MYFW 8-K
First Western Financial Inc (MYFW)
UNITED STATES
SECURITIES AND EXCHANGE COMMISSION
Washington, D.C. 20549
FORM 8-K
CURRENT REPORT
Pursuant to Section 13 or 15(d) of The Securities Exchange Act of 1934
Date of Report (Date of earliest event reported): April 30, 2020
FIRST WESTERN FINANCIAL, INC.
(Exact name of registrant as specified in its charter)
|
Colorado |
001-38595 |
37-1442266 |
|
(State or other jurisdiction of |
(Commission |
(I.R.S. Employer |
|
incorporation or organization) |
File Number) |
Identification No.) |
|
|
|
|
|
1900 16th Street, Suite 1200 |
|
|
|
Denver, Colorado |
|
80202 |
|
(Address of principal executive offices) |
|
(Zip Code) |
Registrant’s telephone number, including area code: 303.531.8100
Former name or former address, if changed since last report: Not Applicable
Check the appropriate box below if the Form 8-K filing is intended to simultaneously satisfy the filing obligation of the registrant under any of the following provisions:
☐ Written communications pursuant to Rule 425 under the Securities Act (17 CFR 230.425)
☐ Soliciting material pursuant to Rule 14a-12 under the Exchange Act (17 CFR 240.14a-12)
☐ Pre-commencement communications pursuant to Rule 14d-2(b) under the Exchange Act (17 CFR 240.14d-2(b))
☐ Pre-commencement communications pursuant to Rule 13e-4(c) under the Exchange Act (17 CFR 240.13e-4(c))
Indicate by check mark whether the registrant is an emerging growth company as defined in Rule 405 of the Securities Act of 1933 (§230.405 of this chapter) or Rule 12b-2 of the Securities Exchange Act of 1934 (§240.12b-2 of this chapter).
☒ Emerging growth company
☒ If an emerging growth company, indicate by check mark if the registrant has elected not to use the extended transition period for complying with any new or revised financial accounting standards provided pursuant to Section 13(a) of the Exchange Act.
Securities registered pursuant to Section 12(b) of the Act:
|
Title of each class |
|
Trading Symbol |
|
Name of each exchange on which registered |
|
Common Stock, no par value |
|
MYFW |
|
The Nasdaq Stock Market LLC |
Item 2.02 Results of Operations and Financial Condition.
On April 30, 2020, First Western Financial, Inc. (the “Company”) issued a press release announcing its financial results for the first quarter ended March 31, 2020. A copy of the press release is furnished as Exhibit 99.1 and is incorporated by reference herein.
The information in this Item 2.02, including Exhibit 99.1, is being furnished pursuant to Item 2.02 of Form 8-K and shall not be deemed “filed” for purposes of Section 18 of the Securities Exchange Act of 1934, as amended (the “Exchange Act”), or otherwise subject to liabilities of that section, nor shall it be deemed incorporated by reference into any filing under the Securities Act of 1933, as amended (the “Securities Act”), or the Exchange Act, unless specifically identified therein as being incorporated therein by reference.
Item 7.01Regulation FD Disclosure.
The Company intends to hold an investor call and webcast to discuss its financial results for the first quarter ended March 31, 2020 on Friday, May 1, 2020, at 10:00 a.m. Mountain Time. The Company’s presentation to analysts and investors contains additional information about the Company’s financial results for the first quarter ended March 31, 2020 and is furnished as Exhibit 99.2 and is incorporated by reference herein.
The information in this Item 7.01, including Exhibit 99.2, is being furnished pursuant to Item 7.01 of Form 8-K and shall not be deemed “filed” for purposes of Section 18 of the Exchange Act, or otherwise subject to liabilities of that section, nor shall it be deemed incorporated by reference into any filing under the Securities Act or the Exchange Act, unless specifically identified therein as being incorporated therein by reference.
Item 9.01 Financial Statements and Exhibits.
(d) Exhibits.
|
Exhibit |
|
Description |
|
99.1
99.2 |
|
Press Release issued by First Western Financial, Inc. dated April 30, 2020
First Western Financial, Inc. Earnings Presentation
|
2
SIGNATURES
Pursuant to the requirements of the Securities Exchange Act of 1934, the registrant has duly caused this report to be signed on its behalf by the undersigned, thereunto duly authorized.
|
|
|
|
FIRST WESTERN FINANCIAL, INC. |
|
|
|
|
|
|
|
|
|
|
|
|
Date: April 30, 2020 |
|
By: /s/ Scott C. Wylie |
|
|
|
|
Scott C. Wylie |
|
|
|
|
|
|
|
|
|
Chairman, Chief Executive Officer and President |
3
Exhibit 99.1

First Western Reports First Quarter 2020 Financial Results
First Quarter 2020 Summary
Net income available to common shareholders of $1.3 million in Q1 2020, compared to $2.6 million in Q4 2019 and $1.6 million in Q1 2019
Diluted EPS of $0.17 in Q1 2020, compared to $0.32 in Q4 2019 and $0.21 in Q1 2019
|
· |
Adjusted net income available to common shareholders, excluding loss on intangibles held for sale, of $1.8 million in Q1 2020 |
|
· |
Adjusted diluted EPS, excluding loss on intangibles held for sale, of $0.22 for Q1 2020 |
|
· |
Total assets grew to $1.35 billion, up 32.7% annualized from Q4 2019 and 18.3% from Q1 2019 |
|
· |
Net interest margin improved to 3.14% in Q1 2020 from 2.91% in Q4 2019 and 3.03% Q1 2019 |
|
· |
Total deposits of $1.2 billion, an 33.7% annualized increase from Q4 2019 and a 20.5% increase from Q1 2019 |
|
· |
Gross loans of $1.04 billion, an annualized increase of 18.4% from Q4 2019 and an increase of 12.1% from Q1 2019 |
|
· |
Branch purchase and assumption agreement signed with Simmons Bank that expands First Western’s presence in Denver market |
|
· |
$8.0 million subordinated debt offering during Q1 2020 completed |
Denver, Colo., April 30, 2020 – First Western Financial, Inc., (“First Western” or the “Company”) (NASDAQ: MYFW), today reported financial results for the first quarter ended March 31, 2020.
Net income available to common shareholders was $1.3 million, or $0.17 per diluted share, for the first quarter of 2020. This compares to $2.6 million, or $0.32 per diluted share, for the fourth quarter of 2019, and $1.6 million, or $0.21 per diluted share, for the first quarter of 2019.
Financial results for the first quarter of 2020 include a $0.6 million loss on intangibles held for sale related to the Company’s Capital Management segment, which negatively impacted earnings per diluted share by 5 cents. For the first quarter of 2020, adjusted net income, available to common shareholders, excluding the held for sale loss, was $1.8 million, or $0.22 per diluted share.
Scott C. Wylie, CEO of First Western, commented, “During January and February, we experienced positive trends throughout the business including strong growth in loans and deposits and an expansion in our net interest margin. We were also very pleased to sign a branch purchase and assumption agreement with
Simmons Bank in February that will increase our presence in Denver, add valuable scale and banking talent, and we believe will be highly accretive to earnings.”
“As the COVID-19 pandemic accelerated in March, our focus turned to protecting the health and safety of our associates and ensuring that we continued to support the financial needs of our clients and the communities we serve. We have implemented a number of programs to help our clients manage through this crisis, including participating in the Small Business Association’s Paycheck Protection Program (“PPP”). As of April 24th, we processed 347 applications for a total of $162.1 million funded through the PPP. While our top priority has been serving our existing clients, we have also used the PPP to establish many new commercial client relationships with businesses that were frustrated by the lack of response from their prior banks.”
“We believe we are well positioned from a capital and liquidity standpoint to continue supporting our clients and communities throughout the duration of this crisis. Now more than ever, we have the opportunity to demonstrate the compelling value proposition of the First Western model, help our clients navigate through a time of unprecedented challenges, and attract new commercial and wealth management clients to our franchise,” said Mr. Wylie.
|
|
|
For the Three Months Ended |
|
|||||||
|
|
|
March 31, |
|
December 31, |
|
March 31, |
|
|||
|
(Dollars in thousands, except per share data) |
|
2020 |
|
2019 |
|
2019 |
|
|||
|
Earnings Summary |
|
|
|
|
|
|
|
|
|
|
|
Net interest income |
|
$ |
8,931 |
|
$ |
8,190 |
|
$ |
7,971 |
|
|
Less: provision for loan losses |
|
|
367 |
|
|
447 |
|
|
194 |
|
|
Total non-interest income |
|
|
7,767 |
|
|
8,228 |
|
|
6,976 |
|
|
Total non-interest expense |
|
|
14,647 |
|
|
13,082 |
|
|
12,602 |
|
|
Income before income taxes |
|
|
1,684 |
|
|
2,889 |
|
|
2,151 |
|
|
Income tax expense |
|
|
350 |
|
|
317 |
|
|
524 |
|
|
Net income available to common shareholders |
|
|
1,334 |
|
|
2,572 |
|
|
1,627 |
|
|
Adjusted net income available to common shareholders(1) |
|
|
1,772 |
|
|
2,572 |
|
|
1,627 |
|
|
Basic earnings per common share |
|
|
0.17 |
|
|
0.33 |
|
|
0.21 |
|
|
Adjusted basic earnings per common share(1) |
|
|
0.23 |
|
|
0.33 |
|
|
0.21 |
|
|
Diluted earnings per common share |
|
|
0.17 |
|
|
0.32 |
|
|
0.21 |
|
|
Adjusted diluted earnings per common share(1) |
|
$ |
0.22 |
|
$ |
0.32 |
|
$ |
0.21 |
|
|
|
|
|
|
|
|
|
|
|
|
|
|
Return on average assets (annualized) |
|
|
0.43 |
% |
|
0.82 |
% |
|
0.57 |
% |
|
Adjusted return on average assets (annualized)(1) |
|
|
0.57 |
|
|
0.82 |
|
|
0.57 |
|
|
Return on average shareholders' equity (annualized) |
|
|
4.09 |
|
|
8.06 |
|
|
5.50 |
|
|
Adjusted return on average shareholders' equity (annualized)(1) |
|
|
5.43 |
|
|
8.06 |
|
|
5.50 |
|
|
Return on tangible common equity (annualized)(1) |
|
|
5.03 |
|
|
9.85 |
|
|
6.88 |
|
|
Adjusted return on tangible common equity (annualized)(1) |
|
|
6.69 |
|
|
9.85 |
|
|
6.88 |
|
|
Net interest margin |
|
|
3.14 |
|
|
2.91 |
|
|
3.03 |
|
|
Efficiency ratio(1) |
|
|
84.39 |
% |
|
80.54 |
% |
|
83.15 |
% |
|
(1) |
Represents a Non-GAAP financial measure. See “Reconciliations of Non-GAAP Measures” for a reconciliation of our Non-GAAP measures to the most directly comparable GAAP financial measure. |
2
Operating Results for the First Quarter 2020
Revenue
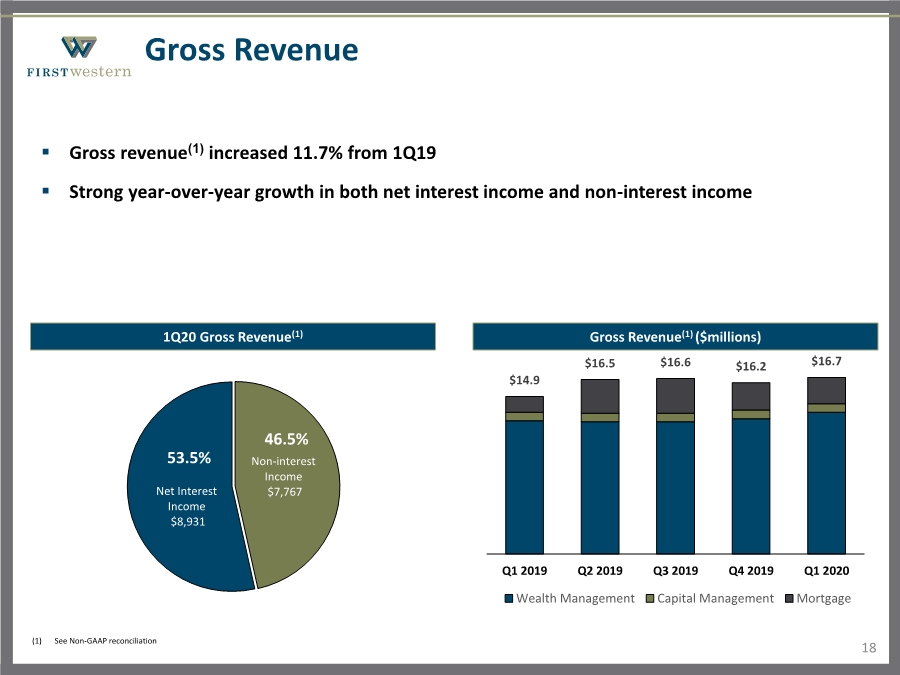
Gross revenue (1) was $16.7 million for the first quarter of 2020, compared to $16.2 million for the fourth quarter of 2019. The increase in revenue was primarily driven by a $0.7 million increase in net interest income.
Relative to the first quarter of 2019, gross revenue increased $1.8 million from $14.9 million. The increase was primarily due to growth in net interest income and net gain on mortgage loans resulting from increased mortgage activity.
|
(1) |
Represents a Non-GAAP financial measure. See “Reconciliations of Non-GAAP Measures” for a reconciliation of our Non-GAAP measures to the most directly comparable GAAP financial measure. |
Net Interest Income
Net interest income for the first quarter of 2020 was $8.9 million, an increase of 9.0% from $8.2 million in the fourth quarter of 2019. The increase in net interest income was primarily attributable to a reduction in interest expense resulting from a 20 basis point decline in the cost of funds.
Relative to the first quarter of 2019, net interest income increased 12.0% from $8.0 million. The year-over-year increase in net interest income was due primarily to growth in average loans and lower cost of funds.
Net Interest Margin
Net interest margin for the first quarter of 2020 increased to 3.14% from 2.91% in the fourth quarter of 2019. The increase was primarily driven by a 20 basis point decline in the cost of funds.
Relative to the first quarter of 2019, the net interest margin increased from 3.03%, primarily due to a 29 basis point decline in cost of funds.
Non-interest Income
Non-interest income for the first quarter of 2020 was $7.8 million, a decrease of 5.6% from $8.2 million in the fourth quarter of 2019. The decrease was primarily attributable to a decrease in insurance revenues.
While our net gains on mortgage loans remained consistent with the fourth quarter, the uncertainty of COVID-19’s impact on the economy caused major disruptions in the mortgage market. Sharp Fed Funds and US Treasury rate reductions, as well as capacity, liquidity and delinquency concerns in the mortgage industry caused the market value of loans and loan servicing to decline rapidly and significantly relative to mortgage hedges, resulting in approximately $4 million of lost value during the month of March.
Relative to the first quarter of 2019, non-interest income increased 11.3% from $7.0 million. The increase was primarily attributable to higher net gains on mortgage loans as a result of a higher volume of mortgages.
Non-interest Expense
Non-interest expense for the first quarter of 2020 was $14.6 million, an increase of 12.0% from $13.1 million for the fourth quarter of 2019. Non-interest expense for the first quarter of 2020 included a $0.6 million loss
3
on intangibles held for sale related to the Capital Management segment. Excluding the loss on intangibles held for sale, the increase was driven by higher professional costs primarily associated with the pending branch acquisition along with an increase in salaries and employee benefits expense resulting from higher head count and seasonality in payroll taxes.
Non-interest expense increased 16.2% from $12.6 million in the first quarter of 2019. The increase was primarily due to higher salaries and employee benefits expense reflecting the growth of the organization over the past year and improved performance.
The Company’s efficiency ratio was 84.4% in the first quarter of 2020, compared with 80.5% in the fourth quarter of 2019 and 83.2% in the first quarter of 2019. The efficiency ratio was negatively impacted during the first quarter 2020 by various acquisition and disposition related expenses. Management expects a return to the positive trend it had previously shown in the Company’s efficiency ratio.
Income Taxes
The Company recorded income tax expense of $0.4 million for the first quarter of 2020, representing an effective tax rate of 20.8%, compared to 11.0% for the fourth quarter of 2019. The lower effective tax rate in the fourth quarter of 2019 was primarily attributable to tax-planning strategies driven by the impact of research and development tax credits.
Loan Portfolio
Total gross loans including mortgage loans held for sale were $1.11 billion at March 31, 2020, an increase of $61.8 million from the end of the prior quarter, and an increase of $157.1 million from March 31, 2019.
Gross loans, excluding mortgage loans held for sale, totaled $1.04 billion at March 31, 2020, an annualized increase of 18.4% from $998.0 million at December 31, 2019, and an increase of 12.1% from $931.2 million at March 31, 2019. The increase in gross loans from December 31, 2019 was primarily due to growth in the 1-4 family residential, commercial and industrial, and commercial real estate portfolios.
Deposits
Total deposits were $1.18 billion at March 31, 2020, compared to $1.09 billion at December 31, 2019, and $978.1 million at March 31, 2019. The increase in total deposits from December 31, 2019 was primarily due to an increase in money market, time and non-interest bearing deposits.
Average total deposits for the first quarter of 2020 increased $103.6 million, or 10.6%, from the first quarter of 2019.
Assets Under Management
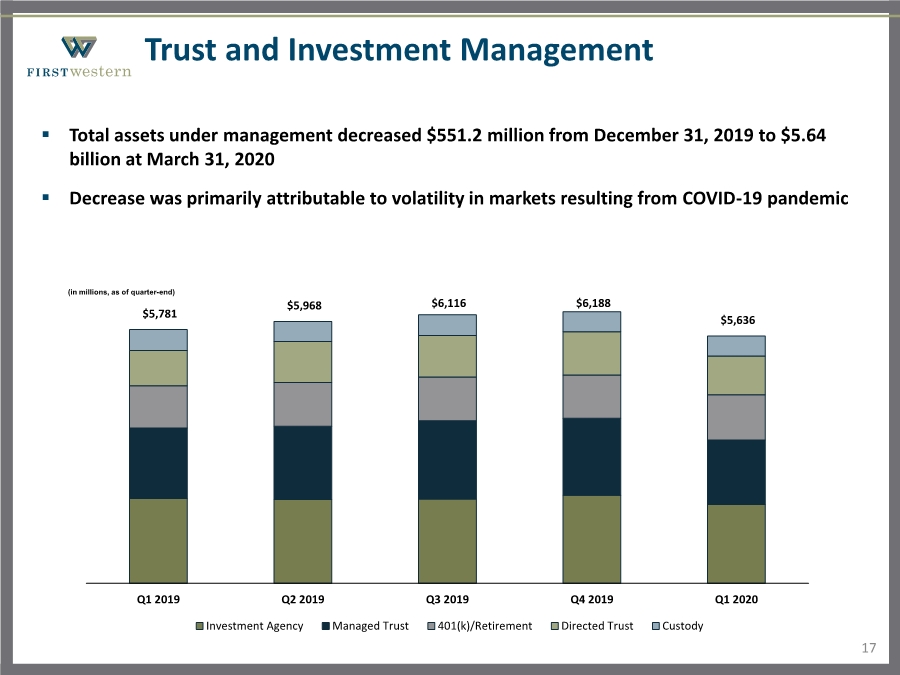
Total assets under management decreased by $551.2 million during the first quarter to $5.64 billion at March 31, 2020, compared to $6.19 billion at December 31, 2019, and $5.78 billion at March 31, 2019. The decrease was primarily attributable to market losses resulting from the market volatility related to the global pandemic.
4
Credit Quality
Non-performing assets totaled $11.1 million, or 0.82% of total assets, at March 31, 2020, a decline from $12.9 million, or 1.03% of total assets, at December 31, 2019 due primarily to pay downs on non-performing loans.
The Company recorded a provision for loan losses of $0.4 million in the first quarter of 2020, primarily reflecting the strong growth in the loan portfolio. Changes within the provision during the first quarter 2020 also included a decrease in the specific reserve resulting from pay downs on an impaired loan and an increase in the unallocated reserve based on management’s assumptions related to the impact of the COVID-19 pandemic given data that was currently available, as of the date of analysis.
As a result of the COVID-19 pandemic, a loan modification program was designed and implemented to assist our clients experiencing financial stress resulting from the economic impacts caused by the global pandemic. The program includes loan extensions, temporary payment moratoriums, and financial covenant waivers for commercial and consumer borrowers impacted by the pandemic who have a pass risk rating and have not been delinquent over 30 days on payments in the last two years. These programs were implemented towards the end of the first quarter of 2020. No clients participated in the loan modification program in the first quarter, however as April 24th, the Company entered into modification agreements with 32 clients across multiple industries in the amount of $55.8 million.
The Company will continue to closely monitor the loan portfolio, understanding the stress of our borrowers as well as the on-going impact of COVID-19, as it relates to the allowance for loan loss and credit quality metrics.
Capital
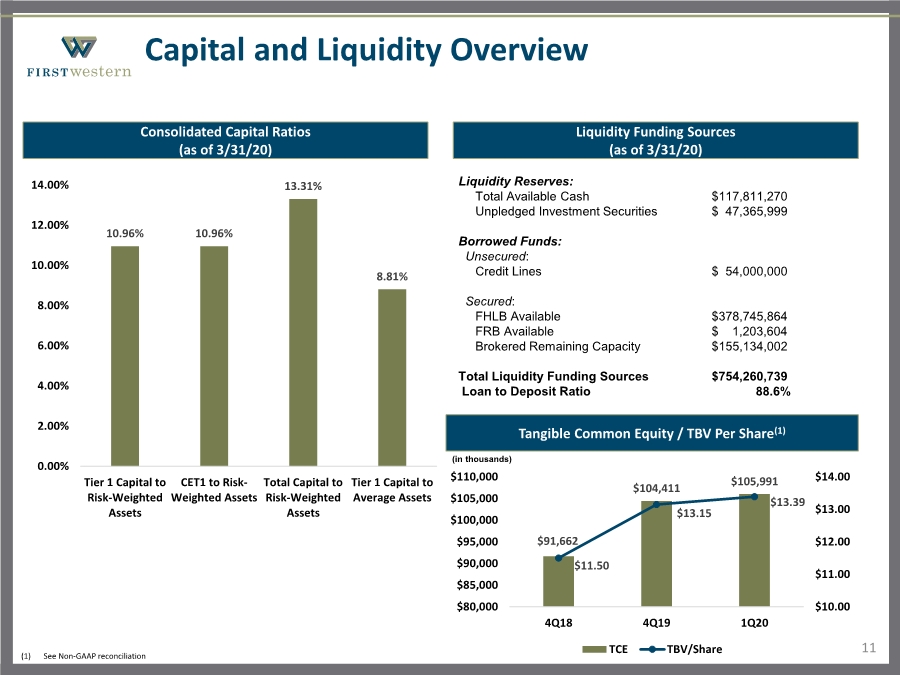
At March 31, 2020, First Western (“Consolidated”) and First Western Trust Bank (“Bank”) exceeded the minimum capital levels required by their respective regulators. At March 31, 2020, the Bank was classified as “well capitalized,” as summarized in the following table:
|
|
|
March 31, |
|
|
|
|
2020 |
|
|
Consolidated Capital |
|
|
|
|
Tier 1 capital to risk-weighted assets |
|
10.96 |
% |
|
Common Equity Tier 1 (“CET 1”) to risk-weighted assets |
|
10.96 |
|
|
Total capital to risk-weighted assets |
|
13.31 |
|
|
Tier 1 capital to average assets |
|
8.81 |
|
|
|
|
|
|
|
Bank Capital |
|
|
|
|
Tier 1 capital to risk-weighted assets |
|
10.35 |
|
|
CET 1 to risk-weighted assets |
|
10.35 |
|
|
Total capital to risk-weighted assets |
|
11.23 |
|
|
Tier 1 capital to average assets |
|
8.33 |
% |
Tangible book value per common share increased 12.7% from $11.88 at March 31, 2019 to $13.39 at March 31, 2020, and was up 1.8% from $13.15 at December 31, 2019.
During the first quarter of 2020, the Company repurchased 22,679 shares of its common stock at an average price of $16.50 under its stock repurchase program, which authorized the repurchase of up to 300,000 shares
5
of its common stock. As of March 31, 2020, the Company had up to 233,623 shares remaining under the current stock repurchase authorization, although the Company does not currently anticipate continuing to repurchase shares while its capital can be better used supporting its clients and communities through the duration of the COVID-19 pandemic.
Conference Call, Webcast and Slide Presentation
The Company will host a conference call and webcast at 10:00 a.m. MT/ 12:00 p.m. ET on Friday, May 1, 2020. The call can be accessed via telephone at 877-405-1628; passcode 3033844. A recorded replay will be accessible through May 8, 2020 by dialing 855-859-2056; passcode 3033844.
A slide presentation relating to the first quarter 2020 results will be accessible prior to the scheduled conference call. The slide presentation and webcast of the conference call can be accessed on the Events and Presentations page of the Company’s investor relations website at https://myfw.gcs-web.com.
About First Western
First Western is a financial services holding company headquartered in Denver, Colorado, with operations in Colorado, Arizona, Wyoming and California. First Western and its subsidiaries provide a fully integrated suite of wealth management services on a private trust bank platform, which includes a comprehensive selection of deposit, loan, trust, wealth planning and investment management products and services. First Western’s common stock is traded on the Nasdaq Global Select Market under the symbol “MYFW.” For more information, please visit www.myfw.com.
Non-GAAP Financial Measures
Some of the financial measures included in this press release are not measures of financial performance recognized in accordance with generally accepted accounting principles in the United States (“GAAP”). These non-GAAP financial measures include “Tangible Common Equity,” “Tangible Common Book Value per Share,” “Return on Tangible Common Equity,” “Efficiency Ratio,” and “Gross Revenue,” “Adjusted Net Income Available to Common Shareholders,” “Adjusted Earnings Per Share,” “Adjusted Diluted Earnings Per Share,” “Adjusted Return on Average Assets,” “Adjusted Return on Average Shareholders’ Equity,” and “Adjusted Return on Tangible Common Equity”. The Company believes these non-GAAP financial measures provide both management and investors a more complete understanding of the Company’s financial position and performance. These non-GAAP financial measures are supplemental and are not a substitute for any analysis based on GAAP financial measures. Not all companies use the same calculation of these measures; therefore, this presentation may not be comparable to other similarly titled measures as presented by other companies. Reconciliation of non-GAAP financial measures, to GAAP financial measures are provided at the end of this press release.
Forward-Looking Statements
Statements in this news release regarding our expectations and beliefs about our future financial performance and financial condition, as well as trends in our business and markets are “forward-looking statements” as defined in the Private Securities Litigation Reform Act of 1995. Forward-looking statements often include words such as “believe,” “expect,” “anticipate,” “intend,” “plan,” “estimate,” “project,” “outlook,” or words of similar meaning, or future or conditional verbs such as “will,” “would,” “should,” “opportunity,” “could,” or “may.” The forward looking statements in this news release are based on current information and on assumptions that we make about future events and circumstances that are subject to a number of risks and uncertainties that are often difficult to predict and beyond our control. As a result of those risks and
6
uncertainties, our actual financial results in the future could differ, possibly materially, from those expressed in or implied by the forward looking statements contained in this news release and could cause us to make changes to our future plans. Those risks and uncertainties include, without limitation, the COVID-19 pandemic and related government actions; the risk of geographic concentration in Colorado, Arizona, Wyoming and California; the risk of changes in the economy affecting real estate values and liquidity; the risk in our ability to continue to originate residential real estate loans and sell such loans; risks specific to commercial loans and borrowers; the risk of claims and litigation pertaining to our fiduciary responsibilities; the risk of competition for investment managers and professionals; the risk of fluctuation in the value of our investment securities; the risk of changes in interest rates; and the risk of the adequacy of our allowance for credit losses and the risk in our ability to maintain a strong core deposit base or other low-cost funding sources. Additional information regarding these and other risks and uncertainties to which our business and future financial performance are subject is contained in our Annual Report on Form 10-K filed with the U.S. Securities and Exchange Commission (“SEC”) on March 12, 2020 (“Form 10-K”), and other documents we file with the SEC from time to time. We urge readers of this news release to review the “Risk Factors” section our Form 10-K and any updates to those risk factors set forth in our subsequent Quarterly Reports on Form 10-Q, Current Reports on Form 8-K, and our other filings with the SEC. Also, our actual financial results in the future may differ from those currently expected due to additional risks and uncertainties of which we are not currently aware or which we do not currently view as, but in the future may become, material to our business or operating results. Due to these and other possible uncertainties and risks, readers are cautioned not to place undue reliance on the forward-looking statements contained in this news release, which speak only as of today’s date, or to make predictions based solely on historical financial performance. Any forward-looking statement speaks only as of the date on which it is made, and we do not undertake any obligation to update or review any forward-looking statement, whether as a result of new information, future developments or otherwise, except as required by law.
Contacts:
Financial Profiles, Inc.
Tony Rossi
310-622-8221
7
First Western Financial, Inc.
Consolidated Financial Summary (unaudited)
|
|
|
Three Months Ending |
|||||||
|
|
|
March 31, |
|
December 31, |
|
March 31, |
|||
|
(Dollars in thousands, except per share data) |
|
2020 |
|
2019 |
|
2019 |
|||
|
Interest and dividend income: |
|
|
|
|
|
|
|
|
|
|
Loans, including fees |
|
$ |
11,002 |
|
$ |
10,554 |
|
$ |
10,218 |
|
Investment securities |
|
|
295 |
|
|
321 |
|
|
310 |
|
Federal funds sold and other |
|
|
215 |
|
|
478 |
|
|
522 |
|
Total interest and dividend income |
|
|
11,512 |
|
|
11,353 |
|
|
11,050 |
|
|
|
|
|
|
|
|
|
|
|
|
Interest expense: |
|
|
|
|
|
|
|
|
|
|
Deposits |
|
|
2,393 |
|
|
2,995 |
|
|
2,909 |
|
Other borrowed funds |
|
|
188 |
|
|
168 |
|
|
170 |
|
Total interest expense |
|
|
2,581 |
|
|
3,163 |
|
|
3,079 |
|
Net interest income |
|
|
8,931 |
|
|
8,190 |
|
|
7,971 |
|
Less: provision for loan losses |
|
|
367 |
|
|
447 |
|
|
194 |
|
Net interest income, after provision for loan losses |
|
|
8,564 |
|
|
7,743 |
|
|
7,777 |
|
|
|
|
|
|
|
|
|
|
|
|
Non-interest income: |
|
|
|
|
|
|
|
|
|
|
Trust and investment management fees |
|
|
4,731 |
|
|
4,748 |
|
|
4,670 |
|
Net gain on mortgage loans |
|
|
2,481 |
|
|
2,577 |
|
|
1,456 |
|
Bank fees |
|
|
368 |
|
|
261 |
|
|
289 |
|
Risk management and insurance fees |
|
|
96 |
|
|
367 |
|
|
468 |
|
Income on company-owned life insurance |
|
|
91 |
|
|
92 |
|
|
93 |
|
Net gain on sale of assets |
|
|
— |
|
|
183 |
|
|
— |
|
Total non-interest income |
|
|
7,767 |
|
|
8,228 |
|
|
6,976 |
|
Total income before non-interest expense |
|
|
16,331 |
|
|
15,971 |
|
|
14,753 |
|
|
|
|
|
|
|
|
|
|
|
|
Non-interest expense: |
|
|
|
|
|
|
|
|
|
|
Salaries and employee benefits |
|
|
8,482 |
|
|
7,990 |
|
|
7,618 |
|
Occupancy and equipment |
|
|
1,440 |
|
|
1,369 |
|
|
1,407 |
|
Professional services |
|
|
1,023 |
|
|
962 |
|
|
777 |
|
Technology and information systems |
|
|
969 |
|
|
928 |
|
|
1,069 |
|
Data processing |
|
|
847 |
|
|
783 |
|
|
687 |
|
Marketing |
|
|
415 |
|
|
300 |
|
|
278 |
|
Amortization of other intangible assets |
|
|
2 |
|
|
7 |
|
|
173 |
|
Net loss on intangibles held for sale |
|
|
553 |
|
|
— |
|
|
— |
|
Other |
|
|
916 |
|
|
743 |
|
|
593 |
|
Total non-interest expense |
|
|
14,647 |
|
|
13,082 |
|
|
12,602 |
|
Income before income taxes |
|
|
1,684 |
|
|
2,889 |
|
|
2,151 |
|
Income tax expense |
|
|
350 |
|
|
317 |
|
|
524 |
|
Net income available to common shareholders |
|
$ |
1,334 |
|
$ |
2,572 |
|
$ |
1,627 |
|
Earnings per common share: |
|
|
|
|
|
|
|
|
|
|
Basic |
|
$ |
0.17 |
|
$ |
0.33 |
|
$ |
0.21 |
|
Diluted |
|
$ |
0.17 |
|
$ |
0.32 |
|
$ |
0.21 |
8
First Western Financial, Inc.
Consolidated Financial Summary (unaudited) (continued)
|
|
|
Three Months Ending |
|||||||
|
|
|
March 31, |
|
December 31, |
|
March 31, |
|||
|
|
|
2020 |
|
2019 |
|
2019 |
|||
|
|
|
|
|
|
|
|
|
|
|
|
(Dollars in thousands) |
|
|
|
|
|
|
|
|
|
|
ASSETS |
|
|
|
|
|
|
|
|
|
|
Cash and cash equivalents: |
|
|
|
|
|
|
|
|
|
|
Cash and due from banks |
|
$ |
4,076 |
|
$ |
4,180 |
|
$ |
2,164 |
|
Interest-bearing deposits in other financial institutions |
|
|
114,438 |
|
|
74,458 |
|
|
67,602 |
|
Total cash and cash equivalents |
|
|
118,514 |
|
|
78,638 |
|
|
69,766 |
|
|
|
|
|
|
|
|
|
|
|
|
Available-for-sale securities, at fair value |
|
|
52,500 |
|
|
58,903 |
|
|
53,610 |
|
Correspondent bank stock, at cost |
|
|
1,158 |
|
|
585 |
|
|
993 |
|
Mortgage loans held for sale |
|
|
64,120 |
|
|
48,312 |
|
|
19,778 |
|
Loans, net of allowance of $8,242, $7,875 and $7,645 |
|
|
1,035,709 |
|
|
990,132 |
|
|
923,545 |
|
Premises and equipment, net |
|
|
5,148 |
|
|
5,218 |
|
|
5,815 |
|
Accrued interest receivable |
|
|
3,107 |
|
|
3,048 |
|
|
3,053 |
|
Accounts receivable |
|
|
4,669 |
|
|
5,238 |
|
|
4,561 |
|
Other receivables |
|
|
1,058 |
|
|
1,006 |
|
|
881 |
|
Other real estate owned, net |
|
|
658 |
|
|
658 |
|
|
658 |
|
Goodwill |
|
|
19,686 |
|
|
19,686 |
|
|
24,811 |
|
Other intangible assets, net |
|
|
26 |
|
|
28 |
|
|
229 |
|
Deferred tax assets, net |
|
|
5,036 |
|
|
5,047 |
|
|
4,549 |
|
Company-owned life insurance |
|
|
15,177 |
|
|
15,086 |
|
|
14,803 |
|
Other assets |
|
|
24,297 |
|
|
16,544 |
|
|
17,636 |
|
Intangibles held for sale |
|
|
3,000 |
|
|
3,553 |
|
|
— |
|
Total assets |
|
$ |
1,353,863 |
|
$ |
1,251,682 |
|
$ |
1,144,688 |
|
|
|
|
|
|
|
|
|
|
|
|
LIABILITIES |
|
|
|
|
|
|
|
|
|
|
Deposits: |
|
|
|
|
|
|
|
|
|
|
Noninterest-bearing |
|
$ |
270,604 |
|
$ |
240,068 |
|
$ |
226,484 |
|
Interest-bearing |
|
|
907,846 |
|
|
846,716 |
|
|
751,617 |
|
Total deposits |
|
|
1,178,450 |
|
|
1,086,784 |
|
|
978,101 |
|
Borrowings: |
|
|
|
|
|
|
|
|
|
|
Federal Home Loan Bank Topeka borrowings |
|
|
10,000 |
|
|
10,000 |
|
|
20,361 |
|
Subordinated notes |
|
|
14,459 |
|
|
6,560 |
|
|
6,560 |
|
Accrued interest payable |
|
|
417 |
|
|
299 |
|
|
329 |
|
Other liabilities |
|
|
21,708 |
|
|
20,244 |
|
|
19,669 |
|
Liabilities held for sale |
|
|
126 |
|
|
117 |
|
|
— |
|
Total liabilities |
|
|
1,225,160 |
|
|
1,124,004 |
|
|
1,025,020 |
|
|
|
|
|
|
|
|
|
|
|
|
SHAREHOLDERS’ EQUITY |
|
|
|
|
|
|
|
|
|
|
Total shareholders’ equity |
|
|
128,703 |
|
|
127,678 |
|
|
119,668 |
|
Total liabilities and shareholders’ equity |
|
$ |
1,353,863 |
|
$ |
1,251,682 |
|
$ |
1,144,688 |
9
First Western Financial, Inc.
Consolidated Financial Summary (unaudited) (continued)
|
|
|
As of |
|||||||
|
|
|
March 31, |
|
December 31, |
|
March 31, |
|||
|
(Dollars in thousands) |
|
2020 |
|
2019 |
|
2019 |
|||
|
Loan Portfolio |
|
|
|
|
|
|
|
|
|
|
Cash, Securities and Other |
|
$ |
147,157 |
|
$ |
146,701 |
|
$ |
130,641 |
|
Construction and Development |
|
|
25,461 |
|
|
28,120 |
|
|
37,128 |
|
1-4 Family Residential |
|
|
412,306 |
|
|
400,134 |
|
|
360,607 |
|
Non-Owner Occupied CRE |
|
|
192,350 |
|
|
165,179 |
|
|
172,014 |
|
Owner Occupied CRE |
|
|
121,138 |
|
|
127,968 |
|
|
108,873 |
|
Commercial and Industrial |
|
|
144,066 |
|
|
128,457 |
|
|
120,602 |
|
Total loans held for investment |
|
|
1,042,478 |
|
|
996,559 |
|
|
929,865 |
|
Deferred costs, net |
|
|
1,473 |
|
|
1,448 |
|
|
1,325 |
|
Gross loans |
|
$ |
1,043,951 |
|
$ |
998,007 |
|
$ |
931,190 |
|
Total mortgage loans held for sale |
|
$ |
64,120 |
|
$ |
48,312 |
|
$ |
19,778 |
|
|
|
|
|
|
|
|
|
|
|
|
Deposit Portfolio |
|
|
|
|
|
|
|
|
|
|
Money market deposit accounts |
|
$ |
671,641 |
|
$ |
615,575 |
|
$ |
513,328 |
|
Time deposits |
|
|
150,190 |
|
|
134,913 |
|
|
176,312 |
|
Negotiable order of withdrawal accounts |
|
|
82,092 |
|
|
91,921 |
|
|
59,464 |
|
Savings accounts |
|
|
3,923 |
|
|
4,307 |
|
|
2,513 |
|
Total interest-bearing deposits |
|
|
907,846 |
|
|
846,716 |
|
|
751,617 |
|
Noninterest-bearing accounts |
|
|
270,604 |
|
|
240,068 |
|
|
226,484 |
|
Total deposits |
|
$ |
1,178,450 |
|
$ |
1,086,784 |
|
$ |
978,101 |
10
First Western Financial, Inc.
Consolidated Financial Summary (unaudited) (continued)
|
|
|
As of and for the Three Months Ended |
|
|||||||
|
|
|
March 31, |
|
December 31, |
|
March 31, |
|
|||
|
(Dollars in thousands) |
|
2020 |
|
2019 |
|
2019 |
|
|||
|
Average Balance Sheets |
|
|
|
|
|
|
|
|
|
|
|
Average Assets |
|
|
|
|
|
|
|
|
|
|
|
Interest-earning assets: |
|
|
|
|
|
|
|
|
|
|
|
Interest-bearing deposits in other financial institutions |
|
$ |
68,035 |
|
$ |
108,245 |
|
$ |
85,826 |
|
|
Available-for-sale securities |
|
|
55,208 |
|
|
58,745 |
|
|
50,474 |
|
|
Loans |
|
|
1,016,148 |
|
|
958,497 |
|
|
915,921 |
|
|
Interest-earning assets |
|
|
1,139,391 |
|
|
1,125,487 |
|
|
1,052,221 |
|
|
Mortgage loans held for sale |
|
|
37,798 |
|
|
59,813 |
|
|
13,277 |
|
|
Total interest earning-assets, plus mortgage loans held for sale |
|
|
1,177,189 |
|
|
1,185,300 |
|
|
1,065,498 |
|
|
Allowance for loan losses |
|
|
(8,010) |
|
|
(7,756) |
|
|
(7,567) |
|
|
Noninterest-earning assets |
|
|
84,054 |
|
|
78,934 |
|
|
77,780 |
|
|
Total assets |
|
$ |
1,253,233 |
|
$ |
1,256,478 |
|
$ |
1,135,711 |
|
|
|
|
|
|
|
|
|
|
|
|
|
|
Average Liabilities and Shareholders’ Equity |
|
|
|
|
|
|
|
|
|
|
|
Interest-bearing liabilities: |
|
|
|
|
|
|
|
|
|
|
|
Interest-bearing deposits |
|
$ |
830,736 |
|
$ |
865,489 |
|
$ |
760,507 |
|
|
Federal Home Loan Bank Topeka borrowings |
|
|
10,495 |
|
|
10,000 |
|
|
10,401 |
|
|
Subordinated notes |
|
|
7,854 |
|
|
6,560 |
|
|
6,560 |
|
|
Total interest-bearing liabilities |
|
|
849,085 |
|
|
882,049 |
|
|
777,468 |
|
|
Noninterest-bearing liabilities: |
|
|
|
|
|
|
|
|
|
|
|
Noninterest-bearing deposits |
|
|
253,813 |
|
|
226,948 |
|
|
220,408 |
|
|
Other liabilities |
|
|
19,874 |
|
|
19,912 |
|
|
19,413 |
|
|
Total noninterest-bearing liabilities |
|
|
273,687 |
|
|
246,860 |
|
|
239,821 |
|
|
Shareholders’ equity |
|
|
130,461 |
|
|
127,569 |
|
|
118,422 |
|
|
Total liabilities and shareholders’ equity |
|
$ |
1,253,233 |
|
$ |
1,256,478 |
|
$ |
1,135,711 |
|
|
|
|
|
|
|
|
|
|
|
|
|
|
Yields (annualized) |
|
|
|
|
|
|
|
|
|
|
|
Interest-bearing deposits in other financial institutions |
|
|
1.26 |
% |
|
1.77 |
% |
|
2.43 |
% |
|
Available-for-sale securities |
|
|
2.14 |
|
|
2.19 |
|
|
2.46 |
|
|
Loans |
|
|
4.33 |
|
|
4.40 |
|
|
4.46 |
|
|
Interest-earning assets |
|
|
4.04 |
|
|
4.03 |
|
|
4.20 |
|
|
Mortgage loans held for sale |
|
|
3.45 |
|
|
3.63 |
|
|
3.80 |
|
|
Total interest-earning assets, plus mortgage loans held for sale |
|
|
4.02 |
|
|
4.01 |
|
|
4.20 |
|
|
Interest-bearing deposits |
|
|
1.15 |
|
|
1.38 |
|
|
1.53 |
|
|
Federal Home Loan Bank Topeka borrowings |
|
|
1.95 |
|
|
1.96 |
|
|
1.92 |
|
|
Subordinated notes |
|
|
6.97 |
|
|
7.26 |
|
|
7.32 |
|
|
Total interest-bearing liabilities |
|
|
1.22 |
|
|
1.43 |
|
|
1.58 |
|
|
Net interest margin |
|
|
3.14 |
|
|
2.91 |
|
|
3.03 |
|
|
Interest rate spread |
|
|
2.83 |
% |
|
2.60 |
% |
|
2.62 |
% |
11
First Western Financial, Inc.
Consolidated Financial Summary (unaudited) (continued)
|
|
|
As of and for the Three Months Ended |
|
|||||||
|
|
|
March 31, |
|
December 31, |
|
March 31, |
|
|||
|
(Dollars in thousands, except share and per share data) |
|
2020 |
|
2019 |
|
2019 |
|
|||
|
Asset Quality |
|
|
|
|
|
|
|
|
|
|
|
Non-performing loans |
|
$ |
10,451 |
|
$ |
12,270 |
|
$ |
18,713 |
|
|
Non-performing assets |
|
|
11,109 |
|
|
12,928 |
|
|
19,371 |
|
|
Net charge-offs |
|
|
— |
|
|
248 |
|
|
— |
|
|
Non-performing loans to total loans |
|
|
1.00 |
% |
|
1.23 |
% |
|
2.01 |
% |
|
Non-performing assets to total assets |
|
|
0.82 |
|
|
1.03 |
|
|
1.69 |
|
|
Allowance for loan losses to non-performing loans |
|
|
78.86 |
|
|
64.18 |
|
|
40.85 |
|
|
Allowance for loan losses to total loans |
|
|
0.79 |
|
|
0.79 |
|
|
0.82 |
|
|
Net charge-offs to average loans |
|
|
— |
% |
|
0.03 |
% |
|
— |
% |
|
|
|
|
|
|
|
|
|
|
|
|
|
Assets under management |
|
$ |
5,636,500 |
|
$ |
6,187,707 |
|
$ |
5,781,297 |
|
|
|
|
|
|
|
|
|
|
|
|
|
|
Market Data |
|
|
|
|
|
|
|
|
|
|
|
Book value per share at period end |
|
$ |
16.26 |
|
$ |
16.08 |
|
$ |
15.02 |
|
|
Tangible book value per common share(1) |
|
$ |
13.39 |
|
$ |
13.15 |
|
$ |
11.88 |
|
|
Weighted average outstanding shares, basic |
|
|
7,863,564 |
|
|
7,906,516 |
|
|
7,873,718 |
|
|
Weighted average outstanding shares, diluted |
|
|
7,930,611 |
|
|
7,950,279 |
|
|
7,889,644 |
|
|
Shares outstanding at period end |
|
|
7,917,489 |
|
|
7,940,168 |
|
|
7,968,420 |
|
|
|
|
|
|
|
|
|
|
|
|
|
|
Consolidated Capital |
|
|
|
|
|
|
|
|
|
|
|
Tier 1 capital to risk-weighted assets |
|
|
10.96 |
% |
|
11.31 |
% |
|
11.13 |
% |
|
CET 1 to risk-weighted assets |
|
|
10.96 |
|
|
11.31 |
|
|
11.13 |
|
|
Total capital to risk-weighted assets |
|
|
13.31 |
|
|
12.87 |
|
|
12.78 |
|
|
Tier 1 capital to average assets |
|
|
8.81 |
|
|
8.58 |
|
|
8.67 |
|
|
|
|
|
|
|
|
|
|
|
|
|
|
Bank Capital |
|
|
|
|
|
|
|
|
|
|
|
Tier 1 capital to risk-weighted assets |
|
|
10.35 |
|
|
10.67 |
|
|
10.36 |
|
|
CET 1 to risk-weighted assets |
|
|
10.35 |
|
|
10.67 |
|
|
10.36 |
|
|
Total capital to risk-weighted assets |
|
|
11.23 |
|
|
11.53 |
|
|
11.26 |
|
|
Tier 1 capital to average assets |
|
|
8.33 |
% |
|
8.09 |
% |
|
8.07 |
% |
|
(1) |
Represents a Non-GAAP financial measure. See “Reconciliation of Non-GAAP Measures” for a reconciliation of our Non-GAAP measures to the most directly comparable GAAP financial measure. |
12
First Western Financial, Inc.
Consolidated Financial Summary (unaudited) (continued)
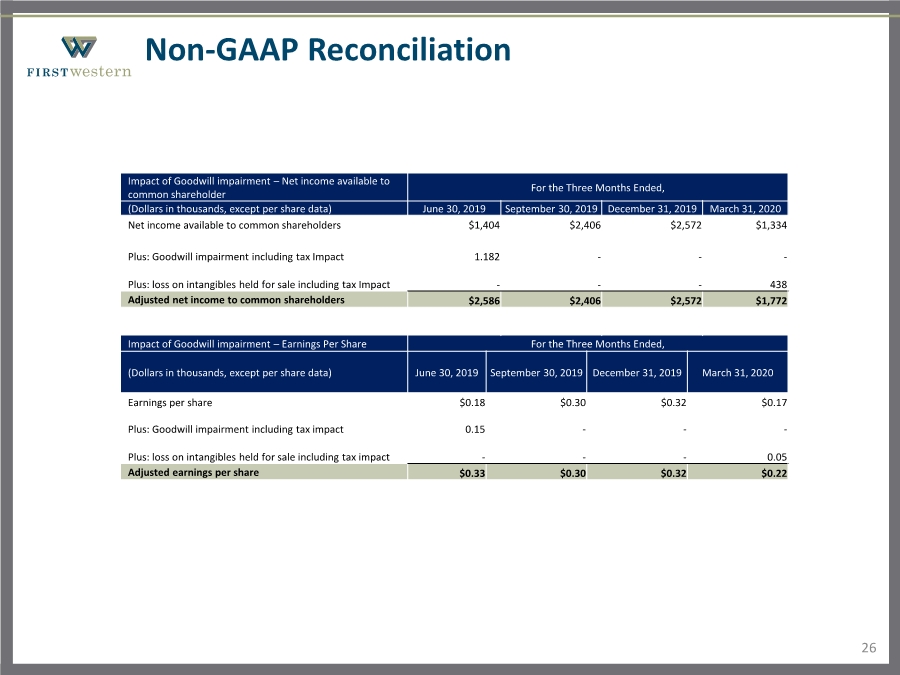
Reconciliations of Non-GAAP Financial Measures
|
|
|
As of and for the Three Months Ended |
|
|||||||
|
|
|
March 31, |
|
December 31, |
|
March 31, |
|
|||
|
(Dollars in thousands, except share and per share data) |
|
2020 |
|
2019 |
|
2019 |
|
|||
|
Tangible common |
|
|
|
|
|
|
|
|
|
|
|
Total shareholders' equity |
|
$ |
128,703 |
|
$ |
127,678 |
|
$ |
119,668 |
|
|
Less: |
|
|
|
|
|
|
|
|
|
|
|
Goodwill |
|
|
19,686 |
|
|
19,686 |
|
|
24,811 |
|
|
Intangibles held for sale |
|
|
3,000 |
|
|
3,553 |
|
|
— |
|
|
Other intangibles, net |
|
|
26 |
|
|
28 |
|
|
229 |
|
|
Tangible common equity |
|
$ |
105,991 |
|
$ |
104,411 |
|
$ |
94,628 |
|
|
|
|
|
|
|
|
|
|
|
|
|
|
Common shares outstanding, end of period |
|
|
7,917,489 |
|
|
7,940,168 |
|
|
7,968,420 |
|
|
Tangible common book value per share |
|
$ |
13.39 |
|
$ |
13.15 |
|
$ |
11.88 |
|
|
|
|
|
|
|
|
|
|
|
|
|
|
Net income available to common shareholders |
|
$ |
1,334 |
|
$ |
2,572 |
|
$ |
1,627 |
|
|
Return on tangible common equity (annualized) |
|
|
5.03 |
% |
|
9.85 |
% |
|
6.88 |
% |
|
|
|
|
|
|
|
|
|
|
|
|
|
Efficiency |
|
|
|
|
|
|
|
|
|
|
|
Non-interest expense |
|
$ |
14,647 |
|
$ |
13,082 |
|
$ |
12,602 |
|
|
Less: amortization |
|
|
2 |
|
|
7 |
|
|
173 |
|
|
Less: loss on intangibles held for sale |
|
|
553 |
|
|
— |
|
|
— |
|
|
Adjusted non-interest expense |
|
$ |
14,092 |
|
$ |
13,075 |
|
$ |
12,429 |
|
|
|
|
|
|
|
|
|
|
|
|
|
|
Net interest income |
|
$ |
8,931 |
|
$ |
8,190 |
|
$ |
7,971 |
|
|
Non-interest income |
|
|
7,767 |
|
|
8,228 |
|
|
6,976 |
|
|
Less: |
|
|
|
|
|
|
|
|
|
|
|
Net gain on sale of assets |
|
|
— |
|
|
183 |
|
|
— |
|
|
Total income |
|
$ |
16,698 |
|
$ |
16,235 |
|
$ |
14,947 |
|
|
Efficiency ratio |
|
|
84.39 |
% |
|
80.54 |
% |
|
83.15 |
% |
|
|
|
|
|
|
|
|
|
|
|
|
|
Total income before non-interest expense |
|
$ |
16,331 |
|
$ |
15,971 |
|
$ |
14,753 |
|
|
Less: |
|
|
|
|
|
|
|
|
|
|
|
Net gain on sale of assets |
|
|
— |
|
|
183 |
|
|
— |
|
|
Plus: provision for loan losses |
|
|
367 |
|
|
447 |
|
|
194 |
|
|
Gross revenue |
|
$ |
16,698 |
|
$ |
16,235 |
|
$ |
14,947 |
|
13
First Western Financial, Inc.
Consolidated Financial Summary (unaudited) (continued)
|
|
|
As of and for the Three Months Ended |
|
|||||||
|
|
|
March 31, |
|
December 31, |
|
March 31, |
|
|||
|
(Dollars in thousands, except share and per share data) |
|
2020 |
|
2019 |
|
2019 |
|
|||
|
Adjusted Net Income Available To Common Shareholders |
|
|
|
|
|
|
|
|
|
|
|
Net income available to common shareholders |
|
$ |
1,334 |
|
$ |
2,572 |
|
$ |
1,627 |
|
|
Plus: loss on intangibles held for sale including income tax impact |
|
|
438 |
|
|
— |
|
|
— |
|
|
Adjusted net income available to shareholders |
|
$ |
1,772 |
|
$ |
2,572 |
|
$ |
1,627 |
|
|
|
|
|
|
|
|
|
|
|
|
|
|
Adjusted Earnings Per Share |
|
|
|
|
|
|
|
|
|
|
|
Earnings per share |
|
$ |
0.17 |
|
$ |
0.33 |
|
$ |
0.21 |
|
|
Plus: loss on intangibles held for sale including income tax impact |
|
|
0.06 |
|
|
— |
|
|
— |
|
|
Adjusted earnings per share |
|
$ |
0.23 |
|
$ |
0.33 |
|
$ |
0.21 |
|
|
|
|
|
|
|
|
|
|
|
|
|
|
Adjusted Diluted Earnings Per Share |
|
|
|
|
|
|
|
|
|
|
|
Diluted earnings per share |
|
$ |
0.17 |
|
$ |
0.32 |
|
$ |
0.21 |
|
|
Plus: loss on intangibles held for sale including income tax impact |
|
|
0.05 |
|
|
— |
|
|
— |
|
|
Adjusted diluted earnings per share |
|
$ |
0.22 |
|
$ |
0.32 |
|
$ |
0.21 |
|
|
|
|
|
|
|
|
|
|
|
|
|
|
Adjusted Return on Average Assets (annualized) |
|
|
|
|
|
|
|
|
|
|
|
Return on average assets |
|
|
0.43 |
% |
|
0.82 |
% |
|
0.57 |
% |
|
Plus: loss on intangibles held for sale including income tax impact |
|
|
0.14 |
|
|
— |
|
|
— |
|
|
Adjusted return on average assets |
|
|
0.57 |
% |
|
0.82 |
% |
|
0.57 |
% |
|
|
|
|
|
|
|
|
|
|
|
|
|
Adjusted Return on Average Shareholders' Equity (annualized) |
|
|
|
|
|
|
|
|
|
|
|
Return on average shareholders' equity |
|
|
4.09 |
% |
|
8.06 |
% |
|
5.50 |
% |
|
Plus: loss on intangibles held for sale including income tax impact |
|
|
1.34 |
|
|
— |
|
|
— |
|
|
Adjusted return on average shareholders' equity |
|
|
5.43 |
% |
|
8.06 |
% |
|
5.50 |
% |
|
|
|
|
|
|
|
|
|
|
|
|
|
Adjusted Return on Tangible Common Equity (annualized) |
|
|
|
|
|
|
|
|
|
|
|
Return on tangible common equity |
|
|
5.03 |
% |
|
9.85 |
% |
|
6.88 |
% |
|
Plus: loss on intangibles held for sale including income tax impact |
|
|
1.66 |
|
|
— |
|
|
— |
|
|
Adjusted return on tangible common equity |
|
|
6.69 |
% |
|
9.85 |
% |
|
6.88 |
% |
14
Exhibit 99.2
| First Western Financial, Inc. The First, Western-Based Private Trust Bank First Quarter 2020 Conference Call |

| Safe Harbor 2 This presentation contains “forward-looking statements” within the meaning of Section 27A of the Securities Act of 1933, as amended, and Section 21E of the Securities Exchange Act of 1934, as amended. These forward-looking statements reflect the current views of First Western Financial, Inc.’s (“First Western”) management with respect to, among other things, future events and First Western’s financial performance. These statements are often, but not always, made through the use of words or phrases such as “may,” “should,” “could,” “predict,” “potential,” “believe,” “will likely result,” “expect,” “continue,” “will,” “anticipate,” “seek,” “estimate,” “intend,” “plan,” “project,” “future” “forecast,” “goal,” “target,” “would” and “outlook,” or the negative variations of those words or other comparable words of a future or forward-looking nature. These forward-looking statements are not historical facts, and are based on current expectations, estimates and projections about First Western’s industry, management’s beliefs and certain assumptions made by management, many of which, by their nature, are inherently uncertain and beyond First Western’s control. Accordingly, First Western cautions you that any such forward-looking statements are not guarantees of future performance and are subject to risks, assumptions and uncertainties that are difficult to predict. Although First Western believes that the expectations reflected in these forward-looking statements are reasonable as of the date made, actual results may prove to be materially different from the results expressed or implied by the forward-looking statements. Those following risks and uncertainties, among others, could cause actual results and future events to differ materially from those set forth or contemplated in the forward-looking statements: the COVID-19 pandemic and related government actions; the risk of geographic concentration in Colorado, Arizona, Wyoming and California; the risk of changes in the economy affecting real estate values and liquidity; the risk in our ability to continue to originate residential real estate loans and sell such loans; risks specific to commercial loans and borrowers; the risk of claims and litigation pertaining to our fiduciary responsibilities; the risk of competition for investment managers and professionals; the risk of fluctuation in the value of our investment securities; the risk of changes in interest rates; and the risk of the adequacy of our allowance for credit losses and the risk in our ability to maintain a strong core deposit base or other low-cost funding sources. Additional information regarding these and other risks and uncertainties to which our business and future financial performance are subject is contained in our Annual Report on Form 10-K filed with the U.S. Securities and Exchange Commission (“SEC”) on March 12, 2020 and other documents we file with the SEC from time to time. All subsequent written and oral forward-looking statements attributable to First Western or persons acting on First Western’s behalf are expressly qualified in their entirety by this paragraph. Forward-looking statements speak only as of the date of this presentation. First Western undertakes no obligation to publicly update or otherwise revise any forward-looking statements, whether as a result of new information, future events or otherwise (except as required by law). Certain of the information contained herein may be derived from information provided by industry sources. The Company believes that such information is accurate and the sources from which it has been obtained are reliable; however, the Company cannot guaranty the accuracy of such information and has not independently verified such information. This presentation contains certain non-GAAP financial measures intended to supplement, not substitute for, comparable GAAP measures. Reconciliations of non-GAAP financial measures to GAAP financial measures are provided at the end of this presentation. Numbers in the presentation may not sum due to rounding. |
| COVID-19 Impact Overview |
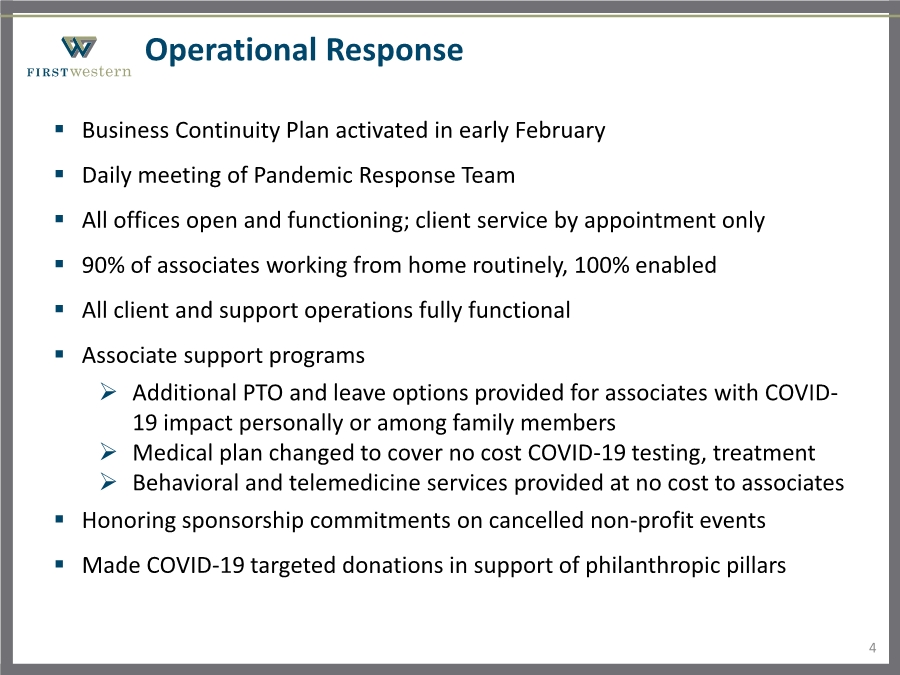
| Operational Response 4 .. Business Continuity Plan activated in early February .. Daily meeting of Pandemic Response Team .. All offices open and functioning; client service by appointment only .. 90% of associates working from home routinely, 100% enabled .. All client and support operations fully functional .. Associate support programs Additional PTO and leave options provided for associates with COVID- 19 impact personally or among family members Medical plan changed to cover no cost COVID-19 testing, treatment Behavioral and telemedicine services provided at no cost to associates .. Honoring sponsorship commitments on cancelled non-profit events .. Made COVID-19 targeted donations in support of philanthropic pillars |
| Client Engagement and Support Overview Trust and Investment Management Banking .. Active client calling program to assess impact of COVID-19 .. All credits placed into risk categories based on data gathered .. Loan modification program, including payment deferrals, extensions and financial covenant waivers put in place .. Robust digital and online banking platforms efficiently serving client needs .. Participation in Paycheck Protection Program serving both existing and new clients $55.8 million in loan payment extensions/deferrals (as of 4/24/2020) 5 .. Tactical shift over last twelve months has resulted in outperformance during 1Q20 Clients moved to lower end of targeted equity weightings Shift from international equities into cash Active tax loss harvesting $162.8 million in PPP loans approved (as of 4/24/2020) |
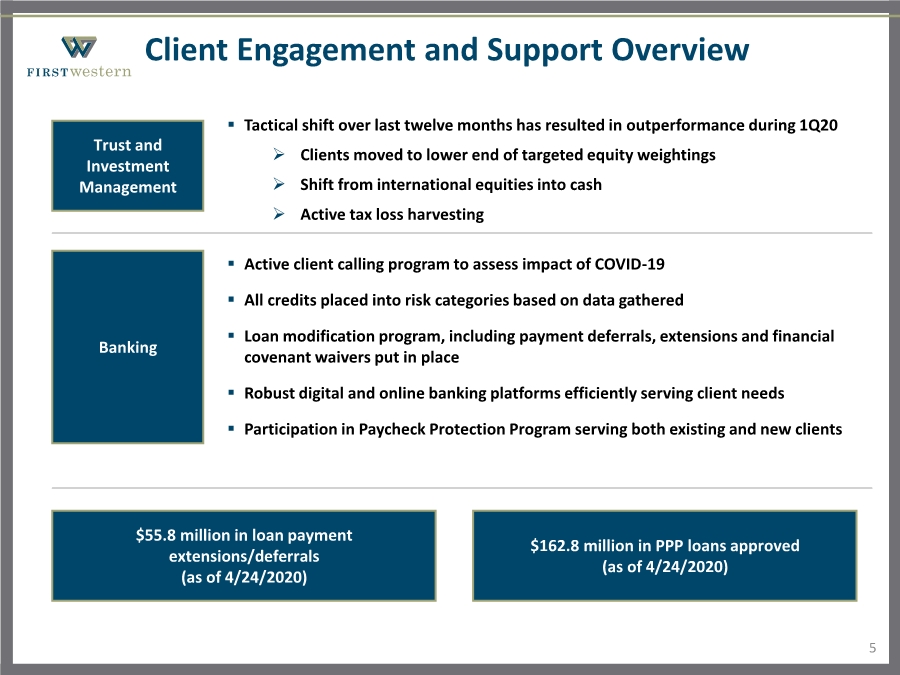
| Notable Trends and Data Points 6 .. Positive business development trends in January and February Strong loan and deposit growth Steady expansion in net interest margin .. No meaningful change in credit line utilization rate since crisis started .. Loan pipeline slightly down from pre-crisis levels, but still relatively healthy .. Mortgage production remains consistent, largely driven by refinancings .. Mortgage market disruption in March caused unrealized loss in mortgages .. Strong deposit inflow in March from both existing and new clients |
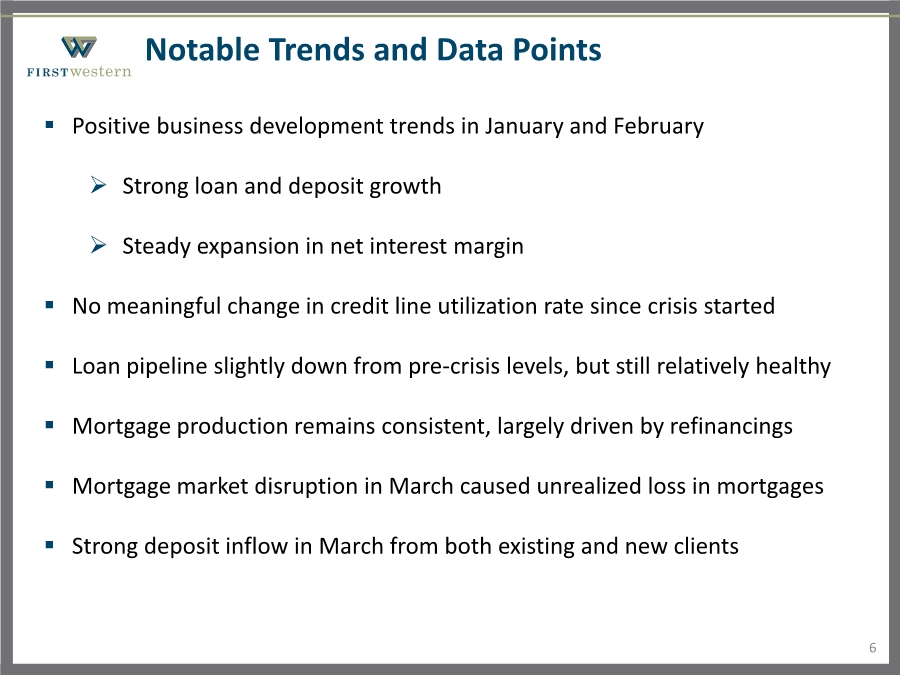
| Loan Portfolio Composition 7 Cash, Securities and Other 14% 1 - 4 Family Residential 40% Non-Owner Occupied CRE 18% Construction and Development 2% Owner Occupied CRE 12% Commercial and Industrial 14% Commercial 58% Consumer 42% $1.0 Billion (as of 3/31/20) Commercial vs. Consumer |
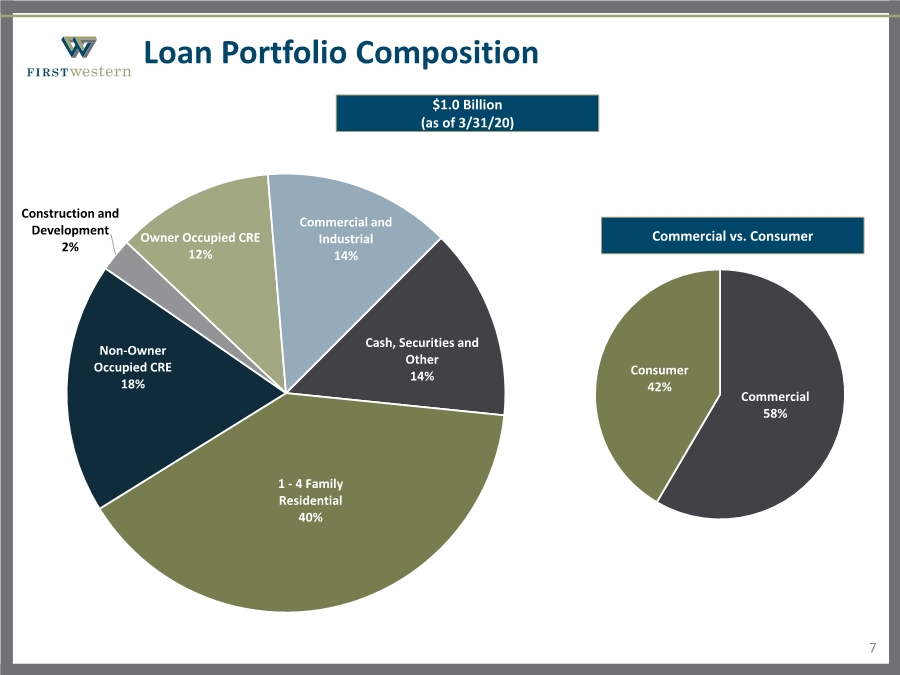
| Commercial Loans by Industry 8 44% 16% 10% 7% 4% 4% 3% 3% 3% 2% 2% 2% Real Estate / Rental and Leasing Finance and Insurance Health Care and Social Assistance Other Miscellaneous⁽¹⁾ Consumer Professional, Scientific and Technical Services Accommodation and Food Services Construction Arts, Entertainment and Recreation Mining, Quarrying and Oil and Gas Extraction Other Services (except Public Administration) Administrative and Support and Waste Management and Remediation Services 0% 5% 10% 15% 20% 25% 30% 35% 40% 45% 50% $609.2 Million (as of 3/31/20) Industry as a Percentage of Commercial Loans (as of 3/31/20) (1) Represents the aggregate of individual industries; no one industry is more than 2% of Commercial loans |
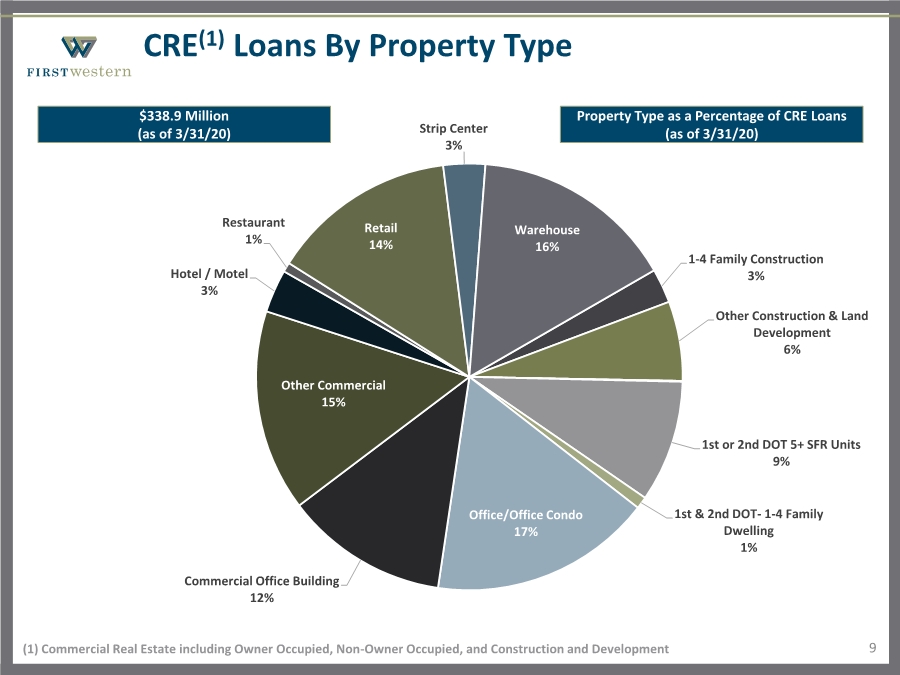
| CRE(1) Loans By Property Type 9 1-4 Family Construction 3% Other Construction & Land Development 6% 1st or 2nd DOT 5+ SFR Units 9% 1st & 2nd DOT- 1-4 Family Dwelling 1% Office/Office Condo 17% Commercial Office Building 12% Other Commercial 15% Hotel / Motel 3% Restaurant 1% Retail 14% Strip Center 3% Warehouse 16% (1) Commercial Real Estate including Owner Occupied, Non-Owner Occupied, and Construction and Development $338.9 Million (as of 3/31/20) Property Type as a Percentage of CRE Loans (as of 3/31/20) |
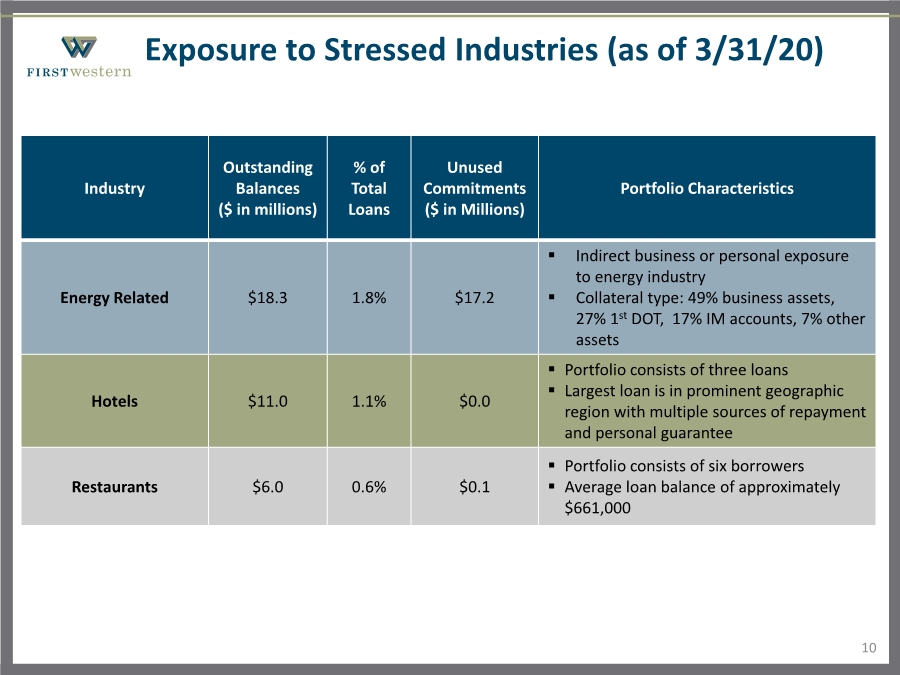
| Exposure to Stressed Industries (as of 3/31/20) 10 Industry Outstanding Balances ($ in millions) % of Total Loans Unused Commitments ($ in Millions) Portfolio Characteristics Energy Related $18.3 1.8% $17.2 .. Indirect business or personal exposure to energy industry .. Collateral type: 49% business assets, 27% 1st DOT, 17% IM accounts, 7% other assets Hotels $11.0 1.1% $0.0 .. Portfolio consists of three loans .. Largest loan is in prominent geographic region with multiple sources of repayment and personal guarantee Restaurants $6.0 0.6% $0.1 .. Portfolio consists of six borrowers .. Average loan balance of approximately $661,000 |
| Capital and Liquidity Overview 11 Liquidity Funding Sources (as of 3/31/20) Liquidity Reserves: Total Available Cash $117,811,270 Unpledged Investment Securities $ 47,365,999 Borrowed Funds: Unsecured: Credit Lines $ 54,000,000 Secured: FHLB Available $378,745,864 FRB Available $ 1,203,604 Brokered Remaining Capacity $155,134,002 Total Liquidity Funding Sources $754,260,739 Loan to Deposit Ratio 88.6% Consolidated Capital Ratios (as of 3/31/20) 10.96% 10.96% 13.31% 8.81% 0.00% 2.00% 4.00% 6.00% 8.00% 10.00% 12.00% 14.00% Tier 1 Capital to Risk-Weighted Assets CET1 to Risk- Weighted Assets Total Capital to Risk-Weighted Assets Tier 1 Capital to Average Assets Tangible Common Equity / TBV Per Share(1) (in thousands) $91,662 $104,411 $105,991 $11.50 $13.15 $13.39 $10.00 $11.00 $12.00 $13.00 $14.00 $80,000 $85,000 $90,000 $95,000 $100,000 $105,000 $110,000 4Q18 4Q19 1Q20 TCE TBV/Share (1) See Non-GAAP reconciliation |
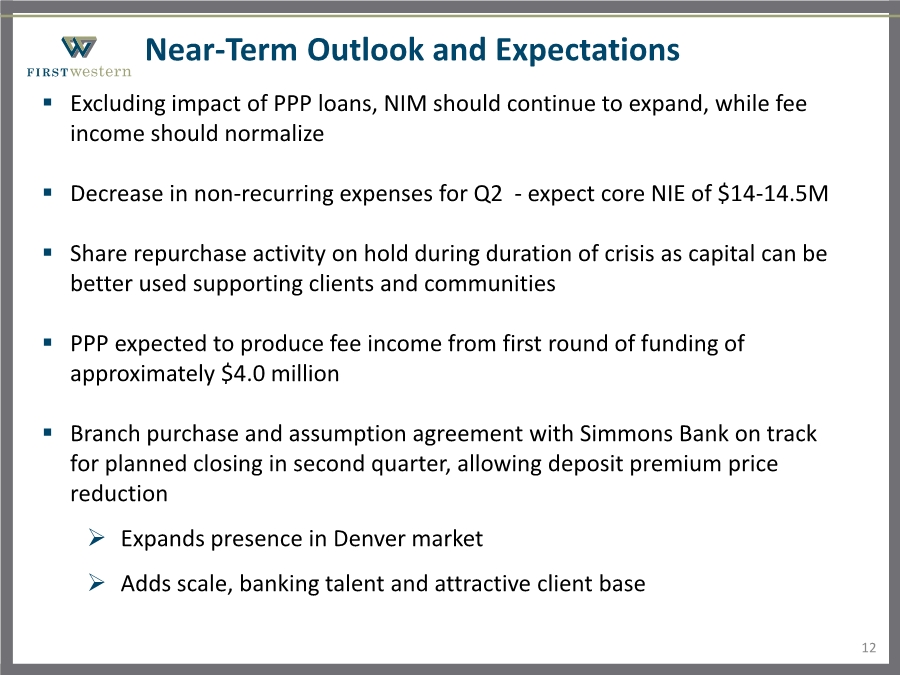
| Near-Term Outlook and Expectations 12 .. Excluding impact of PPP loans, NIM should continue to expand, while fee income should normalize .. Decrease in non-recurring expenses for Q2 - expect core NIE of $14-14.5M .. Share repurchase activity on hold during duration of crisis as capital can be better used supporting clients and communities .. PPP expected to produce fee income from first round of funding of approximately $4.0 million .. Branch purchase and assumption agreement with Simmons Bank on track for planned closing in second quarter, allowing deposit premium price reduction Expands presence in Denver market Adds scale, banking talent and attractive client base |
| First Quarter 2020 Financial Review |
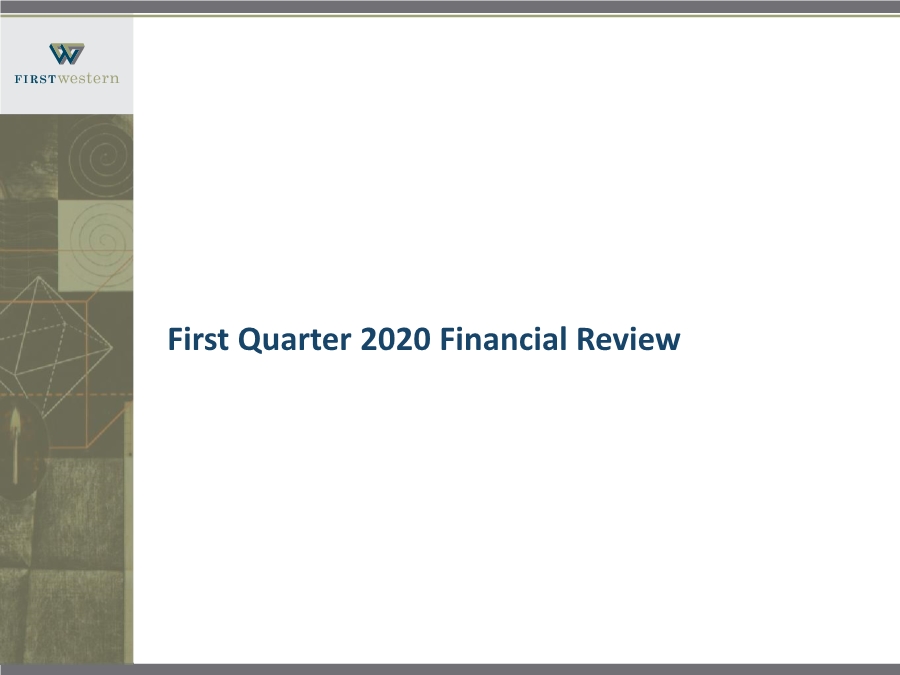
| $0.21 $0.33 $0.30 $0.32 $0.22 $0.15 $0.05 $- $0.05 $0.10 $0.15 $0.20 $0.25 $0.30 $0.35 $0.40 Q1 2019 Q2 2019 Q3 2019 Q4 2019 Q1 2020 EPS Adjustments to EPS (1) (1) Net Income Available to Common Shareholders and Earnings per Share 14 Net Income Available to Common Shareholders .. Strong operational and financial performance in light of COVID-19 pandemic .. Financial results impacted by $0.6 million (or $0.05 per diluted share) loss on held for sale intangible assets related to Capital Management segment .. Net income of $1.3 million, or $0.17 diluted earnings per share, in 1Q20 .. Adjusted net income(1) increased 8.9% and adjusted EPS(1) increased 4.8% from 1Q19 .. Book value and tangible book value(1) per common share increased 8.3% and 12.7%, respectively, over 1Q19 Earnings per Share (in thousands) $1,182 $438 $1,627 $2,586 $2,406 $2,572 $1,772 Q1 2019 Q2 2019 Q3 2019 Q4 2019 Q1 2020 Net Income Adjustments to Net Income (1) (1) See Non-GAAP reconciliation (1) |
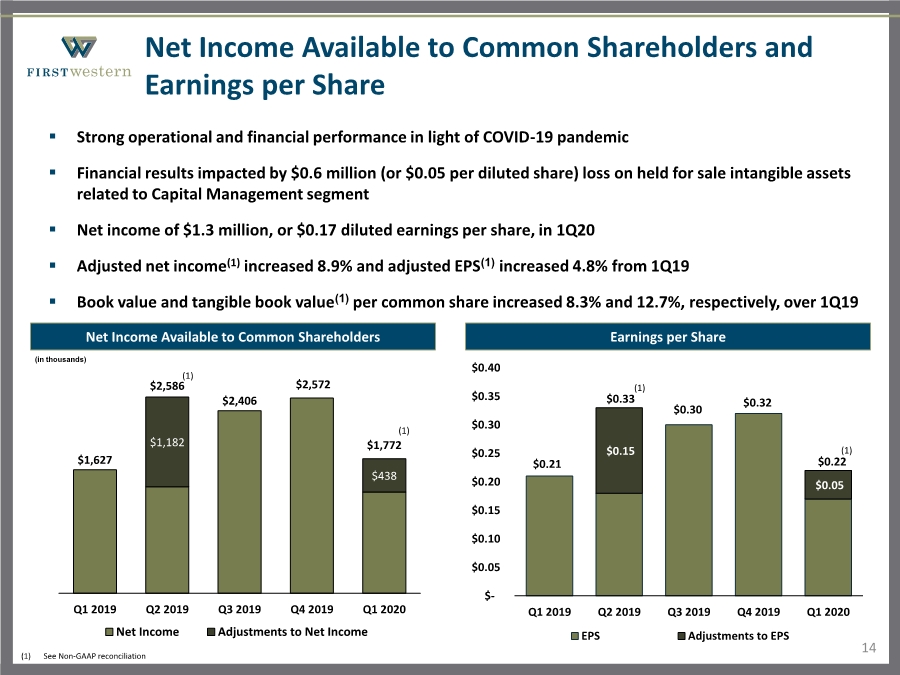
| $929 $966 $990 $1,018 $1,054 $1,045 $1,107 1Q19 2Q19 3Q19 4Q19 1Q20 4Q19 1Q20 HFI HFS Average Period End Loan Portfolio 15 Loan Portfolio Composition(1) .. Gross loans held-for-investment (HFI) increased 18.4% annualized .. Total new HFI loan production of $122.5 million in 1Q20 vs $146.1 million in 4Q19 and $63.8 million in 1Q19 .. Payoffs/paydowns, net of draws, increased to $87.7 million in 1Q20 vs $82.7 million in 4Q19 .. Balanced growth across C&I, CRE and 1-4 family residential portfolios (in thousands, as of quarter-end) Total Loans(1) (in millions) (1) Excludes deferred costs, net 1Q 2019 4Q 2019 1Q 2020 Cash, Securities and Other $130,641 $146,701 $147,157 Construction and Development 37,128 28,120 25,461 1 - 4 Family Residential 360,607 400,134 412,306 Non-Owner Occupied CRE 172,014 165,179 192,350 Owner Occupied CRE 108,873 127,968 121,138 Commercial and Industrial 120,602 128,457 144,066 Total Loans HFI $929,865 $996,559 $1,042,478 Mortgage loans held for sale 19,778 48,312 64,120 Total Loans $949,643 $1,044,871 $1,106,598 Loan Production & Net Loan Payoffs/Paydowns $63.8 $52.6 $55.4 $146.1 $122.5 $24.5 $44.7 $71.3 $82.7 $87.7 1Q19 2Q19 3Q19 4Q19 1Q20 Production Net Loan Payoffs/Paydowns (in millions) |
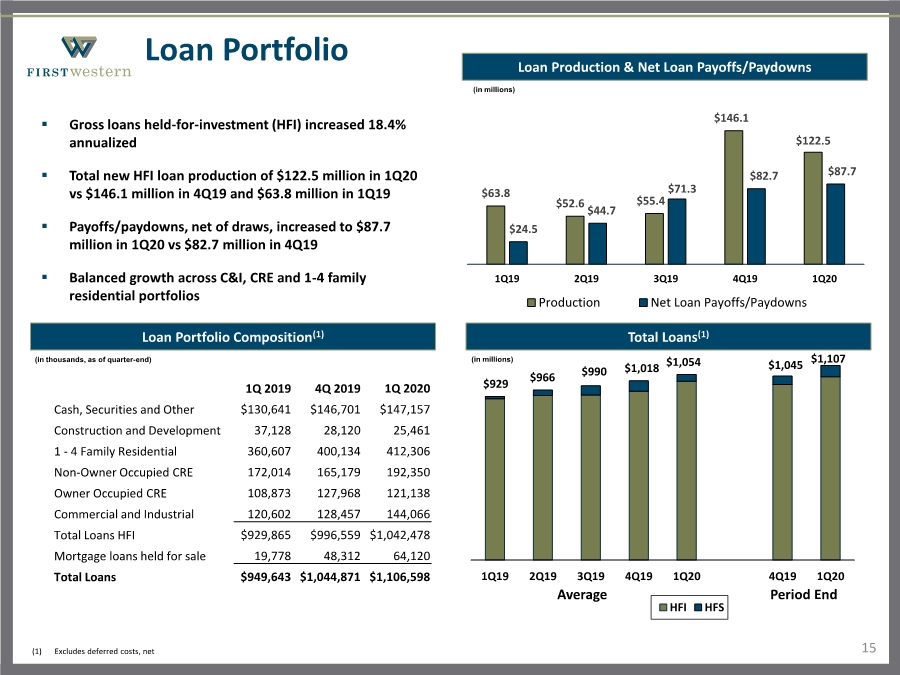
| $981 $967 $1,042 $1,092 $1,085 $1,087 $1,178 1Q19 2Q19 3Q19 4Q19 1Q20 4Q19 1Q20 Average Period End Total Deposits 16 Deposit Portfolio Composition .. Total deposits increased $91.7 million from end of prior quarter .. Strong growth in noninterest-bearing and money market accounts .. Continued improvement in deposit mix .. Cost of funds declined 20 bps from Q4 2019 1Q 2019 4Q 2019 1Q 2020 Money market deposit accounts $513,328 $615,575 $671,641 Time deposits 176,312 134,913 150,190 NOW 59,464 91,921 82,092 Savings accounts 2,513 4,307 3,923 Noninterest-bearing accounts 226,484 240,068 270,604 Total Deposits $978,101 $1,086,784 $1,178,450 (in thousands, as of quarter-end) Total Deposits (in millions) |
| Trust and Investment Management .. Total assets under management decreased $551.2 million from December 31, 2019 to $5.64 billion at March 31, 2020 .. Decrease was primarily attributable to volatility in markets resulting from COVID-19 pandemic $5,781 $5,968 $6,116 $6,188 $5,636 Q1 2019 Q2 2019 Q3 2019 Q4 2019 Q1 2020 Investment Agency Managed Trust 401(k)/Retirement Directed Trust Custody (in millions, as of quarter-end) 17 |
| Non-interest Income $7,767 Net Interest Income $8,931 53.5% 46.5% Gross Revenue 18 (1) See Non-GAAP reconciliation 1Q20 Gross Revenue(1) .. Gross revenue(1) increased 11.7% from 1Q19 .. Strong year-over-year growth in both net interest income and non-interest income Gross Revenue(1) ($millions) $14.9 $16.5 $16.6 $16.2 $16.7 Q1 2019 Q2 2019 Q3 2019 Q4 2019 Q1 2020 Wealth Management Capital Management Mortgage |
| Net Interest Income & Net Interest Margin 19 Net Interest Income .. Net interest income increased 9.0% from 4Q19, due to an increase in average loans and a higher net interest margin .. Net interest margin increased to 3.14%, primarily due to a 20 basis point decline in the cost of funds Net Interest Margin 3.03% 3.10% 2.95% 2.91% 3.14% Q1 2019 Q2 2019 Q3 2019 Q4 2019 Q1 2020 $7,971 $7,960 $7,940 $8,190 $8,931 Q1 2019 Q2 2019 Q3 2019 Q4 2019 Q1 2020 (in thousands) |
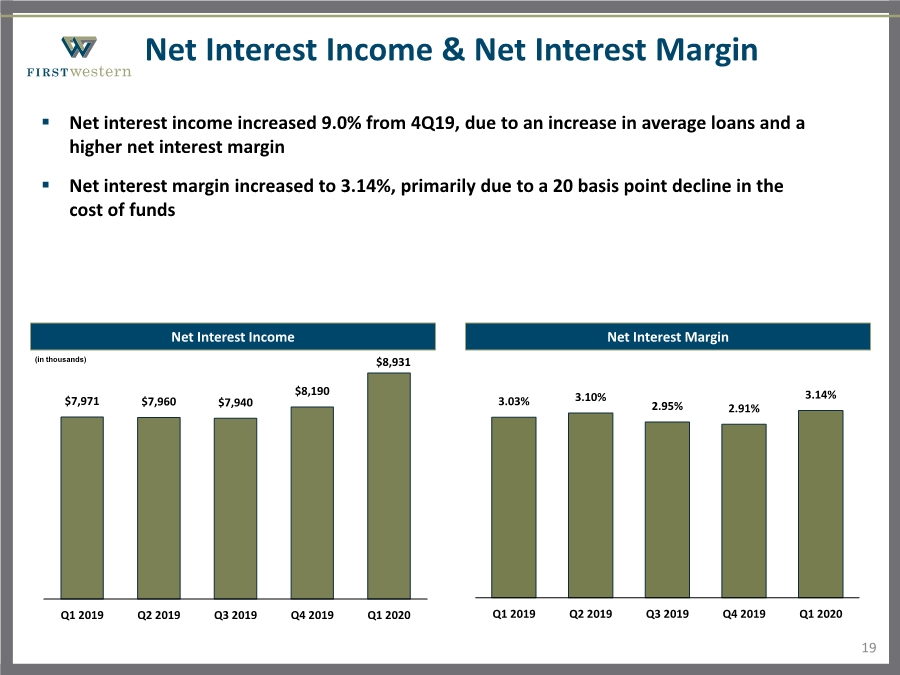
| $4,670 $4,693 $4,824 $4,748 $4,731 Q1 2019 Q2 2019 Q3 2019 Q4 2019 Q1 2020 Non-Interest Income 20 Total Non-Interest Income .. Non-interest income declined from 4Q19 primarily due to a decrease in insurance fees .. The uncertainty of COVID-19’s impact on the economy caused major disruptions in the mortgage market. .. Sharp rate reductions, as well as capacity, liquidity and delinquency concerns caused the market value of loans and loan servicing to decline significantly relative to mortgage hedges, resulting in approximately $4 million of lost value during the month of March Trust & Investment Management Fees $6,976 $8,586 $8,788 $8,228 $7,767 Q1 2019 Q2 2019 Q3 2019 Q4 2019 Q1 2020 Trust and Investment Management Fees Net Gain on Mortgage Loans Sold Bank Fees Risk Management and Insurance Fees Income on Company-Owned Life Insurance Net Gain on Sale of Securities/Assets (in thousands) (in thousands) |
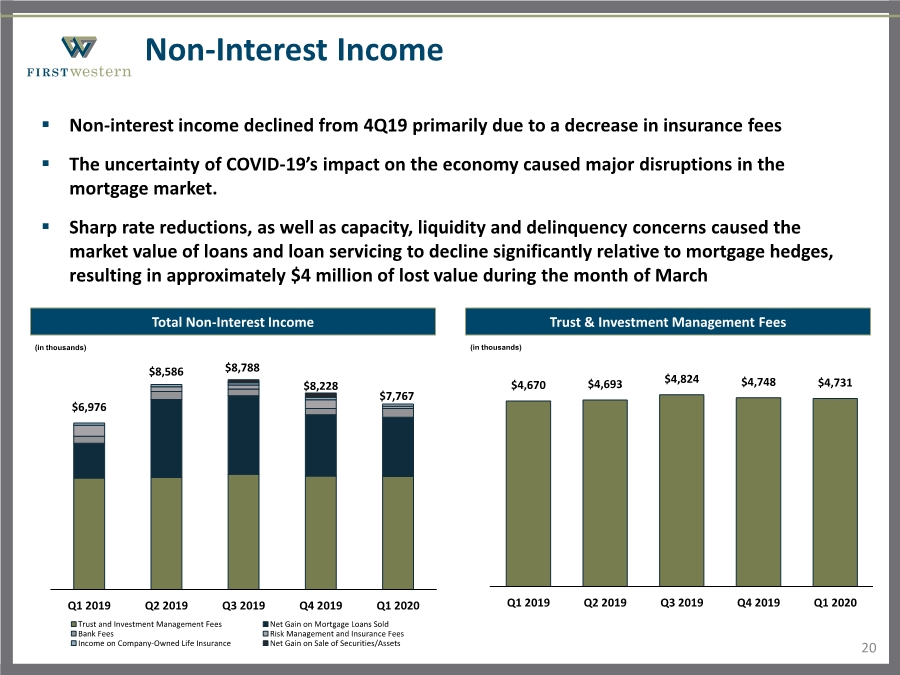
| Non-Interest Expense and Efficiency Ratio 21 Total Non-Interest Expense(1) .. Non-interest expense in 1Q20 included $0.6 million net loss on intangibles held for sale related to the Capital Management segment .. Excluding the loss, non-interest expense increased 7.7% from 4Q19 .. Increase was primarily driven by higher professional costs and payroll taxes Operating Efficiency Ratio(1) 83.2% 78.2% 80.6% 80.5% 84.4% Q1 2019 Q2 2019 Q3 2019 Q4 2019 Q1 2020 $1,572 $553 $12,602 $14,659 $13,422 $13,082 $14,647 Q1 2019 Q2 2019 Q3 2019 Q4 2019 Q1 2020 Goodwill Impairment or Loss on HFS Intangibles Non-Interest Expense (in thousands) (1) See Non-GAAP reconciliation |
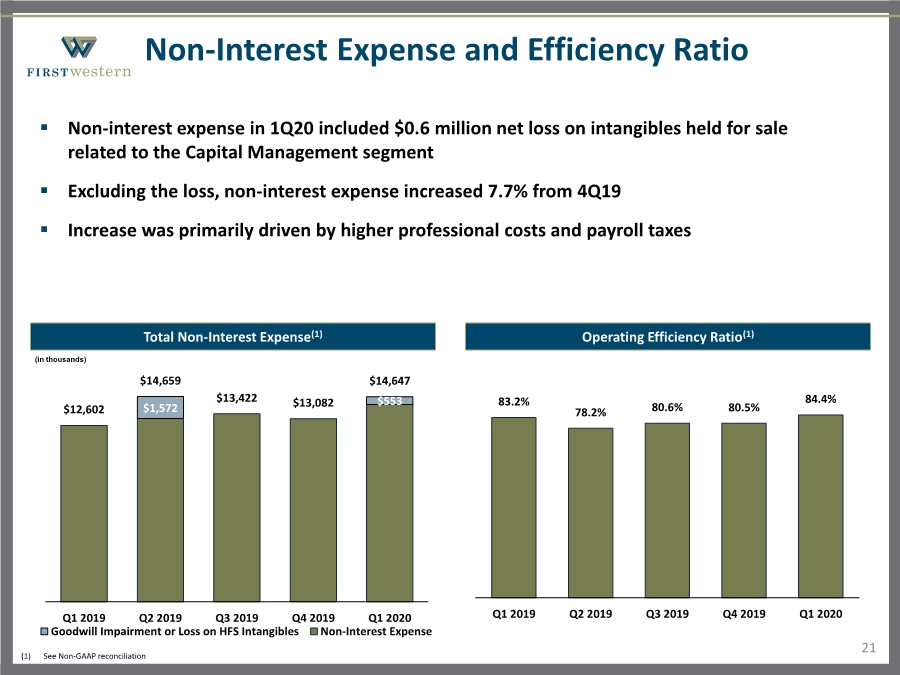
| Asset Quality 22 Non-Performing Assets/Total Assets .. Non-performing assets declined due to paydowns on non-performing loans .. No charge-offs in the quarter .. $0.4 million provision expense primarily reflects strong growth in total loans and a downgrade in the economic forecast due to the impact of the COVID-19 pandemic Net Charge-Offs/Average Loans 0.00% 0.00% 0.00% 0.03% 0.00% 0.00% 0.20% 0.40% 0.60% 0.80% 1.00% Q1 2019 Q2 2019 Q3 2019 Q4 2019 Q1 2020 1.69% 1.13% 1.15% 1.03% 0.82% Q1 2019 Q2 2019 Q3 2019 Q4 2019 Q1 2020 |
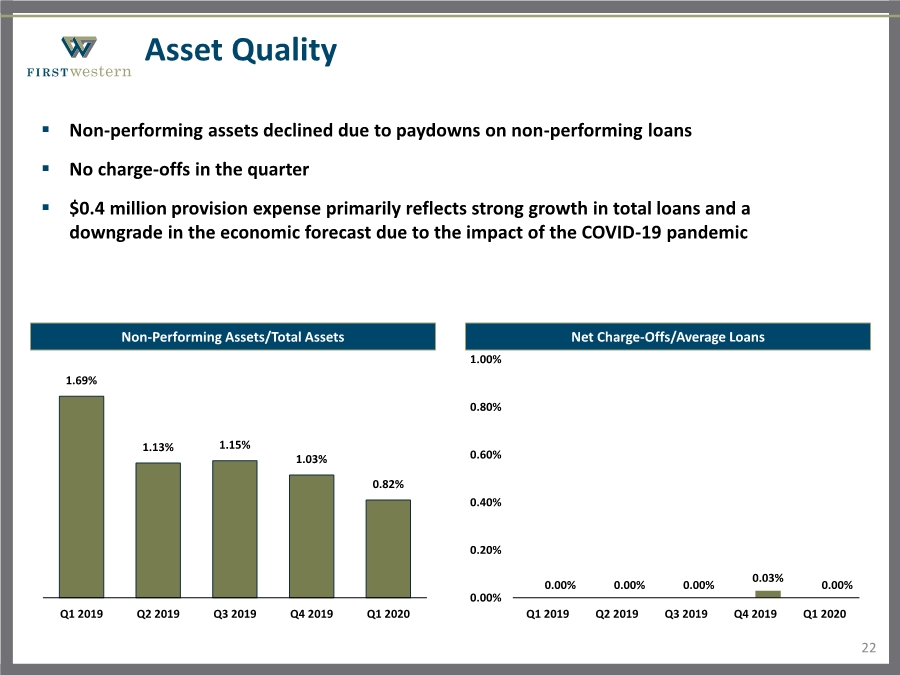
| Appendix |
| 24 Non-GAAP Reconciliation Consolidated Efficiency Ratio For the Three Months Ended, (Dollars in thousands) March 31, 2019 June 30, 2019 September 30, 2019 December 31, 2019 March 31, 2020 Non-interest expense $12,602 $14,659 $13,442 $13,082 $14,647 Less: Amortization 173 142 52 7 2 Less: Goodwill impairment - 1,572 --- Less: loss on intangibles held for sale ---- 553 Adjusted non-interest expense $12,429 $12,945 $13,390 $13,075 $14,092 Net interest income $7,971 $7,960 $7,940 $8,190 $8,931 Non-interest income 6,976 8,586 8,788 8,228 7,767 Less: Net gain on sale of securities -- 119 -- Less: Net gain on sale of assets --- 183 - Total income $14,947 $16,546 $16,609 $16,235 $16,698 Efficiency ratio 83.2% 78.2% 80.6% 80.5% 84.4% Consolidated Tangible Common Book Value Per Share As of the Three Months Ended, (Dollars in thousands) March 31, 2019 June 30, 2019 September 30, 2019 December 31, 2019 March 31, 2020 Total shareholders' equity $119,668 $122,157 $125,732 $127,678 $128,703 Less: Goodwill 24,811 23,239 19,686 $19,686 $19,686 Assets held for sale —— 3,553 3,553 3,000 Other intangibles, net 229 88 36 28 26 Tangible common equity 94,628 98,830 102,457 104,411 105,991 Common shares outstanding, end of period 7,968,420 7,983,866 7,983,284 7,940,168 7,917,489 Tangible common book value per share $11.88 $12.38 $12.83 $13.15 $13.39 |
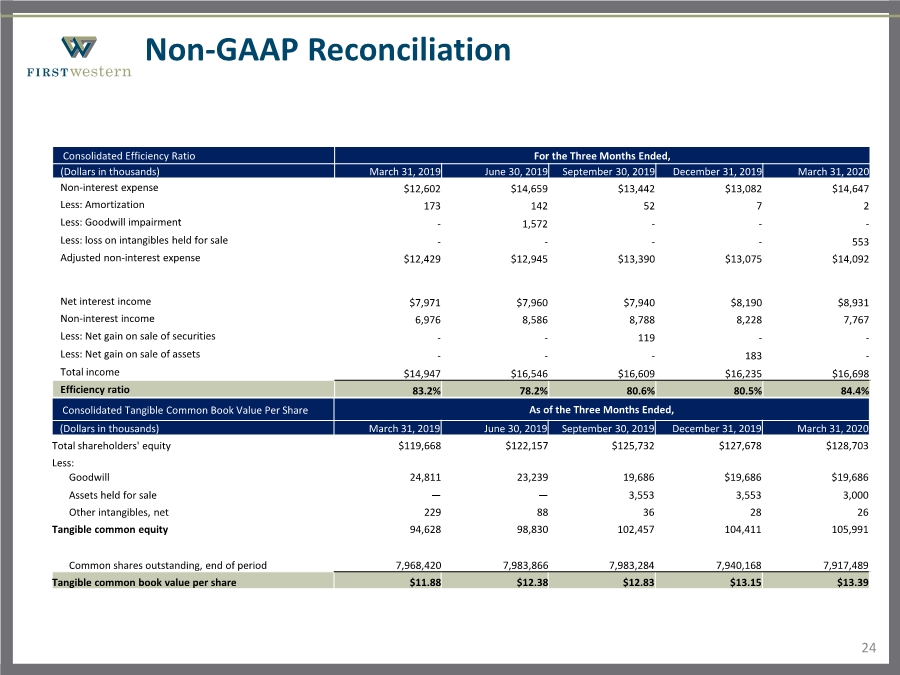
| 25 Non-GAAP Reconciliation Wealth Management Gross Revenue For the Three Months Ended, (Dollars in thousands) March 31, 2019 June 30, 2019 September 30, 2019 December 31, 2019 March 31, 2020 Total income before non-interest expense $12,509 $12,550 $12,554 $12,534 $13,023 Less: Net gain on sale of securities -- 119 -- Less: Net gain on sale of assets --- 183 - Plus: Provision for (recovery of) credit loss 194 (78) 100 447 367 Gross revenue $12,703 $12,472 $12,535 $12,798 $13,390 Capital Management Gross Revenue For the Three Months Ended, (Dollars in thousands) March 31, 2019 June 30, 2019 September 30, 2019 December 31, 2019 March 31, 2020 Total income before non-interest expense $765 $798 $776 $815 $804 Less: Net gain on sale of securities ----- Less: Net gain on sale of assets ----- Plus: Provision for (recovery of) credit loss ----- Gross revenue $765 $798 $776 $815 $804 Mortgage Gross Revenue For the Three Months Ended, (Dollars in thousands) March 31, 2019 June 30, 2019 September 30, 2019 December 31, 2019 March 31, 2020 Total income before non-interest expense $1,479 $3,276 $3,298 $2,622 $2,504 Less: Net gain on sale of securities ----- Less: Net gain on sale of assets ----- Plus: Provision for (recovery of) credit loss ----- Gross revenue $1,479 $3,276 $3,298 $2,622 $2,504 Consolidated Gross Revenue For the Three Months Ended, (Dollars in thousands) March 31, 2019 June 30, 2019 September 30, 2019 December 31, 2019 March 31, 2020 Total income before non-interest expense $14,753 $16,624 $16,628 $15,971 $16,331 Less: Net gain on sale of securities -- 119 -- Less: Net gain on sale of assets --- 183 - Plus: Provision for (recovery of) credit loss 194 (78) 100 447 367 Gross revenue $14,947 $16,546 $16,609 $16,235 $16,698 |
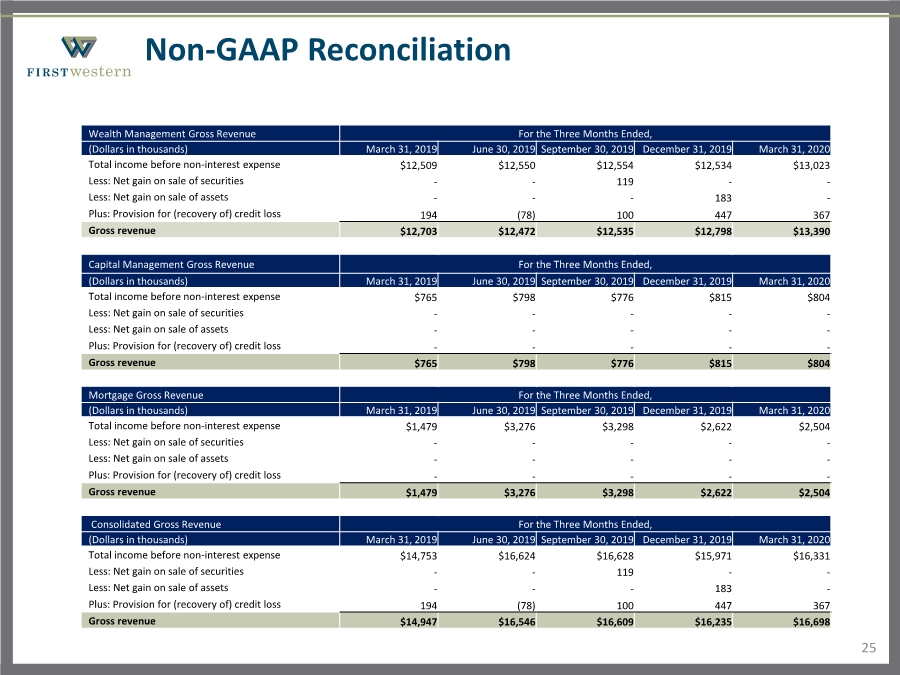
| 26 Non-GAAP Reconciliation Impact of Goodwill impairment – Net income available to common shareholder For the Three Months Ended, (Dollars in thousands, except per share data) June 30, 2019 September 30, 2019 December 31, 2019 March 31, 2020 Net income available to common shareholders $1,404 $2,406 $2,572 $1,334 Plus: Goodwill impairment including tax Impact 1.182 --- Plus: loss on intangibles held for sale including tax Impact --- 438 Adjusted net income to common shareholders $2,586 $2,406 $2,572 $1,772 Impact of Goodwill impairment – Earnings Per Share For the Three Months Ended, (Dollars in thousands, except per share data) June 30, 2019 September 30, 2019 December 31, 2019 March 31, 2020 Earnings per share $0.18 $0.30 $0.32 $0.17 Plus: Goodwill impairment including tax impact 0.15 --- Plus: loss on intangibles held for sale including tax impact --- 0.05 Adjusted earnings per share $0.33 $0.30 $0.32 $0.22 |