
NEON 8-K
Neonode Inc. (NEON)
UNITED STATES
SECURITIES AND EXCHANGE COMMISSION
Washington, D.C. 20549
FORM 8-K
CURRENT REPORT
Pursuant to Section 13 or 15(d) of the Securities Exchange Act of 1934
Date of Report (Date of earliest event reported): November 10, 2020
NEONODE INC.
(Exact name of issuer of securities held pursuant to the plan)
Commission File Number 1-35526
| Delaware | 94-1517641 | |
|
(State or other jurisdiction of incorporation) |
(I.R.S. Employer Identification No.) |
Storgatan 23C, 114 55 Stockholm, Sweden
(Address of Principal Executive Office, including Zip Code)
+46 (0) 8 667 17 17
Registrant’s telephone number, including area code:
Not Applicable
(Former name or former address, if changed since last report)
Check the appropriate box below if the Form 8-K filing is intended to simultaneously satisfy the filing obligation of the registrant under any of the following provisions (see General Instruction A.2. below):
| ☐ | Written communications pursuant to Rule 425 under the Securities Act (17 CFR 230.425) |
| ☐ | Soliciting material pursuant to Rule 14a-12 under the Exchange Act (17 CFR 240.14a-12) |
| ☐ | Pre-commencement communications pursuant to Rule 14d-2(b) under the Exchange Act (17 CFR 240.14d-2(b)) |
| ☐ | Pre-commencement communications pursuant to Rule 13e-4(c) under the Exchange Act (17 CFR 240.13e-4(c)) |
Securities registered pursuant to Section 12(b) of the Act:
| Title of each class | Trading Symbol(s) | Name of each exchange on which registered | ||
| Common Stock, par value $0.001 per share | NEON | The Nasdaq Stock Market LLC |
Indicate by check mark whether the registrant is an emerging growth company as defined in Rule 405 of the Securities Act of 1933 (§230.405 of this chapter) or Rule 12b-2 of the Securities Exchange Act of 1934 (§240.12b-2 of this chapter).
Emerging growth company ☐
If an emerging growth company, indicate by check mark if the registrant has elected not to use the extended transition period for complying with any new or revised financial accounting standards provided pursuant to Section 13(a) of the Exchange Act. ☐
TABLE OF CONTENTS
| Item 2.02 | Results of Operations and Financial Condition | 2 |
| Item 7.01 | Regulation FD Disclosure | 2 |
| Item 9.01 | Financial Statements and Exhibits | 2 |
| Signatures | 3 | |
Exhibit Index
| Ex-99.1 | Earnings Release of the Company dated November 10, 2020 |
| Ex-99.2 | Third Quarter 2020 Presentation of Neonode |
1

Item 2.02. Results of Operations and Financial Condition
On November 10, 2020, Neonode Inc. (the “Company”) reported its earnings for the three and six months ended September 30, 2020 (the “Earnings Release”) and posted on the Neonode website the Third Quarter 2020 Presentation (the “Quarterly Presentation”). A copy of the Earnings Release and the Quarterly Presentation are attached hereto as Exhibits 99.1 and 99.2, respectively, and are incorporated herein by reference.
The information furnished pursuant to this Item 2.02, including Exhibits 99.1 and 99.2, shall not be deemed “filed” for purposes of Section 18 of the Securities Exchange Act of 1934, as amended (the “Exchange Act”), or otherwise subject to the liabilities under that Section, or incorporated by reference in any filing under the Securities Act of 1933, as amended (the “Securities Act”), or the Exchange Act, except as shall be expressly set forth by specific reference in such a filing.
Item 7.01 Regulation FD Disclosure
As previously announced, the Company will conduct a conference call today, Tuesday, November 10, 2020 at 10:00 a.m. ET. The presentation slides to be used during the call, attached hereto as Exhibit 99.2, will be available on the “Investor Relations” section of the Company’s website at www.neonode.com immediately prior to the call. The information contained in, or that can be accessed through the Company’s website is not a part of this filing.
The information furnished pursuant to this Item 7.01, including Exhibit 99.2, shall not be deemed “filed” for purposes of Section 18 of the Exchange Act, or otherwise subject to the liabilities under that Section, or incorporated by reference in any filing under the Securities Act or the Exchange Act, except as shall be expressly set forth by specific reference in such a filing.
Item 9.01. Financial Statements and Exhibits.
| (d) | Exhibits |
| Exhibit No. | Description | |
| Exhibit 99.1 | Earnings Release of the Company dated November 10, 2020 | |
| Exhibit 99.2 | Third Quarter 2020 Presentation of Neonode |
2
Pursuant to the requirements of the Securities Exchange Act of 1934, the Registrant has duly caused this report to be signed on its behalf by the undersigned thereunto duly authorized.
| Date: November 10, 2020 | NEONODE INC. | |
| By: | /s/ Maria Ek | |
| Name: | Maria Ek | |
| Title: | Chief Financial Officer | |
3
Exhibit 99.1

Press Release
For Release, 09:10AM EST November 10, 2020
Neonode
Reports Third Quarter Ended September 30, 2020
Financial Results
STOCKHOLM, SWEDEN, November 10, 2020 — Neonode Inc. (NASDAQ: NEON), today reported financial results for the three and nine months ended September 30, 2020.
FINANCIAL SUMMARY THIRD QUARTER 2020
| ● | Net sales totaled $1.5 million compared to $1.3 million for the same period last year. |
| ● | Net loss attributable to Neonode Inc. totaled $1.6 million compared to a net loss of $1.1 million for the same period last year. |
| ● | Loss per share totaled $0.16 compared to a loss per share of $0.12 for the same period last year. |
| ● | Net cash used in operating activities totaled $1.8 million and $1.4 million for the three months ended September 30, 2020 and 2019, respectively. |
BUSINESS HIGHLIGHTS DURING THE QUARTER
| ● | The company completed a $13.9 million private placement financing transaction receiving cash proceeds of $13.0 million, net of offering costs. The company’s CEO and two members of the Board participated in the transaction purchasing a total of $3.1 million in stock. |
| ● | In addition, as part of the private placement financing transaction, the company fully repaid $1.0 million in short-term working capital loans owed to the two members of the Board. |
| ● | Continued marketing of touch sensor modules with a focus on contactless touch applications with customers in the elevator and interactive kiosk segments. |
| ● | Increased sales of touch sensor modules and evaluation kits to end customers and value adding partners. |
| ● | Advanced discussions regarding several new development projects around zForce® touch solutions with existing and new customers, including in the avionics and industrial control systems segments. |
| ● | Continued development and marketing of MultiSensing® platform for driver and in-cabin monitoring in automotive applications. |
| ● | Strengthened technical leadership through recruitment of Mr. Atsushi Ishii as new Vice President Engineering. |
BUSINESS HIGHLIGHTS SINCE THE END OF THE QUARTER
| ● | Expansion of sales team in North America and Europe and of partner network in Asia. |
| ● | Focused work on execution of marketing and business development plans to drive sales. |
| ● | Continued trend of growing interest in the company’s contactless touch solutions and increased sales of touch sensor modules and evaluation kits. |
| ● | Prototype development agreement signed with leading U.S. defense contractor. |
THE CEO’S COMMENTS
“License fees earned in the third quarter from our printer and automotive customers continued to be at reduced levels due to slower sales in the global markets amid the COVID-19 crisis. We expect these markets to rebound in the future as the pandemic is controlled but hesitate to speculate how quickly any recovery will be. We also continue to see certain customers delaying decisions regarding new development projects and investments due to COVID-19-related challenges in their businesses, in particular in Europe and North America. On the other side, COVID-19 has also rapidly projected our technology into new areas of growth. Our contactless touch sensor technology is an elegant, cost-effective solution that can protect consumers from having to physically touch surfaces on devices in public spaces. COVID-19 has been a paradigm shift in global consumer behavior, where people want to avoid touching buttons, keypads, and screens on public space devices,” commented Dr. Urban Forssell, CEO of Neonode.
“We are currently engaged with numerous customers around the world assisting them in development and product release of innovative solutions for contactless touch in elevators and self-service, multi-user kiosks. These customer activities have resulted in an increase in the manufacture and shipment of evaluation kits and sensors modules. We anticipate the worldwide demand for our sensor modules will continue to build over the coming quarters and years from these and new customer applications in self-service kiosks, vending machines, elevators, and other applications. We are also experiencing strong customer interest for our touch and in-cabin monitoring solutions offerings from customers in the military and avionics, industrial, and automotive segments. To expand our reach and accelerate growth we continue to build our sales and partner eco-system. For example, we recently added four new value-added resellers in Asia and hired two highly qualified salespersons. We also completed a significant financing transaction that included the participation of several investment funds along with company insiders. The proceeds from the financing not only strengthen the company’s cash position, but also provide the liquidity to accelerate growth by adding critical assets needed to meet growing customer demand,” concluded Dr. Forssell.
FINANCIAL OVERVIEW FOR THE THREE AND NINE MONTH PERIOD ENDED SEPTEMBER 30, 2020
The increase of 14.1% in total net revenues for the three-month period in 2020 as compared to the same period in 2019 was primarily related to significantly higher revenues from sensor module sales which was partially offset by slightly lower license revenues. The decrease of 29.5% in total net revenues for the nine-month period in 2020 as compared to the same period in 2019 was primarily related to lower license revenues across all customers. In accordance with our revenue recognition policy, we record unbilled license fees using prior royalty revenue data. In 2020, due to the uncertainty in the global economy, we recorded lower estimated license fees than in the same period in 2019.
Our combined total gross margin was 86.6% and 89.6% for the three and nine months ended September 30, 2020 and 95.1% and 95.3% for the three and nine months ended September 2019, respectively. The decrease in total gross margin in 2020 as compared to 2019 was primarily due to the increase in sales of sensor modules with lower gross margins compared to the 100% gross margin on license fees, plus certain costs relating to inventory adjustments in 2020. Our operating expense increased 24.8% and decreased 2.5% in the three and nine months ended September 30, 2020, respectively, compared to same periods in 2019. The increase for the three months in 2020 is primarily due to actual and estimated one-time legal costs. The decrease for the nine months period in 2020 is primarily related to lower staff expenses and scrapped inventory included in the comparable periods in 2019.
Net loss attributable to Neonode Inc. for the three and nine months ended September 30, 2020 was $1.6 million and $4.3 million, or a loss of $0.16 and $0.45 per share, respectively, compared to a net loss of $1.1 million and $2.9 million, or a loss of $0.12 and $0.33 per share, in the comparable periods in 2019, respectively.
2
Cash used by operations was $1.8 million and $3.7 million for three and nine months ended September 30, 2020, respectively, compared to $1.4 million and $2.9 million in the same periods in 2019, respectively.
Cash and accounts receivable totaled $13.3 million on September 30, 2020 compared to $3.7 million at December 31, 2019.
CONFERENCE CALL INFORMATION
The company will host a conference call Tuesday November 10, 2020 at 10AM Eastern Standard Time (EST)/4PM Central European Time (CET) featuring remarks by, and Q&A with, Urban Forssell, CEO, Maria Ek, CFO, and David Brunton, Head of Investor Relations.
The dial-in number for the conference call is toll-free: (877) 539-0733 (U.S. domestic), +1 (678) 607-2005 (international) or 085 661 9361 (Stockholm, Sweden). To access the call all participants must use the following Conference ID: #6708249. Please make sure to call at least five minutes before the scheduled start time.
To register for the call, and listen online, please click:
https://event.on24.com/wcc/r/2796934/24252073E597983C0BA475E62DA1868F
For interested individuals unable to join the live event, a digital recording for replay will be available for 30 days after the call's completion – 11/10/2020 (13:00PM EST) to 11/24/2020 (23:59PM EST). To access the recording, please use one of these Dial-In Numbers (800) 585-8367, (855) 859-2056 or (404) 537-3406, and the Conference ID #6708249.
Neonode will post a link to the presentation from the conference call in the Investor Relations section of the Neonode website www.neonode.com after the call.
For more information, please contact:
Investor Relations
David Brunton
E-mail:
[email protected]
Phone: +1 925 768 0620
Chief Financial Officer
Maria Ek
E-mail: [email protected]
About Neonode
Neonode Inc. (NASDAQ:NEON) is a publicly traded company, headquartered in Stockholm, Sweden and established in 2001. The company provides advanced optical sensing solutions for contactless touch, touch, gesture control, and in-cabin monitoring. Building on experience acquired during years of advanced R&D and technology licensing, Neonode’s technology is currently deployed in more than 75 million products and the company holds more than 120 patents worldwide. Neonode’s customer base includes some of the world’s best-known Fortune 500 companies in the consumer electronics, office equipment, medical, avionics, and automotive industries.
3
Neonode operates in three business areas: HMI Solutions, HMI Products and Remote Sensing Solutions. In HMI Solutions, Neonode offers customized touch and gesture control solutions for different markets and segments, including the military & avionics and industrial segments. In HMI Products, the company provides standardized sensor modules for contactless touch, touch and gesture sensing applications relevant to many industries, including the elevator and interactive kiosk segments. In Remote Sensing Solutions, Neonode offers software solutions for driver and in-cabin monitoring in vehicles.
NEONODE and the NEONODE logo are trademarks of Neonode, Inc. registered in the United States and other countries.
For further information please visit www.neonode.com
Follow us at:
LinkedIn
Cision
Subscribe to our news here
Safe Harbor Statement
This press release contains forward-looking statements within the meaning of the Private Securities Litigation Reform Act of
1995. These include, but are not limited to, statements relating to expectations, future performance or future events, the impact
of COVID-19, the increase in customer demand, their projects and sales, our ability to generate growth, and estimated lawsuit
costs. These statements are based on current assumptions, expectations and information available to Neonode management and involve
a number of known and unknown risks, uncertainties and other factors that may cause Neonode's actual results, levels of activity,
performance or achievements to be materially different from any expressed or implied by these forward-looking statements.
These risks, uncertainties, and factors are discussed under "Risk Factors" and elsewhere in Neonode's public filings with the SEC from time to time, including Neonode's annual report on Form 10-K, quarterly reports on Form 10-Q, and current reports on Form 8-K. You are advised to carefully consider these various risks, uncertainties and other factors. Although Neonode management believes that the forward-looking statements contained in this press release are reasonable, it can give no assurance that its expectations will be fulfilled. Forward-looking statements are made as of today's date, and Neonode undertakes no duty to update or revise them.
4
NEONODE INC.
CONDENSED CONSOLIDATED BALANCE SHEETS
(In thousands, except share and per share amounts)
| September 30, | December 31, | |||||||
| 2020 | 2019 | |||||||
| ASSETS | (Unaudited) | (Audited) | ||||||
| Current assets: | ||||||||
| Cash | $ | 12,212 | $ | 2,357 | ||||
| Accounts receivable and unbilled revenue, net | 1,044 | 1,324 | ||||||
| Projects in process | 11 | 8 | ||||||
| Inventory | 1,128 | 1,030 | ||||||
| Prepaid expenses and other current assets | 1,000 | 715 | ||||||
| Total current assets | 15,395 | 5,434 | ||||||
| Investment in joint venture | 3 | 3 | ||||||
| Property and equipment, net | 1,072 | 1,583 | ||||||
| Operating lease right-of-use assets | 155 | 416 | ||||||
| Total assets | $ | 16,625 | $ | 7,436 | ||||
| LIABILITIES AND STOCKHOLDERS’ EQUITY | ||||||||
| Current liabilities: | ||||||||
| Accounts payable | $ | 917 | $ | 555 | ||||
| Accrued payroll and employee benefits | 908 | 960 | ||||||
| Accrued expenses | 629 | 541 | ||||||
| Deferred revenues | 143 | 67 | ||||||
| Current portion of finance lease obligations | 650 | 568 | ||||||
| Current portion of operating lease obligations | 118 | 332 | ||||||
| Total current liabilities | 3,365 | 3,023 | ||||||
| Finance lease obligations, net of current portion | 277 | 508 | ||||||
| Operating lease obligations, net of current portion | - | 58 | ||||||
| Total liabilities | 3,642 | 3,589 | ||||||
| Commitments and contingencies | ||||||||
| Stockholders’ equity: | ||||||||
| Common stock, 25,000,000 shares authorized, with par value of $0.001; 11,467,377 and 9,171,154 shares issued and outstanding at September 30, 2020 and December 31, 2019, respectively | 11 | 9 | ||||||
| Additional paid-in capital | 211,587 | 197,543 | ||||||
| Accumulated other comprehensive loss | (890 | ) | (639 | ) | ||||
| Accumulated deficit | (194,813 | ) | (190,520 | ) | ||||
| Total Neonode Inc. stockholders’ equity | 15,895 | 6,393 | ||||||
| Noncontrolling interests | (2,912 | ) | (2,546 | ) | ||||
| Total stockholders’ equity | 12,983 | 3,847 | ||||||
| Total liabilities and stockholders’ equity | $ | 16,625 | $ | 7,436 | ||||
5
NEONODE INC.
CONDENSED CONSOLIDATED STATEMENTS OF OPERATIONS
(In thousands, except per share amounts)
(Unaudited)
| Three months ended September 30, | Nine months ended September 30, | |||||||||||||||
| 2020 | 2019 | 2020 | 2019 | |||||||||||||
| Revenues: | ||||||||||||||||
| HMI Solutions | $ | 1,211 | $ | 1,214 | $ | 3,071 | $ | 4,625 | ||||||||
| HMI Products | 284 | 96 | 476 | 407 | ||||||||||||
| Total revenues | 1,495 | 1,310 | 3,547 | 5,032 | ||||||||||||
| Cost of revenues: | ||||||||||||||||
| HMI Solutions | - | - | 1 | 5 | ||||||||||||
| HMI Products | 201 | 64 | 367 | 231 | ||||||||||||
| Total cost of revenues | 201 | 64 | 368 | 236 | ||||||||||||
| Total gross margin | 1,294 | 1,246 | 3,179 | 4,796 | ||||||||||||
| Operating expenses: | ||||||||||||||||
| Research and development | 901 | 1,167 | 2,939 | 3,878 | ||||||||||||
| Sales and marketing | 604 | 491 | 1,797 | 1,431 | ||||||||||||
| General and administrative | 1,535 | 777 | 3,034 | 2,658 | ||||||||||||
| Total operating expenses | 3,040 | 2,435 | 7,770 | 7,967 | ||||||||||||
| Operating loss | (1,746 | ) | (1,189 | ) | (4,591 | ) | (3,171 | ) | ||||||||
| Other expense: | ||||||||||||||||
| Interest expense | 11 | 8 | 25 | 27 | ||||||||||||
| Total other expense | 11 | 8 | 25 | 27 | ||||||||||||
| Loss before provision (benefit) for income taxes | (1,757 | ) | (1,197 | ) | (4,616 | ) | (3,198 | ) | ||||||||
| Provision (benefit) for income taxes | (9 | ) | 2 | 10 | 15 | |||||||||||
| Net loss including noncontrolling interests | (1,748 | ) | (1,199 | ) | (4,626 | ) | (3,213 | ) | ||||||||
| Net loss attributable to noncontrolling interests | 110 | 113 | 366 | 290 | ||||||||||||
| Net loss attributable to Neonode Inc. | (1,638 | ) | (1,086 | ) | (4,260 | ) | (2,923 | ) | ||||||||
| Preferred dividends | (33 | ) | - | (33 | ) | - | ||||||||||
| Net loss attributable to common shareholders of Neonode Inc. | $ | (1,671 | ) | $ | (1,086 | ) | $ | (4,293 | ) | $ | (2,923 | ) | ||||
| Loss per common share: | ||||||||||||||||
| Basic and diluted loss per share | $ | (0.16 | ) | $ | (0.12 | ) | $ | (0.45 | ) | $ | (0.33 | ) | ||||
| Basic and diluted – weighted average number of common shares outstanding | 10,128 | 8,811 | 9,492 | 8,804 | ||||||||||||
6
NEONODE INC.
CONDENSED CONSOLIDATED STATEMENTS OF COMPREHENSIVE LOSS
(In thousands)
(Unaudited)
| Three months ended September 30, | Nine months ended September 30, | |||||||||||||||
| 2020 | 2019 | 2020 | 2019 | |||||||||||||
| Net loss | $ | (1,748 | ) | $ | (1,199 | ) | $ | (4,626 | ) | $ | (3,213 | ) | ||||
| Other comprehensive income (loss): | ||||||||||||||||
| Foreign currency translation adjustments | (228 | ) | (145 | ) | (251 | ) | (300 | ) | ||||||||
| Comprehensive loss | (1,976 | ) | (1,344 | ) | (4,877 | ) | (3,513 | ) | ||||||||
| Less: Comprehensive loss attributable to noncontrolling interests | 110 | 113 | 366 | 290 | ||||||||||||
| Comprehensive loss attributable to Neonode Inc. | $ | (1,866 | ) | $ | (1,231 | ) | $ | (4,511 | ) | $ | (3,223 | ) | ||||
7
NEONODE INC.
CONDENSED CONSOLIDATED STATEMENTS OF STOCKHOLDERS’ EQUITY
(In thousands, except for Preferred Stock Shares Issued)
(Unaudited)
For the Quarter to Date periods ended September 30, 2019 through September 30, 2020
| Preferred Stock Shares Issued | Preferred Stock Amount | Common Stock Shares Issued | Common Stock Amount | Additional Paid-in Capital | Accumulated Other Comprehensive Income (Loss) | Accumulated Deficit | Total Neonode Inc. Stockholders’ Equity | Noncontrolling Interests | Total Stockholders’ Equity | |||||||||||||||||||||||||||||||
| Balances, December 31, 2018 | 82 | $ | - | 8,800 | $ | 9 | $ | 197,507 | $ | (456 | ) | $ | (185,222 | ) | $ | 11,838 | $ | (2,042 | ) | $ | 9,796 | |||||||||||||||||||
| Foreign currency translation adjustment | - | - | - | - | - | (181 | ) | - | (181 | ) | - | (181 | ) | |||||||||||||||||||||||||||
| Net loss | - | - | - | - | - | - | (573 | ) | (573 | ) | (111 | ) | (684 | ) | ||||||||||||||||||||||||||
| Balances, March 31, 2019 | 82 | $ | - | 8,800 | $ | 9 | $ | 197,507 | $ | (637 | ) | $ | (185,795 | ) | $ | 11,084 | $ | (2,153 | ) | $ | 8,931 | |||||||||||||||||||
| Conversion of Series B Preferred Stock to common stock | (2 | ) | - | 1 | - | - | - | - | - | - | - | |||||||||||||||||||||||||||||
| Foreign currency translation adjustment | - | - | - | - | - | 26 | - | 26 | - | 26 | ||||||||||||||||||||||||||||||
| Net loss | - | - | - | - | - | - | (1,264 | ) | (1,264 | ) | (66 | ) | (1,330 | ) | ||||||||||||||||||||||||||
| Balances, June 30, 2019 | 80 | $ | - | 8,801 | $ | 9 | $ | 197,507 | $ | (611 | ) | $ | (187,059 | ) | $ | 9,846 | $ | (2,219 | ) | $ | 7,627 | |||||||||||||||||||
| Conversion of Series B Preferred Stock to common stock | (80 | ) | - | 10 | - | - | - | - | - | - | - | |||||||||||||||||||||||||||||
| Foreign currency translation adjustment | - | - | - | - | - | (145 | ) | - | (145 | ) | - | (145 | ) | |||||||||||||||||||||||||||
| Net loss | - | - | - | - | - | - | (1,086 | ) | (1,086 | ) | (113 | ) | (1,199 | ) | ||||||||||||||||||||||||||
| Balances, September 30, 2019 | - | $ | - | 8,811 | $ | 9 | $ | 197,507 | $ | (756 | ) | $ | (188,145 | ) | $ | 8,615 | $ | (2,332 | ) | $ | 6,283 | |||||||||||||||||||
| Common stock issued upon exercise of common stock warrants | - | - | 360 | - | 36 | - | - | 36 | - | 36 | ||||||||||||||||||||||||||||||
| Foreign currency translation adjustment | - | - | - | - | - | 117 | - | 117 | - | 117 | ||||||||||||||||||||||||||||||
| Net loss | - | - | - | - | - | - | (2,375 | ) | (2,375 | ) | (214 | ) | (2,589 | ) | ||||||||||||||||||||||||||
| Balances, December 31, 2019 | - | $ | - | 9,171 | $ | 9 | $ | 197,543 | $ | (639 | ) | $ | (190,520 | ) | $ | 6,393 | $ | (2,546 | ) | $ | 3,847 | |||||||||||||||||||
| Foreign currency translation adjustment | - | - | - | - | - | (87 | ) | - | (87 | ) | - | (87 | ) | |||||||||||||||||||||||||||
| Net loss | - | - | - | - | - | - | (1,010 | ) | (1,010 | ) | (102 | ) | (1,112 | ) | ||||||||||||||||||||||||||
| Balances, March 31, 2020 | - | $ | - | 9,171 | $ | 9 | $ | 197,543 | $ | (726 | ) | $ | (191,530 | ) | $ | 5,296 | $ | (2,648 | ) | $ | 2,648 | |||||||||||||||||||
| Foreign currency translation adjustment | - | - | - | - | - | 64 | - | 64 | - | 64 | ||||||||||||||||||||||||||||||
| Net loss | - | - | - | - | - | - | (1,612 | ) | (1,612 | ) | (154 | ) | (1,766 | ) | ||||||||||||||||||||||||||
| Balances, June 30, 2020 | - | $ | - | 9,171 | $ | 9 | $ | 197,543 | $ | (662 | ) | $ | (193,142 | ) | $ | 3,748 | $ | (2,802 | ) | $ | 946 | |||||||||||||||||||
| Issuance of shares for cash, net of offering costs | 3,932 | 3,932 | 1,612 | 1 | 9,597 | - | - | 13,530 | - | 13,530 | ||||||||||||||||||||||||||||||
| Series C-2 Preferred Stock issued for repayment of short-term borrowings and accrued interest | 517 | 517 | - | - | (1 | ) | - | - | 516 | - | 516 | |||||||||||||||||||||||||||||
| Conversion of Series C-1 and C-2 Preferred Stock to common stock | (4,449 | ) | (4,449 | ) | 684 | 1 | 4,448 | - | - | - | - | - | ||||||||||||||||||||||||||||
| Preferred dividends | - | - | - | - | - | - | (33 | ) | (33 | ) | - | (33 | ) | |||||||||||||||||||||||||||
| Foreign currency translation adjustment | - | - | - | - | - | (228 | ) | - | (228 | ) | - | (228 | ) | |||||||||||||||||||||||||||
| Net loss | - | - | - | - | - | - | (1,638 | ) | (1,638 | ) | (110 | ) | (1,748 | ) | ||||||||||||||||||||||||||
| Balances, September 30, 2020 | - | $ | - | 11,467 | $ | 11 | $ | 211,587 | $ | (890 | ) | $ | (194,813 | ) | $ | 15,895 | $ | (2,912 | ) | $ | 12,983 | |||||||||||||||||||
8
NEONODE INC.
CONDENSED CONSOLIDATED STATEMENTS OF CASH FLOWS
(In thousands)
(Unaudited)
| Nine months ended September 30, | ||||||||
| 2020 | 2019 | |||||||
| Cash flows from operating activities: | ||||||||
| Net loss (including noncontrolling interests) | $ | (4,626 | ) | $ | (3,213 | ) | ||
| Adjustments to reconcile net loss to net cash used in operating activities: | ||||||||
| Bad debt expense | - | 20 | ||||||
| Depreciation and amortization | 567 | 650 | ||||||
| Amortization of operating lease right-of-use assets | 289 | 298 | ||||||
| Changes in operating assets and liabilities: | ||||||||
| Accounts receivable and unbilled revenue, net | 284 | (128 | ) | |||||
| Projects in process | (3 | ) | (8 | ) | ||||
| Inventory | (55 | ) | (8 | ) | ||||
| Prepaid expenses and other current assets | (248 | ) | (76 | ) | ||||
| Accounts payable and accrued expenses | 310 | (30 | ) | |||||
| Deferred revenues | 73 | (16 | ) | |||||
| Operating lease obligations | (298 | ) | (362 | ) | ||||
| Net cash used in operating activities | (3,707 | ) | (2,873 | ) | ||||
| Cash flows from investing activities: | ||||||||
| Purchase of property and equipment | (17 | ) | (89 | ) | ||||
| Net cash used in investing activities | (17 | ) | (89 | ) | ||||
| Cash flows from financing activities: | ||||||||
| Proceeds from issuance of preferred and common stock, net of offering costs | 13,530 | - | ||||||
| Proceeds from short term borrowings | 966 | - | ||||||
| Proceeds from short term tax credits | 542 | - | ||||||
| Payments on short term borrowings | (516 | ) | - | |||||
| Payments on short term tax credits | (557 | ) | - | |||||
| Principal payments on finance lease obligations | (185 | ) | (403 | ) | ||||
| Payment of preferred dividend | (2 | ) | - | |||||
| Net cash provided by (used in) financing activities | 13,778 | (403 | ) | |||||
| Effect of exchange rate changes on cash | (199 | ) | (165 | ) | ||||
| Net increase (decrease) in cash | 9,855 | (3,530 | ) | |||||
| Cash at beginning of period | 2,357 | 6,555 | ||||||
| Cash at end of period | $ | 12,212 | $ | 3,025 | ||||
| Supplemental disclosure of cash flow information: | ||||||||
| Cash paid for income taxes | $ | 10 | $ | 15 | ||||
| Cash paid for interest | $ | 25 | $ | 27 | ||||
| Supplemental disclosure of non-cash investing and financing activities: | ||||||||
| Short-term borrowings and accrued interest settled for Series C-2 Preferred Stock | $ | 516 | $ | - | ||||
| Accrual of dividends | $ | 31 | $ | - | ||||
| Right-of-use asset obtained in exchange for lease obligation | $ | 25 | $ | - | ||||
9
Exhibit 99.2
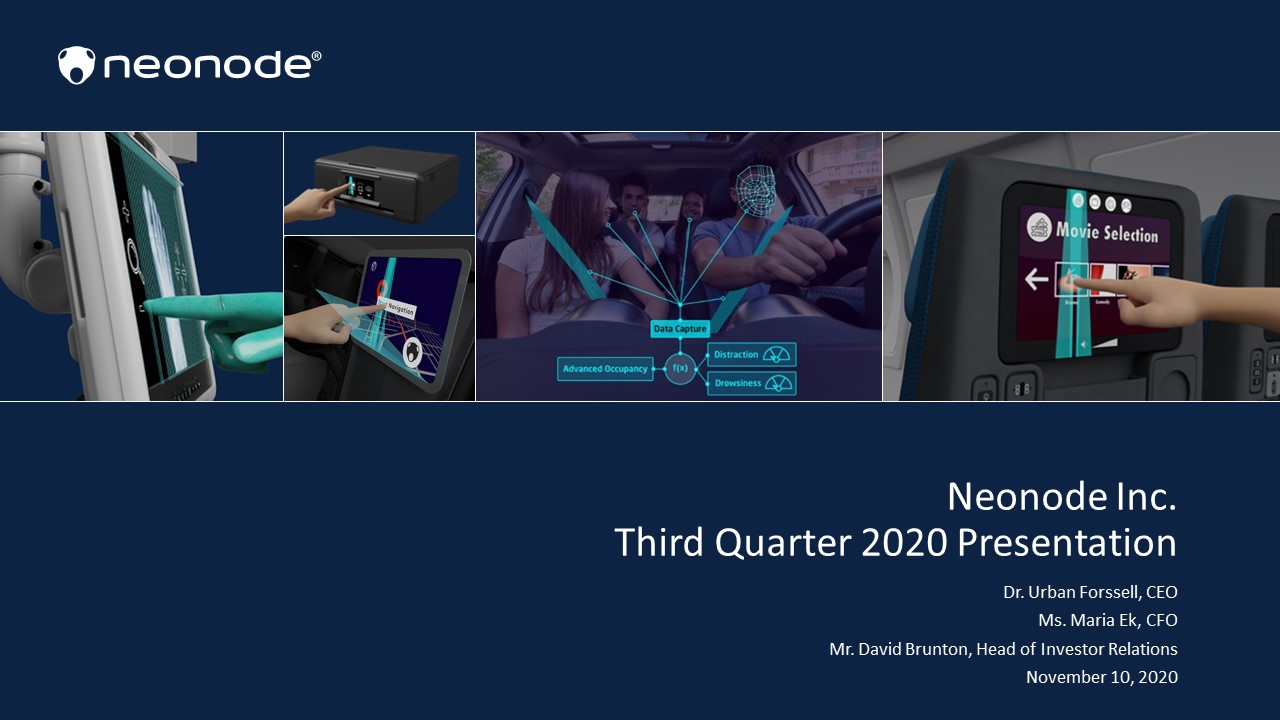
Neonode Inc. Third Quarter 2020 Presentation Dr. Urban Forssell, CEO Ms. Maria Ek, CFO Mr. David Brunton, Head of Investor Relations November 10, 2020
2 Disclaimer This presentation contains, and related oral and written statements of Neonode Inc. (“Neonode” or the “Company”) and its management may contain, forward-looking statements within the meaning of the Private Securities Litigation Reform Act of 1995 . Forward - looking statements include information about current expectations, potential financial performance or future events. The se also may include statements about market and sales growth, financial results, use of free cash flow, product development and introduction, regulatory matters and sales efforts. They are based on assumptions, expectations and information available to the Company and its management and involve a number of known and unknown risks, uncertainties and other factors that may cause th e Company’s actual results, levels of activity, performance or achievements to be materially different from any expressed or im pli ed by these forward-looking statements. These uncertainties and risks include, but are not limited to, those outlined in filings of th e Company with the U.S. Securities and Exchange Commission (the “SEC”) under the Securities Exchange Act of 1934, as amended, including sections entitled “Risk Factors” and “Management’s Discussion and Analysis of Financial Condition and Results of Operations.” You are advised to carefully consider these various risks, uncertainties and other factors. Forward-looking stat eme nts are made as of today’s date. The Company and its management undertake no duty to update or revise forward - looking statements. This presentation has been prepared by the Company based on its own information, as well as information from public sources. Certain of the information contained herein may be derived from information provided by industry sources. The Company believe s such information is accurate and that the sources from which it has been obtained are reliable. However, the Company has not independently verified such information and cannot guarantee the accuracy of such information.

3 Strategy and Business Update
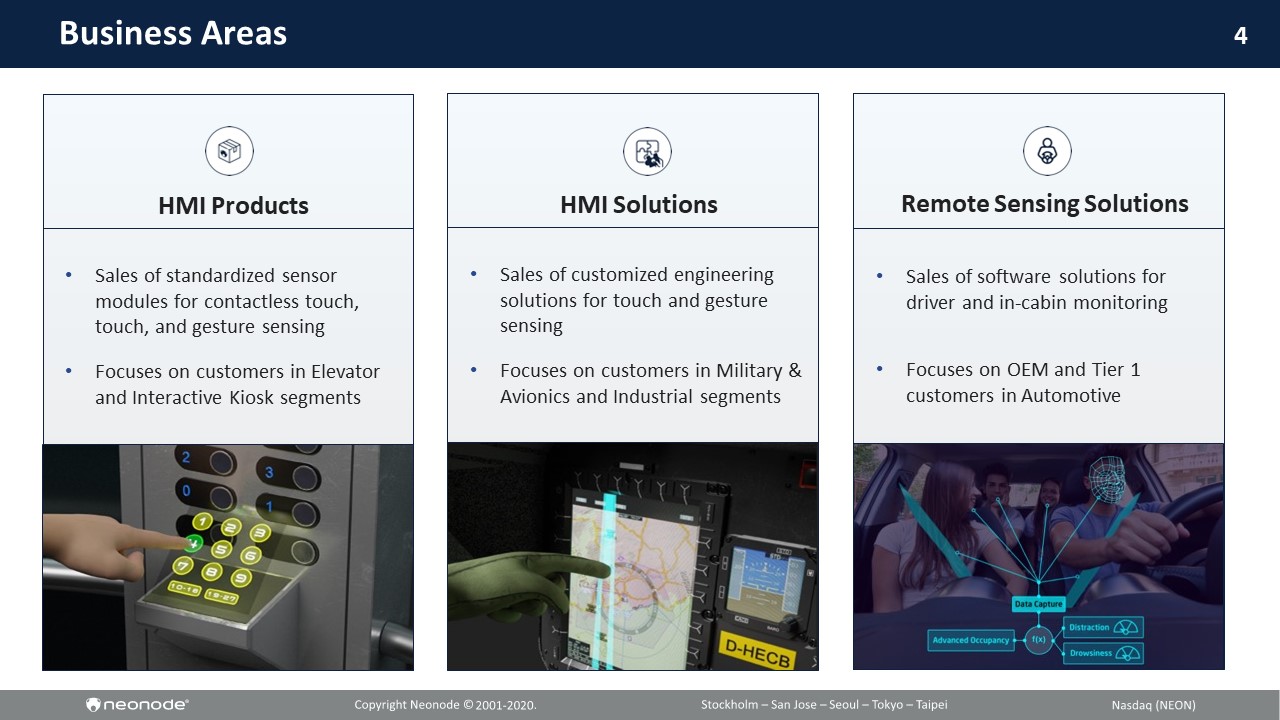
4 Remote Sensing Solutions • Sales of software solutions for driver and in - cabin monitoring • Focuses on OEM and Tier 1 customers in Automotive HMI Solutions • Sales of customized engineering solutions for touch and gesture sensing • Focuses on customers in Military & Avionics and Industrial segments Business Areas HMI Products • Sales of standardized sensor modules for contactless touch, touch, and gesture sensing • Focuses on customers in Elevator and Interactive Kiosk segments
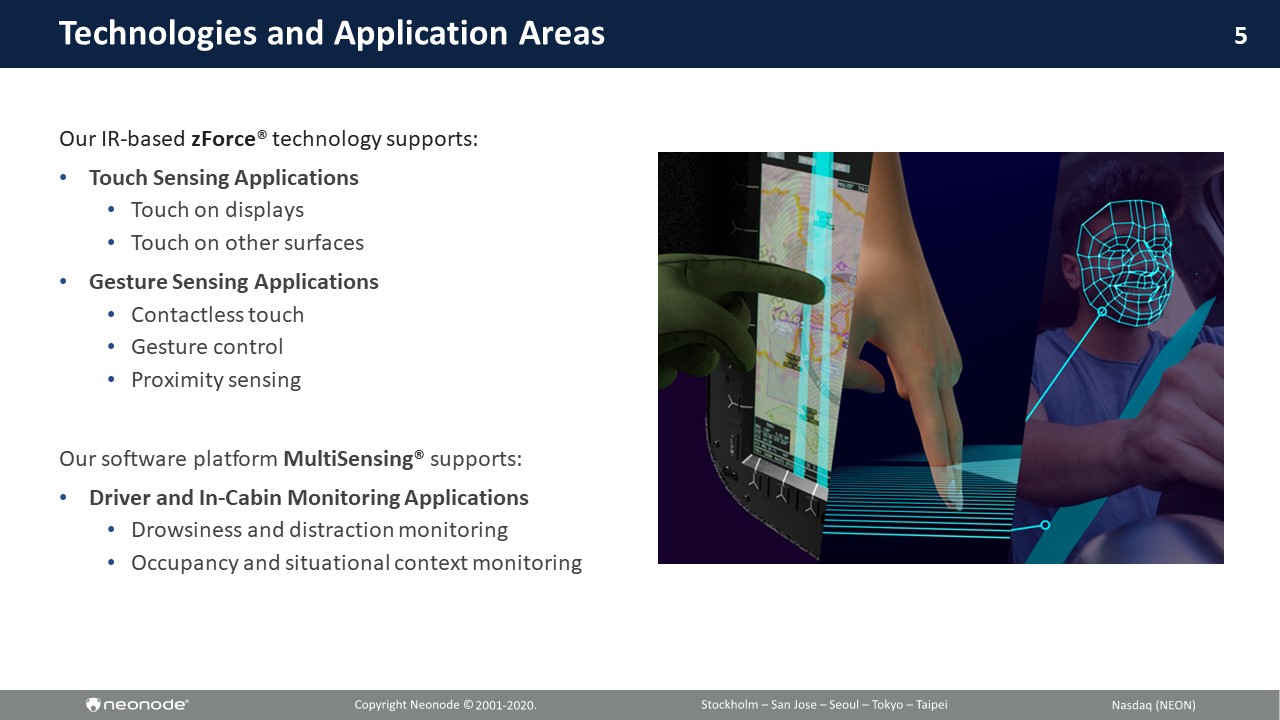
5 Technologies and Application Areas Our IR - based zForce ® technology supports: • Touch Sensing Applications • Touch on displays • Touch on other surfaces • Gesture Sensing Applications • Contactless touch • Gesture control • Proximity sensing Our software platform MultiSensing ® supports: • Driver and In - Cabin Monitoring Applications • Drowsiness and distraction monitoring • Occupancy and situational context monitoring
6 Business Area – HMI Solutions Focuses on customized optical touch and gesture control solutions for demanding customers in the Military & Avionics and Industrial segments using our patented IR - based zForce technology.
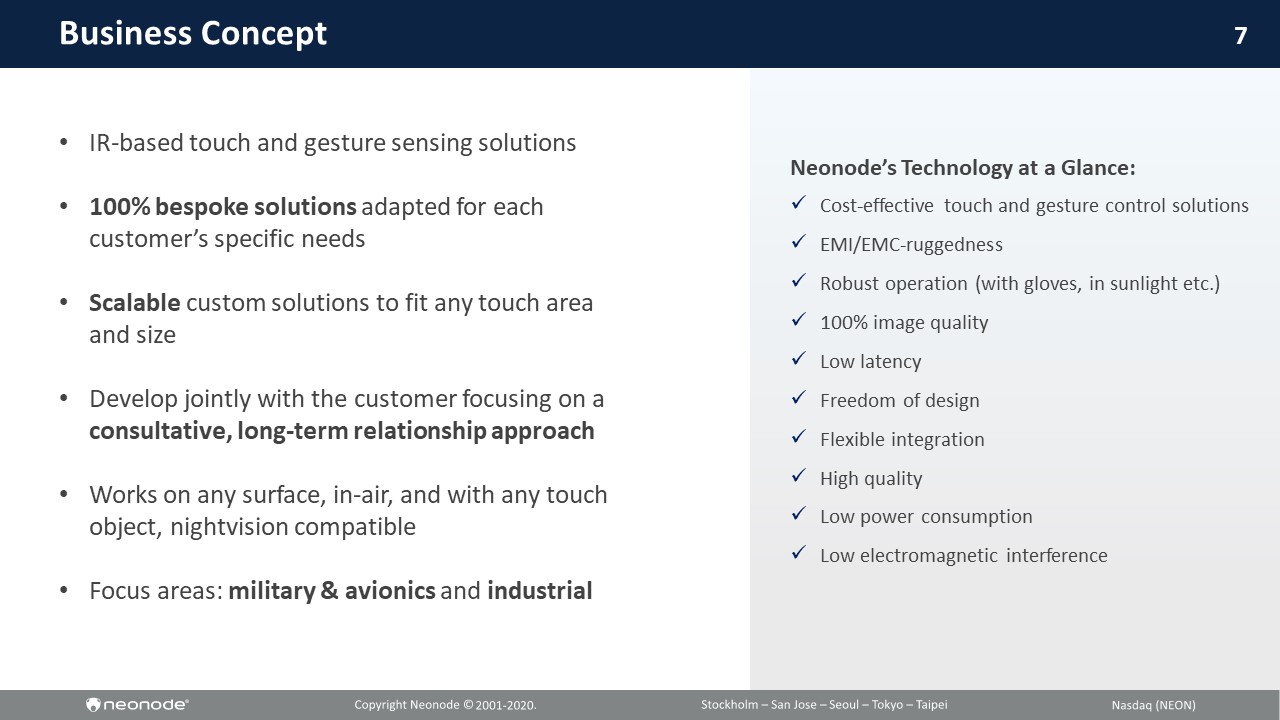
7 Business Concept • IR - based touch and gesture sensing solutions • 100% bespoke solutions adapted for each customer’s specific needs • Scalable custom solutions to fit any touch area and size • Develop jointly with the customer focusing on a consultative, long - term relationship approach • Works on any surface, in - air, and with any touch object, nightvision compatible • Focus areas: military & avionics and industrial Neonode’s Technology at a Glance: x Cost - effective touch and gesture control solutions x EMI/EMC - ruggedness x Robust operation (with gloves, in sunlight etc.) x 100% image quality x Low latency x Freedom of design x Flexible integration x High quality x Low power consumption x Low electromagnetic interference
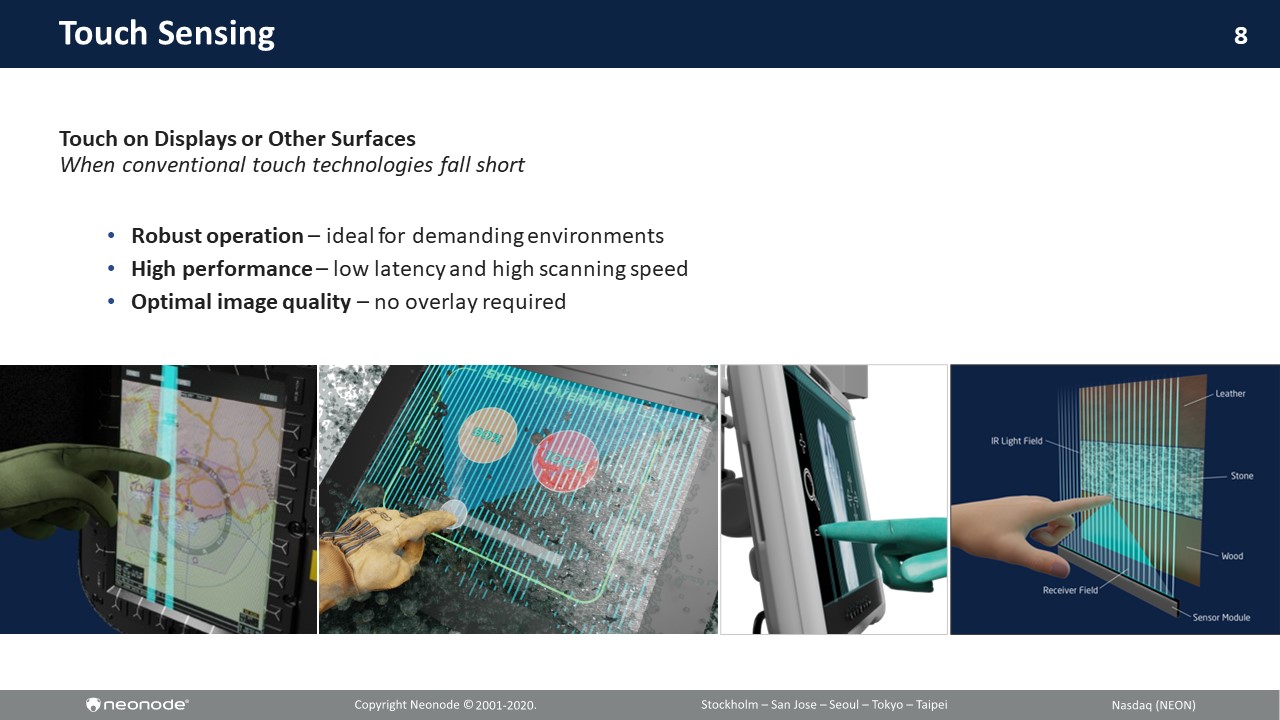
8 Touch Sensing Touch on Displays or Other Surfaces When conventional touch technologies fall short • Robust operation – ideal for demanding environments • High performance – low latency and high scanning speed • Optimal image quality – no overlay required
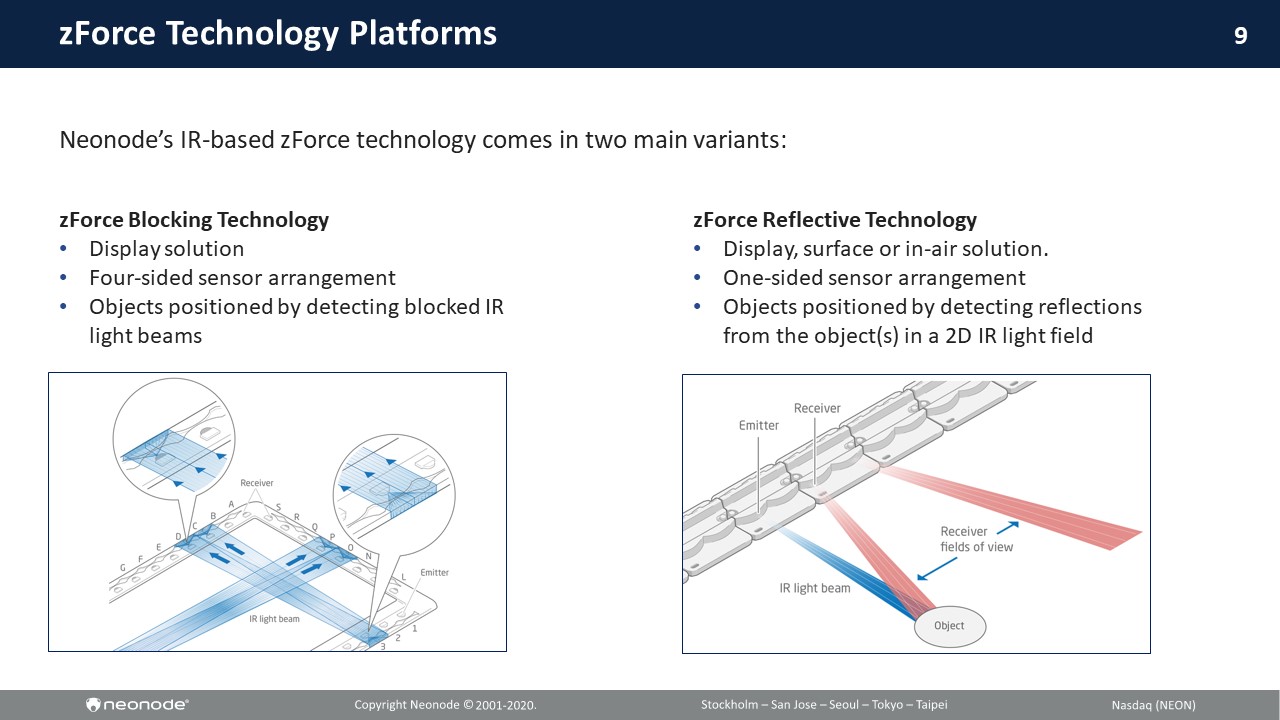
9 zForce Blocking Technology • Display solution • Four - sided sensor arrangement • Objects positioned by detecting blocked IR light beams zForce Technology Platforms Neonode’s IR - based zForce technology comes in two main variants: zForce Reflective Technology • Display, surface or in - air solution. • One - sided sensor arrangement • Objects positioned by detecting reflections from the object (s) in a 2D IR light field
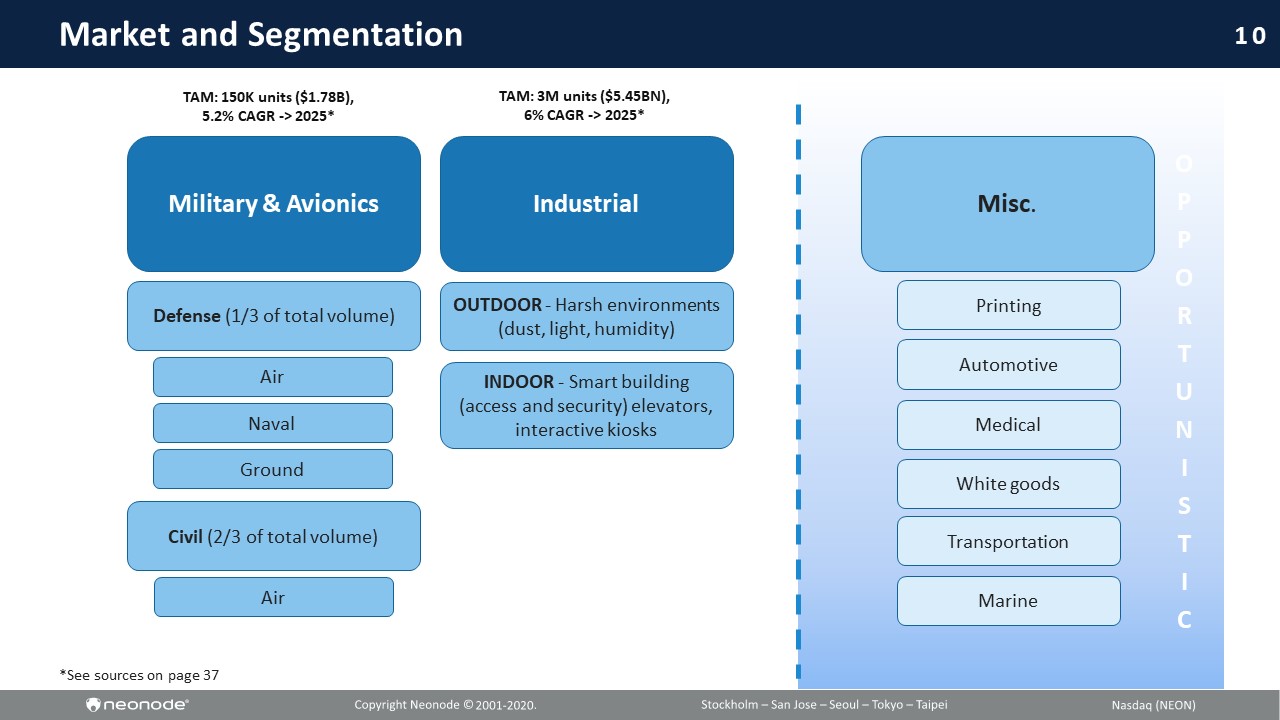
10 Printing Automotive Market and Segmentation Military & Avionics Industrial Misc . Defense (1/3 of total volume ) Civil (2/3 of total volume ) Medical Transportation White goods Marine OUTDOOR - Harsh environments (dust, light , humidity ) INDOOR - Smart building (access and security ) elevators, interactive kiosks TAM: 3M units ($5.45BN), 6% CAGR - > 2025* Air Naval Ground Air O P P O R T U N I S T I C TAM: 150K units ( $ 1.78B) , 5.2 % CAGR - > 2025* *See sources on page 37
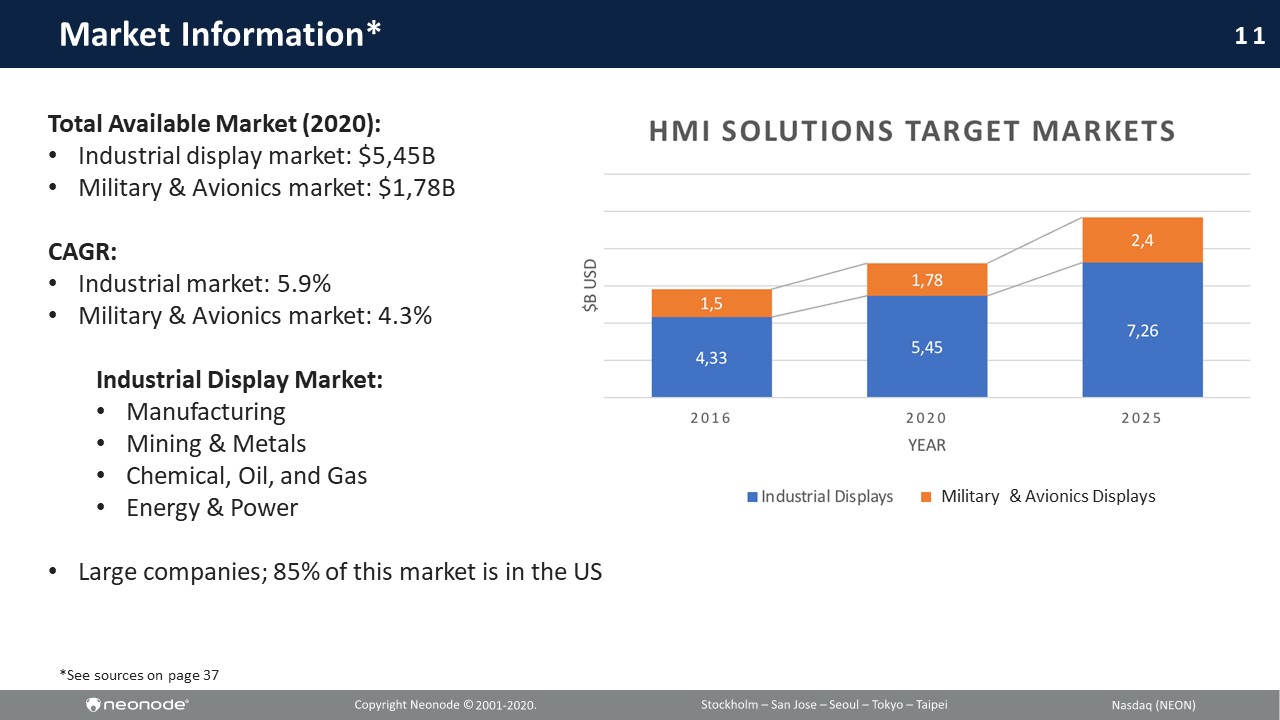
11 Market Information* Total A vail able M arket (2020): • Industrial display market: $5,4 5 B • Military & Avionics market: $1,78B CAGR: • Industrial market : 5.9% • Military & Avionics market : 4 . 3% Industrial Display Market: • Manufacturing • Mining & Metals • Chemical, Oil, and Gas • Energy & Power • Large companies ; 85% of this market is in the US Military & Avionics Displays *See sources on page 37
12 Business Area – HMI Products Focuses on sales of Neonode’s innovative, plug - and - play sensor modules, using our reflective IR - based zForce technology that enable contactless touch, touch, and gesture sensing applications.
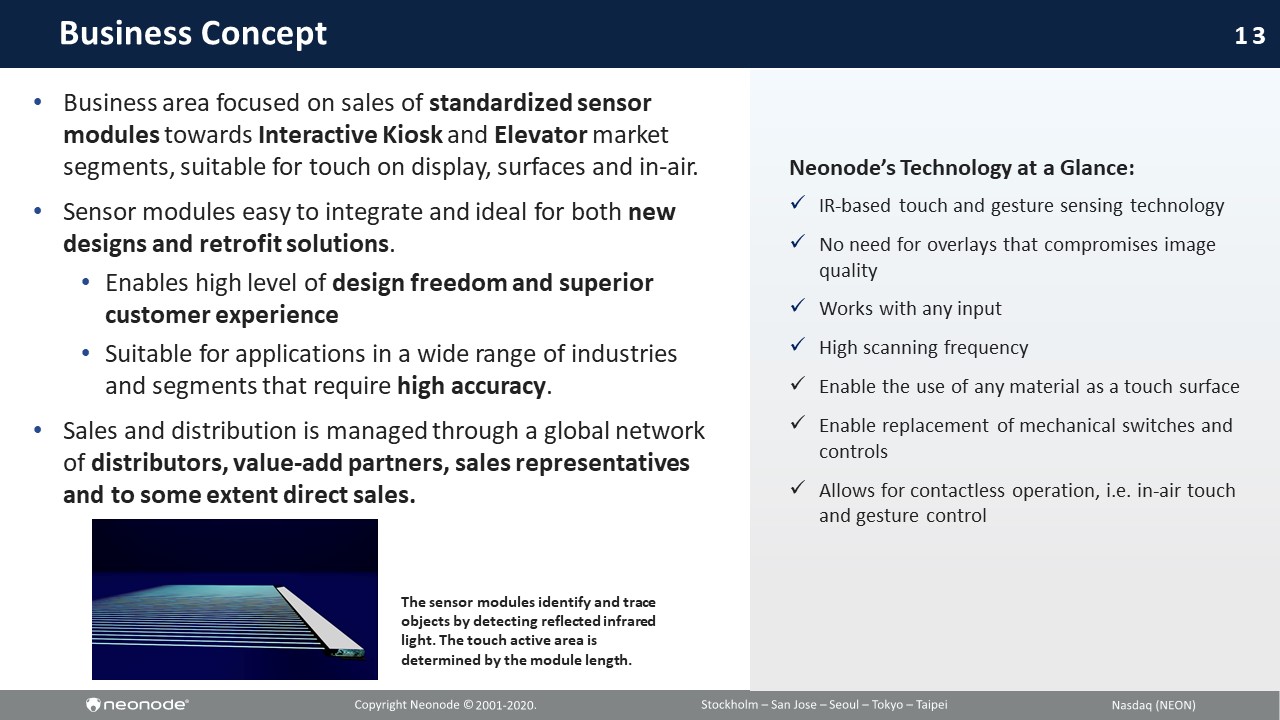
13 x IR - based touch and gesture sensing technology x No need for overlays that compromises image quality x Works with any input x High scanning frequency x Enable the use of any material as a touch surface x Enable replacement of mechanical switches and controls x Allows for contactless operation, i.e. in - air touch and gesture control Neonode’s Technology at a Glance: Business Concept • Business area focused on sales of standardized sensor modules towards Interactive Kiosk and Elevator market segments, suitable for touch on display, surfaces and in - air. • Sensor modules easy to integrate and ideal for both new designs and retrofit solutions . • Enables high level of design freedom and superior customer experience • Suitable for applications in a wide range of industries and segments that require high accuracy . • Sales and distribution is managed through a global network of distributors, value - add partners, sales representatives and to some extent direct sales. The sensor modules identify and trace objects by detecting reflected infrared light. The touch active area is determined by the module length.
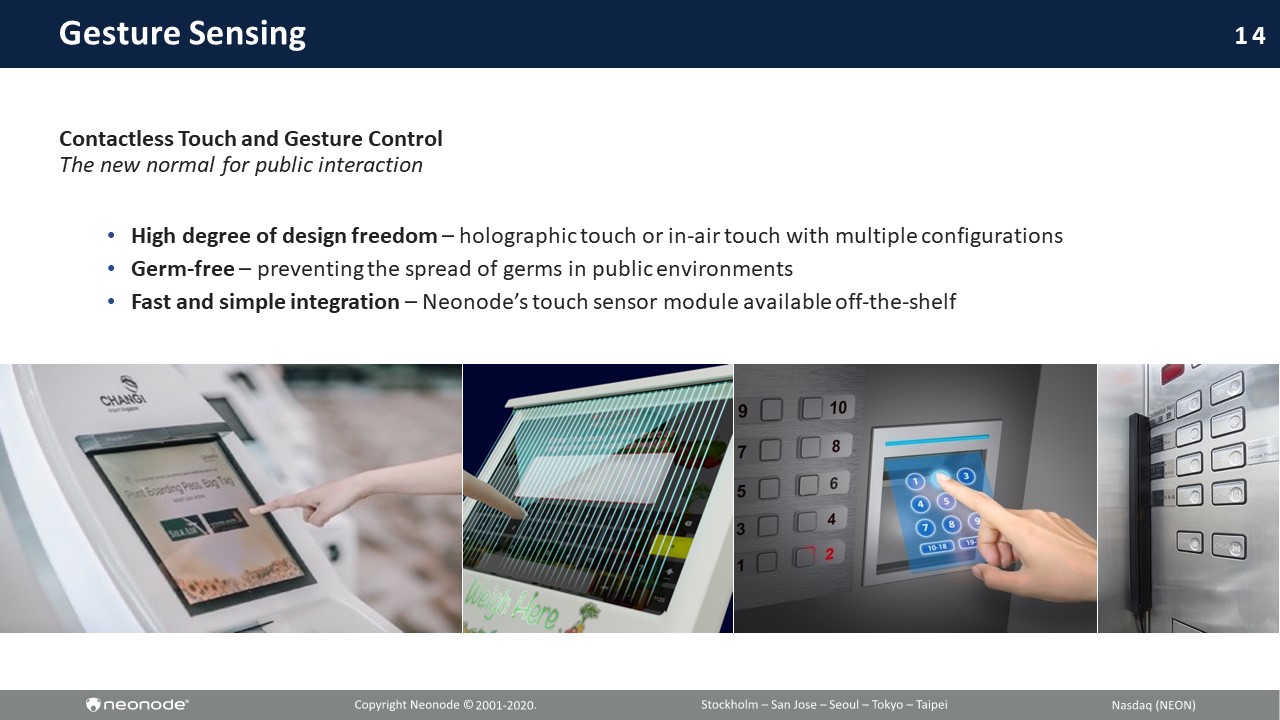
14 Gesture Sensing Contactless Touch and Gesture Control The new normal for public interaction • High degree of design freedom – holographic touch or in - air touch with multiple configurations • Germ - free – preventing the spread of germs in public environments • Fast and simple integration – Neonode’s touch sensor module available off - the - shelf
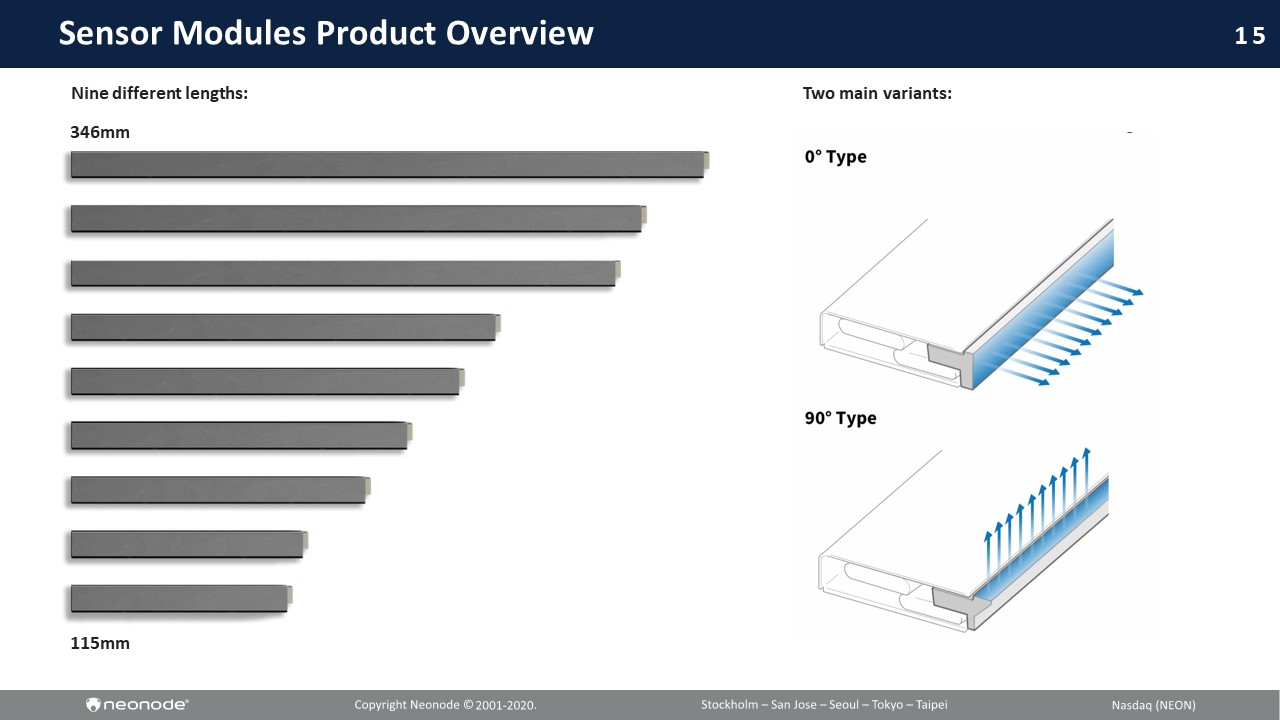
15 Sensor Modules Product Overview 115mm 346mm Nine different lengths: Two main variants :
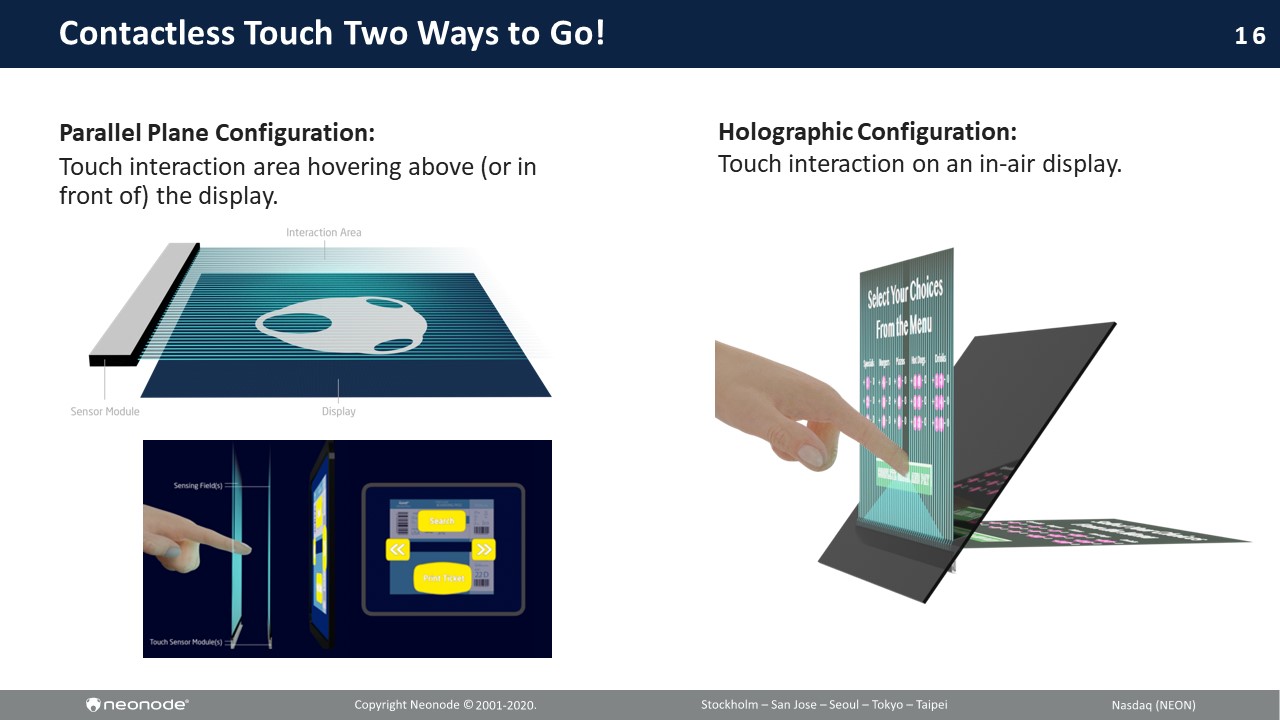
16 Contactless Touch Two Ways to Go! Parallel Plane Configuration: Touch interaction area hovering above (or in front of) the display. Holographic Configuration: Touch interaction on an in - air display.
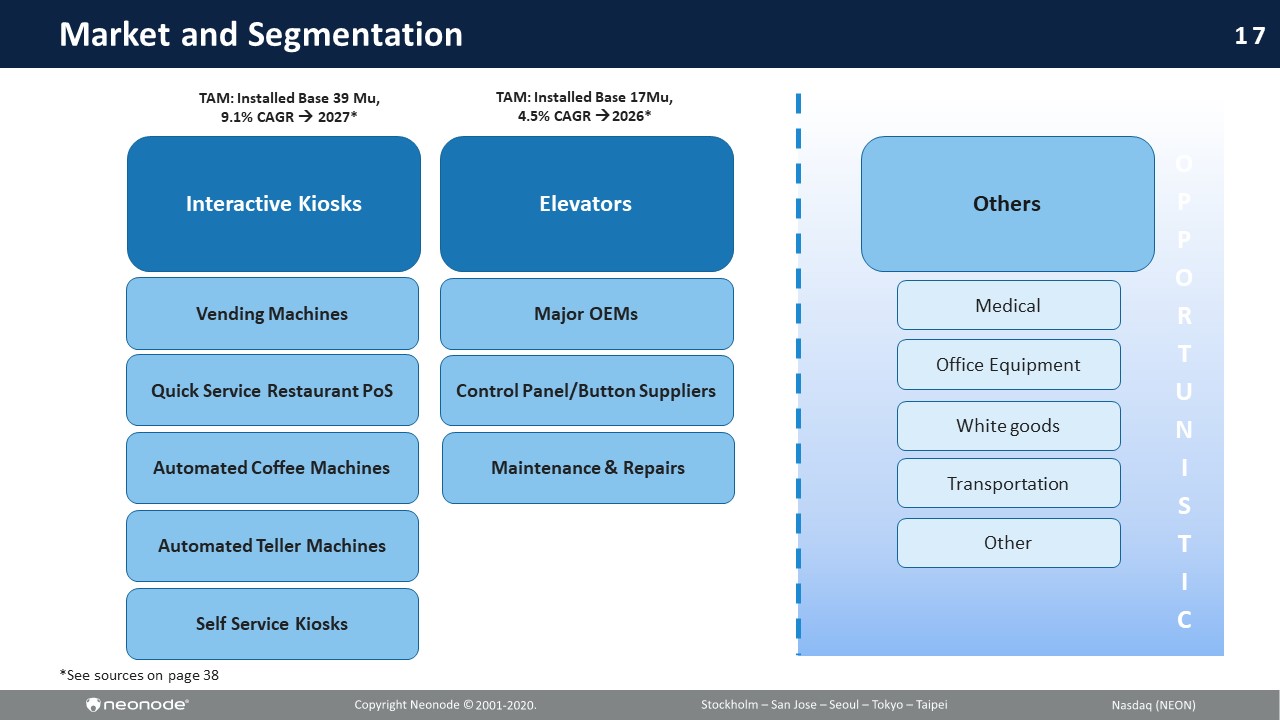
17 Medical Office Equipment Market and Segmentation Interactive Kiosks Elevators Others Vending Machines Quick Service Restaurant PoS Transportation White goods Other Major OEMs Control Panel/ Button Suppliers TAM: Installed Base 39 Mu, 9.1% CAGR 2027* TAM: Installed Base 17 Mu, 4.5% CAGR 2026* O P P O R T U N I S T I C Automated Coffee Machines Automated Teller Machines Self Service Kiosks Maintenance & Repairs *See sources on page 38
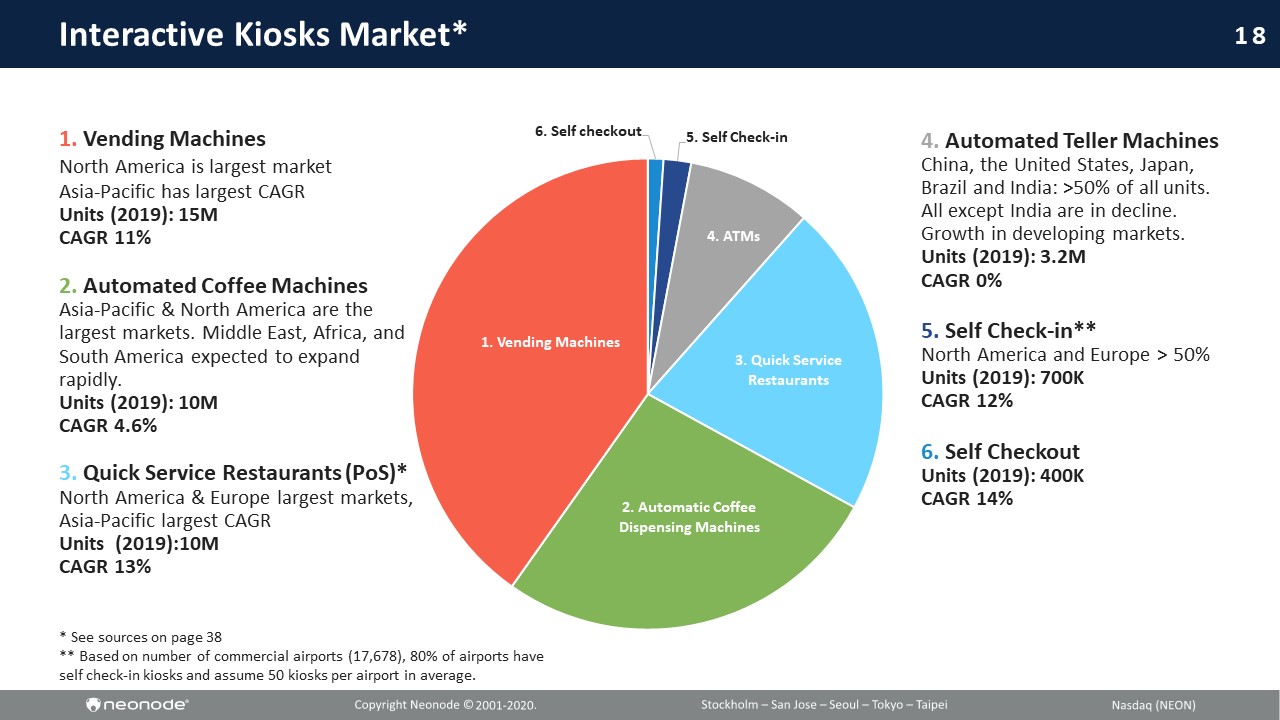
18 Interactive Kiosks Market* * See sources on page 38 * * Based on number of commercial airports (17,678), 80% of airports have self check - in kiosks and assume 50 kiosks per airport in average. 6. Self checkout 5. Self Check - in 4. ATMs 3. Quick Service Restaurants 2. Automatic Coffee Dispensing Machines 1. Vending Machines 4. Automated Teller Machines China, the United States, Japan, Brazil and India: >50% of all units. All except India are in decline. Growth in developing markets. Units (2019): 3.2M CAGR 0% 5. Self Check - in** North America and Europe > 50% Units (2019): 700K CAGR 12% 6. Self Checkout Units (2019): 400K CAGR 14% 1. Vending Machines North America is largest market Asia - Pacific has largest CAGR Units (2019): 15M CAGR 11% 2. Automated Coffee Machines Asia - Pacific & North America are the largest markets. Middle East, Africa, and South America expected to expand rapidly. Units (2019): 10M CAGR 4.6% 3. Quick Service Restaurants ( PoS )* North America & Europe largest markets, Asia - Pacific largest CAGR Units (2019):10M CAGR 13%
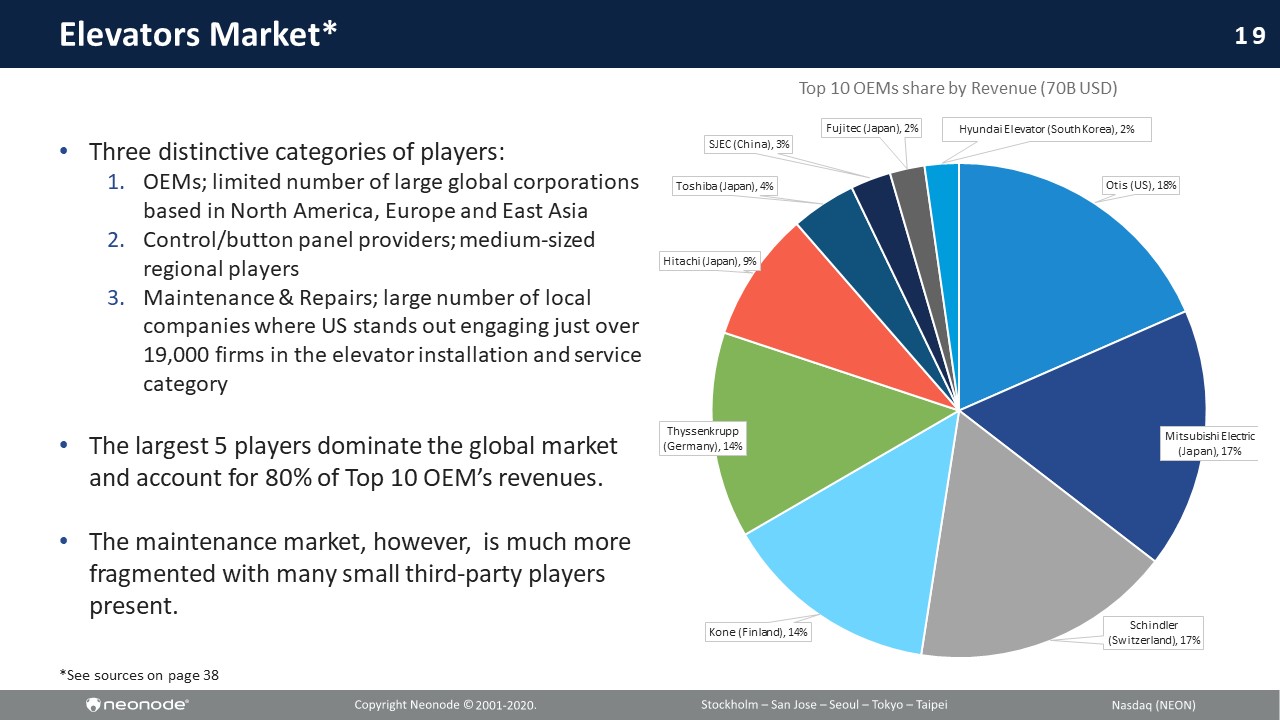
19 Elevators Market* • Three distinctive categories of players: 1. OEMs; limited number of large global corporations based in North America, Europe and East Asia 2. Control/button panel providers; medium - sized regional players 3. Maintenance & Repairs; large number of local companies where US stands out engaging just over 19,000 firms in the elevator installation and service category • The largest 5 players dominate the global market and account for 80% of Top 10 OEM’s revenues. • The maintenance market, however, is much more fragmented with many small third - party players present. Otis (US) , 18% Mitsubishi Electric (Japan) , 17% Schindler (Switzerland) , 17% Kone (Finland) , 14% Thyssenkrupp (Germany) , 14% Hitachi (Japan) , 9% Toshiba (Japan) , 4% SJEC (China) , 3% Fujitec (Japan) , 2% Hyundai Elevator (South Korea) , 2% Top 10 OEMs share by Revenue ( 70B USD) *See sources on page 38
20 Partner Network Distributors Value - added Resellers Other Partners
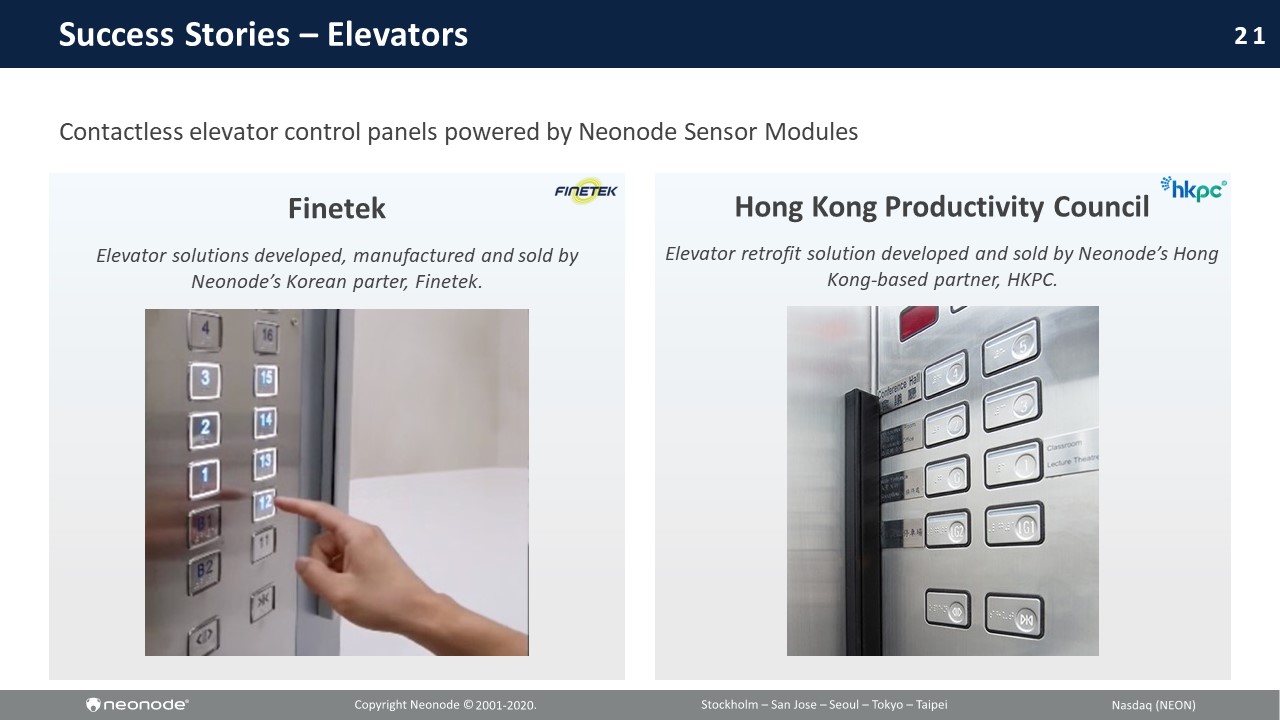
21 Hong Kong Productivity Council Elevator retrofit solution developed and sold by Neonode’s Hong Kong - based partner, HKPC. Success Stories – Elevators Finetek Elevator solutions developed , manufactured and sold by Neonode’s Korean parter, Finetek . Contactless elevator control panels powered by Neonode Sensor Modules
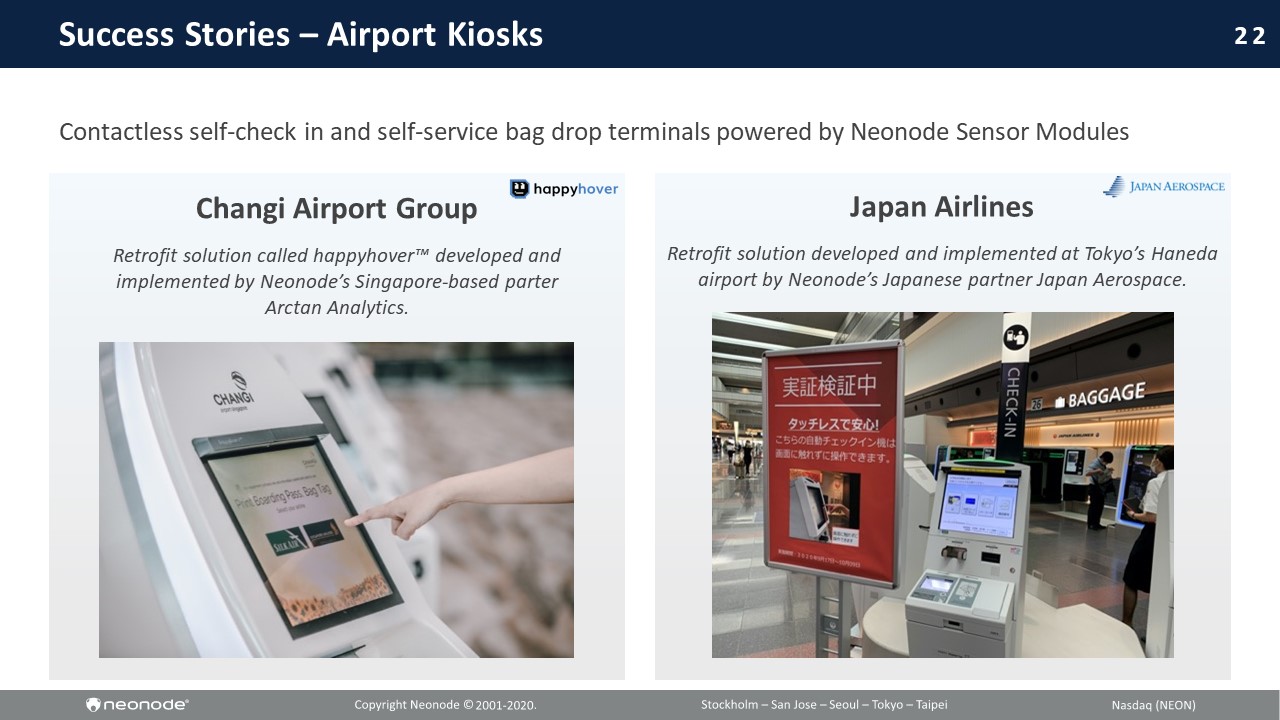
22 Japan Airlines Retrofit solution developed and implemented at Tokyo’s Haneda airport by Neonode’s Japanese partner Japan Aerospace. Success Stories – Airport Kiosks Changi Airport Group Retrofit solution called happyhover Ρ developed and implemented by Neonode’s Singapore - based parter Arctan Analytics . Contactless self - check in and self - service bag drop terminals powered by Neonode Sensor Modules
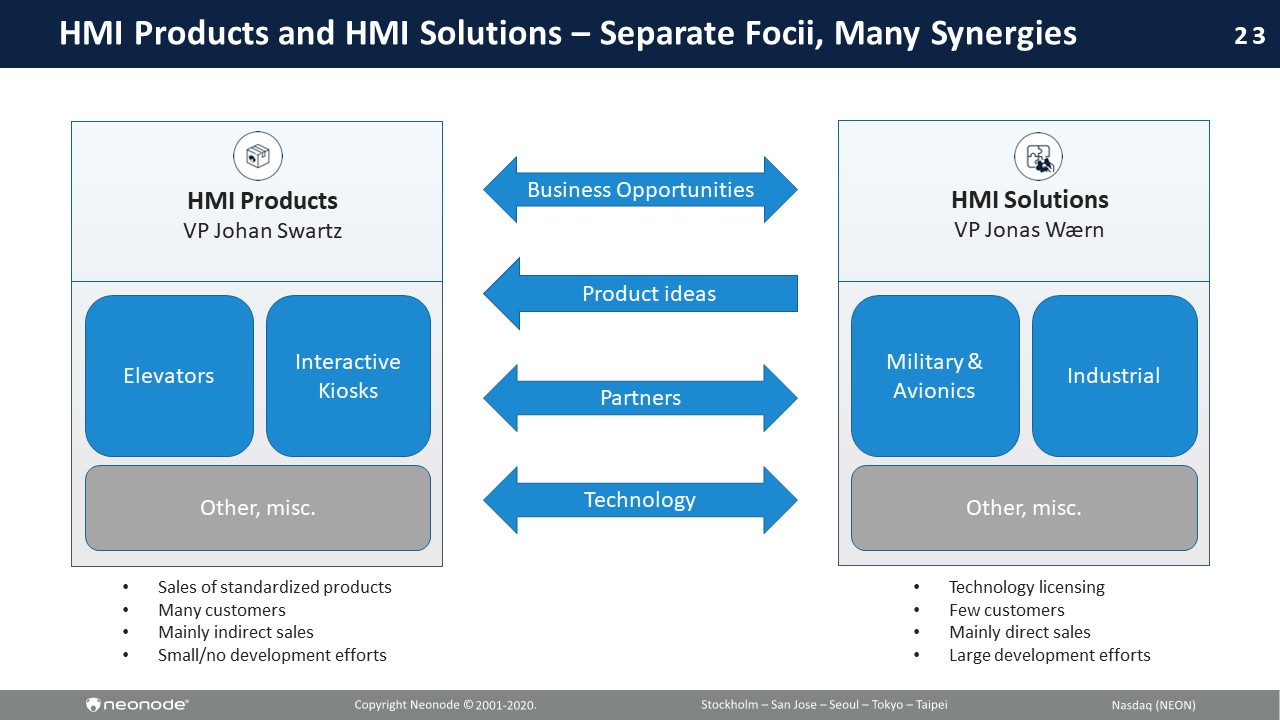
23 HMI Products and HMI Solutions – Separate Focii , Many Synergies HMI Solutions VP Jonas Wærn Military & Avionics Industrial Other , misc . HMI Products VP Johan Swartz Elevators Interactive Kiosks Other , misc . Product ideas Partners Technology • Sales of standardized products • Many customers • Mainly indirect sales • Small/no development efforts • Technology licensing • Few customers • Mainly direct sales • Large development efforts Business Opportunities
24 Business Area – Remote Sensing Solutions Focuses on driver and in - cabin monitoring in vehicles . Addressing the need for robust, cost - effective driver and in - cabin monitoring systems that enable OEMs to be compliant with the new EU general safety regulations (GSR) and meet the Euro NCAP guidelines, applicable for all new vehicles from 2024 .
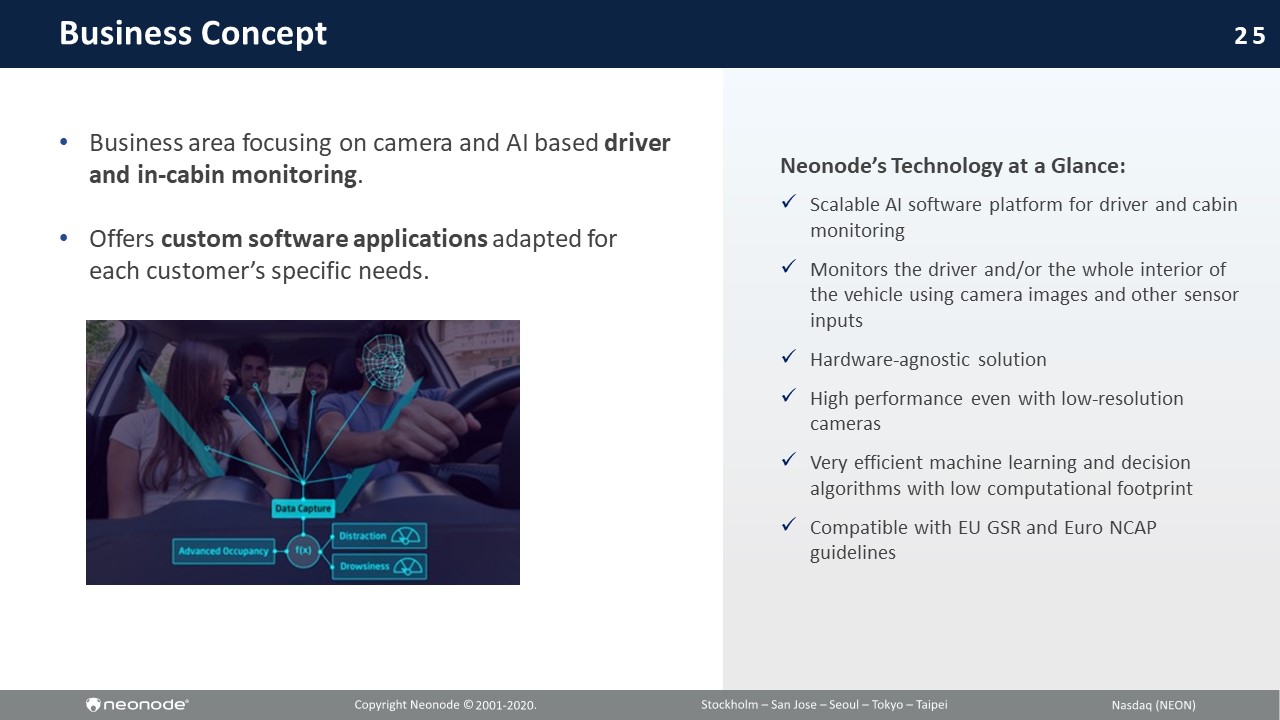
25 Business Concept • Business area focusing on camera and AI based driver and in - cabin monitoring . • Offers custom software applications adapted for each customer’s specific needs. Neonode’s Technology at a Glance: x Scalable AI software platform for driver and cabin monitoring x M onitors the driver and/or the whole interior of the vehicle using camera images and other sensor inputs x Hardware - agnostic solution x High performance even with low - resolution cameras x Very efficient machine learning and decision algorithms with low computational footprint x Compatible with EU GSR and Euro NCAP guidelines
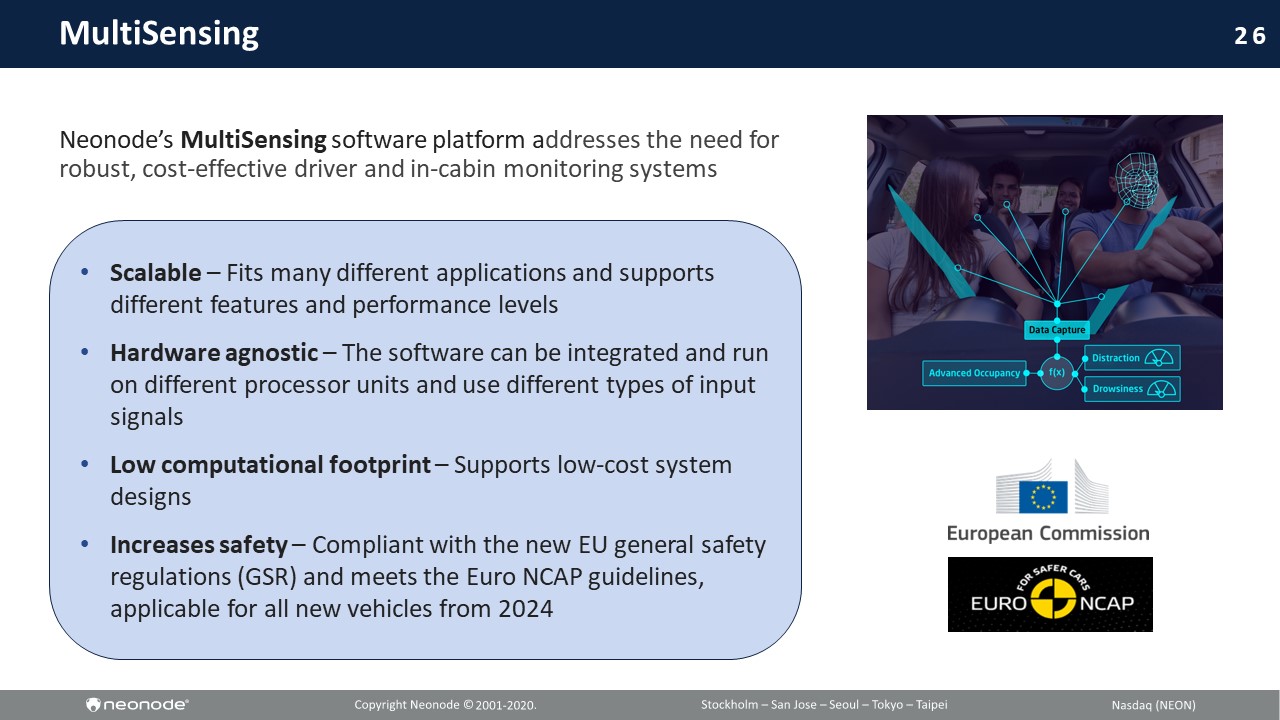
26 • Scalable – Fits many different applications and supports different features and performance levels • Hardware agnostic – The software can be integrated and run on different processor units and use different types of input signals • Low computational footprint – Supports low - cost system designs • Increases safety – Compliant with the new EU general safety regulations (GSR) and meets the Euro NCAP guidelines, applicable for all new vehicles from 2024 MultiSensing Neonode’s MultiSensing software platform a ddresses the need for robust, cost - effective driver and in - cabin monitoring systems
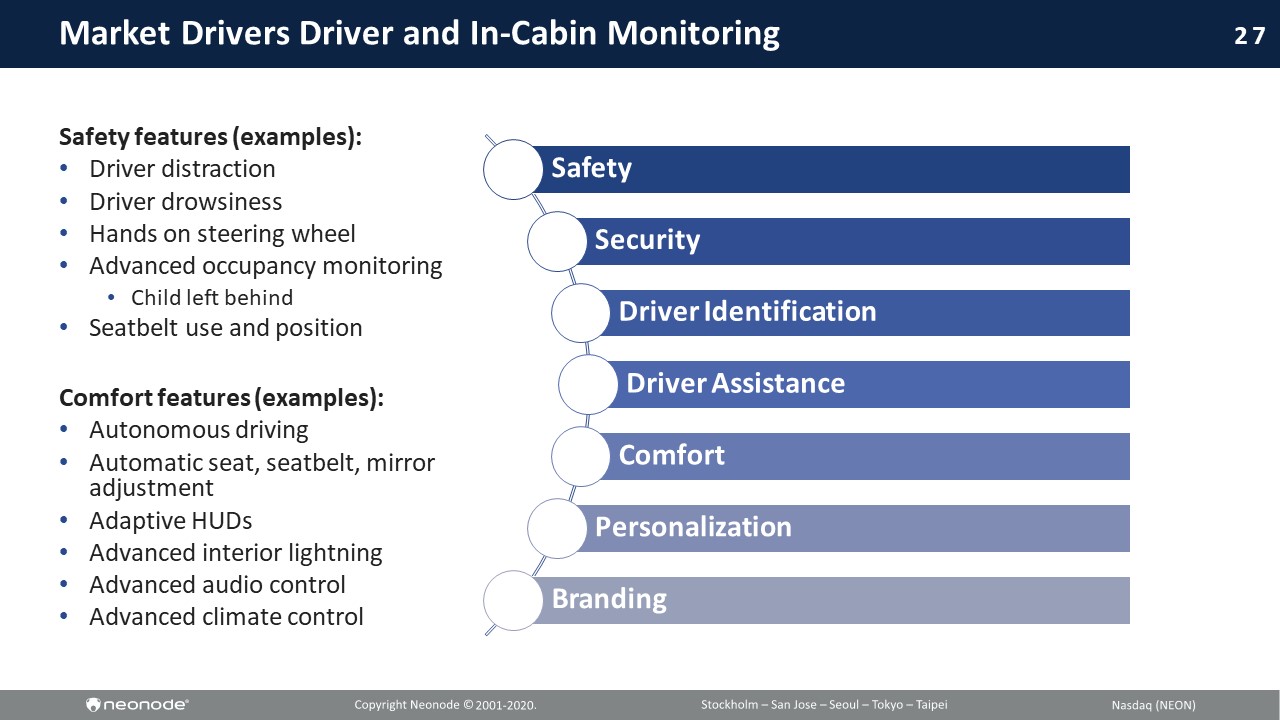
27 Market Drivers Driver and In - Cabin Monitoring Safety features (examples): • Driver distraction • Driver drowsiness • Hands on steering wheel • Advanced occupancy monitoring • Child left behind • Seatbelt use and position Comfort features (examples): • Autonomous driving • Automatic seat, seatbelt, mirror adjustment • Adaptive HUDs • Advanced interior lightning • Advanced audio control • Advanced climate control Safety Security Driver Identification Driver Assistance Comfort Personalization Branding
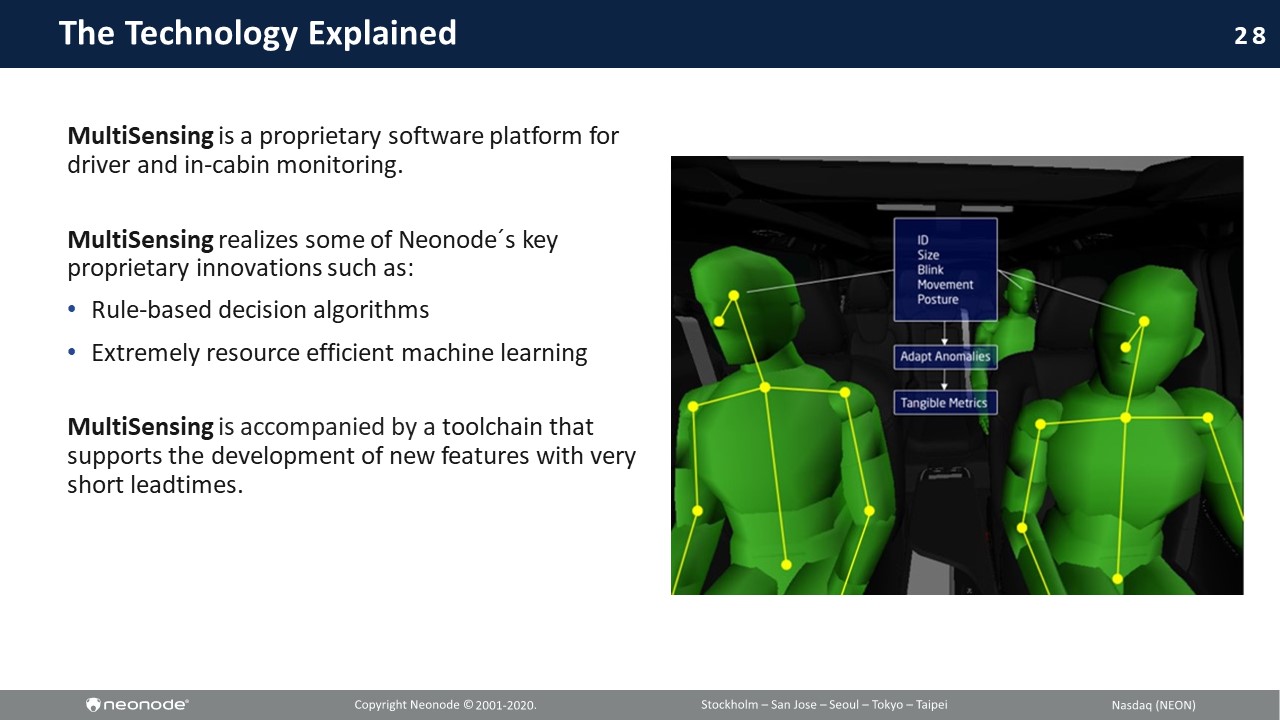
28 The Technology Explained MultiSensing is a proprietary software platform for driver and in - cabin monitoring. MultiSensing realizes some of Neonode Dz s key proprietary innovations such as: • Rule - based decision algorithms • Extremely resource efficient machine learning MultiSensing is accompanied by a toolchain that supports the development of new features with very short leadtimes .
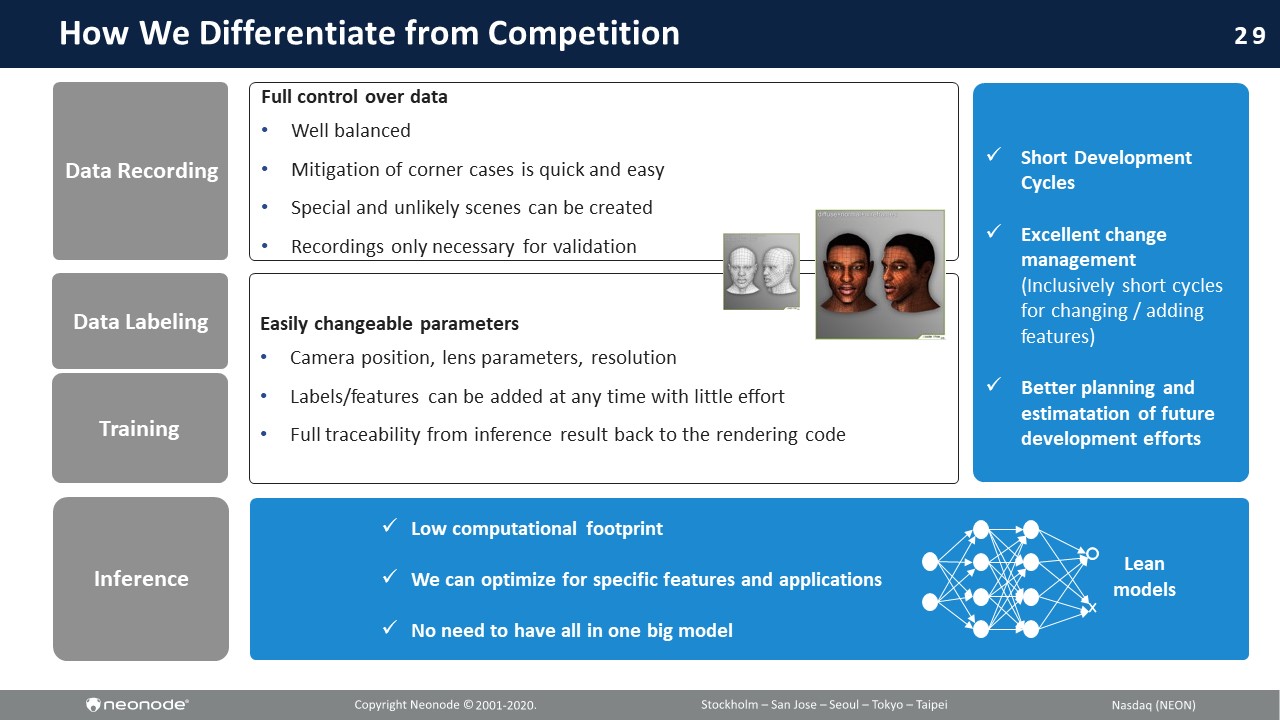
29 How We Differentiate from Competition Data Recording Data Labeling Training Inference x Short Development Cycles x Excellent change management (Inclusively short cycles for changing / adding features) x Better planning and estimatation of future development efforts x Low computational footprint x We can optimize for specific features and applications x No need to have all in one big model Full control over data • Well balanced • Mitigation of corner cases is quick and easy • Special and unlikely scenes can be created • Recordings only necessary for validation Easily change able parameters • C amera position , l ens parameters , resolution • L abels/ f e a t u r e s can be added at any time with little effort • Full traceability from inference result back to the rendering code Le a n m o d e l s
30 Financial Update Third Quarter 2020
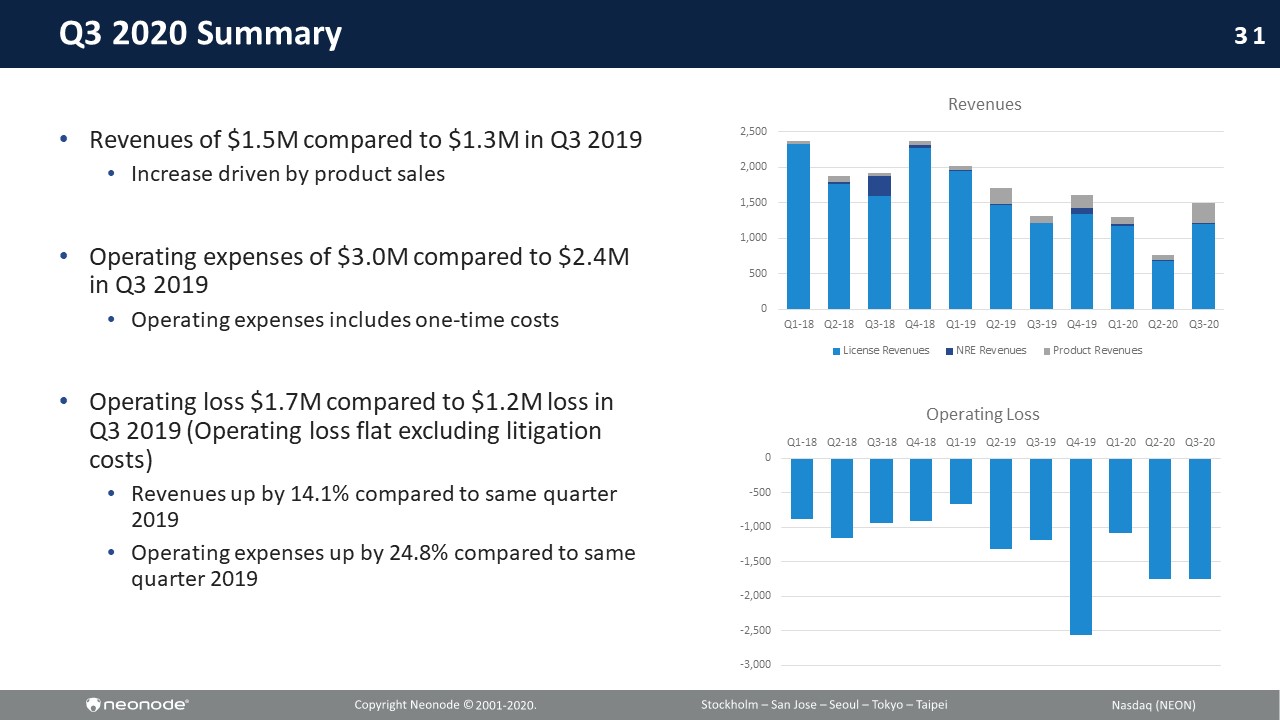
31 Q3 2020 Summary • Revenues of $1.5M compared to $1.3M in Q3 2019 • Increase driven by product sales • Operating expenses of $3.0M compared to $2.4M in Q3 2019 • Operating expenses includes one - time costs • Operating loss $1.7M compared to $1.2M loss in Q3 2019 (Operating loss flat excluding litigation costs) • Revenues up by 14.1% compared to same quarter 2019 • Operating expenses up by 24.8% compared to same quarter 2019 0 500 1,000 1,500 2,000 2,500 Q1-18 Q2-18 Q3-18 Q4-18 Q1-19 Q2-19 Q3-19 Q4-19 Q1-20 Q2-20 Q3-20 Revenues License Revenues NRE Revenues Product Revenues -3,000 -2,500 -2,000 -1,500 -1,000 -500 0 Q1-18 Q2-18 Q3-18 Q4-18 Q1-19 Q2-19 Q3-19 Q4-19 Q1-20 Q2-20 Q3-20 Operating Loss
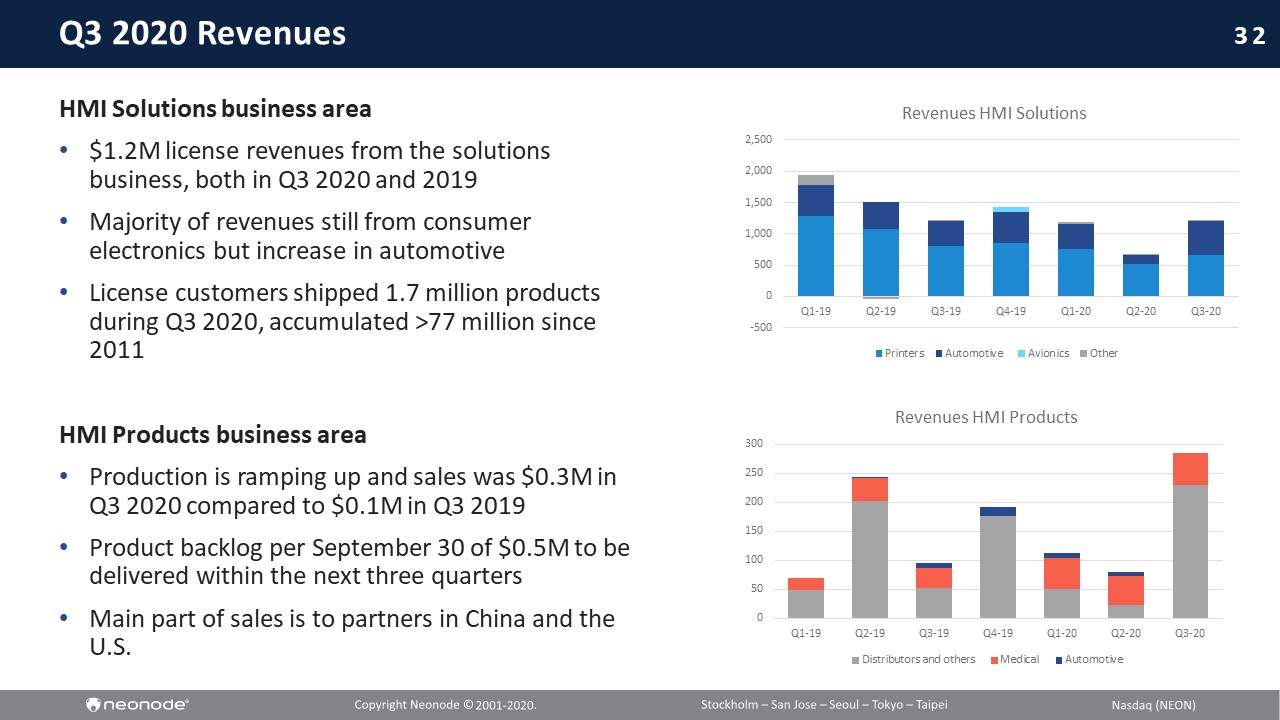
32 Q3 2020 Revenues HMI Solutions business area • $1.2M license revenues from the solutions business, both in Q3 2020 and 2019 • Majority of revenues still from consumer electronics but increase in automotive • License customers shipped 1.7 million products during Q3 2020, accumulated >77 million since 2011 HMI Products business area • Production is ramping up and sales was $0.3M in Q3 2020 compared to $0.1M in Q3 2019 • Product backlog per September 30 of $0.5M to be delivered within the next three quarters • Main part of sales is to partners in China and the U.S. -500 0 500 1,000 1,500 2,000 2,500 Q1-19 Q2-19 Q3-19 Q4-19 Q1-20 Q2-20 Q3-20 Revenues HMI Solutions Printers Automotive Avionics Other 0 50 100 150 200 250 300 Q1-19 Q2-19 Q3-19 Q4-19 Q1-20 Q2-20 Q3-20 Revenues HMI Products Distributors and others Medical Automotive
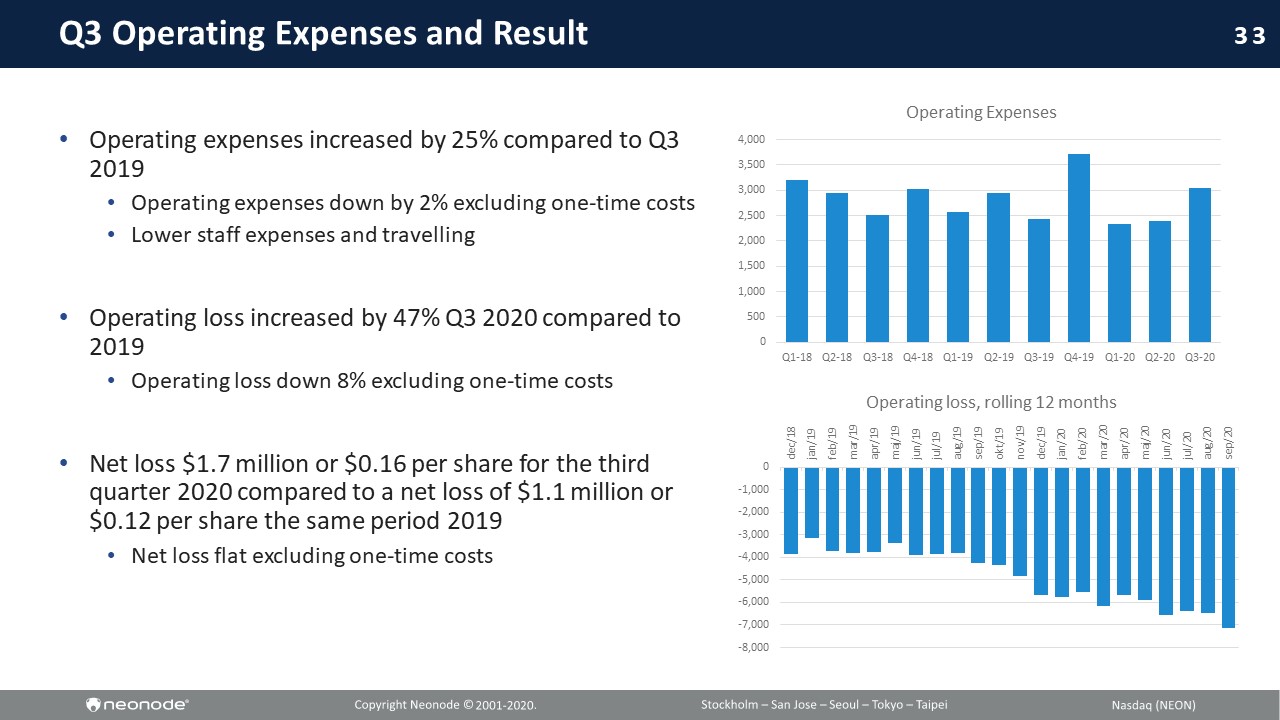
33 Q3 Operating Expenses and Result • Operating expenses increased by 25% compared to Q3 2019 • Operating expenses down by 2% excluding one - time costs • Lower staff expenses and travelling • Operating loss increased by 47% Q3 2020 compared to 2019 • Operating loss down 8% excluding one - time costs • Net loss $1.7 million or $0.16 per share for the third quarter 2020 compared to a net loss of $1.1 million or $0.12 per share the same period 2019 • Net loss flat excluding one - time costs 0 500 1,000 1,500 2,000 2,500 3,000 3,500 4,000 Q1-18 Q2-18 Q3-18 Q4-18 Q1-19 Q2-19 Q3-19 Q4-19 Q1-20 Q2-20 Q3-20 Operating Expenses -8,000 -7,000 -6,000 -5,000 -4,000 -3,000 -2,000 -1,000 0 dec/18 jan/19 feb/19 mar/19 apr/19 maj/19 jun/19 jul/19 aug/19 sep/19 okt/19 nov/19 dec/19 jan/20 feb/20 mar/20 apr/20 maj/20 jun/20 jul/20 aug/20 sep/20 Operating loss, rolling 12 months
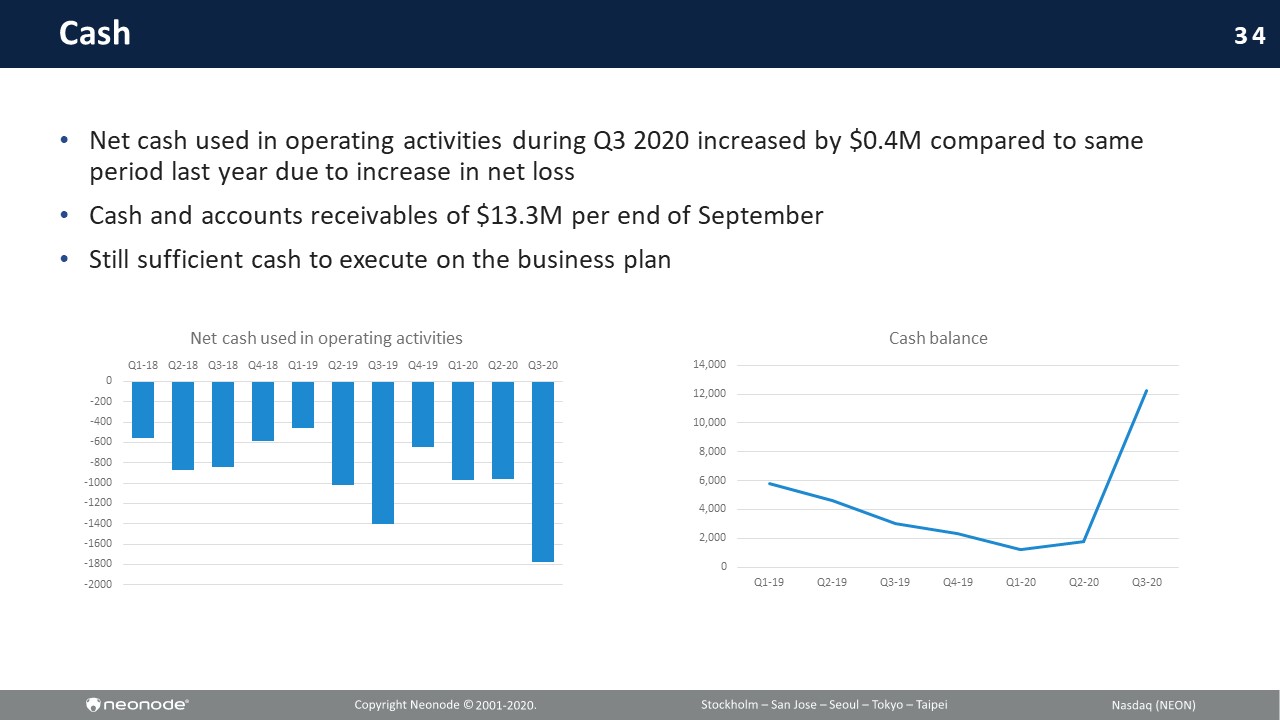
34 Cash • Net cash used in operating activities during Q3 2020 increased by $0.4M compared to same period last year due to increase in net loss • Cash and accounts receivables of $13.3M per end of September • Still sufficient cash to execute on the business plan -2000 -1800 -1600 -1400 -1200 -1000 -800 -600 -400 -200 0 Q1-18 Q2-18 Q3-18 Q4-18 Q1-19 Q2-19 Q3-19 Q4-19 Q1-20 Q2-20 Q3-20 Net cash used in operating activities 0 2,000 4,000 6,000 8,000 10,000 12,000 14,000 Q1-19 Q2-19 Q3-19 Q4-19 Q1-20 Q2-20 Q3-20 Cash balance
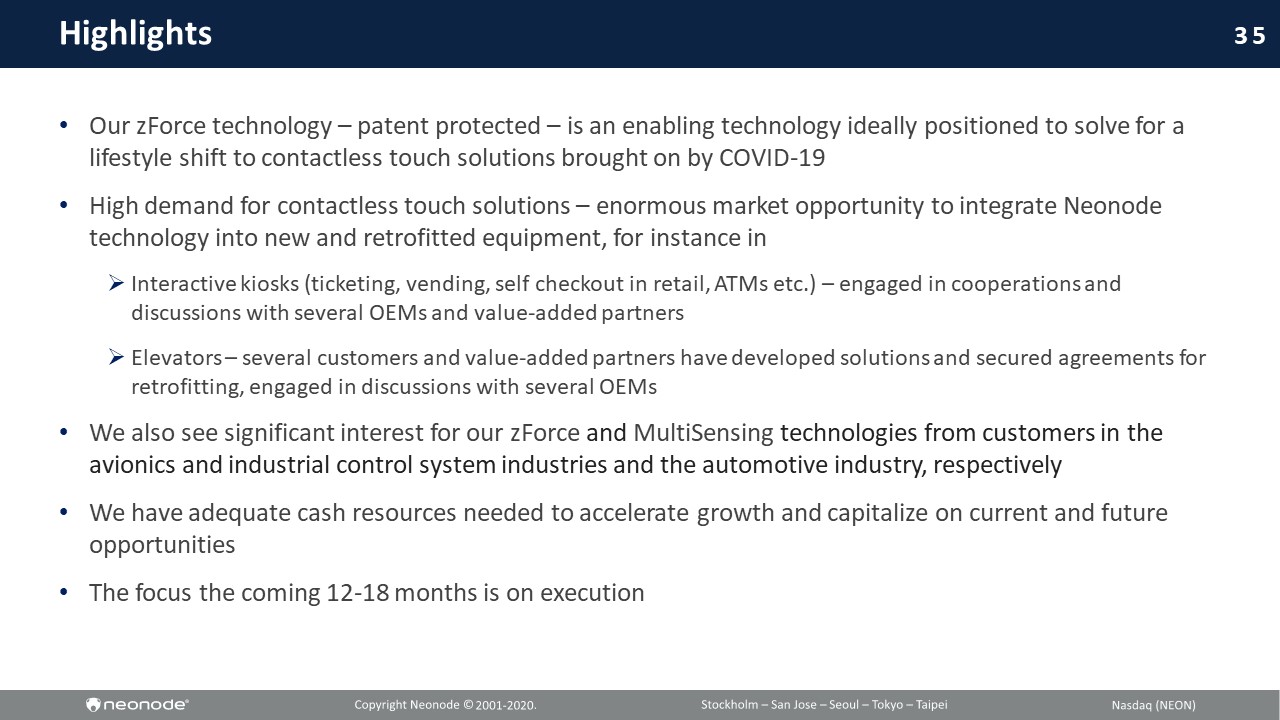
35 Highlights • Our zForce technology – patent protected – is an enabling technology ideally positioned to solve for a lifestyle shift to contactless touch solutions brought on by COVID - 19 • High demand for contactless touch solutions – enormous market opportunity to integrate Neonode technology into new and retrofitted equipment , for instance in » Interactive kiosks ( ticketing , vending , self checkout in retail , ATMs etc.) – engaged in cooperations and discussions with several OEMs and value - added partners » Elevators – several customers and value - added partners have developed solutions and secured agreements for retrofitting , engaged in discussions with several OEMs • We also see significant interest for our zForce and MultiSensing technologies from customers in the avionics and industrial control system industries and the automotive industry, respectively • We have adequate cash resources needed to accelerate growth and capitalize on current and future opportunities • The focus the coming 12 - 18 months is on execution
36 Appendices
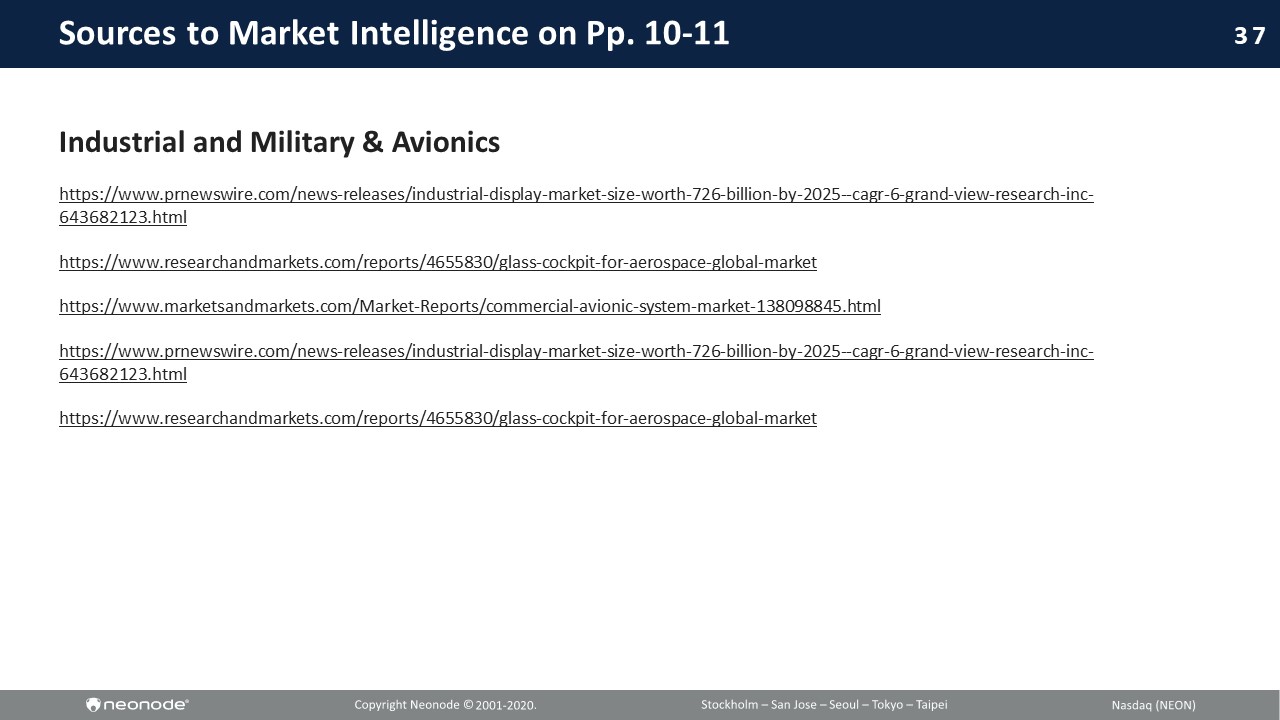
37 Sources to Market Intelligence on Pp. 10 - 11 Industrial and Military & Avionics https://www.prnewswire.com/news - releases/industrial - display - market - size - worth - 726 - billion - by - 2025 -- cagr - 6 - grand - view - research - in c - 643682123.html https://www.researchandmarkets.com/reports/4655830/glass - cockpit - for - aerospace - global - market https://www.marketsandmarkets.com/Market - Reports/commercial - avionic - system - market - 138098845.html https://www.prnewswire.com/news - releases/industrial - display - market - size - worth - 726 - billion - by - 2025 -- cagr - 6 - grand - view - research - in c - 643682123.html https://www.researchandmarkets.com/reports/4655830/glass - cockpit - for - aerospace - global - market
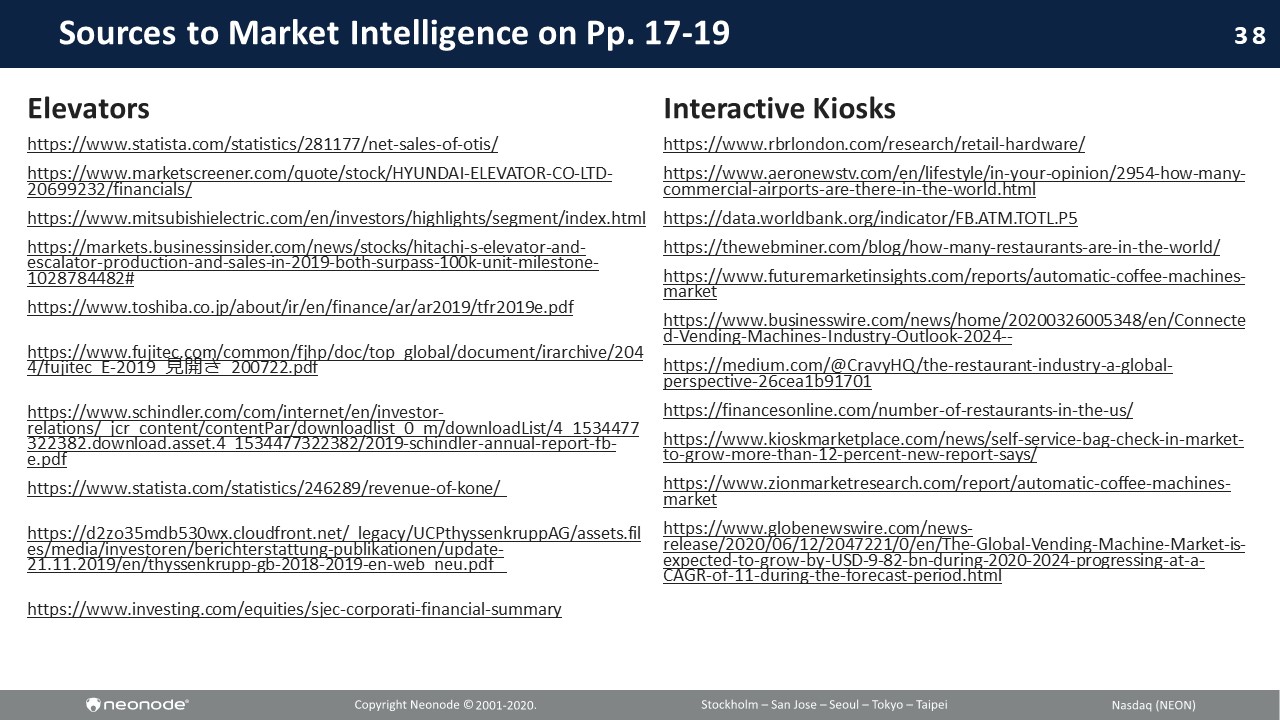
38 Sources to Market Intelligence on Pp. 17 - 19 Elevators https://www.statista.com/statistics/281177/net - sales - of - otis/ https://www.marketscreener.com/quote/stock/HYUNDAI - ELEVATOR - CO - LTD - 20699232/financials/ https://www.mitsubishielectric.com/en/investors/highlights/segment/index.html https://markets.businessinsider.com/news/stocks/hitachi - s - elevator - and - escalator - production - and - sales - in - 2019 - both - surpass - 100k - unit - milestone - 1028784482# https://www.toshiba.co.jp/about/ir/en/finance/ar/ar2019/tfr2019e.pdf https://www.fujitec.com/common/fjhp/doc/top_global/document/irarchive/204 4/fujitec_E - 2019_ 見開き _200722. pdf https://www.schindler.com/com/internet/en/investor - relations/_jcr_content/contentPar/downloadlist_0_m/downloadList/4_1534477 322382.download.asset.4_1534477322382/2019 - schindler - annual - report - fb - e.pdf https://www.statista.com/statistics/246289/revenue - of - kone/ https://d2zo35mdb530wx.cloudfront.net/_legacy/UCPthyssenkruppAG/assets.fil es/media/investoren/berichterstattung - publikationen/update - 21.11.2019/en/thyssenkrupp - gb - 2018 - 2019 - en - web_neu.pdf https://www.investing.com/equities/sjec - corporati - financial - summary Interactive Kiosks https://www.rbrlondon.com/research/retail - hardware/ https://www.aeronewstv.com/en/lifestyle/in - your - opinion/2954 - how - many - commercial - airports - are - there - in - the - world.html https://data.worldbank.org/indicator/FB.ATM.TOTL.P5 https://thewebminer.com/blog/how - many - restaurants - are - in - the - world/ https://www.futuremarketinsights.com/reports/automatic - coffee - machines - market https://www.businesswire.com/news/home/20200326005348/en/Connecte d - Vending - Machines - Industry - Outlook - 2024 -- https://medium.com/@CravyHQ/the - restaurant - industry - a - global - perspective - 26cea1b91701 https://financesonline.com/number - of - restaurants - in - the - us/ https://www.kioskmarketplace.com/news/self - service - bag - check - in - market - to - grow - more - than - 12 - percent - new - report - says/ https://www.zionmarketresearch.com/report/automatic - coffee - machines - market https://www.globenewswire.com/news - release/2020/06/12/2047221/0/en/The - Global - Vending - Machine - Market - is - expected - to - grow - by - USD - 9 - 82 - bn - during - 2020 - 2024 - progressing - at - a - CAGR - of - 11 - during - the - forecast - period.html

Thank You [email protected] neonode.com