
BRC Group Holdings, Inc 8-K, filed May 11, 2020
BRC Group Holdings, Inc. (RILY)
About this 8-K
BRC Group Holdings, Inc filed this 8-K on May 11, 2020.
Items reported
- Item 2.02: Financial results
- Item 7.01: Regulation FD disclosure
- Item 9.01: Financial statements and exhibits
UNITED STATES
SECURITIES AND EXCHANGE COMMISSION
Washington, D.C. 20549
FORM 8-K
CURRENT REPORT
Pursuant to Section 13 OR 15(d) of The Securities Exchange Act of 1934
Date of Report (Date of earliest event reported): May 11, 2020
B. RILEY FINANCIAL, INC.
(Exact name of registrant as specified in its charter)
| Delaware | 001-37503 | 27-0223495 | ||
| (State or other jurisdiction of incorporation) |
(Commission File Number) | (IRS Employer Identification No.) |
21255 Burbank Boulevard, Suite 400
Woodland Hills, California 91367
818-884-3737
(Address, Including Zip Code, and Telephone Number, Including Area Code, of Registrant’s Principal Executive Offices)
Securities registered pursuant to Section 12(b) of the Act:
| Title of each class | Trading Symbol(s) | Name of each exchange on which registered | ||
| Common Stock, par value $0.0001 per share | RILY | Nasdaq Global Market | ||
| Depositary Shares (each representing a 1/1000th interest in a 6.875% Series A Cumulative Perpetual Preferred Share, par value $0.0001 per share) | RILYP | Nasdaq Global Market | ||
| 7.25% Senior Notes due 2027 | RILYG | Nasdaq Global Market | ||
| 7.50% Senior Notes due 2027 | RILYZ | Nasdaq Global Market | ||
| 7.375% Senior Notes due 2023 | RILYH | Nasdaq Global Market | ||
| 6.875% Senior Notes due 2023 | RILYI | Nasdaq Global Market | ||
| 6.75% Senior Notes due 2024 | RILYO | Nasdaq Global Market | ||
| 6.50% Senior Notes due 2026 | RILYN | Nasdaq Global Market | ||
| 6.375% Senior Notes due 2025 | RILYM | Nasdaq Global Market |
Not Applicable
(Former name or former address, if changed since last report)
Check the appropriate box below if the Form 8-K filing is intended to simultaneously satisfy the filing obligation of the registrant under any of the following provisions:
| ☐ | Written communications pursuant to Rule 425 under the Securities Act (17 CFR 230.425) |
| ☐ | Soliciting material pursuant to Rule 14a-12 under the Exchange Act (17 CFR 240.14a-12) |
| ☐ | Pre-commencement communications pursuant to Rule 14d-2(b) under the Exchange Act (17 CFR 240.14d-2(b)) |
| ☐ | Pre-commencement communications pursuant to Rule 13e-4(c) under the Exchange Act (17 CFR 240.13e-4(c)) |
Indicate by check mark whether the registrant is an emerging growth company as defined in Rule 405 of the Securities Act of 1933 (§230.405 of this chapter) or Rule 12b-2 of the Securities Exchange Act of 1934 (§240.12b-2 of this chapter).
Emerging growth company ☐
If an emerging growth company, indicate by check mark if the registrant has elected not to use the extended transition period for complying with any new or revised financial accounting standards provided pursuant to Section 13(a) of the Exchange Act. ☐
Item 2.02. Results of Operations and Financial Condition.
On May 11, 2020, B. Riley Financial, Inc. (the “Company”) issued a press release reporting its financial results for the fiscal quarter ended March 31, 2020. A copy of the press release is attached hereto as Exhibit 99.1.
Item 7.01. Regulation FD Disclosure.
Additionally, on May 11, 2020, in conjunction with the press release described above, the Company posted to its website at ir.brileyfin.com certain supplemental financial information for the fiscal quarter ended March 31, 2020 and certain prior periods. A copy of the information is attached hereto as Exhibit 99.2.
The information set forth in this Current Report, including Exhibits 99.1 and 99.2 attached hereto, is being furnished and shall not be deemed “filed” for purposes of Section 18 of the Securities Exchange Act of 1934, as amended (the “Exchange Act”), or otherwise subject to the liabilities of such section. The information in this Current Report, including Exhibits 99.1 and 99.2 attached hereto, shall not be incorporated by reference into any filing under the Securities Act of 1933, as amended, or the Exchange Act, except as expressly set forth by specific reference in such a filing to this Current Report.
Item 9.01. Financial Statements and Exhibits.
(d) Exhibits
|
Exhibit No. |
Description | |
| 99.1 | Earnings Release dated May 11, 2020 | |
| 99.2 | First Quarter 2020 Supplemental Financial Data dated May 11, 2020 |
SIGNATURE
Pursuant to the requirements of the Securities Exchange Act of 1934, the registrant has duly caused this report to be signed on its behalf by the undersigned hereunto duly authorized.
| May 11, 2020 | B. RILEY FINANCIAL, INC. | |||
| By: | /s/ Phillip J. Ahn | |||
| Name: | Phillip J. Ahn | |||
| Title: | Chief Financial Officer and Chief Operating Officer | |||
Exhibit 99.1

B. Riley Financial Reports First Quarter
2020 Results and
Declares Quarterly Cash Dividend of $0.25 per Common Share
Record Results Mitigated by Unrealized Losses
LOS ANGELES, May 11, 2020 – B. Riley Financial, Inc. (NASDAQ:RILY) (“B. Riley” or the “Company”) today announced results for the first quarter ended March 31, 2020.
Bryant Riley, Chairman and Co-Chief Executive Officer, B. Riley Financial, said: “Our first quarter results consisted of very strong performance from our operating businesses alongside a significant mark-to-market loss from our investment portfolio. Core operations demonstrated collective strength with a record quarter in terms of both growth and overall profitability. While our investment book saw large unrealized losses during the quarter, primarily from the global impact of COVID-19, these losses do not have a material impact on our operations. Since the end of the quarter, our portfolio has had a meaningful rebound and we feel fortunate to have the asset of permanent capital which will allow us to capitalize on market dislocations being presented.”
“As we evaluate our operating businesses, we have never been more excited about our earnings power and position in the market. We believe B. Riley is well-positioned to grow market share through the second half of 2020 as capital markets recover and the headwinds in the retail sector accelerate. We are actively pursuing and have been engaged in several new opportunities which leverage our diverse capabilities across restructuring, bankruptcy and litigation advisory, valuation, lending and retail liquidation. We maintain a balance sheet in excess of $775 million of cash and investments, which we intend to use opportunistically to support our clients and partners and create value for our shareholders.”
“As we continue to prioritize the health and well-being of our colleagues, we could not be prouder of this team of world-class professionals. Our strength lies in our ability to support our clients and partners as they navigate the challenges created by the COVID-19 pandemic.”
First Quarter 2020 Financial Summary
| · | GAAP consolidated revenues of ($0.2 million) and net loss of ($98.7 million) |
| · | Record quarterly operating revenues (1) of $182.2 million and operating adjusted EBITDA (3) of $70.9 million |
| · | Investment loss (4) driven by significant markdowns, primarily unrealized losses on marketable securities and on fair value of loans |
| · | Cash and cash equivalents total $124.2 million at March 31, 2020 |
| · | Repurchased over one million shares of common stock during the quarter |
| · | Declared quarterly dividend of $0.25 per common share |
| Three Months Ended March 31 | ||||||||
| (Dollars in thousands) | 2020 | 2019 | ||||||
| Revenues: | ||||||||
| Operating Revenues (1) | $ | 182,236 | $ | 116,261 | ||||
| Investment (Loss) Gains (4) | (182,442 | ) | 25,867 | |||||
| Total Revenues | $ | (206 | ) | $ | 142,128 | |||
| Adjusted EBITDA: | ||||||||
| Operating Adjusted EBITDA (3) | $ | 70,908 | $ | 18,858 | ||||
| Investment Adjusted EBITDA | (166,972 | ) | 15,572 | |||||
| Total Adjusted EBITDA (2) | $ | (96,064 | ) | $ | 34,430 | |||
B. Riley Financial, Inc. | www.brileyfin.com | NASDAQ: RILY
B. Riley Financial reported revenues of ($0.2 million) and net loss of ($98.7 million), primarily driven by investment losses which eclipsed record quarterly operating results for the three months ended March 31, 2020.
Operating revenue (1) increased to $182.2 million from $116.3 million in the prior year period. Operating adjusted EBITDA (3) increased to $70.9 million from $18.9 million for the prior year period. Strong operating performance was driven by investment banking, record quarterly results from GlassRatner consulting; and solid performance from appraisal and wealth management, in addition to contributions from retail liquidation, principal investments and brands.
Investment loss (4) of ($182.4 million) includes the recognition of significant markdowns related to the Company’s proprietary investments, which comprise certain private and public securities and loans. Lower income related to these equity investments, and fair value adjustments on loans, are unrealized mark-to-market losses due to implementation of new accounting standard effective January 1, 2020.
The Company employs a strategy of actively investing in companies which can benefit from B. Riley’s operational, financial and industry expertise to create revenue opportunities for its affiliated businesses. While a majority of the investment losses came from four large positions, the Company views these marks as moment in time valuations due to impacts of COVID-19 versus permanent impairment. Leveraging the Company’s proprietary network, operating businesses, and balance sheet into long-term investment gains remains a core component of its business strategy to create value for its clients, partners and shareholders.
First Quarter 2020 Segment Financial Summary
| Capital Markets | Auction & Liquidation | Valuation & Appraisal | Principal Investments | Brands | ||||||||||||||||||||||||||||||||||||
| (Dollars in thousands) | Q1 2020 | Q1 2019 | Q1 2020 | Q1 2019 | Q1 2020 | Q1 2019 | Q1 2020 | Q1 2019 | Q1 2020 | Q1 2019 | ||||||||||||||||||||||||||||||
| Revenues: | ||||||||||||||||||||||||||||||||||||||||
| Operating Revenues | $ | 126,264 | $ | 59,434 | $ | 20,661 | $ | 20,709 | $ | 8,788 | $ | 8,583 | $ | 22,722 | $ | 27,535 | $ | 3,801 | $ | - | ||||||||||||||||||||
| Investment (Loss) Gains (4) | (182,442 | ) | 25,867 | - | - | - | - | - | - | - | - | |||||||||||||||||||||||||||||
| Total Segment Revenue | $ | (56,178 | ) | $ | 85,301 | $ | 20,661 | $ | 20,709 | $ | 8,788 | $ | 8,583 | $ | 22,722 | $ | 27,535 | $ | 3,801 | - | ||||||||||||||||||||
| Segment Income: | ||||||||||||||||||||||||||||||||||||||||
| Operating Income | $ | 46,505 | $ | (1,711 | ) | $ | 4,289 | $ | 11,504 | $ | 1,880 | $ | 1,363 | $ | 8,504 | $ | 7,929 | $ | (1,817 | ) | - | |||||||||||||||||||
| Investment (Loss) Income | (166,972 | ) | 15,572 | - | - | - | - | - | - | - | - | |||||||||||||||||||||||||||||
| Segment Income | $ | (120,467 | ) | $ | 13,861 | $ | 4,289 | $ | 11,504 | $ | 1,880 | $ | 1,363 | $ | 8,504 | $ | 7,929 | $ | (1,817 | ) | - | |||||||||||||||||||
| · | Capital Markets segment loss reflects markdowns related to investments mentioned above, which eclipsed strong performance from investment banking, record quarterly revenues from GlassRatner, and increased contributions from wealth management. |
| · | Auction and Liquidation segment results were primarily driven by large retail liquidation projects conducted by Great American Group during the quarter. |
| · | Valuation and Appraisal segment performance increased slightly during the quarter driven by an increase in appraisal units and lower operating expenses. Historical results for this segment have remained relatively steady from quarter-to-quarter and year-to-year. |
| · | Principal Investments segment companies, United Online and magicJack, performed at or above expectations, contributing steady cash flow for the Company. |
As of March 31, 2020, the Company had total cash and cash equivalents of $124.2 million, with no significant principal payments due on outstanding indebtedness until 2023. Cash and investments totaled $777.7 million, which includes approximately $48.8 million of other equity investments and deposits included in prepaid and other assets.
Supplemental Financial Data
Additional information included in B. Riley Financial’s First Quarter 2020 Results related to investments and operating metrics have been presented to provide investors with useful information regarding its performance and overall results of operations, which the Company intends to provide moving forward. Further details related to these metrics can be found in a Financial Supplement on the Company’s investor relations website. Shareholders may access this information by visiting ir.brileyfin.com.
Share Repurchases
During the first quarter, the Company repurchased over one million shares of its common stock under its existing share repurchase program, including the repurchase of 880,000 shares as part of a privately negotiated transaction completed prior to March 2020.
Dividend
The Company’s Board of Directors has declared a quarterly dividend of $0.25 per share, which will be paid on or about June 10, 2020 to stockholders of record as of June 1, 2020.
Conference Call
Management will host a conference call today, Monday, May 11, 2020 at 4:30 p.m. Eastern time (1:30 p.m. Pacific time) to discuss the Company’s quarterly results. The live broadcast and archived recording will be available on the Company’s investor relations website.
Date: Monday, May 11, 2020
Time: 4:30 p.m. Eastern time (1:30 p.m. Pacific time)
Toll-Free: 1-877-451-6152
International: 1-201-389-0879
Replay Dial-In (expires on Monday, May 18, 2020)
Toll-Free: 1-844-512-2921
International: 1-412-317-6671
Replay Pin: 13703074
For more information, visit ir.brileyfin.com.
About B. Riley Financial, Inc. (NASDAQ:RILY)
B. Riley Financial provides collaborative financial services tailored to fit the capital raising and business advisory needs of public and private companies and high-net-worth individuals. The Company operates through several wholly owned subsidiaries which offer complementary end-to-end capabilities spanning investment banking and institutional brokerage, private wealth and investment management, corporate advisory, restructuring, due diligence, forensic accounting and litigation support, appraisal and valuation, and auction and liquidation services. Certain registered affiliates of B. Riley originate and underwrite senior secured loans for asset-rich companies. The Company also makes proprietary investments in companies and assets with attractive return profiles. For more information about B. Riley and its affiliated companies, visit www.brileyfin.com.
Footnotes
| (1) | Operating revenue is defined as the sum of revenues from service and fees, interest income - loans and securities lending and sales of goods. |
| (2) | Adjusted EBITDA includes earnings before interest, taxes, depreciation, amortization, restructuring costs, share-based payments, impairment of tradenames, and transaction related and other costs. For a definition of adjusted EBITDA and a reconciliation to GAAP financial measures, please see the Appendix. See “Note Regarding Use of Non-GAAP Financial Measures” for further discussion of this non-GAAP term. |
| (3) | Operating adjusted EBITDA is defined as adjusted EBITDA excluding trading income (losses) and fair value adjustments on loans and other investment related expenses. See “Note Regarding Use of Non-GAAP Financial Measures” for further discussion of this non-GAAP term. |
| (4) | Investment (loss) gains is defined as trading income (losses) and fair value adjustments on loans. |
Forward-Looking Statements
Statements in this press release that are not descriptions of historical facts are forward-looking statements that are based on management’s current expectations and assumptions and are subject to risks and uncertainties. If such risks or uncertainties materialize or such assumptions prove incorrect, our business, operating results, financial condition and stock price could be materially negatively affected. You should not place undue reliance on such forward-looking statements, which are based on the information currently available to us and speak only as of the date of this press release. Such forward looking statements include, but are not limited to, statements regarding the Company’s anticipated results of operations for 2020, as well as statements regarding our excitement and the expected growth of our business segments. Factors that could cause such actual results to differ materially from those contemplated or implied by such forward-looking statements include (without limitation) the risks associated with the unpredictable and ongoing impact of the COVID-19 pandemic and other risks described from time to time in B. Riley Financial, Inc.’s periodic filings with the SEC, including, without limitation, the risks described in B. Riley Financial, Inc.’s Annual Report on Form 10-K for the year ended December 31, 2019 under the captions “Risk Factors” and “Management’s Discussion and Analysis of Financial Condition and Results of Operations.” Additional information will be set forth in our Quarterly Report on Form 10-Q for the quarter ended March 31, 2020. These factors should be considered carefully, and readers are cautioned not to place undue reliance on such forward-looking statements. All information is current as of the date this press release is issued, and B. Riley Financial, Inc. undertakes no duty to update this information.
Note Regarding Use of Non-GAAP Financial Measures
Certain of the information set forth herein, including operating revenue and adjusted EBITDA, may be considered non-GAAP financial measures. B. Riley Financial believes this information is useful to investors because it provides a basis for measuring the Company's available capital resources, the operating performance of its business and its revenues and cash flow, excluding in the case of operating revenues, which is the sum of revenues from service and fees, interest income - loans and securities lending and sales of goods, and additionally excluding in the case of adjusted EBITDA net interest expense, provisions for or benefit from income taxes, depreciation, amortization, fair value adjustment, transaction and other expenses, restructuring costs, and stock-based compensation that would normally be included in the most directly comparable measures calculated and presented in accordance with Generally Accepted Accounting Principles ("GAAP"). In addition, the Company's management uses these non-GAAP financial measures along with the most directly comparable GAAP financial measures in evaluating the Company's operating performance, capital resources and cash flow. Non-GAAP financial measures should not be considered in isolation from, or as a substitute for, financial information presented in compliance with GAAP, and non-financial measures as reported by the Company may not be comparable to similarly titled amounts reported by other companies.
| B. RILEY FINANCIAL, INC. | ||||||||||||
| Consolidated Balance Sheets | ||||||||||||
| (Dollars in thousands, except par value) | ||||||||||||
| March 31, 2020 | December 31, 2019 | |||||||
| (Unaudited) | ||||||||
| Assets | ||||||||
| Assets: | ||||||||
| Cash and cash equivalents | $ | 124,231 | $ | 104,268 | ||||
| Restricted cash | 471 | 471 | ||||||
| Due from clearing brokers | 10,879 | 23,818 | ||||||
| Securities and other investments owned, at fair value | 287,786 | 408,213 | ||||||
| Securities borrowed | 674,163 | 814,331 | ||||||
| Accounts receivable, net | 46,450 | 46,624 | ||||||
| Due from related parties | 4,391 | 5,832 | ||||||
| Advances against customer contracts | 11,121 | 27,347 | ||||||
| Loans receivable, at fair value (includes $216,302 from related parties at March 31, 2020) | 326,299 | 43,338 | ||||||
| Loans receivable, at cost (includes $157,080 from related parties at December 31, 2019) | - | 225,848 | ||||||
| Prepaid expenses and other assets | 114,686 | 81,808 | ||||||
| Operating lease right-of-use assets | 46,213 | 47,809 | ||||||
| Property and equipment, net | 12,223 | 12,727 | ||||||
| Goodwill | 223,697 | 223,697 | ||||||
| Other intangible assets, net | 212,500 | 220,525 | ||||||
| Deferred income taxes | 35,786 | 31,522 | ||||||
| Total assets | $ | 2,130,896 | $ | 2,318,178 | ||||
| Liabilities and Equity | ||||||||
| Liabilities: | ||||||||
| Accounts payable | $ | 6,858 | $ | 4,477 | ||||
| Accrued expenses and other liabilities | 103,452 | 130,714 | ||||||
| Deferred revenue | 73,709 | 67,121 | ||||||
| Due to related parties and partners | 1,061 | 1,750 | ||||||
| Due to clearing brokers | 5,126 | - | ||||||
| Securities sold not yet purchased | 14,298 | 41,820 | ||||||
| Securities loaned | 670,859 | 810,495 | ||||||
| Mandatorily redeemable noncontrolling interests | 4,508 | 4,616 | ||||||
| Operating lease liabilities | 59,430 | 61,511 | ||||||
| Notes payable | 714 | 38,167 | ||||||
| Loan participations sold | 12,405 | 12,478 | ||||||
| Term loan | 61,932 | 66,666 | ||||||
| Senior notes payable | 853,523 | 688,112 | ||||||
| Total liabilities | 1,867,875 | 1,927,927 | ||||||
| B. Riley Financial, Inc. stockholders' equity: | ||||||||
| Preferred stock, $0.0001 par value; 1,000,000 shares authorized; 2,531 and 2,349 issued and | - | - | ||||||
| outstanding as of March 31, 2020 and December 31, 2019, respectively; liquidation | ||||||||
| preference of $63,273 and $58,723 as of March 31, 2020 and December 31, 2019, respectively | ||||||||
| Common stock, $0.0001 par value; 100,000,000 shares authorized; 25,988,565 and 26,972,332 | 3 | 3 | ||||||
| issued and outstanding as of March 31, 2020 and December 31, 2019, respectively. | ||||||||
| Additional paid-in capital | 308,472 | 323,109 | ||||||
| (Accumulated deficit) retained earnings | (70,232 | ) | 39,536 | |||||
| Accumulated other comprehensive loss | (3,208 | ) | (1,988 | ) | ||||
| Total B. Riley Financial, Inc. stockholders' equity | 235,035 | 360,660 | ||||||
| Noncontrolling interests | 27,986 | 29,591 | ||||||
| Total equity | 263,021 | 390,251 | ||||||
| Total liabilities and equity | $ | 2,130,896 | $ | 2,318,178 | ||||
B. RILEY FINANCIAL, INC.
Consolidated Statements of Operations
(Unaudited)
(Dollars in thousands, except share data)
| Three Months Ended March 31, | ||||||||
| 2020 | 2019 | |||||||
| Revenues: | ||||||||
| Services and fees | $ | 159,381 | $ | 103,896 | ||||
| Trading (losses) income and fair value adjustments on loans | (182,442 | ) | 25,867 | |||||
| Interest income - Loans and securities lending | 21,851 | 11,420 | ||||||
| Sale of goods | 1,004 | 945 | ||||||
| Total revenues | (206 | ) | 142,128 | |||||
| Operating expenses: | ||||||||
| Direct cost of services | 19,952 | 14,116 | ||||||
| Cost of goods sold | 769 | 1,119 | ||||||
| Selling, general and administrative expenses | 87,744 | 94,964 | ||||||
| Restructuring charge | - | 147 | ||||||
| Impairment of tradenames | 4,000 | - | ||||||
| Interest expense - Securities lending and loan participations sold | 8,473 | 6,804 | ||||||
| Total operating expenses | 120,938 | 117,150 | ||||||
| Operating (loss) income | (121,144 | ) | 24,978 | |||||
| Other income (expense): | ||||||||
| Interest income | 246 | 637 | ||||||
| Loss from equity investments | (236 | ) | (3,762 | ) | ||||
| Interest expense | (15,654 | ) | (10,770 | ) | ||||
| (Loss) income before income taxes | (136,788 | ) | 11,083 | |||||
| Beneft (provision) for income taxes | 37,539 | (3,104 | ) | |||||
| Net (loss) income | (99,249 | ) | 7,979 | |||||
| Net loss attributable to noncontrolling interests | (584 | ) | (44 | ) | ||||
| Net (loss) income attributable to B. Riley Financial, Inc. | $ | (98,665 | ) | $ | 8,023 | |||
| Preferred stock dividends | 1,055 | - | ||||||
| Net (loss) income available to common shareholders | $ | (99,720 | ) | $ | 8,023 | |||
| Basic (loss) income per common share | $ | (3.83 | ) | $ | 0.31 | |||
| Diluted (loss) income per common share | $ | (3.83 | ) | $ | 0.30 | |||
| Weighted average basic common shares outstanding | 26,028,613 | 26,217,215 | ||||||
| Weighted average diluted common shares outstanding | 26,028,613 | 26,687,531 | ||||||
| B. RILEY FINANCIAL, INC. | |||||||||||||
| Consolidated Statements of Cash Flows | |||||||||||||
| (Unaudited) | |||||||||||||
| (Dollars in thousands) | |||||||||||||
| Three Months Ended March 31, | |||||||||||||
| 2020 | 2019 | ||||||||||||
| Cash flows from operating activities: | |||||||||||||
| Net (loss) income | $ | (99,249) | $ | 7,979 | |||||||||
| Adjustments to reconcile net income to net cash provided by operating activities: | |||||||||||||
| Depreciation and amortization | 4,956 | 4,913 | |||||||||||
| Provision for doubtful accounts | 724 | 233 | |||||||||||
| Share-based compensation | 5,322 | 2,614 | |||||||||||
| Fair value adjustments, non-cash | 17,926 | 49 | |||||||||||
| Non-cash interest and other | (2,827) | 736 | |||||||||||
| Effect of foreign currency on operations | 179 | 130 | |||||||||||
| Loss from equity investments | 236 | 3,762 | |||||||||||
| Deferred income taxes | (4,254) | (390) | |||||||||||
| Impairment of intangibles and loss on disposal of fixed assets | 4,046 | 88 | |||||||||||
| Gain on extinguishment of debt | (1,556) | — | |||||||||||
| Income allocated for mandatorily redeemable noncontrolling interests | 175 | 169 | |||||||||||
| Change in operating assets and liabilities: | |||||||||||||
| Due from clearing brokers | 12,939 | 15,320 | |||||||||||
| Securities and other investments owned | 125,061 | (15,274) | |||||||||||
| Securities borrowed | 140,168 | 104,104 | |||||||||||
| Accounts receivable and advances against customer contracts | 15,674 | (2,845) | |||||||||||
| Prepaid expenses and other assets | (37,151) | (3,706) | |||||||||||
| Accounts payable, accrued expenses and other liabilities | (22,097) | (1,251) | |||||||||||
| Amounts due to/from related parties and partners | 752 | (1,236) | |||||||||||
| Securities sold, not yet purchased | (27,522) | (1,675) | |||||||||||
| Deferred revenue | 6,589 | 893 | |||||||||||
| Securities loaned | (139,636) | (105,689) | |||||||||||
| Net cash provided by operating activities | 455 | 8,924 | |||||||||||
| Cash flows from investing activities: | |||||||||||||
| Purchases of loans receivable | (115,328) | (20,154) | |||||||||||
| Repayments of loans receivable | 42,128 | 5,500 | |||||||||||
| Sale of loan receivable to related party | 1,800 | — | |||||||||||
| Repayment of loan participations sold | (244) | — | |||||||||||
| Purchases of property, equipment and other | (438) | (1,746) | |||||||||||
| Proceeds from sale of property, equipment and intangible assets | 1 | 12 | |||||||||||
| Purchase of equity investments | — | (10,558) | |||||||||||
| Dividends and distributions from equity investments | 589 | 433 | |||||||||||
| Net cash used in investing activities | (71,492) | (26,513) | |||||||||||
| Cash flows from financing activities: | |||||||||||||
| Repayment of asset based credit facility | (37,096) | — | |||||||||||
| Repayment of notes payable | (357) | (357) | |||||||||||
| Proceeds from term loan | — | 10,000 | |||||||||||
| Repayment of term loan | (4,810) | — | |||||||||||
| Proceeds from issuance of senior notes | 171,078 | 4,987 | |||||||||||
| Redemption of senior notes | (1,829) | — | |||||||||||
| Payment of debt issuance costs | (2,724) | (145) | |||||||||||
| Payment of employment taxes on vesting of restricted stock | (505) | (714) | |||||||||||
| Common dividends paid | (9,609) | (2,606) | |||||||||||
| Preferred dividends paid | (1,055) | — | |||||||||||
| Repurchase of common stock | (24,068) | (2,650) | |||||||||||
| Distribution to noncontrolling interests | (1,323) | (274) | |||||||||||
| Proceeds from issuance of preferred stock | 4,630 | — | |||||||||||
| Net cash provided by financing activities | 92,332 | 8,241 | |||||||||||
| Increase (decrease) in cash, cash equivalents and restricted cash | 21,295 | (9,348) | |||||||||||
| Effect of foreign currency on cash, cash equivalents and restricted cash | (1,332) | 23 | |||||||||||
| Net increase (decrease) in cash, cash equivalents and restricted cash | 19,963 | (9,325) | |||||||||||
| Cash, cash equivalents and restricted cash, beginning of period | 104,739 | 180,278 | |||||||||||
| Cash, cash equivalents and restricted cash, end of period | $ | 124,702 | $ | 170,953 | |||||||||
| Supplemental disclosures: | |||||||||||||
| Interest paid | $ | 21,785 | $ | 17,435 | |||||||||
| Taxes paid | $ | 574 | $ | 192 | |||||||||
| B. RILEY FINANCIAL, INC. | ||||||||||
| Segment Financial Information | ||||||||||
| (Unaudited) | ||||||||||
| (Dollars in thousands) | ||||||||||
| Three Months Ended | ||||||||||
| March 31, | ||||||||||
| 2020 | 2019 | |||||||||
| Capital Markets segment: | ||||||||||
| Revenues - Services and fees | $ | 104,413 | $ | 48,014 | ||||||
| Trading (losses) income and fair value adjustments on loans | (182,442) | 25,867 | ||||||||
| Interest income - Loans and securities lending | 21,851 | 11,420 | ||||||||
| Total revenues | (56,178) | 85,301 | ||||||||
| Selling, general and administrative expenses | (54,711) | (63,389) | ||||||||
| Restructuring recovery | — | 29 | ||||||||
| Interest expense - Securities lending and loan participations sold | (8,473) | (6,804) | ||||||||
| Depreciation and amortization | (1,105) | (1,276) | ||||||||
| Segment (loss) income | (120,467) | 13,861 | ||||||||
| Auction and Liquidation segment: | ||||||||||
| Revenues - Services and fees | 20,661 | 20,709 | ||||||||
| Direct cost of services | (14,816) | (6,274) | ||||||||
| Cost of goods sold | (29) | (14) | ||||||||
| Selling, general and administrative expenses | (1,526) | (2,915) | ||||||||
| Depreciation and amortization | (1) | (2) | ||||||||
| Segment income | 4,289 | 11,504 | ||||||||
| Valuation and Appraisal segment: | ||||||||||
| Revenues - Services and fees | 8,788 | 8,583 | ||||||||
| Selling, general and administrative expenses | (6,867) | (7,187) | ||||||||
| Depreciation and amortization | (41) | (33) | ||||||||
| Segment income | 1,880 | 1,363 | ||||||||
| Principal Investments - United Online and magicJack segment: | ||||||||||
| Revenues - Services and fees | 21,718 | 26,590 | ||||||||
| Revenues - Sale of goods | 1,004 | 945 | ||||||||
| Total revenues | 22,722 | 27,535 | ||||||||
| Direct cost of services | (5,136) | (7,842) | ||||||||
| Cost of goods sold | (740) | (1,105) | ||||||||
| Selling, general and administrative expenses | (5,463) | (7,020) | ||||||||
| Depreciation and amortization | (2,879) | (3,463) | ||||||||
| Restructuring charge | — | (176) | ||||||||
| Segment income | 8,504 | 7,929 | ||||||||
| Brands segment: | ||||||||||
| Revenues - Services and fees | 3,801 | — | ||||||||
| Selling, general and administrative expenses | (904) | — | ||||||||
| Depreciation and amortization | (714) | — | ||||||||
| Impairment of tradenames | (4,000) | — | ||||||||
| Segment loss | (1,817) | — | ||||||||
| Consolidated operating (loss) income from reportable segments | (107,611) | 34,657 | ||||||||
| Corporate and other expenses | (13,533) | (9,679) | ||||||||
| Interest income | 246 | 637 | ||||||||
| Loss on equity investments | (236) | (3,762) | ||||||||
| Interest expense | (15,654) | (10,770) | ||||||||
| (Loss) income before income taxes | (136,788) | 11,083 | ||||||||
| Benefit (provision) for income taxes | 37,539 | (3,104) | ||||||||
| Net (loss) income | (99,249) | 7,979 | ||||||||
| Net loss attributable to noncontrolling interests | (584) | (44) | ||||||||
| Net (loss) income attributable to B. Riley Financial, Inc. | (98,665) | 8,023 | ||||||||
| Preferred stock dividends | 1,055 | — | ||||||||
| Net (loss) income available to common shareholders | $ | (99,720) | $ | 8,023 | ||||||
| B. RILEY FINANCIAL, INC. | |||||||||||
| Adjusted EBITDA and Operating Adjusted EBITDA Reconciliation | |||||||||||
| (Unaudited) | |||||||||||
| (Dollars in thousands) | |||||||||||
| Three Months Ended March 31, | |||||||||||
| 2020 | 2019 | ||||||||||
| Net (loss) income attributable to B. Riley Financial, Inc. | $ | (98,665) | $ | 8,023 | |||||||
| EBITDA Adjustments: | |||||||||||
| (Benefit) Provision for income taxes | (37,539) | 3,104 | |||||||||
| Interest expense | 15,654 | 10,770 | |||||||||
| Interest income | (246) | (637) | |||||||||
| Share based payments | 5,322 | 2,614 | |||||||||
| Depreciation and amortization | 4,956 | 4,913 | |||||||||
| Restructuring costs | — | 147 | |||||||||
| Impairment of tradenames | 4,000 | — | |||||||||
| Transactions related costs and other | 10,454 | 5,496 | |||||||||
| Total EBITDA adjustments | 2,601 | 26,407 | |||||||||
| Adjusted EBITDA | $ | (96,064) | $ | 34,430 | |||||||
| Operating EBITDA Adjustments: | |||||||||||
| Trading losses (income) and fair value adjustments on loans | 182,442 | (25,867) | |||||||||
| Other investment related expenses | (15,470) | 10,295 | |||||||||
| Total Operating EBITDA Adjustments | 166,972 | (15,572) | |||||||||
| Operating Adjusted EBITDA | $ | 70,908 | $ | 18,858 | |||||||
| B. RILEY FINANCIAL, INC. | |||||||||||
| Adjusted Net Income Reconciliation | |||||||||||
| (Unaudited) | |||||||||||
| (Dollars in thousands, except share data) | |||||||||||
| Three Months Ended | |||||||||||
| March 31, | |||||||||||
| 2020 | 2019 | ||||||||||
| Net (loss) income attributable to B. Riley Financial, Inc. | $ | (98,665) | $ | 8,023 | |||||||
| Adjustments: | |||||||||||
| Share based payments | 5,322 | 2,614 | |||||||||
| Amortization of intangible assets | 4,024 | 3,377 | |||||||||
| Restructuring costs | — | 147 | |||||||||
| Impairment of tradenames | 4,000 | — | |||||||||
| Transactions related costs and other | 10,454 | 5,496 | |||||||||
| Income tax effect of adjusting entries | (6,559) | (3,245) | |||||||||
| Adjusted net (loss) income attributable to B. Riley Financial, Inc. | $ | (81,424) | $ | 16,412 | |||||||
| Adjusted income per common share: | |||||||||||
| Adjusted basic income per share | $ | (3.13) | $ | 0.63 | |||||||
| Adjusted diluted income per share | $ | (3.13) | $ | 0.61 | |||||||
| Shares used to calculate adjusted basic net income per share | 26,028,613 | 26,217,215 | |||||||||
| Shares used to calculate adjusted diluted net income per share | 26,028,613 | 26,687,531 | |||||||||
Contacts
Investors B. Riley Financial ir@brileyfin.com (310) 966-1444 |
Media Jo Anne McCusker jmccusker@brileyfin.com (646) 885-5425 |
Source: B. Riley Financial, Inc.
# # #
Exhibit 99.2

1 NASDAQ: RILY First Quarter 2020 Supplemental Financial Data May 11, 2020
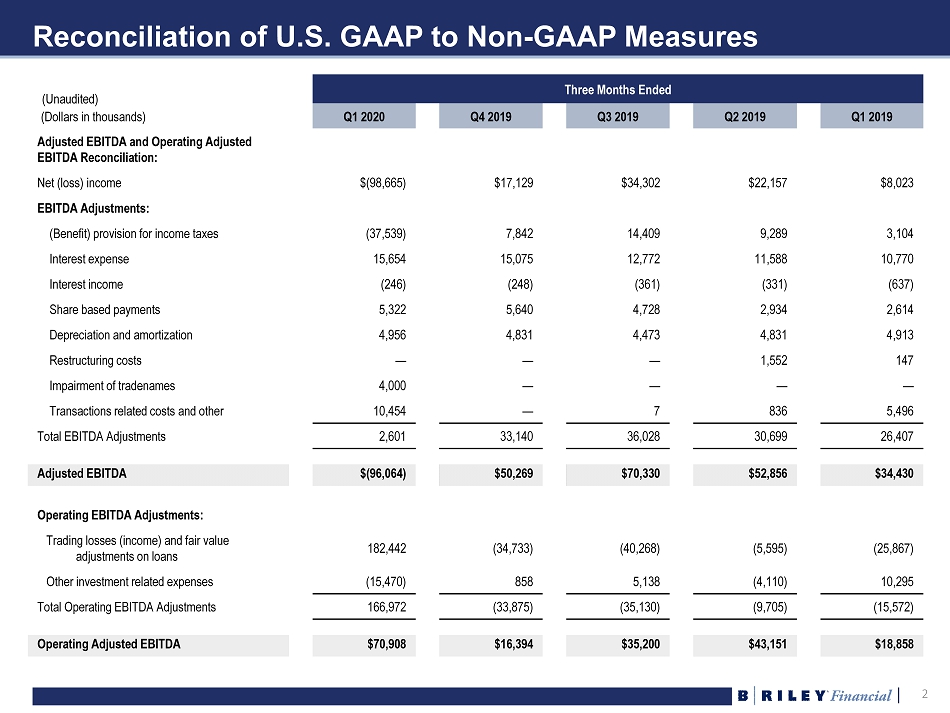
2 2 Reconciliation of U.S. GAAP to Non - GAAP Measures Three Months Ended (Dollars in thousands) Q1 2020 Q4 2019 Q3 2019 Q2 2019 Q1 2019 Adjusted EBITDA and Operating Adjusted EBITDA Reconciliation: Net (loss) income $(98,665) $17,129 $34,302 $22,157 $8,023 EBITDA Adjustments: (Benefit) provision for income taxes (37,539) 7,842 14,409 9,289 3,104 Interest expense 15,654 15,075 12,772 11,588 10,770 Interest income (246) (248) (361) (331) (637) Share based payments 5,322 5,640 4,728 2,934 2,614 Depreciation and amortization 4,956 4,831 4,473 4,831 4,913 Restructuring costs — — — 1,552 147 Impairment of tradenames 4,000 — — — — Transactions related costs and other 10,454 — 7 836 5,496 Total EBITDA Adjustments 2,601 33,140 36,028 30,699 26,407 Adjusted EBITDA $(96,064) $50,269 $70,330 $52,856 $34,430 Operating EBITDA Adjustments: Trading losses (income) and fair value adjustments on loans 182,442 (34,733) (40,268) (5,595) (25,867) Other investment related expenses (15,470) 858 5,138 (4,110) 10,295 Total Operating EBITDA Adjustments 166,972 (33,875) (35,130) (9,705) (15,572) Operating Adjusted EBITDA $70,908 $16,394 $35,200 $43,151 $18,858 (Unaudited)
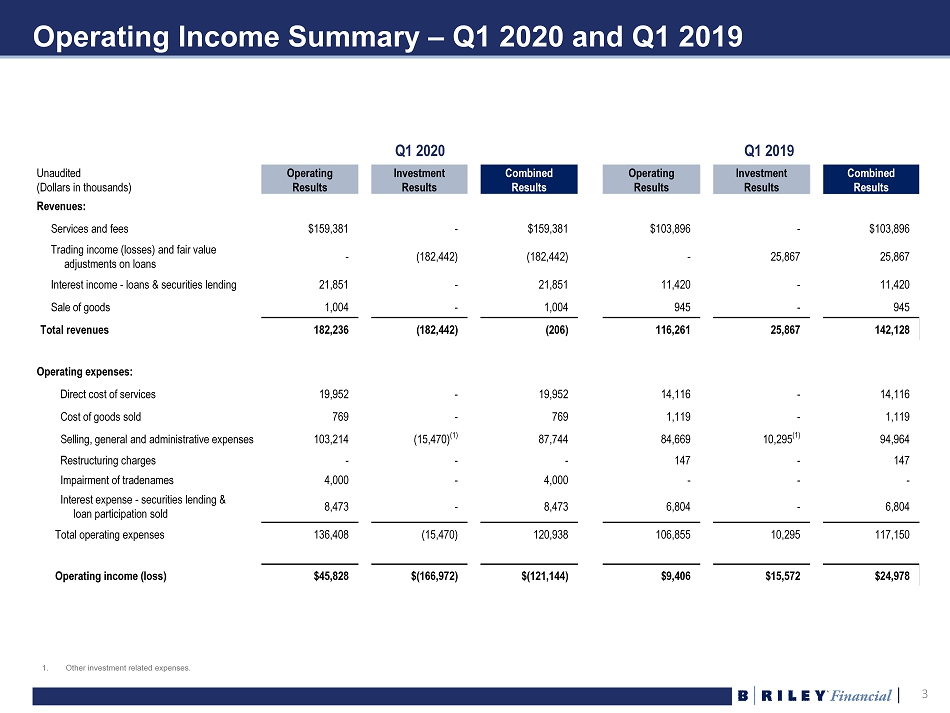
3 3 Operating Income Summary – Q1 2020 and Q1 2019 Unaudited (Dollars in thousands) Operating Results Investment Results Combined Results Operating Results Investment Results Combined Results Revenues: Services and fees $159,381 - $159,381 $103,896 - $103,896 Trading income (losses) and fair value adjustments on loans - (182,442) (182,442) - 25,867 25,867 Interest income - loans & securities lending 21,851 - 21,851 11,420 - 11,420 Sale of goods 1,004 - 1,004 945 - 945 Total revenues 182,236 (182,442) (206) 116,261 25,867 142,128 Operating expenses: Direct cost of services 19,952 - 19,952 14,116 - 14,116 Cost of goods sold 769 - 769 1,119 - 1,119 Selling, general and administrative expenses 103,214 (15,470) (1) 87,744 84,669 10,295 (1) 94,964 Restructuring charges - - - 147 - 147 Impairment of tradenames 4,000 - 4,000 - - - Interest expense - securities lending & loan participation sold 8,473 - 8,473 6,804 - 6,804 Total operating expenses 136,408 (15,470) 120,938 106,855 10,295 117,150 Operating income (loss) $45,828 $(166,972) $(121,144) $9,406 $15,572 $24,978 Q1 2020 Q1 2019 1. Other investment related expenses.
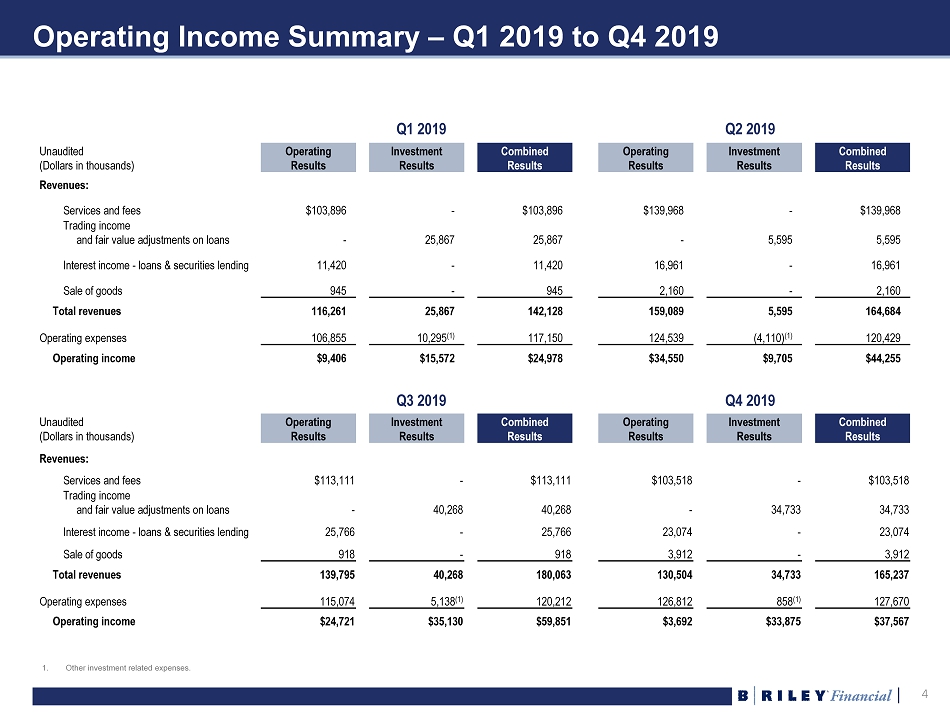
4 4 Operating Income Summary – Q1 2019 to Q4 2019 Q1 2019 Q2 2019 Unaudited (Dollars in thousands) Operating Results Investment Results Combined Results Operating Results Investment Results Combined Results Revenues: Services and fees $103,896 - $103,896 $139,968 - $139,968 Trading income and fair value adjustments on loans - 25,867 25,867 - 5,595 5,595 Interest income - loans & securities lending 11,420 - 11,420 16,961 - 16,961 Sale of goods 945 - 945 2,160 - 2,160 Total revenues 116,261 25,867 142,128 159,089 5,595 164,684 Operating expenses 106,855 10,295 (1) 117,150 124,539 (4,110) (1) 120,429 Operating income $9,406 $15,572 $24,978 $34,550 $9,705 $44,255 Unaudited (Dollars in thousands) Operating Results Investment Results Combined Results Operating Results Investment Results Combined Results Revenues: Services and fees $113,111 - $113,111 $103,518 - $103,518 Trading income and fair value adjustments on loans - 40,268 40,268 - 34,733 34,733 Interest income - loans & securities lending 25,766 - 25,766 23,074 - 23,074 Sale of goods 918 - 918 3,912 - 3,912 Total revenues 139,795 40,268 180,063 130,504 34,733 165,237 Operating expenses 115,074 5,138 (1) 120,212 126,812 858 (1) 127,670 Operating income $24,721 $35,130 $59,851 $3,692 $33,875 $37,567 Q3 2019 Q4 2019 1. Other investment related expenses.
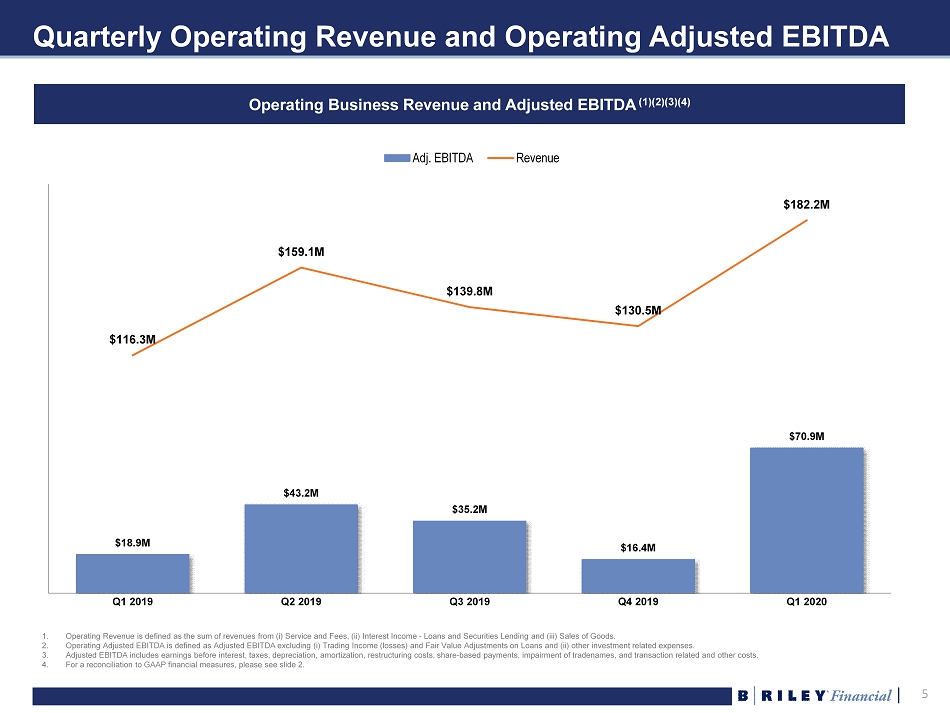
5 5 Quarterly Operating Revenue and Operating Adjusted EBITDA Operating Business Revenue and Adjusted EBITDA (1)(2)(3)(4) $18.9M $43.2M $35.2M $16.4M $70.9M $116.3M $159.1M $139.8M $130.5M $182.2M Q1 2019 Q2 2019 Q3 2019 Q4 2019 Q1 2020 Adj. EBITDA Revenue 1. Operating Revenue is defined as the sum of revenues from ( i ) Service and Fees, (ii) Interest Income - Loans and Securities Lending and (iii) Sales of Goods. 2. Operating Adjusted EBITDA is defined as Adjusted EBITDA excluding ( i ) Trading Income (losses) and Fair Value Adjustments on Loans and (ii) other investment related expenses. 3. Adjusted EBITDA includes earnings before interest, taxes, depreciation, amortization, restructuring costs, share - based payments, impairment of tradenames, and transaction related and other costs. 4. For a reconciliation to GAAP financial measures, please see slide 2.
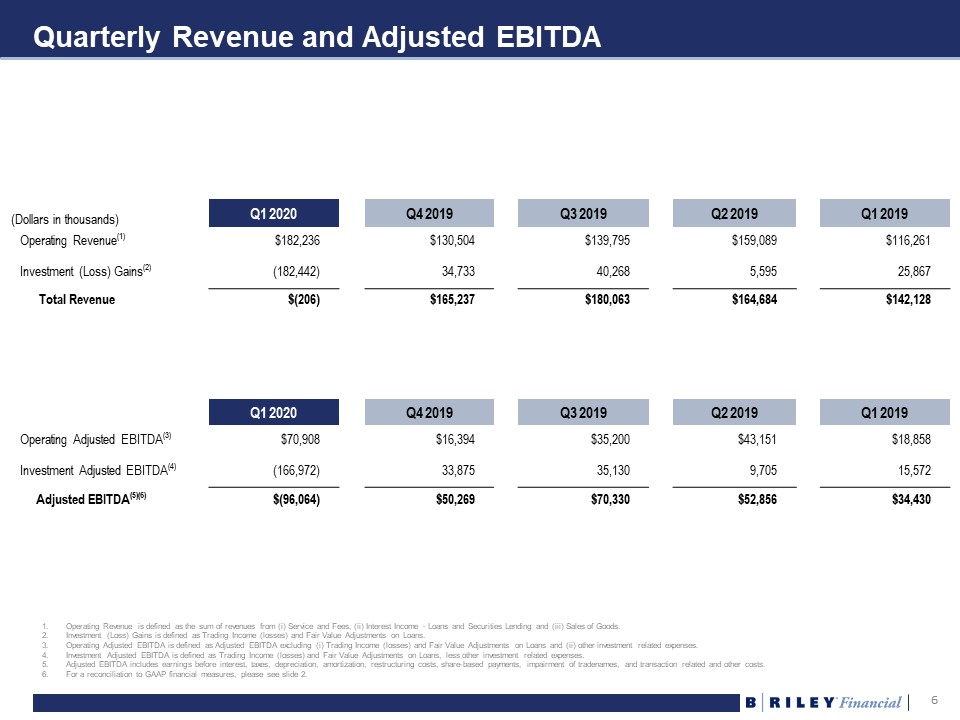
6 6 Quarterly Revenue and Adjusted EBITDA (Dollars in thousands) Q1 2020 Q4 2019 Q3 2019 Q2 2019 Q1 2019 Operating Revenue (1) $182,236 $130,504 $139,795 $159,089 $116,261 Investment (Loss) Gains (2) (182,442) 34,733 40,268 5,595 25,867 Total Revenue $(206) $165,237 $180,063 $164,684 $142,128 Q1 2020 Q4 2019 Q3 2019 Q2 2019 Q1 2019 Operating Adjusted EBITDA (3) $70,908 $16,394 $35,200 $43,151 $18,858 Investment Adjusted EBITDA (4) (166,972) 33,875 35,130 9,705 15,572 Adjusted EBITDA (5)(6) $(96,064) $50,269 $70,330 $52,856 $34,430 1. Operating Revenue is defined as the sum of revenues from ( i ) Service and Fees, (ii) Interest Income - Loans and Securities Lending and (iii) Sales of Goods. 2. Investment (Loss) Gains is defined as Trading Income (losses) and Fair Value Adjustments on Loans. 3. Operating Adjusted EBITDA is defined as Adjusted EBITDA excluding ( i ) Trading Income (losses) and Fair Value Adjustments on Loans and (ii) other investment related expenses. 4. Investment Adjusted EBITDA is defined as Trading Income (losses) and Fair Value Adjustments on Loans, less other investment r ela ted expenses. 5. Adjusted EBITDA includes earnings before interest, taxes, depreciation, amortization, restructuring costs, share - based payments, impairment of tradenames, and transaction related and other costs. 6. For a reconciliation to GAAP financial measures, please see slide 2.
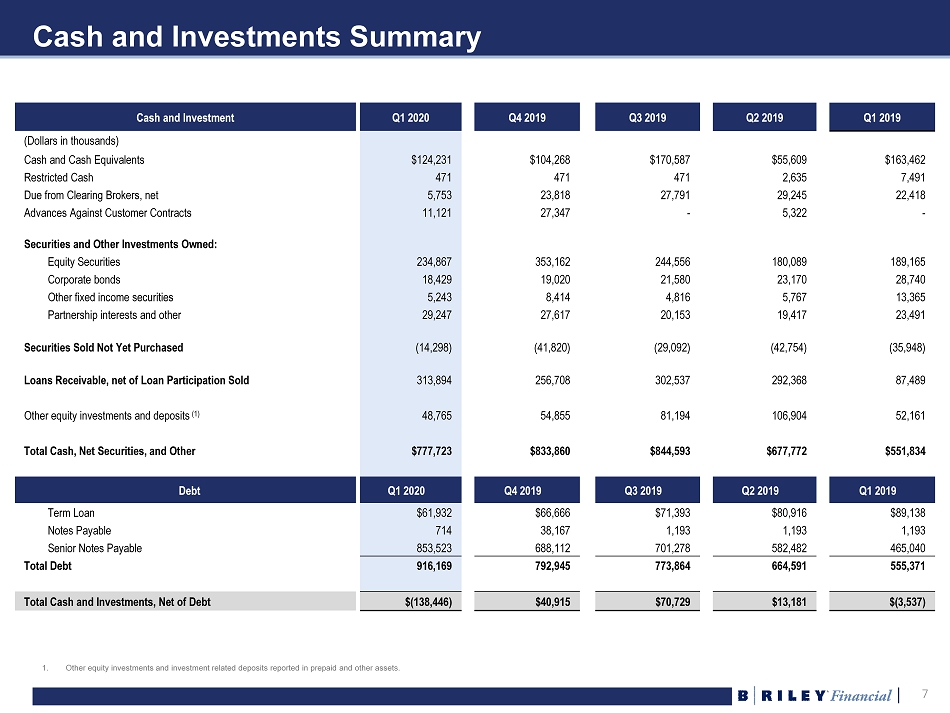
7 7 Cash and Investments Summary Cash and Investment Q1 2020 Q4 2019 Q3 2019 Q2 2019 Q1 2019 (Dollars in thousands) Cash and Cash Equivalents $124,231 $104,268 $170,587 $55,609 $163,462 Restricted Cash 471 471 471 2,635 7,491 Due from Clearing Brokers, net 5,753 23,818 27,791 29,245 22,418 Advances Against Customer Contracts 11,121 27,347 - 5,322 - Securities and Other Investments Owned: Equity Securities 234,867 353,162 244,556 180,089 189,165 Corporate bonds 18,429 19,020 21,580 23,170 28,740 Other fixed income securities 5,243 8,414 4,816 5,767 13,365 Partnership interests and other 29,247 27,617 20,153 19,417 23,491 Securities Sold Not Yet Purchased (14,298) (41,820) (29,092) (42,754) (35,948) Loans Receivable, net of Loan Participation Sold 313,894 256,708 302,537 292,368 87,489 Other equity investments and deposits (1) 48,765 54,855 81,194 106,904 52,161 Total Cash, Net Securities, and Other $777,723 $833,860 $844,593 $677,772 $551,834 Debt Q1 2020 Q4 2019 Q3 2019 Q2 2019 Q1 2019 Term Loan $61,932 $66,666 $71,393 $80,916 $89,138 Notes Payable 714 38,167 1,193 1,193 1,193 Senior Notes Payable 853,523 688,112 701,278 582,482 465,040 Total Debt 916,169 792,945 773,864 664,591 555,371 Total Cash and Investments, Net of Debt $(138,446) $40,915 $70,729 $13,181 $(3,537) 1. Other equity investments and investment related deposits reported in prepaid and other assets.
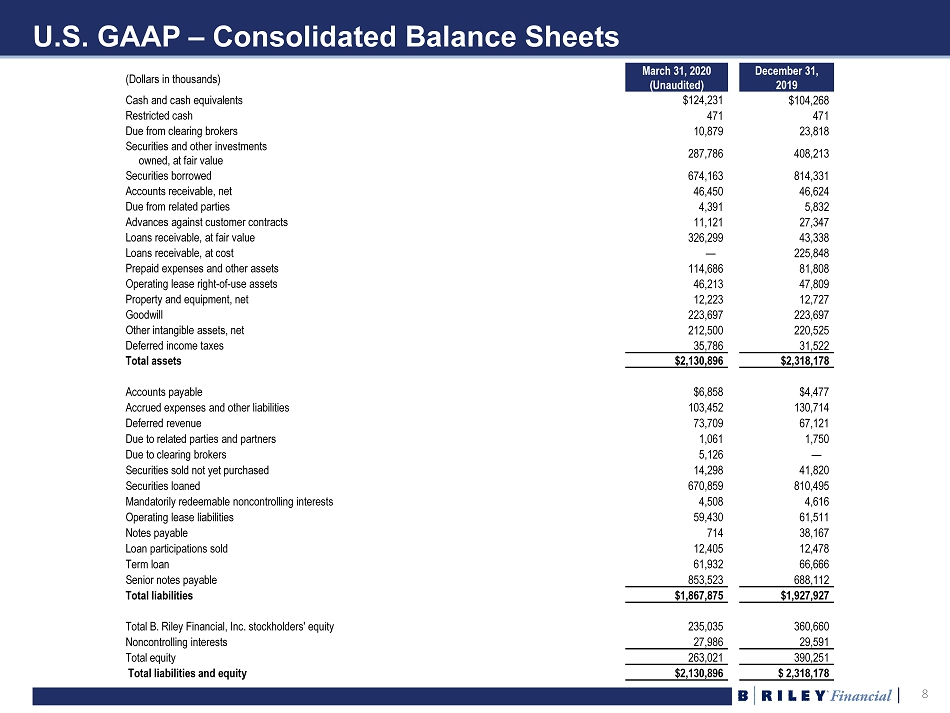
8 8 U.S. GAAP – Consolidated Balance Sheets March 31, 2020 (Unaudited) December 31, 2019 Cash and cash equivalents $124,231 $104,268 Restricted cash 471 471 Due from clearing brokers 10,879 23,818 Securities and other investments owned, at fair value 287,786 408,213 Securities borrowed 674,163 814,331 Accounts receivable, net 46,450 46,624 Due from related parties 4,391 5,832 Advances against customer contracts 11,121 27,347 Loans receivable, at fair value 326,299 43,338 Loans receivable, at cost — 225,848 Prepaid expenses and other assets 114,686 81,808 Operating lease right - of - use assets 46,213 47,809 Property and equipment, net 12,223 12,727 Goodwill 223,697 223,697 Other intangible assets, net 212,500 220,525 Deferred income taxes 35,786 31,522 Total assets $2,130,896 $2,318,178 Accounts payable $6,858 $4,477 Accrued expenses and other liabilities 103,452 130,714 Deferred revenue 73,709 67,121 Due to related parties and partners 1,061 1,750 Due to clearing brokers 5,126 — Securities sold not yet purchased 14,298 41,820 Securities loaned 670,859 810,495 Mandatorily redeemable noncontrolling interests 4,508 4,616 Operating lease liabilities 59,430 61,511 Notes payable 714 38,167 Loan participations sold 12,405 12,478 Term loan 61,932 66,666 Senior notes payable 853,523 688,112 Total liabilities $1,867,875 $1,927,927 Total B. Riley Financial, Inc. stockholders' equity 235,035 360,660 Noncontrolling interests 27,986 29,591 Total equity 263,021 390,251 Total liabilities and equity $2,130,896 $ 2,318,178 (Dollars in thousands)
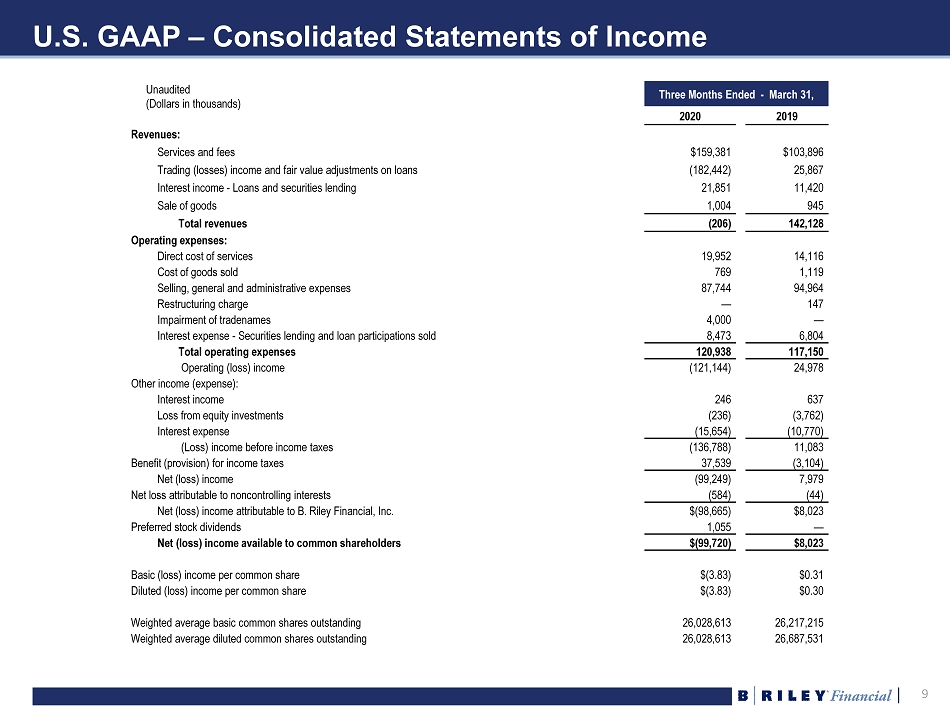
9 9 U.S. GAAP – Consolidated Statements of Income Unaudited (Dollars in thousands) Three Months Ended - March 31, 2020 2019 Revenues: Services and fees $159,381 $103,896 Trading (losses) income and fair value adjustments on loans (182,442) 25,867 Interest income - Loans and securities lending 21,851 11,420 Sale of goods 1,004 945 Total revenues ( 206) 142,128 Operating expenses: Direct cost of services 19,952 14,116 Cost of goods sold 769 1,119 Selling, general and administrative expenses 87,744 94,964 Restructuring charge — 147 Impairment of tradenames 4,000 — Interest expense - Securities lending and loan participations sold 8,473 6,804 Total operating expenses 120,938 117,150 Operating (loss) income (121,144) 24,978 Other income (expense): Interest income 246 637 Loss from equity investments (236) (3,762) Interest expense (15,654) (10,770) (Loss) income before income taxes (136,788) 11,083 Benefit (provision) for income taxes 37,539 (3,104) Net (loss) income (99,249) 7,979 Net loss attributable to noncontrolling interests (584) (44) Net (loss) income attributable to B. Riley Financial, Inc. $(98,665) $8,023 Preferred stock dividends 1,055 — Net (loss) income available to common shareholders $(99,720) $8,023 Basic (loss) income per common share $(3.83) $0.31 Diluted (loss) income per common share $(3.83) $0.30 Weighted average basic common shares outstanding 26,028,613 26,217,215 Weighted average diluted common shares outstanding 26,028,613 26,687,531
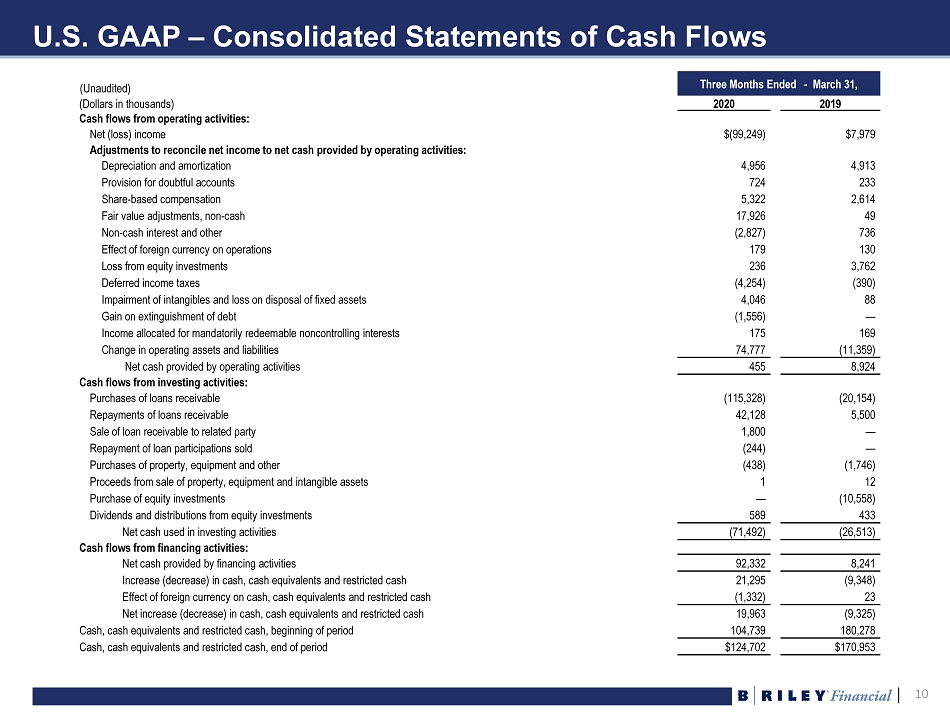
10 10 U.S. GAAP – Consolidated Statements of Cash Flows Three Months Ended - March 31, (Dollars in thousands) 2020 2019 Cash flows from operating activities: Net (loss) income $(99,249) $7,979 Adjustments to reconcile net income to net cash provided by operating activities: Depreciation and amortization 4,956 4,913 Provision for doubtful accounts 724 233 Share - based compensation 5,322 2,614 Fair value adjustments, non - cash 17,926 49 Non - cash interest and other (2,827) 736 Effect of foreign currency on operations 179 130 Loss from equity investments 236 3,762 Deferred income taxes (4,254) (390) Impairment of intangibles and loss on disposal of fixed assets 4,046 88 Gain on extinguishment of debt (1,556) — Income allocated for mandatorily redeemable noncontrolling interests 175 169 Change in operating assets and liabilities 74,777 (11,359) Net cash provided by operating activities 455 8,924 Cash flows from investing activities: Purchases of loans receivable (115,328) (20,154) Repayments of loans receivable 42,128 5,500 Sale of loan receivable to related party 1,800 — Repayment of loan participations sold (244) — Purchases of property, equipment and other (438) (1,746) Proceeds from sale of property, equipment and intangible assets 1 12 Purchase of equity investments — (10,558) Dividends and distributions from equity investments 589 433 Net cash used in investing activities (71,492) (26,513) Cash flows from financing activities: Net cash provided by financing activities 92,332 8,241 Increase (decrease) in cash, cash equivalents and restricted cash 21,295 (9,348) Effect of foreign currency on cash, cash equivalents and restricted cash (1,332) 23 Net increase (decrease) in cash, cash equivalents and restricted cash 19,963 (9,325) Cash, cash equivalents and restricted cash, beginning of period 104,739 180,278 Cash, cash equivalents and restricted cash, end of period $124,702 $170,953 (Unaudited)
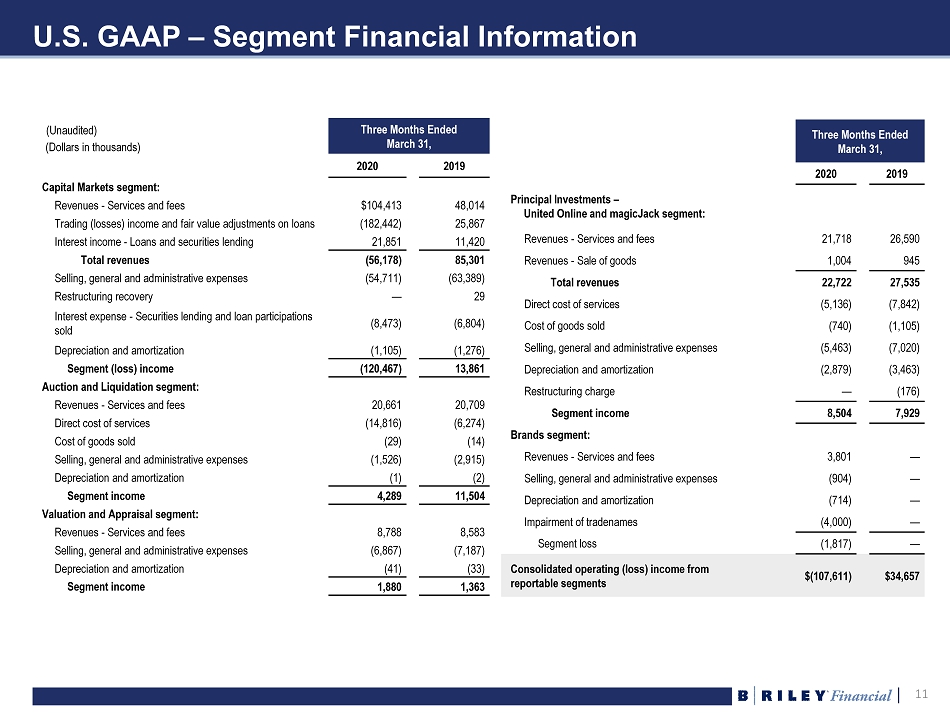
11 11 U.S. GAAP – Segment Financial Information (Dollars in thousands) Three Months Ended March 31, 2020 2019 Capital Markets segment: Revenues - Services and fees $104,413 48,014 Trading (losses) income and fair value adjustments on loans (182,442) 25,867 Interest income - Loans and securities lending 21,851 11,420 Total revenues (56,178) 85,301 Selling, general and administrative expenses (54,711) (63,389) Restructuring recovery — 29 Interest expense - Securities lending and loan participations sold (8,473) (6,804) Depreciation and amortization (1,105) (1,276) Segment (loss) income (120,467) 13,861 Auction and Liquidation segment: Revenues - Services and fees 20,661 20,709 Direct cost of services (14,816) (6,274) Cost of goods sold (29) (14) Selling, general and administrative expenses (1,526) (2,915) Depreciation and amortization (1) (2) Segment income 4,289 11,504 Valuation and Appraisal segment: Revenues - Services and fees 8,788 8,583 Selling, general and administrative expenses (6,867) (7,187) Depreciation and amortization (41) (33) Segment income 1,880 1,363 Three Months Ended March 31, 2020 2019 Principal Investments – United Online and magicJack segment: Revenues - Services and fees 21,718 26,590 Revenues - Sale of goods 1,004 945 Total revenues 22,722 27,535 Direct cost of services (5,136) (7,842) Cost of goods sold (740) (1,105) Selling, general and administrative expenses (5,463) (7,020) Depreciation and amortization (2,879) (3,463) Restructuring charge — (176) Segment income 8,504 7,929 Brands segment: Revenues - Services and fees 3,801 — Selling, general and administrative expenses (904) — Depreciation and amortization (714) — Impairment of tradenames (4,000) — Segment loss (1,817) — Consolidated operating (loss) income from reportable segments $(107,611) $34,657 (Unaudited)
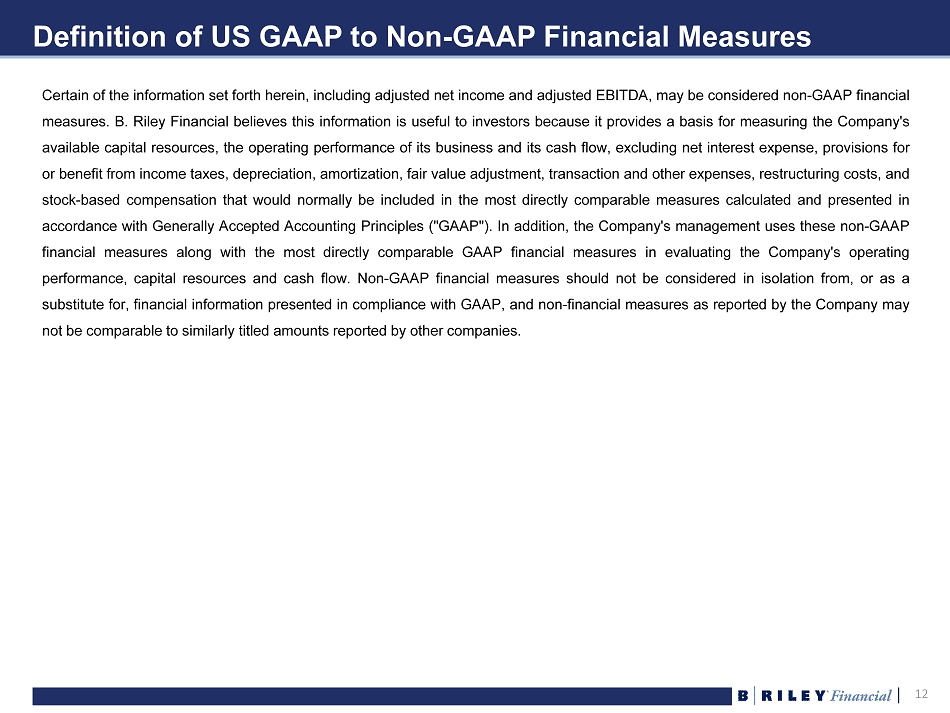
12 12 Definition of US GAAP to Non - GAAP Financial Measures Certain of the information set forth herein, including adjusted net income and adjusted EBITDA, may be considered non - GAAP financial measures . B . Riley Financial believes this information is useful to investors because it provides a basis for measuring the Company's available capital resources, the operating performance of its business and its cash flow, excluding net interest expense, provisions for or benefit from income taxes, depreciation, amortization, fair value adjustment, transaction and other expenses, restructuring costs, and stock - based compensation that would normally be included in the most directly comparable measures calculated and presented in accordance with Generally Accepted Accounting Principles ("GAAP") . In addition, the Company's management uses these non - GAAP financial measures along with the most directly comparable GAAP financial measures in evaluating the Company's operating performance, capital resources and cash flow . Non - GAAP financial measures should not be considered in isolation from, or as a substitute for, financial information presented in compliance with GAAP, and non - financial measures as reported by the Company may not be comparable to similarly titled amounts reported by other companies .