
Constellium SE 10-Q for FY2026 Q1
Constellium SE (CSTM)
10-Q
2026-04-29
For: 2026-03-31
View Original
Added on
April 29, 2026
About this 10-Q
Constellium SE filed this 10-Q on April 29, 2026, covering the quarter ended March 31, 2026 (FY2026 Q1).
Headline figures
Quarter ended March 31, 2026, as reported in this filing, compared with the same period a year earlier where the filing states it.
- Revenue
- $2.46B
- up 24.4% from $1.98B a year earlier
- Net income
- $199M
- up 437.8% from net income of $37M a year earlier
- Diluted EPS
- $1.42
- up 446.2% from $0.26 a year earlier
2026 Long Term Incentive Award Agreement Terms and Conditions Effective as from March 12, 2026
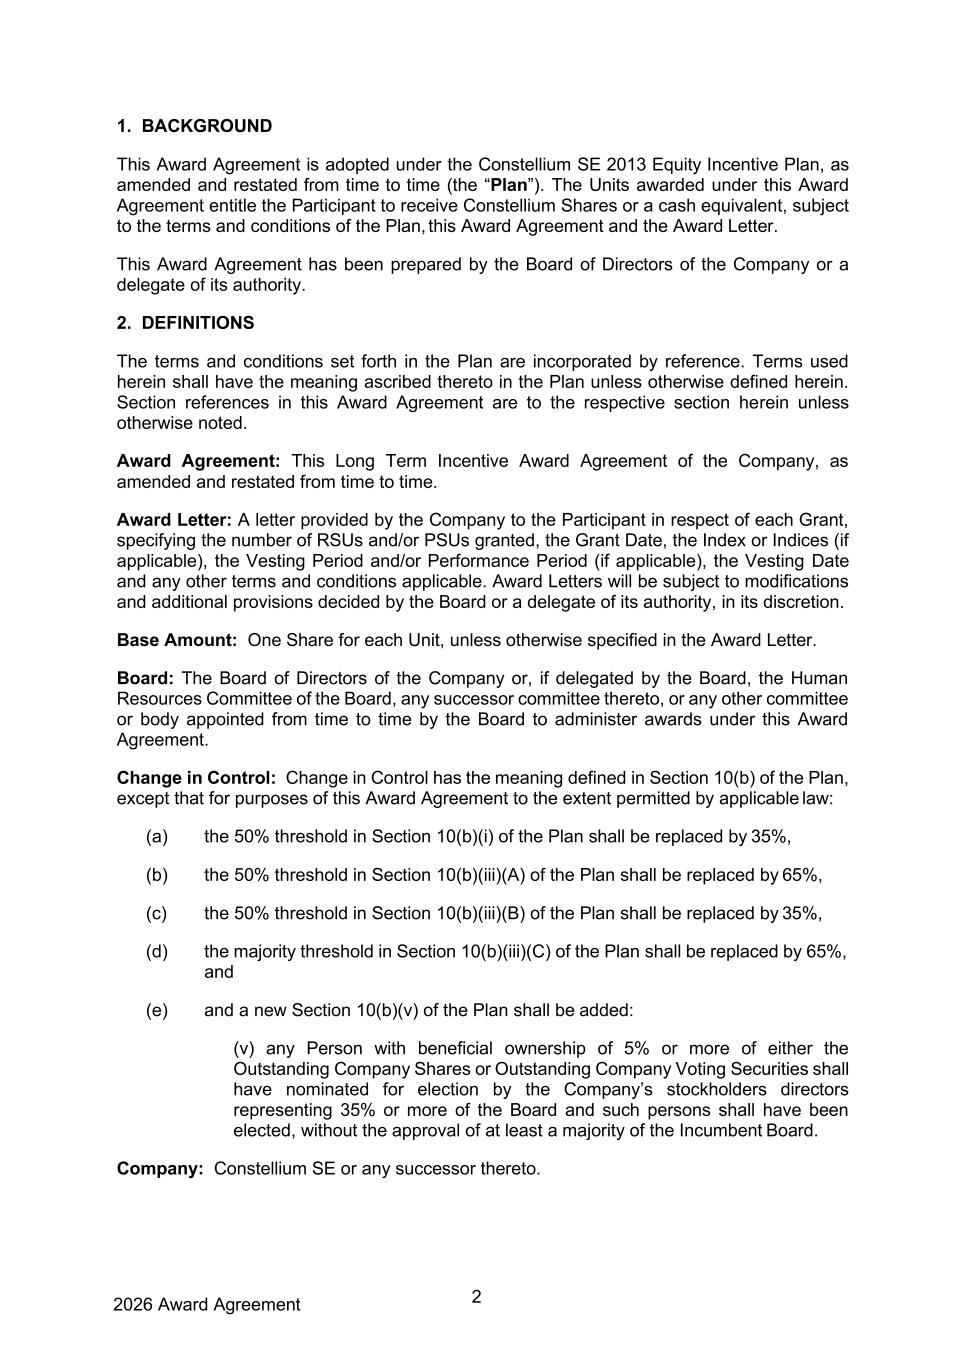
2026 Award Agreement 2 1. BACKGROUND This Award Agreement is adopted under the Constellium SE 2013 Equity Incentive Plan, as amended and restated from time to time (the “Plan”). The Units awarded under this Award Agreement entitle the Participant to receive Constellium Shares or a cash equivalent, subject to the terms and conditions of the Plan, this Award Agreement and the Award Letter. This Award Agreement has been prepared by the Board of Directors of the Company or a delegate of its authority. 2. DEFINITIONS The terms and conditions set forth in the Plan are incorporated by reference. Terms used herein shall have the meaning ascribed thereto in the Plan unless otherwise defined herein. Section references in this Award Agreement are to the respective section herein unless otherwise noted. Award Agreement: This Long Term Incentive Award Agreement of the Company, as amended and restated from time to time. Award Letter: A letter provided by the Company to the Participant in respect of each Grant, specifying the number of RSUs and/or PSUs granted, the Grant Date, the Index or Indices (if applicable), the Vesting Period and/or Performance Period (if applicable), the Vesting Date and any other terms and conditions applicable. Award Letters will be subject to modifications and additional provisions decided by the Board or a delegate of its authority, in its discretion. Base Amount: One Share for each Unit, unless otherwise specified in the Award Letter. Board: The Board of Directors of the Company or, if delegated by the Board, the Human Resources Committee of the Board, any successor committee thereto, or any other committee or body appointed from time to time by the Board to administer awards under this Award Agreement. Change in Control: Change in Control has the meaning defined in Section 10(b) of the Plan, except that for purposes of this Award Agreement to the extent permitted by applicable law: (a) the 50% threshold in Section 10(b)(i) of the Plan shall be replaced by 35%, (b) the 50% threshold in Section 10(b)(iii)(A) of the Plan shall be replaced by 65%, (c) the 50% threshold in Section 10(b)(iii)(B) of the Plan shall be replaced by 35%, (d) the majority threshold in Section 10(b)(iii)(C) of the Plan shall be replaced by 65%, and (e) and a new Section 10(b)(v) of the Plan shall be added: (v) any Person with beneficial ownership of 5% or more of either the Outstanding Company Shares or Outstanding Company Voting Securities shall have nominated for election by the Company’s stockholders directors representing 35% or more of the Board and such persons shall have been elected, without the approval of at least a majority of the Incumbent Board. Company: Constellium SE or any successor thereto.
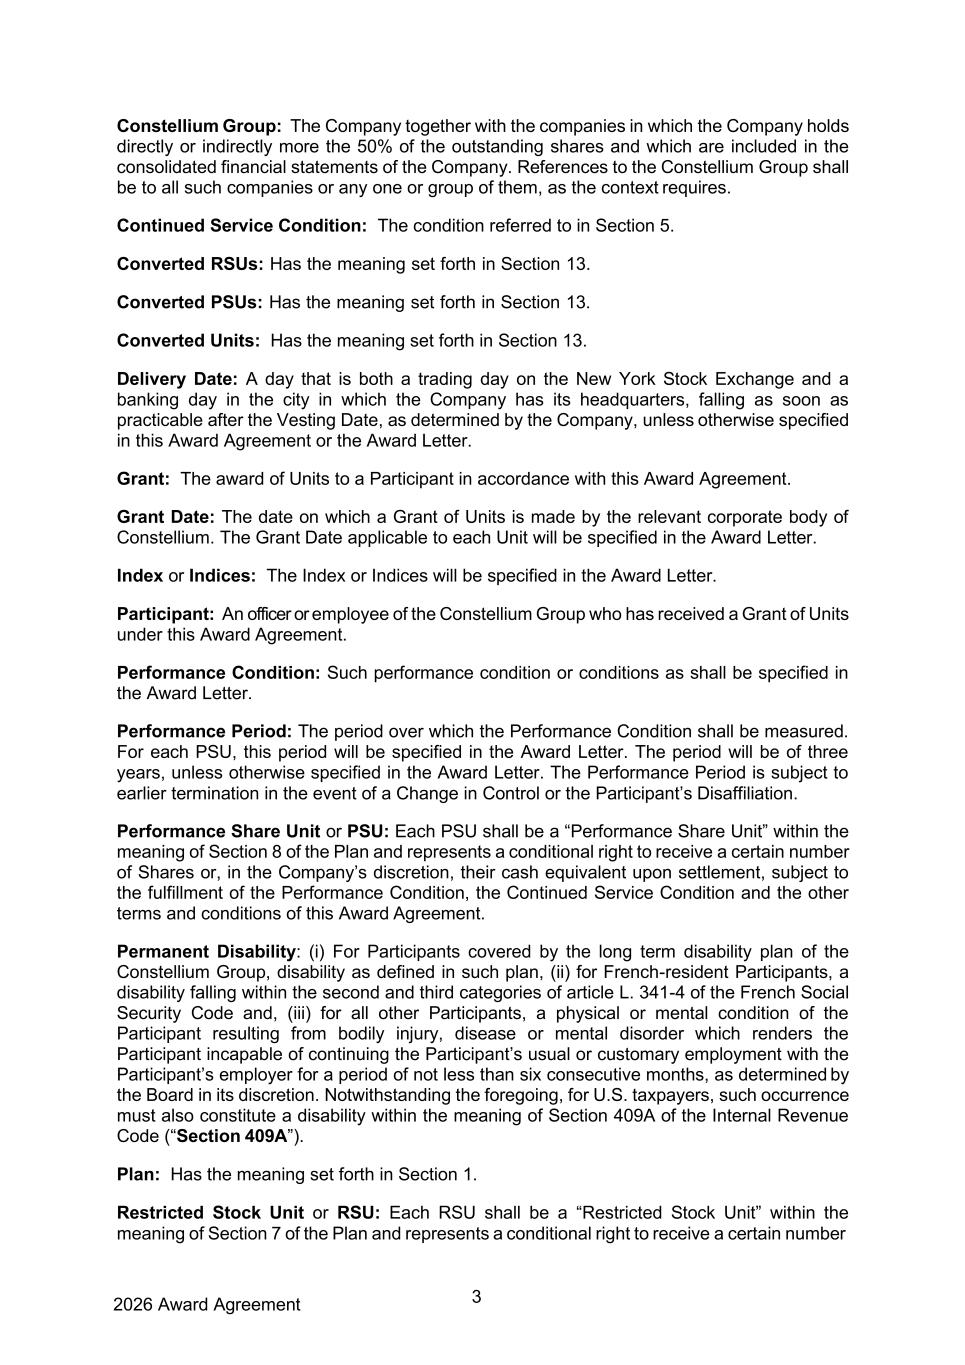
2026 Award Agreement 3 Constellium Group: The Company together with the companies in which the Company holds directly or indirectly more the 50% of the outstanding shares and which are included in the consolidated financial statements of the Company. References to the Constellium Group shall be to all such companies or any one or group of them, as the context requires. Continued Service Condition: The condition referred to in Section 5. Converted RSUs: Has the meaning set forth in Section 13. Converted PSUs: Has the meaning set forth in Section 13. Converted Units: Has the meaning set forth in Section 13. Delivery Date: A day that is both a trading day on the New York Stock Exchange and a banking day in the city in which the Company has its headquarters, falling as soon as practicable after the Vesting Date, as determined by the Company, unless otherwise specified in this Award Agreement or the Award Letter. Grant: The award of Units to a Participant in accordance with this Award Agreement. Grant Date: The date on which a Grant of Units is made by the relevant corporate body of Constellium. The Grant Date applicable to each Unit will be specified in the Award Letter. Index or Indices: The Index or Indices will be specified in the Award Letter. Participant: An officer or employee of the Constellium Group who has received a Grant of Units under this Award Agreement. Performance Condition: Such performance condition or conditions as shall be specified in the Award Letter. Performance Period: The period over which the Performance Condition shall be measured. For each PSU, this period will be specified in the Award Letter. The period will be of three years, unless otherwise specified in the Award Letter. The Performance Period is subject to earlier termination in the event of a Change in Control or the Participant’s Disaffiliation. Performance Share Unit or PSU: Each PSU shall be a “Performance Share Unit” within the meaning of Section 8 of the Plan and represents a conditional right to receive a certain number of Shares or, in the Company’s discretion, their cash equivalent upon settlement, subject to the fulfillment of the Performance Condition, the Continued Service Condition and the other terms and conditions of this Award Agreement. Permanent Disability: (i) For Participants covered by the long term disability plan of the Constellium Group, disability as defined in such plan, (ii) for French-resident Participants, a disability falling within the second and third categories of article L. 341-4 of the French Social Security Code and, (iii) for all other Participants, a physical or mental condition of the Participant resulting from bodily injury, disease or mental disorder which renders the Participant incapable of continuing the Participant’s usual or customary employment with the Participant’s employer for a period of not less than six consecutive months, as determined by the Board in its discretion. Notwithstanding the foregoing, for U.S. taxpayers, such occurrence must also constitute a disability within the meaning of Section 409A of the Internal Revenue Code (“Section 409A”). Plan: Has the meaning set forth in Section 1. Restricted Stock Unit or RSU: Each RSU shall be a “Restricted Stock Unit” within the meaning of Section 7 of the Plan and represents a conditional right to receive a certain number
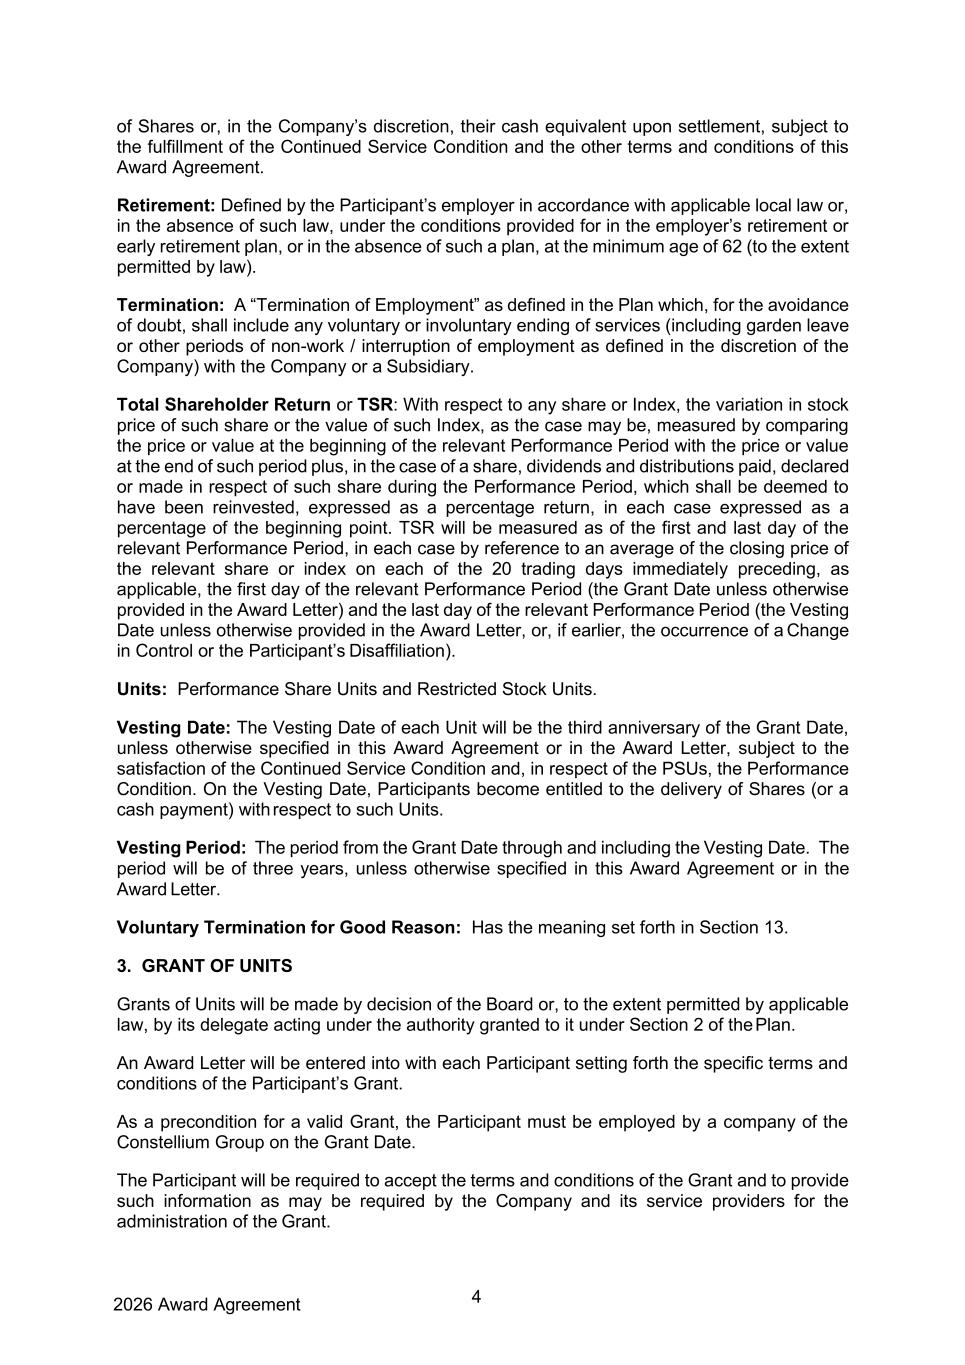
2026 Award Agreement 4 of Shares or, in the Company’s discretion, their cash equivalent upon settlement, subject to the fulfillment of the Continued Service Condition and the other terms and conditions of this Award Agreement. Retirement: Defined by the Participant’s employer in accordance with applicable local law or, in the absence of such law, under the conditions provided for in the employer’s retirement or early retirement plan, or in the absence of such a plan, at the minimum age of 62 (to the extent permitted by law). Termination: A “Termination of Employment” as defined in the Plan which, for the avoidance of doubt, shall include any voluntary or involuntary ending of services (including garden leave or other periods of non-work / interruption of employment as defined in the discretion of the Company) with the Company or a Subsidiary. Total Shareholder Return or TSR: With respect to any share or Index, the variation in stock price of such share or the value of such Index, as the case may be, measured by comparing the price or value at the beginning of the relevant Performance Period with the price or value at the end of such period plus, in the case of a share, dividends and distributions paid, declared or made in respect of such share during the Performance Period, which shall be deemed to have been reinvested, expressed as a percentage return, in each case expressed as a percentage of the beginning point. TSR will be measured as of the first and last day of the relevant Performance Period, in each case by reference to an average of the closing price of the relevant share or index on each of the 20 trading days immediately preceding, as applicable, the first day of the relevant Performance Period (the Grant Date unless otherwise provided in the Award Letter) and the last day of the relevant Performance Period (the Vesting Date unless otherwise provided in the Award Letter, or, if earlier, the occurrence of a Change in Control or the Participant’s Disaffiliation). Units: Performance Share Units and Restricted Stock Units. Vesting Date: The Vesting Date of each Unit will be the third anniversary of the Grant Date, unless otherwise specified in this Award Agreement or in the Award Letter, subject to the satisfaction of the Continued Service Condition and, in respect of the PSUs, the Performance Condition. On the Vesting Date, Participants become entitled to the delivery of Shares (or a cash payment) with respect to such Units. Vesting Period: The period from the Grant Date through and including the Vesting Date. The period will be of three years, unless otherwise specified in this Award Agreement or in the Award Letter. Voluntary Termination for Good Reason: Has the meaning set forth in Section 13. 3. GRANT OF UNITS Grants of Units will be made by decision of the Board or, to the extent permitted by applicable law, by its delegate acting under the authority granted to it under Section 2 of the Plan. An Award Letter will be entered into with each Participant setting forth the specific terms and conditions of the Participant’s Grant. As a precondition for a valid Grant, the Participant must be employed by a company of the Constellium Group on the Grant Date. The Participant will be required to accept the terms and conditions of the Grant and to provide such information as may be required by the Company and its service providers for the administration of the Grant.
2026 Award Agreement 5 4. VESTING OF UNITS The level of vesting of the Units and the resulting Share entitlement shall be determined as soon as practicable after the Vesting Date subject to the achievement of the Continued Service Condition as set forth under Section 5 and, in respect of the PSUs, based on the level of achievement of the Performance Condition as set forth under Section 6. To the extent that vesting is achieved under these conditions, the Participant will be entitled to receive Shares in the numbers determined according to such conditions. Any Units that do not vest will be cancelled without further notice, entitlement or right of indemnity. Prior to the Delivery Date, the Participant does not have any legal ownership or any other rights relating to the Shares. The Participant shall not be entitled to any dividend or have any voting rights or any other rights as a shareholder to the Shares until and unless the Shares have been transferred to the Participant or, in certain limited cases, upon vesting of the Units. If at any time any Participant forfeits any or all of such Participant’s Units, due to the Continued Service Condition or the Performance Condition not being met or otherwise, all of such Participant’s rights and interests in such Units and in Shares issuable thereunder shall terminate upon forfeiture without payment of any indemnity or consideration. 5. CONTINUED SERVICE CONDITION As a condition to the vesting of the Units, the Participant must remain an active officer or employee of the Constellium Group from the Grant Date through the Vesting Date, without Termination, unless one of the exceptions listed below shall apply. A Termination that does not result from such an exception shall result in the immediate cancellation and forfeiture of any Units of such Participant that have not previously vested, without further notice, entitlement or right of indemnity. The Continued Service Condition shall not be deemed to be breached if the Participant’s termination of office or employment within the Constellium Group results from one of the following exceptional events: (a) Permanent Disability, in which case the Participant retains the right to settlement and the original Vesting Date and conditions will continue to apply; (b) Death of the Participant, in which case outstanding Units will be settled with the Participant’s heirs or representatives (for PSUs, at the Base Amount) as soon as practicable after the date of death, constituting full and final settlement of such Units; or (c) Retirement, in which case the Participant retains the right to settlement and the original Vesting Date and conditions will continue to apply, and the number of Shares to be delivered will be prorated by multiplying (i) the number of Shares the Participant would otherwise have received for the Vesting Period by (ii) a fraction, the numerator of which is the number of full months in the period that begins with the month that contains the Grant Date and ends with (and includes) the month in which the Participant’s employment with the Constellium Group terminates due to the Participant’s Retirement, and the denominator of which is the total number of full months in the period that begins with the month that contains the Grant Date and ends with the month that contains the Vesting Date.
2026 Award Agreement 6 If the Participant’s last day of office or employment with the Constellium Group occurs before the last day of the Vesting Period for any reason other than those mentioned above, then, unless the Board or Committee determines otherwise in its sole discretion, any Units of such Participant that have not previously vested shall be immediately cancelled and forfeited without further notice, entitlement or right of indemnity. 6. PERFORMANCE CONDITION The vesting of the PSUs and the delivery of the related Shares shall be subject to the level of achievement of the Performance Condition in respect of the relevant Performance Period, as specified in the Award Letter. 7. MEASUREMENT AND CALCULATION OF ACHIEVEMENT The measurement of the achievement of the Performance Condition shall be made as soon as practicable after the end of the relevant Performance Period. The number of PSUs to be settled in Shares or the equivalent amount of cash, in case applicable, shall be calculated by the Company based on this measurement. The Company shall carry out the measurement and calculation in its discretion. The Board may in its discretion decide to amend the targets initially set and/or the composition of the list of companies referred to if it reasonably believes that changes in the business of the Company and/or any of the listed companies have had an adverse effect on their comparability for purposes of measuring the Company’s relative performance. Such changes may include a change in accounting method, a change in scope of consolidation following a merger, sale, acquisition, or the creation of a material new business entity or the discontinuation of an existing material business entity, or any other changes in circumstances that it shall deem material and pertinent. The calculation of the number of Shares to be settled shall not result in fractional Shares. The number of Shares shall be rounded to the nearest whole Share. 8. SETTLEMENT Following the Vesting Date, the Company will complete the settlement by transferring the applicable number of Shares or, in its discretion, their cash equivalent to the Participant’s brokerage or other bank account, as applicable, on the Delivery Date. Completion of settlement is dependent on the Participant’s compliance with the terms and conditions of the Plan, this Award Agreement and the relevant Award Letter and providing all necessary instructions and actions to enable the Company to facilitate the settlement. If the Participant has not performed all necessary actions to enable the Company to complete the settlement, the Company may, in its sole discretion, sell the Shares on behalf of the Participant and remit the proceeds to the Participant. The Company may, in its sole discretion, use one or more of the following instruments to settle Units: newly issued Shares, treasury Shares held by the Company, Shares purchased from the open market, or, in lieu of Shares, cash (without adjustment for change in tax or social treatment). On each Delivery Date, the Company shall pay to the Participant a cash amount equal to the product of (x) any cash dividends or other distributions (other than cash dividends or other distributions pursuant to which the Units were adjusted pursuant to Section 3(c) of the Plan or Section 13(a)), if any, paid on a Share from the Grant Date to such Delivery Date and (y) the number of Shares delivered to the Participant on such Delivery Date (including for this purpose
2026 Award Agreement 7 any Shares that would have been delivered on such Delivery Date but for being withheld to satisfy tax withholding obligations). 9. NO EFFECT ON TERMS OF EMPLOYMENT The Grant or settlement of Units and/or Shares does not constitute a term or a condition of the Participant’s office or employment with any company of the Constellium Group under applicable local laws and the rights and obligations arising from a Participant’s office or employment with the Group are separate from, and are not affected by, the Participant’s participation in this Award Agreement. The Units, the Shares or their cash equivalent do not form a part of the Participant’s salary or benefit of any kind. Nothing in this Award Agreement, any Award Letter or the Plan shall interfere with or limit in any way the right of the Company, its Subsidiaries or its Affiliates to terminate a Participant’s office or employment or service at any time, nor confer upon any Participant the right to continue in the office or employment of the Company, its Subsidiaries or its Affiliates. The Grant or settlement of Units and/or Shares does not create any right for that Participant to be offered participation in the Plan in the future or to be granted any additional Units or Shares on any particular terms or in any particular amounts. By participating in the Plan, a Participant waives all rights to compensation for any loss in relation to and in accordance with such participation, including: (a) any loss or reduction of any rights or expectations under this Award Agreement and the Award Letter in any circumstances or for any reason; (b) any exercise of a discretion or a decision taken in relation to any Units or Shares, and/or to this Award Agreement or the Award Letter, or any failure to exercise a discretion or take a decision; and (c) the operation, suspension, termination or amendment of the Plan, this Award Agreement or the Award Letter. 10. TAXES AND OTHER OBLIGATIONS The Participant is responsible for paying all personal taxes and personal social security charges associated with the Units and the Shares related thereto. This includes responsibility for any and all personal tax and personal social security charge liabilities in multiple countries, if the Participant has resided in more than one country during any period in which tax liabilities arise with respect to this Grant. Participants are advised to consult their own financial and tax advisers (at their own expense) before accepting the Grant in order to verify their tax position. Units and Shares before delivery must not be used as security for any liability, be transferred or otherwise disposed of (except in the event of the Participant’s death, to the Participant’s personal representatives) and will lapse immediately on any attempt to do so. Pursuant to applicable laws, the Constellium Group is or may be required or may deem it appropriate to withhold taxes, social security charges or fulfill employment related and other obligations upon Grant, vesting or settlement of Shares, or payment of any cash-equivalent, or when the Shares are disposed of by a Participant. The Constellium Group shall have the right to determine how such collection, withholding or other measures will be arranged or carried out, including but not limited to salary withholding, a settlement of a net amount remaining after the completion of such measures or a sale of the Shares on behalf of a Participant for the completion of such measures.
2026 Award Agreement 8 11. BREACH OF THESE TERMS AND CONDITIONS The Participant shall comply with the terms and conditions set forth in this Award Agreement and in the Award Letter, as well as any administrative instructions given by the Company regarding the same from time to time. If the Participant breaches the terms and conditions set forth in the Plan, this Award Agreement and/or in the Award Letter and/or any administrative instructions given by the Company, the Company may in its discretion, at any time prior to the Delivery Date, cancel the Grant of Units. 12. AMENDMENTS Amendments of this Award Agreement and of any Grant made hereunder shall be governed by Section 12 of the Plan. 13. RIGHTS OF PARTICIPANTS IN CORPORATE EVENTS (a) The Board may in its discretion choose to adjust the number of Shares underlying each Unit in accordance with applicable law in the event that it shall deem such adjustment to be necessary and equitable to protect the interests of the Participants following certain corporate transactions affecting the share capital of the Company. These events may include, and are not limited to, (i) capital reduction, (ii) modification of the means of sharing of profits, (iii) grants of free shares to all existing holders, (iv) a capital increase by incorporation of reserves, profits or issuance premiums, (v) distribution of reserves and (vi) any issuance of capital securities or financial instruments that give a right to the allocation of capital securities with preferential subscription rights reserved to shareholders. For the avoidance of doubt, the Company’s decision to cancel existing shares held by the Company, to grant stock or stock options to officers or employees or to issue shares to selected investors prior to the settlement of the Units will not give rise to such adjustments. (b) Subject to Section 13(d) and Section 409A, should the Company, during the Vesting Period, resolve to merge with another existing company or merge with a company to be formed, or should the Company resolve to be demerged, the Board may determine, in its sole discretion, whether the Units may be settled prior to the merger or demerger. Any settlement will be within such period as resolved by the Board. The Board may determine, in its sole discretion, whether the Units should be converted into similar equity rights issued by the other company. In such circumstances, the Board shall determine the terms and the period applicable to the vesting of such new rights. (c) This Award Agreement and the Grants made hereunder shall not in any way infringe or limit the ability of the Company to register in or transfer to another member state in the European Economic Area or to register a transfer of its domicile into another member state. Such registration or transfer shall not have any impact on the rights and obligations of the Participants under this Award Agreement and in respect of any Grant, except to the extent resulting from a change in applicable law and/or as decided by the Board in its sole discretion. (d) In the event of a Change in Control occurring before the Vesting Date, in accordance with the provisions of Section 10(b) of the Plan, as well as the definition of Change in Control under Section 2: (i) any RSUs that have not previously vested or lapsed will be converted into a cash-denominated right equal in value to (A) the number of Shares underlying such RSU immediately prior to such Change in Control multiplied by (B) the
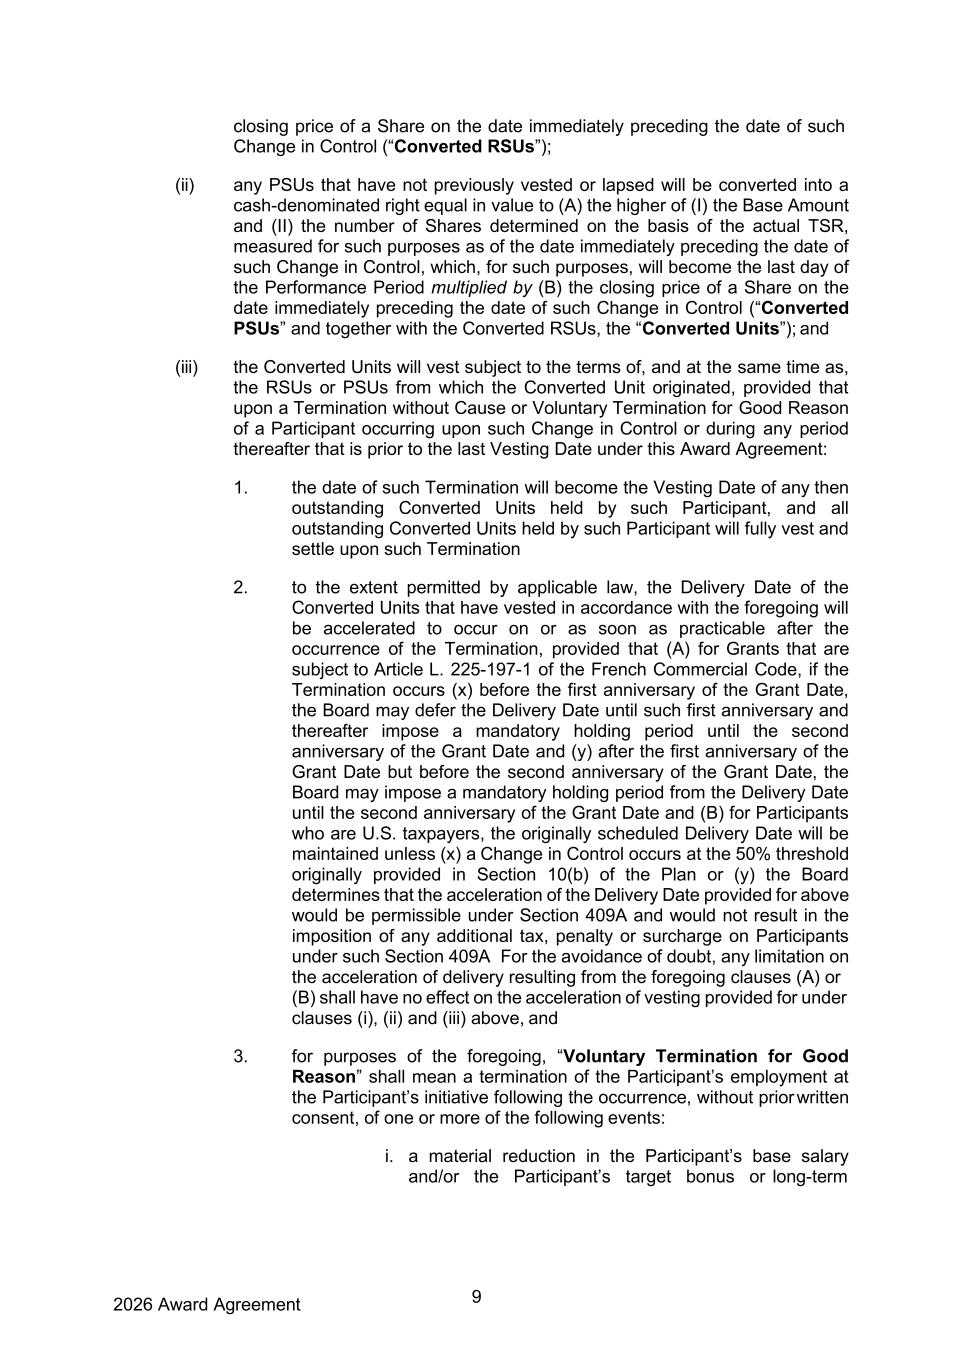
2026 Award Agreement 9 closing price of a Share on the date immediately preceding the date of such Change in Control (“Converted RSUs”); (ii) any PSUs that have not previously vested or lapsed will be converted into a cash-denominated right equal in value to (A) the higher of (I) the Base Amount and (II) the number of Shares determined on the basis of the actual TSR, measured for such purposes as of the date immediately preceding the date of such Change in Control, which, for such purposes, will become the last day of the Performance Period multiplied by (B) the closing price of a Share on the date immediately preceding the date of such Change in Control (“Converted PSUs” and together with the Converted RSUs, the “Converted Units”); and (iii) the Converted Units will vest subject to the terms of, and at the same time as, the RSUs or PSUs from which the Converted Unit originated, provided that upon a Termination without Cause or Voluntary Termination for Good Reason of a Participant occurring upon such Change in Control or during any period thereafter that is prior to the last Vesting Date under this Award Agreement: 1. the date of such Termination will become the Vesting Date of any then outstanding Converted Units held by such Participant, and all outstanding Converted Units held by such Participant will fully vest and settle upon such Termination 2. to the extent permitted by applicable law, the Delivery Date of the Converted Units that have vested in accordance with the foregoing will be accelerated to occur on or as soon as practicable after the occurrence of the Termination, provided that (A) for Grants that are subject to Article L. 225-197-1 of the French Commercial Code, if the Termination occurs (x) before the first anniversary of the Grant Date, the Board may defer the Delivery Date until such first anniversary and thereafter impose a mandatory holding period until the second anniversary of the Grant Date and (y) after the first anniversary of the Grant Date but before the second anniversary of the Grant Date, the Board may impose a mandatory holding period from the Delivery Date until the second anniversary of the Grant Date and (B) for Participants who are U.S. taxpayers, the originally scheduled Delivery Date will be maintained unless (x) a Change in Control occurs at the 50% threshold originally provided in Section 10(b) of the Plan or (y) the Board determines that the acceleration of the Delivery Date provided for above would be permissible under Section 409A and would not result in the imposition of any additional tax, penalty or surcharge on Participants under such Section 409A For the avoidance of doubt, any limitation on the acceleration of delivery resulting from the foregoing clauses (A) or (B) shall have no effect on the acceleration of vesting provided for under clauses (i), (ii) and (iii) above, and 3. for purposes of the foregoing, “Voluntary Termination for Good Reason” shall mean a termination of the Participant’s employment at the Participant’s initiative following the occurrence, without prior written consent, of one or more of the following events: i. a material reduction in the Participant’s base salary and/or the Participant’s target bonus or long-term
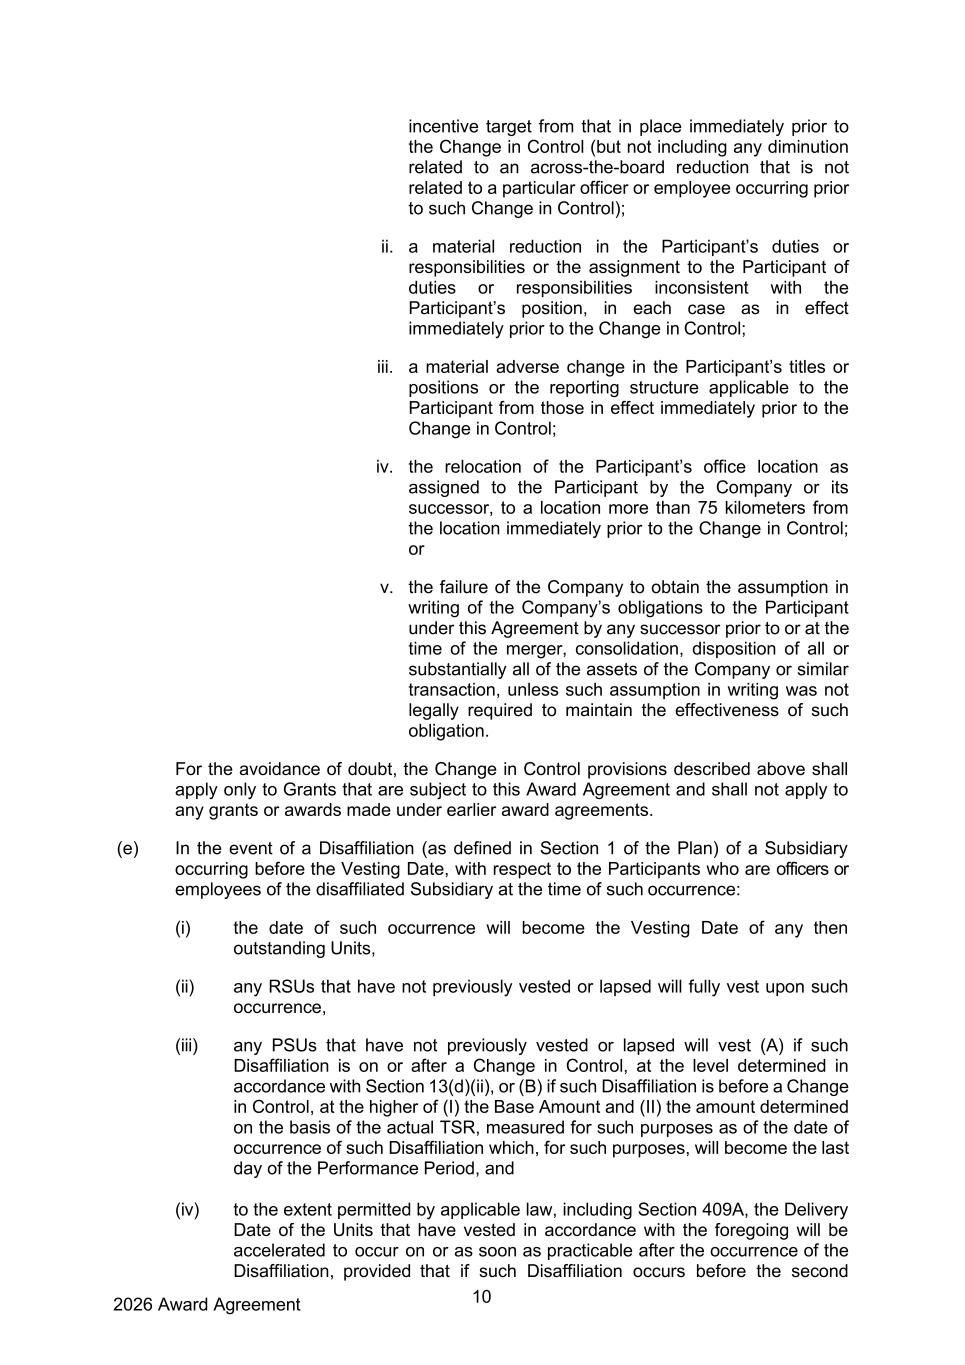
2026 Award Agreement 10 incentive target from that in place immediately prior to the Change in Control (but not including any diminution related to an across-the-board reduction that is not related to a particular officer or employee occurring prior to such Change in Control); ii. a material reduction in the Participant’s duties or responsibilities or the assignment to the Participant of duties or responsibilities inconsistent with the Participant’s position, in each case as in effect immediately prior to the Change in Control; iii. a material adverse change in the Participant’s titles or positions or the reporting structure applicable to the Participant from those in effect immediately prior to the Change in Control; iv. the relocation of the Participant’s office location as assigned to the Participant by the Company or its successor, to a location more than 75 kilometers from the location immediately prior to the Change in Control; or v. the failure of the Company to obtain the assumption in writing of the Company’s obligations to the Participant under this Agreement by any successor prior to or at the time of the merger, consolidation, disposition of all or substantially all of the assets of the Company or similar transaction, unless such assumption in writing was not legally required to maintain the effectiveness of such obligation. For the avoidance of doubt, the Change in Control provisions described above shall apply only to Grants that are subject to this Award Agreement and shall not apply to any grants or awards made under earlier award agreements. (e) In the event of a Disaffiliation (as defined in Section 1 of the Plan) of a Subsidiary occurring before the Vesting Date, with respect to the Participants who are officers or employees of the disaffiliated Subsidiary at the time of such occurrence: (i) the date of such occurrence will become the Vesting Date of any then outstanding Units, (ii) any RSUs that have not previously vested or lapsed will fully vest upon such occurrence, (iii) any PSUs that have not previously vested or lapsed will vest (A) if such Disaffiliation is on or after a Change in Control, at the level determined in accordance with Section 13(d)(ii), or (B) if such Disaffiliation is before a Change in Control, at the higher of (I) the Base Amount and (II) the amount determined on the basis of the actual TSR, measured for such purposes as of the date of occurrence of such Disaffiliation which, for such purposes, will become the last day of the Performance Period, and (iv) to the extent permitted by applicable law, including Section 409A, the Delivery Date of the Units that have vested in accordance with the foregoing will be accelerated to occur on or as soon as practicable after the occurrence of the Disaffiliation, provided that if such Disaffiliation occurs before the second
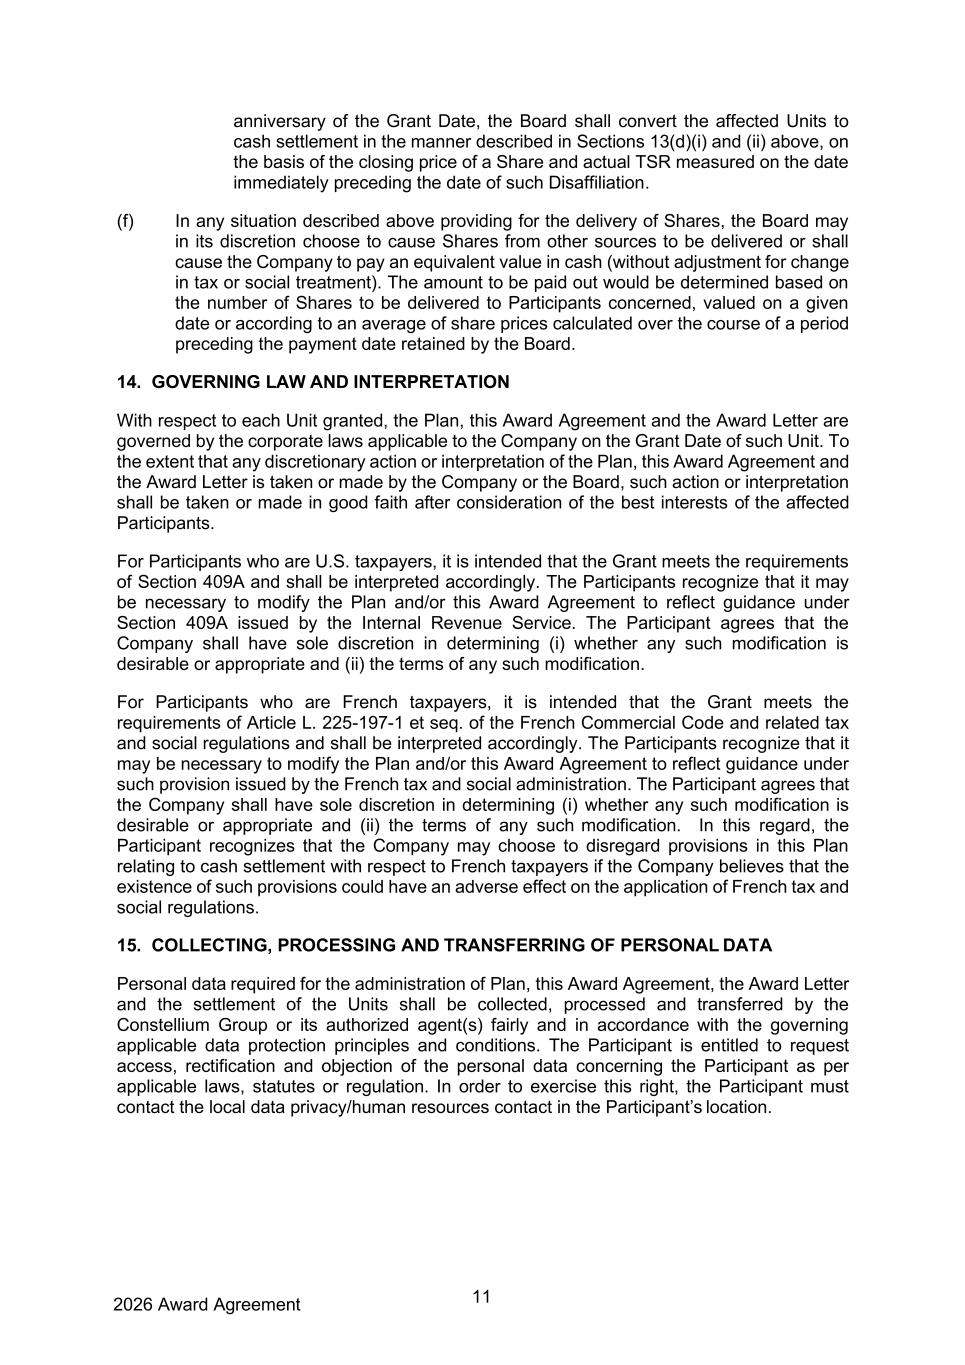
2026 Award Agreement 11 anniversary of the Grant Date, the Board shall convert the affected Units to cash settlement in the manner described in Sections 13(d)(i) and (ii) above, on the basis of the closing price of a Share and actual TSR measured on the date immediately preceding the date of such Disaffiliation. (f) In any situation described above providing for the delivery of Shares, the Board may in its discretion choose to cause Shares from other sources to be delivered or shall cause the Company to pay an equivalent value in cash (without adjustment for change in tax or social treatment). The amount to be paid out would be determined based on the number of Shares to be delivered to Participants concerned, valued on a given date or according to an average of share prices calculated over the course of a period preceding the payment date retained by the Board. 14. GOVERNING LAW AND INTERPRETATION With respect to each Unit granted, the Plan, this Award Agreement and the Award Letter are governed by the corporate laws applicable to the Company on the Grant Date of such Unit. To the extent that any discretionary action or interpretation of the Plan, this Award Agreement and the Award Letter is taken or made by the Company or the Board, such action or interpretation shall be taken or made in good faith after consideration of the best interests of the affected Participants. For Participants who are U.S. taxpayers, it is intended that the Grant meets the requirements of Section 409A and shall be interpreted accordingly. The Participants recognize that it may be necessary to modify the Plan and/or this Award Agreement to reflect guidance under Section 409A issued by the Internal Revenue Service. The Participant agrees that the Company shall have sole discretion in determining (i) whether any such modification is desirable or appropriate and (ii) the terms of any such modification. For Participants who are French taxpayers, it is intended that the Grant meets the requirements of Article L. 225-197-1 et seq. of the French Commercial Code and related tax and social regulations and shall be interpreted accordingly. The Participants recognize that it may be necessary to modify the Plan and/or this Award Agreement to reflect guidance under such provision issued by the French tax and social administration. The Participant agrees that the Company shall have sole discretion in determining (i) whether any such modification is desirable or appropriate and (ii) the terms of any such modification. In this regard, the Participant recognizes that the Company may choose to disregard provisions in this Plan relating to cash settlement with respect to French taxpayers if the Company believes that the existence of such provisions could have an adverse effect on the application of French tax and social regulations. 15. COLLECTING, PROCESSING AND TRANSFERRING OF PERSONAL DATA Personal data required for the administration of Plan, this Award Agreement, the Award Letter and the settlement of the Units shall be collected, processed and transferred by the Constellium Group or its authorized agent(s) fairly and in accordance with the governing applicable data protection principles and conditions. The Participant is entitled to request access, rectification and objection of the personal data concerning the Participant as per applicable laws, statutes or regulation. In order to exercise this right, the Participant must contact the local data privacy/human resources contact in the Participant’s location.
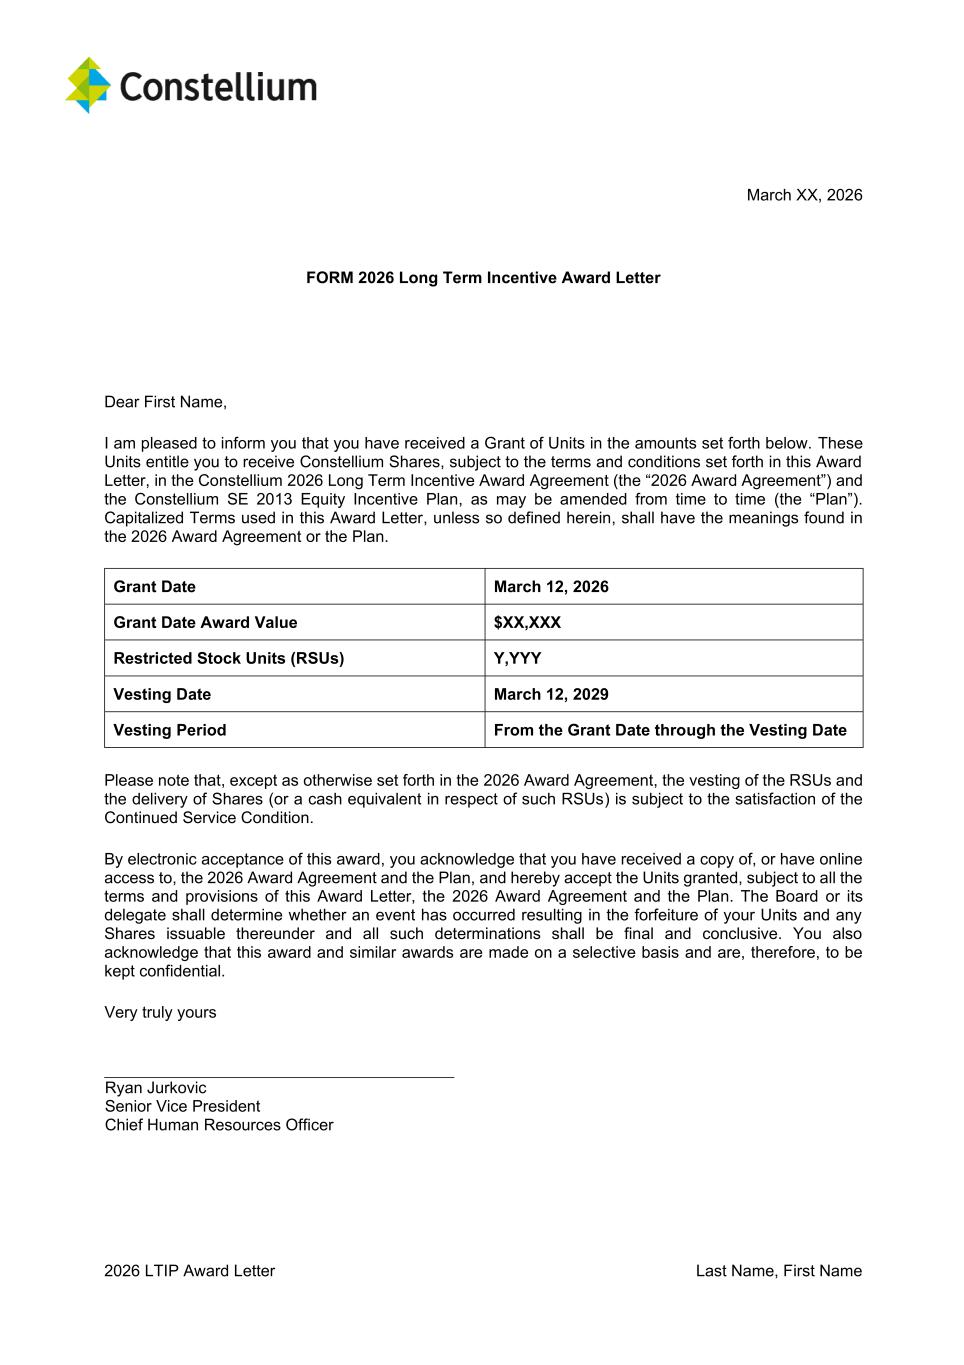
2026 LTIP Award Letter Last Name, First Name March XX, 2026 FORM 2026 Long Term Incentive Award Letter Dear First Name, I am pleased to inform you that you have received a Grant of Units in the amounts set forth below. These Units entitle you to receive Constellium Shares, subject to the terms and conditions set forth in this Award Letter, in the Constellium 2026 Long Term Incentive Award Agreement (the “2026 Award Agreement”) and the Constellium SE 2013 Equity Incentive Plan, as may be amended from time to time (the “Plan”). Capitalized Terms used in this Award Letter, unless so defined herein, shall have the meanings found in the 2026 Award Agreement or the Plan. Grant Date March 12, 2026 Grant Date Award Value $XX,XXX Restricted Stock Units (RSUs) Y,YYY Vesting Date March 12, 2029 Vesting Period From the Grant Date through the Vesting Date Please note that, except as otherwise set forth in the 2026 Award Agreement, the vesting of the RSUs and the delivery of Shares (or a cash equivalent in respect of such RSUs) is subject to the satisfaction of the Continued Service Condition. By electronic acceptance of this award, you acknowledge that you have received a copy of, or have online access to, the 2026 Award Agreement and the Plan, and hereby accept the Units granted, subject to all the terms and provisions of this Award Letter, the 2026 Award Agreement and the Plan. The Board or its delegate shall determine whether an event has occurred resulting in the forfeiture of your Units and any Shares issuable thereunder and all such determinations shall be final and conclusive. You also acknowledge that this award and similar awards are made on a selective basis and are, therefore, to be kept confidential. Very truly yours Ryan Jurkovic Senior Vice President Chief Human Resources Officer
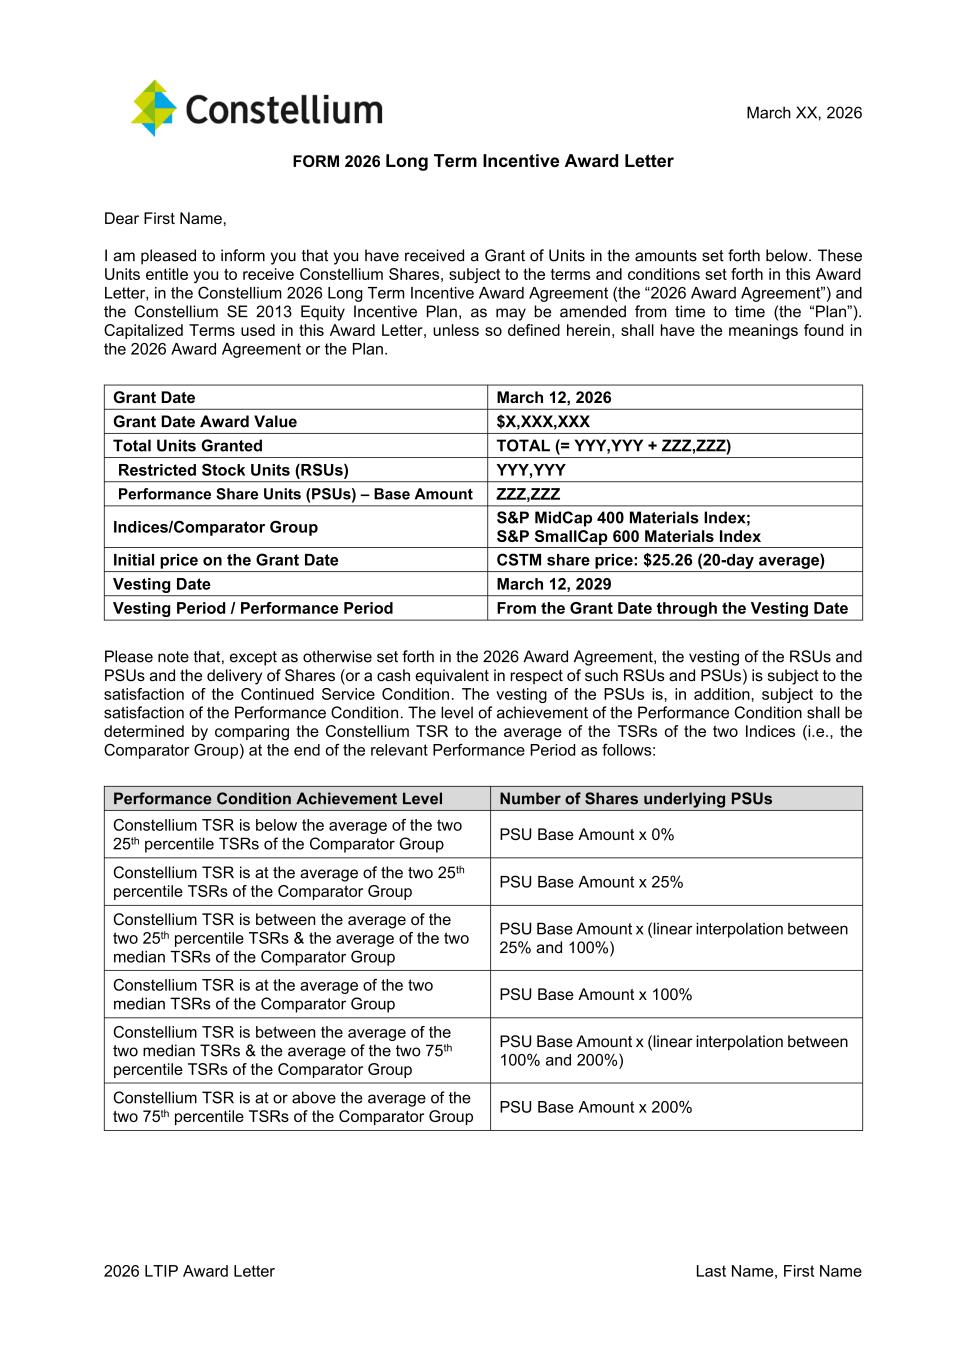
2026 LTIP Award Letter Last Name, First Name March XX, 2026 FORM 2026 Long Term Incentive Award Letter Dear First Name, I am pleased to inform you that you have received a Grant of Units in the amounts set forth below. These Units entitle you to receive Constellium Shares, subject to the terms and conditions set forth in this Award Letter, in the Constellium 2026 Long Term Incentive Award Agreement (the “2026 Award Agreement”) and the Constellium SE 2013 Equity Incentive Plan, as may be amended from time to time (the “Plan”). Capitalized Terms used in this Award Letter, unless so defined herein, shall have the meanings found in the 2026 Award Agreement or the Plan. Grant Date March 12, 2026 Grant Date Award Value $X,XXX,XXX Total Units Granted TOTAL (= YYY,YYY + ZZZ,ZZZ) Restricted Stock Units (RSUs) YYY,YYY Performance Share Units (PSUs) – Base Amount ZZZ,ZZZ Indices/Comparator Group S&P MidCap 400 Materials Index; S&P SmallCap 600 Materials Index Initial price on the Grant Date CSTM share price: $25.26 (20-day average) Vesting Date March 12, 2029 Vesting Period / Performance Period From the Grant Date through the Vesting Date Please note that, except as otherwise set forth in the 2026 Award Agreement, the vesting of the RSUs and PSUs and the delivery of Shares (or a cash equivalent in respect of such RSUs and PSUs) is subject to the satisfaction of the Continued Service Condition. The vesting of the PSUs is, in addition, subject to the satisfaction of the Performance Condition. The level of achievement of the Performance Condition shall be determined by comparing the Constellium TSR to the average of the TSRs of the two Indices (i.e., the Comparator Group) at the end of the relevant Performance Period as follows: Performance Condition Achievement Level Number of Shares underlying PSUs Constellium TSR is below the average of the two 25th percentile TSRs of the Comparator Group PSU Base Amount x 0% Constellium TSR is at the average of the two 25th percentile TSRs of the Comparator Group PSU Base Amount x 25% Constellium TSR is between the average of the two 25th percentile TSRs & the average of the two median TSRs of the Comparator Group PSU Base Amount x (linear interpolation between 25% and 100%) Constellium TSR is at the average of the two median TSRs of the Comparator Group PSU Base Amount x 100% Constellium TSR is between the average of the two median TSRs & the average of the two 75th percentile TSRs of the Comparator Group PSU Base Amount x (linear interpolation between 100% and 200%) Constellium TSR is at or above the average of the two 75th percentile TSRs of the Comparator Group PSU Base Amount x 200%
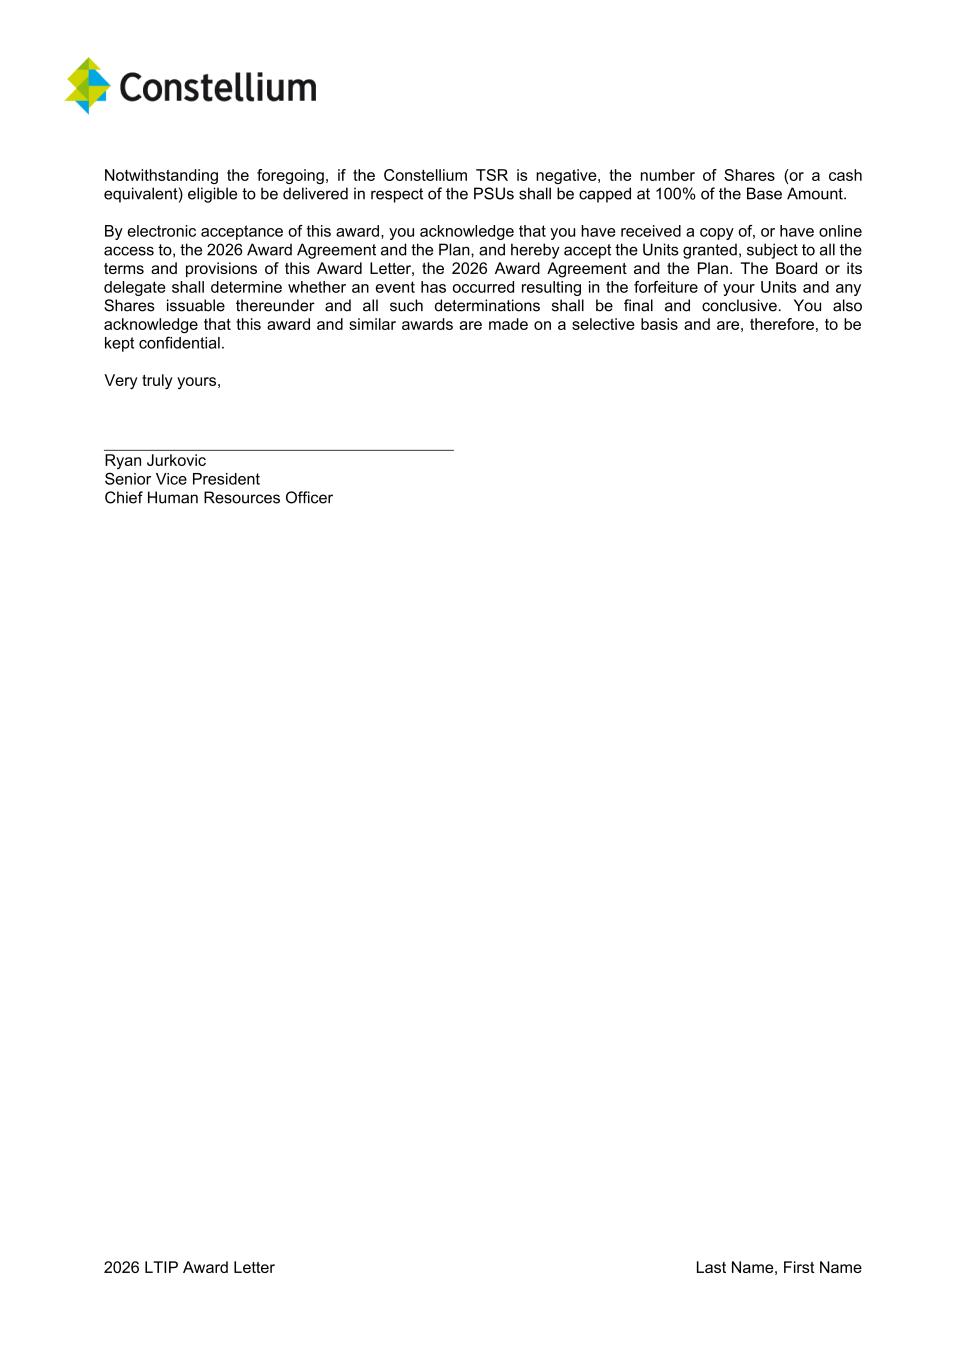
2026 LTIP Award Letter Last Name, First Name Notwithstanding the foregoing, if the Constellium TSR is negative, the number of Shares (or a cash equivalent) eligible to be delivered in respect of the PSUs shall be capped at 100% of the Base Amount. By electronic acceptance of this award, you acknowledge that you have received a copy of, or have online access to, the 2026 Award Agreement and the Plan, and hereby accept the Units granted, subject to all the terms and provisions of this Award Letter, the 2026 Award Agreement and the Plan. The Board or its delegate shall determine whether an event has occurred resulting in the forfeiture of your Units and any Shares issuable thereunder and all such determinations shall be final and conclusive. You also acknowledge that this award and similar awards are made on a selective basis and are, therefore, to be kept confidential. Very truly yours, Ryan Jurkovic Senior Vice President Chief Human Resources Officer
Exhibit 31.1
Certification by the Chief Executive Officer
Pursuant to Section 302 of the Sarbanes-Oxley Act of 2002
I, Ingrid Joerg, certify that:
1.I have reviewed this quarterly report on Form 10-Q of Constellium SE;
2.Based on my knowledge, this report does not contain any untrue statement of a material fact or omit to state a material fact necessary to make the statements made, in light of the circumstances under which such statements were made, not misleading with respect to the period covered by this report;
3.Based on my knowledge, the financial statements, and other financial information included in this report, fairly present in all material respects the financial condition, results of operations and cash flows of the registrant as of, and for, the periods presented in this report;
4.The registrant’s other certifying officer and I are responsible for establishing and maintaining disclosure controls and procedures (as defined in Exchange Act Rules 13a-15(e) and 15d-15(e)) and internal control over financial reporting (as defined in Exchange Act Rules 13a-15(f) and 15d-15(f)) for the registrant and have:
(a)Designed such disclosure controls and procedures, or caused such disclosure controls and procedures to be designed under our supervision, to ensure that material information relating to the registrant, including its consolidated subsidiaries, is made known to us by others within those entities, particularly during the period in which this report is being prepared;
(b)Designed such internal control over financial reporting, or caused such internal control over financial reporting to be designed under our supervision, to provide reasonable assurance regarding the reliability of financial reporting and the preparation of financial statements for external purposes in accordance with generally accepted accounting principles;
(c)Evaluated the effectiveness of the registrant’s disclosure controls and procedures and presented in this report our conclusions about the effectiveness of the disclosure controls and procedures, as of the end of the period covered by this report based on such evaluation; and
(d)Disclosed in this report any change in the registrant’s internal control over financial reporting that occurred during the registrant’s most recent fiscal quarter (the registrant’s fourth fiscal quarter in the case of an annual report) that has materially affected, or is reasonably likely to materially affect, the registrant’s internal control over financial reporting; and
5.The registrant’s other certifying officer and I have disclosed, based on our most recent evaluation of internal control over financial reporting, to the registrant’s auditors and the audit committee of the registrant’s board of directors (or persons performing the equivalent functions):
(a)All significant deficiencies and material weaknesses in the design or operation of internal control over financial reporting which are reasonably likely to adversely affect the registrant’s ability to record, process, summarize and report financial information; and
(b)Any fraud, whether or not material, that involves management or other employees who have a significant role in the registrant’s internal control over financial reporting.
Date: | April 29, 2026 | By: | /s/ Ingrid Joerg | ||||||||
Name: Ingrid Joerg | |||||||||||
Title: Chief Executive Officer | |||||||||||
Exhibit 31.2
Certification by the Chief Financial Officer
Pursuant to Section 302 of the Sarbanes-Oxley Act of 2002
I, Jack Guo, certify that:
1.I have reviewed this quarterly report on Form 10-Q of Constellium SE;
2.Based on my knowledge, this report does not contain any untrue statement of a material fact or omit to state a material fact necessary to make the statements made, in light of the circumstances under which such statements were made, not misleading with respect to the period covered by this report;
3.Based on my knowledge, the financial statements, and other financial information included in this report, fairly present in all material respects the financial condition, results of operations and cash flows of the registrant as of, and for, the periods presented in this report;
4.The registrant’s other certifying officer and I are responsible for establishing and maintaining disclosure controls and procedures (as defined in Exchange Act Rules 13a-15(e) and 15d-15(e)) and internal control over financial reporting (as defined in Exchange Act Rules 13a-15(f) and 15d-15(f)) for the registrant and have:
(a)Designed such disclosure controls and procedures, or caused such disclosure controls and procedures to be designed under our supervision, to ensure that material information relating to the registrant, including its consolidated subsidiaries, is made known to us by others within those entities, particularly during the period in which this report is being prepared;
(b)Designed such internal control over financial reporting, or caused such internal control over financial reporting to be designed under our supervision, to provide reasonable assurance regarding the reliability of financial reporting and the preparation of financial statements for external purposes in accordance with generally accepted accounting principles;
(c)Evaluated the effectiveness of the registrant’s disclosure controls and procedures and presented in this report our conclusions about the effectiveness of the disclosure controls and procedures, as of the end of the period covered by this report based on such evaluation; and
(d)Disclosed in this report any change in the registrant’s internal control over financial reporting that occurred during the registrant’s most recent fiscal quarter (the registrant’s fourth fiscal quarter in the case of an annual report) that has materially affected, or is reasonably likely to materially affect, the registrant’s internal control over financial reporting; and
5.The registrant’s other certifying officer and I have disclosed, based on our most recent evaluation of internal control over financial reporting, to the registrant’s auditors and the audit committee of the registrant’s board of directors (or persons performing the equivalent functions):
(a)All significant deficiencies and material weaknesses in the design or operation of internal control over financial reporting which are reasonably likely to adversely affect the registrant’s ability to record, process, summarize and report financial information; and
(b)Any fraud, whether or not material, that involves management or other employees who have a significant role in the registrant’s internal control over financial reporting.
Date: | April 29, 2026 | By: | /s/ Jack Guo | ||||||||
Name: Jack Guo | |||||||||||
Title: Executive Vice President and Chief Financial Officer | |||||||||||
Exhibit 32.1
Certification by the Chief Executive Officer
Pursuant to Section 906 of the Sarbanes-Oxley Act of 2002
In connection with the quarterly report of Constellium SE (the “Company”) on Form 10-Q for the period ended March 31, 2026, as filed with the Securities and Exchange Commission on the date hereof (the “Quarterly Report”), I, Ingrid Joerg, Chief Executive Officer of the Company, certify pursuant to 18 U.S.C. Section 1350, as adopted pursuant to Section 906 of the Sarbanes-Oxley Act of 2002, that to my knowledge:
(1)The Quarterly Report fully complies with the requirements of Section 13(a) or 15(d) of the Securities Exchange Act of 1934; and
(2)The information contained in the Quarterly Report fairly presents, in all material respects, the financial condition and results of operations of the Company.
Date: | April 29, 2026 | By: | /s/ Ingrid Joerg | ||||||||
Name: Ingrid Joerg | |||||||||||
Title: Chief Executive Officer | |||||||||||
Exhibit 32.2
Certification of the Chief Financial Officer
Pursuant to Section 906 of the Sarbanes-Oxley Act of 2002
In connection with the quarterly report of Constellium SE (the “Company”) on Form 10-Q for the period ended March 31, 2026, as filed with the Securities and Exchange Commission on the date hereof (the “Quarterly Report”), I, Jack Guo, Chief Financial Officer of the Company, certify pursuant to 18 U.S.C. Section 1350, as adopted pursuant to Section 906 of the Sarbanes-Oxley Act of 2002, that to my knowledge:
(1)The Quarterly Report fully complies with the requirements of Section 13(a) or 15(d) of the Securities Exchange Act of 1934; and
(2)The information contained in the Quarterly Report fairly presents, in all material respects, the financial condition and results of operations of the Company.
Date: | April 29, 2026 | By: | /s/ Jack Guo | ||||||||
Name: Jack Guo | |||||||||||
Title: Executive Vice President and Chief Financial Officer | |||||||||||