Operator
Good morning, and welcome to the Synchrony Financial First Quarter 2026 Earnings Conference Call. Please refer to the company's Investor Relations website for access to their earnings materials. Please be advised that today's conference call is being recorded. Currently, all callers have been placed in a listen-only mode. The call will be open for your questions following the conclusion of management's prepared remarks. If at any time you should need operator assistance, please press star zero. If you wish to ask a question following the prepared remarks, please press star 1. I will now turn the call over to Catherine Miller, Senior Vice President of Investor Relations. Thank you. You may begin.
Thank you and good morning, everyone.
Welcome to our quarterly earnings conference call.
In addition to today's press release, we have provided a presentation that covers the topics we plan to address during our call. call. The press release, detailed financial schedules, and presentation are available on our website, SynchronyFinancial.com. This information can be accessed by going to the Investor Relations section of the website. Before we get started, I wanted to remind you that our comments today will include forward-looking statements. These statements are subject to risks and uncertainty, and actual results can differ materially. We list the factors that might cause actual results to differ materially in our SEC filings, which are available on our website. During the call, we will refer to non-GAAP financial measures in discussing the company's performance. You can find a reconciliation of these measures to GAAP financial measures in our materials for today's call. Finally, Synchrony Financial is not responsible for and does not edit or guarantee the accuracy of our earnings teleconference transcripts provided by third parties. The only authorized webcasts are located on our website. On the call this morning are Brian Doubles, Synchrony's President and Chief Executive Officer, and Brian Wenzel, Executive Vice President and Chief Financial Officer. I will now turn the call over to Brian Devils.
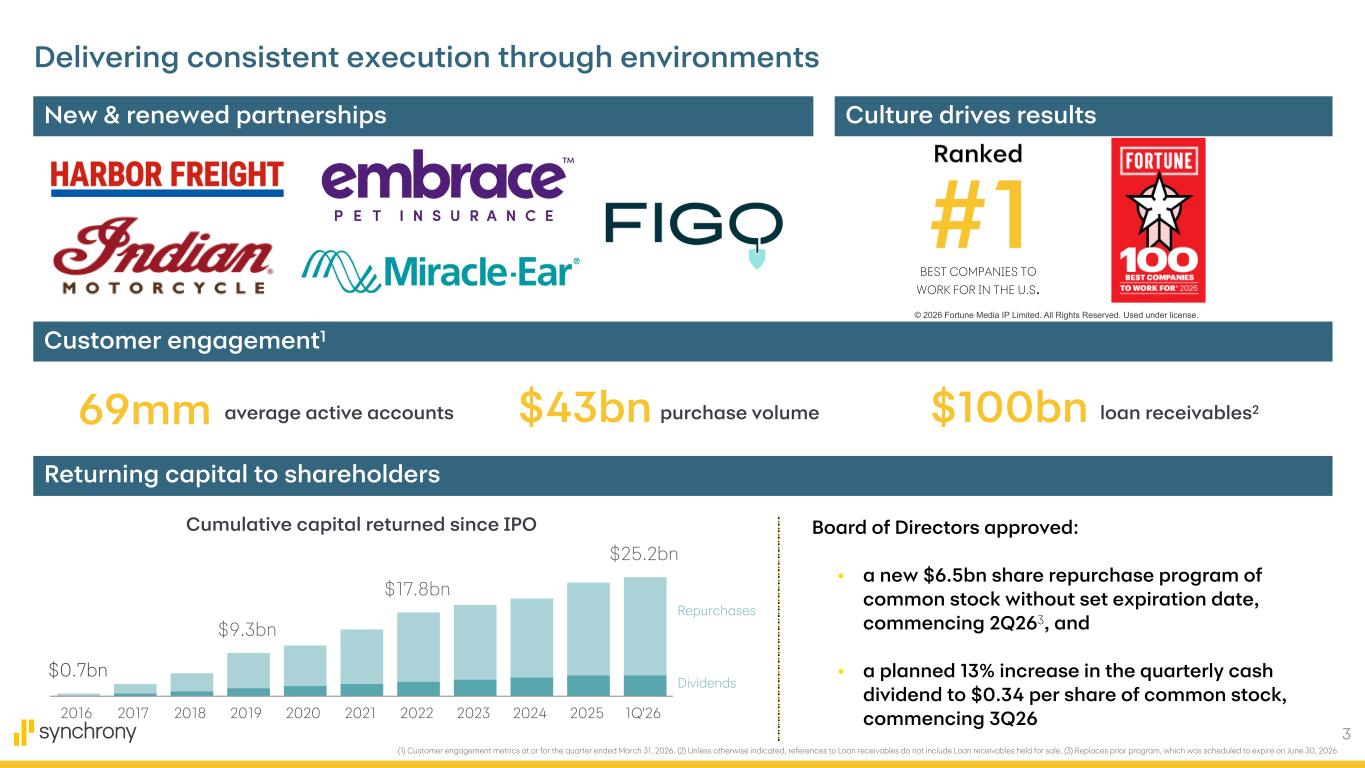
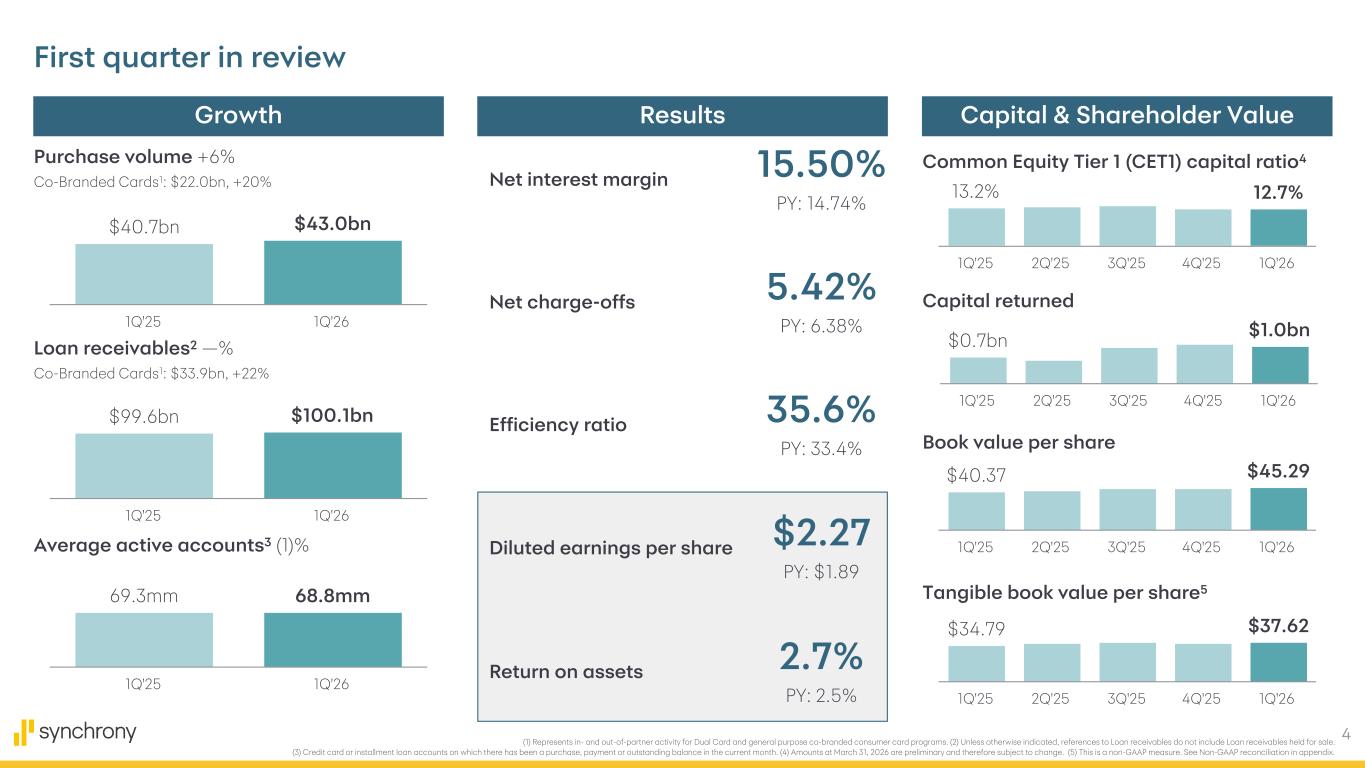
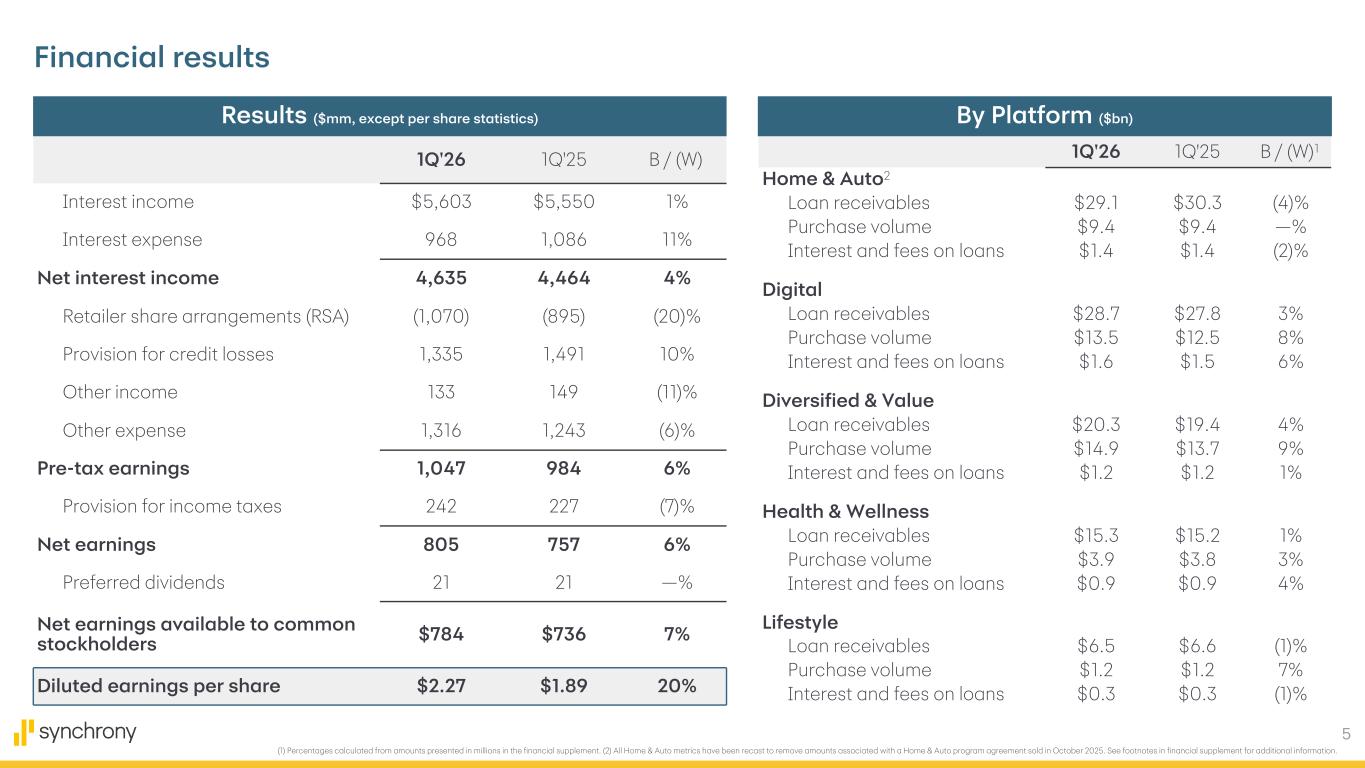
Thanks, Catherine, and good morning, everyone. Synchrony started the year with strong momentum and delivered first quarter financial results that included a record first quarter purchase volume of $43 billion, reflecting the enduring appeal of Synchrony's multi-product suite. customers engaged across our diversified portfolio contributing to continued sequential improvement in average active account trends higher spend per account across all five platforms and six percent growth in total portfolio purchase volume compared to last year at the platform level diversified and valued purchase volume grew nine percent primarily reflecting the impact of partner expansion digital platform purchase volume increased eight percent driven by strong customer response to enhance product offerings and refresh value propositions purchase volume and lifestyle increased seven percent primarily driven by other apparel and goods and luxury partially offset by lower average active accounts health and wellness purchase volume was three percent higher primarily reflecting growth in pet and audiology and purchase volume in home and auto is flat generally reflecting partner expansion and furniture and electronics offset by selective spend and home improvement and lower average active accounts synchrony's co-branded credit cards including our dual cards accounted for 51 of our total purchase volume in the first quarter and increased 20 versus last year driven by product upgrades higher broad-based spend and enhanced utility across these card programs. The mix of discretionary spend within our out-of-partner portfolio increased during the first quarter, making the third consecutive quarter of year-on-year improvement. Additionally, the rate of discretionary spend growth continued to accelerate, outpacing non-discretionary spend growth also for the third consecutive quarter, and even during the month of March when fuel prices began to rise. This discretionary spend strength came, in particular, from categories like retail, entertainment, and electronics. And while spending on fuel was up significantly during March in our non-discretionary spend, total portfolio spend per account growth remained strong as consumers navigated the higher costs. Meanwhile, payment rate increased approximately 50 basis points compared to last year. collectively we believe these spend and payment trends are a testament to the efficacy of our prior credit actions and consistent credit discipline as well as resilient consumer health supported by some early benefit from increased tax refunds and lower tax withholdings synchrony continue to execute across our key strategic priorities during the first quarter adding or renewing more than 15 partners including indian motorcycle Harbor Freight, and Miracle Air. We renewed our partnership with Indian Motorcycle, America's first motorcycle company founded in 1901 to offer flexible financing solutions through their nationwide dealer network. We also extended our relationship with Harbor Freight, America's number one tool store with nearly 50 years in business and more than 1,600 locations nationwide, to provide private label credit card financing with the option of 5% back, for zero-interest, equal-payment installment loans. And our program with Miracle Ear enables patients to pay for hearing devices and related services over time, leveraging practice management software that optimizes the financing experience for both consumers and staff. Synchrony also continued to broaden distribution of care credit financing during the first quarter through our expanded strategic partnerships with Planet DDS. As the preferred patient financing solution across all Planet DDS practice management platforms, CareCredit will be integrated across more than 2,500 cloud nine orthodontic practices and more than 15,000 Denicon dental practices to improve patient access to treatment while also supporting practice growth, operational efficiency, and better patient outcomes. And we're also delivering streamlined CareCredit experiences for pet families through our new partnership with both Figo and Embrace Pet Insurance. Today, consumers can use care credit at approximately 85% of U.S. vet locations, and now approved pet insurance claims can be reimbursed directly as a credit to the consumer's care credit account after they pay for their pet's care using their care credit card. These partnerships extend care credit's pet insurance reimbursement ecosystem to more than 1.7 million insured pets and underscore the larger opportunity we have through our strategic partnership with independence pet holdings together we are making it easier for consumers to pay for and manage the cost of pet care and lastly we continued to enhance the utility of care credit by broadening its acceptance for eligible health and wellness purchases on walmart.com complementing care credits long-standing acceptance in store across Walmart and fans club locations nationwide in addition to currently eligible health and wellness purchases, CareCredit cardholders can now use their card to make purchases across a wider selection of in-store and online product categories, including medical supplies and equipment, fitness products, and sleep essentials. This expanded collaboration with Walmart will enable us to empower more consumers with financial flexibility to purchase health and wellness products and services whenever and however the need arises. And as we look to the remainder of the year ahead, Synchrony is positioned to drive our momentum further as we grow our existing partner programs and win new ones, diversify our programs, products, and markets to reach and serve more consumers and more businesses across the country, empower best-in-class experiences for all those we serve. I am proud to say that we are doing all of this while also earning the privilege of being ranked as the number one best company to work for in the U.S. by Fortune Magazine and Great Place to Work in 2026. Together, all of our incredible people at Synchrony have built a high-trust culture that makes us faster, bolder, and better for the customers and partners who count on us every single day.
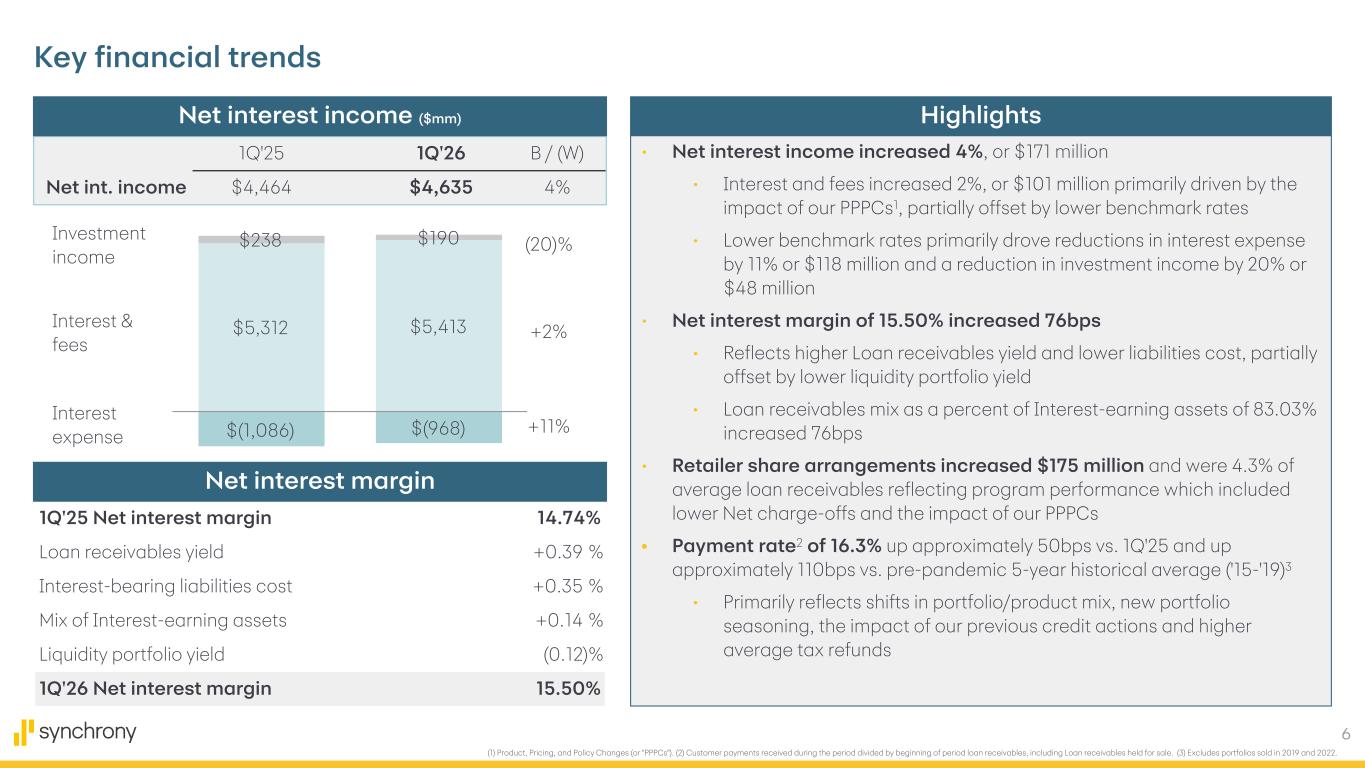
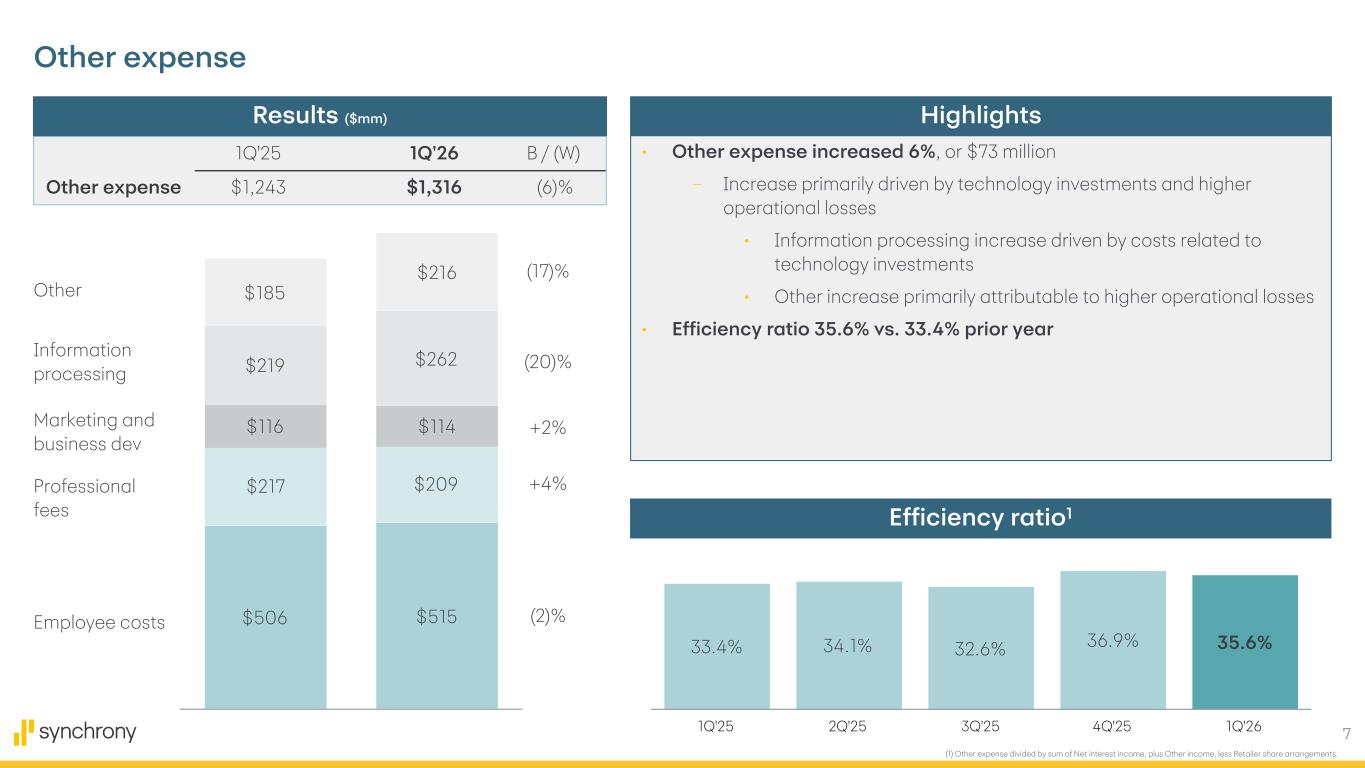
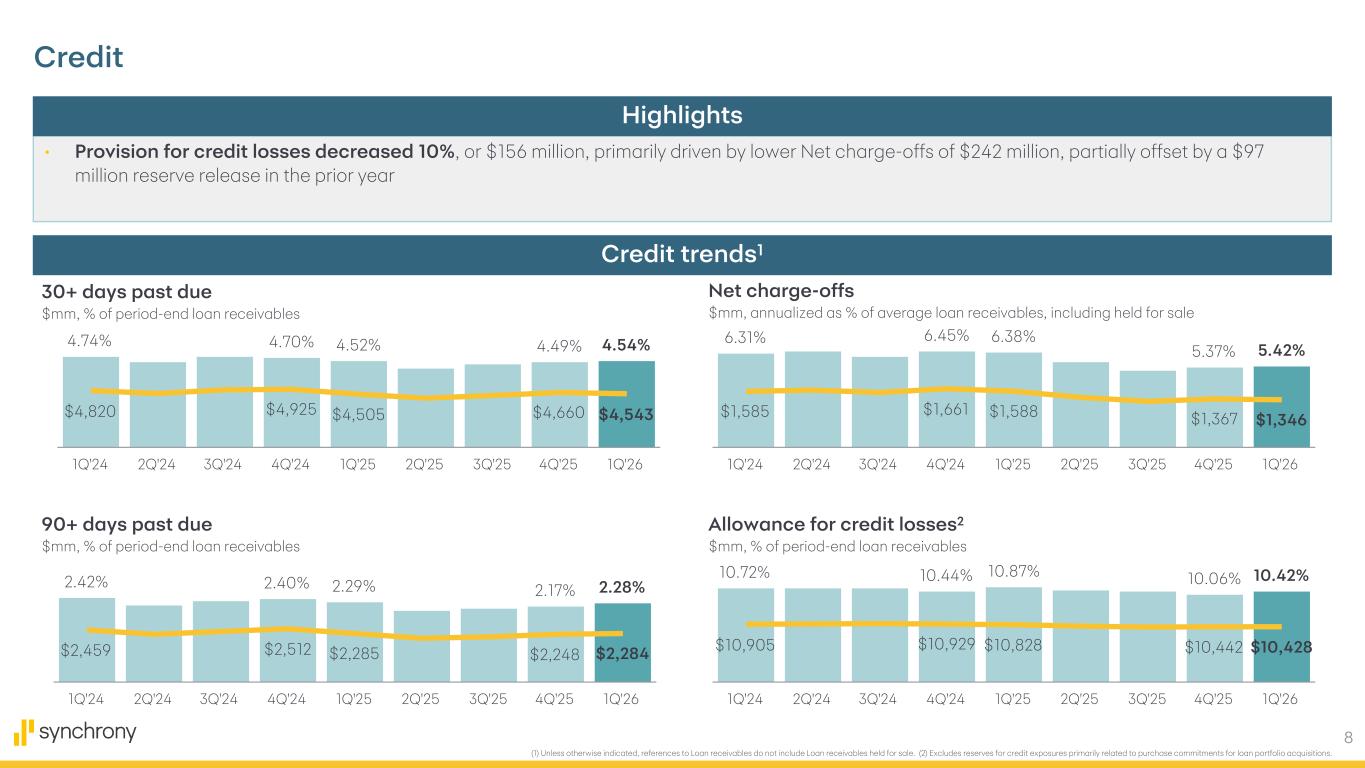
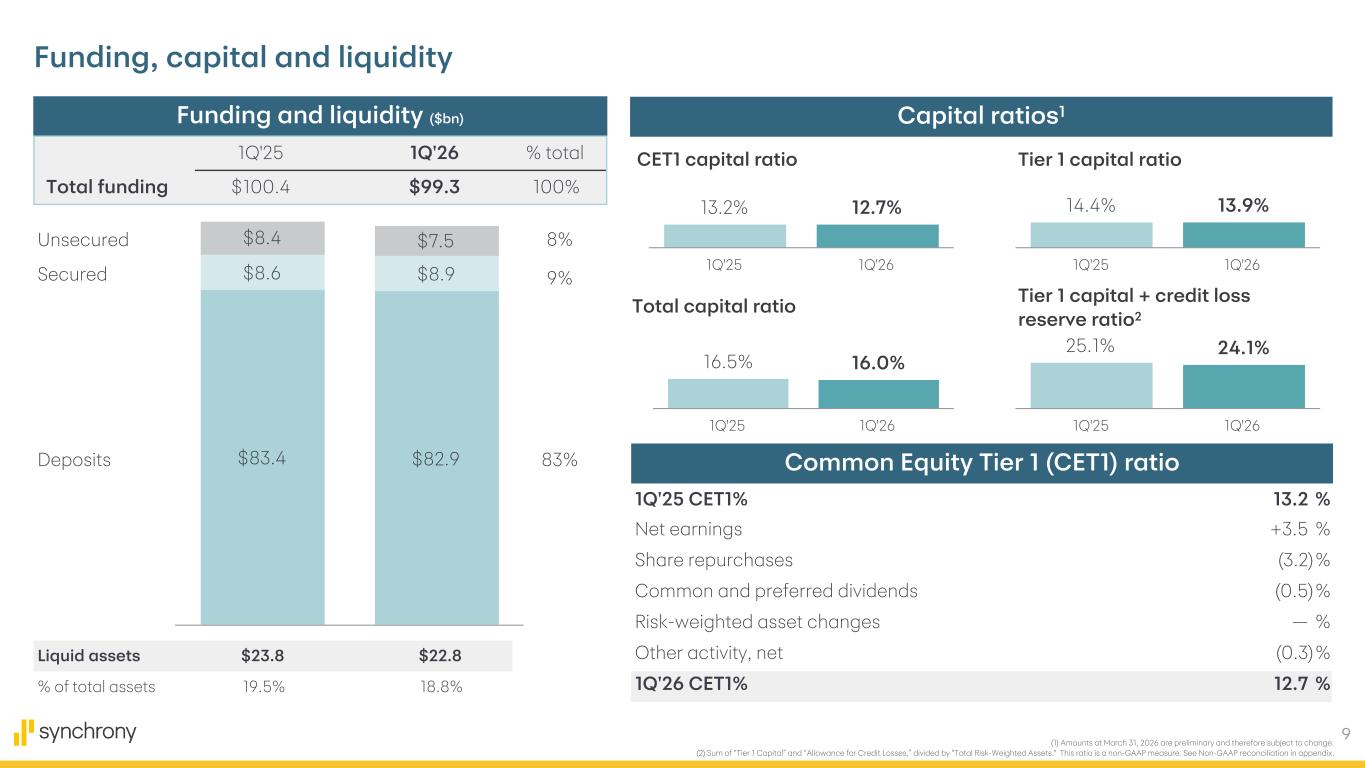
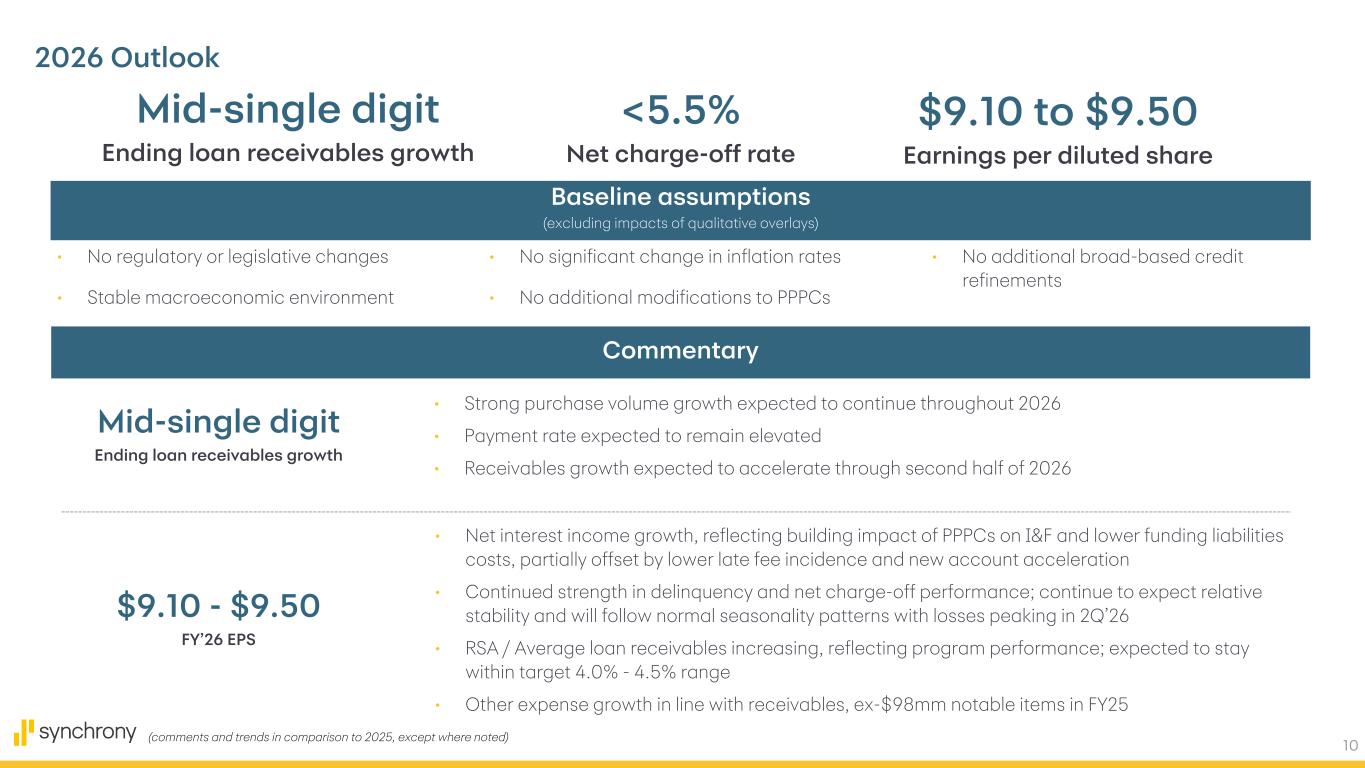
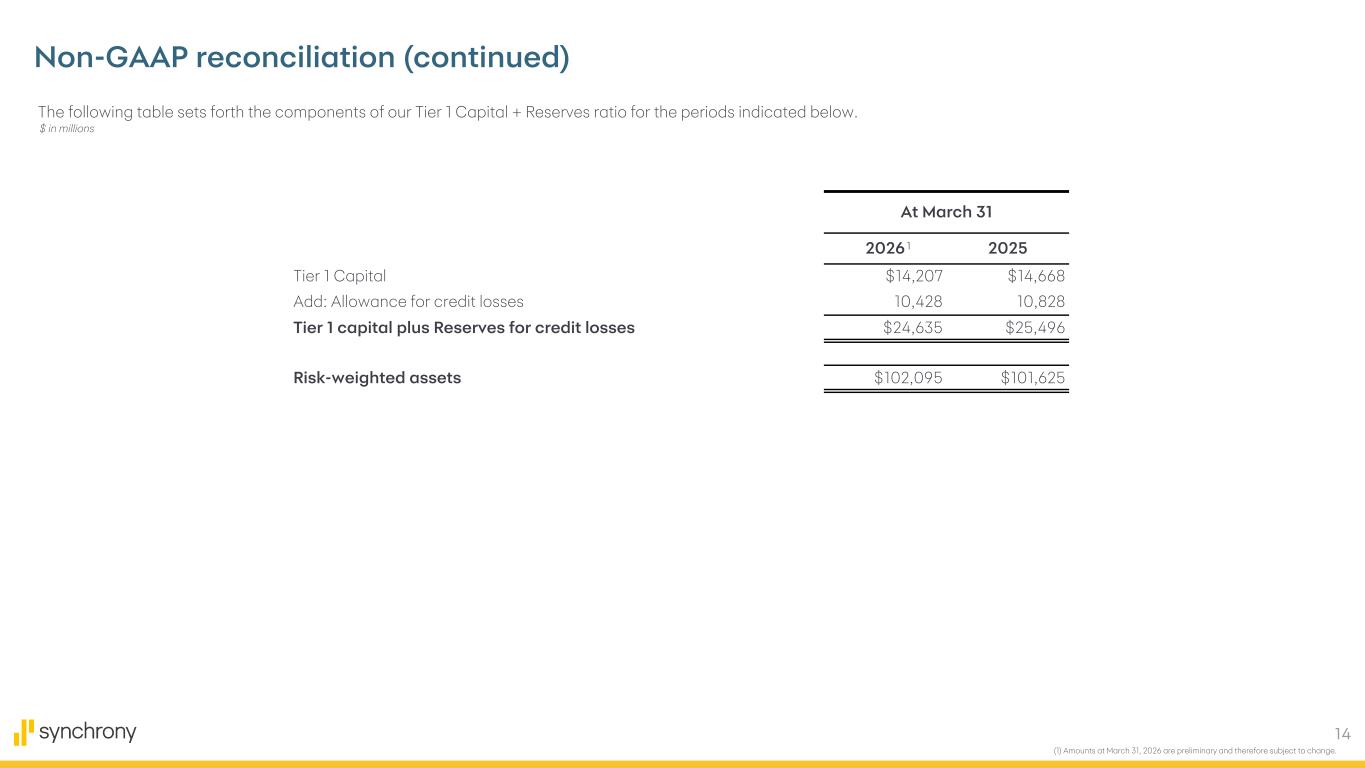
With that, I'll turn the call over to Brian to discuss our financial performance in greater detail thanks brian and good morning everyone synchrony's first quarter financial performance delivered record first quarter purchase volume a positive inflection in loan receivables growth strong credit performance and higher return on average assets and tangible common equity compared to last year these results reflected synchrony's discipline execution as we focus on delivering consistent risk-adjusted returns amid evolving market conditions Turning to our performance in more detail, Synchrony generated $43 billion of purchase volume, a first quarter record and a 6% increase compared to last year. Ending loan receivables were flat at $100 billion, though we did achieve a positive inflection in ending loan receivables with an increase of approximately $477 million at the end of the first quarter. This reflected the impact of higher purchase volume, generally offset by the effects of elevated payment rates. The payment rate of 16.3% was approximately 50 basis points higher than last year and approximately 110 basis points above the pre-pandemic first quarter average, primarily reflecting shifts in portfolio and product mix, as well as the impacts of new portfolio seasoning, our previous credit actions, and higher average tax refunds. Net Net interest income increased 4 percent to $4.6 billion, primarily driven by the combination of higher interest in fees and lower interest expense. Interest in fees increased 2 percent, primarily driven by the impact of our PPPCs, partially offset by lower benchmark rates. Interest expense decreased 11 percent, primarily due to lower benchmark rates. Our first quarter net interest margin increased 76 basis points versus last year to 15.5%, reflecting three key drivers. One, a 47 basis point increase in our loan receivables yield, which was partially driven by the impact of our PPPCs and contributed approximately 39 basis points to our net interest Two, a 44 basis point decline in our total interest bearing liabilities cost, which which reflected the impact of lower benchmark rates and contributed approximately 35 basis points to our net interest margin. And three, a 76 basis point increase in the mix of loan receivables as a percent of interest earning assets versus last year, which contributed approximately 14 basis points to our net interest margin. These improvements were partially offset by a 69 basis point reduction in our liquidity portfolio yield, which reduced our net interest margin by 12 basis points. The decline was generally driven by lower benchmark rates. Turning to the remainder of our P&L, RSAs of $1.1 billion, or 4.31% of average loan receivables in the first quarter, and increased $175 million versus the prior year, primarily reflecting program performance, which included lower net charge-offs and the impact of our PPPCs. Provision for credit losses decreased $156 million to $1.3 billion, primarily driven by a $242 million decrease in net charge-offs, partially offset by a $97 million reserve release in the prior year. Other expense increased 6% to $1.3 billion, primarily driven by the costs related to technology investments and higher operational losses. The first quarter efficiency ratio is 35.6%, approximately 220 basis points higher than last year. This resulted from higher overall expenses and the impact of higher RSA as program performance improved. To summarize Synchrony's first quarter results, we generated net earnings of $805 million or $2.27 per diluted share, a return on average assets of 2.7% and a return on tangible common equity of 24.5% and an 8% increase in tangible book value per share. Shifting focus to our key credit trends on slide eight, our portfolio's mix of below min payers remain well below pre-pandemic levels across all credit cohorts during the first quarter with the non-prime population outperforming relative to other credit cohorts since the end of 2023. We believe this continued trend in non-prime is reflective of our previous credit actions. We also continue to see normalization in the prime and superprime cohorts with some gradual shifting in the mix from above minimum to minimum payments. At quarter end, both our 30-plus and 90-plus delinquency rates were generally in line with the prior year, and our net charge-off rate was 5.42% in the first quarter, a decrease of 96 basis points from 6.38% in the prior year. Collectively, these payment and credit trends underscore the efficacy of our previous credit actions and ongoing credit management strategies, as well as the resilience of our customers and portfolio amid an uncertain environment. Finally, our allowance for credit losses as a percent of loan receivables was 10.42%, which increased approximately 36 basis points from 10.06% in the fourth quarter in line with our seasonal trends and a decreased 45 basis points from 10.87% in the first quarter of 2025. Turning to slide nine, Synchrony's funding, capital, and liquidity remain a foundational strength of our business. Synchrony grew our direct deposits by $3.1 billion and reduced broker deposits by $3.7 billion compared to last year. And during the first quarter, we issued $750 million of senior unsecured debt at our tightest five-year credit spread to date, and a final coupon of 4.95%, and a $500 million three-year secured public bond from the Synchrony Card Issuance Trust with a final coupon of 4.22%. As of March 31st, deposits represented 83% of our total funding, with secured debt representing 9 percent, and unsecured debt representing 8 percent. Total liquid assets decreased 4 percent to $22.8 billion and represented 18.8 percent of total assets, 72 basis points lower than last year. Now focusing on our capital ratios, synchrony ended the quarter with CET1 ratio of 12.7 percent, a Tier 1 capital ratio of 13.9%, and a total capital ratio of 16%, each of which declined by approximately 50 basis points versus the prior year. And our Tier 1 capital plus reserve ratio decreased to 24.1% compared to 25.1% last year. Sector returned $1 billion to shareholders during the first quarter, which included $900 million in shareware purchases and $104 million in common stock dividends. In addition, our board of directors approved a new shareware purchase program of up to $6.5 million of the company's common stock, which commenced in the second quarter of 2026 and in a change from a prior shareware purchase program does not have an expiration date. The new shareware purchase program replaces the company's prior program, which was scheduled to expire on June 30, 2026 and had approximately $300 million remaining. The pace and amount of share repurchases are flexible and will be executed from time to time subject to various factors, including capital levels, financial performance, market conditions, legal and regulatory requirements, and in accordance with our capital plans. Finally, I would like to discuss our outlook on slide 10. We continue to expect accelerated growth in purchase volume and average active accounts without any further broad-based credit refinements as we move through the year. The outcome should more than offset the impact of elevated payment rates to drive mid-single-digit growth in ending loan receivables by year-end. The rate of receivables growth should follow seasonality and accelerate as we move into the back half of the year. This will be driven by growth in our core portfolio as well as a combination of both recently launched and soon-to-be-launched programs, including Walmart OnePay, Bob's Discount Furniture, RH, and approximately $725 million of Lowe's commercial co-brand loan receivables, which was added in early April. Net interest income is expected to grow in 2026 as a result of higher loan receivables, the impact of PPPCs continuing to build, and as we reduce our funding liabilities costs, these trends will partially offset the lower late-fee incidents. We expect delinquency and losses to follow normal seasonality through the year, with net charge-offs peaking in the second quarter. We expect our net charge-offs to be less than 5.5 percent for the full year, and we remain focused on our disciplined approach to underwriting our business. And as program performance strengthens due to higher net interest income and lower losses compared to last year, we continue to expect RSAs to increase but remain within our long-term range of four to four point five percent of average receivables lastly we remain focused on operating expense discipline while also investing in the long-term potential of our business as a result we continue to expect other expense growth to trend in line with loan receivables putting all these elements together sacred remains on track to deliver between nine dollars and ten cents and nine dollars and fifty cents in diluted earnings per share while also executing across key strategic priorities to deliver consistent risk-adjusted growth and strong capital generation. And we are well-positioned to return excess capital in an aggressive but prudent way. With that, I'll turn the call back over to Brian.
Thanks, Brian. Before I turn the call over to Q&A, I'd like to leave you with three key takeaways from today's discussion. First, the consumer remains resilient and the foundation of our portfolio is strong. Our consistent underwriting discipline, credit management strategies, and portfolio performance have positioned us well for both the near and long term. Second, Synchrony's investments are driving results across our business and for the millions of consumers and hundreds of thousands of small and mid-sized businesses we serve across the country. And third, because of the results we deliver, Synchrony is generating growth at strong risk risk-adjusted returns and robust capital, positioning us well to drive considerable long-term value for our stakeholders. With that, I'll turn the call back to Catherine and open the Q&A.
That concludes our prepared remarks. We will now begin the Q&A session. So that we can accommodate as many of you as possible, I'd like to ask the participants to please limit yourself to one primary and one follow-up question. If you have additional questions, the Investor Relations team will be available after the Operator, please start the Q&A session.
Operator
Thank you. At this time, if you wish to ask a question, please press star 1 on your telephone keypad. You may remove yourself from the queue by pressing star 2. Please limit yourself to one question and one follow-up question. We'll take our first question from Terry Maugh with Barclays. Please go ahead.
Good morning. morning just wanted to start off with the long growth guide amid single digits can you maybe just give a little more a little bit more color on kind of what you're seeing in account acquisitions and just borrower behavior to give you confidence in that second half acceleration yeah thanks for the question terry you know as we look at the first quarter and how we exited you saw a clear acceleration of our purchase volume to a record high for the first quarter six percent uh you know year over year. So we've seen that acceleration. You know, positively paying rates up from a credit perspective of 50 basis points. Some of that in the first quarter was a result of higher income tax refunds, which impacted the quarter by 14 basis points. But we feel good about the purchase buying coming through and we feel good about some of the discretionary purchases that we see as we go through. As you kind of step out into the quarters, again, What we're going to start to see is some of the acquisitions, whether it's Walmart, OnePay, Lowe's commercial, begin to build into the portfolio as we move into the back half of the year. And we saw strong new account originations of 15% in the first quarter of this year. So we see positive momentum as we exited out of the first quarter. You know, for the first couple weeks in April, we've seen that to be consistent with how we exited to maybe slightly stronger from a purchase volume standpoint. So we feel good that the consumer is engaging with our products and wanting our products as we move forward.
Got it. That's helpful. And then on the payment rate of 16.3% this quarter, and it being, you know, over 100 basis points above your pre-pandemic average, has your product mix shift driven a permanent resetting of that payment rate higher? If that's the case, what does that mean for your long-term loss expectations and loan growth?
Thanks again, Terry. So I don't think it's permanently reset. I think what you look at is two fundamental elements that have happened over the last couple of years in which, you know, have been driven by our credit actions. Number one, we have a higher credit quality into the portfolio, particularly into the higher super prime versus what we normally have. So non-prime has gone down, which has a higher evolve rate, number one. Number two, you see a mix in the portfolios, people pull back in discretionary purchases the last couple of years, particularly in the home and auto space and lifestyle. When you have those larger promotional purchases, those payment rates are generally sub 10%, probably around eight or nine. So when you remix the portfolio and the percent of promotional financings are down, you artificially bring the payment rate up. So that plus the acceleration of new accounts here in the last year or so, they tend to pay off at a slightly higher level. So it's more a phenomenon of a shift inside the portfolio as relates to credit actions and to the return to growth. Got it. Thank you.
Operator
Thank you. We'll take our next question from Ryan Nash with Goldman Sachs.
Hey, Ryan. Good morning, Ryan. Ryan, maybe to start on the EPS guide of 910 to 950, Can you maybe just help us with how some of the moving pieces have shifted? It's clear credit's better with the guys below 550. But, you know, what else would you say has shifted, given obviously we've seen rates moving? And where do you think we're tracking within the range after a quarter? And I have a follow-up.
Thanks, Ryan. So, again, I think you started with net charge-offs. I think as we guided at the start of the year that our loss rate would be in line with a long-term target. Right now it's slightly below, so there's a little bit of favorability. You do have some, you know, payment rate pressure that we saw in the first quarter. But if you take a step back and say, okay, how do you think about the range for a second, and how do you move towards the higher end of the range, there's clearly a couple things that can play into that equation. Number one, will you see a slowing of the payment rate, which will increase for evolved rate, particularly on existing accounts that will drive more revenue toward you, number Two, on the delinquency formation and performance of delinquencies, will that continue to improve or stay steady? If it improves, most certainly you have a little bit of headwind from late fees, but most certainly you'll get potentially a reserve release and net charge-off benefits. Both of those two items have an RSA offset to it. So, again, we're not guiding inside the range, but clearly there are cases where you can get to the higher end of the range. Even if the payment rate stays higher and charge-off stays where they are from our first quarter exit, you then see you're towards the middle or lower end of the range. So, again, I think we see pathways both ways. The question you're going to have to answer is what happens in the macro environment? The consumer has been incredibly resilient, both from a purchasing behavior pattern and a payment behavior pattern. So, again, we'll have to watch, you know, the uncertainty as it relates to the geopolitical risks that exist today.
And then in terms of the buyback, you know, I guess, you know, how do we think about, you know, the pacing of the $6.5 billion, which is open-ended? Do you think it will be done differently than under the prior process? And I guess maybe just touch upon what are your expectations for capital relief under the Basel proposal and how do you think about Standard versus Erbra, which I'm assuming is more onerous on your business, but it would be good to hear you flesh it out.
So to parse that question, Ryan, when you think about the $6.5 billion, again, being open-ended, we don't give quarterly cadence. What I'd sit back and say is if you look back at, you know, the recent history and look at that cadence, that's, you know, probably what we'll end up doing. That's all dependent upon, you know, how the business performs, macroeconomic environment, legal regulatory or capital plans, et cetera. There are a bunch of caveats to that. But again, looking back at history, probably gives you a good cadence on how we step out under this plan. Again, this was designed really to align us now that we have a stress capital buffer of 250 basis points with our category, you know, for peers. With regard to your question on the Basel III proposal, under the standardized approach, you know, it is favorable to synchronize. So we absolutely appreciate the Fed's thoughtfulness of re-proposing the rules here and their ability and willingness to listen to industry participants with regard to that rule. So when you look at the standardized approach, you know, we clearly get a benefit on the retail exposures or on the risk weighting of assets, and only a small negative as it goes to the AOCI inclusion into that, that would generate, if the rule was adopted exactly as it is with no changes, you would see our RWAs go down and our capital get relief of 125 to 150 basis points. If you step out and look at the enhanced risk-based approach, that's a little bit more mixed. You do get more risk-weighting, withdrawing assets benefit, it, but you're now going to introduce a capital charge for the open-to-buy in the portfolio, which treats all those open-to-buys the same way. You're going to introduce operating risk into the equation, and then you have an impact on the DTA, which is when you combine all those effects, it's a net negative force if the rule is adopted exactly as is. But I think we continue to study the rule, and I think we'll provide comments as well as industry participants in ways in which you can eliminate some of the double counts, particularly on the operating risk, and maybe be a little bit more thoughtful on the open-to-buy and how that's converted to a risk-weighted asset. Thanks for calling, Brian. Thanks, Ryan.
Operator
Thank you. We'll go next to Sanjay Saccharone with KBW. Please go ahead.
Operator
Please keep lower.
Thanks for the question, Sanjay. And again, I think if you go back to what I said back in January, and I said kind of coming through here. Our guidance was around in line with the 5.5% to 6%. Really, we're trying to give a position of stability as it relates to the charge-off guidance. I think as you look at it now being less than 5.5%, I don't think there's a material difference in the way in which we thought about credit at the end of January and the way we think about credit today. So I think you may be overweighting that change relative to to to our guide that one sanjay look i think the consumer
is still in pretty good shape you know it's been very consistent over the past few quarters we're seeing signs of strength when you look at spending patterns credit continues to outperform our expectations so i think the macro environment is still pretty constructive you know strong labor market you do have the higher tax refunds we can get into that in a little bit and you've got some watch items. We're watching inflation very closely, higher gas prices, other factors that I think are creating some uncertainty out there with consumers, but they really seem to be looking past it at this point. You don't see it impacting spend. You saw spend for us accelerate really nicely this quarter. You look at the platforms, D&D was up 9%, digital was up 8%, lifestyle up 7%. That's indicative of, one, I think, our product suite, but also a pretty healthy, resilient consumer. So, you know, there's a lot of what I would call noise out there right now and things that we're watching and tracking, you know, really carefully. But at this point, you know, whether you're looking at spend patterns or you're looking at credit performance and early stage, late stage, everything, you know, points to a pretty resilient consumer. And I don't know if you want to add on tax refunds.
Yeah, let me just add some color both on tax and then on gas, Sanjay. So first on tax-free funds, you know, the tax-free funds are slightly lower than our expectations, low end of the range for us we thought would be around $500. They're coming in $350. And the way we've seen that, well, it hasn't had a material effect on our book. We've seen it will certainly impact when we look at payment rate and we lag payment rate to the refunds. There's about a 14 basis point impact in the quarter from higher payment rate in the quarter related to tax refunds. You know, you hit on a good point where the next couple of weeks you tend to see a little bit higher refunds of people who filed closer to the April 15th deadline, so that refund amount could creep up a little bit. But we didn't see on week-on-week, when you look at it, we did not see any real change in purchasing behavior pattern. When I look at the depository side of the business, we saw lower inflows and lower outflows. But that trend week on week with returns has mirrored for the last three years. So I think when we look at refunds, there hasn't been a material impact onto the business. When you look at gas prices, if you look at the average transaction value for gas in March, It's up 17% sequentially February to March of this year, and up 10% year-over-year. But we haven't seen any change in the frequency. It's actually up slightly, to be honest with you, year-over-year on frequency of gas purchases, and we haven't seen any pullback as it relates to gas. So at this point, I think the consumer is probably annoyed, but they haven't changed their behavioral patterns today as it relates to that spending. Thanks, Tony. Have a good day.
Operator
Thank you. We'll go next to Darren Peller with Wolf Research. Please go ahead.
Hey, guys. Thanks. Can we just start on expenses? Just given it grew 8% on an adjusted basis in first quarter and your guidance appears to imply expense growth decelerates throughout the year, even as receivables growth improves, so much of that is due to upfront investment in new program ads rolling off or any other color than the expense side would be great.
Yeah. Thanks, Darren, and good morning. You know, the expense, you know, there are two, what I'd say, items I'd point you to inside the quarter. Number one is slightly higher information technology expense that goes in there. There's two components that are in there. Number one is the association fees that we pay to MasterCard and Visa. So on a volume basis, with volume being up, particularly in the co-brand space, you know, we see slightly higher expense. that should continue on for the year. And then you have some information technology and investments that we're making, whether it's cloud and the like. And again, that will probably continue on. The other item that you see is up is in the other, which relates to some operational losses, which I think is a little bit more idiosyncratic in the first quarter and should reduce down as we move forward. So again, I think when you think about the run rate of expense dollars, they're probably about the same. But again, you get a step up as assets kind of come through and get some leverage in the back half of the year.
Thanks. And just for my follow-up, I want to touch on AI and agentic for a moment. Just maybe you guys can give us more color on any incremental investments you've been making around both the AI side and the efficiencies in the business. I know your FTEs have been effectively flat since 2023, but any early signs of evidence where you might be able to even create more efficiencies on that front and then on the agentic side also just incremental investments being made over the past couple of quarters to ensure that your placement on choice at the point of sale stays as high as it should be for sangria and its merchant partners thanks yeah it's a great question i'll start with the second piece of that because i actually think this is the more important of the two uh which is around agentic commerce.
It's a big area of focus for us. I think we're moving very quickly here. We've got hopefully first mover advantage. And like you said, this is going to fundamentally change how consumers discover new products, how they research, read reviews, and ultimately purchase. It's still early. We're working with all the top companies to ensure that as that purchasing path changes, our financing offers, our products are embedded in that experience. So there's still a lot that is unknown here in terms of how this could play out. You know, one scenario, which is probably the most prevalent right now, is that, you know, when a consumer researches a product inside of the AI platform to complete the purchase, it'll still go back to the merchant site. We're already embedded there. So that's kind of the easier of the two use cases. I think the second one, which is bound to happen at some point, is that the purchase actually gets completed inside of the AI platform. And that's where, as you indicated, it's really important that we're in there, our financing options are present in that checkout process. The good news is our partners have a huge incentive to make sure that that's the case. So as they're talking to all of the AI companies about how this is going to work, they're pulling us in and saying, okay, it's imperative that Synchrony's cards, our cards with them, are present and an option for the consumer to purchase, because they want to make sure that those transactions run on our rails, that the ValProp is protected, that the consumer benefits, and it feels very similar to if they were purchasing on the merchant site. So that's kind of the agentic piece of it. The Gen AI, or what I would call it more the productivity and efficiency piece. We've been on this for, you know, well over a year at this point. A big opportunity for us, you know, you referenced holding headcount flat. I think the bigger benefit, frankly, in the near term is just speed to market. Like, you know, we're using this, our coders are using it, 90% of our professional workforce is using it across all functions, across all platforms and they're getting real economies of scale and so you know i think the the early returns are this is going to help us be a lot faster a lot more efficient but also free up and redeploy our resources to things that are frankly more challenging more strategic uh and you know frankly more fun to work on so i'm i'm very optimistic about uh you know how we're how we're operating here i think we're off and running and there's big benefits in the future. Okay.
That's great to hear. Thanks, Brian. Thanks, guys. Yeah, thanks. Thanks, Darren.
Operator
Thank you. We'll take our next question from Rick Shane with J.P. Morgan. Please go ahead.
Hey, guys. Thanks for taking my questions. Look, you mentioned strength and luxury, strength and discretionary. You also mentioned 17% increase at the pump on a ticket basis. To follow up on Sanjay's question, can you help us understand spending and credit performance right now based on both income level and FICO score, realizing that they're different? Are you seeing divergence in the portfolio based upon sort of borrower category?
Yeah, thanks for the question, Shane. So when you go back, one of the key things we talked about on this call has been payment rate. And when you look at payment rate by credit cohort, you see strength coming at 780 plus. That is up the largest as you look at that piece of it. The next group is then the non-prime that is up. And then the middle at 650 to 720 and 720 to 780 is performing about equally. So again, And you see the top end continuing to pull up, which goes back to the mix shift I indicated earlier on the call. When you look at it by behavioral pattern inside of that, you do see a little bit of shift as it relates into min pay, but that's really getting offset by, you know, between min pay and statement pay. And when you look at it by cohort, then again, underneath that and whether people are paying and MinPay or FullPay, again, the bottom end is holding firm with regard to that MinPay. And really where you see more MinPay happening is in the prime segment between $650 and $780. So, again, I think we see the middle moving a little bit here, but, again, the high end is continuing to pull through. When we look at it generationally, you know, again, generations in that high-end cohort are continuing to pull the spend, but slightly higher payment rates, particularly at the high end of the portfolio. Got it. Super interesting. Thanks, Rick. Have a good day.
Operator
Thank you. We'll go next to Mahir Bhatia with UBS. Please go ahead.
Thanks. I think that's me. I'll just start with maybe just talking about average accounts for a second. You know, they've been declining for six quarters here. I think some of that is just a deliberate byproduct of your previous credit restrictions. But I had a two-part question on that. The first was just, are you seeing any shifts in consumer engagement with programs there? And maybe relatedly, we've seen a little bit of an increase in loyalty costs.
So is that like you have you just readjusting programs to see that to drive a little bit more volume there or is it just uh the walmart and some of the other co-brand programs picking up speed and the loyalty costs yeah thanks mir for the question i'm glad you didn't uh change firms uh by the way as well but but on the active account the first part of your question uh that that's generally just lagging the the loan receivables you should see that invert right as we've accelerated new accounts and they begin to engage into the portfolio so again trails a little bit, but you will see that inversion happen probably in the middle part of this year. So that's one. I think when you get to the loyalty question, again, a couple of things. One, we've enhanced certain value propositions last year on some of the cards. That drives a slightly higher loyalty cost. And then, to a large degree, what happens when you launch some new programs, you are going to see higher loyalty costs as some of the most engaged people take up that product and they tend to spend in-store, which has a higher value proposition for our partners and merchants than it does in the world. And that's just a phenomenal, you know, a byproduct of how the portfolio seasons when you add those new accounts. Again, having 15% new account growth, again, will drive a little bit more of that in-store value proposition versus world as you launch. But again, when you look at the co-branded volume being up uh you know 20 you are going to drive more more loyalty uh more loyalty costs which is really a good thing when you look at transaction frequency it is up so it's not uh you know our customers are engaging with the product and engaging in a bigger way uh year over year all right thank you and then just to uh follow up uh i want to go back to ryan's question about as buybacks uh can you just remind us so like what's the what factors impact that level of buyback is ct1 just the binding constraint there or are there other considerations we should be keep in mind things like you know rating agencies requirements etc yeah you know ct1 is not is not the binding constraint for us obviously you know the only thing left in the capital stack that we have to fully develop is the tier one so there's a little bit more preferred to do that is not a binding constraint today uh for us you know we still have you know plenty of plenty of room right relative to our targets um there are multiple factors you know yes you hit on one which is radiations and things like things like that that kind of come in our regulators but again i i think we start with how is the business performing what's the visibility to our business performance What do we see as RWA growth as we move through? Then you start looking into factors around, okay, what is the regulatory environment? How do you think about that? And just step through those things, that's when we set the cadence along with our capital plan and the board with regard to do it. We are going to be aggressive but prudent, and I think you'd have to appreciate the fact that we can't drop 100 basis points right away or go right down to the target. I think the regulators and most certainly rating agencies, our board probably wouldn't be comfortable on that. But I think we've shown a measured discipline. You see that really on the chart that we laid out in the earnings deck on page three, where we have been accelerating capital return to shareholders. And most certainly, I think when you look at the latter part of the deck and you go back into the capital ratio page, which sits on page nine, You see the earnings generation power of the business generating, you know, year-over-year, 350 basis points of CET1. So, you know, we are driving towards that target. And, again, we'll use an appropriate cadence to get there and hopefully in an aggressive but proven way. Thank you for taking my questions. Mayor, have a good day.
Operator
Thank you. And we'll go next to Erica and Jarian from UBS. Please go ahead.
Hi. Good morning. I'm glad Meher didn't take my job.
We're happy for you too, Erica.
My first question is, I know you don't love this question, but it's a fierce debate in the marketplace right now. So I have to re-ask it. So I guess it's two parts. First, based on the RSA math under Basel III endgame that you gave us, Brian, that would essentially take your CET1 from 12.7 closer to 14, if I'm hearing you right, on the 120 basis points. I guess as you think about having a higher level of CET-1 relative to that 11% minimum, is that going to be biased towards buybacks or, you know, more aggressive portfolio acquisition? And additionally, I know you don't love the question about pacing of buybacks, but that is a fierce debate right now with the investor community. Over the past three quarters, your buyback average has been about $900 million per quarter, which would then suggest that you would go through this current authorization in under two years. And thus, I guess I'm just wondering, you know, what drove that $900 million pacing? And as the receivables growth improves, is that an immediate offset to that buyback pacing?
Thanks, Erica. I won't comment whether we'd love or dislike the question, but let me try to parse it out for you a little bit as you kind of go through it. With regard to what happens ultimately with Basel III, I mean, to be honest with you, we don't know what the final rule will look like. To the extent that that rule gets implemented the way it is today, we most certainly would have a discussion with the board with regard to our capital levels and what we do with that incremental capital. And I think we've shown over time to either invest that capital into acquisitions such as Ally Lending and Allegro and other things, or, you know, we can return it back to Shirlers. But that's a decision that's going to be out. We haven't really engaged the board with that today. It's not something that we're working on. We're currently studying that evaluation, right, and that rule and seeing, you know, what are the positives and negatives and where does the need to be adjusted and where we may comment either with the industries or by ourselves. So that part of the question with regard to the cadence and the pacing, again, I look at a slightly longer horizon. Again, where we see opportunities and where we saw the business perform, right, relative to the earnings power of the business, you know, and the market will lean in to the extent that that shifts or we allocated more to RWAs, we'll adjust that pattern. So again, I'm not sure many people give a quarterly cadence. I know that's something everyone would like to do. But again, we will be aggressive but prudent. But I think if you look back over, you know, the past history, I think you'll get a better read versus a quarter or two.
And just my second follow-up, just clarifying your response to Ryan and Sanjay's question, Is there reserve release in the guide, or is there reserve release at sort of the mid-to-high point of the ETS guide?
Yeah, so let's make sure we're clear, Erica. I was trying to sit back and say ways in which you can get to the high end. Again, we haven't given any view on whether or not we'll be releasing reserves or not. I think if I take a step back, right, you know, credit has been a strength for us. I think we've been a leader in the industry. I think our performance has been terrific. Now the question becomes in the macro. We have qualitative overlays that sit there and say, okay, we're prepared to the extent that the macro environment gets worse. I think I've consistently said that, you know, where I see this, if the environment continues to play out the way we think, there's a little bit more of a downward bias, but I'm not necessarily sure I would plan on that today. Again, we continue to evaluate the environment, and we step out quarter by quarter. But, again, we haven't provided guidance, and I was only trying to give, you know, some of the previous analysts a way in which you think about the range and where you can end up inside the range.
Thanks, Eric. Have a good day.
Operator
Thank you. We'll take our next question from Mark DeVries with Douche of Bank. Please go ahead.
Yeah, thanks. You know, could you comment on how the pipeline for new program acquisitions or signs look kind of relative to recent history and how meaningful those types of opportunities could be for growth over the next year, and if possible, comment on kind of how big of an opportunity you think the new RH program could be.
We continue to have a very active pipeline, a combination of, you know, new startup de novo programs, which we're really excited about, some existing programs. I would say the existing programs that are coming to market in the next year or two are in kind of the mid-size range, nothing really that significant in terms of portfolios we acquire, but, you know, we've got a great track record of, you know, buying portfolios, winning programs, and then driving a lot of penetration and seeing really good growth So, you know, across all five of our platforms, we've got a very robust pipeline, I would say, in traditional programs, but also, you know, a nice pipeline of opportunities in what I would consider nontraditional opportunities, whether it's, you know, ISVs inside of health and wellness or home and auto and the more fragmented space. So, you know, the good news, too, just to add on to that, you know, we're seeing pretty good price discipline in the market. That continues to be the case. That's been consistent for the last two or three years. You know, there's always some pockets of irrational behavior, but, you know, generally, I think the industry is pricing in right way for this environment and we're winning the the programs that that we want to win and we're very excited about rh the great franchise and we think we'll be able to drive a lot more penetration and really grow that program got it thank you thanks mark thank you and we'll go next to Moshe Oranbuk from 2D Callum.
Operator
Please go ahead.
Great, thanks. Maybe to kind of follow up, you know, four out of your five verticals all had growth, some of them pretty strong growth in purchase volume, and home and auto was flat, although with down 6% accounts, you know, I guess had okay growth per account. Could you drill into that a little bit? like what you know what went on there from an account perspective are there you know things that you're doing to you know restart account growth in some of those programs obviously you've got some new programs but you know in other words that existing base uh you know because that is um you know about 30 of your receivables so can you talk about the plans there a little bit yeah and thanks thanks much for the question so when you think about the home and auto platform This is a large portion of our promotional financing business, so those average active accounts, when consumers are engaging in those discretionary purchases, have a tendency to stick.
Again, as we've said, they have been a little bit more challenged, particularly in the home specialty space, with regard to making those bigger ticket purchases. So that has impacted more of the average account growth. Again, what you've seen is a positive trajectory on home receivables, but again, you have a a fairly broad mix inside that sales platform, everywhere from do-it-yourself at Lowe's to home furnishings, then to furniture. And then most certainly you have auto, which has a very different dynamic relative to the average transaction values and frequencies of purchase. So it's more about the mix inside the home and auto platform than any delivered strategy that we have. Again, we're moving into an important part of the year for that vertical as you begin to see more things around the home, whether they're home projects and specialty, we'll certainly in do-it-yourself, et cetera, that, again, you tend to see a little bit more of the volume acceleration. So that, with the launch of a couple of new programs, both Bob's and RH, again, hopefully that will create a little bit of a tailwind for that platform.
And maybe just as a follow-up, you know, Brian, you had mentioned, you know, that not just the impact of tax refunds, but the benefit going forward of, you know, kind of lower withholdings. I guess, you know, could you talk about that a little bit and, you know, whether that, you know, has been a driver in your, you know, both credit and spend outlook?
Yeah, you know, that's a great question, Moshe, and it's probably harder to discern that piece of it, you can look at the flow of dollars into the economy on the stimulus level relative to the refunds themselves because they're lumpy. As you begin to see this flow that comes through throughout the year, it is harder to pull that piece apart. What I'd say is if you looked at our purchase volume going through the quarter, it has been relatively consistent. You know, absent the two storms we saw at the end of January and early February, it's been pretty consistent with regard to the growth. Now, that's a combination, part of that's going to be withholding, part of it's income tax refunds, but really it's the consumer and some of the discretionary purchases and rotation that Brian talked about in prepared remarks kind of pulling through. Again, you know, if I look at the first three weeks of April, we continue to see that strength kind of come through. Again, I'm not sure I can isolate or anyone can really isolate the withholding piece of it but but it must have some effect inside the overall consumer um spending behavioral patterns and the last thing i'd say even inside of uh you know april we saw the last three weekends have been you know three strongest weekends of the year and most certainly you know ahead of last year's pace so you know we're encouraged about the consumer the resilience and their willingness to engage with our products thanks very much Thanks so much, Adam.
Operator
Thank you. At this time, we have time for one final question, and we'll take our final question from Saul Martinez with HSBC. Please go ahead.
Thank you for squeezing in here. I wanted to go back to expenses. I know for 26, you're expecting expenses to track loan growth. But beyond 26, is the idea – can you just comment on your ability to deliver operating leverage as you exit 26 and into 27 and, you know, top-line growth accelerates? And just kind of how do you weigh investment needs – you talked about AI and Agentec earlier – versus the ability and willingness to let revenue flow down to the bottom line?
Yeah, thanks for the question, Saul. You know, our intended way in which we want to run the company is we don't want to be adding headcount right now. We want to be able to drive productivity through tools that Brian talked about, you know, when you think about simpler things like engineering. But how do we drive AI through all aspects of our business to drive a flat headcount environment and get leverage and drive the operating leverage when you look at NII growth relative to OPEX growth? So, again, where we want to increase our spending inside OpEx is around some of the technology that creates a differentiator for us and gives us first-mover advantage, particularly when Brian talks about things like AI. So, again, I think we want to be disciplined on the core costs, bring our core operating costs down for the consumer, but then continue that investment for the medium to long-term in technology, whether it's cloud or AI or other things in that nature. So, again, while trying to drive that operating leverage of having NII grow faster than operating expenses. Okay.
Great. That's helpful. Then maybe just follow up on the consumer. It seems like there's a little bit of a divergence between, you know, really strong credit trends, high payment rates persisting. But you also mentioned, you know, minimum payments having, you know, gone up. And correct me if I got some of these details wrong, but in the super prime and maybe the higher end of the prime market, can you just comment on what you're seeing there? Is that just a normalization from historically low levels, just any color there would be helpful?
Yeah, I don't believe it's necessarily a divergence. I think it's the way customers engage with how they pay. A lot of times you see people engage in auto payments and they set it for minimum payments versus setting it for full statement payments and make the option to make incremental payments. So it's not really a divergence. I think if you take it up a level, what we're clearly trying to articulate is that we see strength in the consumer from a spending behavior pattern, from a payment behavior pattern, and it's flowing through, which has a little bit of a drag on NII, but clear strength in maintaining credit, you know, now we sit in April and we have a good portion of the year now covered, that's a good base for us to continue to deliver through what is an evolving macroeconomic environment. So I think it's relatively consistent, and we're pleased with the performance of the consumer inside of our products.
All right. Thank you very much.
Thank you. Have a good day.
Operator
This concludes Synchrony's earnings conference call. You may disconnect your line at this time, and have a wonderful day.