Nabors Industries Ltd 8-K, filed Sep 11, 2025
Nabors Industries Ltd (NBR)
About this 8-K
Nabors Industries Ltd filed this 8-K on September 11, 2025, reporting on events of September 2, 2025.
Items reported
- Item 7.01: Regulation FD disclosure
- Item 9.01: Financial statements and exhibits
UNITED STATES
SECURITIES AND EXCHANGE COMMISSION
Washington, D.C. 20549
Form
CURRENT REPORT
PURSUANT TO SECTION 13 OR 15(d) OF THE
SECURITIES EXCHANGE ACT OF 1934
Date of Report (Date of earliest event reported):
(Exact name of registrant as specified in its charter)
| (State or Other Jurisdiction of Incorporation or Organization) |
(Commission File Number) | (I.R.S. Employer Identification No.) |
| N/A | ||
| (Address of principal executive offices) | (Zip Code) |
(
(Registrant’s telephone number, including area code)
N/A
(Former name or former address, if changed since last report.)
Check the appropriate box below if the Form 8-K filing is intended to simultaneously satisfy the filing obligation of the registrant under any of the following provisions:
| Written communications pursuant to Rule 425 under the Securities Act (17 CFR 230.425) |
| Soliciting material pursuant to Rule 14a-12 under the Exchange Act (17 CFR 240.14a-12) |
| Pre-commencement communications pursuant to Rule 14d-2(b) under the Exchange Act (17 CFR 240.14d-2(b)) |
| Pre-commencement communications pursuant to Rule 13e-4(c) under the Exchange Act (17 CFR 240.13e-4(c)) |
Securities registered pursuant to Section 12(b) of the Act:
| Title of each class | Trading Symbol(s) | Name of exchange on which registered | ||
Indicate by check mark whether the registrant is an emerging growth company as defined in Rule 405 of the Securities Act of 1933 (§230.405 of this chapter) or Rule 12b-2 of the Securities Exchange Act of 1934 (§240.12b-2 of this chapter).
Emerging growth
company
If an emerging growth company, indicate by check mark if the registrant has elected not to use the extended transition period for complying with any new or revised financial accounting standards provided pursuant to Section 13(a) of the Exchange Act. ¨
| Item 7.01 | Regulation FD Disclosure. |
On September 3, 2025, Mr. William Restrepo, the Chief Financial Officer of Nabors Industries Ltd., attended the Barclays 39th Annual Energy-Power Conference. Mr. Restrepo participated in a panel discussion on land drilling. On September 2, 2025, the Company published an Investor Presentation on its website, which was used as the basis for those discussions. The Investor Presentation is attached hereto as Exhibit 99.1 and incorporated herein by reference.
The presentation referenced above contain forward-looking statements within the meaning of the Securities Act of 1933, as amended (the “Securities Act”), and the Securities Exchange Act of 1934, as amended (the “Exchange Act”). Such forward-looking statements are subject to risks and uncertainties, as disclosed from time to time in the Company’s filings with the Securities and Exchange Commission. As a result of these factors, actual results may differ materially from those indicated or implied by such forward-looking statements.
The information in this Item 7.01, including Exhibit 99.1, shall not be deemed “filed” for purposes of Section 18 of the Exchange Act or otherwise subject to liabilities of that Section or Sections 11 and 12(a)(2) of the Securities Act.
| Item 9.01 | Financial Statements and Exhibits. |
(d) Exhibits
| Exhibit No. |
Description | |
| 99.1 | Presentation | |
| 104 | Cover Page Interactive Data File (embedded within the Inline XBRL document contained in Exhibit 101) |
SIGNATURE
Pursuant to the requirements of the Securities Exchange Act of 1934, the registrant has duly caused this report to be signed on its behalf by the undersigned hereunto duly authorized.
| Nabors Industries Ltd. | ||
| Date: September 11, 2025 | By: | /s/ Mark D. Andrews |
| Mark D. Andrews | ||
| Corporate Secretary | ||
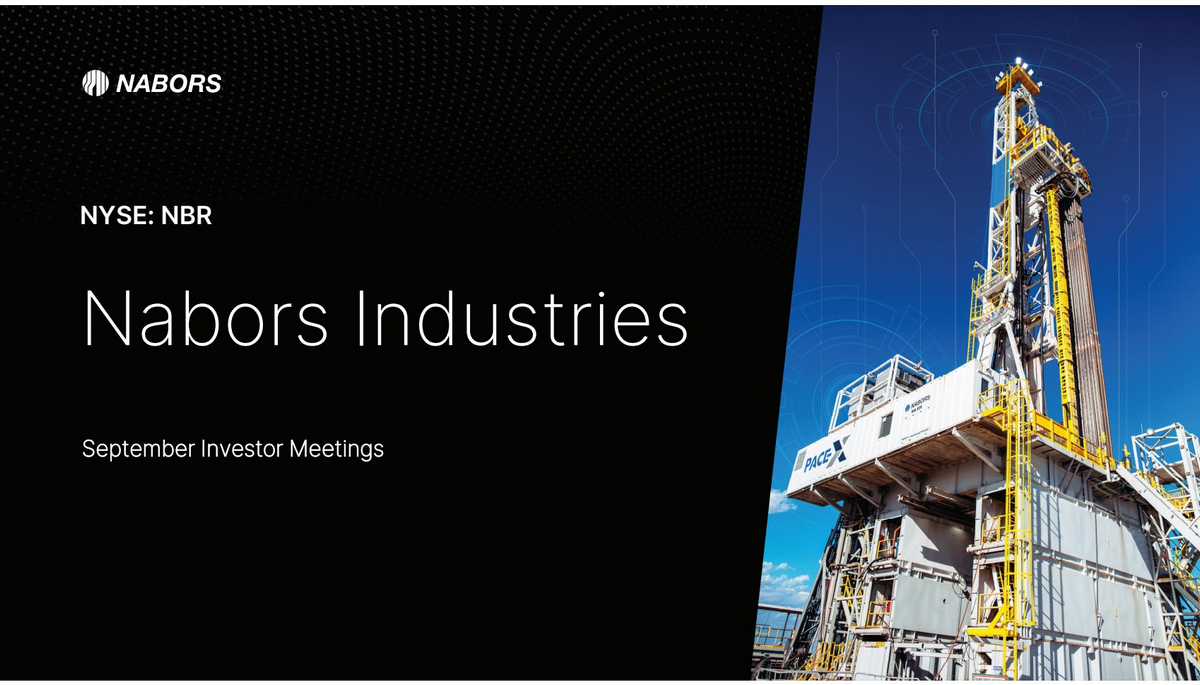
| September Investor Meetings NYSE: NBR Nabors Industries |
| NABORS.COM We often discuss expectations regarding our future markets, demand for our products and services, and our performance in our annual, quarterly, and current reports, press releases, and other written and oral statements. Such statements, including statements in this document that relate to matters that are not historical facts, are “forward-looking statements” within the meaning of the safe harbor provisions of Section 27A of the U.S. Securities Act of 1933 and Section 21E of the U.S. Securities Exchange Act of 1934. These “forward-looking statements” are based on our analysis of currently available competitive, financial and economic data and our operating plans. They are inherently uncertain, and investors should recognize that events and actual results could turn out to be significantly different from our expectations. Factors to consider when evaluating these forward-looking statements include, but are not limited to: • geopolitical events, pandemics and other macro-events and their respective and collective impact on our operations as well as oil and gas markets and prices; • fluctuations and volatility in worldwide prices of and demand for oil and natural gas; • fluctuations in levels of oil and natural gas exploration and development activities; • fluctuations in the demand for our services; • competitive and technological changes and other developments in the oil and gas and oilfield services industries; • our ability to renew customer contracts in order to maintain competitiveness; • the existence of operating risks inherent in the oil and gas and oilfield services industries; • the possibility of the loss of one or a number of our large customers; • the amount and nature of our future capital expenditures and how we expect to fund our capital expenditures; • the occurrence of cybersecurity incidents, attacks and other breaches to our information technology systems; • the impact of long-term indebtedness and other financial commitments on our financial and operating flexibility; • our access to and the cost of capital, including the impact of a further downgrade in our credit rating, covenant restrictions, availability under our revolving credit facility, and future issuances of debt or equity securities and the global interest rate environment; • our dependence on our operating subsidiaries and investments to meet our financial obligations; • our ability to retain skilled employees; • our ability to realize the expected benefits of our acquisition of Parker Drilling Company (“Parker”) as well as other strategic transactions we may undertake; • changes in tax laws and the possibility of changes in other laws and regulation; Forward-Looking Statements NABORS INDUSTRIES 2 • global views on and the regulatory environment related to energy transition and our ability to implement our energy transition initiatives; • potential long-lived asset impairments • the possibility of changes to U.S. trade policies and regulations including the imposition of trade embargoes, sanctions or tariffs, by either the U.S. or any other country in which we operate or have supply lines; • general economic conditions, including the capital and credit markets; • potential adverse reactions or changes to business relationships resulting from the announcement or completion of the merger; • our ability to retain key personnel of Nabors and Parker; • the significant costs to integrate Parker's operations with our own; • our ability to successfully integrate Parker’s business with our own and to realize the expected benefits of the merger with Parker, including expected synergies; and • the combined company's ability to utilize NOLs; Our businesses depend, to a large degree, on the level of spending by oil and gas companies for exploration, development and production activities. Therefore, sustained lower oil or natural gas prices that have a material impact on exploration, development or production activities could also materially affect our financial position, results of operations and cash flows. The above description of risks and uncertainties is by no means all-inclusive but is designed to highlight what we believe are important factors to consider. For a discussion of these factors and other risks and uncertainties, please refer to our filings with the Securities and Exchange Commission ("SEC"), including those contained in our Annual Reports on Form 10-K and Quarterly Reports on Form 10-Q, which are available at the SEC's website at www.sec.gov. We undertake no obligation to publicly update or revise any forward-looking statement as a result of new information, future events or otherwise, except as otherwise required by law. Non-GAAP Financial Measures This presentation refers to certain “non-GAAP” financial measures, such as adjusted EBITDA, net debt, and adjusted gross margin. The components of these non-GAAP measures are computed by using amounts that are determined in accordance with accounting principles generally accepted in the United States of America (“GAAP”). Other companies in our industry may compute these metrics differently. These measures have limitations and should not be used in isolation or as a substitute for the amounts reported in accordance with GAAP. |
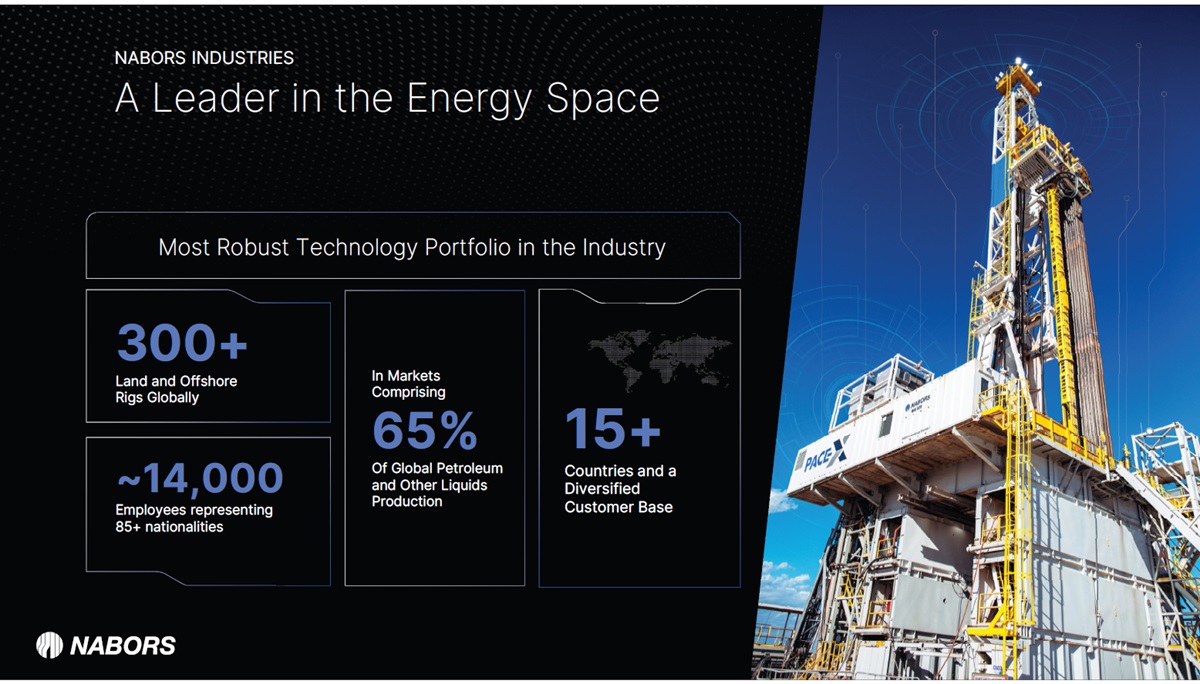
| Most Robust Technology Portfolio in the Industry 300+ Land and Offshore Rigs Globally In Markets Comprising 65% Of Global Petroleum and Other Liquids Production 15+ Countries and a Diversified Customer Base ~14,000 Employees representing 85+ nationalities A Leader in the Energy Space NABORS INDUSTRIES |
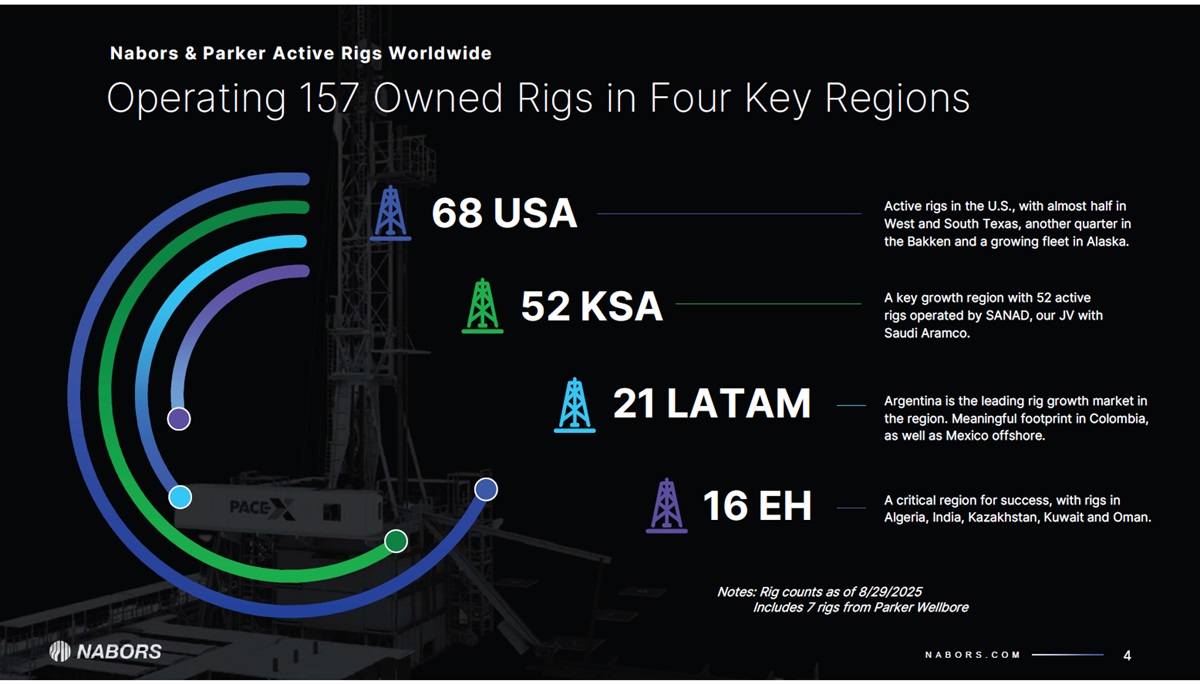
| NABORS.COM Operating 157 Owned Rigs in Four Key Regions Nabors & Parker Active Rigs Worldwide 4 68 USA 52 KSA 21 LATAM 16 EH Active rigs in the U.S., with almost half in West and South Texas, another quarter in the Bakken and a growing fleet in Alaska. A key growth region with 52 active rigs operated by SANAD, our JV with Saudi Aramco. Argentina is the leading rig growth market in the region. Meaningful footprint in Colombia, as well as Mexico offshore. A critical region for success, with rigs in Algeria, India, Kazakhstan, Kuwait and Oman. Notes: Rig counts as of 8/29/2025 Includes 7 rigs from Parker Wellbore |
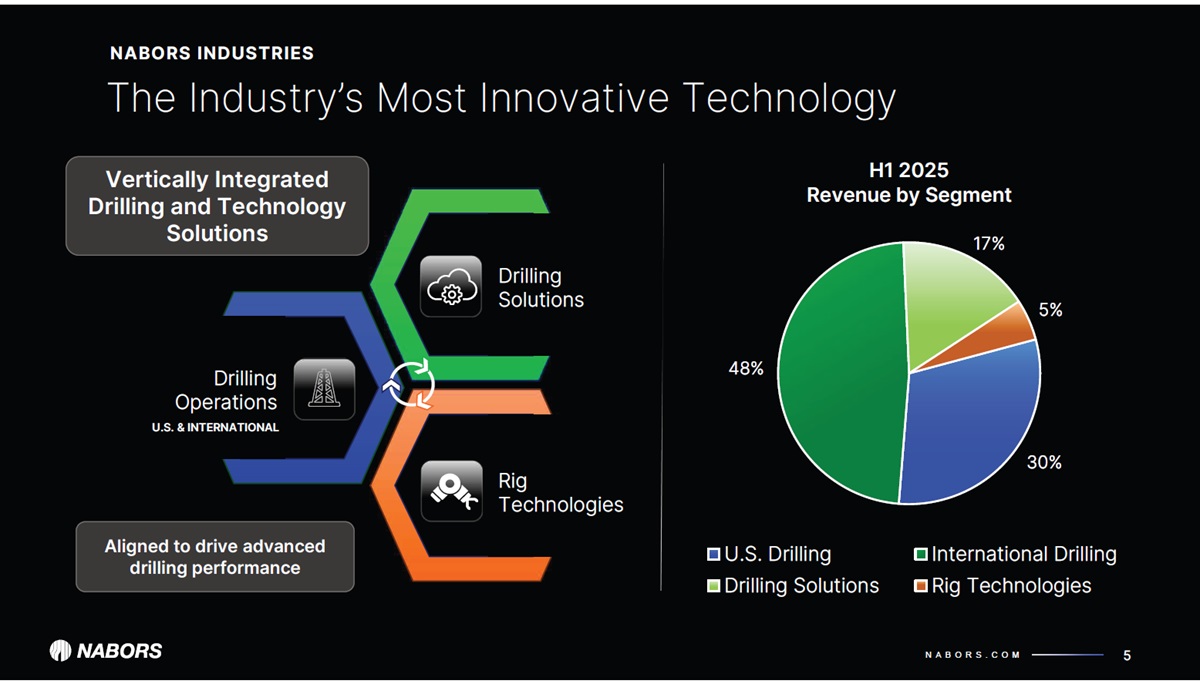
| NABORS.COM 3 0 % 4 8 % 17 % 5 % H1 2025 Revenue by Segment U.S. Drilling International Drilling Drilling Solutions Rig Technologies 5 The Industry’s Most Innovative Technology NABORS INDUSTRIES Vertically Integrated Drilling and Technology Solutions Drilling Operations Rig Technologies Drilling Solutions Aligned to drive advanced drilling performance U.S. & INTERNATIONAL |
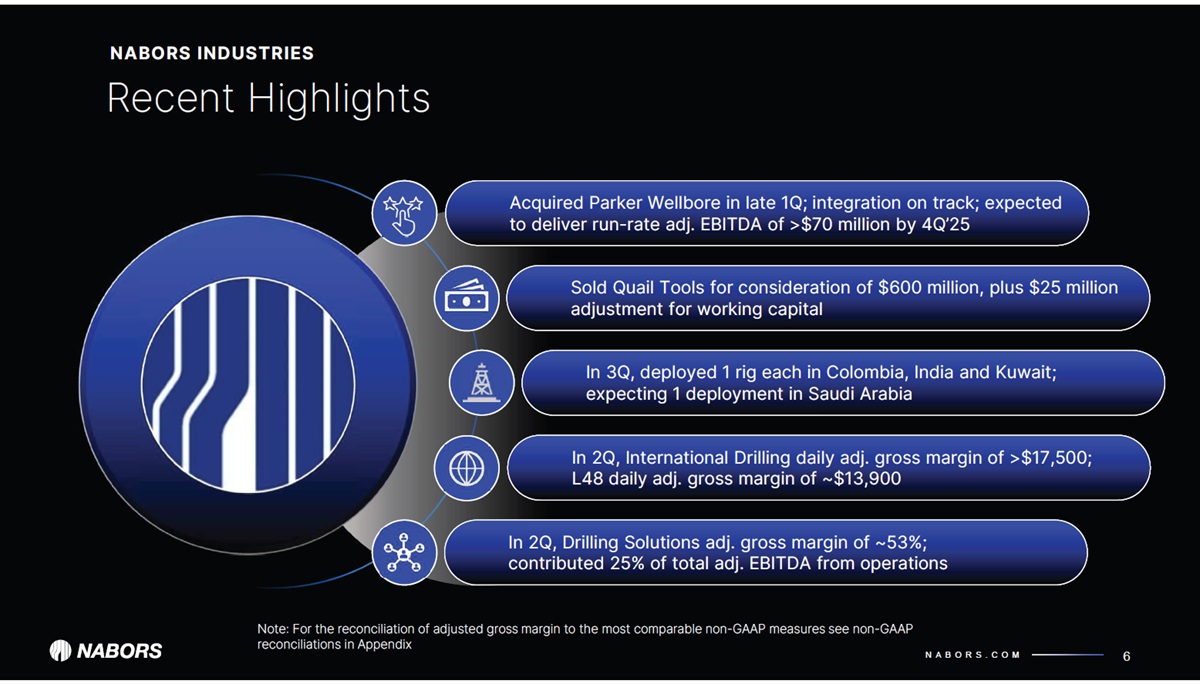
| NABORS.COM Recent Highlights NABORS INDUSTRIES 6 In 2Q, International Drilling daily adj. gross margin of >$17,500; L48 daily adj. gross margin of ~$13,900 Acquired Parker Wellbore in late 1Q; integration on track; expected to deliver run-rate adj. EBITDA of >$70 million by 4Q’25 In 3Q, deployed 1 rig each in Colombia, India and Kuwait; Nabors expecting 1 deployment in Saudi Arabia In 2Q, Drilling Solutions adj. gross margin of ~53%; contributed 25% of total adj. EBITDA from operations Note: For the reconciliation of adjusted gross margin to the most comparable non-GAAP measures see non-GAAP reconciliations in Appendix Sold Quail Tools for consideration of $600 million, plus $25 million adjustment for working capital |
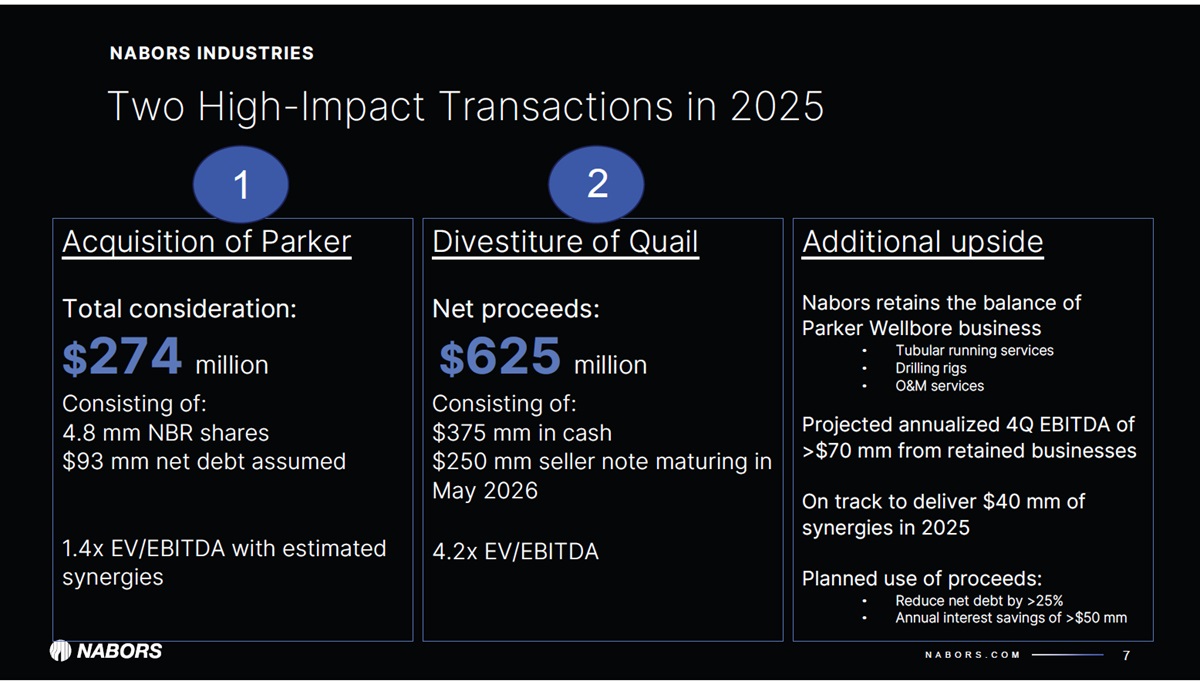
| NABORS.COM Two High-Impact Transactions in 2025 NABORS INDUSTRIES 7 Acquisition of Parker Total consideration: $274 million Consisting of: 4.8 mm NBR shares $93 mm net debt assumed 1.4x EV/EBITDA with estimated synergies Divestiture of Quail Net proceeds: $625 million Consisting of: $375 mm in cash $250 mm seller note maturing in May 2026 4.2x EV/EBITDA Additional upside Nabors retains the balance of Parker Wellbore business • Tubular running services • Drilling rigs • O&M services Projected annualized 4Q EBITDA of >$70 mm from retained businesses On track to deliver $40 mm of synergies in 2025 Planned use of proceeds: • Reduce net debt by >25% • Annual interest savings of >$50 mm 1 2 |
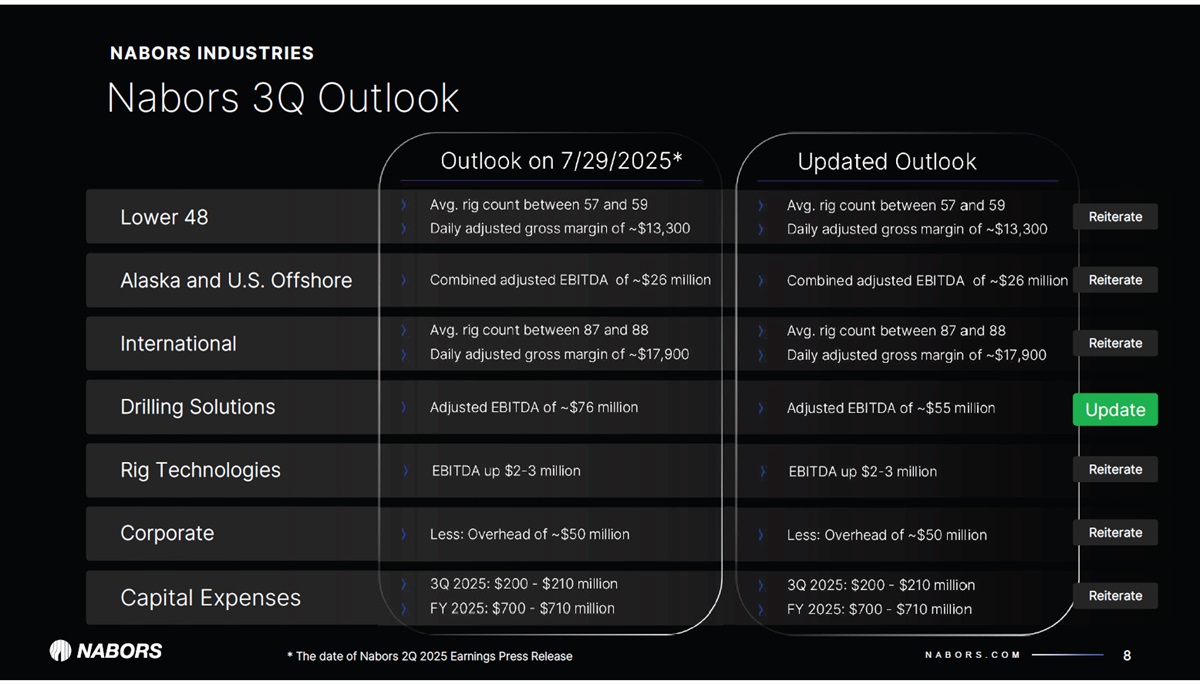
| NABORS.COM Nabors 3Q Outlook NABORS INDUSTRIES 8 Lower 48 Alaska and U.S. Offshore ⟩ Avg. rig count between 57 and 59 ⟩ Daily adjusted gross margin of ~$13,300 ⟩ Combined adjusted EBITDA of ~$26 million ⟩ 3Q 2025: $200 - $210 million ⟩ FY 2025: $700 - $710 million ⟩ EBITDA up $2-3 million Drilling Solutions Rig Technologies Outlook on 7/29/2025* Capital Expenses International ⟩ Avg. rig count between 87 and 88 ⟩ Daily adjusted gross margin of ~$17,900 ⟩ Adjusted EBITDA of ~$76 million Corporate ⟩ Less: Overhead of ~$50 million ⟩ Avg. rig count between 57 and 59 ⟩ Daily adjusted gross margin of ~$13,300 ⟩ Combined adjusted EBITDA of ~$26 million ⟩ 3Q 2025: $200 - $210 million ⟩ FY 2025: $700 - $710 million ⟩ EBITDA up $2-3 million Updated Outlook ⟩ Avg. rig count between 87 and 88 ⟩ Daily adjusted gross margin of ~$17,900 ⟩ Adjusted EBITDA of ~$55 million ⟩ Less: Overhead of ~$50 million Reiterate Update Reiterate Reiterate Reiterate Reiterate Reiterate * The date of Nabors 2Q 2025 Earnings Press Release |
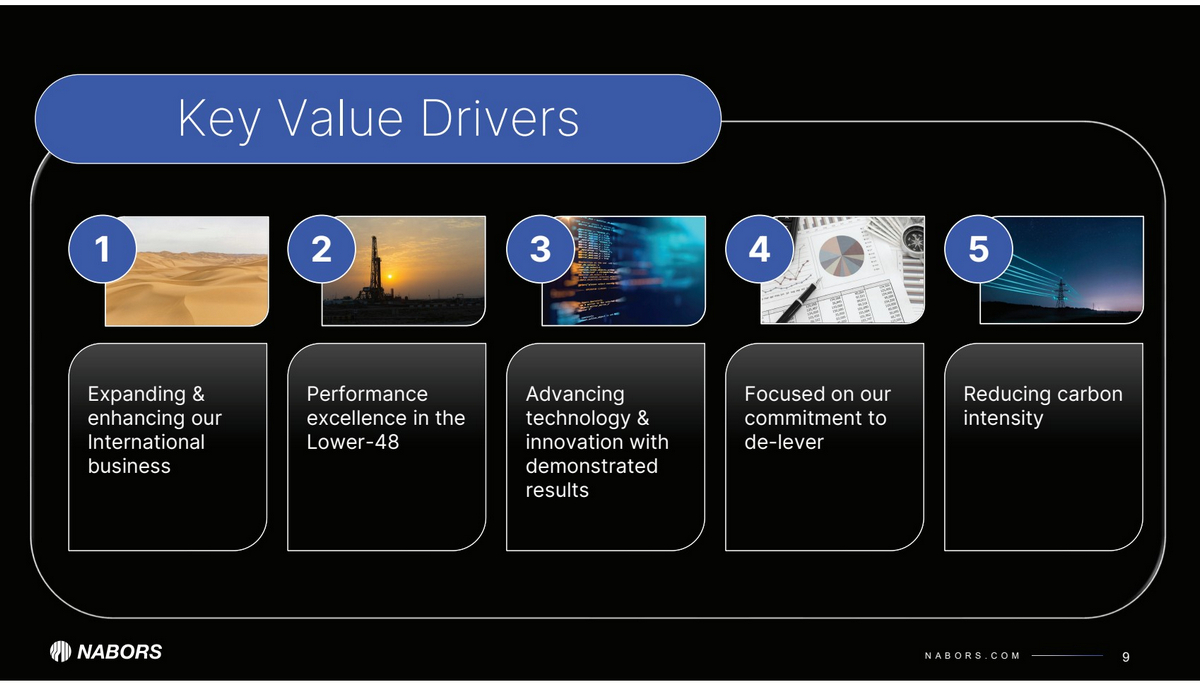
| NABORS.COM Performance excellence in the Lower-48 9 Expanding & enhancing our International business Key Value Drivers 1 Advancing technology & innovation with demonstrated results Focused on our commitment to de-lever 2 3 Reducing carbon intensity 4 5 |
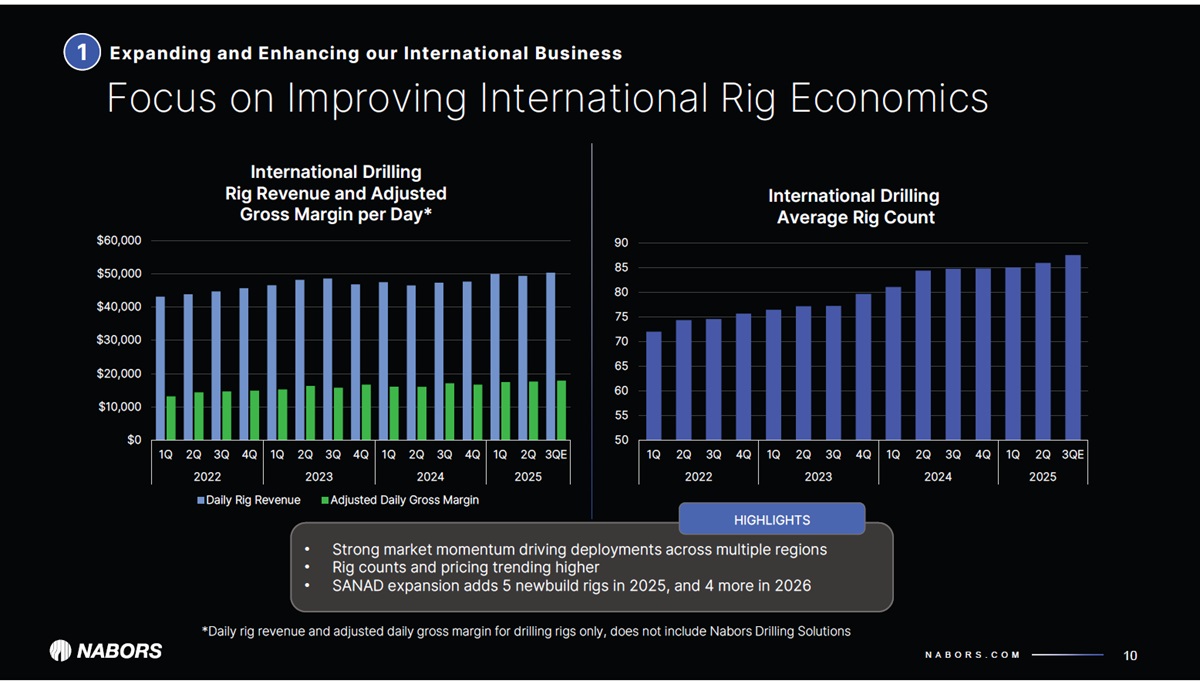
| NABORS.COM $0 $10,000 $20,000 $30,000 $40,000 $50,000 $60,000 1Q 2Q 3Q 4Q 1Q 2Q 3Q 4Q 1Q 2Q 3Q 4Q 1Q 2Q 3QE 2022 2023 2024 2025 International Drilling Rig Revenue and Adjusted Gross Margin per Day* Daily Rig Revenue Adjusted Daily Gross Margin 50 55 60 65 70 75 80 85 90 1Q 2Q 3Q 4Q 1Q 2Q 3Q 4Q 1Q 2Q 3Q 4Q 1Q 2Q 3QE 2022 2023 2024 2025 International Drilling Average Rig Count 1 Focus on Improving International Rig Economics Expanding and Enhancing our International Business 10 *Daily rig revenue and adjusted daily gross margin for drilling rigs only, does not include Nabors Drilling Solutions • Strong market momentum driving deployments across multiple regions • Rig counts and pricing trending higher • SANAD expansion adds 5 newbuild rigs in 2025, and 4 more in 2026 HIGHLIGHTS |
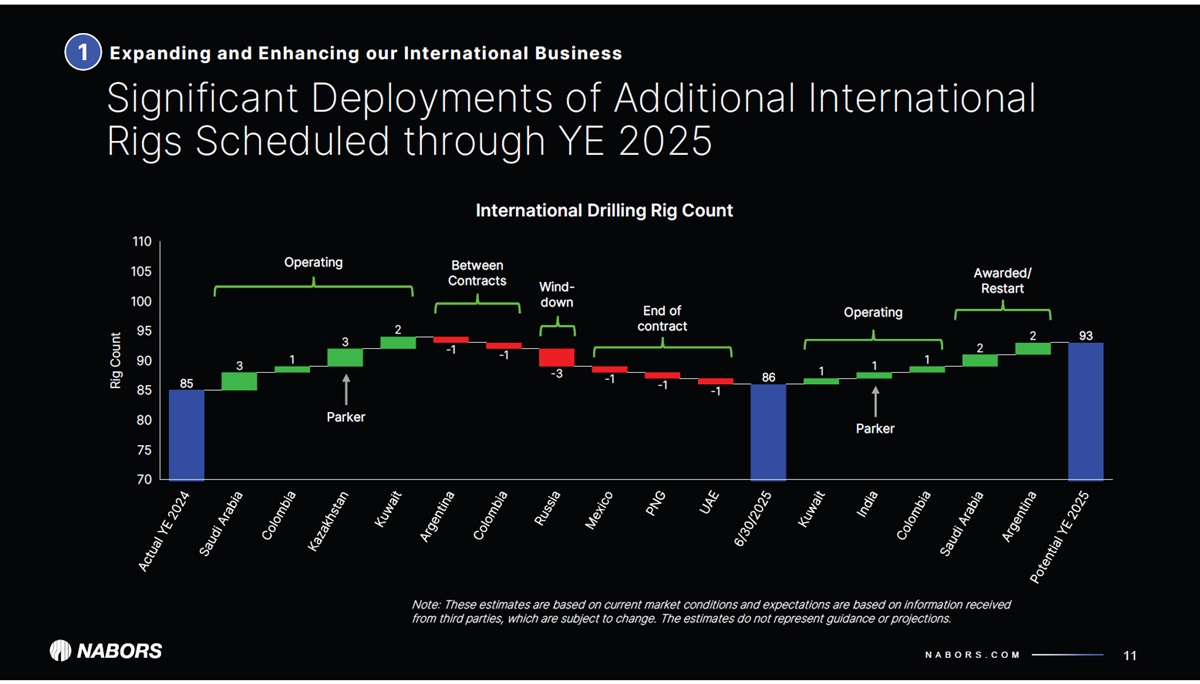
| NABORS.COM 3 1 3 2 -1 -1 -3 -1 -1 -1 1 1 1 2 2 85 86 93 Rig Count 70 75 80 85 90 95 100 105 110 1 Significant Deployments of Additional International Rigs Scheduled through YE 2025 11 Note: These estimates are based on current market conditions and expectations are based on information received from third parties, which are subject to change. The estimates do not represent guidance or projections. Expanding and Enhancing our International Business Awarded/ Restart International Drilling Rig Count Operating End of contract Between Contracts Parker Parker Wind-down Operating |
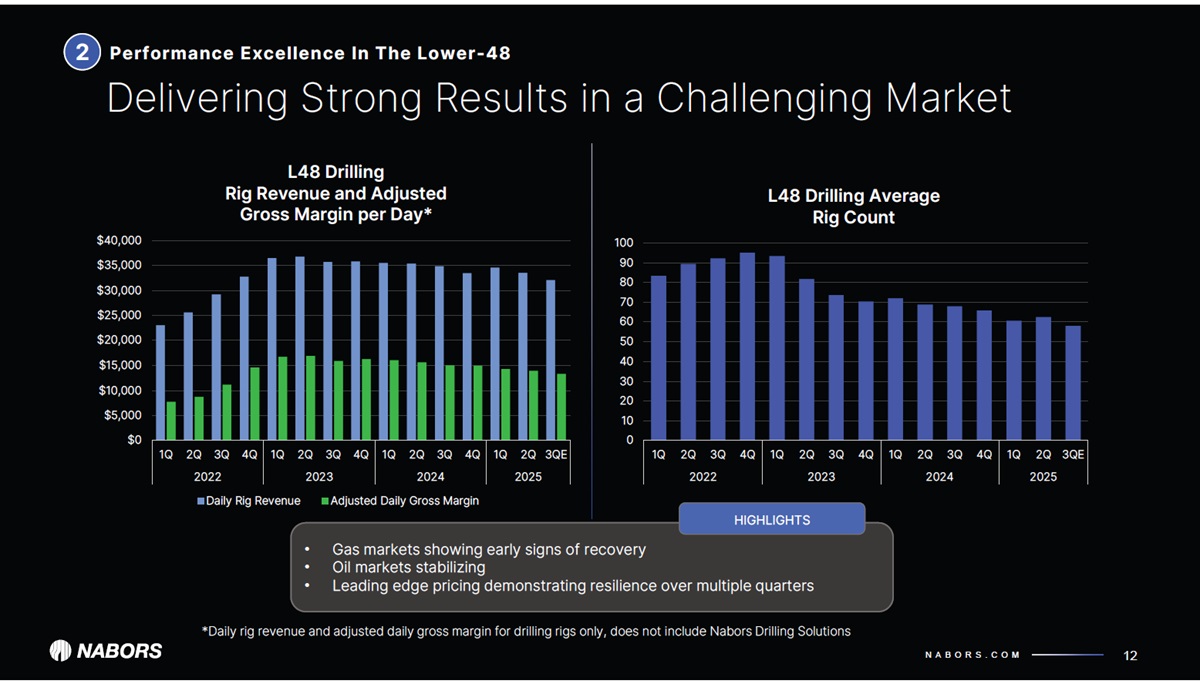
| NABORS.COM $0 $5,000 $10,000 $15,000 $20,000 $25,000 $30,000 $35,000 $40,000 1Q 2Q 3Q 4Q 1Q 2Q 3Q 4Q 1Q 2Q 3Q 4Q 1Q 2Q 3QE 2022 2023 2024 2025 L48 Drilling Rig Revenue and Adjusted Gross Margin per Day* Daily Rig Revenue Adjusted Daily Gross Margin 0 10 20 30 40 50 60 70 80 90 100 1Q 2Q 3Q 4Q 1Q 2Q 3Q 4Q 1Q 2Q 3Q 4Q 1Q 2Q 3QE 2022 2023 2024 2025 L48 Drilling Average Rig Count 2 Delivering Strong Results in a Challenging Market Performance Excellence In The Lower-48 12 *Daily rig revenue and adjusted daily gross margin for drilling rigs only, does not include Nabors Drilling Solutions • Gas markets showing early signs of recovery • Oil markets stabilizing • Leading edge pricing demonstrating resilience over multiple quarters HIGHLIGHTS |
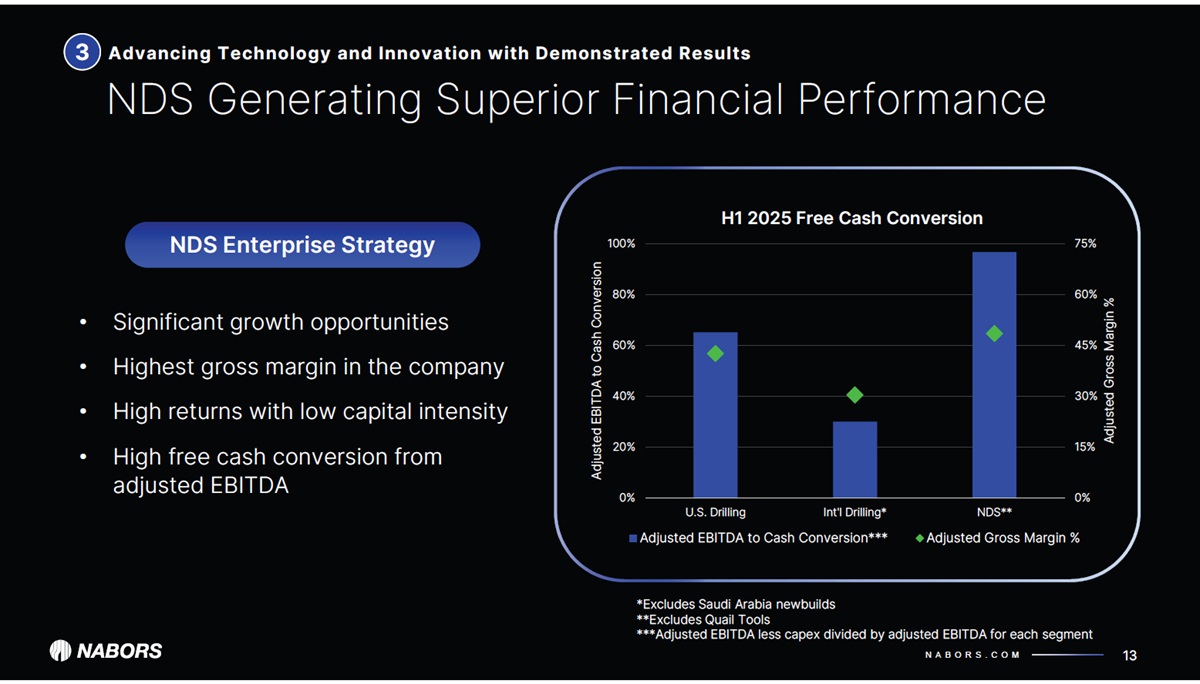
| NABORS.COM 0% 15% 30% 45% 60% 75% 0% 20% 40% 60% 80% 100% U.S. Drilling Int'l Drilling* NDS** Adjusted Gross Margin % Adjusted EBITDA to Cash Conversion H1 2025 Free Cash Conversion Adjusted EBITDA to Cash Conversion*** Adjusted Gross Margin % 13 NDS Generating Superior Financial Performance Advancing Technology and Innovation with Demonstrated Results • Significant growth opportunities • Highest gross margin in the company • High returns with low capital intensity • High free cash conversion from adjusted EBITDA NDS Enterprise Strategy *Excludes Saudi Arabia newbuilds **Excludes Quail Tools ***Adjusted EBITDA less capex divided by adjusted EBITDA for each segment 3 |
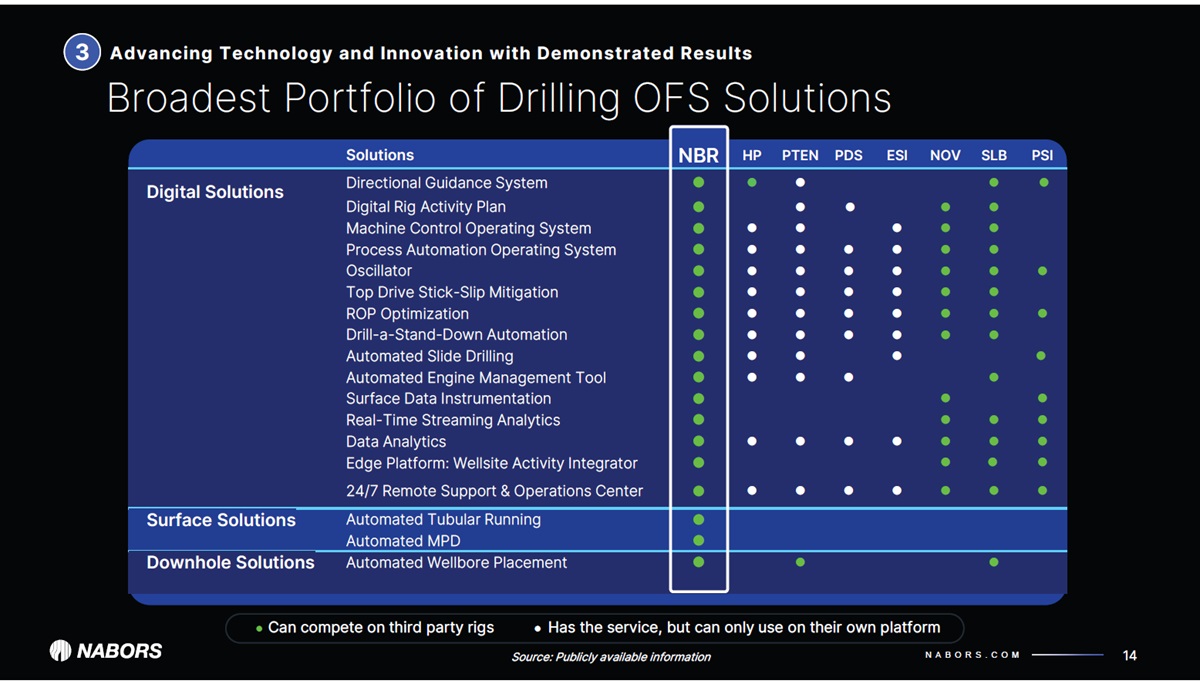
| NABORS.COM Broadest Portfolio of Drilling OFS Solutions Advancing Technology and Innovation with Demonstrated Results 14 Products Pipeline? ● Can compete on third party rigs ● Has the service, but can only use on their own platform Source: Publicly available information Solutions NBR HP PTEN PDS ESI NOV SLB PSI Directional Guidance System ● ● ● ● ● Digital Solutions Digital Rig Activity Plan ● ● ● ● ● Machine Control Operating System ● ● ● ● ● ● Process Automation Operating System ● ● ● ● ● ● ● Oscillator ● ● ● ● ● ● ● ● Top Drive Stick-Slip Mitigation ● ● ● ● ● ● ● ROP Optimization ● ● ● ● ● ● ● ● Drill-a-Stand-Down Automation ● ● ● ● ● ● ● Automated Slide Drilling ● ● ● ● ● Automated Engine Management Tool ● ● ● ● ● Surface Data Instrumentation ● ● ● Real-Time Streaming Analytics ● ● ● ● Data Analytics ● ● ● ● ● ● ● ● Edge Platform: Wellsite Activity Integrator ● ● ● ● 24/7 Remote Support & Operations Center ● ● ● ● ● ● ● ● Surface Solutions Automated Tubular Running ● Automated MPD ● Downhole Solutions Automated Wellbore Placement ● ● ● 3 |
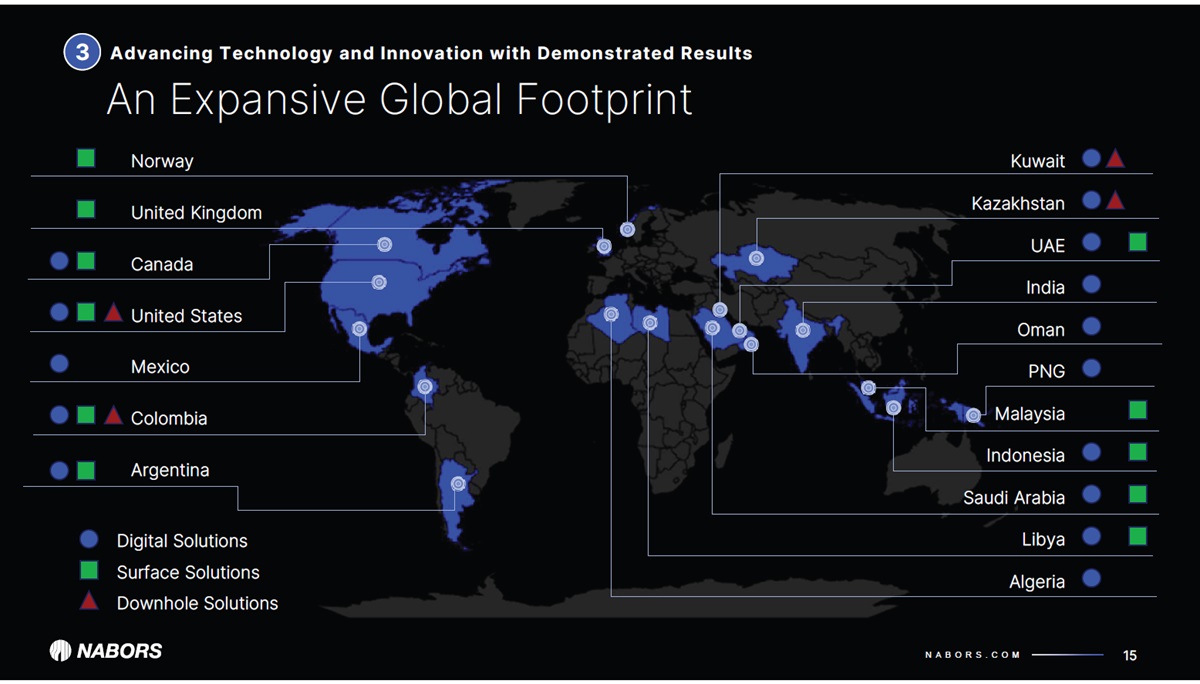
| NABORS.COM An Expansive Global Footprint NABORS DRILLING SOLUTIONS 15 Digital Solutions Surface Solutions Downhole Solutions Canada United States Mexico Colombia Argentina India Kazakhstan Algeria UAE Oman PNG Saudi Arabia Malaysia Indonesia Kuwait Libya United Kingdom Norway 3 Advancing Technology and Innovation with Demonstrated Results |
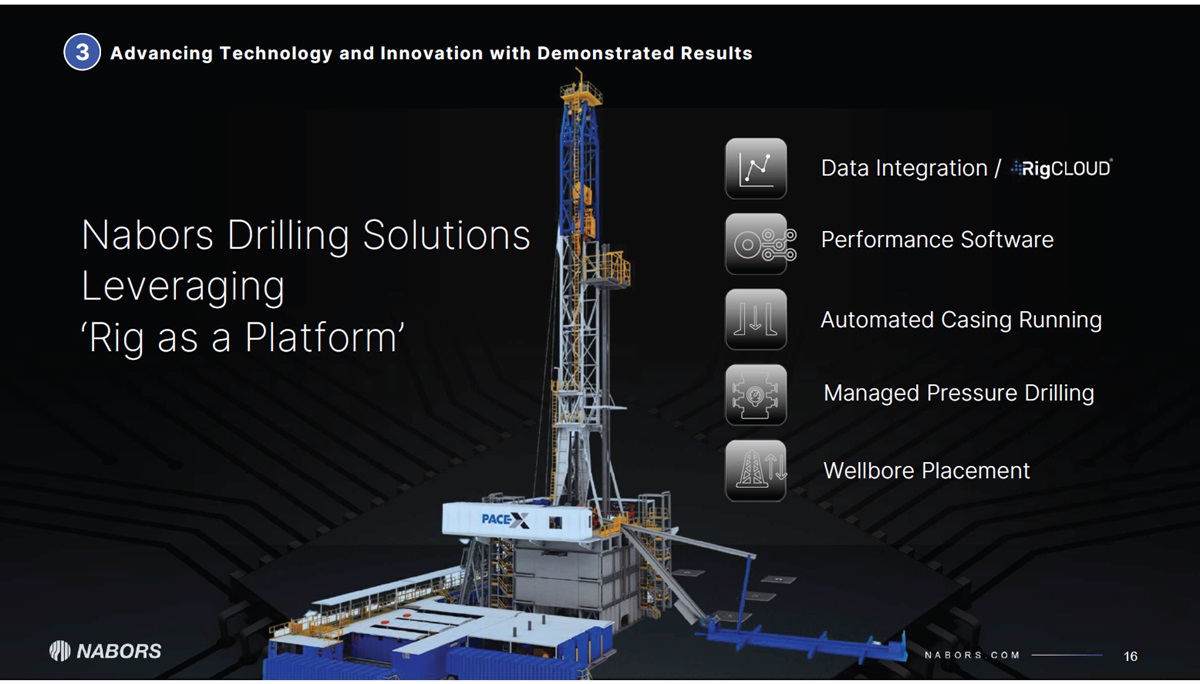
| NABORS.COM 16 Nabors Drilling Solutions Leveraging ‘Rig as a Platform’ Managed Pressure Drilling Performance Software Wellbore Placement Automated Casing Running Data Integration / 3 Advancing Technology and Innovation with Demonstrated Results |
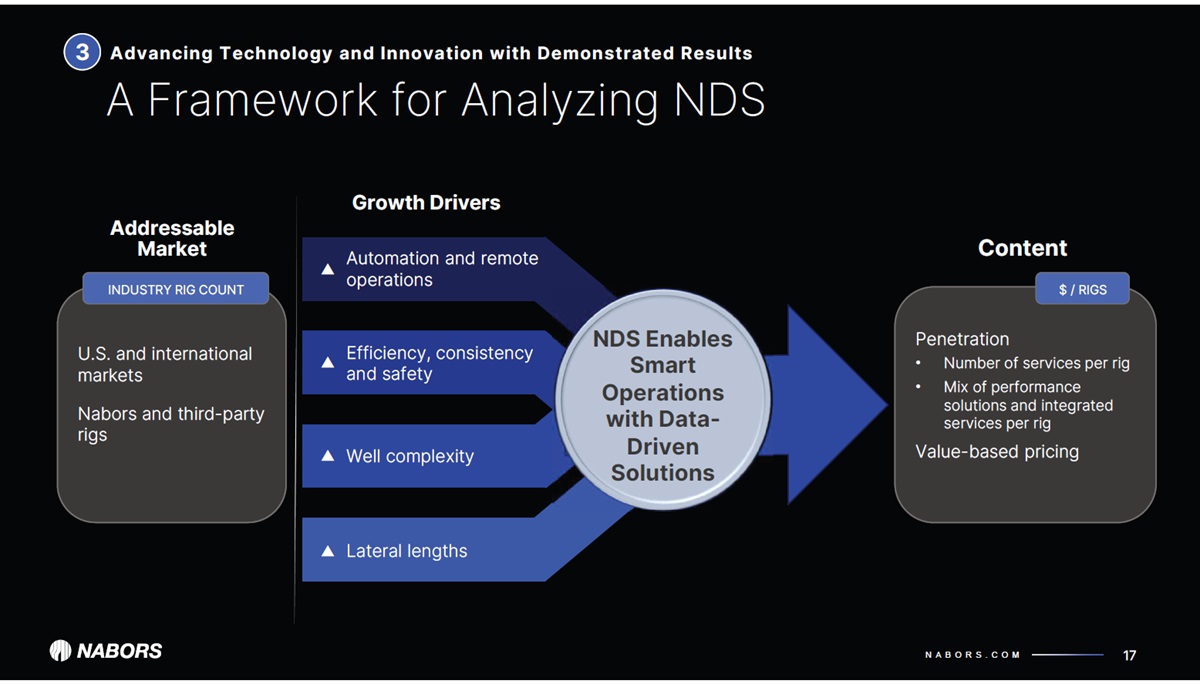
| NABORS.COM 17 A Framework for Analyzing NDS NDS Enables Smart Operations with Data-Driven Solutions 3 Advancing Technology and Innovation with Demonstrated Results Efficiency, consistency and safety Automation and remote operations Well complexity Lateral lengths Addressable Market Growth Drivers Content Penetration • Number of services per rig • Mix of performance solutions and integrated services per rig Value-based pricing $ / RIGS U.S. and international markets Nabors and third-party rigs INDUSTRY RIG COUNT ▲ ▲ ▲ ▲ |
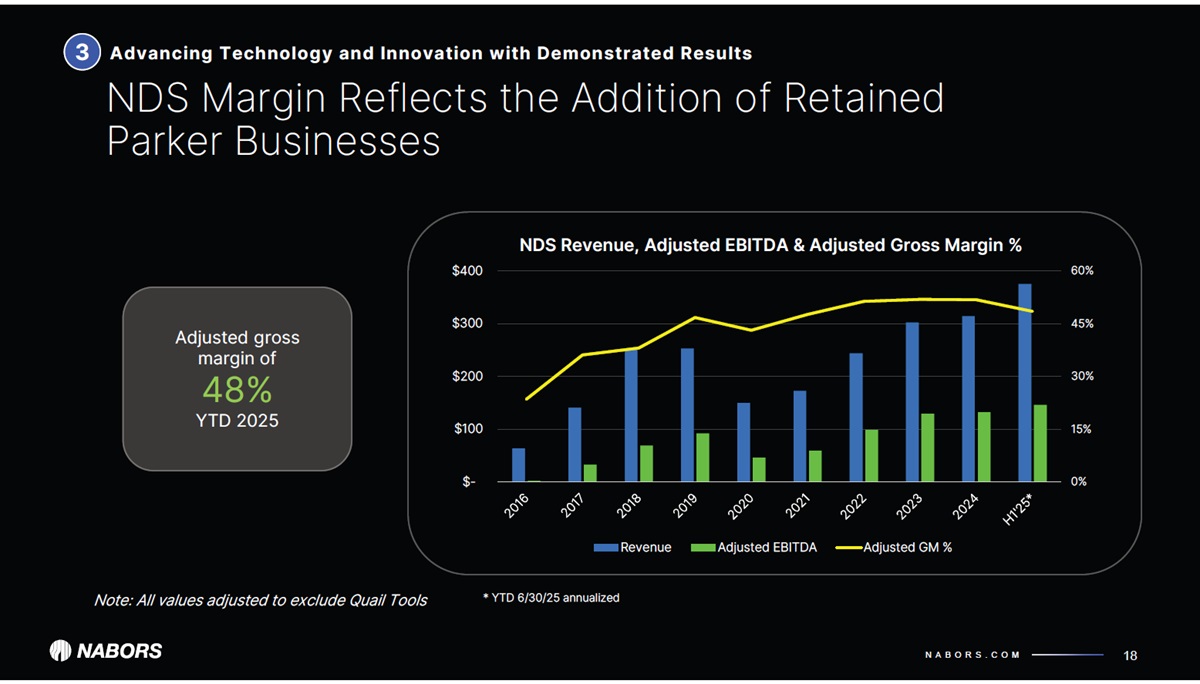
| NABORS.COM 0% 15% 30% 45% 60% $- $100 $200 $300 $400 NDS Revenue, Adjusted EBITDA & Adjusted Gross Margin % Revenue Adjusted EBITDA Adjusted GM % NDS Margin Reflects the Addition of Retained Parker Businesses Advancing Technology and Innovation with Demonstrated Results 18 3 * YTD 6/30/25 annualized Adjusted gross margin of 48% YTD 2025 Note: All values adjusted to exclude Quail Tools |
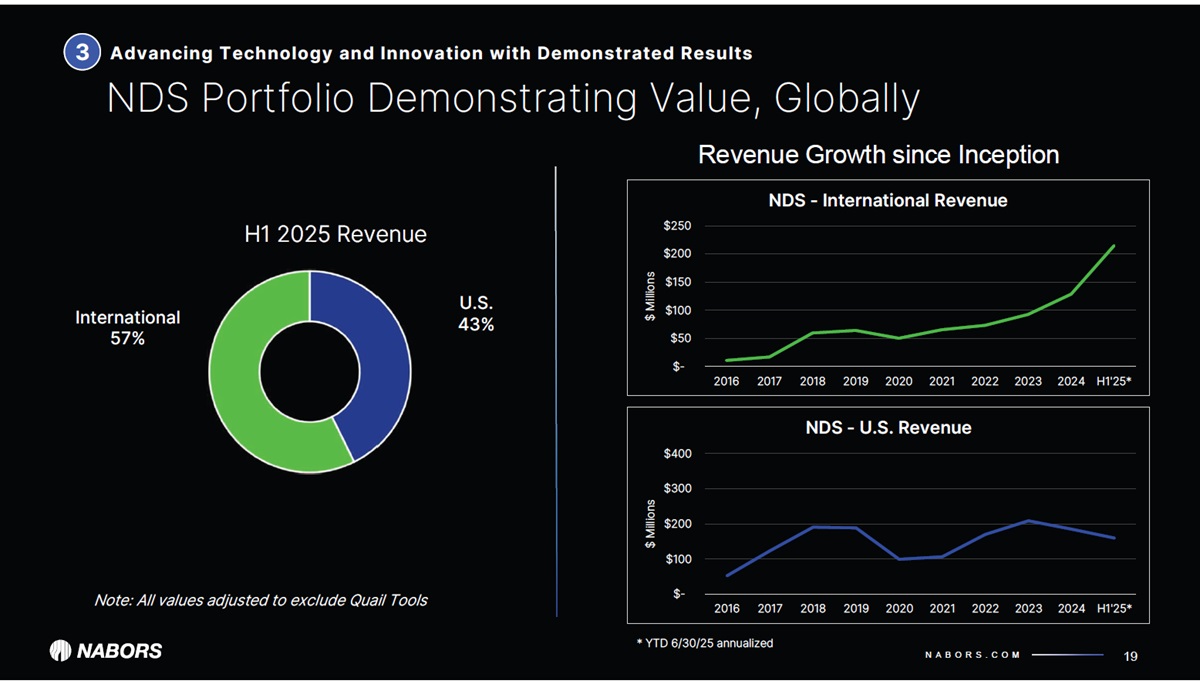
| NABORS.COM $- $100 $200 $300 $400 2016 2017 2018 2019 2020 2021 2022 2023 2024 H1'25* $ Millions NDS - U.S. Revenue $- $50 $100 $150 $200 $250 2016 2017 2018 2019 2020 2021 2022 2023 2024 H1'25* $ Millions NDS - International Revenue NDS Portfolio Demonstrating Value, Globally Advancing Technology and Innovation with Demonstrated Results 19 3 * YTD 6/30/25 annualized Revenue Growth since Inception U.S. 43% International 57% H1 2025 Revenue Note: All values adjusted to exclude Quail Tools |
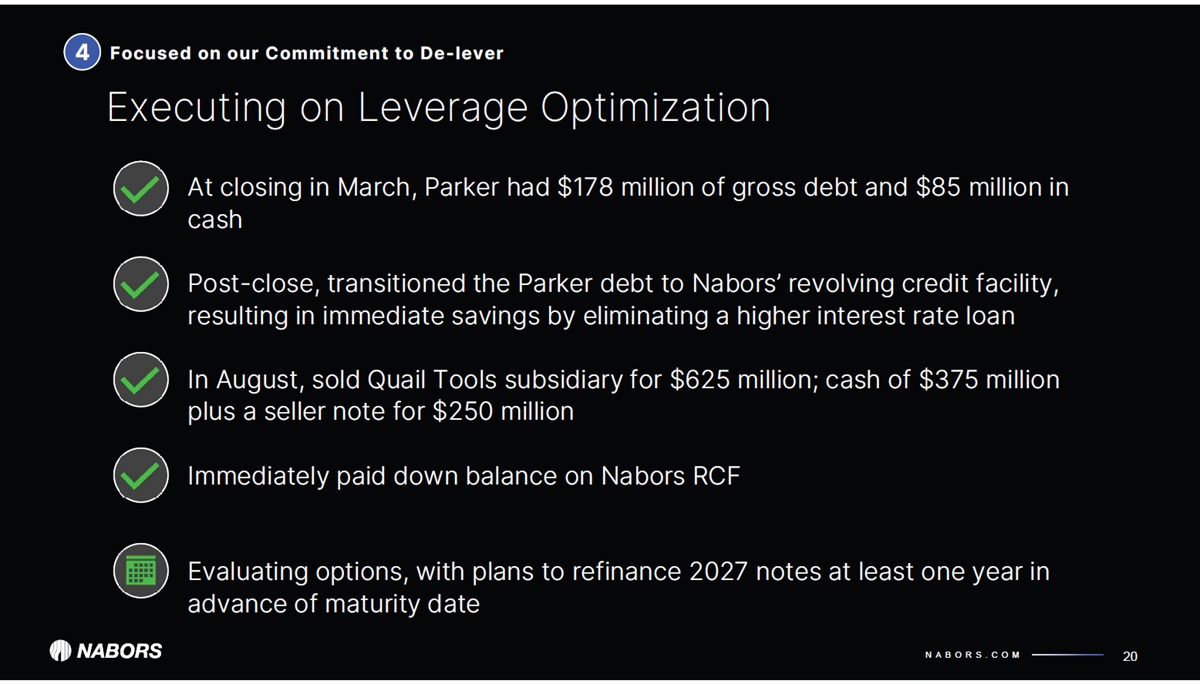
| NABORS.COM x At closing in March, Parker had $178 million of gross debt and $85 million in cash x Post-close, transitioned the Parker debt to Nabors’ revolving credit facility, resulting in immediate savings by eliminating a higher interest rate loan x In August, sold Quail Tools subsidiary for $625 million; cash of $375 million plus a seller note for $250 million x Immediately paid down balance on Nabors RCF x Evaluating options, with plans to refinance 2027 notes at least one year in advance of maturity date Executing on Leverage Optimization Focused on our Commitment to De-lever 20 4 |
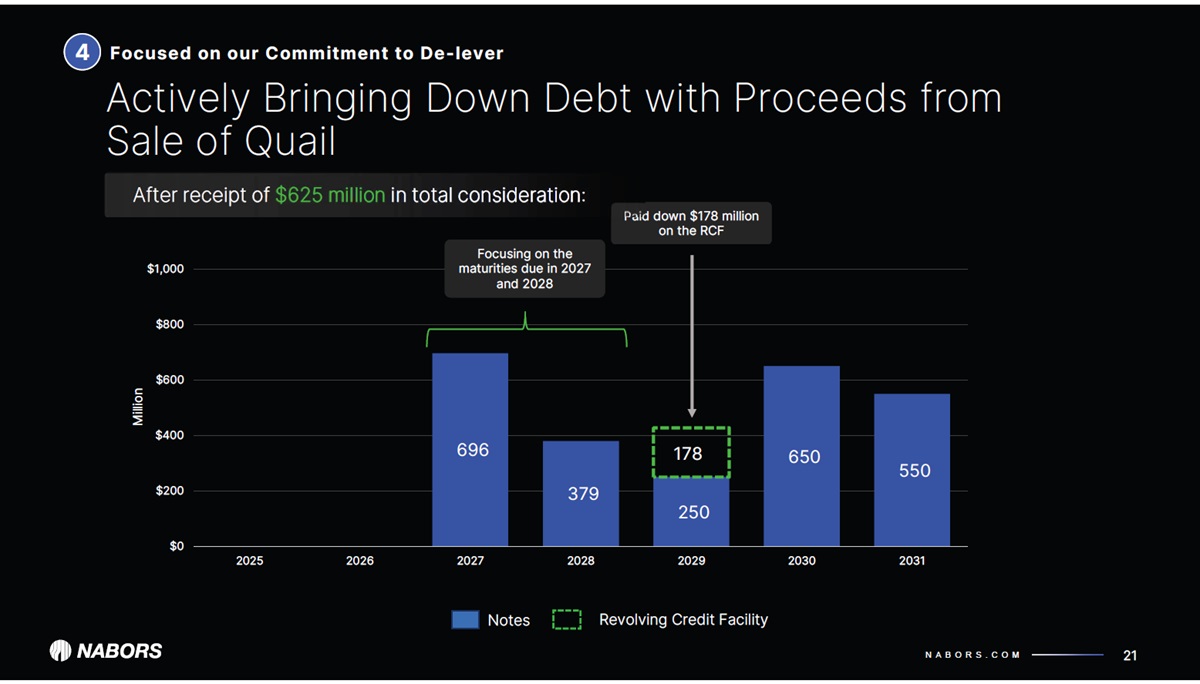
| NABORS.COM 696 379 250 650 550 178 $0 $200 $400 $600 $800 $1,000 2025 2026 2027 2028 2029 2030 2031 Million 21 Actively Bringing Down Debt with Proceeds from Sale of Quail Notes Revolving Credit Facility Focusing on the maturities due in 2027 and 2028 Paid down $178 million on the RCF After receipt of $625 million in total consideration: 4 Focused on our Commitment to De-lever |
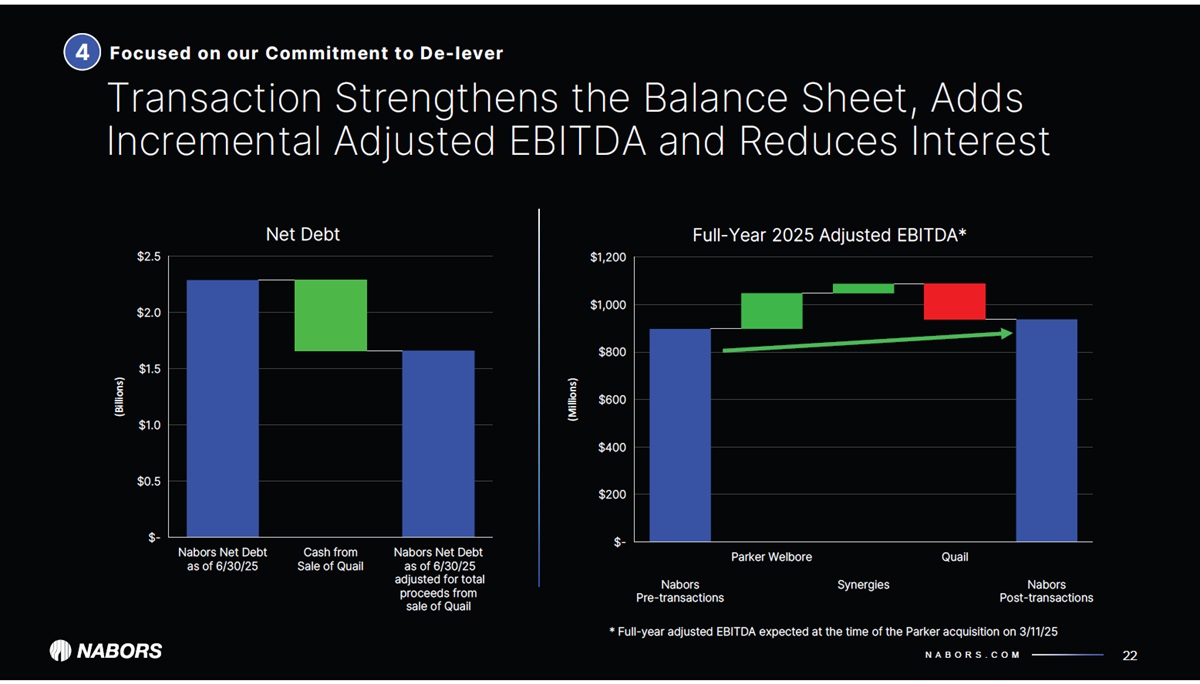
| NABORS.COM Transaction Strengthens the Balance Sheet, Adds Incremental Adjusted EBITDA and Reduces Interest Focused on our Commitment to De-lever 22 4 Nabors Pre-transactions Parker Welbore Synergies Quail Nabors Post-transactions (Millions) $- $200 $400 $600 $800 $1,000 $1,200 Full-Year 2025 Adjusted EBITDA* * Full-year adjusted EBITDA expected at the time of the Parker acquisition on 3/11/25 Nabors Net Debt as of 6/30/25 Cash from Sale of Quail Nabors Net Debt as of 6/30/25 adjusted for total proceeds from sale of Quail (Billions) $- $0.5 $1.0 $1.5 $2.0 $2.5 Net Debt |
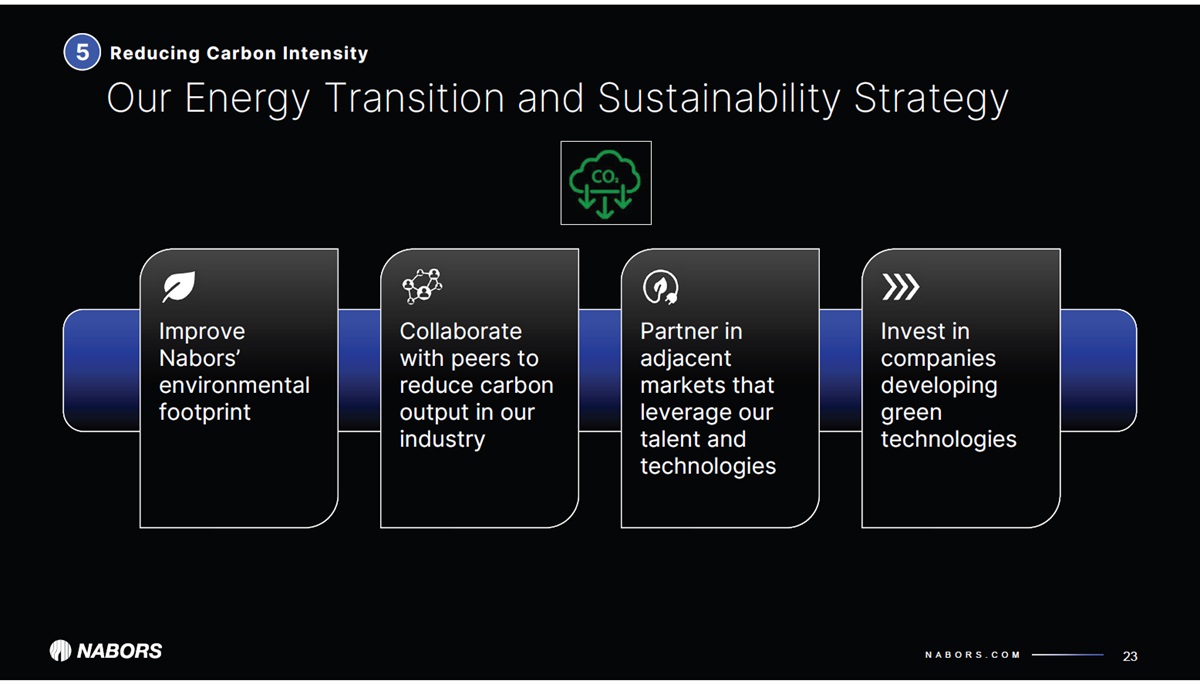
| NABORS.COM Our Energy Transition and Sustainability Strategy Reducing Carbon Intensity 23 Improve Nabors’ environmental footprint Collaborate with peers to reduce carbon output in our industry Partner in adjacent markets that leverage our talent and technologies Invest in companies developing green technologies 5 |
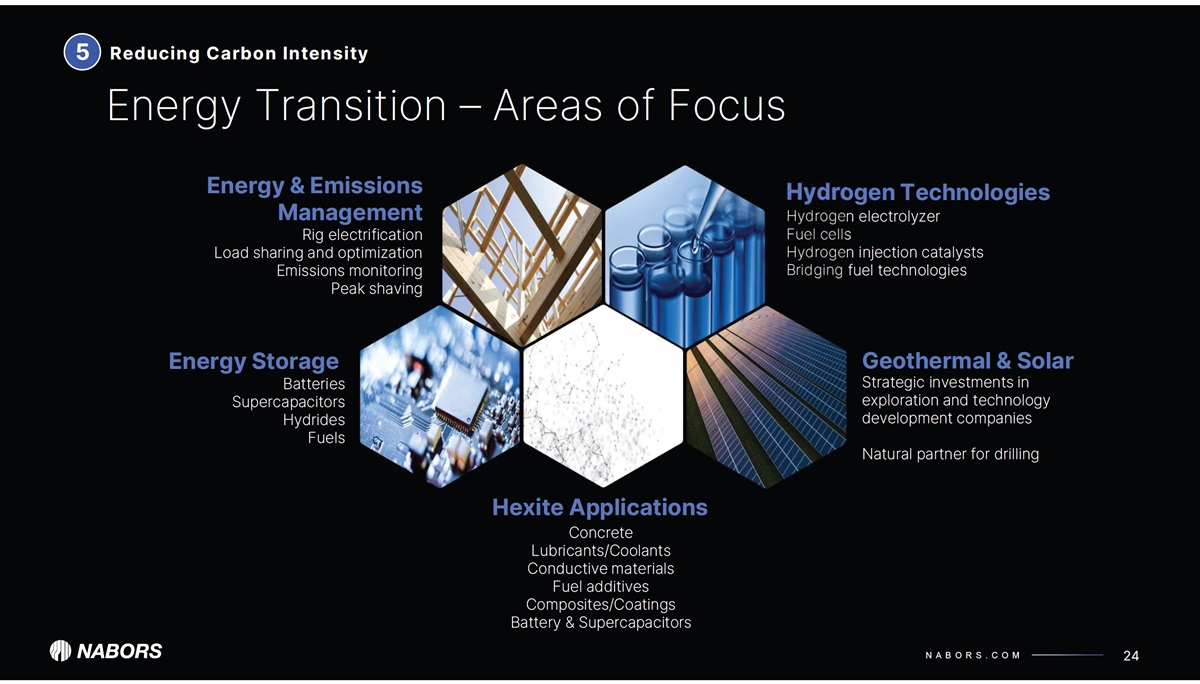
| NABORS.COM Energy Transition – Areas of Focus Reducing Carbon Intensity 24 Energy & Emissions Management Rig electrification Load sharing and optimization Emissions monitoring Peak shaving Energy Storage Batteries Supercapacitors Hydrides Fuels Hydrogen Technologies Hydrogen electrolyzer Fuel cells Hydrogen injection catalysts Bridging fuel technologies Geothermal & Solar Strategic investments in exploration and technology development companies Natural partner for drilling Hexite Applications Concrete Lubricants/Coolants Conductive materials Fuel additives Composites/Coatings Battery & Supercapacitors 5 |
| NABORS.COM Footnotes, Financial Definitions and Disclaimer 25 |
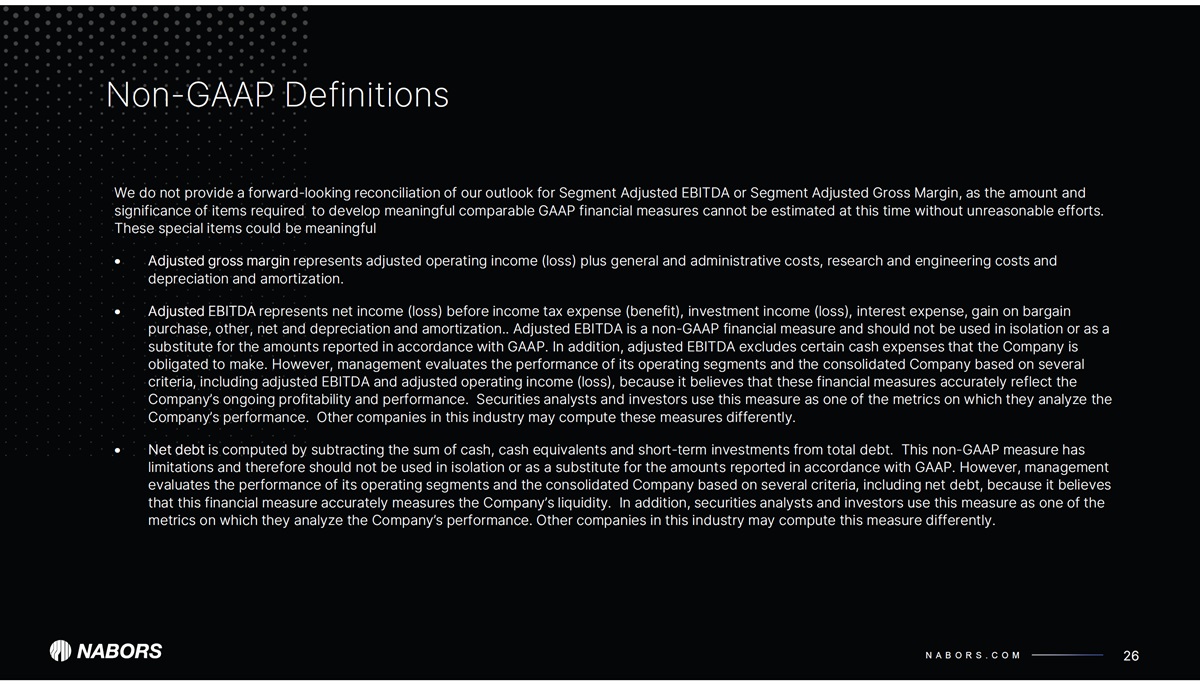
| NABORS.COM 26 Non-GAAP Definitions We do not provide a forward-looking reconciliation of our outlook for Segment Adjusted EBITDA or Segment Adjusted Gross Margin, as the amount and significance of items required to develop meaningful comparable GAAP financial measures cannot be estimated at this time without unreasonable efforts. These special items could be meaningful x A dju ste d gro s s m argin represents adjusted operating income (loss) plus general and administrative costs, research and engineering costs and depreciation and amortization. x A dju ste d E BIT D A represents net income (loss) before income tax expense (benefit), investment income (loss), interest expense, gain on bargain purchase, other, net and depreciation and amortization.. Adjusted EBITDA is a non-GAAP financial measure and should not be used in isolation or as a substitute for the amounts reported in accordance with GAAP. In addition, adjusted EBITDA excludes certain cash expenses that the Company is obligated to make. However, management evaluates the performance of its operating segments and the consolidated Company based on several criteria, including adjusted EBITDA and adjusted operating income (loss), because it believes that these financial measures accurately reflect the Company’s ongoing profitability and performance. Securities analysts and investors use this measure as one of the metrics on which they analyze the Company’s performance. Other companies in this industry may compute these measures differently. x N et d e bt is computed by subtracting the sum of cash, cash equivalents and short-term investments from total debt. This non-GAAP measure has limitations and therefore should not be used in isolation or as a substitute for the amounts reported in accordance with GAAP. However, management evaluates the performance of its operating segments and the consolidated Company based on several criteria, including net debt, because it believes that this financial measure accurately measures the Company’s liquidity. In addition, securities analysts and investors use this measure as one of the metrics on which they analyze the Company’s performance. Other companies in this industry may compute this measure differently. |
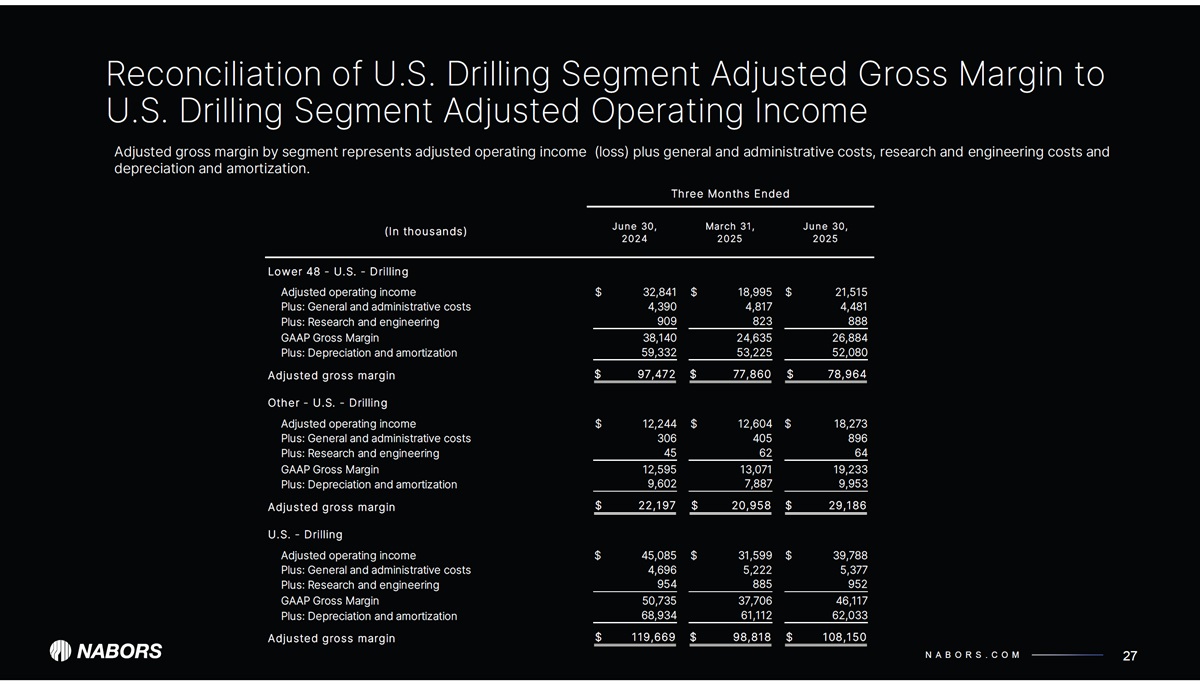
| NABORS.COM Reconciliation of U.S. Drilling Segment Adjusted Gross Margin to U.S. Drilling Segment Adjusted Operating Income 27 Adjusted gross margin by segment represents adjusted operating income (loss) plus general and administrative costs, research and engineering costs and depreciation and amortization. June 3 0, March 31, June 3 0, 2024 2025 2025 L o w er 4 8 - U.S. - Drillin g Adjusted operating income 32,841 $ 18,995 $ 21,515 $ Plus: General and administrative costs 4,390 4,817 4,481 Plus: Research and engineering 909 823 888 GAAP Gross Margin 38,140 24,635 26,884 Plus: Depreciation and amortization 53,225 59,332 52,080 A dju ste d gro s s m argin $ 9 7,4 7 2 $ 7 7,8 6 0 $ 7 8,9 6 4 Oth er - U.S. - Drillin g Adjusted operating income 12,244 $ 12,604 $ 18,273 $ Plus: General and administrative costs 306 405 896 Plus: Research and engineering 45 62 64 GAAP Gross Margin 12,595 13,071 19,233 Plus: Depreciation and amortization 7,887 9,602 9,953 A dju ste d gro s s m argin $ 2 2,19 7 $ 2 0,9 5 8 $ 2 9,18 6 U.S. - Drillin g Adjusted operating income 45,085 $ 31,599 $ 39,788 $ Plus: General and administrative costs 4,696 5,222 5,377 Plus: Research and engineering 954 885 952 GAAP Gross Margin 50,735 37,706 46,117 Plus: Depreciation and amortization 61,112 68,934 62,033 A dju ste d gro s s m argin $ 119,6 6 9 $ 9 8,818 $ 10 8,15 0 (In th o u s a n d s) T hre e M o nth s E n d e d |
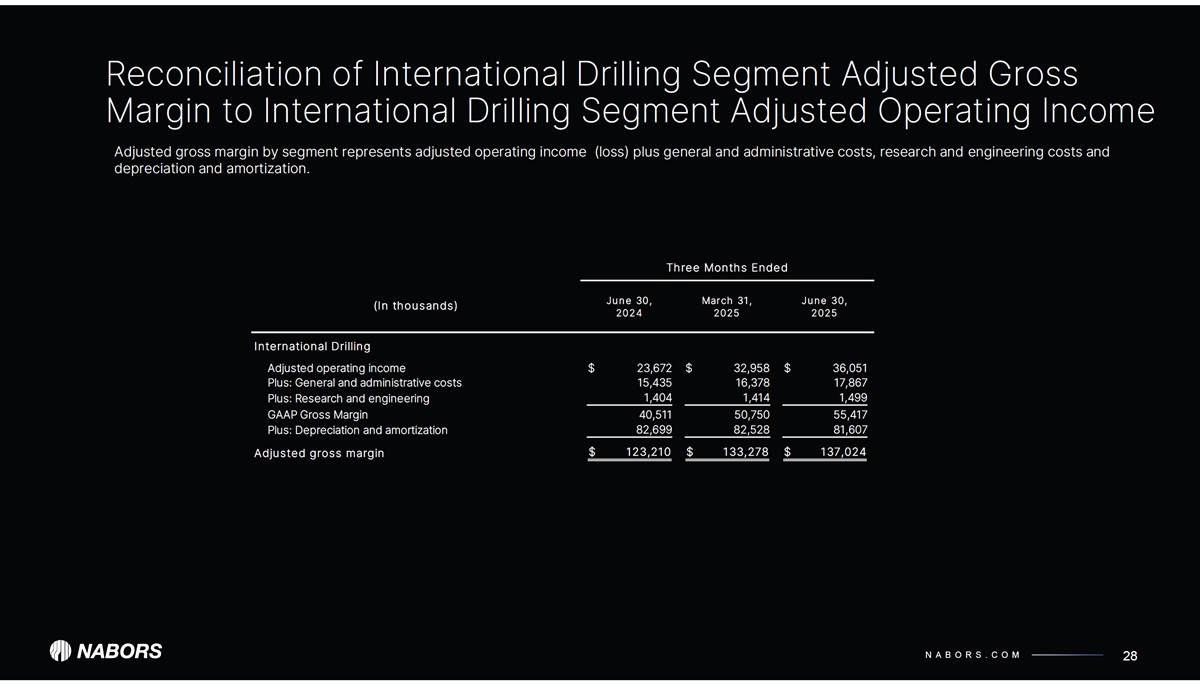
| NABORS.COM Reconciliation of International Drilling Segment Adjusted Gross Margin to International Drilling Segment Adjusted Operating Income 28 Adjusted gross margin by segment represents adjusted operating income (loss) plus general and administrative costs, research and engineering costs and depreciation and amortization. June 3 0, March 31, June 3 0, 2 0 2 4 2 0 25 2 0 25 Intern atio n al Drillin g Adjusted operating income 23,672 $ 32,958 $ 36,051 $ Plus: General and administrative costs 15,435 16,378 17,867 Plus: Research and engineering 1,404 1,414 1,499 GAAP Gross Margin 40,511 50,750 55,417 Plus: Depreciation and amortization 82,528 82,699 81,607 A dju ste d gro s s m argin $ 12 3,210 $ 13 3,2 7 8 $ 1 3 7,0 2 4 T hre e M o nth s E n d e d (In th o u s a n d s) |
| NABORS INDUSTRIES LTD. NABORS.COM NABORS CORPORATE SERVICES 515 W. Greens Road Suite 1200 Houston, TX 77067-4525 @naborsglobal Contact Us: William C. Conroy, CFA VP - Corporate Development and Investor Relations William.Conroy@nabors.com Kara K. Peak Director - Corporate Development and Investor Relations Kara.Peak@nabors.com |