
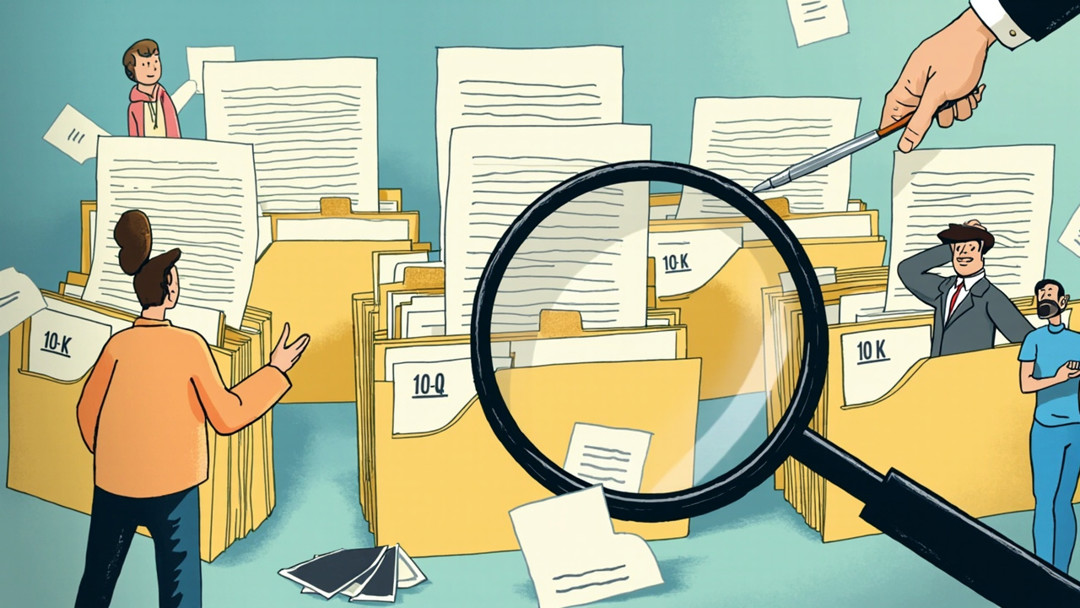
Reading SEC filings is the most direct path to understanding what a company actually does, earns, and owes. Unlike press releases or analyst notes, these documents carry legal weight and are filed under penalty of perjury. This guide walks through the core filings, where to find them, and how to turn raw disclosures into a repeatable research workflow.
Key takeaways
- The 10-K, 10-Q, and 8-K are the three filings that matter most for fundamental analysis.
- Footnotes and the MD&A often contain details that never make it into headlines.
- Insider buying clusters can signal confidence; routine selling is usually noise.
- A repeatable workflow beats reading filings in random order.
- EDGAR full-text search is the fastest way to find specific disclosures.
Why SEC filings are the foundation of stock research

SEC filings are the only company communications that executives must sign under oath, which makes them fundamentally different from earnings calls, investor decks, or media coverage. A 10-K annual report, for example, includes audited financial statements and a management discussion that the CEO and CFO personally certify. If a number is wrong, the consequences are legal, not just reputational. That accountability is why professional investors treat these documents as the primary source for company research.
News articles and analyst reports are interpretations. They summarize, contextualize, and sometimes sensationalize. Filings give you the raw material: revenue recognition policies, segment breakdowns, debt covenants, related-party transactions, and risk factors written by the company itself. When you read a 10-K and a 10-Q together, you are seeing the same information an equity analyst starts with, before any spin is added.
This does not mean filings are easy to read. They are dense, repetitive, and written partly for lawyers. But that density is a feature. The footnotes to the financial statements often contain the most important details, such as changes in accounting estimates or contingent liabilities, that never make it into a headline. Building a habit of reading 10-K and 10-Q documents directly is the single highest-return skill an individual investor can develop.
Navigating EDGAR, the SEC's free filing database

EDGAR, the Electronic Data Gathering, Analysis, and Retrieval system, is the SEC's free public database for every filing a US-listed company submits. It requires no login or subscription. Start at the EDGAR full-text search page, where you can enter a company name, ticker symbol, or Central Index Key (CIK). The ticker search is fastest: type the symbol, select the company from the dropdown, and you land on its filing index.
The filing index lists every document in reverse chronological order. Use the "Filing Type" filter to narrow results. For fundamental analysis, the most important types are 10-K (annual report), 10-Q (quarterly report), 8-K (current events), DEF 14A (proxy statement), and Forms 3, 4, and 5 (insider ownership changes). Each filing row shows the date, type, and a description. Click the "Documents" button to open the actual filing, then choose the primary document, usually an .htm file, to read the formatted version.
Full-text search is the most powerful feature for targeted research. From the EDGAR search page, select "Full-Text Search" and enter a phrase like "supply chain disruption" or "material weakness" along with the company name or CIK. You can restrict results to a date range and filing type. This is how professional analysts find specific disclosures without reading hundreds of pages. For example, searching a retailer's 10-K filings for "inventory obsolescence" across the last three years reveals whether write-downs are recurring or one-time.
Bookmark each company's CIK-based filing index URL. The CIK is a permanent identifier, unlike ticker symbols, which change after mergers or rebrandings. A stable bookmark saves time and ensures you are always looking at the correct entity. EDGAR also offers an RSS feed for each company, so you can receive alerts when new filings post. This turns the database from a passive archive into an active monitoring tool for your watchlist. For programmatic access to filing data, the Equibles API returns structured financials without manual scraping.
Reading the 10-K, the annual report that matters
The 10-K is the most complete document a public company files each year, and reading it well means treating it as your primary source instead of a press release. The document follows a fixed structure, which makes it easier to compare companies across the same industry once you know where to look.
Start with Item 1, the business description. This section explains what the company actually does, who its customers are, and where it generates revenue. Look for concrete details: the percentage of sales from a single product line, dependence on a handful of large customers, or geographic concentration. A company that says revenue is diversified but then discloses that one client accounts for 28% of sales is telling you something the marketing page never will.
Item 1A, risk factors, is where management lists what could go wrong. Read it with a skeptical eye. The risks are often boilerplate, but the order and specificity matter. A company that places cybersecurity threats ahead of supply chain disruptions may be signaling where it spends its anxiety. Compare this section year over year: a newly added risk about a key supplier's financial instability is a red flag worth investigating further.
The Management's Discussion and Analysis, or MD&A, is the section where executives explain the numbers in plain language. This is where the filing gets its narrative. Look for honest admissions about margin pressure, pricing power, or customer churn. When the MD&A blames external factors for every miss while taking credit for every beat, that pattern is a governance warning.
The financial statements themselves, the income statement, balance sheet, and cash flow statement, are the quantitative core. But the notes that follow are where the real details hide. Reading 10-K and 10-Q notes carefully reveals accounting choices, lease obligations, pension assumptions, and contingent liabilities that never appear in the headline numbers. A company can report rising earnings while quietly extending payment terms to customers, a signal that revenue quality is deteriorating.
Finally, use the 10-K as a benchmark. Track how metrics like gross margin, operating cash flow, and share count change from one year to the next. The 10-K rewards a close reading.
Reading the 10-Q, quarterly updates and trend spotting
The 10-Q is the quarterly report that turns annual snapshots into a moving picture. While the 10-K gives you a full year of audited financials, the 10-Q offers unaudited but timely updates on revenue, expenses, cash flow, and balance-sheet shifts. The 10-Q is where you catch momentum changes before they show up in the annual report.
Start by comparing the current quarter to the same quarter last year, not just to the previous quarter. Many businesses have strong seasonality: a retailer's fourth quarter will dwarf its first, so quarter-over-quarter comparisons can mislead. Year-over-year comparison isolates real growth from seasonal noise. Then layer in sequential analysis to spot acceleration or deceleration. If revenue grew 12% year over year last quarter but only 6% this quarter, that slowdown is an early warning sign worth investigating.
Pay close attention to the MD&A section. Here, executives explain what drove the numbers and what they expect next. Look for changes in tone or emphasis compared to the prior 10-Q. A company that quietly shifts from discussing customer acquisition to discussing cost control may be signaling a demand problem.
Also scan the balance sheet for working-capital changes. Rising inventory relative to sales can indicate slowing demand. A jump in accounts receivable may mean the company is extending looser credit terms to book revenue. These trends are easier to spot in quarterly filings because you get four data points per year instead of one.
Finally, compare the 10-Q to the most recent 10-K. The 10-K contains audited annual figures and detailed footnotes; the 10-Q updates those numbers but with less detail. When a quarterly figure diverges sharply from the annual trend, dig into the footnotes and subsequent 8-K filings for explanations. This cross-check helps you separate one-time events from structural changes.
Financial statement analysis from filings
Financial statement analysis turns raw SEC data into decision-ready metrics. The income statement, balance sheet, and cash flow statement each answer a different question: can the company generate profit, does it have enough assets to cover obligations, and is cash actually flowing through the business. Start by pulling the three core statements from the 10-K or 10-Q, then calculate ratios in four categories: liquidity, profitability, leverage, and efficiency.
Liquidity ratios measure short-term solvency. The current ratio divides current assets by current liabilities; a value below 1.0 signals potential trouble meeting near-term bills. The quick ratio removes inventory from current assets, which matters for retailers or manufacturers where inventory may be slow to convert to cash. Both figures come directly from the balance sheet, and comparing them across the last eight quarters shows whether liquidity is improving or deteriorating.
Profitability ratios use the income statement. Gross margin is gross profit divided by revenue, and it reveals pricing power before operating costs. Operating margin subtracts selling, general, and administrative expenses, showing how efficiently management runs the core business. Net margin includes interest and taxes, so a wide gap between operating and net margin often points to heavy debt loads or one-time charges. Return on equity, calculated as net income divided by average shareholders' equity, tells investors how effectively the company compounds retained earnings.
Leverage ratios come from both the balance sheet and income statement. The debt-to-equity ratio divides total liabilities by shareholders' equity; a ratio above 2.0 deserves scrutiny, though capital-intensive industries like utilities or telecoms routinely run higher. The interest coverage ratio divides operating income by interest expense. A coverage ratio below 1.5 means the company spends a large share of operating profit just servicing debt, leaving little buffer for downturns.
Efficiency ratios connect the income statement to the balance sheet. Inventory turnover divides cost of goods sold by average inventory; a falling turnover rate may indicate obsolete stock or weakening demand. Receivables turnover divides revenue by average accounts receivable, and a slowdown here can signal that customers are stretching payments, which often precedes cash flow problems. Days sales outstanding, the inverse of receivables turnover multiplied by 365, gives a concrete number: if it rises from 45 to 70 days over two years, collection is getting harder.
The cash flow statement ties everything together. Operating cash flow should exceed net income over time; if net income grows but operating cash flow stagnates, earnings quality is suspect. Free cash flow, calculated as operating cash flow minus capital expenditures, is the cash left for dividends, buybacks, or debt reduction. A company with rising net income but negative free cash flow for three consecutive years is funding growth with debt or dilution, not operations.
Red flags in the footnotes and MD&A
Footnotes and the MD&A are where companies bury the details that headline numbers gloss over. These sections separate a healthy business from one that is quietly deteriorating. Start with the MD&A's tone: vague language about "challenging conditions" without specific metrics, or a sudden shift from discussing revenue drivers to legal contingencies, often signals management is steering attention away from a problem.
Related-party transactions are a classic warning sign. If a company leases office space from an entity controlled by the CEO, or buys inventory from a supplier owned by a board member, the terms may not reflect market rates. The footnotes must disclose these arrangements, but the depth of detail varies. Compare the stated terms against what an independent third party would charge. A pattern of related-party deals that grows year over year, especially when the company's margins are declining, deserves scrutiny.
Going-concern language is the most direct red flag you can find. When auditors include a paragraph stating there is "substantial doubt about the company's ability to continue as a going concern," that is a formal warning that the business may not survive the next twelve months. Do not dismiss it as boilerplate. Check whether management's mitigation plan in the MD&A is concrete, such as a signed credit facility or committed asset sale, or just aspirational language about "exploring strategic alternatives."
Accounting changes deserve equal attention. A switch in revenue recognition policy, inventory valuation method, or depreciation schedule can inflate current earnings at the expense of future periods. The footnote explaining the change will quantify the impact, but you must read it. If a company changes auditors shortly after an accounting change, treat that combination as a serious signal. Aggressive revenue recognition shows up in footnotes through channel stuffing, bill-and-hold arrangements, or extended payment terms that pull future sales into the current quarter. Compare revenue growth against cash flow from operations; a widening gap between the two is a red flag that reported sales are not converting into cash.
Finally, watch for footnotes that disclose contingent liabilities, such as pending litigation or environmental remediation, with ranges so wide they are meaningless. A company that says a lawsuit could cost "between $10 million and $500 million" is telling you it cannot quantify the risk. That uncertainty belongs in your valuation, not ignored.
Insider transactions and ownership via Forms 3, 4, and 5
Insider buying and selling data is one of the most direct signals you can pull from SEC filings, because it reflects what executives and large shareholders actually do with their own money. Form 3 is filed when someone becomes an insider, typically within 10 days of a new appointment or acquisition of more than 10% of a company's shares. It establishes their initial ownership position. Form 4 is the workhorse: insiders must report any change in beneficial ownership within two business days of the transaction. Form 5 catches smaller, exempt transactions that did not need to be reported on Form 4, filed annually within 45 days of the company's fiscal year end.
Pay closest attention to clusters of open-market purchases by multiple officers or directors. A single insider buying shares can be noise; three or four insiders buying within the same quarter often signals genuine confidence in the company's direction. Conversely, routine selling tied to a prearranged 10b5-1 trading plan is far less informative than a sudden, large sale outside any plan. The footnotes on Form 4 disclose whether a transaction was part of such a plan, so do not skip them.
Ownership concentration matters too. A CEO who holds a meaningful percentage of outstanding shares has skin in the game, while a management team that has been steadily reducing its stake while issuing optimistic guidance deserves a closer look. Cross-reference the ownership table in the annual proxy statement with the transaction history on Forms 4 and 5 to see the trend over time. This is fundamental analysis at its most practical: the numbers tell you what insiders believe, not what they say.
One caveat: insider activity is a signal, not a verdict. Executives sell for personal reasons, diversification, or tax planning. Buying is generally more informative than selling, but even buying can be wrong. Use insider data alongside the financial statement analysis from the 10-K and 10-Q, never as a standalone trigger for a trade.
Proxy statements and corporate governance signals
The DEF 14A filing, commonly called the proxy statement, is the annual report on how a company governs itself. It arrives ahead of the shareholder meeting and lays out the board's composition, executive pay packages, and any proposals shareholders will vote on. This document often reveals more about management's priorities than the income statement does.
Executive compensation is the first place to look. The summary compensation table shows salary, bonus, stock awards, and option grants for the CEO, CFO, and the next three highest-paid officers. Compare pay to performance over three to five years. If total compensation rises while return on invested capital falls, that misalignment is a warning sign. Also check the ratio of CEO pay to median employee pay, which the proxy must disclose. A ratio above 300 to 1 without a clear performance justification deserves scrutiny.
Board independence matters because directors who lack ties to management are more likely to challenge poor decisions. The proxy lists each director's independence status, committee assignments, and any related-party transactions. Look for an audit committee composed entirely of independent directors, a compensation committee that uses an external consultant, and a lead independent director or separate chair when the CEO also chairs the board. These structural details affect how quickly problems get caught and fixed.
Shareholder proposals in the proxy signal what activist investors and large asset managers consider material. A proposal asking for climate risk disclosure or a report on political spending may not pass, but a 30 percent or higher vote in favor tells you the issue has momentum. Companies that ignore repeated high-vote proposals often face proxy fights later, which can distract management and depress returns.
Governance quality is not a guarantee of outperformance, but poor governance is a reliable predictor of tail risk. When you read a DEF 14A alongside the 10-K, you see not just what management did, but how they are held accountable for doing it.
Using 8-K filings for breaking corporate events
An 8-K is the SEC's mechanism for disclosing material events between quarterly reports. Unlike the 10-K or 10-Q, which follow a fixed schedule, an 8-K must be filed within four business days of a triggering event. This makes it the fastest official signal for acquisitions, executive departures, earnings restatements, and other developments that can move a stock price before the next scheduled filing.
Common triggers include entry into a material definitive agreement, completion of an acquisition or disposition of assets, results of operations and financial condition, and changes in control of the registrant. Item 5.02 covers departures of directors or principal officers, while Item 4.02 addresses non-reliance on previously issued financial statements. Each item number corresponds to a specific disclosure category, so learning the structure lets you scan filings quickly.
For timely research, monitor 8-K filings through EDGAR's full-text search or RSS feeds tied to specific tickers. Many investors set alerts for Item 1.01 (material agreements) and Item 2.01 (completion of acquisitions), because these often precede analyst revisions. When an 8-K appears, read the exhibit attachments, not just the cover page. The actual merger agreement, employment contract, or restatement details live in the exhibits and contain the terms that matter for valuation.
A restatement 8-K deserves special attention. If a company files an Item 4.02 stating that prior financials should not be relied upon, the market often reacts sharply. Compare the restated figures with the original 10-K or 10-Q to understand the magnitude and direction of the error. This turns a breaking event into a research edge, but always verify the underlying numbers before acting.
Building a repeatable research workflow
A disciplined workflow turns SEC filings from a wall of documents into a decision-ready research process. The goal is consistency: every company you evaluate gets the same scrutiny, so you can compare apples to apples and avoid missing a red flag because you were tired or rushed. Here is a step-by-step checklist you can run for any US stock.
- Start with EDGAR full-text search. Use the company's ticker or CIK to pull all filings from the last three years. Filter to 10-K, 10-Q, 8-K, DEF 14A, and Forms 3, 4, and 5. Download the primary documents for offline reading.
- Read the latest 10-K first. Focus on Item 1 (Business), Item 1A (Risk Factors), Item 7 (MD&A), and Item 8 (Financial Statements). Note the auditor's opinion: an unqualified opinion is expected; anything else is a stop sign.
- Pull the last four 10-Qs. Compare revenue, operating income, and cash flow from operations quarter over quarter and year over year. Look for divergences between net income and operating cash flow, which can signal accrual manipulation or deteriorating working capital.
- Calculate five core ratios. From the income statement and balance sheet: gross margin, operating margin, current ratio, debt-to-equity, and free cash flow yield. Track these across the last eight quarters to spot trends, not just snapshots.
- Screen the footnotes and MD&A for red flags. Search for keywords like "restatement," "material weakness," "related party," "going concern," "change in accounting principle," and "non-GAAP" adjustments. Each deserves a deeper read before you proceed.
- Check insider activity. Review Forms 4 filed in the last six months. Heavy insider selling without a stated diversification plan, or a pattern of sales right before earnings, is a caution signal. Conversely, open-market purchases by multiple officers can be a mild positive.
- Review the proxy statement. Look at executive compensation structure, board independence, and any shareholder proposals. Governance red flags often appear here before they hit the income statement.
- Document your findings. Keep a one-page template per company: thesis, key ratios, red flags, insider activity, and follow-up questions. This makes your research repeatable and lets you revisit a stock in six months without starting from scratch.
This workflow takes about two to three hours per company once you are familiar with the forms. The payoff is that you stop reacting to headlines and start evaluating the same underlying data that professional analysts use. When a step needs one specific passage rather than a whole document, filing and earnings-call search pulls the exact exhibit or footnote you are after.
Common mistakes to avoid
Even experienced investors fall into predictable traps when they rely on SEC filings alone. The most damaging mistake is treating a single 10-K as a complete picture. A company's annual report is a snapshot, not a trend. Without comparing it to the prior year's 10-K and the three most recent 10-Qs, you miss whether revenue growth is accelerating or stalling, whether margins are expanding or eroding, and whether management's narrative matches the numbers.
Ignoring the footnotes is equally costly. The notes to financial statements contain the assumptions behind revenue recognition, lease obligations, pension liabilities, and contingent risks. A company can report healthy earnings while hiding a material weakness in internal controls or an off-balance-sheet liability in the fine print. Skim the footnotes and you are reading marketing material.
Misreading non-GAAP metrics is a third common error. Companies often highlight adjusted EBITDA or free cash flow while burying the reconciliation to GAAP net income. These adjustments can be legitimate, but they can also strip out real costs like stock-based compensation or restructuring charges. Always trace the reconciliation and ask whether the adjustment makes the business look better than it is.
Finally, many researchers fail to compare across peers. A 20% gross margin may look fine in isolation but is a red flag if every competitor in the industry reports 35%. Filing analysis only becomes meaningful when you benchmark against sector norms and historical performance. Build a checklist that forces you to review multiple periods, read every footnote, reconcile non-GAAP figures, and pull at least two peer filings before you form a conclusion.
Frequently asked questions
Where can I find SEC filings for free?
All public companies file through EDGAR, the SEC's database at sec.gov. You can search by company name, ticker, or CIK number. Most filings appear within minutes of submission, and you can download them as HTML, text, or PDF without creating an account.
What is the most important section of a 10-K?
The Management's Discussion and Analysis (MD&A) explains results in management's own words, including trends, risks, and unusual events. Read it alongside the financial statements and footnotes. The MD&A often reveals what executives are worried about, which numbers alone cannot show.
How do I spot red flags in SEC filings?
Look for sudden changes in accounting policies, frequent restatements, growing receivables that outpace revenue, unusual related-party transactions, and vague risk-factor language. Compare the current filing with previous periods. A single red flag is not proof of fraud, but multiple warnings deserve deeper investigation.
How often should I check a company's filings?
At minimum, review the 10-K annually and the 10-Q each quarter. Also monitor 8-K filings for material events like acquisitions, executive departures, or auditor changes. Setting EDGAR email alerts for companies you follow keeps you current without daily manual searches.
Can I rely on SEC filings alone for stock research?
Filings provide the factual foundation, but they are backward-looking and written by the company. Pair them with industry data, competitor comparisons, and independent analysis. For investment decisions, consider consulting a qualified financial professional, especially when large sums are involved.
You can search company filings for free through SEC EDGAR. If you want faster cross-document retrieval with exact passages, use the filing and earnings-call search on Equibles.
This article is for information only and is not investment advice.