
ACEL 8-K
Accel Entertainment, Inc. (ACEL)
8-K
2021-03-15
For: 2021-03-15
View Original
Added on
April 08, 2026
UNITED STATES
SECURITIES AND EXCHANGE COMMISSION
Washington, D.C. 20549
FORM 8-K
CURRENT REPORT
Pursuant to Section 13 or 15(d)
of the Securities Exchange Act of 1934
Date of Report (Date of earliest event reported): March 15, 2021
(Exact name of registrant as specified in its charter)
| (State or other jurisdiction of incorporation) | (Commission File Number) | (IRS Employer Identification No.) | |||||||||||||||
| , | |||||||||||||||||
| (Address of principal executive offices) | (Zip Code) | ||||||||||||||||
(630 ) 972-2235
(Registrant’s telephone number, including area code)
(Former name or former address, if changed since last report)
Check the appropriate box below if the Form 8-K filing is intended to simultaneously satisfy the filing obligation of the registrant under any of the following provisions:
Securities registered pursuant to Section 12(b) of the Act:
| Title of each class | Trading symbol(s) | Name of each exchange on which registered | ||||||
Indicate by check mark whether the registrant is an emerging growth company as defined in Rule 405 of the Securities Act of 1933 (§230.405 of this chapter) or Rule 12b-2 of the Securities Exchange Act of 1934 (§240.12b-2 of this chapter).
Emerging growth company ☒
If an emerging growth company, indicate by check mark if the registrant has elected not to use the extended transition period for complying with any new or revised financial accounting standards provided pursuant to Section 13(a) of the Exchange Act. ☐
Item 2.02. Results of Operations and Financial Condition.
On March 15, 2021, the Company issued a press release announcing its financial and operating results for the fourth quarter and year ended December 31, 2020. Copies of the Company’s press release and investor presentation are attached and furnished herewith as Exhibits 99.1 and 99.2 to this Form 8-K and are incorporated herein by reference.
Information in this report (including Exhibits 99.1 and 99.2) furnished pursuant to Item 2.02 shall not be deemed to be “filed” for the purposes of Section 18 of the Securities Exchange Act of 1934 or otherwise subject to the liabilities of that Section.
The Company announces material information to the public through a variety of means, including filings with the Securities and Exchange Commission, press releases, public conference calls, and the Company’s investor relations website (https:// ir.accelentertainment.com) as means of disclosing material non-public information and for complying with its disclosure obligations under Regulation FD.
Item 9.01 Financial Statements and Exhibits.
(d) Exhibits
| Exhibit Number | Description | |||||||
| 99.1 | ||||||||
| 99.2 | ||||||||
| 104 | Cover Page Interactive Data File (embedded within the Inline XBRL document) | |||||||
2
SIGNATURE
Pursuant to the requirements of the Securities Exchange Act of 1934, the registrant has duly caused this report to be signed on its behalf by the undersigned hereunto duly authorized.
| ACCEL ENTERTAINMENT, INC. | |||||||||||
| Date: March 15, 2021 | By: | /s/ Brian Carroll | |||||||||
| Brian Carroll | |||||||||||
| Chief Financial Officer | |||||||||||
3
Accel Entertainment Announces 2020 Operating Results
Chicago, IL – March 15, 2021 – Accel Entertainment, Inc. (NYSE: ACEL) today announced certain financial and operating results for the three-months and fiscal year ended December 31, 2020.
Highlights
•Ended 2020 with 2,435 locations; an increase of 5% compared to 2019
•Ended 2020 with 12,247 VGTs; an increase of 17% compared to 2019
•Revenue of $74 million for Q4 2020 and $316 million for YE 2020
•Net loss of $10 million for Q4 2020 and $13 million for YE 2020
•Adjusted EBITDA of $5 million for Q4 2020 and $34 million for YE 2020
•Completed acquisition of American Video Gaming on December 30, 2020, an Illinois operator with 49 locations
Recent Events
•February 2021 was the highest revenue month in Accel’s history
•Entered into a securities purchase agreement in March 2021 to acquire Century Gaming, Inc., one of the leading distributed gaming operators in Montana and Nevada
2021 Guidance
While it is difficult to predict the duration and impact of COVID-19, our 2021 guidance includes the impact of the January 2021 shutdown, assumes no M&A, and includes increased operating expenses for COVID-19.
•End 2021 with an estimated 13,250 – 13,400 VGTs
•End 2021 with an estimated 2,550 – 2,575 locations
•2021 Revenue estimated to be $580 - $600 million
•2021 Adjusted EBITDA[1] estimated to be $95 - $100 million
•2021 capital expenditures estimated to be $20-$25 million of cash spend
Accel Entertainment CEO Andy Rubenstein commented, “We are pleased to have achieved strong financial results for both the fourth quarter and full year 2020, despite industry-wide complexities resulting from the COVID-19 pandemic. Our asset-light business model was key to allowing us to end the year stronger than ever, and execute on our growth plans to secure additional scale, as illustrated by our recent acquisition of American Video Gaming. As a result of these efforts we have begun 2021 with a strong tailwind, achieving the highest revenue month in our history in February. We’re confident we are well-positioned to continue this success as the market recovers and we remain focused on delivering a safe, yet comfortable gaming experience for our players.”
[1] Although we provide guidance for Adjusted EBITDA, we are not able to provide guidance for net income, the most directly comparable GAAP measure. Certain elements of the composition of GAAP net income, including stock-based compensation expenses, are not predictable, making it impractical for us to provide guidance on net income or to reconcile our Adjusted EBITDA guidance to net income without unreasonable efforts. For the same reason, we are unable to address the probable significance of the unavailable information.
1
| Consolidated Statements of Operations and Comprehensive (Loss) Income and Other Data | |||||||||||||||||||||||
| Three Months Ended December 31, | Year Ended December 31, | ||||||||||||||||||||||
| (in thousands) | 2020 | 2019 | 2020 | 2019 | |||||||||||||||||||
| (As Restated) | (As Restated) | ||||||||||||||||||||||
| Total net revenues | $ | 74,414 | $ | 122,812 | $ | 316,352 | $ | 428,696 | |||||||||||||||
| Operating loss | (11,966) | (5,657) | (24,679) | 13,336 | |||||||||||||||||||
| Loss before income taxes | (13,650) | (19,976) | (29,902) | (10,502) | |||||||||||||||||||
| Net loss | (10,411) | (22,425) | (12,984) | (15,701) | |||||||||||||||||||
| Other Financial Data: | |||||||||||||||||||||||
Adjusted EBITDA(1) | 4,708 | 20,795 | 33,901 | 79,594 | |||||||||||||||||||
Adjusted net (loss) income(2) | (4,134) | 1,300 | 5,776 | 22,695 | |||||||||||||||||||
| (1) | Adjusted EBITDA is defined as net (loss) income plus amortization of route and customer acquisition costs and location contracts acquired; stock-based compensation expense; (gain) loss on change in fair value of contingent earnout A-2 shares; other expenses, net; tax effect of adjustments; depreciation and amortization of property and equipment; interest expense; emerging markets; and provision for income taxes. For additional information on Adjusted EBITDA and a reconciliation of net (loss) income to Adjusted EBITDA, see “Non-GAAP Financial Measures—Adjusted EBITDA and Adjusted net (loss) income.” | ||||
| (2) | Adjusted net (loss) income is defined as net (loss) income plus amortization of route and customer acquisition costs and location contracts acquired; stock-based compensation expense; (gain) loss on change in fair value of contingent earnout A-2 shares, other expenses, net; and tax effect of adjustments. For additional information on Adjusted net (loss) income and a reconciliation of net (loss) income to Adjusted net (loss) income, see "Non-GAAP Financial Measures— Adjusted EBITDA and Adjusted net (loss) income.” | ||||
| Key Metrics | |||||||||||
| As of December 31, | |||||||||||
| 2020 | 2019 | ||||||||||
Licensed establishments (1) | 2,435 | 2,312 | |||||||||
Video gaming terminals (2) | 12,247 | 10,499 | |||||||||
Average remaining contract term (years) (3) | 6.8 | 6.9 | |||||||||
| December 31, | |||||||||||
| 2020 | 2019 | ||||||||||
Location hold-per-day – for the three months ended(4) (in whole $) | $583 | $554 | |||||||||
Location hold-per-day – for the year ended(4) (in whole $) | $585 | $590 | |||||||||
2
| (1) | Based on Scientific Games International third-party terminal operator portal data which is updated at the end of each gaming day and includes licensed establishments that may be temporarily closed but still connected to the central system. This metric is utilized by Accel to continually monitor growth from existing locations, organic openings, acquired locations, and competitor conversions. | ||||
| (2) | Based on Scientific Games International third-party terminal operator portal data which is updated at the end of each gaming day and includes VGTs that may be temporarily shut off but still connected to the central system. This metric is utilized by Accel to continually monitor growth from existing locations, organic openings, acquired locations, and competitor conversions. | ||||
| (3) | Calculated by determining the average expiration date of all outstanding contracts, and then subtracting the applicable measurement date. The IGB limited the length of contracts entered into after February 2, 2018 to a maximum of eight years with no automatic renewals. | ||||
| (4) | Calculated by dividing the difference between cash deposited in all VGTs at each licensed establishment and tickets issued to players at each licensed establishment by the number of locations in operation each day during the period being measured. Then divide the calculated amount by the number of operating days in such period. Excluding the Grand River Jackpot acquisition, location hold-per-day was $649 and $637 for the three months and year ended December 31, 2020, respectively. Location hold-per-day for the year ended December 31, 2020 is computed based on 217-eligible days of gaming (excludes 148 non-gaming days due to the IGB mandated COVID-19 shutdown). | ||||
Consolidated Statements of Cash Flows Data | |||||||||||
| Year Ended December 31, | |||||||||||
| (in thousands) | 2020 | 2019 | |||||||||
| (As Restated) | |||||||||||
| Net cash (used in) provided by operating activities | $ | (3,705) | $ | 45,565 | |||||||
| Net cash used in investing activities | (61,435) | (151,532) | |||||||||
| Net cash provided by financing activities | 74,188 | 139,141 | |||||||||
3
Non-GAAP Financial Measures | |||||||||||||||||||||||
| Three Months Ended December 31, | Year Ended December 31, | ||||||||||||||||||||||
| (in thousands) | 2020 | 2019 | 2020 | 2019 | |||||||||||||||||||
| (As Restated) | (As Restated) | ||||||||||||||||||||||
| Net loss | $ | (10,411) | $ | (22,425) | $ | (12,984) | $ | (15,701) | |||||||||||||||
| Adjustments: | |||||||||||||||||||||||
Amortization of route and customer acquisition costs and location contracts acquired(1) | 5,830 | 4,763 | 22,608 | 17,975 | |||||||||||||||||||
Stock-based compensation(2) | 1,483 | 1,852 | 5,538 | 2,236 | |||||||||||||||||||
(Gain) loss on change in fair value of contingent earnout shares(3) | (1,850) | 9,836 | (8,484) | 9,837 | |||||||||||||||||||
Other expenses, net(4) | 3,228 | 12,103 | 8,948 | 19,649 | |||||||||||||||||||
Tax effect of adjustments(5) | (2,414) | (4,829) | (9,850) | (11,301) | |||||||||||||||||||
| Adjusted net (loss) income | (4,134) | 1,300 | $ | 5,776 | $ | 22,695 | |||||||||||||||||
| Depreciation and amortization of property and equipment | 5,670 | 7,734 | 20,969 | 26,398 | |||||||||||||||||||
| Interest expense, net | 3,534 | 3,342 | 13,707 | 12,860 | |||||||||||||||||||
Emerging markets(6) | 463 | — | 517 | — | |||||||||||||||||||
| Income tax (benefit) expense | (825) | 7,278 | (7,068) | 16,500 | |||||||||||||||||||
| Loss on debt extinguishment | — | 1,141 | — | 1,141 | |||||||||||||||||||
| Adjusted EBITDA | 4,708 | 20,795 | $ | 33,901 | $ | 79,594 | |||||||||||||||||
(1) Route and customer acquisition costs consist of upfront cash payments and future cash payments to third-party sales agents to acquire the licensed video gaming establishments that are not connected with a business combination. Accel amortizes the upfront cash payment over the life of the contract, including expected renewals, beginning on the date the location goes live, and recognizes non-cash amortization charges with respect to such items. Future or deferred cash payments, which may occur based on terms of the underlying contract, are generally lower in the aggregate as compared to established practice of providing higher upfront payments, and are also capitalized and amortized over the remaining life of the contract. Future cash payments do not include cash costs associated with renewing customer contracts as Accel does not generally incur significant costs as a result of extension or renewal of an existing contract. Location contracts acquired in a business combination are recorded at fair value as part of the business combination accounting and then amortized as an intangible asset on a straight-line basis over the expected useful life of the contract of 10 years. “Amortization of route and customer acquisition costs and location contracts acquired” aggregates the non-cash amortization charges relating to upfront route and customer acquisition cost payments and location contracts acquired.
(2) Stock-based compensation consists of options, restricted stock units and warrants.
(3) (Gain) loss on change in fair value of contingent earnout A-2 shares represents an unrealized fair value adjustment at each reporting period end related to the value of these contingent shares. Upon achieving such contingency, A-2 shares convert to A-1 common stock resulting in a non-cash settlement of the obligation.
(4) Other expenses, net consists of (i) non-cash expenses including the remeasurement of contingent consideration liabilities, (ii) non-recurring expenses relating to lobbying efforts and legal expenses in Pennsylvania and lobbying efforts in Missouri, (iii) non-recurring costs associated with COVID-19 and (iv) other non-recurring expenses.
(5) Calculated by excluding the impact of the non-GAAP adjustments from the current period tax provision calculations.
(6) Emerging markets consist of the results, on an adjusted EBITDA basis, for non-core jurisdictions where our operations are developing. Markets are no longer considered emerging when Accel has installed or acquired at least 500 gaming terminals in the jurisdiction, or when 24 months have elapsed from the date Accel first installs or acquires gaming terminals in the jurisdiction, whichever occurs first.
Restatement of prior period financial statements
The restatement reflects adjustments to correct an error related to the accounting treatment of certain earn out arrangements issued in connection with the 2019 business combination with TPG Pace Holdings Corp., a special purpose acquisition company, that were previously presented as equity. Because the number of Class A-1 common stock (the “contingent earnout shares”) the holder is entitled to under the
4
agreement are dependent, in part, upon the occurrence of a change of control, which is not an input to the fair value of a fixed for fixed contract on equity shares, the Company determined that the contingent earnout share obligation should be presented as a liability and marked to fair value each period, not equity-classified as previously presented. The Company also concluded that Class A-2 common stock issued in the transaction does not represent an increase in equity due to the fact that such shares are not entitled to dividends, voting rights, or a stake in the Company in the case of liquidation. Accordingly, the contingent earnout is now reflected as a liability at fair value on the Company’s consolidated balance sheets at December 31, 2020 and 2019, and the change in the fair value of such liability in each period is recognized as a gain or loss in the Company’s consolidated statements of operations and comprehensive (loss) income. The contingent earnout liability does not constitute indebtedness of the Company and will only be satisfied, if earned, by settlement in the Company’s Class A-1 common stock in a non-cash transaction. The existence of contingent earnout shares occurred as a result of the Company’s merger and reverse recapitalization occurring on November 20, 2019 and did not impact any reporting periods prior to the merger and reverse recapitalization transaction.
The Company also corrected certain classification errors impacting amusement revenue, ATM fees and other revenue, and cost of revenue that were previously presented net instead of gross, and certain revenue share expenses that were previously presented in general and administrative instead of cost of revenue. There is no impact to net income (loss) as a result of these reclassifications.
Conference Call
Accel will host an investor conference call on March 15, 2021 at 11 a.m. Central (12 p.m. Eastern) to discuss these operating and financial results. Interested parties may join the live webcast by registering at http://www.directeventreg.com/registration/event/662712 or accessing the webcast via the company’s investor relations website: ir.accelentertainment.com. Following completion of the call, a replay of the webcast will be posted on Accel’s investor relations website.
About Accel
Accel believes it is the leading distributed gaming operator in the United States on an Adjusted EBITDA basis, and a preferred partner for local business owners in the Illinois market. Accel’s business consists of the installation, maintenance and operation of VGTs, redemption devices that disburse winnings and contain ATM functionality, and other amusement devices in authorized non-casino locations such as restaurants, bars, taverns, convenience stores, liquor stores, truck stops, and grocery stores.
Forward Looking Statements
This press release contains forward-looking statements within the meaning of Section 27A of the Securities Act of 1933, as amended, and Section 21E of the Securities Exchange Act of 1934, as amended. All statements, other than statements of historical fact, contained in this press release are forward-looking statements, including, but not limited to, any statements regarding our 2021 guidance, including with respect to the duration and impact of the COVID-19 crisis (including expected operating expenses related thereto), potential acquisitions or strategic alliances, and our estimates of number of VGTs, locations, revenues, [net (loss) income], Adjusted EBITDA and capital expenditures. The words “predict,” “estimated,” “anticipates,” “believes,” “estimates,” “expects,” “intends,” “may,” “plans,” “projects,” “will,” “would,” “continue,” and similar expressions or the negatives thereof are intended to identify forward looking statements. These forward looking statements represent our current reasonable expectations and involve known and unknown risks, uncertainties and other factors that may cause our
5
actual results, performance and achievements, or industry results, to be materially different from any future results, performance or achievements expressed or implied by such forward-looking statements. We cannot guarantee the accuracy of the forward-looking statements, and you should be aware that results and events could differ materially and adversely from those contained in the forward looking statements due to a number of factors including, but not limited to: the existing and potential future adverse impact of the COVID-19 pandemic on Accel’s business, operations and financial condition, including as a result the suspensions of all video gaming terminal operations by the Illinois Gaming Board between March 16, 2020 and June 30, 2020 and between November 1 9, 2020 and January 23, 2021, which suspensions could be reinstated; Accel’s ability to operate in existing markets or expand into new jurisdictions; Accel’s ability to manage its growth effectively; Accel’s ability to offer new and innovative products and services that fulfill the needs of licensed establishment partners and create strong and sustained player appeal; Accel’s dependence on relationships with key manufacturers, developers and third parties to obtain VGTs, amusement machines, and related supplies, programs, and technologies for its business on acceptable terms; the negative impact on Accel’s future results of operations by the slow growth in demand for VGTs and by the slow growth of new gaming jurisdictions; Accel’s heavy dependency on its ability to win, maintain and renew contracts with licensed establishment partners; unfavorable economic conditions or decreased discretionary spending due to other factors such as epidemics or other public health issues (including COVID-19), terrorist activity or threat thereof, civil unrest or other economic or political uncertainties, that could adversely affect Accel’s business, results of operations, cash flows and financial conditions and other risks and uncertainties indicated from time to time in documents filed or to be filed with the Securities and Exchange Commission (“SEC”). Accordingly, forward-looking statements, including any projections or analysis, should not be viewed as factual and should not be relied upon as an accurate prediction of future results. The forward-looking statements contained in this press release are based on our current expectations and beliefs concerning future developments and their potential effects on the Accel. These forward-looking statements involve a number of risks, uncertainties (some of which are beyond our control), or other assumptions that may cause actual results or performance to be materially different from those expressed or implied by these forward-looking statements. These risks and uncertainties include, but are not limited to, those factors described in the sections entitled “Risk Factors” in the Quarterly Reports on Form 10 Q and in the Annual Report on Form 10-K filed by Accel with the SEC, as well as Accel’s other filings with the SEC. Except as required by law, we do not undertake publicly to update or revise these statements, even if experience or future changes make it clear that any projected results expressed in this or other press releases or future quarterly reports, or company statements will not be realized. In addition, the inclusion of any statement in this press release does not constitute an admission by us that the events or circumstances described in such statement are material. We qualify all of our forward-looking statements by these cautionary statements. In addition, the industry in which we operate is subject to a high degree of uncertainty and risk due to a variety of factors including those described in the section entitled “Risk Factors” in the Quarterly Reports on Form 10-Q and in the Annual Report on Form 10-K filed by Accel with the SEC, as well as Accel’s other filings with the SEC. These and other factors could cause our results to differ materially from those expressed in this press release.
Non-GAAP Financial Information
This press release includes certain financial information not prepared in accordance with Generally Accepted Accounting Principles in the United States (“GAAP”), including Adjusted EBITDA and Adjusted net (loss) income. Adjusted EBITDA and adjusted net (loss) income are non-GAAP financial measures and are key metrics used to monitor ongoing core operations. Management of Accel believes Adjusted EBITDA and adjusted net (loss) income enhance the understanding of Accel’s underlying
6
drivers of profitability and trends in Accel’s business and facilitates company-to-company and period-to-period comparisons, because these non-GAAP financial measures exclude the effects of certain non-cash items, represents certain nonrecurring items that are unrelated to core performance, or excludes non-core operations. Management of Accel also believes that these non-GAAP financial measures are used by investors, analysts and other interested parties as measures of financial performance.
Although Accel excludes amortization of route and customer acquisition costs and location contracts acquired from Adjusted EBITDA and Adjusted net (loss) income, Accel believes that it is important for investors to understand that these route, customer and location contract acquisitions contribute to revenue generation. Any future acquisitions may result in amortization of route and customer acquisition costs and location contracts acquired.
Adjusted EBITDA and Adjusted net (loss) income are not recognized terms under GAAP. These non-GAAP financial measures excludes some, but not all, items that affect net (loss) income, and these measures may vary among companies. These non-GAAP financial measures are unaudited and have important limitations as an analytical tool, should not be viewed in isolation and do not purport to be alternatives to net loss as indicators of operating performance.
Media Contact:
Eric Bonach
Abernathy MacGregor
212-371-5999
7
Accel Entertainment 1 Fourth Quarter and Full-Year 2020 Earnings Presentation March 2021
Important Information 2 Forward-Looking Statements This presentation contains forward-looking statements within the meaning of Section 27A of the Securities Act of 1933, as amended, and Section 21E of the Securities Exchange Act of 1934, as amended. All statements, other than statements of historical fact, contained in this presentation are forward-looking statements, including, but not limited to, statements regarding our strategy, prospects, plans, objectives, future operations, future revenue and earnings, projected margins and expenses, markets for our services, potential acquisitions or strategic alliances, financial position, and liquidity and anticipated cash needs and availability. The words “anticipates,” “believes,” “estimates,” “expects,” “intends,” “may,” “plans,” “projects,” “will,” “would,” and similar expressions or the negatives thereof are intended to identify forward-looking statements. However, not all forward-looking statements contain these identifying words. These forward-looking statements represent our current reasonable expectations and involve known and unknown risks, uncertainties and other factors that may cause our actual results, performance and achievements, or industry results, to be materially different from any future results, performance or achievements expressed or implied by such forward-looking statements. We cannot guarantee the accuracy of the forward-looking statements, and you should be aware that results and events could differ materially and adversely from those contained in the forward-looking statements due to a number of factors including, but not limited to: the existing and potential future adverse impact of the COVID-19 pandemic on Accel’s business, operations and financial condition, including as a result the suspensions of all video gaming terminal operations by the Illinois Gaming Board between March 16, 2020 and June 30, 2020 and between November 19, 2020 and January 23, 2021, which suspensions could be reinstated; Accel’s ability to operate in existing markets or expand into new jurisdictions; Accel’s ability to manage its growth effectively; Accel’s ability to offer new and innovative products and services that fulfill the needs of licensed establishment partners and create strong and sustained player appeal; Accel’s dependence on relationships with key manufacturers, developers and third parties to obtain VGTs, amusement machines, and related supplies, programs, and technologies for its business on acceptable terms; the negative impact on Accel’s future results of operations by the slow growth in demand for VGTs and by the slow growth of new gaming jurisdictions; Accel’s heavy dependency on its ability to win, maintain and renew contracts with licensed establishment partners; unfavorable economic conditions or decreased discretionary spending due to other factors such as epidemics or other public health issues (including COVID-19), terrorist activity or threat thereof, civil unrest or other economic or political uncertainties, that could adversely affect Accel’s business, results of operations, cash flows and financial conditions and other risks and uncertainties indicated from time to time in documents filed or to be filed with the Securities and Exchange Commission ("SEC"). Accordingly, forward-looking statements, including any projections or analysis, should not be viewed as factual and should not be relied upon as an accurate prediction of future results. The forward-looking statements contained in this presentation are based on our current expectations and beliefs concerning future developments and their potential effects on the Accel. These forward-looking statements involve a number of risks, uncertainties (some of which are beyond our control), or other assumptions that may cause actual results or performance to be materially different from those expressed or implied by these forward-looking statements. These risks and uncertainties include, but are not limited to, those factors described in the sections entitled “Risk Factors” in the Quarterly Reports on Form 10-Q and in the Annual Report on Form 10-K filed by Accel with the SEC, as well as Accel’s other filings with the SEC. Except as required by law, we do not undertake publicly to update or revise these statements, even if experience or future changes make it clear that any projected results expressed in this presentation or future quarterly reports, press releases or company statements will not be realized. In addition, the inclusion of any statement in this presentation does not constitute an admission by us that the events or circumstances described in such statement are material. We qualify all of our forward-looking statements by these cautionary statements. In addition, the industry in which we operate is subject to a high degree of uncertainty and risk due to a variety of factors including those described in the section entitled “Risk Factors.” These and other factors could cause our results to differ materially from those expressed in this presentation. Industry and Market Data Unless otherwise indicated, information contained in this presentation concerning our industry and the markets in which we operate, including our general expectations and market position, market opportunity, and market size, is based on information from various sources, on assumptions that we have made that are based on those data and other similar sources, and on our knowledge of the markets for our services. This information includes a number of assumptions and limitations, and you are cautioned not to give undue weight to such information. In addition, projections, assumptions, and estimates of our future performance and the future performance of the industry in which we operate are necessarily subject to a high degree of uncertainty and risk due to a variety of factors, including those described in the Quarterly Reports on Form 10-Q and in the Annual Report on Form 10-K filed by Accel with the SEC, as well as Accel’s other filings with the SEC. These and other factors could cause results to differ materially from those expressed in the estimates made by third parties and by us.
Important Information 3 Use of Non-GAAP Financial Measures This presentation includes non-GAAP financial measures, including Adjusted EBITDA. Adjusted EBITDA is defined as net (loss) income plus amortization of route and customer acquisition costs and location contracts acquired; change in fair value of contingent earnout A-2 shares; stock-based compensation expense; other expenses, net; tax effect of adjustments; depreciation and amortization of property and equipment; emerging markets; interest expense; and provision for income taxes. Management believes that these non-GAAP measures of financial results enhance the understanding of Accel’s underlying drivers of profitability and trends in Accel’s business and facilitate company-to-company and period-to period comparisons, because these non-GAAP financial measures exclude the effects of certain non-cash items or represent certain nonrecurring items that are unrelated to core performance. Management of Accel also believes that these non-GAAP financial measures are used by investors, analysts and other interested parties as measures of financial performance and to evaluate Accel’s ability to fund capital expenditures, service debt obligations and meet working capital requirements. See the slide entitled “Non-GAAP to GAAP Reconciliation” on page 12 for additional information. Restatement of prior period financial statements The restatement reflects adjustments to correct an error related to the accounting treatment of certain earn out arrangements issued in connection with the 2019 business combination with TPG Pace Holdings Corp., a special purpose acquisition company, that were previously presented as equity. Because the number of Class A-1 common stock (the “contingent earnout shares”) the holder is entitled to under the agreement are dependent, in part, upon the occurrence of a change of control, which is not an input to the fair value of a fixed for fixed contract on equity shares, the Company determined that the contingent earnout share obligation should be presented as a liability and marked to fair value each period, not equity-classified as previously presented. The Company also concluded that Class A-2 common stock issued in the transaction does not represent an increase in equity due to the fact that such shares are not entitled to dividends, voting rights, or a stake in the Company in the case of liquidation. Accordingly, the contingent earnout is now reflected as a liability at fair value on the Company’s consolidated balance sheets at December 31, 2020 and 2019, and the change in the fair value of such liability in each period is recognized as a gain or loss in the Company’s consolidated statements of operations and comprehensive (loss) income. The contingent earnout liability does not constitute indebtedness of the Company and will only be satisfied, if earned, by settlement in the Company’s Class A-1 common stock in a non-cash transaction. The existence of contingent earnout shares occurred as a result of the Company’s merger and reverse recapitalization occurring on November 20, 2019 and did not impact any reporting periods prior to the merger and reverse recapitalization transaction. The Company also corrected certain classification errors impacting amusement revenue, ATM fees and other revenue, and cost of revenue that were previously presented net instead of gross, and certain revenue share expenses that were previously presented in general and administrative instead of cost of revenue. There is no impact to net income (loss) as a result of these reclassifications.
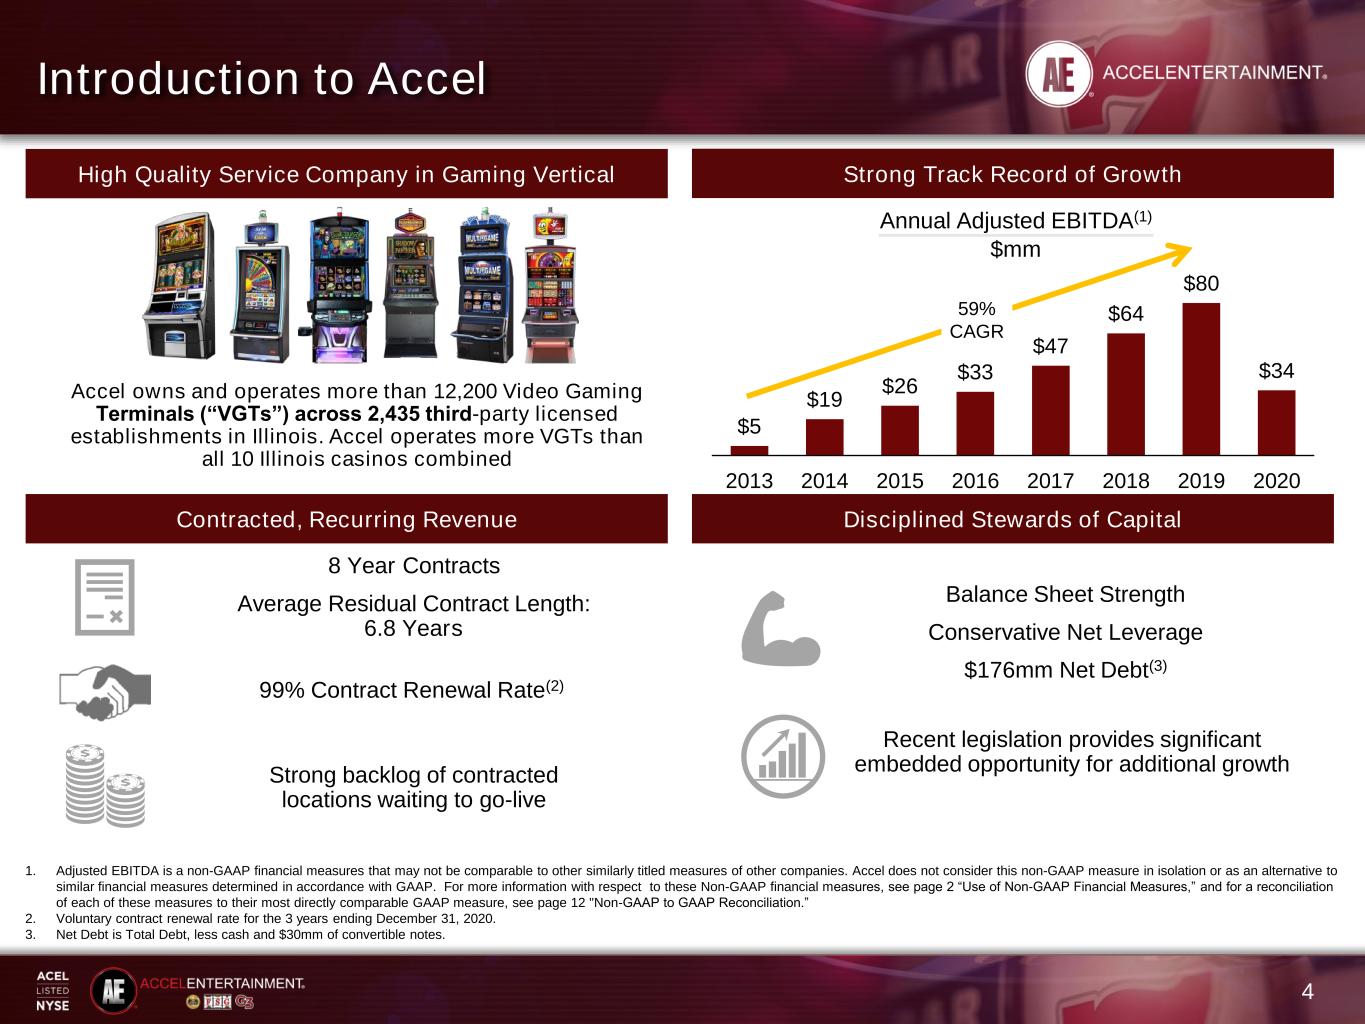
4 Introduction to Accel High Quality Service Company in Gaming Vertical Contracted, Recurring Revenue Strong Track Record of Growth Disciplined Stewards of Capital Accel owns and operates more than 12,200 Video Gaming Terminals (“VGTs”) across 2,435 third-party licensed establishments in Illinois. Accel operates more VGTs than all 10 Illinois casinos combined $5 $19 $26 $33 $47 $64 $80 $34 2013 2014 2015 2016 2017 2018 2019 2020 59% CAGR Annual Adjusted EBITDA(1) $mm 1. Adjusted EBITDA is a non-GAAP financial measures that may not be comparable to other similarly titled measures of other companies. Accel does not consider this non-GAAP measure in isolation or as an alternative to similar financial measures determined in accordance with GAAP. For more information with respect to these Non-GAAP financial measures, see page 2 “Use of Non-GAAP Financial Measures,” and for a reconciliation of each of these measures to their most directly comparable GAAP measure, see page 12 "Non-GAAP to GAAP Reconciliation.” 2. Voluntary contract renewal rate for the 3 years ending December 31, 2020. 3. Net Debt is Total Debt, less cash and $30mm of convertible notes. 8 Year Contracts Average Residual Contract Length: 6.8 Years 99% Contract Renewal Rate(2) Strong backlog of contracted locations waiting to go-live Balance Sheet Strength Conservative Net Leverage $176mm Net Debt(3) Recent legislation provides significant embedded opportunity for additional growth
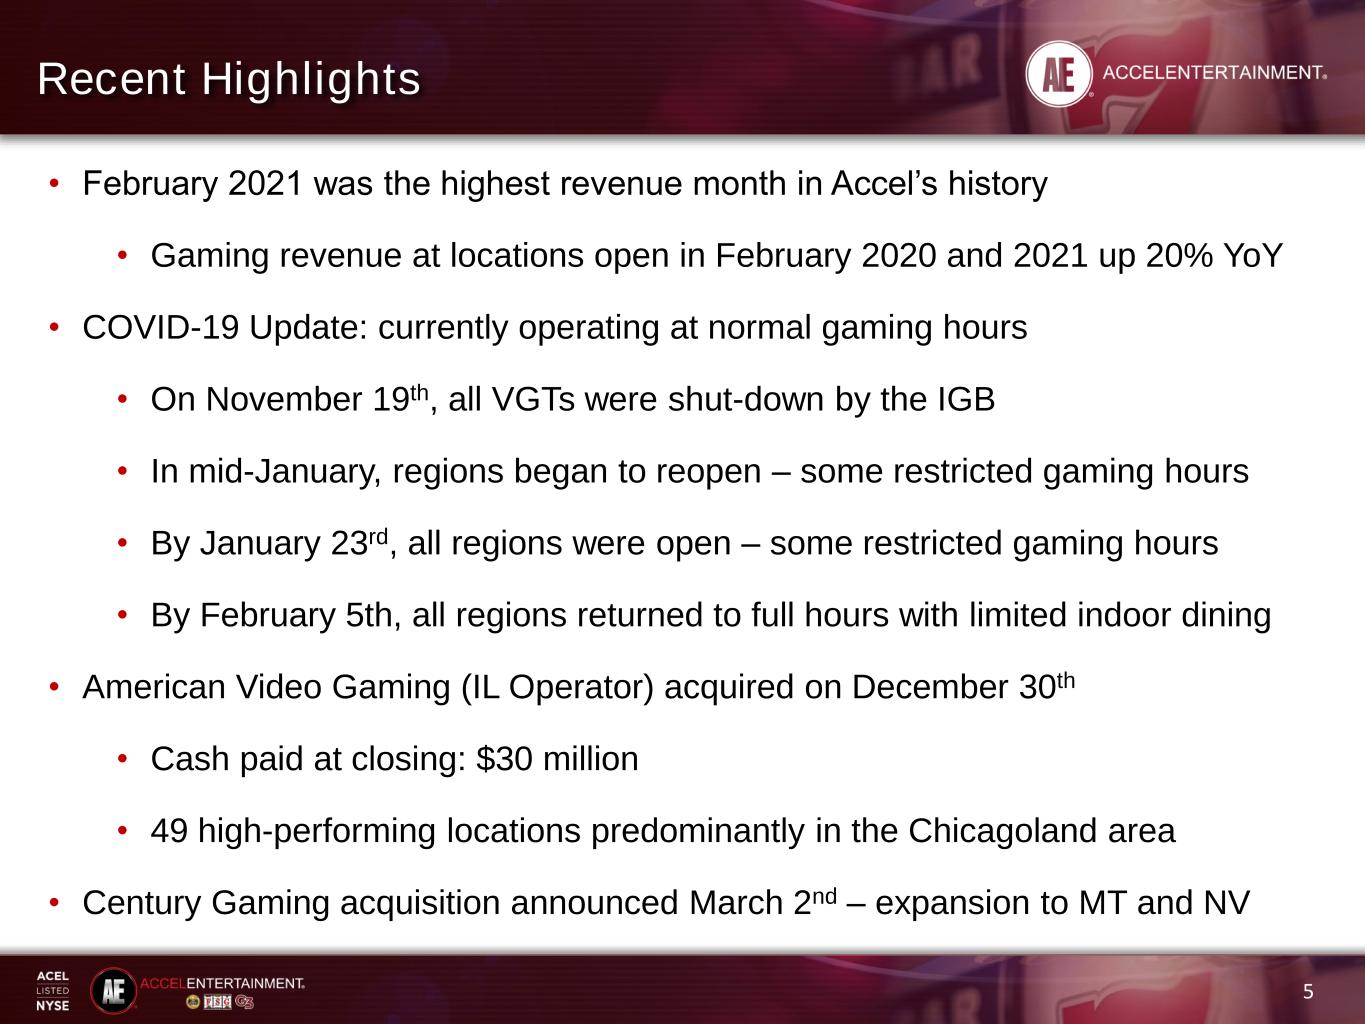
• February 2021 was the highest revenue month in Accel’s history • Gaming revenue at locations open in February 2020 and 2021 up 20% YoY • COVID-19 Update: currently operating at normal gaming hours • On November 19th, all VGTs were shut-down by the IGB • In mid-January, regions began to reopen – some restricted gaming hours • By January 23rd, all regions were open – some restricted gaming hours • By February 5th, all regions returned to full hours with limited indoor dining • American Video Gaming (IL Operator) acquired on December 30th • Cash paid at closing: $30 million • 49 high-performing locations predominantly in the Chicagoland area • Century Gaming acquisition announced March 2nd – expansion to MT and NV Recent Highlights 5
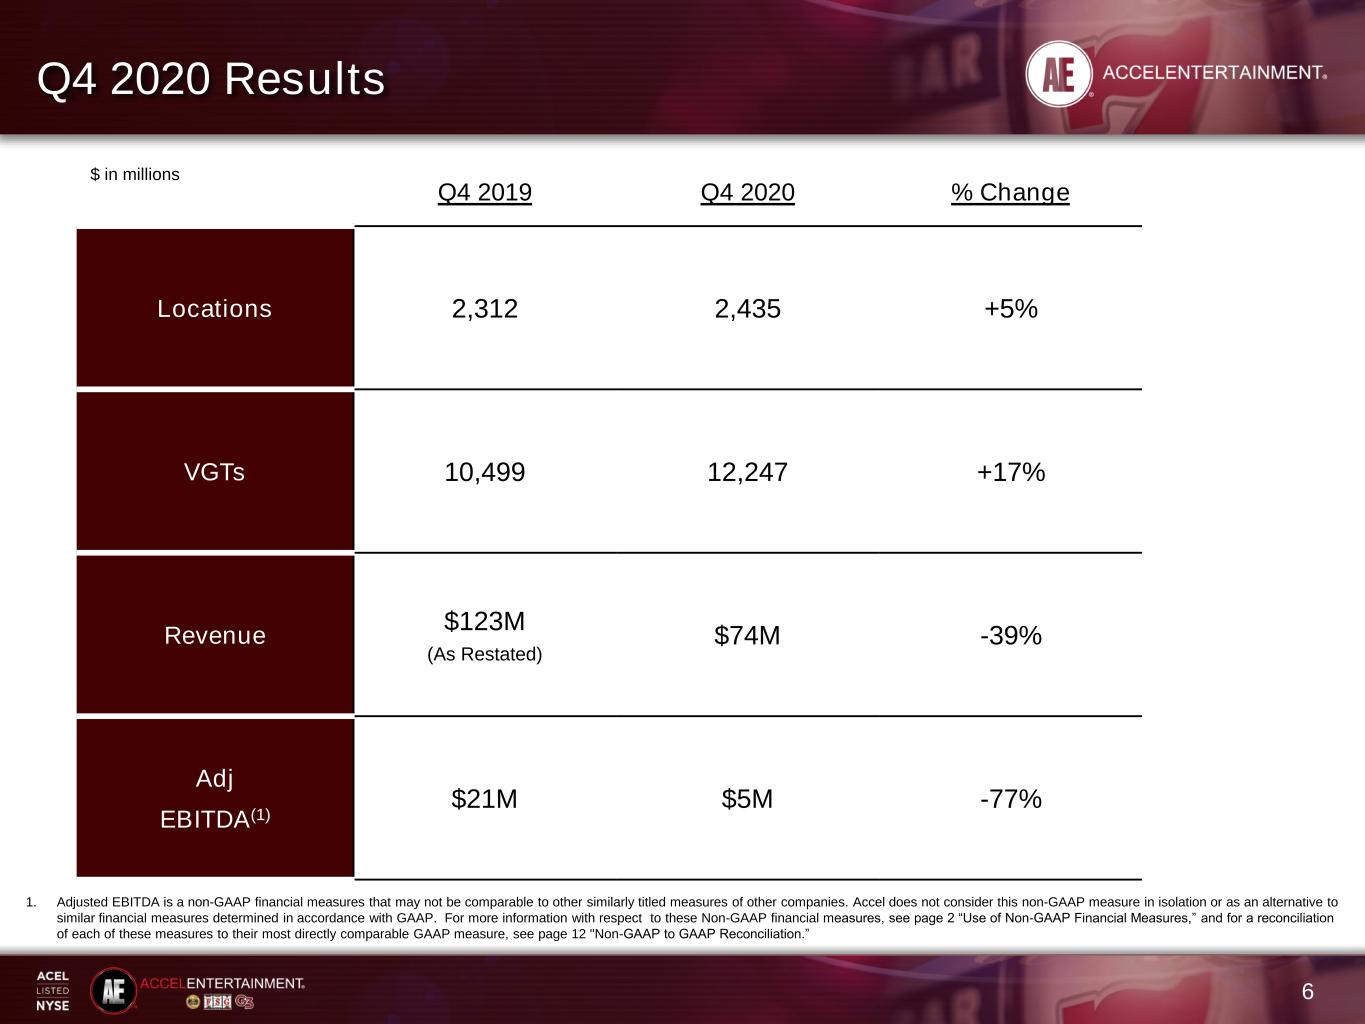
6 Q4 2020 Results 1. Adjusted EBITDA is a non-GAAP financial measures that may not be comparable to other similarly titled measures of other companies. Accel does not consider this non-GAAP measure in isolation or as an alternative to similar financial measures determined in accordance with GAAP. For more information with respect to these Non-GAAP financial measures, see page 2 “Use of Non-GAAP Financial Measures,” and for a reconciliation of each of these measures to their most directly comparable GAAP measure, see page 12 "Non-GAAP to GAAP Reconciliation.” $ in millions Q4 2019 Q4 2020 % Change Locations 2,312 2,435 +5% VGTs 10,499 12,247 +17% Revenue $123M (As Restated) $74M -39% Adj EBITDA(1) $21M $5M -77%
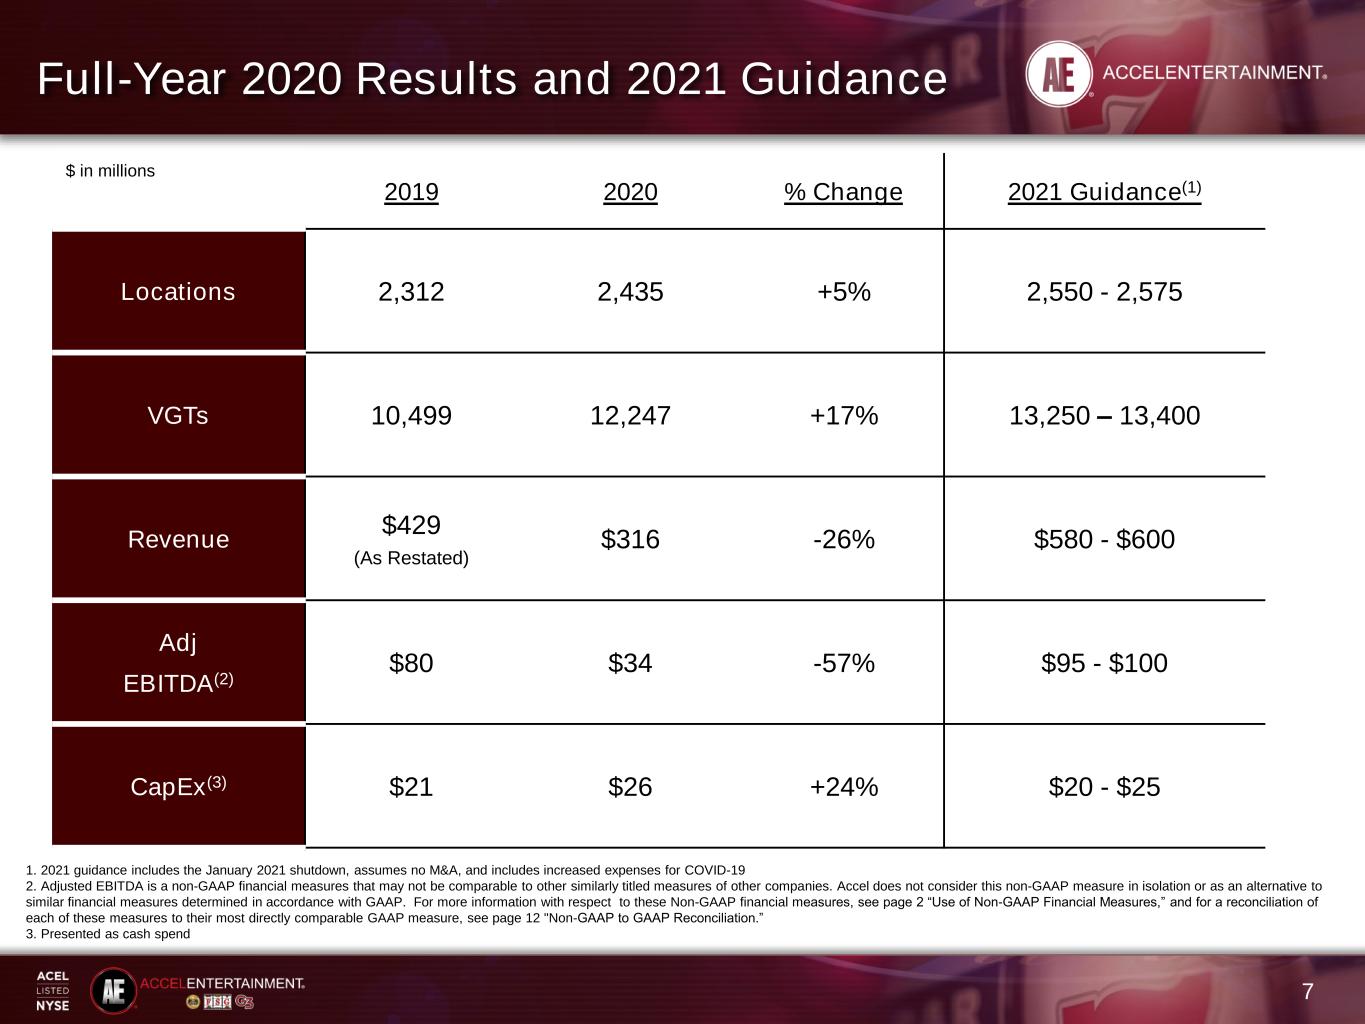
7 Full-Year 2020 Results and 2021 Guidance 1. 2021 guidance includes the January 2021 shutdown, assumes no M&A, and includes increased expenses for COVID-19 2. Adjusted EBITDA is a non-GAAP financial measures that may not be comparable to other similarly titled measures of other companies. Accel does not consider this non-GAAP measure in isolation or as an alternative to similar financial measures determined in accordance with GAAP. For more information with respect to these Non-GAAP financial measures, see page 2 “Use of Non-GAAP Financial Measures,” and for a reconciliation of each of these measures to their most directly comparable GAAP measure, see page 12 "Non-GAAP to GAAP Reconciliation.” 3. Presented as cash spend $ in millions 2019 2020 % Change 2021 Guidance(1) Locations 2,312 2,435 +5% 2,550 - 2,575 VGTs 10,499 12,247 +17% 13,250 – 13,400 Revenue $429 (As Restated) $316 -26% $580 - $600 Adj EBITDA(2) $80 $34 -57% $95 - $100 CapEx(3) $21 $26 +24% $20 - $25
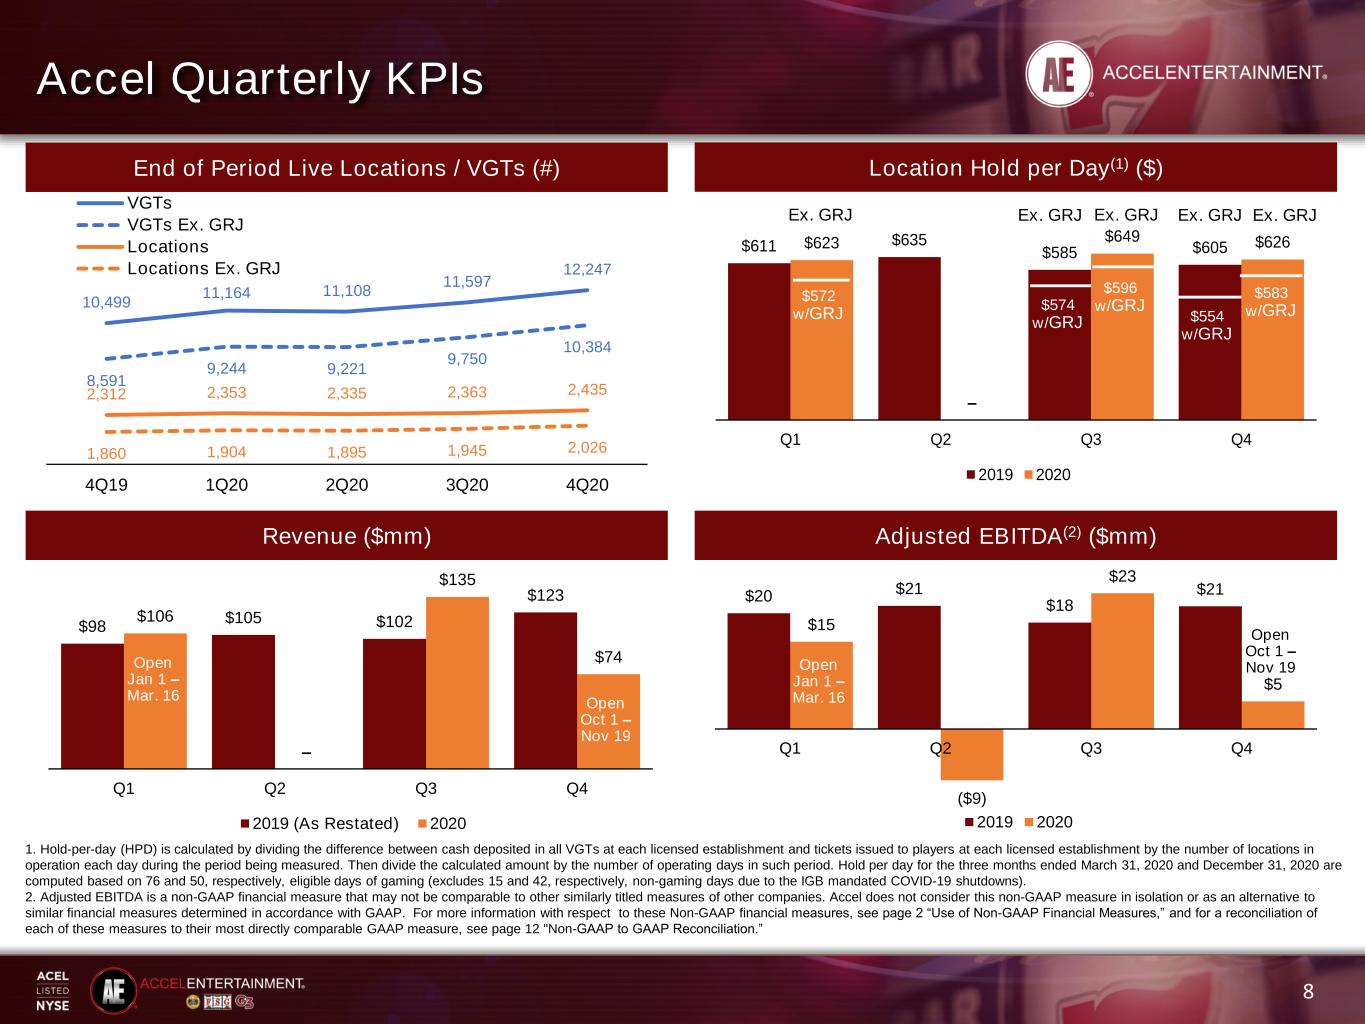
Accel Quarterly KPIs 8 End of Period Live Locations / VGTs (#) Location Hold per Day(1) ($) Revenue ($mm) Adjusted EBITDA(2) ($mm) 10,499 11,164 11,108 11,597 12,247 8,591 9,244 9,221 9,750 10,384 2,312 2,353 2,335 2,363 2,435 1,860 1,904 1,895 1,945 2,026 4Q19 1Q20 2Q20 3Q20 4Q20 VGTs VGTs Ex. GRJ Locations Locations Ex. GRJ $611 $635 $585 $605 $623 – $649 $626 Q1 Q2 Q3 Q4 2019 2020 $20 $21 $18 $21 $15 ($9) $23 $5 Q1 Q2 Q3 Q4 2019 2020 1. Hold-per-day (HPD) is calculated by dividing the difference between cash deposited in all VGTs at each licensed establishment and tickets issued to players at each licensed establishment by the number of locations in operation each day during the period being measured. Then divide the calculated amount by the number of operating days in such period. Hold per day for the three months ended March 31, 2020 and December 31, 2020 are computed based on 76 and 50, respectively, eligible days of gaming (excludes 15 and 42, respectively, non-gaming days due to the IGB mandated COVID-19 shutdowns). 2. Adjusted EBITDA is a non-GAAP financial measure that may not be comparable to other similarly titled measures of other companies. Accel does not consider this non-GAAP measure in isolation or as an alternative to similar financial measures determined in accordance with GAAP. For more information with respect to these Non-GAAP financial measures, see page 2 “Use of Non-GAAP Financial Measures,” and for a reconciliation of each of these measures to their most directly comparable GAAP measure, see page 12 "Non-GAAP to GAAP Reconciliation.” $572 w/GRJ Ex. GRJ Open Jan 1 – Mar. 16 Open Jan 1 – Mar. 16 $98 $105 $102 $123 $106 – $135 $74 Q1 Q2 Q3 Q4 2019 (As Restated) 2020 Open Jan 1 – Mar. 16 Ex. GRJ $596 w/GRJ$574 w/GRJ Ex. GRJ $554 w/GRJ Ex. GRJ $583 w/GRJ Open Oct 1 – Nov 19 Open Oct 1 – Nov 19 Ex. GRJ
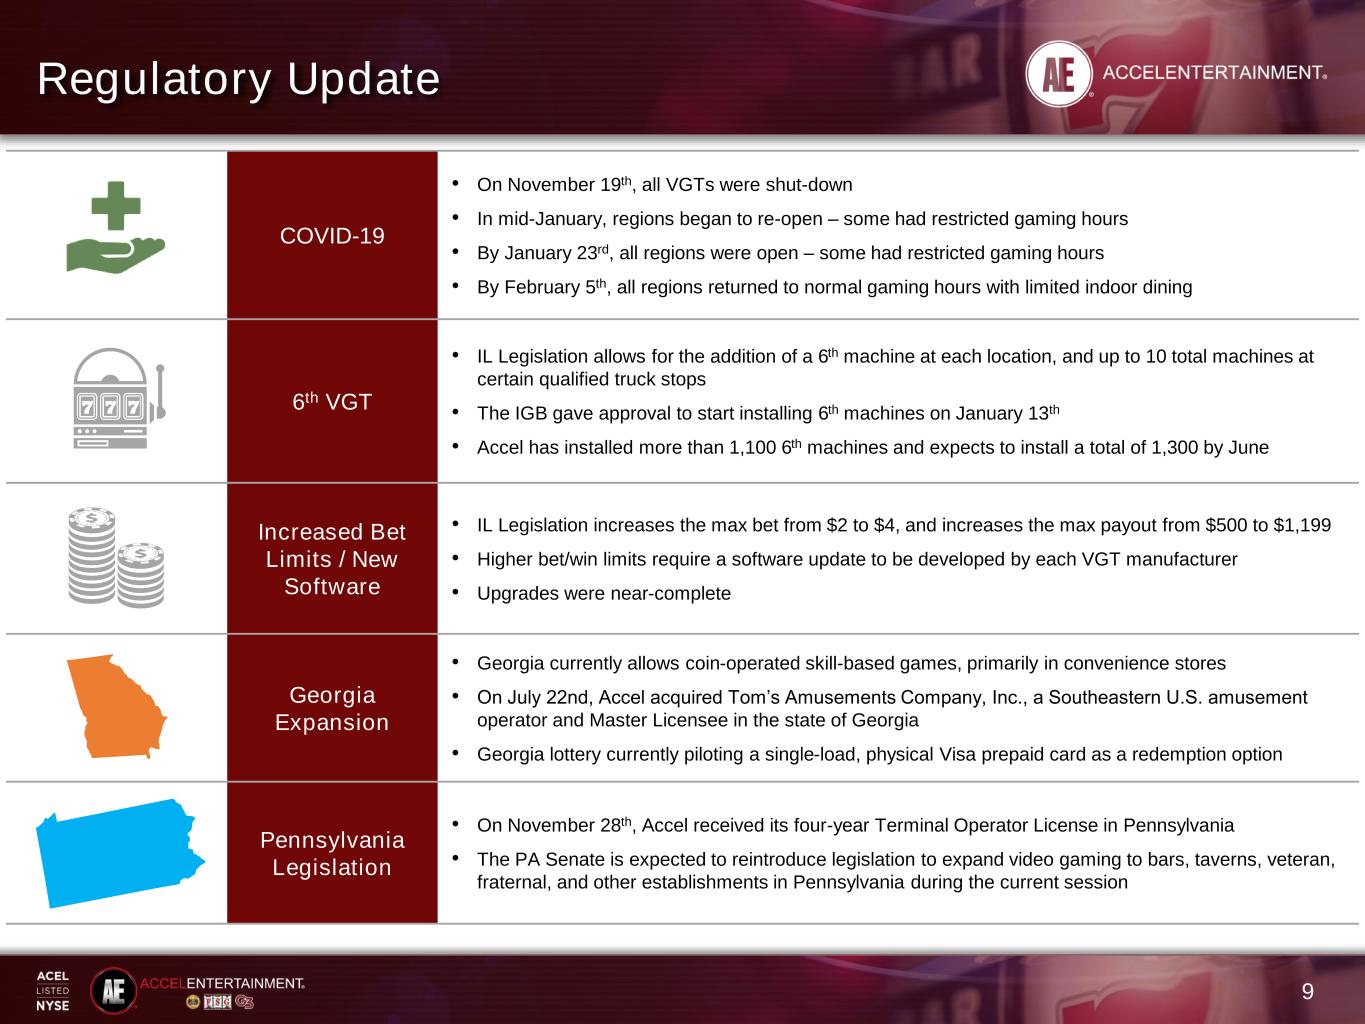
9 Regulatory Update COVID-19 • On November 19th, all VGTs were shut-down • In mid-January, regions began to re-open – some had restricted gaming hours • By January 23rd, all regions were open – some had restricted gaming hours • By February 5th, all regions returned to normal gaming hours with limited indoor dining 6th VGT • IL Legislation allows for the addition of a 6th machine at each location, and up to 10 total machines at certain qualified truck stops • The IGB gave approval to start installing 6th machines on January 13th • Accel has installed more than 1,100 6th machines and expects to install a total of 1,300 by June Increased Bet Limits / New Software • IL Legislation increases the max bet from $2 to $4, and increases the max payout from $500 to $1,199 • Higher bet/win limits require a software update to be developed by each VGT manufacturer • Upgrades were near-complete Georgia Expansion • Georgia currently allows coin-operated skill-based games, primarily in convenience stores • On July 22nd, Accel acquired Tom’s Amusements Company, Inc., a Southeastern U.S. amusement operator and Master Licensee in the state of Georgia • Georgia lottery currently piloting a single-load, physical Visa prepaid card as a redemption option Pennsylvania Legislation • On November 28th, Accel received its four-year Terminal Operator License in Pennsylvania • The PA Senate is expected to reintroduce legislation to expand video gaming to bars, taverns, veteran, fraternal, and other establishments in Pennsylvania during the current session
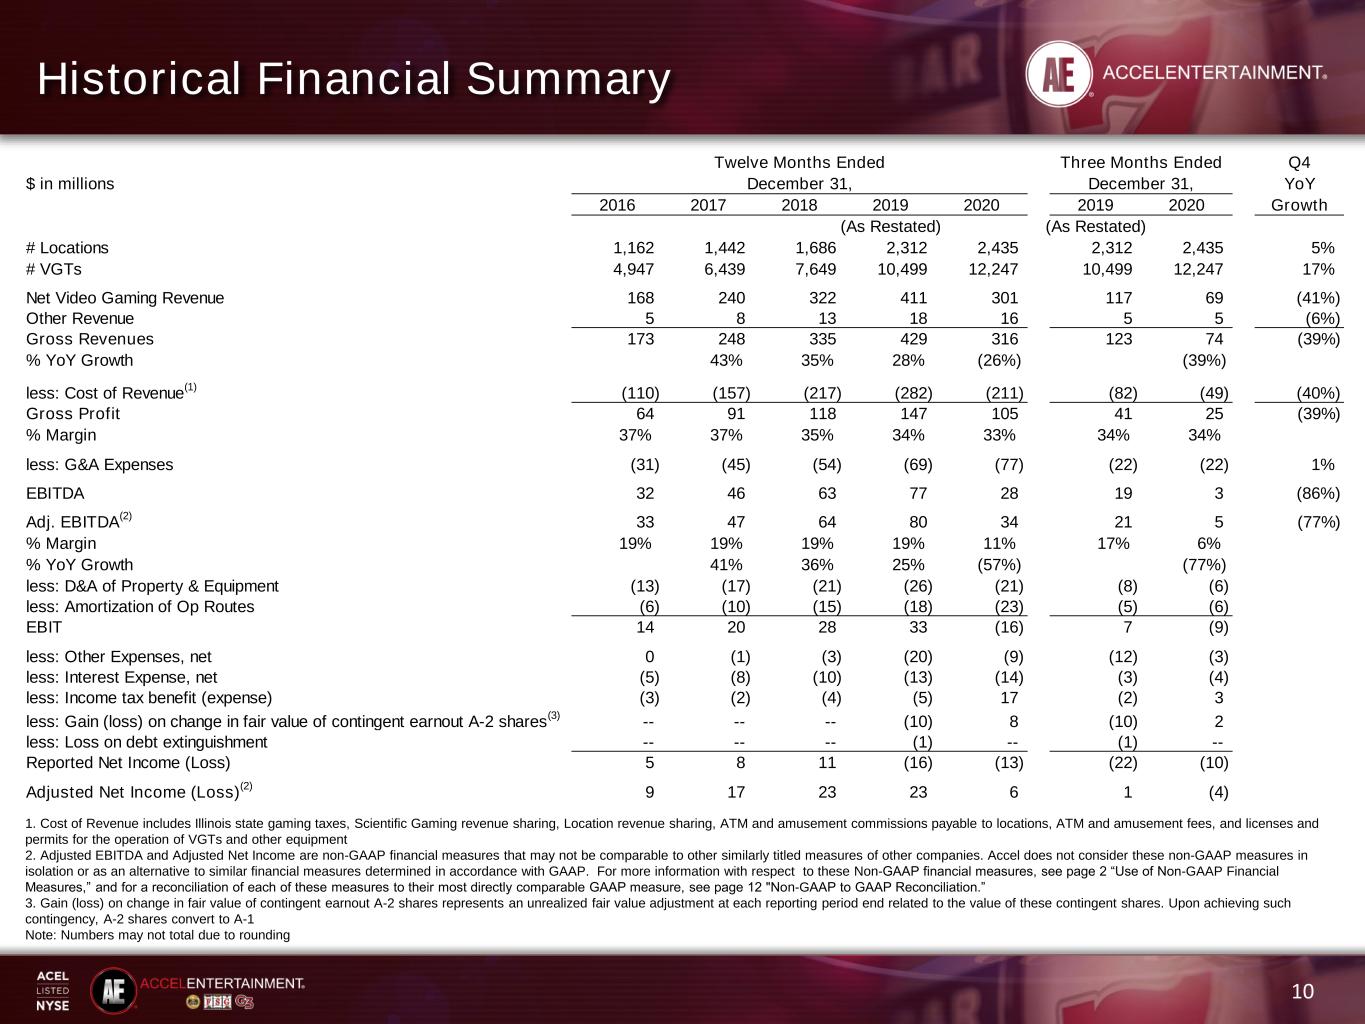
Historical Financial Summary 10 1. Cost of Revenue includes Illinois state gaming taxes, Scientific Gaming revenue sharing, Location revenue sharing, ATM and amusement commissions payable to locations, ATM and amusement fees, and licenses and permits for the operation of VGTs and other equipment 2. Adjusted EBITDA and Adjusted Net Income are non-GAAP financial measures that may not be comparable to other similarly titled measures of other companies. Accel does not consider these non-GAAP measures in isolation or as an alternative to similar financial measures determined in accordance with GAAP. For more information with respect to these Non-GAAP financial measures, see page 2 “Use of Non-GAAP Financial Measures,” and for a reconciliation of each of these measures to their most directly comparable GAAP measure, see page 12 "Non-GAAP to GAAP Reconciliation.” 3. Gain (loss) on change in fair value of contingent earnout A-2 shares represents an unrealized fair value adjustment at each reporting period end related to the value of these contingent shares. Upon achieving such contingency, A-2 shares convert to A-1 Note: Numbers may not total due to rounding Three Months Ended Q4 $ in millions December 31, YoY 2016 2017 2018 2019 2020 2019 2020 Growth (As Restated) (As Restated) # Locations 1,162 1,442 1,686 2,312 2,435 2,312 2,435 5% # VGTs 4,947 6,439 7,649 10,499 12,247 10,499 12,247 17% Net Video Gaming Revenue 168 240 322 411 301 117 69 (41%) Other Revenue 5 8 13 18 16 5 5 (6%) Gross Revenues 173 248 335 429 316 123 74 (39%) % YoY Growth 43% 35% 28% (26%) (39%) less: Cost of Revenue (1) (110) (157) (217) (282) (211) (82) (49) (40%) Gross Profit 64 91 118 147 105 41 25 (39%) % Margin 37% 37% 35% 34% 33% 34% 34% less: G&A Expenses (31) (45) (54) (69) (77) (22) (22) 1% EBITDA 32 46 63 77 28 19 3 (86%) Adj. EBITDA (2) 33 47 64 80 34 21 5 (77%) % Margin 19% 19% 19% 19% 11% 17% 6% % YoY Growth 41% 36% 25% (57%) (77%) less: D&A of Property & Equipment (13) (17) (21) (26) (21) (8) (6) less: Amortization of Op Routes (6) (10) (15) (18) (23) (5) (6) EBIT 14 20 28 33 (16) 7 (9) less: Other Expenses, net 0 (1) (3) (20) (9) (12) (3) less: Interest Expense, net (5) (8) (10) (13) (14) (3) (4) less: Income tax benefit (expense) (3) (2) (4) (5) 17 (2) 3 less: Gain (loss) on change in fair value of contingent earnout A-2 shares (3) -- -- -- (10) 8 (10) 2 less: Loss on debt extinguishment -- -- -- (1) -- (1) -- Reported Net Income (Loss) 5 8 11 (16) (13) (22) (10) Adjusted Net Income (Loss) (2) 9 17 23 23 6 1 (4) Twelve Months Ended December 31,
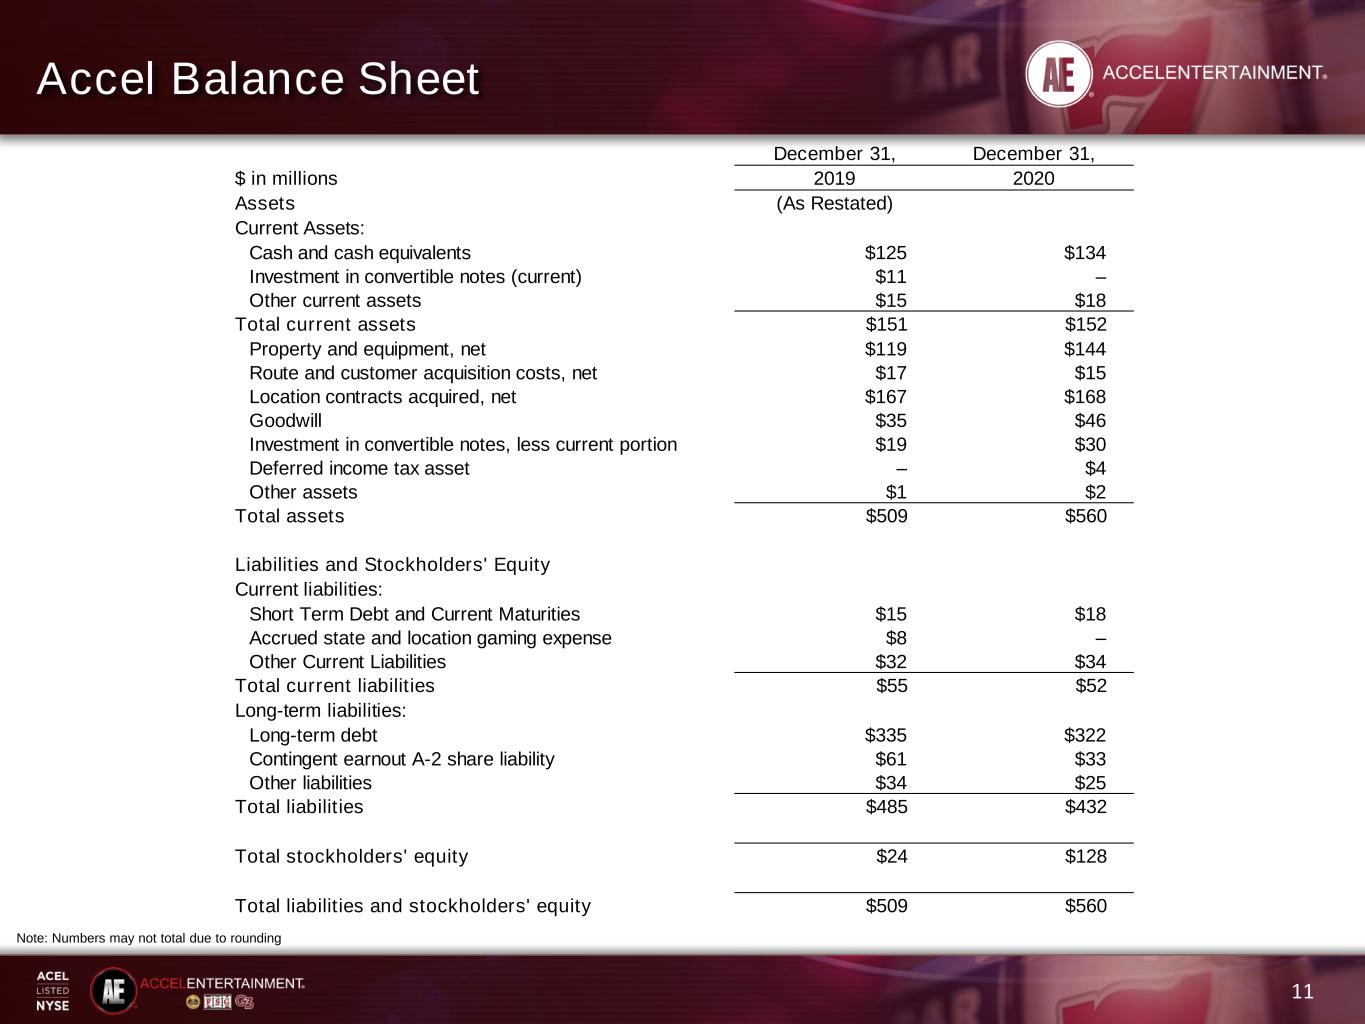
11 Accel Balance Sheet December 31, December 31, $ in millions 2019 2020 Assets (As Restated) Current Assets: Cash and cash equivalents $125 $134 Investment in convertible notes (current) $11 – Other current assets $15 $18 Total current assets $151 $152 Property and equipment, net $119 $144 Route and customer acquisition costs, net $17 $15 Location contracts acquired, net $167 $168 Goodwill $35 $46 Investment in convertible notes, less current portion $19 $30 Deferred income tax asset – $4 Other assets $1 $2 Total assets $509 $560 Liabilities and Stockholders' Equity Current liabilities: Short Term Debt and Current Maturities $15 $18 Accrued state and location gaming expense $8 – Other Current Liabilities $32 $34 Total current liabilities $55 $52 Long-term liabilities: Long-term debt $335 $322 Contingent earnout A-2 share liability $61 $33 Other liabilities $34 $25 Total liabilities $485 $432 Total stockholders' equity $24 $128 Total liabilities and stockholders' equity $509 $560 Note: Numbers may not total due to rounding
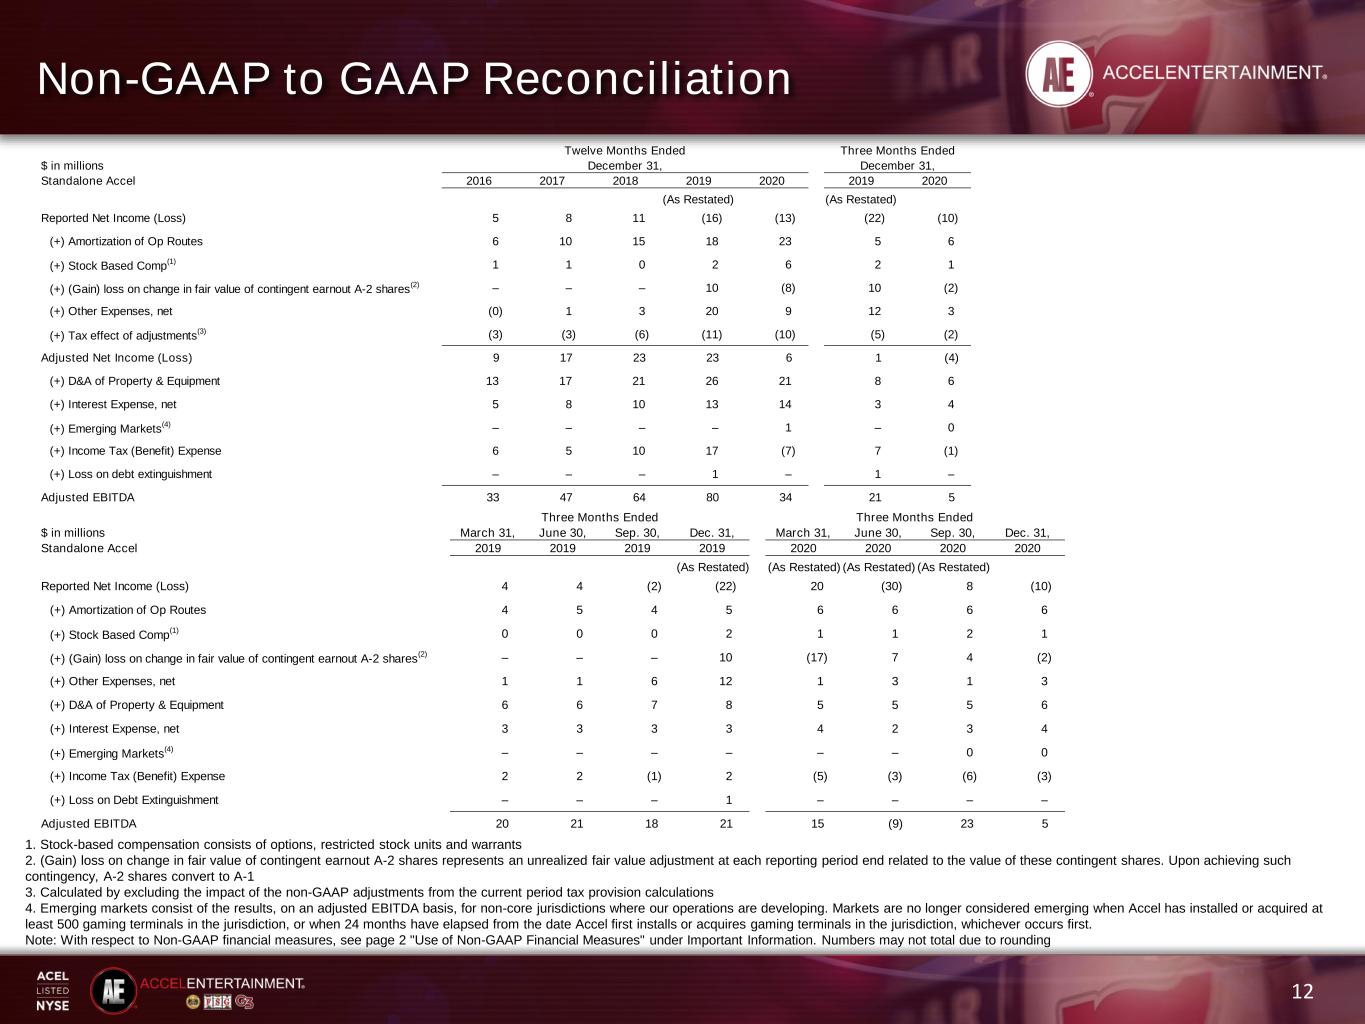
Non-GAAP to GAAP Reconciliation 12 1. Stock-based compensation consists of options, restricted stock units and warrants 2. (Gain) loss on change in fair value of contingent earnout A-2 shares represents an unrealized fair value adjustment at each reporting period end related to the value of these contingent shares. Upon achieving such contingency, A-2 shares convert to A-1 3. Calculated by excluding the impact of the non-GAAP adjustments from the current period tax provision calculations 4. Emerging markets consist of the results, on an adjusted EBITDA basis, for non-core jurisdictions where our operations are developing. Markets are no longer considered emerging when Accel has installed or acquired at least 500 gaming terminals in the jurisdiction, or when 24 months have elapsed from the date Accel first installs or acquires gaming terminals in the jurisdiction, whichever occurs first. Note: With respect to Non-GAAP financial measures, see page 2 "Use of Non-GAAP Financial Measures" under Important Information. Numbers may not total due to rounding Twelve Months Ended Three Months Ended Nine Months Ended $ in millions December 31, December 31, September 30, Standalone Accel 2016 2017 2018 2019 2020 2019 2020 (As Restated) (As Restated) Reported Net Income (Loss) 5 8 11 (16) (13) (22) (10) (+) Amortization of Op Routes 6 10 15 18 23 5 6 (+) Stock Based Comp (1) 1 1 0 2 6 2 1 (+) (Gain) loss on change in fair value of contingent earnout A-2 shares (2) – – – 10 (8) 10 (2) (+) Other Expenses, net (0) 1 3 20 9 12 3 (+) Tax effect of adjustments (3) (3) (3) (6) (11) (10) (5) (2) Adjusted Net Income (Loss) 9 17 23 23 6 1 (4) (+) D&A of Property & Equipment 13 17 21 26 21 8 6 (+) Interest Expense, net 5 8 10 13 14 3 4 (+) Emerging Markets (4) – – – – 1 – 0 (+) Income Tax (Benefit) Expense 6 5 10 17 (7) 7 (1) (+) Loss on debt extinguishment – – – 1 – 1 – Adjusted EBITDA 33 47 64 80 34 21 5 Three Months Ended $ in millions March 31, June 30, Sep. 30, Dec. 31, March 31, June 30, Sep. 30, Dec. 31, Standalone Accel 2019 2019 2019 2019 2020 2020 2020 2020 (As Restated) (As Restated) (As Restated) (As Restated) Reported Net Income (Loss) 4 4 (2) (22) 20 (30) 8 (10) (+) Amortization of Op Routes 4 5 4 5 6 6 6 6 (+) Stock Based Comp (1) 0 0 0 2 1 1 2 1 (+) (Gain) loss on change in fair value of contingent earnout A-2 shares (2) – – – 10 (17) 7 4 (2) (+) Other Expenses, net 1 1 6 12 1 3 1 3 (+) D&A of Property & Equipment 6 6 7 8 5 5 5 6 (+) Interest Expense, net 3 3 3 3 4 2 3 4 (+) Emerging Markets (4) – – – – – – 0 0 (+) Income Tax (Benefit) Expense 2 2 (1) 2 (5) (3) (6) (3) (+) Loss on Debt Extinguishment – – – 1 – – – – Adjusted EBITDA 20 21 18 21 15 (9) 23 5 Three Months Ended