
AGM 8-K
Federal Agricultural Mortgage Corp (AGM)
8-K
2021-08-05
For: 2021-08-05
View Original
Added on
April 04, 2026
UNITED STATES
SECURITIES AND EXCHANGE COMMISSION
Washington, D.C. 20549
________________
FORM 8-K
CURRENT REPORT
PURSUANT TO SECTION 13 OR 15(d) OF THE
SECURITIES EXCHANGE ACT OF 1934
Date of Report (Date of earliest event reported): August 5, 2021
(Exact name of registrant as specified in its charter)
Federally chartered instrumentality of the United States | ||||||||||||||
(State or Other Jurisdiction of Incorporation) | (Commission File Number) | (IRS Employer Identification No.) | ||||||||||||
| (Address of Principal Executive Offices) | (Zip Code) | |||||||||||||
Registrant’s telephone number, including area code (202 ) 872-7700
No change
(Former name or former address, if changed since last report)
Check the appropriate box below if the Form 8-K filing is intended to simultaneously satisfy the filing obligation of the registrant under any of the following provisions (see General Instruction A.2. below):
Securities registered pursuant to Section 12(b) of the Act:
| Title of each class | Trading symbol | Exchange on which registered | ||||||||||||
Indicate by check mark whether the registrant is an emerging growth company as defined in Rule 405 of the Securities Act of 1933 (17 CFR §230.405) or Rule 12b-2 of the Securities Exchange Act of 1934 (17 CFR §240.12b-2). Emerging growth company ☐
If an emerging growth company, indicate by check mark if the registrant has elected not to use the extended transition period for complying with any new or revised financial accounting standards provided pursuant to Section 13(a) of the Exchange Act. ☐
Item 2.02 Results of Operations and Financial Condition.
On August 5, 2021, the Federal Agricultural Mortgage Corporation (“Farmer Mac”) issued a press release to announce (1) its financial results for the fiscal quarter ended June 30, 2021 and (2) a conference call to discuss those results and Farmer Mac’s Quarterly Report on Form 10-Q for the fiscal quarter ended June 30, 2021. A copy of the press release is attached as Exhibit 99.1 and is incorporated by reference into this report. All references to www.farmermac.com in Exhibit 99.1 are inactive textual references only, and the information contained on that website is not incorporated by reference into this report.
The information furnished in this Item 2.02, including Exhibit 99.1, shall not be deemed “filed” for purposes of Section 18 of the Securities Exchange Act of 1934, as amended (the “Exchange Act”), or otherwise subject to the liabilities of that Section, nor will any of such information or Exhibit be deemed incorporated by reference into any filing under the Exchange Act or the Securities Act of 1933, as amended (the “Securities Act”), except as shall be expressly set forth by specific reference in such filing.
Item 7.01 Regulation FD Disclosure.
On August 5, 2021, Farmer Mac posted an investor slide presentation for equity investors to its website at www.farmermac.com under the tab “Investors — Events and Presentations.” Farmer Mac expects to use the slide presentation in connection with future investor presentations to analysts and investors. The slide presentation is attached as Exhibit 99.2 and is incorporated by reference into this report. All references to www.farmermac.com in Exhibit 99.2 are inactive textual references only, and the information contained on that website is not incorporated by reference into this report.
The information furnished in this Item 7.01, including Exhibit 99.2, shall not be deemed “filed” for purposes of Section 18 of the Exchange Act, or otherwise subject to the liabilities of that Section, nor will any of such information or Exhibit be deemed incorporated by reference into any filing under the Exchange Act or the Securities Act, except as shall be expressly set forth by specific reference in such filing.
Item 9.01 Financial Statements and Exhibits.
(d) Exhibits
104 Cover Page Inline Interactive Data File - the cover page interactive data file does not appear in the Interactive Data File because its XBRL tags are embedded within the Inline XBRL document included as Exhibit 101
SIGNATURES
Pursuant to the requirements of the Securities Exchange Act of 1934, the registrant has duly caused this report to be signed on its behalf by the undersigned thereunto duly authorized.
FEDERAL AGRICULTURAL MORTGAGE CORPORATION
By: /s/ Stephen P. Mullery
Name: Stephen P. Mullery
Title: Executive Vice President – General Counsel
Dated: August 5, 2021
Farmer Mac Reports Second Quarter 2021 Results
- Outstanding Business Volume of $22.2 Billion -
WASHINGTON, D.C., August 5, 2021 — The Federal Agricultural Mortgage Corporation (Farmer Mac; NYSE: AGM and AGM.A), the nation's secondary market provider that increases the availability and affordability of credit for the benefit of rural America, today announced its results for the fiscal quarter ended June 30, 2021.
Second Quarter 2021 Highlights
•Added $1.5 billion of gross business volume, resulting in net growth of $334.6 million;
•Net interest income grew $6.8 million year-over-year to $55.1 million;
•Net effective spread, a non-GAAP measure, increased 22% from the prior-year period to $56.6 million and a high 1.01% of the overall portfolio, primarily due to portfolio growth and a continued shift in portfolio composition to higher spread loan purchase products;
•Net income attributable to common stockholders was $25.4 million, or $2.35 per diluted common share;
•Core earnings, a non-GAAP measure, grew 14% from the prior-year period to $30.0 million, or $2.77 per diluted common share;
•Second quarter 2021 efficiency ratio of 26%;
•Return on Equity improved to 18%, compared to 16% for the first quarter 2021;
•Total allowance for credit losses reflected $1.0 million release driven by improving credit metrics and economic forecasts; and
•Issued $125.0 million of Tier 1 capital through the public offering of 4.875% Series G non-cumulative preferred stock.
"Second quarter was another strong quarter for Farmer Mac," said President & Chief Executive Officer Brad Nordholm. "We generated record core earnings results, with an all-time high net effective spread. We maintained strong credit quality, saw continued volume demand and executed on critical initiatives that are consistent with our multi-year strategic plan. We expect the positive trends in the first half of the year to continue, as we build on the momentum we’ve established as we create greater value for our customers, communities, and shareholders over time. While the emergence of the Delta variant creates some level of near-term uncertainty, we are confident that our current infrastructure, strong capital position, and commitment to our customers will continue to support us, as it has over the last 17 months, in navigating the ongoing pandemic."
1
Second Quarter 2021 Results
Business Volume
Our outstanding business volume was $22.2 billion as of June 30, 2021, a net increase of $0.3 billion from March 31, 2021 after taking into account all new business, maturities, and paydowns on existing assets. The net increase was primarily attributable to a net increase of $426.8 million in the Farm & Ranch line of business, partially offset by net decreases of $60.2 million in the USDA Guarantees line of business, $24.4 million in the Rural Utilities line of business, and $7.6 million in the Institutional Credit line of business.
The $426.8 million net increase in our Farm & Ranch line of business is due to a $394.8 million net increase in outstanding loan purchase volume and a $128.6 million net increase in loans underlying long-term standby purchase commitments ("LTSPCs"), which was partially offset by a net decrease of $96.5 million in loans held in consolidated trusts. Our net growth of 17.5% in the Farm & Ranch on-balance sheet portfolio over the twelve months ended June 30, 2021 is significantly higher than the 6.0% net growth of the overall agricultural mortgage loan market over the twelve months ended March 31, 2021 (based on our analysis of bank and Farm Credit System call report data).
The $7.6 million net decrease in the Institutional Credit line of business reflects $476.2 million of maturities, partially offset by $468.6 million in gross volume. This net decrease was due to a net volume decrease in our smaller fund counterparties, partially offset by a modest net increase among our three largest counterparties. The net growth from our large counterparties was driven by the purchase of four new AgVantage securities in the rural utilities industry with an aggregate purchase price of $375.0 million.
The $24.4 million net decrease in the Rural Utilities line of business was due to $63.5 million in paydowns in loans and LTSPCs, partially offset by $39.1 million in gross new loan volume. The net volume decrease is due to increased market competitiveness that has lowered spreads in this line of business.
The $60.2 million net decrease in the USDA Guarantees line of business reflected $160.6 million in paydowns, partially offset by $100.4 million in gross new volume. The net volume decrease is reflective of the low interest rate environment that has increased the competitiveness and lowered the spreads in this line of business.
Spreads
Net interest income for second quarter 2021 was $55.1 million, a $6.8 million increase compared to $48.3 million in the prior-year period, primarily due to a $4.3 million increase related to new business volume, a $1.8 million decrease in funding costs, and a $0.7 million increase in the fair value of derivatives designated in fair value hedge accounting relationships (designated financial derivatives). Net interest yield was 0.94% in second quarter 2021 compared to 0.87% in the prior-year period.
Net effective spread, a non-GAAP measure, for second quarter 2021 was $56.6 million, a $10.1 million increase from $46.5 million in the prior-year period. This increase was primarily attributable to a $5.1 million decrease in non-GAAP funding costs, an increase of $4.3 million from new business volume, and a $0.7 million increase in cash collections on non-accrual loans. In percentage terms, net effective spread was 1.01% for second quarter 2021, as compared to 0.89% in second quarter 2020. The increase of 0.12% was primarily attributable to a decrease in non-GAAP funding costs and net volume growth.
2
Earnings
Farmer Mac's net income attributable to common stockholders for second quarter 2021 were $25.4 million ($2.35 per diluted common share), compared to $31.7 million ($2.94 per diluted common share) in the prior-year period. The $6.2 million year-over-year decrease in net income attributable to common stockholders was due to a $7.6 million after-tax decrease in the fair value of undesignated financial derivatives due to fluctuations in long-term interest rates, a $2.2 million after-tax increase in operating expenses, and a $1.9 million increase in preferred stock dividends. These factors were partially offset by a $5.4 million after-tax increase in net interest income.
Farmer Mac enters into financial derivatives transactions to hedge interest rate risks inherent in its business and carries its financial derivatives at fair value in its consolidated financial statements. As these fluctuations are not expected to have a cumulative impact on Farmer Mac's earnings, Farmer Mac uses non-GAAP core earnings as a useful alternative measure to understand the business.
Farmer Mac's non-GAAP core earnings for second quarter 2021 were $30.0 million ($2.77 per diluted common share), compared to $26.3 million ($2.45 per diluted common share) in second quarter 2020. The $3.6 million year-over-year increase in core earnings was primarily due to a $8.0 million after-tax increase in net effective spread. This increase was partially offset by a $2.2 million after-tax increase in operating expenses and a $1.9 million increase in preferred stock dividends.
Credit
As of June 30, 2021, the total allowance for losses was $16.6 million, which reflects a $1.0 million release from March 31, 2021. The release was primarily due to ratings upgrades and improving economic conditions, specifically, expectations for unemployment and agricultural commodity prices. Across all of Farmer Mac's lines of business, allowance for losses represented 0.07% of total outstanding business volume as of June 30, 2021.
As of June 30, 2021, Farmer Mac's 90-day delinquencies were $63.1 million (0.70% of the Farm & Ranch portfolio), compared to $72.3 million (0.84% of the Farm & Ranch portfolio) as of March 31, 2021. The decrease in 90-day delinquencies from first quarter was primarily driven by two commodity groups – permanent plantings and livestock. Across all of Farmer Mac's lines of business, 90-day delinquencies represented 0.28% of total outstanding business volume as of June 30, 2021, compared to 0.33% as of March 31, 2021.
Capital
As of June 30, 2021, Farmer Mac's core capital level was $1.2 billion, which was $482.6 million above the minimum capital level required by our statutory charter. This compares to $1.0 billion as of March 31, 2021, which was $348.1 million above the minimum capital requirement. The increase in capital in excess of the minimum capital level required was primarily due to the issuance of the Series G Preferred Stock and an increase in retained earnings. Farmer Mac's Tier 1 capital ratio was 15.3% as of June 30, 2021.
Preferred Stock
In May 2021, Farmer Mac issued 5.0 million shares of 4.875% non-cumulative perpetual Series G
preferred stock, par value $25.00 per share. Farmer Mac incurred direct costs of $3.7 million related to
3
the issuance of the Series G preferred stock. The dividend rate on the Series G preferred stock will remain
at a non-cumulative, fixed rate of 4.875% per year, when, as, and if a dividend is declared by the Board of
Directors of Farmer Mac, for so long as the Series G preferred stock remains outstanding. The Series G
preferred stock has no maturity date, but Farmer Mac has the option to redeem the preferred stock on any dividend payment date on and after July 17, 2026.
Share Repurchase Program
In March 2021, Farmer Mac's board of directors reinstated the share repurchase program on its previous terms (with a remaining authorization of up to $9.8 million in stock repurchases) and extended the expiration date of the program to March 2023. Farmer Mac did not repurchase any shares of its Class C non-voting common stock during the first half of 2021.
Earnings Conference Call Information
The conference call to discuss Farmer Mac's second quarter 2021 financial results will be held beginning at 4:30 p.m. Eastern time on Thursday, August 5, and can be accessed by telephone or live webcast as follows:
Telephone (Domestic): (888) 645-4404
Telephone (International): (862) 298-0702
Webcast: https://www.farmermac.com/investors/events-presentations/
When dialing in to the call, please ask for the "Farmer Mac Earnings Conference Call." The call can be heard live and will also be available for replay on Farmer Mac’s website for two weeks following the conclusion of the call.
More complete information about Farmer Mac's performance for second quarter 2021 is in Farmer Mac's Quarterly Report on Form 10-Q for the quarter ended June 30, 2021, filed today with the SEC.
Use of Non-GAAP Measures
In the accompanying analysis of its financial information, Farmer Mac uses the following non-GAAP measures: "core earnings," "core earnings per share," and "net effective spread." Farmer Mac uses these non-GAAP measures to measure corporate economic performance and develop financial plans because, in management's view, they are useful alternative measures in understanding Farmer Mac's economic performance, transaction economics, and business trends. The non-GAAP financial measures that Farmer Mac uses may not be comparable to similarly labeled non-GAAP financial measures disclosed by other companies. Farmer Mac's disclosure of these non-GAAP measures is intended to be supplemental in nature and is not meant to be considered in isolation from, as a substitute for, or as more important than, the related financial information prepared in accordance with GAAP.
Core earnings and core earnings per share principally differ from net income attributable to common stockholders and earnings per common share, respectively, by excluding the effects of fair value fluctuations. These fluctuations are not expected to have a cumulative net impact on Farmer Mac's financial condition or results of operations reported in accordance with GAAP if the related financial instruments are held to maturity, as is expected.
Core earnings and core earnings per share also differ from net income attributable to common stockholders and earnings per common share, respectively, by excluding specified infrequent or unusual
4
transactions that Farmer Mac believes are not indicative of future operating results and that may not reflect the trends and economic financial performance of Farmer Mac's core business. For example, we have excluded from core earnings losses on retirement of preferred stock and the re-measurement of the deferred tax asset.
Farmer Mac uses net effective spread to measure the net spread Farmer Mac earns between its interest-earning assets and the related net funding costs of these assets. Net effective spread differs from net interest income and net interest yield because it excludes: (1) the amortization of premiums and discounts on assets consolidated at fair value that are amortized as adjustments to yield in interest income over the contractual or estimated remaining lives of the underlying assets; (2) interest income and interest expense related to consolidated trusts with beneficial interests owned by third parties, which are presented on Farmer Mac's consolidated balance sheets as "Loans held for investment in consolidated trusts, at amortized cost"; and (3) the fair value changes of financial derivatives and the corresponding assets or liabilities designated in a fair value hedge accounting relationship.
Net effective spread also principally differs from net interest income and net interest yield because it includes: (1) the accrual of income and expense related to the contractual amounts due on financial derivatives that are not designated in hedge accounting relationships ("undesignated financial derivatives"); and (2) the net effects of terminations or net settlements on financial derivatives. More information about Farmer Mac’s use of non-GAAP measures is available in "Management's Discussion and Analysis of Financial Condition and Results of Operations—Results of Operations" in Farmer Mac's Annual Report on Form 10-K for the year ended December 31, 2020, filed February 25, 2021 with the SEC.
For a reconciliation of Farmer Mac's net income attributable to common stockholders to core earnings and of earnings per common share to core earnings per share, and net interest income and net interest yield to net effective spread, see "Reconciliations" below.
Forward-Looking Statements
Management's expectations for Farmer Mac's future necessarily involve assumptions and estimates and the evaluation of risks and uncertainties. Various factors or events, both known and unknown, could cause Farmer Mac's actual results to differ materially from the expectations as expressed or implied by the forward-looking statements in this release, including uncertainties about:
•the duration, spread, and severity of the COVID-19 pandemic and its effects on the business operations of agricultural and rural borrowers, the capital markets, and Farmer Mac's business operations;
•the actions taken to address the COVID-19 pandemic, including government actions to mitigate the economic impact of the pandemic, how quickly and to what extent normal economic and operating conditions can resume, the possibility of future disruptions to economic recovery caused by any further outbreaks, regulatory measures or voluntary actions to limit the spread of COVID-19, and the duration and efficacy of any restrictions that may be imposed;
•the availability to Farmer Mac of debt and equity financing and, if available, the reasonableness of rates and terms;
•legislative or regulatory developments that could affect Farmer Mac, its sources of business, or agricultural or rural infrastructure industries;
•fluctuations in the fair value of assets held by Farmer Mac and its subsidiaries;
5
•the level of lender interest in Farmer Mac's products and the secondary market provided by Farmer Mac;
•the general rate of growth in agricultural mortgage and rural utilities indebtedness;
•the effect of economic conditions and geopolitics on agricultural mortgage or rural utilities lending, borrower repayment capacity, or collateral values, including fluctuations in interest rates, changes in U.S. trade policies, fluctuations in export demand for U.S. agricultural products, and volatility in commodity prices;
•the degree to which Farmer Mac is exposed to interest rate risk resulting from fluctuations in Farmer Mac's borrowing costs relative to market indexes;
•developments in the financial markets, including possible investor, analyst, and rating agency reactions to events involving government-sponsored enterprises, including Farmer Mac;
•the effect of any changes in Farmer Mac's executive leadership; and
•other factors that could hinder agricultural mortgage lending or borrower repayment capacity, including the effects of severe weather or fluctuations in agricultural real estate values.
Other risk factors are discussed in "Risk Factors" in Part I, Item 1A in Farmer Mac's Annual Report on Form 10-K for the year ended December 31, 2020, as filed with the SEC on February 25, 2021. Considering these potential risks and uncertainties, no undue reliance should be placed on any forward-looking statements expressed in this release. The forward-looking statements contained in this release represent management's expectations as of the date of this release. Farmer Mac undertakes no obligation to release publicly the results of revisions to any forward-looking statements included in this release to reflect new information or any future events or circumstances, except as otherwise required by applicable law. The information in this release is not necessarily indicative of future results.
About Farmer Mac
Farmer Mac is a vital part of the agricultural credit markets and was created to increase access to and reduce the cost of credit for the benefit of American agricultural and rural communities. As the nation’s secondary market for agricultural credit, we provide financial solutions to a broad spectrum of the agricultural community, including agricultural lenders, agribusinesses, and other institutions that can benefit from access to flexible, low-cost financing and risk management tools. Farmer Mac's customers benefit from our low cost of funds, low overhead costs, and high operational efficiency. More information about Farmer Mac (including the Annual Report on Form 10-K referenced above) is available on Farmer Mac's website at www.farmermac.com.
CONTACT: Jalpa Nazareth, Investor Relations
Megan Murray-Pelaez, Media Inquiries
(202) 872-7700
* * * *
6
FEDERAL AGRICULTURAL MORTGAGE CORPORATION AND SUBSIDIARIES
CONSOLIDATED BALANCE SHEETS
(unaudited)
| As of | |||||||||||
| June 30, 2021 | December 31, 2020 | ||||||||||
| (in thousands) | |||||||||||
| Assets: | |||||||||||
| Cash and cash equivalents | $ | 828,403 | $ | 1,033,941 | |||||||
| Investment securities: | |||||||||||
| Available-for-sale, at fair value (amortized cost of $3,817,578 and $3,843,666, respectively) | 3,832,232 | 3,853,692 | |||||||||
| Held-to-maturity, at amortized cost | 45,032 | 45,032 | |||||||||
| Other investments | 403 | — | |||||||||
| Total Investment Securities | 3,877,667 | 3,898,724 | |||||||||
| Farmer Mac Guaranteed Securities: | |||||||||||
| Available-for-sale, at fair value (amortized cost of $6,618,871 and $6,594,992, respectively) | 6,877,405 | 6,947,701 | |||||||||
| Held-to-maturity, at amortized cost | 1,040,757 | 1,175,792 | |||||||||
| Total Farmer Mac Guaranteed Securities | 7,918,162 | 8,123,493 | |||||||||
| USDA Securities: | |||||||||||
| Trading, at fair value | 5,050 | 6,695 | |||||||||
| Held-to-maturity, at amortized cost | 2,445,718 | 2,473,626 | |||||||||
| Total USDA Securities | 2,450,768 | 2,480,321 | |||||||||
| Loans: | |||||||||||
| Loans held for investment, at amortized cost | 7,796,712 | 7,261,933 | |||||||||
| Loans held for investment in consolidated trusts, at amortized cost | 1,077,993 | 1,287,045 | |||||||||
| Allowance for losses | (14,000) | (13,832) | |||||||||
| Total loans, net of allowance | 8,860,705 | 8,535,146 | |||||||||
| Financial derivatives, at fair value | 16,224 | 17,468 | |||||||||
| Interest receivable (includes $11,197 and $16,401, respectively, related to consolidated trusts) | 161,282 | 186,429 | |||||||||
| Guarantee and commitment fees receivable | 37,261 | 37,113 | |||||||||
| Deferred tax asset, net | 10,200 | 18,321 | |||||||||
| Prepaid expenses and other assets | 20,573 | 24,545 | |||||||||
| Total Assets | $ | 24,181,245 | $ | 24,355,501 | |||||||
| Liabilities and Equity: | |||||||||||
| Liabilities: | |||||||||||
| Notes payable | $ | 21,706,254 | $ | 21,848,917 | |||||||
| Debt securities of consolidated trusts held by third parties | 1,120,293 | 1,323,786 | |||||||||
| Financial derivatives, at fair value | 24,347 | 29,892 | |||||||||
| Accrued interest payable (includes $10,126 and $14,370, respectively, related to consolidated trusts) | 82,060 | 92,738 | |||||||||
| Guarantee and commitment obligation | 35,827 | 35,535 | |||||||||
| Accounts payable and accrued expenses | 30,138 | 28,879 | |||||||||
| Reserve for losses | 2,111 | 3,277 | |||||||||
| Total Liabilities | 23,001,030 | 23,363,024 | |||||||||
| Commitments and Contingencies | |||||||||||
| Equity: | |||||||||||
| Preferred stock: | |||||||||||
| Series C, par value $25 per share, 3,000,000 shares authorized, issued and outstanding | 73,382 | 73,382 | |||||||||
| Series D, par value $25 per share, 4,000,000 shares authorized, issued and outstanding | 96,659 | 96,659 | |||||||||
Series E, par value $25 per share, 3,180,000 shares authorized, issued and outstanding | 77,003 | 77,003 | |||||||||
| Series F, par value $25 per share, 4,800,000 shares authorized, issued and outstanding | 116,160 | 116,160 | |||||||||
| Series G, par value $25 per share, 5,000,000 shares authorized, issued and outstanding | 121,327 | — | |||||||||
| Common stock: | |||||||||||
| Class A Voting, $1 par value, no maximum authorization, 1,030,780 shares outstanding | 1,031 | 1,031 | |||||||||
| Class B Voting, $1 par value, no maximum authorization, 500,301 shares outstanding | 500 | 500 | |||||||||
| Class C Non-Voting, $1 par value, no maximum authorization, 9,234,311 shares and 9,205,897 shares outstanding, respectively | 9,234 | 9,206 | |||||||||
| Additional paid-in capital | 124,148 | 122,899 | |||||||||
| Accumulated other comprehensive income/(loss), net of tax | 16,733 | (13,923) | |||||||||
| Retained earnings | 544,038 | 509,560 | |||||||||
| Total Equity | 1,180,215 | 992,477 | |||||||||
| Total Liabilities and Equity | $ | 24,181,245 | $ | 24,355,501 | |||||||
7
FEDERAL AGRICULTURAL MORTGAGE CORPORATION AND SUBSIDIARIES
CONSOLIDATED STATEMENTS OF OPERATIONS
(unaudited)
| For the Three Months Ended | For the Six Months Ended | ||||||||||||||||||||||
| June 30, 2021 | June 30, 2020 | June 30, 2021 | June 30, 2020 | ||||||||||||||||||||
| (in thousands, except per share amounts) | |||||||||||||||||||||||
| Interest income: | |||||||||||||||||||||||
| Investments and cash equivalents | $ | 4,457 | $ | 10,399 | $ | 9,986 | $ | 28,140 | |||||||||||||||
| Farmer Mac Guaranteed Securities and USDA Securities | 42,414 | 61,792 | 84,818 | 133,309 | |||||||||||||||||||
| Loans | 60,214 | 55,430 | 119,708 | 116,026 | |||||||||||||||||||
| Total interest income | 107,085 | 127,621 | 214,512 | 277,475 | |||||||||||||||||||
| Total interest expense | 51,956 | 79,273 | 106,132 | 187,815 | |||||||||||||||||||
| Net interest income | 55,129 | 48,348 | 108,380 | 89,660 | |||||||||||||||||||
| Release of/(provision for) losses | 761 | (451) | (152) | (3,889) | |||||||||||||||||||
| Net interest income after provision for losses | 55,890 | 47,897 | 108,228 | 85,771 | |||||||||||||||||||
| Non-interest income/(expense): | |||||||||||||||||||||||
| Guarantee and commitment fees | 2,997 | 3,140 | 6,027 | 6,336 | |||||||||||||||||||
| (Losses)/gains on financial derivatives | (3,066) | 6,523 | 1,227 | (2,775) | |||||||||||||||||||
| (Losses)/gains on trading securities | (62) | (21) | (75) | 85 | |||||||||||||||||||
| Gains on sale of real estate owned | — | — | — | 485 | |||||||||||||||||||
| Release of reserve for losses | 222 | 400 | 1,166 | 7 | |||||||||||||||||||
| Other income | 435 | 1,229 | 1,018 | 2,045 | |||||||||||||||||||
| Non-interest income | 526 | 11,271 | 9,363 | 6,183 | |||||||||||||||||||
| Operating expenses: | |||||||||||||||||||||||
| Compensation and employee benefits | 9,779 | 8,087 | 21,574 | 18,214 | |||||||||||||||||||
| General and administrative | 6,349 | 5,295 | 12,685 | 10,658 | |||||||||||||||||||
| Regulatory fees | 750 | 725 | 1,500 | 1,450 | |||||||||||||||||||
| Operating expenses | 16,878 | 14,107 | 35,759 | 30,322 | |||||||||||||||||||
| Income before income taxes | 39,538 | 45,061 | 81,832 | 61,632 | |||||||||||||||||||
| Income tax expense | 8,252 | 9,435 | 17,319 | 13,176 | |||||||||||||||||||
| Net income | 31,286 | 35,626 | 64,513 | 48,456 | |||||||||||||||||||
| Preferred stock dividends | (5,842) | (3,939) | (11,111) | (7,370) | |||||||||||||||||||
| Net income attributable to common stockholders | $ | 25,444 | $ | 31,687 | $ | 53,402 | $ | 41,086 | |||||||||||||||
| Earnings per common share: | |||||||||||||||||||||||
| Basic earnings per common share | $ | 2.36 | $ | 2.95 | $ | 4.96 | $ | 3.83 | |||||||||||||||
| Diluted earnings per common share | $ | 2.35 | $ | 2.94 | $ | 4.93 | $ | 3.81 | |||||||||||||||
8
Reconciliations
Reconciliations of Farmer Mac's net income attributable to common stockholders to core earnings and core earnings per share are presented in the following tables along with information about the composition of core earnings for the periods indicated:
| Reconciliation of Net Income Attributable to Common Stockholders to Core Earnings | |||||||||||||||||
| For the Three Months Ended | |||||||||||||||||
| June 30, 2021 | March 31, 2021 | June 30, 2020 | |||||||||||||||
| (in thousands, except per share amounts) | |||||||||||||||||
| Net income attributable to common stockholders | $ | 25,444 | $ | 27,958 | $ | 31,687 | |||||||||||
| Less reconciling items: | |||||||||||||||||
| (Losses)/gains on undesignated financial derivatives due to fair value changes | (3,721) | 1,695 | 8,700 | ||||||||||||||
| Losses on hedging activities due to fair value changes | (2,097) | (271) | (2,676) | ||||||||||||||
| Unrealized losses on trading assets | (61) | (14) | (20) | ||||||||||||||
| Net effects of amortization of premiums/discounts and deferred gains on assets consolidated at fair value | 20 | 16 | 35 | ||||||||||||||
| Net effects of terminations or net settlements on financial derivatives | 109 | 1,165 | 720 | ||||||||||||||
| Income tax effect related to reconciling items | 1,208 | (544) | (1,419) | ||||||||||||||
| Sub-total | (4,542) | 2,047 | 5,340 | ||||||||||||||
| Core earnings | $ | 29,986 | $ | 25,911 | $ | 26,347 | |||||||||||
| Composition of Core Earnings: | |||||||||||||||||
| Revenues: | |||||||||||||||||
Net effective spread(1) | $ | 56,551 | $ | 53,859 | $ | 46,469 | |||||||||||
Guarantee and commitment fees(2) | 4,334 | 4,240 | 4,943 | ||||||||||||||
Other(3) | 301 | 451 | 1,048 | ||||||||||||||
| Total revenues | 61,186 | 58,550 | 52,460 | ||||||||||||||
| Credit related expense (GAAP): | |||||||||||||||||
| (Release of)/provision for losses | (983) | (31) | 51 | ||||||||||||||
| Gains on sale of REO | — | — | — | ||||||||||||||
| Total credit related expense | (983) | (31) | 51 | ||||||||||||||
| Operating expenses (GAAP): | |||||||||||||||||
| Compensation and employee benefits | 9,779 | 11,795 | 8,087 | ||||||||||||||
| General and administrative | 6,349 | 6,336 | 5,295 | ||||||||||||||
| Regulatory fees | 750 | 750 | 725 | ||||||||||||||
| Total operating expenses | 16,878 | 18,881 | 14,107 | ||||||||||||||
| Net earnings | 45,291 | 39,700 | 38,302 | ||||||||||||||
Income tax expense(4) | 9,463 | 8,520 | 8,016 | ||||||||||||||
| Preferred stock dividends (GAAP) | 5,842 | 5,269 | 3,939 | ||||||||||||||
| Core earnings | $ | 29,986 | $ | 25,911 | $ | 26,347 | |||||||||||
| Core earnings per share: | |||||||||||||||||
| Basic | $ | 2.79 | $ | 2.41 | $ | 2.46 | |||||||||||
| Diluted | 2.77 | 2.39 | 2.45 | ||||||||||||||
(1)Net effective spread is a non-GAAP measure. See "Use of Non-GAAP Measures" above for an explanation of net effective spread. See below for a reconciliation of net interest income to net effective spread.
(2)Includes interest income and interest expense related to consolidated trusts owned by third parties reclassified from net interest income to guarantee and commitment fees to reflect management's view that the net interest income Farmer Mac earns is effectively a guarantee fee on the consolidated Farmer Mac Guaranteed Securities.
9
(3)Reflects reconciling adjustments for the reclassification to exclude expenses related to interest rate swaps not designated as hedges and terminations or net settlements on financial derivatives, and reconciling adjustments to exclude fair value adjustments on financial derivatives and trading assets and the recognition of deferred gains over the estimated lives of certain Farmer Mac Guaranteed Securities and USDA Securities.
(4)Includes the tax impact of non-GAAP reconciling items between net income attributable to common stockholders and core earnings.
| Reconciliation of Net Income Attributable to Common Stockholders to Core Earnings | |||||||||||
| For the Six Months Ended | |||||||||||
| June 30, 2021 | June 30, 2020 | ||||||||||
| (in thousands, except per share amounts) | |||||||||||
| Net income attributable to common stockholders | $ | 53,402 | $ | 41,086 | |||||||
| Less reconciling items: | |||||||||||
| (Losses)/gains on undesignated financial derivatives due to fair value changes | (2,026) | 2,216 | |||||||||
| Losses on hedging activities due to fair value changes | (2,368) | (8,601) | |||||||||
| Unrealized (losses)/gains on trading assets | (75) | 86 | |||||||||
| Net effects of amortization of premiums/discounts and deferred gains on assets consolidated at fair value | 36 | 38 | |||||||||
| Net effects of terminations or net settlements on financial derivatives | 1,274 | (580) | |||||||||
| Income tax effect related to reconciling items | 664 | 1,437 | |||||||||
| Sub-total | (2,495) | (5,404) | |||||||||
| Core earnings | $ | 55,897 | $ | 46,490 | |||||||
| Composition of Core Earnings: | |||||||||||
| Revenues: | |||||||||||
Net effective spread(1) | $ | 110,410 | $ | 90,632 | |||||||
Guarantee and commitment fees(2) | 8,574 | 9,839 | |||||||||
Other(3) | 752 | 1,722 | |||||||||
| Total revenues | 119,736 | 102,193 | |||||||||
| Credit related expense (GAAP): | |||||||||||
| (Release of)/provision for losses | (1,014) | 3,882 | |||||||||
| Gain on sale of REO | — | (485) | |||||||||
| Total credit related expense | (1,014) | 3,397 | |||||||||
| Operating expenses (GAAP): | |||||||||||
| Compensation and employee benefits | 21,574 | 18,214 | |||||||||
| General and administrative | 12,685 | 10,658 | |||||||||
| Regulatory fees | 1,500 | 1,450 | |||||||||
| Total operating expenses | 35,759 | 30,322 | |||||||||
| Net earnings | 84,991 | 68,474 | |||||||||
Income tax expense(4) | 17,983 | 14,614 | |||||||||
| Preferred stock dividends (GAAP) | 11,111 | 7,370 | |||||||||
| Core earnings | $ | 55,897 | $ | 46,490 | |||||||
| Core earnings per share: | |||||||||||
| Basic | $ | 5.20 | $ | 4.34 | |||||||
| Diluted | 5.16 | 4.31 | |||||||||
(1)Net effective spread is a non-GAAP measure. See "Use of Non-GAAP Measures" above for an explanation of net effective spread. See below for a reconciliation of net interest income to net effective spread.
(2)Includes interest income and interest expense related to consolidated trusts owned by third parties reclassified from net interest income to guarantee and commitment fees to reflect management's view that the net interest income Farmer Mac earns is effectively a guarantee fee on the consolidated Farmer Mac Guaranteed Securities.
10
(3)Reflects reconciling adjustments for the reclassification to exclude expenses related to interest rate swaps not designated as hedges and terminations or net settlements on financial derivatives, and reconciling adjustments to exclude fair value adjustments on financial derivatives and trading assets and the recognition of deferred gains over the estimated lives of certain Farmer Mac Guaranteed Securities and USDA Securities.
(4)Includes the tax impact of non-GAAP reconciling items between net income attributable to common stockholders and core earnings.
| Reconciliation of GAAP Basic Earnings Per Share to Core Earnings Basic Earnings Per Share | |||||||||||||||||||||||||||||
| For the Three Months Ended | For the Six Months Ended | ||||||||||||||||||||||||||||
| June 30, 2021 | March 31, 2021 | June 30, 2020 | June 30, 2021 | June 30, 2020 | |||||||||||||||||||||||||
| (in thousands, except per share amounts) | |||||||||||||||||||||||||||||
| GAAP - Basic EPS | $ | 2.36 | $ | 2.60 | $ | 2.95 | $ | 4.96 | $ | 3.83 | |||||||||||||||||||
| Less reconciling items: | |||||||||||||||||||||||||||||
| (Losses)/gains on undesignated financial derivatives due to fair value changes | (0.35) | 0.16 | 0.81 | (0.19) | 0.21 | ||||||||||||||||||||||||
| Losses on hedging activities due to fair value changes | (0.19) | (0.03) | (0.25) | (0.22) | (0.80) | ||||||||||||||||||||||||
| Unrealized (losses)/gains on trading securities | (0.01) | — | — | (0.01) | 0.01 | ||||||||||||||||||||||||
| Net effects of amortization of premiums/discounts and deferred gains on assets consolidated at fair value | — | — | — | — | — | ||||||||||||||||||||||||
| Net effects of terminations or net settlements on financial derivatives | 0.01 | 0.11 | 0.06 | 0.12 | (0.06) | ||||||||||||||||||||||||
| Income tax effect related to reconciling items | 0.11 | (0.05) | (0.13) | 0.06 | 0.13 | ||||||||||||||||||||||||
| Sub-total | (0.43) | 0.19 | 0.49 | (0.24) | (0.51) | ||||||||||||||||||||||||
| Core Earnings - Basic EPS | $ | 2.79 | $ | 2.41 | $ | 2.46 | $ | 5.20 | $ | 4.34 | |||||||||||||||||||
| Shares used in per share calculation (GAAP and Core Earnings) | 10,763 | 10,738 | 10,730 | 10,751 | 10,721 | ||||||||||||||||||||||||
| Reconciliation of GAAP Diluted Earnings Per Share to Core Earnings Diluted Earnings Per Share | |||||||||||||||||||||||||||||
| For the Three Months Ended | For the Six Months Ended | ||||||||||||||||||||||||||||
| June 30, 2021 | March 31, 2021 | June 30, 2020 | June 30, 2021 | June 30, 2020 | |||||||||||||||||||||||||
| (in thousands, except per share amounts) | |||||||||||||||||||||||||||||
| GAAP - Diluted EPS | $ | 2.35 | $ | 2.58 | $ | 2.94 | $ | 4.93 | $ | 3.81 | |||||||||||||||||||
| Less reconciling items: | |||||||||||||||||||||||||||||
| (Losses)/gains on undesignated financial derivatives due to fair value changes | (0.34) | 0.16 | 0.81 | (0.18) | 0.21 | ||||||||||||||||||||||||
| Losses on hedging activities due to fair value changes | (0.19) | (0.03) | (0.25) | (0.22) | (0.80) | ||||||||||||||||||||||||
| Unrealized (losses)/gains on trading securities | (0.01) | — | — | (0.01) | 0.01 | ||||||||||||||||||||||||
| Net effects of amortization of premiums/discounts and deferred gains on assets consolidated at fair value | — | — | — | — | — | ||||||||||||||||||||||||
| Net effects of terminations or net settlements on financial derivatives | 0.01 | 0.11 | 0.06 | 0.12 | (0.05) | ||||||||||||||||||||||||
| Income tax effect related to reconciling items | 0.11 | (0.05) | (0.13) | 0.06 | 0.13 | ||||||||||||||||||||||||
| Sub-total | (0.42) | 0.19 | 0.49 | (0.23) | (0.50) | ||||||||||||||||||||||||
| Core Earnings - Diluted EPS | $ | 2.77 | $ | 2.39 | $ | 2.45 | $ | 5.16 | $ | 4.31 | |||||||||||||||||||
| Shares used in per share calculation (GAAP and Core Earnings) | 10,838 | 10,819 | 10,776 | 10,829 | 10,779 | ||||||||||||||||||||||||
11
The following table presents a reconciliation of net interest income and net yield to net effective spread for the periods indicated:
| Reconciliation of GAAP Net Interest Income/Yield to Net Effective Spread | |||||||||||||||||||||||||||||||||||||||||||||||||||||||||||
| For the Three Months Ended | For the Six Months Ended | ||||||||||||||||||||||||||||||||||||||||||||||||||||||||||
| June 30, 2021 | March 31, 2021 | June 30, 2020 | June 30, 2021 | June 30, 2020 | |||||||||||||||||||||||||||||||||||||||||||||||||||||||
| Dollars | Yield | Dollars | Yield | Dollars | Yield | Dollars | Yield | Dollars | Yield | ||||||||||||||||||||||||||||||||||||||||||||||||||
| (dollars in thousands) | |||||||||||||||||||||||||||||||||||||||||||||||||||||||||||
| Net interest income/yield | $ | 55,129 | 0.94 | % | $ | 53,251 | 0.91 | % | $ | 48,348 | 0.87 | % | $ | 108,380 | 0.93 | % | $ | 89,660 | 0.82 | % | |||||||||||||||||||||||||||||||||||||||
| Net effects of consolidated trusts | (1,337) | 0.02 | % | (1,210) | 0.03 | % | (1,804) | 0.02 | % | (2,547) | 0.02 | % | (3,505) | 0.03 | % | ||||||||||||||||||||||||||||||||||||||||||||
| Expense related to undesignated financial derivatives | 970 | 0.02 | % | 2,068 | 0.04 | % | (2,413) | (0.05) | % | 3,038 | 0.03 | % | (3,603) | (0.04) | % | ||||||||||||||||||||||||||||||||||||||||||||
| Amortization of premiums/discounts on assets consolidated at fair value | (13) | — | % | (8) | — | % | (21) | — | % | (20) | — | % | (10) | — | % | ||||||||||||||||||||||||||||||||||||||||||||
| Amortization of losses due to terminations or net settlements on financial derivatives | 77 | — | % | 103 | — | % | (22) | — | % | 180 | — | % | 27 | — | % | ||||||||||||||||||||||||||||||||||||||||||||
| Fair value changes on fair value hedge relationships | 1,725 | 0.03 | % | (345) | (0.01) | % | 2,381 | 0.05 | % | 1,379 | 0.01 | % | 8,063 | 0.08 | % | ||||||||||||||||||||||||||||||||||||||||||||
| Net effective spread | $ | 56,551 | 1.01 | % | $ | 53,859 | 0.97 | % | $ | 46,469 | 0.89 | % | $ | 110,410 | 0.99 | % | $ | 90,632 | 0.89 | % | |||||||||||||||||||||||||||||||||||||||
12
The following table presents core earnings for Farmer Mac's reportable operating segments and a reconciliation to consolidated net income for the three months ended June 30, 2021:
| Core Earnings by Business Segment | |||||||||||||||||||||||||||||||||||||||||
| For the Three Months Ended June 30, 2021 | |||||||||||||||||||||||||||||||||||||||||
| Farm & Ranch | USDA Guarantees | Rural Utilities | Institutional Credit | Corporate | Reconciling Adjustments | Consolidated Net Income | |||||||||||||||||||||||||||||||||||
| (in thousands) | |||||||||||||||||||||||||||||||||||||||||
| Net interest income | $ | 24,057 | $ | 6,089 | $ | 5,328 | $ | 16,894 | $ | 2,761 | $ | — | $ | 55,129 | |||||||||||||||||||||||||||
Less: reconciling adjustments(1)(2)(3) | (79) | 893 | 1,287 | (763) | 84 | (1,422) | — | ||||||||||||||||||||||||||||||||||
| Net effective spread | 23,978 | 6,982 | 6,615 | 16,131 | 2,845 | (1,422) | |||||||||||||||||||||||||||||||||||
Guarantee and commitment fees(2) | 3,839 | 173 | 317 | 5 | — | (1,337) | 2,997 | ||||||||||||||||||||||||||||||||||
Other income/(expense)(3) | 309 | 120 | — | — | (128) | (2,994) | (2,693) | ||||||||||||||||||||||||||||||||||
| Non-interest income/(loss) | 4,148 | 293 | 317 | 5 | (128) | (4,331) | 304 | ||||||||||||||||||||||||||||||||||
| Release of/(provision for) loan losses | 626 | — | 181 | (49) | 3 | — | 761 | ||||||||||||||||||||||||||||||||||
| Release of reserve for losses | 172 | — | 50 | — | — | — | 222 | ||||||||||||||||||||||||||||||||||
| Other non-interest expense | (5,855) | (2,263) | (1,838) | (2,316) | (4,606) | — | (16,878) | ||||||||||||||||||||||||||||||||||
Non-interest expense(4) | (5,683) | (2,263) | (1,788) | (2,316) | (4,606) | — | (16,656) | ||||||||||||||||||||||||||||||||||
| Core earnings before income taxes | 23,069 | 5,012 | 5,325 | 13,771 | (1,886) | (5,753) | (5) | 39,538 | |||||||||||||||||||||||||||||||||
| Income tax (expense)/benefit | (4,844) | (1,053) | (1,118) | (2,892) | 444 | 1,211 | (8,252) | ||||||||||||||||||||||||||||||||||
| Core earnings before preferred stock dividends | 18,225 | 3,959 | 4,207 | 10,879 | (1,442) | (4,542) | (5) | 31,286 | |||||||||||||||||||||||||||||||||
| Preferred stock dividends | — | — | — | — | (5,842) | — | (5,842) | ||||||||||||||||||||||||||||||||||
| Segment core earnings/(losses) | $ | 18,225 | $ | 3,959 | $ | 4,207 | $ | 10,879 | $ | (7,284) | $ | (4,542) | (5) | $ | 25,444 | ||||||||||||||||||||||||||
| Total assets at carrying value | $ | 6,716,880 | $ | 2,506,410 | $ | 2,272,425 | $ | 7,926,520 | $ | 4,759,010 | $ | — | $ | 24,181,245 | |||||||||||||||||||||||||||
| Total on- and off-balance sheet program assets at principal balance | $ | 9,056,152 | $ | 2,726,909 | $ | 2,780,027 | $ | 7,634,073 | $ | — | $ | — | $ | 22,197,161 | |||||||||||||||||||||||||||
(1)Excludes the amortization of premiums and discounts on assets consolidated at fair value, originally included in interest income, to reflect core earnings amounts.
(2)Includes the reclassification of interest income and interest expense from consolidated trusts owned by third parties to guarantee and commitment fees, to reflect management's view that the net interest income Farmer Mac earns is effectively a guarantee fee.
(3)Includes the reclassification of interest expense related to interest rate swaps not designated as hedges, which are included in "Gains/(losses) on financial derivatives" on the consolidated financial statements, to determine the effective funding cost for each operating segment.
(4)Includes directly attributable costs and an allocation of indirectly attributable costs based on employee headcount.
(5)Net adjustments to reconcile to the corresponding income measures: core earnings before income taxes reconciled to income before income taxes; core earnings before preferred stock dividends reconciled to net income; and segment core earnings reconciled to net income attributable to common stockholders.
13
Supplemental Information
The following table sets forth information about outstanding volume in each of Farmer Mac's four lines of business as of the dates indicated:
| Lines of Business - Outstanding Business Volume | |||||||||||
| As of June 30, 2021 | As of December 31, 2020 | ||||||||||
| (in thousands) | |||||||||||
| Farm & Ranch: | |||||||||||
| Loans | $ | 5,523,212 | $ | 4,889,393 | |||||||
| Loans held in trusts: | |||||||||||
| Beneficial interests owned by third party investors | 1,077,993 | 1,287,045 | |||||||||
| LTSPCs | 2,388,939 | 2,325,431 | |||||||||
| Guaranteed Securities | 66,008 | 79,312 | |||||||||
| USDA Guarantees: | |||||||||||
| USDA Securities | 2,427,501 | 2,452,964 | |||||||||
| Farmer Mac Guaranteed USDA Securities | 299,408 | 333,754 | |||||||||
| Rural Utilities: | |||||||||||
| Loans | 2,246,568 | 2,260,412 | |||||||||
| LTSPCs | 533,459 | 556,425 | |||||||||
| Institutional Credit | |||||||||||
| AgVantage Securities | 7,634,073 | 7,739,359 | |||||||||
| Total | $ | 22,197,161 | $ | 21,924,095 | |||||||
The following table presents the quarterly net effective spread by segment:
| Net Effective Spread by Line of Business | |||||||||||||||||||||||||||||||||||||||||||||||||||||||||||||||||||||||
| Farm & Ranch | USDA Guarantees | Rural Utilities | Institutional Credit | Corporate | Net Effective Spread | ||||||||||||||||||||||||||||||||||||||||||||||||||||||||||||||||||
| Dollars | Yield | Dollars | Yield | Dollars | Yield | Dollars | Yield | Dollars | Yield | Dollars | Yield | ||||||||||||||||||||||||||||||||||||||||||||||||||||||||||||
| (dollars in thousands) | |||||||||||||||||||||||||||||||||||||||||||||||||||||||||||||||||||||||
| For the quarter ended: | |||||||||||||||||||||||||||||||||||||||||||||||||||||||||||||||||||||||
June 30, 2021(1) | $ | 23,978 | 1.82 | % | $ | 6,982 | 1.12 | % | $ | 6,615 | 1.18 | % | $ | 16,131 | 0.85 | % | $ | 2,845 | 0.24 | % | $ | 56,551 | 1.01 | % | |||||||||||||||||||||||||||||||||||||||||||||||
| March 31, 2021 | 21,454 | 1.74 | % | 6,367 | 1.02 | % | 6,674 | 1.19 | % | 16,673 | 0.87 | % | 2,691 | 0.22 | % | 53,859 | 0.97 | % | |||||||||||||||||||||||||||||||||||||||||||||||||||||
| December 31, 2020 | 20,313 | 1.75 | % | 6,786 | 1.10 | % | 7,322 | 1.35 | % | 17,401 | 0.85 | % | 2,700 | 0.22 | % | 54,522 | 0.98 | % | |||||||||||||||||||||||||||||||||||||||||||||||||||||
| September 30, 2020 | 18,025 | 1.67 | % | 5,865 | 0.97 | % | 6,939 | 1.32 | % | 18,601 | 0.87 | % | 2,372 | 0.23 | % | 51,802 | 0.96 | % | |||||||||||||||||||||||||||||||||||||||||||||||||||||
| June 30, 2020 | 16,733 | 1.71 | % | 4,689 | 0.81 | % | 5,516 | 1.15 | % | 18,782 | 0.86 | % | 749 | 0.08 | % | 46,469 | 0.89 | % | |||||||||||||||||||||||||||||||||||||||||||||||||||||
| March 31, 2020 | 14,938 | 1.64 | % | 4,625 | 0.81 | % | 4,920 | 1.14 | % | 17,702 | 0.84 | % | 1,978 | 0.21 | % | 44,163 | 0.89 | % | |||||||||||||||||||||||||||||||||||||||||||||||||||||
| December 31, 2019 | 16,374 | 1.90 | % | 4,363 | 0.78 | % | 4,871 | 1.17 | % | 18,008 | 0.85 | % | 2,375 | 0.27 | % | 45,991 | 0.95 | % | |||||||||||||||||||||||||||||||||||||||||||||||||||||
| September 30, 2019 | 13,181 | 1.66 | % | 4,314 | 0.79 | % | 4,502 | 1.16 | % | 17,807 | 0.84 | % | 2,657 | 0.30 | % | 42,461 | 0.90 | % | |||||||||||||||||||||||||||||||||||||||||||||||||||||
| June 30, 2019 | 13,335 | 1.72 | % | 4,097 | 0.76 | % | 3,996 | 1.10 | % | 17,371 | 0.82 | % | 2,556 | 0.34 | % | 41,355 | 0.91 | % | |||||||||||||||||||||||||||||||||||||||||||||||||||||
(1)See above for a reconciliation of GAAP net interest income by line of business to net effective spread by line of business for the three months ended June 30, 2021.
14
The following table presents quarterly core earnings reconciled to net income attributable to common stockholders:
| Core Earnings by Quarter Ended | |||||||||||||||||||||||||||||||||||||||||||||||||||||
| June 2021 | March 2021 | December 2020 | September 2020 | June 2020 | March 2020 | December 2019 | September 2019 | June 2019 | |||||||||||||||||||||||||||||||||||||||||||||
| (in thousands) | |||||||||||||||||||||||||||||||||||||||||||||||||||||
| Revenues: | |||||||||||||||||||||||||||||||||||||||||||||||||||||
| Net effective spread | $ | 56,551 | $ | 53,859 | $ | 54,522 | $ | 51,802 | $ | 46,469 | $ | 44,163 | $ | 45,991 | $ | 42,461 | $ | 41,355 | |||||||||||||||||||||||||||||||||||
| Guarantee and commitment fees | 4,334 | 4,240 | 4,652 | 4,659 | 4,943 | 4,896 | 5,432 | 5,208 | 5,276 | ||||||||||||||||||||||||||||||||||||||||||||
| Other | 301 | 451 | 512 | 453 | 1,048 | 674 | 100 | 389 | 777 | ||||||||||||||||||||||||||||||||||||||||||||
| Total revenues | 61,186 | 58,550 | 59,686 | 56,914 | 52,460 | 49,733 | 51,523 | 48,058 | 47,408 | ||||||||||||||||||||||||||||||||||||||||||||
| Credit related expense/(income): | |||||||||||||||||||||||||||||||||||||||||||||||||||||
| (Release of)/provision for losses | (983) | (31) | 2,973 | 1,200 | 51 | 3,831 | 2,851 | 623 | 420 | ||||||||||||||||||||||||||||||||||||||||||||
| REO operating expenses | — | — | — | — | — | — | — | — | 64 | ||||||||||||||||||||||||||||||||||||||||||||
| Losses/(gains) on sale of REO | — | — | 22 | — | — | (485) | — | — | — | ||||||||||||||||||||||||||||||||||||||||||||
| Total credit related expense/(income) | (983) | (31) | 2,995 | 1,200 | 51 | 3,346 | 2,851 | 623 | 484 | ||||||||||||||||||||||||||||||||||||||||||||
| Operating expenses: | |||||||||||||||||||||||||||||||||||||||||||||||||||||
| Compensation and employee benefits | 9,779 | 11,795 | 9,497 | 8,791 | 8,087 | 10,127 | 6,732 | 7,654 | 6,770 | ||||||||||||||||||||||||||||||||||||||||||||
| General and administrative | 6,349 | 6,336 | 6,274 | 5,044 | 5,295 | 5,363 | 5,773 | 5,253 | 4,689 | ||||||||||||||||||||||||||||||||||||||||||||
| Regulatory fees | 750 | 750 | 750 | 725 | 725 | 725 | 725 | 688 | 687 | ||||||||||||||||||||||||||||||||||||||||||||
| Total operating expenses | 16,878 | 18,881 | 16,521 | 14,560 | 14,107 | 16,215 | 13,230 | 13,595 | 12,146 | ||||||||||||||||||||||||||||||||||||||||||||
| Net earnings | 45,291 | 39,700 | 40,170 | 41,154 | 38,302 | 30,172 | 35,442 | 33,840 | 34,778 | ||||||||||||||||||||||||||||||||||||||||||||
| Income tax expense | 9,463 | 8,520 | 8,470 | 8,297 | 8,016 | 6,598 | 7,526 | 7,018 | 7,351 | ||||||||||||||||||||||||||||||||||||||||||||
| Preferred stock dividends | 5,842 | 5,269 | 5,269 | 5,166 | 3,939 | 3,431 | 3,432 | 3,427 | 3,785 | ||||||||||||||||||||||||||||||||||||||||||||
| Core earnings | $ | 29,986 | $ | 25,911 | $ | 26,431 | $ | 27,691 | $ | 26,347 | $ | 20,143 | $ | 24,484 | $ | 23,395 | $ | 23,642 | |||||||||||||||||||||||||||||||||||
| Reconciling items: | |||||||||||||||||||||||||||||||||||||||||||||||||||||
| (Losses)/gains on undesignated financial derivatives due to fair value changes | (3,721) | 1,695 | (1,758) | (4,149) | 8,700 | (6,484) | 4,469 | (7,117) | 10,485 | ||||||||||||||||||||||||||||||||||||||||||||
| (Losses)/gains on hedging activities due to fair value changes | (2,097) | (271) | 3,827 | (5,245) | (2,676) | (5,925) | (220) | (4,535) | (1,438) | ||||||||||||||||||||||||||||||||||||||||||||
| Unrealized (losses)/gains on trading assets | (61) | (14) | 223 | (258) | (20) | 106 | 172 | 49 | 61 | ||||||||||||||||||||||||||||||||||||||||||||
| Net effects of amortization of premiums/discounts and deferred gains on assets consolidated at fair value | 20 | 16 | (77) | 97 | 35 | 3 | 40 | (7) | (139) | ||||||||||||||||||||||||||||||||||||||||||||
| Net effects of terminations or net settlements on financial derivatives | 109 | 1,165 | 1,583 | 233 | 720 | (1,300) | 1,339 | 232 | (592) | ||||||||||||||||||||||||||||||||||||||||||||
| Issuance costs on the retirement of preferred stock | — | — | — | (1,667) | — | — | — | — | (1,956) | ||||||||||||||||||||||||||||||||||||||||||||
| Income tax effect related to reconciling items | 1,208 | (544) | (798) | 1,957 | (1,419) | 2,856 | (1,218) | 2,389 | (1,759) | ||||||||||||||||||||||||||||||||||||||||||||
| Net income attributable to common stockholders | $ | 25,444 | $ | 27,958 | $ | 29,431 | $ | 18,659 | $ | 31,687 | $ | 9,399 | $ | 29,066 | $ | 14,406 | $ | 28,304 | |||||||||||||||||||||||||||||||||||
15
Equity Investor Presentation Second Quarter 2021
FARM ER M AC Forward-Looking Statements In addition to historical information, this presentation includes forward- looking statements that reflect management’s current expectations for Farmer Mac’s future financial results, business prospects, and business developments. Forward-looking statements include, without limitation, any statement that may predict, forecast, indicate, or imply future results, performance, or achievements. Management’s expectations for Farmer Mac’s future necessarily involve assumptions, estimates, and the evaluation of risks and uncertainties. Various factors or events, both known and unknown, could cause Farmer Mac’s actual results to differ materially from the expectations as expressed or implied by the forward- looking statements. Some of these factors are identified and discussed in Farmer Mac’s Annual Report on Form 10-K for the year ended December 31, 2020, filed with the U.S. Securities and Exchange Commission (“SEC”) on February 25, 2021, Quarterly Report on Form 10-Q for the quarter ended March 31, 2021, filed with the SEC on May 6, 2021, and Quarterly Report on Form 10-Q for the quarter ended June 30, 2021, filed with the SEC on August 5, 2021.. These reports are also available on Farmer Mac’s website (www.farmermac.com). Considering these potential risks and uncertainties, no undue reliance should be placed on any forward-looking statements expressed in this presentation. Any forward-looking statements made in this presentation are current only as of June 30, 2021, except as otherwise indicated. Farmer Mac undertakes no obligation to release publicly the results of revisions to any such forward-looking statements that may be made to reflect new information or any future events or circumstances, except as otherwise mandated by the SEC. The information in this presentation is not necessarily indicative of future results. NO OFFER OR SOLICITATION OF SECURITIES This presentation does not constitute an offer to sell or a solicitation of an offer to buy any Farmer Mac security. Farmer Mac securities are offered only in jurisdictions where permissible by offering documents available through qualified securities dealers. Any investor who is considering purchasing a Farmer Mac security should consult the applicable offering documents for the security and their own financial and legal advisors for information about and analysis of the security, the risks associated with the security, and the suitability of the investment for the investor’s particular circumstances. Copyright © 2021 by Farmer Mac. No part of this document may be duplicated, reproduced, distributed, or displayed in public in any manner or by any means without the written permission of Farmer Mac. 02
FARM ER M AC Use of Non-GAAP Financial Measures This presentation is for general informational purposes only, is current only as of June 30, 2021 and should be read in conjunction with Farmer Mac’s Quarterly Report on Form 10-Q filed with the SEC on August 5, 2021. In the accompanying analysis of its financial information, Farmer Mac uses the following non-GAAP financial measures: core earnings, core earnings per share, and net effective spread. Farmer Mac uses these non-GAAP measures to measure corporate economic performance and develop financial plans because, in management's view, they are useful alternative measures in understanding Farmer Mac's economic performance, transaction economics, and business trends. The non-GAAP financial measures that Farmer Mac uses may not be comparable to similarly labeled non- GAAP financial measures disclosed by other companies. Farmer Mac's disclosure of these non-GAAP financial measures is intended to be supplemental in nature and is not meant to be considered in isolation from, as a substitute for, or as more important than, the related financial information prepared in accordance with GAAP. Core earnings and core earnings per share principally differ from net income attributable to common stockholders and earnings per common share, respectively, by excluding the effects of fair value fluctuations. These fluctuations are not expected to have a cumulative net impact on Farmer Mac's financial condition or results of operations reported in accordance with GAAP if the related financial instruments are held to maturity, as is expected. Core earnings and core earnings per share also differ from net income attributable to common stockholders and earnings per common share, respectively, by excluding specified infrequent or unusual transactions that Farmer Mac believes are not indicative of future operating results and that may not reflect the trends and economic financial performance of Farmer Mac's core business. Farmer Mac uses net effective spread to measure the net spread Farmer Mac earns between its interest-earning assets and the related net funding costs of these assets. Net effective spread differs from net interest income and net interest yield because it excludes: (1) the amortization of premiums and discounts on assets consolidated at fair value that are amortized as adjustments to yield in interest income over the contractual or estimated remaining lives of the underlying assets; (2) interest income and interest expense related to consolidated trusts with beneficial interests owned by third parties, which are presented on Farmer Mac's consolidated balance sheets as “Loans held for investment in consolidated trusts, at amortized cost;” and (3) beginning January 1, 2018, the fair value changes of financial derivatives and the corresponding assets and liabilities designated in a fair value hedge relationship. Net effective spread also principally differs from net interest income and net interest yield because it includes: (1) the accrual of income and expense related to the contractual amounts due on financial derivatives that are not designated in hedge relationships; and (2) the net effects of terminations or net settlements on financial derivatives. 03
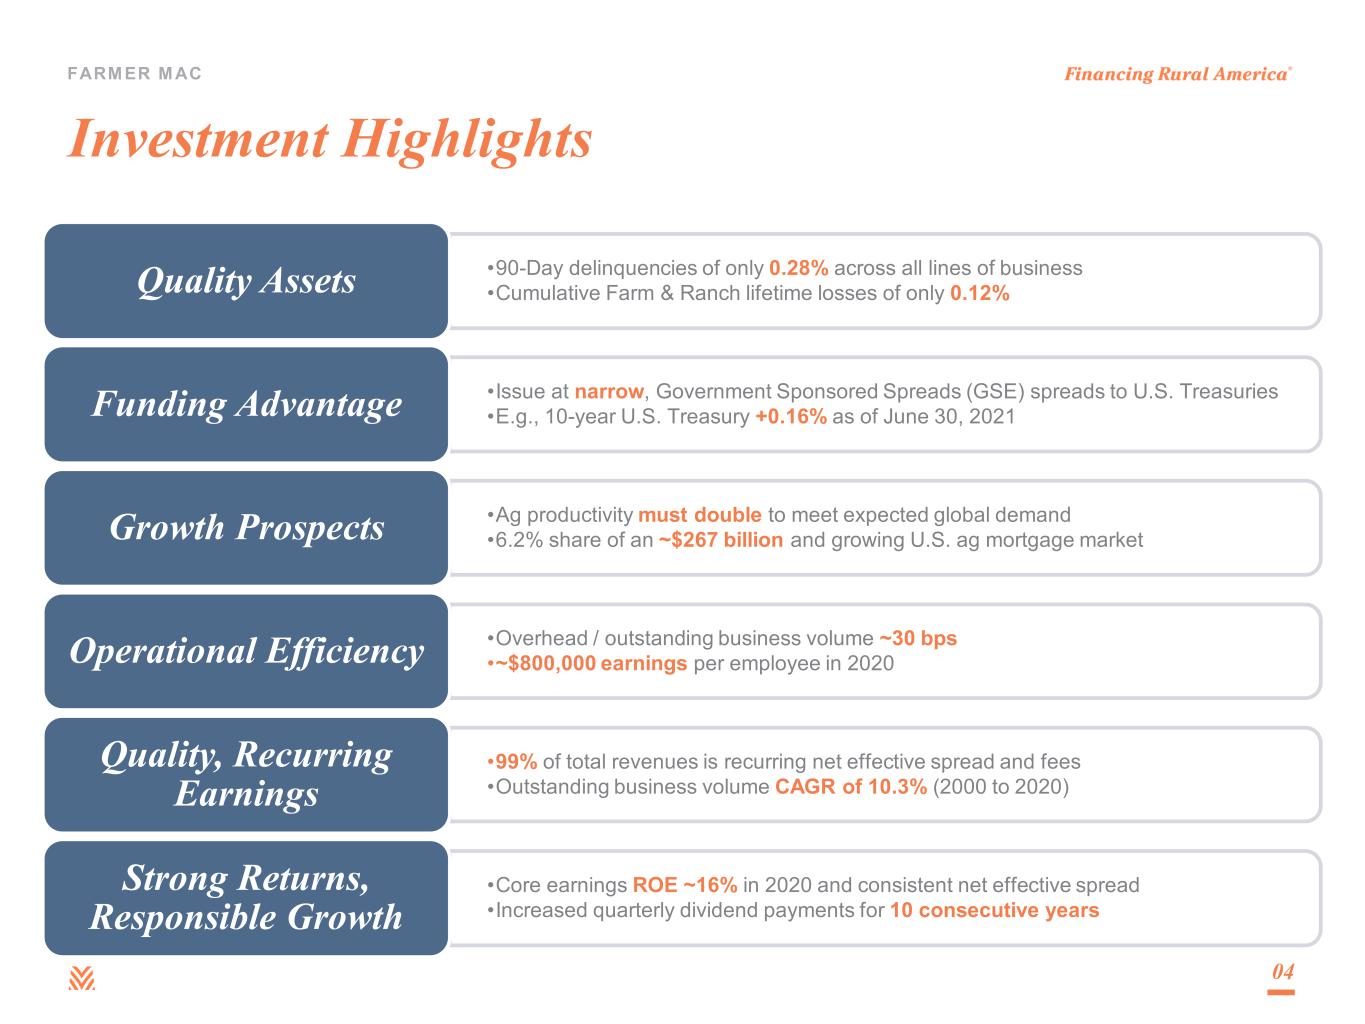
FARM ER M AC Investment Highlights •90-Day delinquencies of only 0.28% across all lines of business •Cumulative Farm & Ranch lifetime losses of only 0.12%Quality Assets •Issue at narrow, Government Sponsored Spreads (GSE) spreads to U.S. Treasuries •E.g., 10-year U.S. Treasury +0.16% as of June 30, 2021Funding Advantage •Ag productivity must double to meet expected global demand •6.2% share of an ~$267 billion and growing U.S. ag mortgage marketGrowth Prospects •Overhead / outstanding business volume ~30 bps •~$800,000 earnings per employee in 2020Operational Efficiency •99% of total revenues is recurring net effective spread and fees •Outstanding business volume CAGR of 10.3% (2000 to 2020) Quality, Recurring Earnings •Core earnings ROE ~16% in 2020 and consistent net effective spread •Increased quarterly dividend payments for 10 consecutive years Strong Returns, Responsible Growth 04

FARM ER M AC Farmer Mac initially chartered by Congress as an instrumentality of the United States Initial public offering First listed on NASDAQ (FAMCU & FAMCL) First major charter revision and expansion of authority (direct loan purchases) First listed on NYSE (AGM & AGM.A) Second major charter revision and expansion of authority (Rural Utilities) A Mission-Driven, For-Profit Company Our Mission Farmer Mac is committed to help build a strong and vital rural America by increasing the availability and affordability of credit for the benefit of American agricultural and rural communities Our Stakeholders • Farmers, ranchers and rural communities • Stockholders • Financial Institutions & Cooperatives • Employees • Congress • Regulators Our Corporate Social Responsibility • To help create sustainable, vibrant rural American communities • We achieve this by conducting our business – With absolute integrity – By holding ourselves to high ethical standards – By promoting a diverse, respectful, and inclusive culture – By adopting an Environmental, Social, Governance (ESG) policy statement 05 1987 1988 1996 1999 2008

FARM ER M AC Aparna Ramesh Executive Vice President – Chief Financial Officer & Treasurer • 20+ years of experience in mission-oriented finance roles • Joined Farmer Mac in 2020 from Federal Reserve Bank of Boston, where she previously served as Senior Vice President and Chief Financial Officer • Prior experience includes roles spanning product management, asset-liability management and profitability within Cambridge Savings Bank and M&T Bank Bradford T. Nordholm President & Chief Executive Officer • 40+ years of agricultural and energy finance experience • Joined Farmer Mac in October 2018 from Starwood Energy Group, a leading private investment firm where he served as CEO and later as Vice Chairman • Prior experience includes CEO of US Central and management positions at National Cooperative and within the Farm Credit System Executive Leadership 06 Zachary N. Carpenter Executive Vice President – Chief Business Officer • 14+ years of experience in agribusiness banking, capital markets, finance, and corporate strategy • Joined Farmer Mac in 2019 from CoBank, where he previously served as Managing Director and Sector Vice President of its Corporate Agribusiness Banking Group • Prior experience includes Executive Director in CoBank’s Capital Markets division and Vice President in Finance and Corporate Strategy at Goldman Sachs
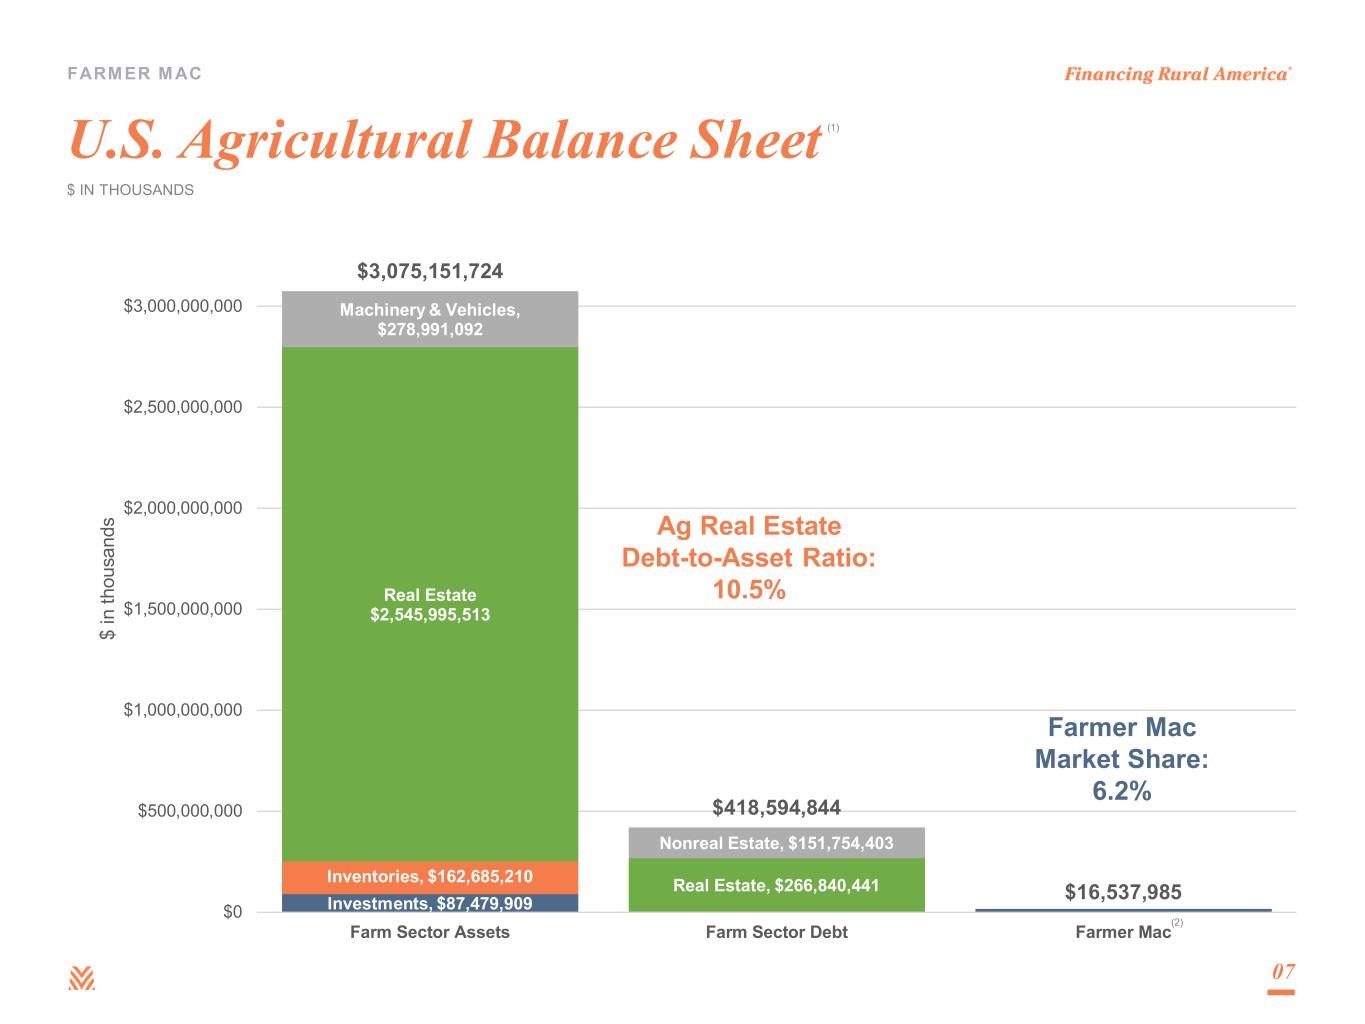
FARM ER M AC U.S. Agricultural Balance Sheet 07 Investments, $87,479,909 Inventories, $162,685,210 Real Estate $2,545,995,513 Machinery & Vehicles, $278,991,092 $3,075,151,724 Real Estate, $266,840,441 Nonreal Estate, $151,754,403 $418,594,844 $16,537,985 $0 $500,000,000 $1,000,000,000 $1,500,000,000 $2,000,000,000 $2,500,000,000 $3,000,000,000 Farm Sector Assets Farm Sector Debt Farmer Mac $ in th ou sa nd s Ag Real Estate Debt-to-Asset Ratio: 10.5% $ IN THOUSANDS (1) (2) Farmer Mac Market Share: 6.2%
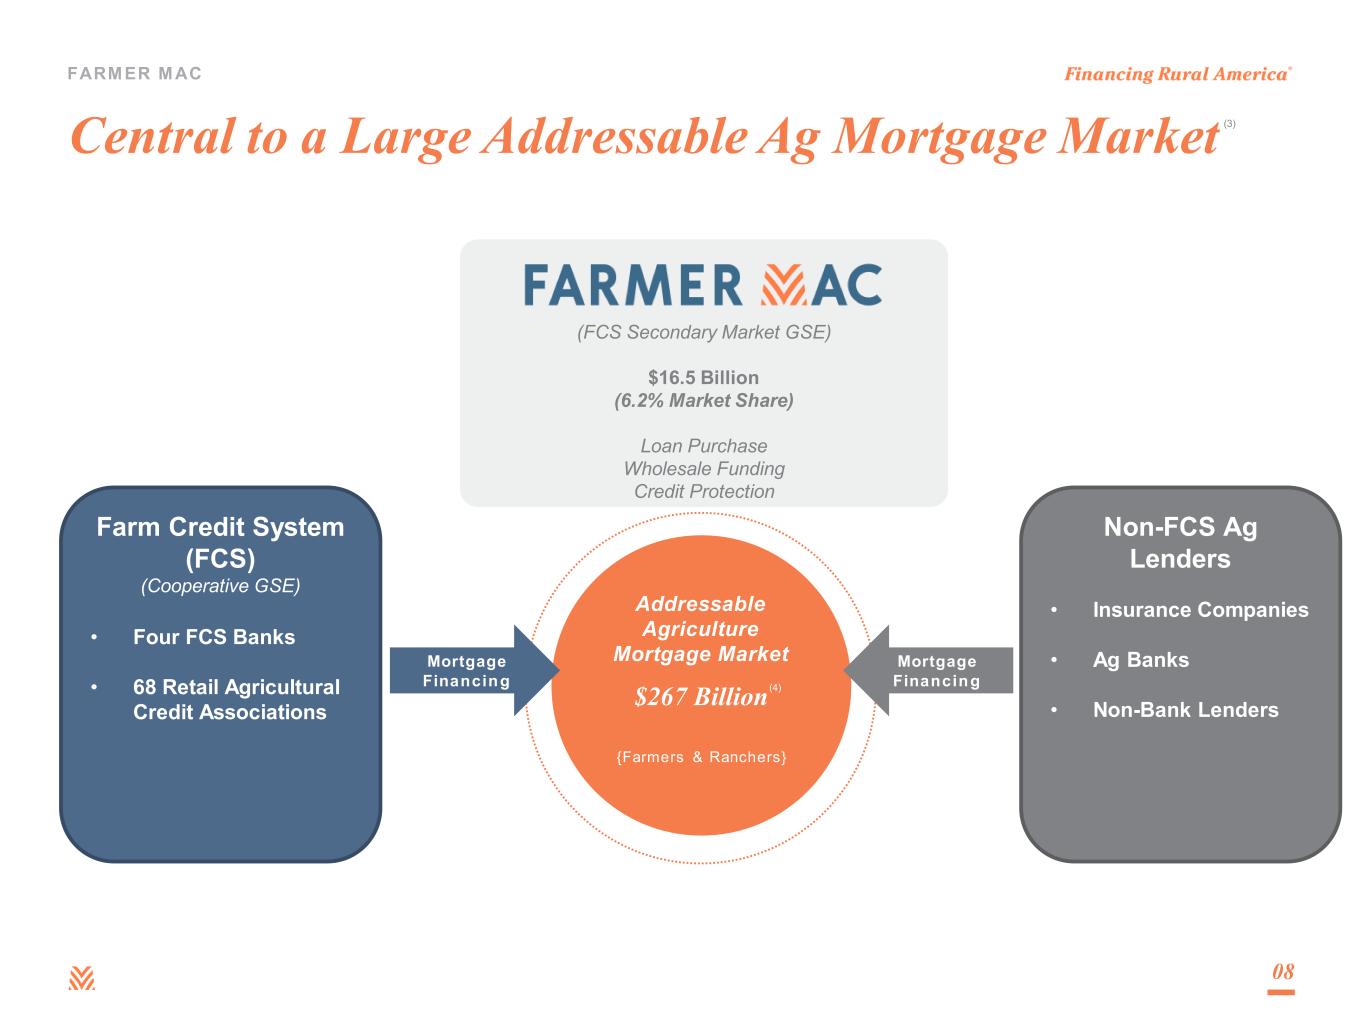
FARM ER M AC (FCS Secondary Market GSE) $16.5 Billion (6.2% Market Share) Loan Purchase Wholesale Funding Credit Protection Farm Credit System (FCS) (Cooperative GSE) • Four FCS Banks • 68 Retail Agricultural Credit Associations Central to a Large Addressable Ag Mortgage Market 08 Addressable Agriculture Mortgage Market {Farmers & Ranchers} Mortgage Financing Mortgage Financing $267 Billion A G B A N K S $61B N O N -B A N K LE N D E R S $13B (3) (4) Non-FCS Ag Lenders • Insurance Companies • Ag Banks • Non-Bank Lenders

FARM ER M AC Farmer Mac’s Operating Model 09 Farmer Mac’s Regulatory/Congressional Oversight • Regulated by the Farm Credit Administration (FCA) through its Office of Secondary Market Oversight (OSMO) • Congressional oversight through Senate and House Agricultural Committees Operating model excludes issued agricultural mortgage-backed securities and long-term standby purchase commitment credit protection components of our business.
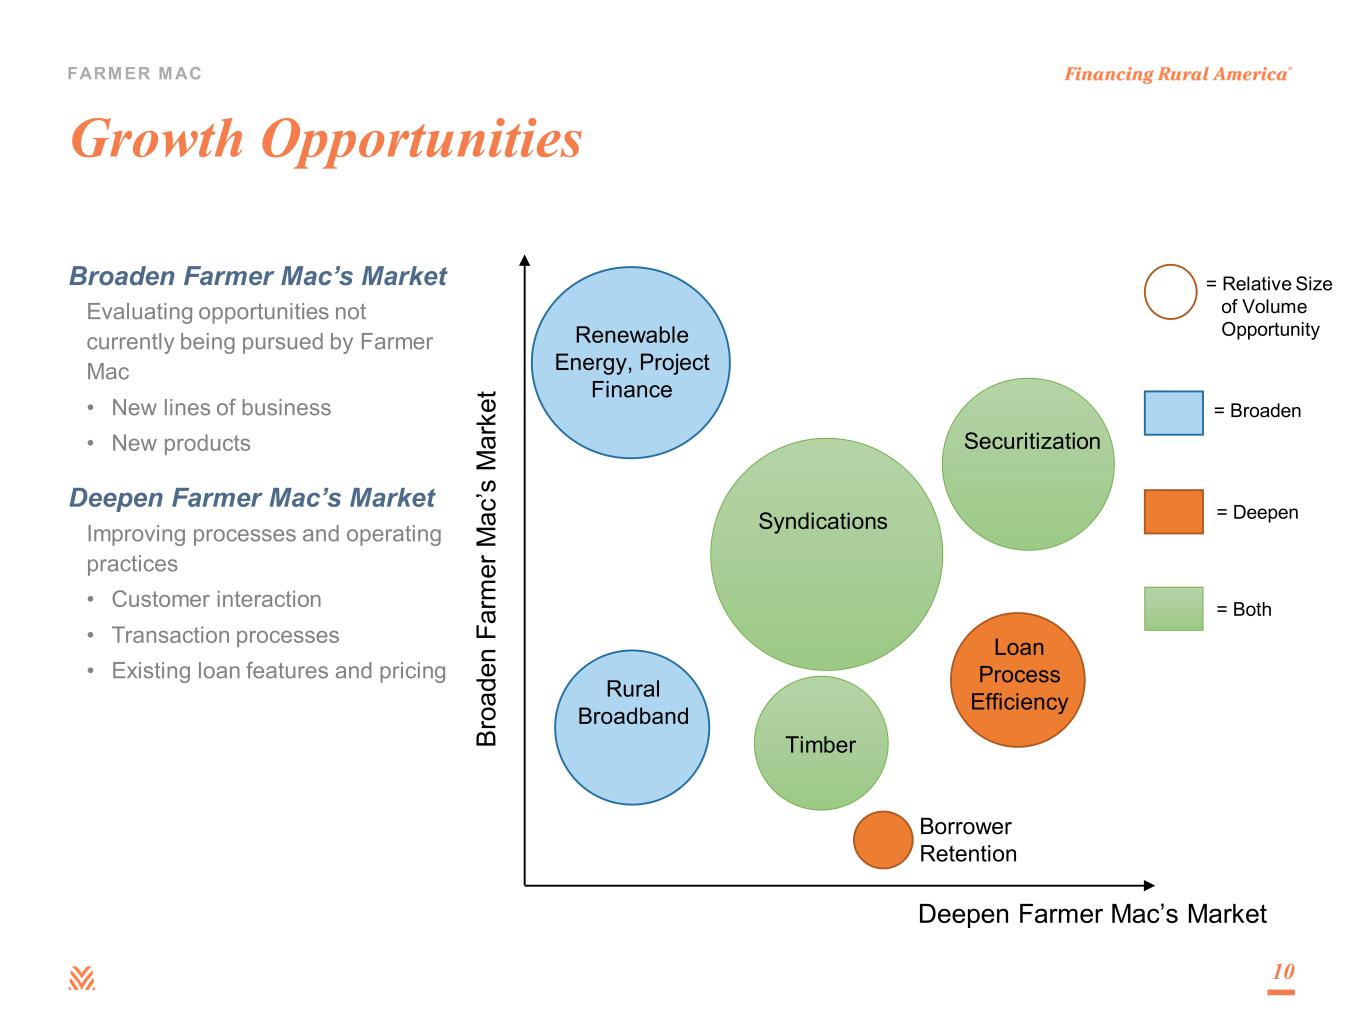
FARM ER M AC Growth Opportunities 10 Deepen Farmer Mac’s Market Br oa de n Fa rm er M ac ’s M ar ke t Loan Process Efficiency Rural Broadband Borrower Retention Renewable Energy, Project Finance Timber Securitization = Relative Size of Volume Opportunity = Broaden = Deepen = Both Syndications Broaden Farmer Mac’s Market Evaluating opportunities not currently being pursued by Farmer Mac • New lines of business • New products Deepen Farmer Mac’s Market Improving processes and operating practices • Customer interaction • Transaction processes • Existing loan features and pricing
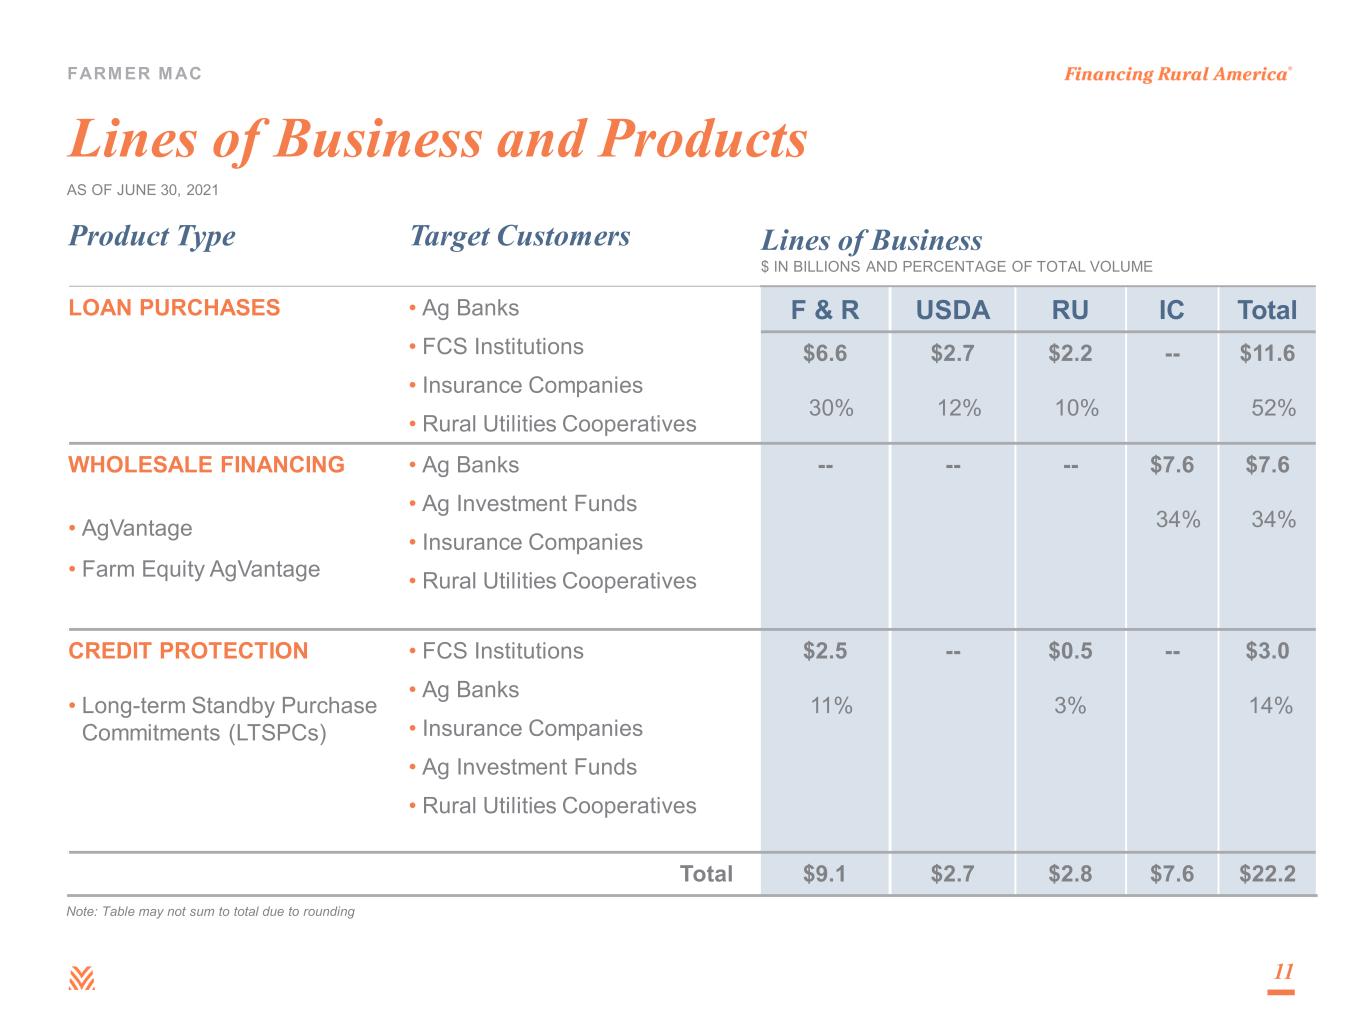
FARM ER M AC Lines of Business and Products Product Type Target Customers Lines of Business $ IN BILLIONS AND PERCENTAGE OF TOTAL VOLUME LOAN PURCHASES • Ag Banks • FCS Institutions • Insurance Companies • Rural Utilities Cooperatives F & R USDA RU IC Total $6.6 30% $2.7 12% $2.2 10% -- $11.6 52% WHOLESALE FINANCING • AgVantage • Farm Equity AgVantage • Ag Banks • Ag Investment Funds • Insurance Companies • Rural Utilities Cooperatives -- -- -- $7.6 34% $7.6 34% CREDIT PROTECTION • Long-term Standby Purchase Commitments (LTSPCs) • FCS Institutions • Ag Banks • Insurance Companies • Ag Investment Funds • Rural Utilities Cooperatives $2.5 11% -- $0.5 3% -- $3.0 14% Total $9.1 $2.7 $2.8 $7.6 $22.2 11 AS OF JUNE 30, 2021 Note: Table may not sum to total due to rounding
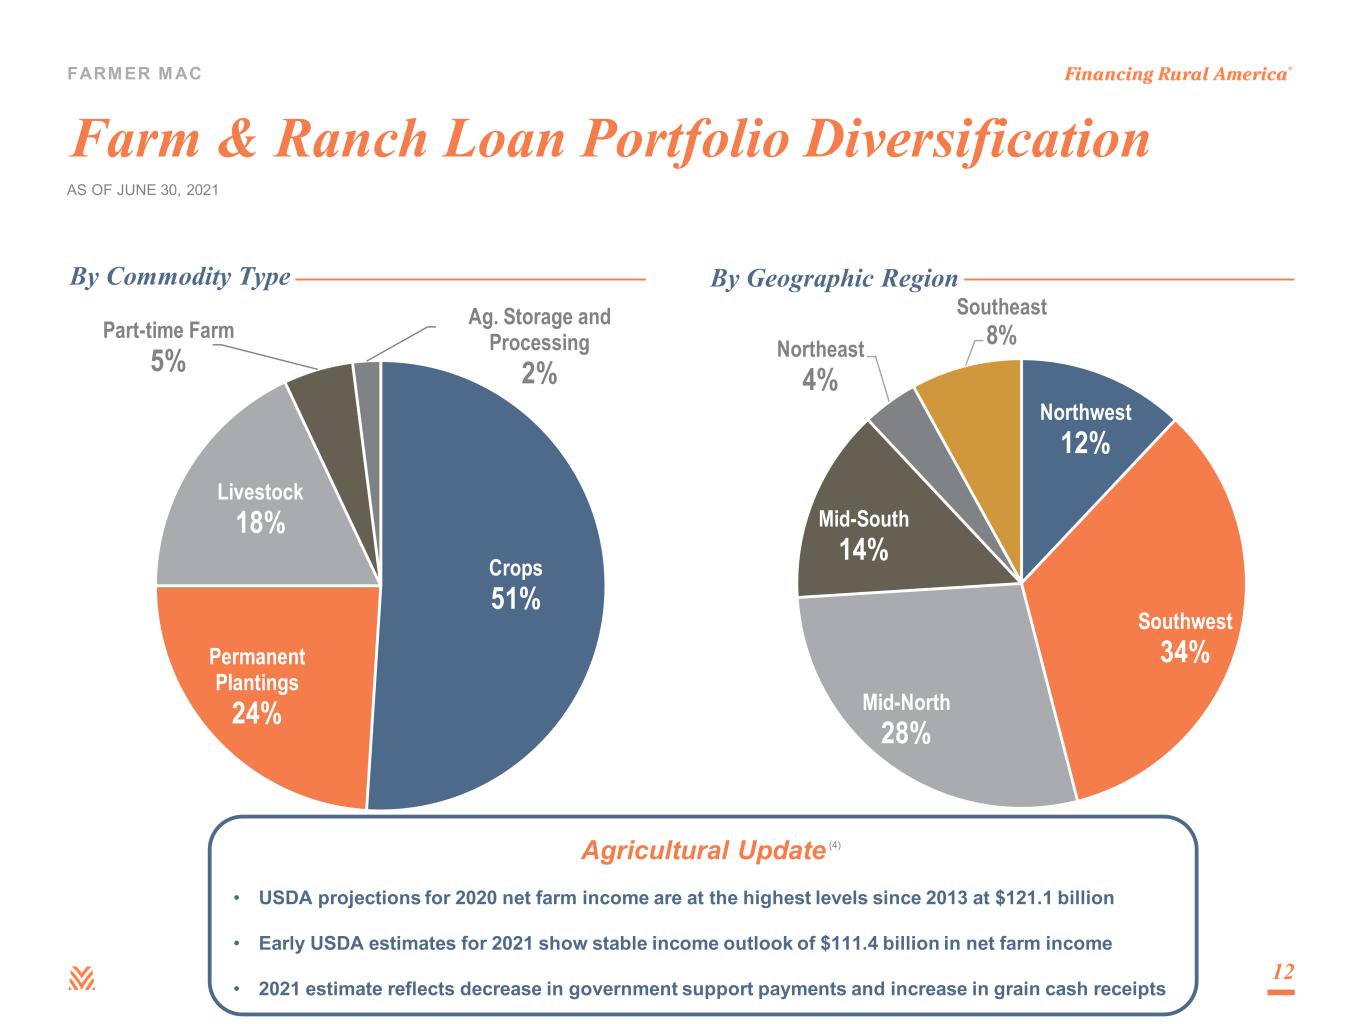
FARM ER M AC Northwest 12% Southwest 34% Mid-North 28% Mid-South 14% Northeast 4% Southeast 8% By Geographic Region Crops 51% Permanent Plantings 24% Livestock 18% Part-time Farm 5% Ag. Storage and Processing 2% By Commodity Type Farm & Ranch Loan Portfolio Diversification 12 AS OF JUNE 30, 2021 Agricultural Update • USDA projections for 2020 net farm income are at the highest levels since 2013 at $121.1 billion • Early USDA estimates for 2021 show stable income outlook of $111.4 billion in net farm income • 2021 estimate reflects decrease in government support payments and increase in grain cash receipts (4)
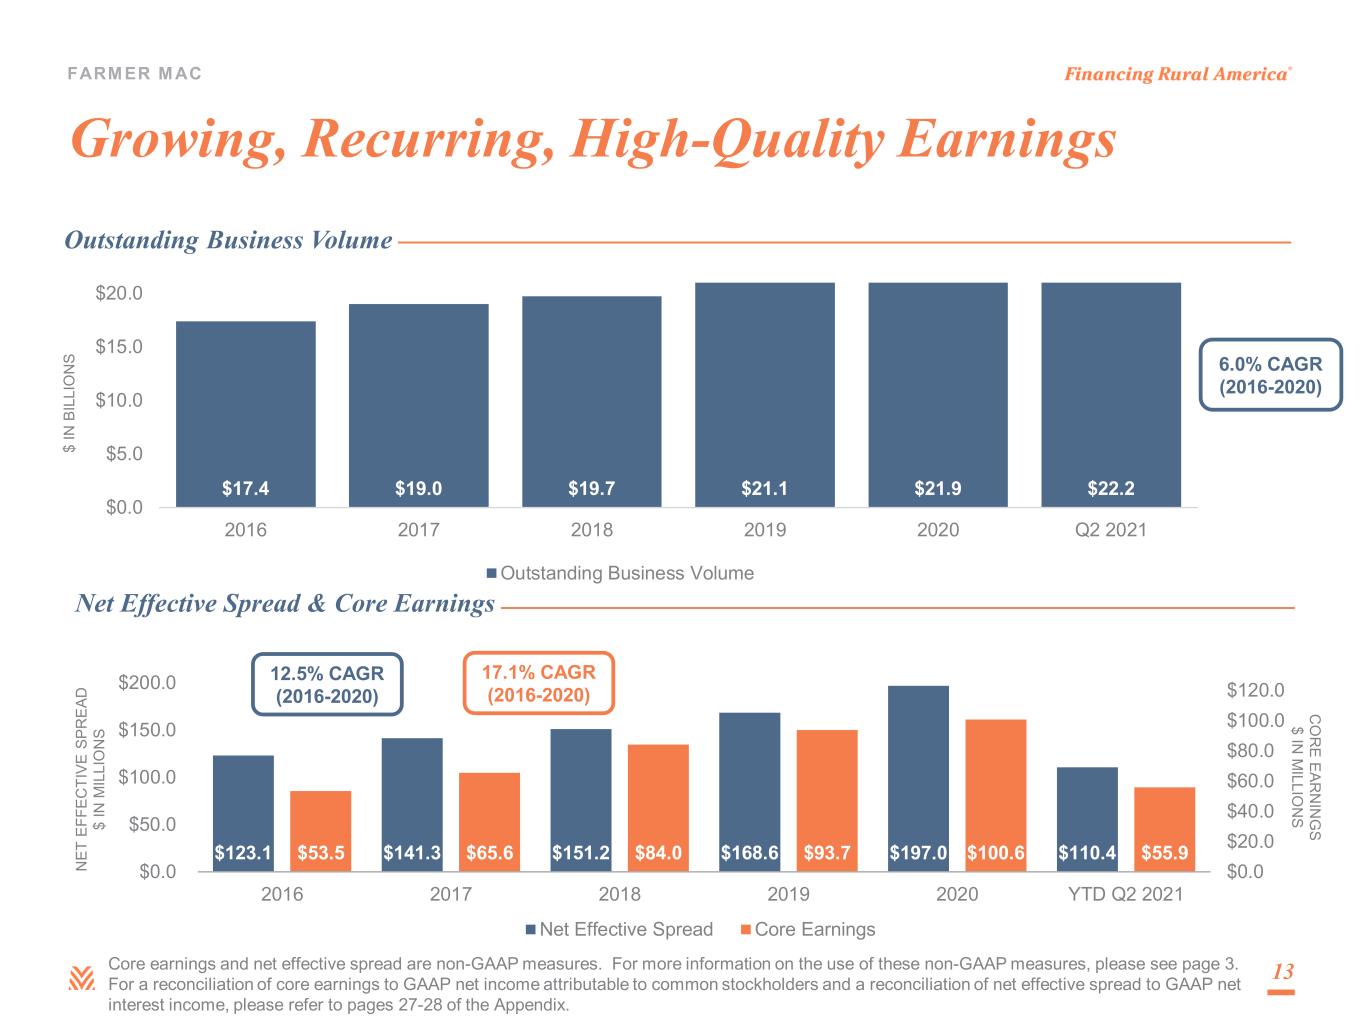
FARM ER M AC $123.1 $141.3 $151.2 $168.6 $197.0 $110.4$53.5 $65.6 $84.0 $93.7 $100.6 $55.9 $0.0 $20.0 $40.0 $60.0 $80.0 $100.0 $120.0 $0.0 $50.0 $100.0 $150.0 $200.0 2016 2017 2018 2019 2020 YTD Q2 2021 C O R E EAR N IN G S $ IN M ILLIO N S N ET E FF EC TI VE S PR EA D $ IN M IL LI O N S Net Effective Spread & Core Earnings Net Effective Spread Core Earnings Growing, Recurring, High-Quality Earnings $17.4 $19.0 $19.7 $21.1 $21.9 $22.2 $0.0 $5.0 $10.0 $15.0 $20.0 2016 2017 2018 2019 2020 Q2 2021 $ IN B IL LI O N S Outstanding Business Volume Outstanding Business Volume 13 6.0% CAGR (2016-2020) 12.5% CAGR (2016-2020) 17.1% CAGR (2016-2020) Core earnings and net effective spread are non-GAAP measures. For more information on the use of these non-GAAP measures, please see page 3. For a reconciliation of core earnings to GAAP net income attributable to common stockholders and a reconciliation of net effective spread to GAAP net interest income, please refer to pages 27-28 of the Appendix.

FARM ER M AC Quality Earnings Drives Strong Dividends $0.05 $0.10 $0.12 $0.14 $0.16 $0.26 $0.36 $0.58 $0.70 $0.80 $0.88 $0.00 $0.10 $0.20 $0.30 $0.40 $0.50 $0.60 $0.70 $0.80 $0.90 $1.00 2011 2012 2013 2014 2015 2016 2017 2018 2019 2020 2021 $ PE R S H AR E Quarterly Dividend per Common Share 14 Initiated New Dividend Policy: Target ~30% Payout Ratio of Core Earnings Increased Target Payout Ratio of Core Earnings to ~35%
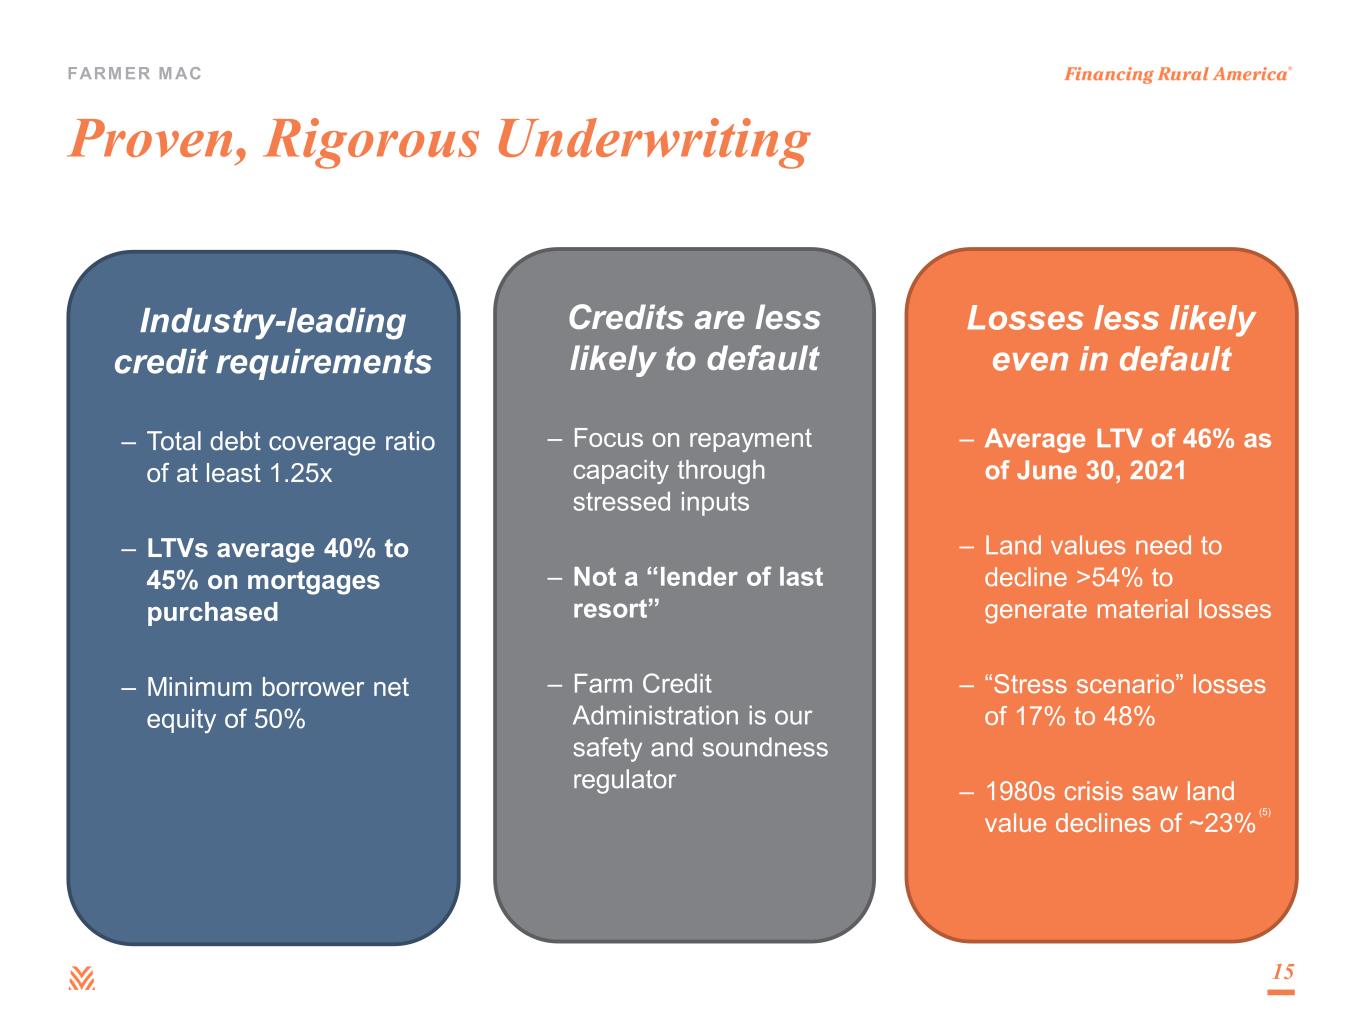
FARM ER M AC Losses less likely even in default – Average LTV of 46% as of June 30, 2021 – Land values need to decline >54% to generate material losses – “Stress scenario” losses of 17% to 48% – 1980s crisis saw land value declines of ~23% Proven, Rigorous Underwriting Industry-leading credit requirements – Total debt coverage ratio of at least 1.25x – LTVs average 40% to 45% on mortgages purchased – Minimum borrower net equity of 50% 15 Credits are less likely to default – Focus on repayment capacity through stressed inputs – Not a “lender of last resort” – Farm Credit Administration is our safety and soundness regulator (5)
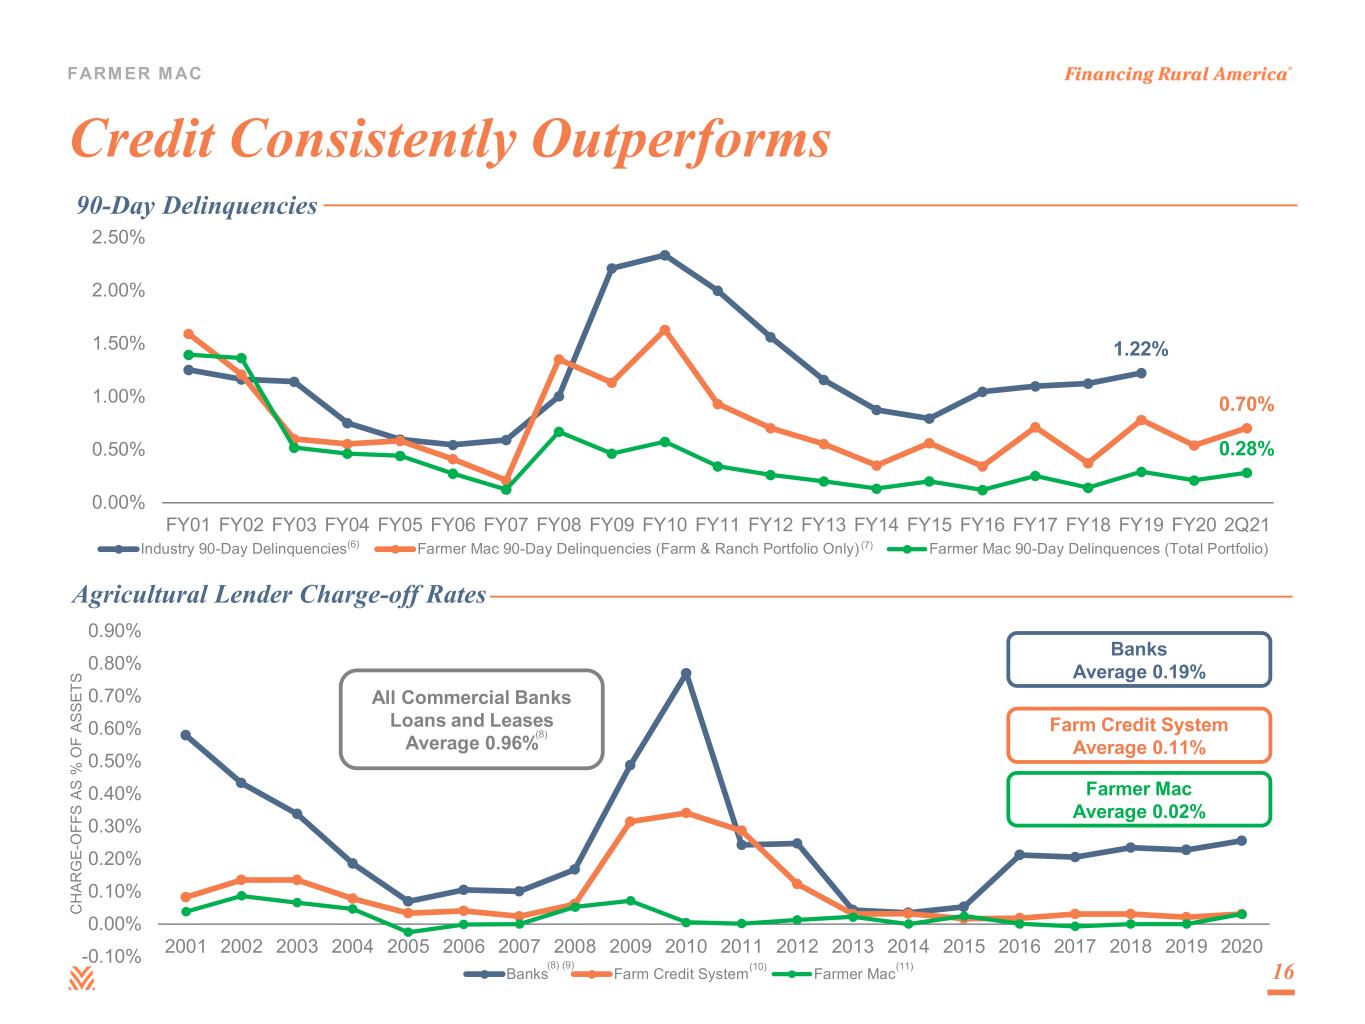
FARM ER M AC Credit Consistently Outperforms 16 1.22% 0.70% 0.28% 0.00% 0.50% 1.00% 1.50% 2.00% 2.50% FY01 FY02 FY03 FY04 FY05 FY06 FY07 FY08 FY09 FY10 FY11 FY12 FY13 FY14 FY15 FY16 FY17 FY18 FY19 FY20 2Q21 90-Day Delinquencies Industry 90-Day Delinquencies Farmer Mac 90-Day Delinquencies (Farm & Ranch Portfolio Only) Farmer Mac 90-Day Delinquences (Total Portfolio) -0.10% 0.00% 0.10% 0.20% 0.30% 0.40% 0.50% 0.60% 0.70% 0.80% 0.90% 2001 2002 2003 2004 2005 2006 2007 2008 2009 2010 2011 2012 2013 2014 2015 2016 2017 2018 2019 2020 C H AR G E- O FF S AS % O F AS SE TS Agricultural Lender Charge-off Rates Banks Farm Credit System Farmer Mac Farmer Mac Average 0.02% Farm Credit System Average 0.11% Banks Average 0.19% All Commercial Banks Loans and Leases Average 0.96%(8) (6) (7) (8) (9) (10) (11)
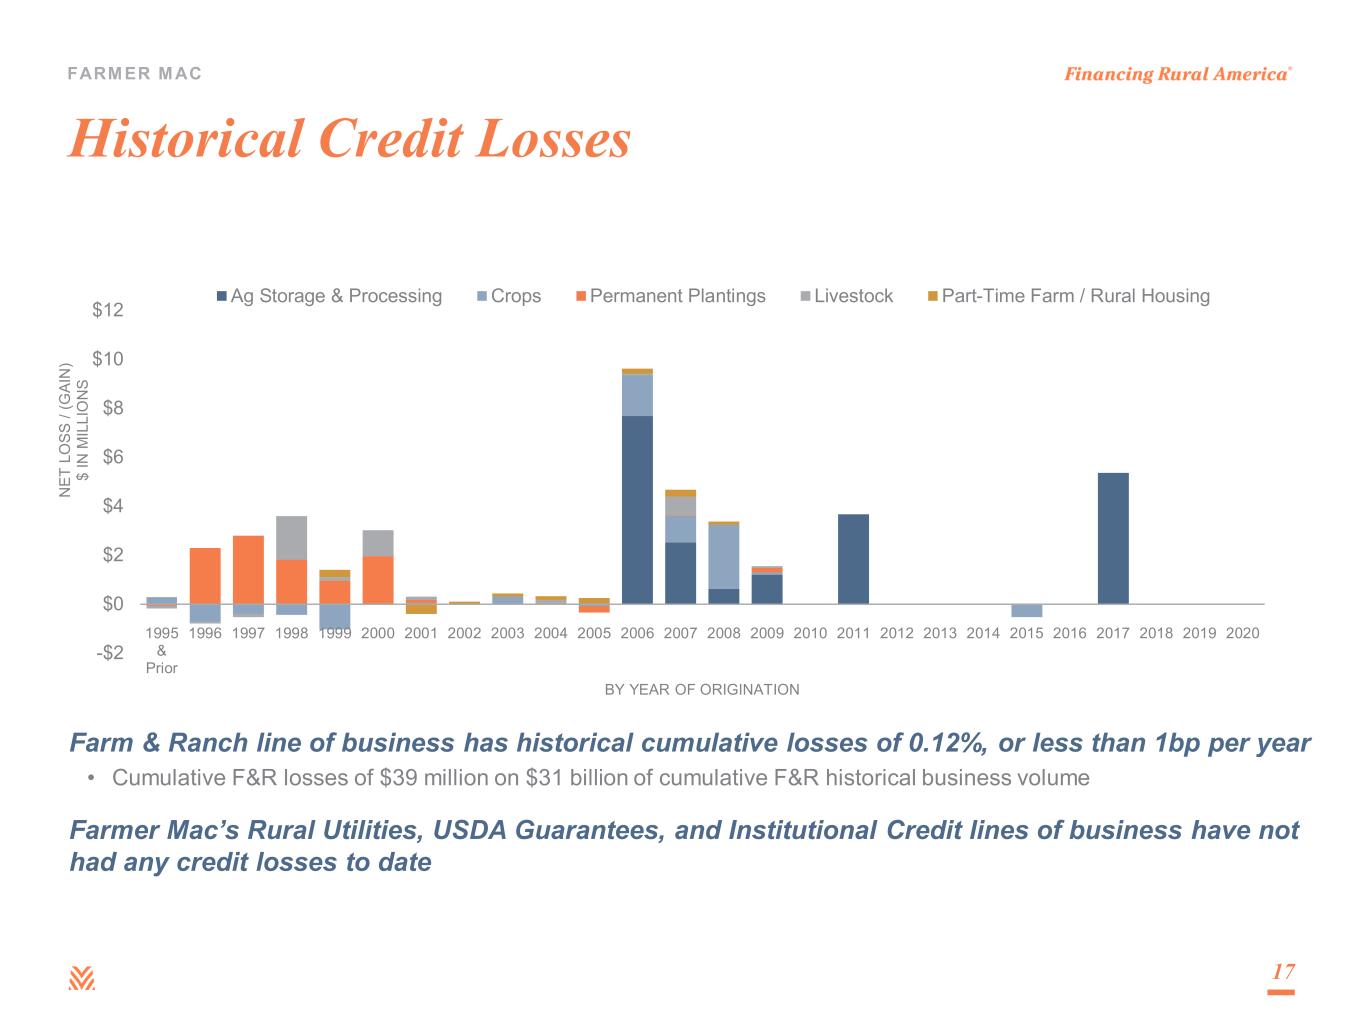
FARM ER M AC Historical Credit Losses Farm & Ranch line of business has historical cumulative losses of 0.12%, or less than 1bp per year • Cumulative F&R losses of $39 million on $31 billion of cumulative F&R historical business volume Farmer Mac’s Rural Utilities, USDA Guarantees, and Institutional Credit lines of business have not had any credit losses to date 17 -$2 $0 $2 $4 $6 $8 $10 $12 1995 & Prior 1996 1997 1998 1999 2000 2001 2002 2003 2004 2005 2006 2007 2008 2009 2010 2011 2012 2013 2014 2015 2016 2017 2018 2019 2020 N ET L O SS / (G AI N ) $ IN M IL LI O N S BY YEAR OF ORIGINATION Ag Storage & Processing Crops Permanent Plantings Livestock Part-Time Farm / Rural Housing

FARM ER M AC Allowance for Losses – Quarterly 18 Improving economic conditions resulted in a net release from the total allowance for losses of $1.0 million. • Improving expectations for unemployment • Improvements in the Housing Price Index (HPI) • Improvements in agricultural commodity prices
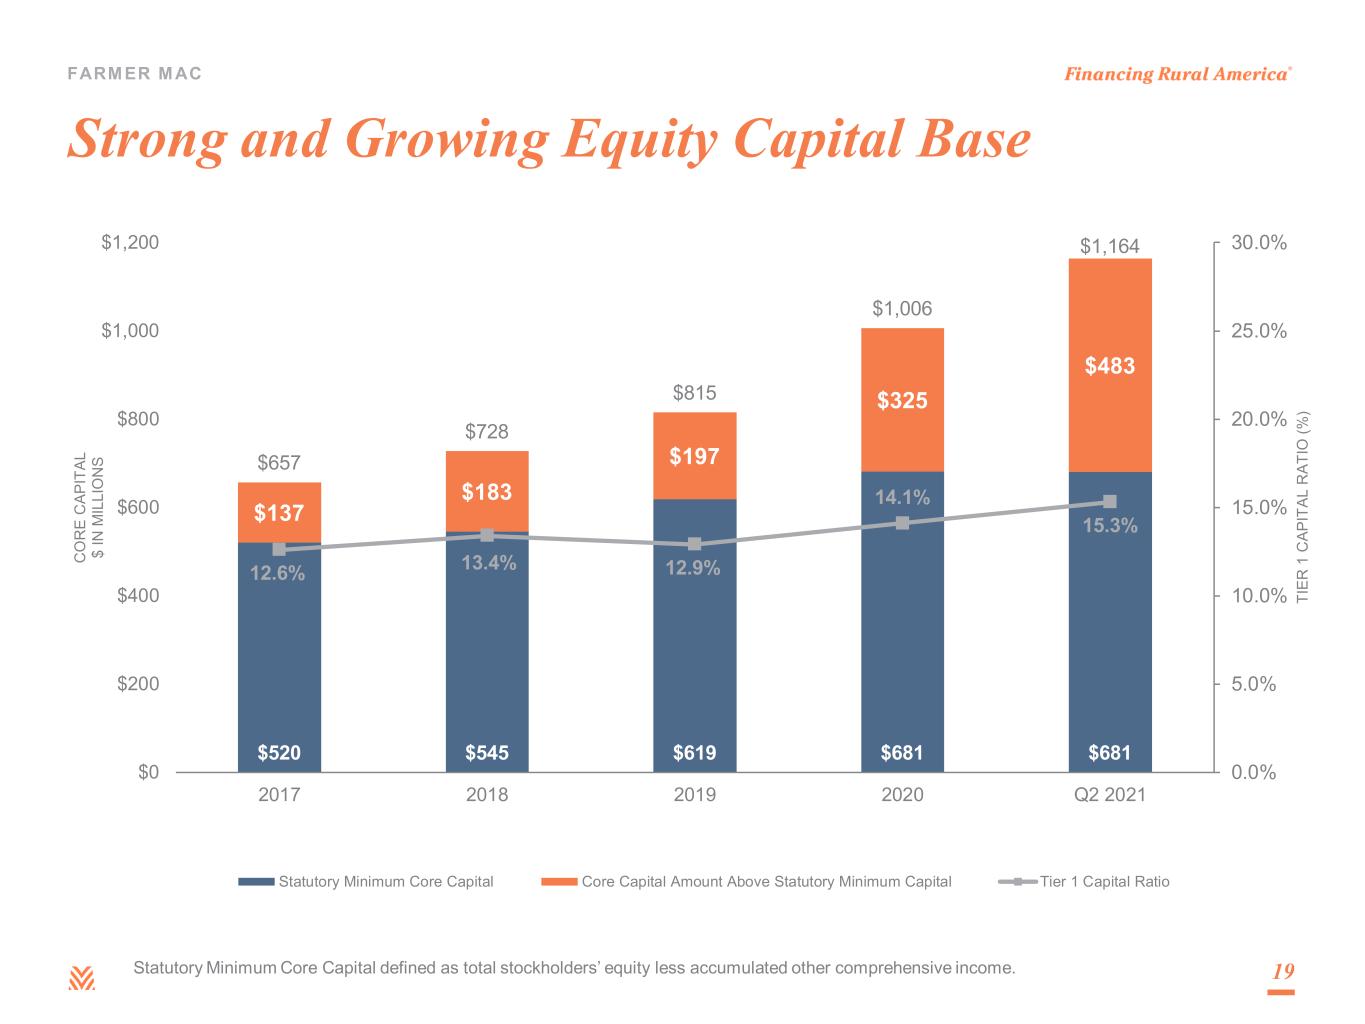
FARM ER M AC $520 $545 $619 $681 $681 $137 $183 $197 $325 $483 $657 $728 $815 $1,006 $1,164 12.6% 13.4% 12.9% 14.1% 15.3% 0.0% 5.0% 10.0% 15.0% 20.0% 25.0% 30.0% $0 $200 $400 $600 $800 $1,000 $1,200 2017 2018 2019 2020 Q2 2021 TI ER 1 C AP IT AL R AT IO (% ) C O R E C AP IT AL $ IN M IL LI O N S Statutory Minimum Core Capital Core Capital Amount Above Statutory Minimum Capital Tier 1 Capital Ratio Strong and Growing Equity Capital Base 19Statutory Minimum Core Capital defined as total stockholders’ equity less accumulated other comprehensive income.
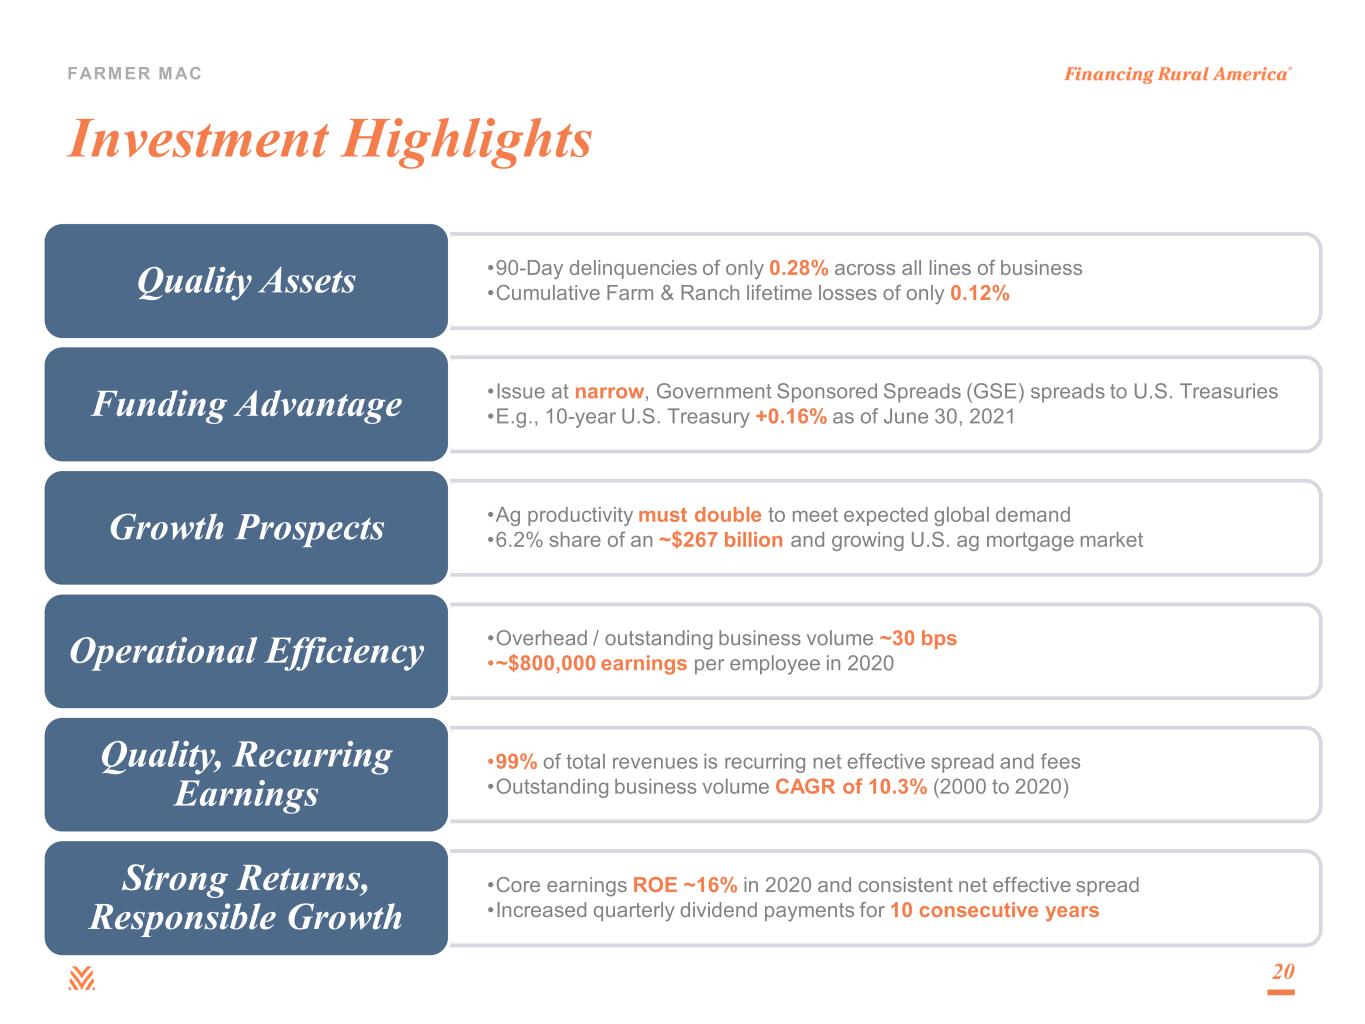
FARM ER M AC Investment Highlights •90-Day delinquencies of only 0.28% across all lines of business •Cumulative Farm & Ranch lifetime losses of only 0.12%Quality Assets •Issue at narrow, Government Sponsored Spreads (GSE) spreads to U.S. Treasuries •E.g., 10-year U.S. Treasury +0.16% as of June 30, 2021Funding Advantage •Ag productivity must double to meet expected global demand •6.2% share of an ~$267 billion and growing U.S. ag mortgage marketGrowth Prospects •Overhead / outstanding business volume ~30 bps •~$800,000 earnings per employee in 2020Operational Efficiency •99% of total revenues is recurring net effective spread and fees •Outstanding business volume CAGR of 10.3% (2000 to 2020) Quality, Recurring Earnings •Core earnings ROE ~16% in 2020 and consistent net effective spread •Increased quarterly dividend payments for 10 consecutive years Strong Returns, Responsible Growth 20

Appendix
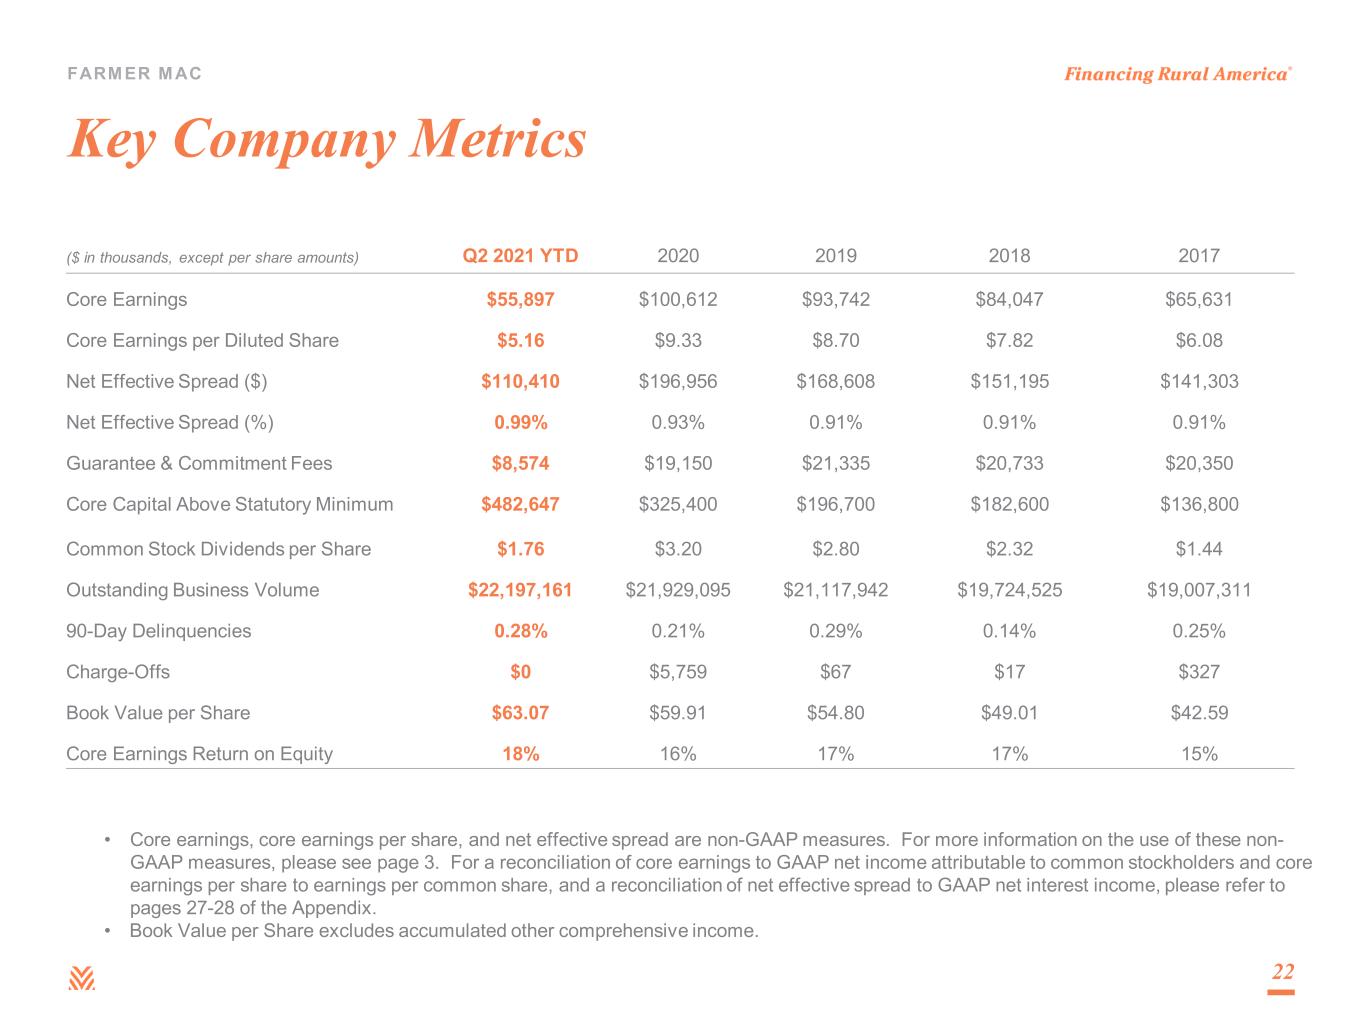
FARM ER M AC • Core earnings, core earnings per share, and net effective spread are non-GAAP measures. For more information on the use of these non- GAAP measures, please see page 3. For a reconciliation of core earnings to GAAP net income attributable to common stockholders and core earnings per share to earnings per common share, and a reconciliation of net effective spread to GAAP net interest income, please refer to pages 27-28 of the Appendix. • Book Value per Share excludes accumulated other comprehensive income. Key Company Metrics 22 ($ in thousands, except per share amounts) Q2 2021 YTD 2020 2019 2018 2017 Core Earnings $55,897 $100,612 $93,742 $84,047 $65,631 Core Earnings per Diluted Share $5.16 $9.33 $8.70 $7.82 $6.08 Net Effective Spread ($) $110,410 $196,956 $168,608 $151,195 $141,303 Net Effective Spread (%) 0.99% 0.93% 0.91% 0.91% 0.91% Guarantee & Commitment Fees $8,574 $19,150 $21,335 $20,733 $20,350 Core Capital Above Statutory Minimum $482,647 $325,400 $196,700 $182,600 $136,800 Common Stock Dividends per Share $1.76 $3.20 $2.80 $2.32 $1.44 Outstanding Business Volume $22,197,161 $21,929,095 $21,117,942 $19,724,525 $19,007,311 90-Day Delinquencies 0.28% 0.21% 0.29% 0.14% 0.25% Charge-Offs $0 $5,759 $67 $17 $327 Book Value per Share $63.07 $59.91 $54.80 $49.01 $42.59 Core Earnings Return on Equity 18% 16% 17% 17% 15%
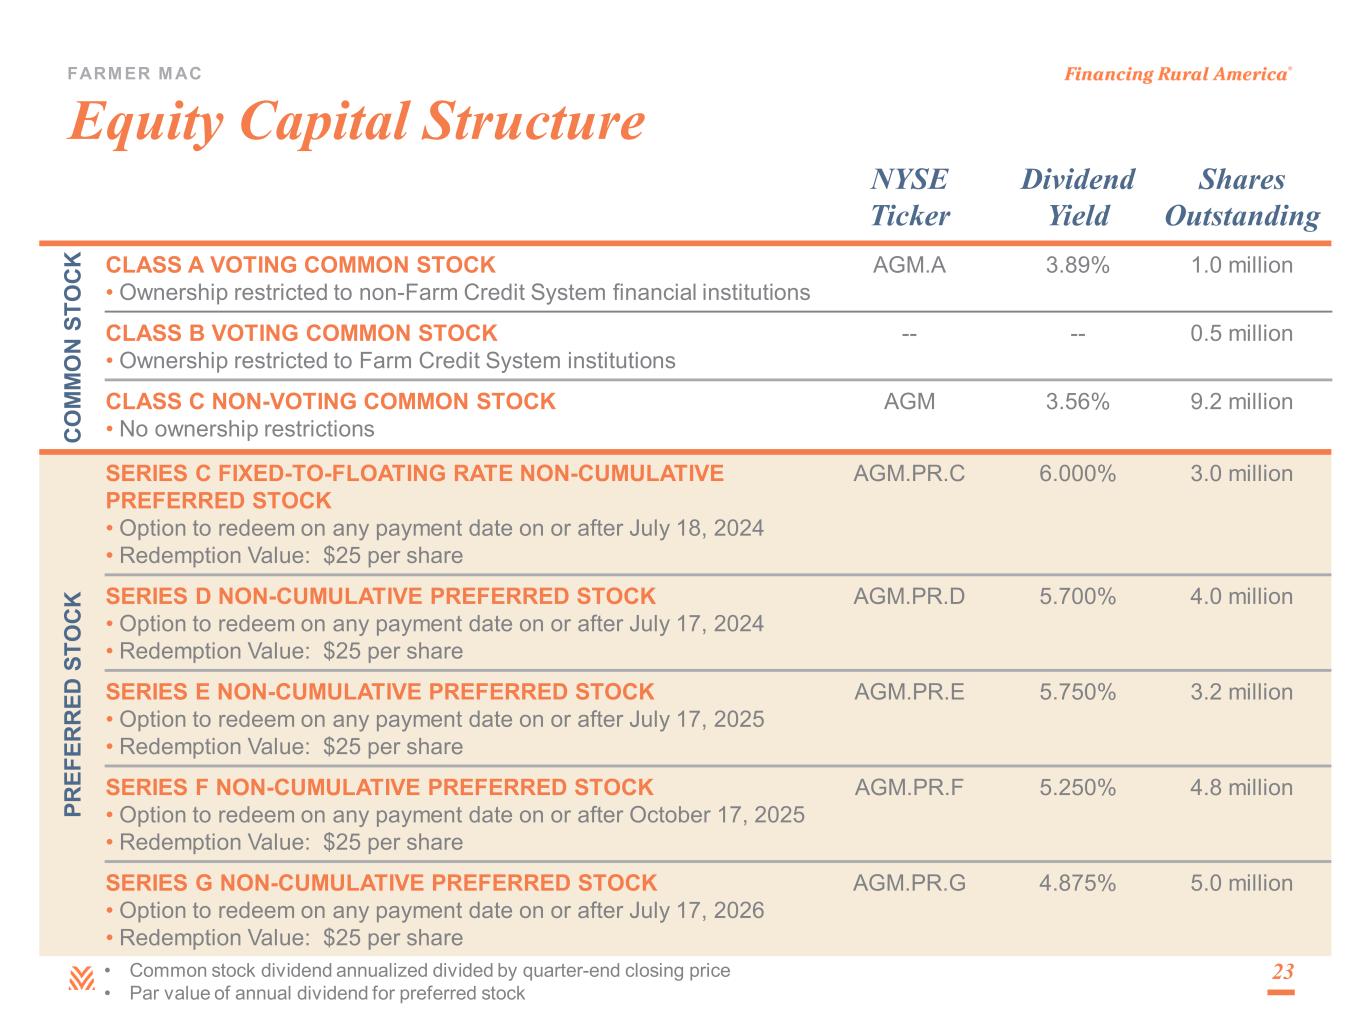
FARM ER M AC Equity Capital Structure 23 NYSE Ticker Dividend Yield Shares Outstanding C O M M O N ST O C K CLASS A VOTING COMMON STOCK • Ownership restricted to non-Farm Credit System financial institutions AGM.A 3.89% 1.0 million CLASS B VOTING COMMON STOCK • Ownership restricted to Farm Credit System institutions -- -- 0.5 million CLASS C NON-VOTING COMMON STOCK • No ownership restrictions AGM 3.56% 9.2 million PR EF ER R ED ST O C K SERIES C FIXED-TO-FLOATING RATE NON-CUMULATIVE PREFERRED STOCK • Option to redeem on any payment date on or after July 18, 2024 • Redemption Value: $25 per share AGM.PR.C 6.000% 3.0 million SERIES D NON-CUMULATIVE PREFERRED STOCK • Option to redeem on any payment date on or after July 17, 2024 • Redemption Value: $25 per share AGM.PR.D 5.700% 4.0 million SERIES E NON-CUMULATIVE PREFERRED STOCK • Option to redeem on any payment date on or after July 17, 2025 • Redemption Value: $25 per share AGM.PR.E 5.750% 3.2 million SERIES F NON-CUMULATIVE PREFERRED STOCK • Option to redeem on any payment date on or after October 17, 2025 • Redemption Value: $25 per share AGM.PR.F 5.250% 4.8 million SERIES G NON-CUMULATIVE PREFERRED STOCK • Option to redeem on any payment date on or after July 17, 2026 • Redemption Value: $25 per share AGM.PR.G 4.875% 5.0 million • Common stock dividend annualized divided by quarter-end closing price • Par value of annual dividend for preferred stock
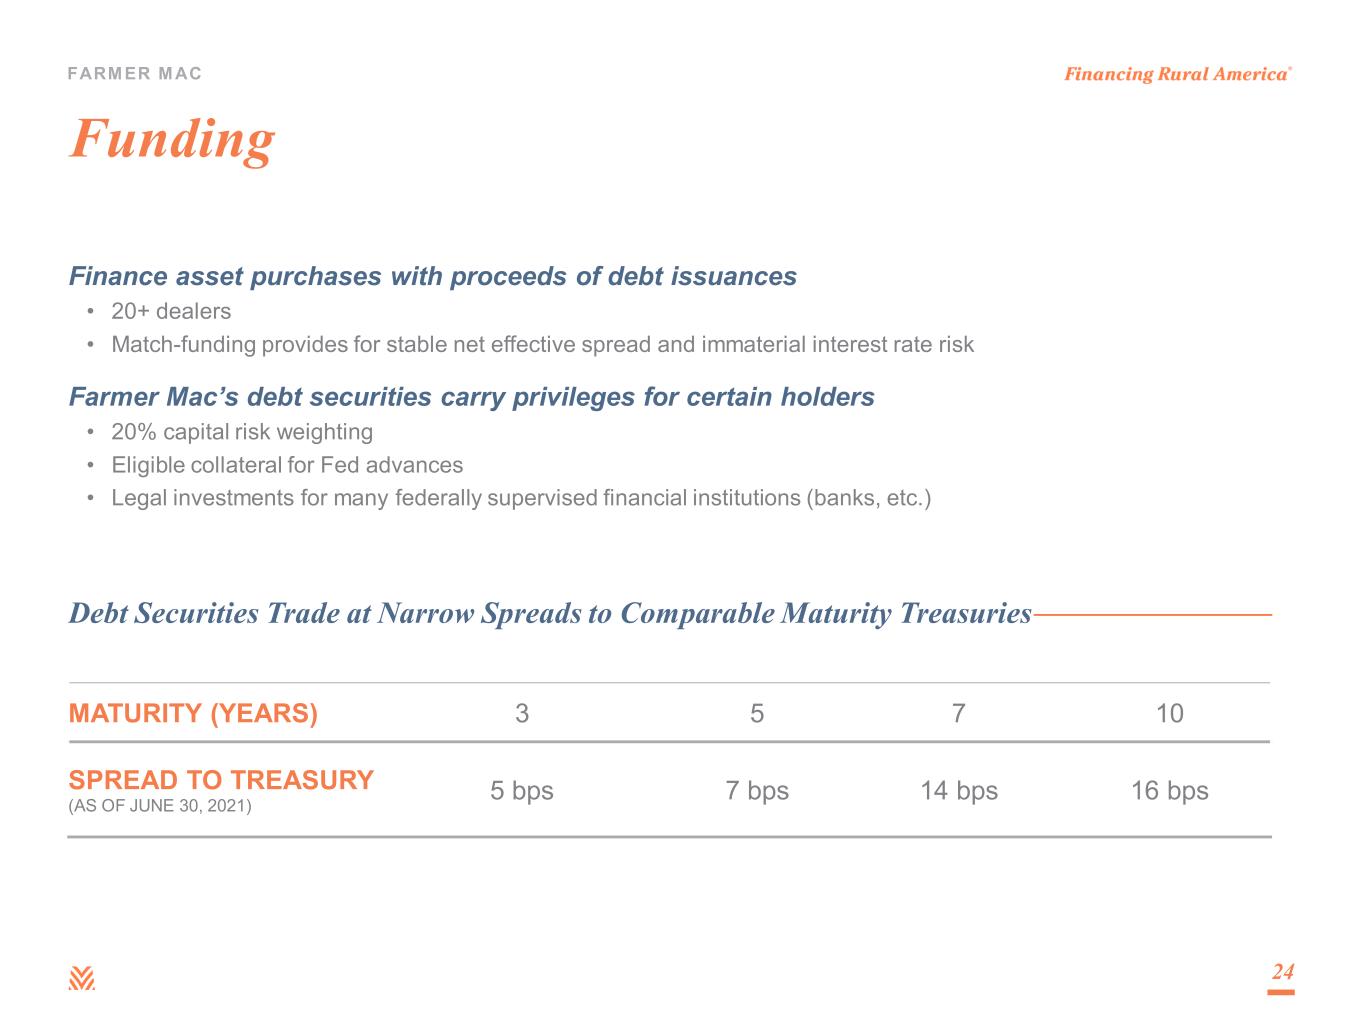
FARM ER M AC Funding Finance asset purchases with proceeds of debt issuances • 20+ dealers • Match-funding provides for stable net effective spread and immaterial interest rate risk Farmer Mac’s debt securities carry privileges for certain holders • 20% capital risk weighting • Eligible collateral for Fed advances • Legal investments for many federally supervised financial institutions (banks, etc.) 24 Debt Securities Trade at Narrow Spreads to Comparable Maturity Treasuries MATURITY (YEARS) 3 5 7 10 SPREAD TO TREASURY (AS OF JUNE 30, 2021) 5 bps 7 bps 14 bps 16 bps

FARM ER M AC World population is expected to grow to 9.8 billion by 2050 • Arable land per person is expected to decline over 40% from 2005 to 2050 USDA projects a 75% increase in total production and consumption of major field crops in the same period • 43% increase in world population • Higher protein diets as incomes in developing countries increase Productivity would need to nearly double by 2050 to feed the world “Demand Pull” Provides Sustained Growth Opportunity 3.0 9.8 0.43 0.18 0.00 0.05 0.10 0.15 0.20 0.25 0.30 0.35 0.40 0.45 0.50 0.0 2.0 4.0 6.0 8.0 10.0 12.0 1960 1970 1980 1990 2000 2010 2020 2030 2040 2050 AR ABLE LAN D PER C APITA (hectare in use per person)W O R LD P O PU LA TI O N (in b illi on s) World Population Arable Land per capita 25 (12) (13)
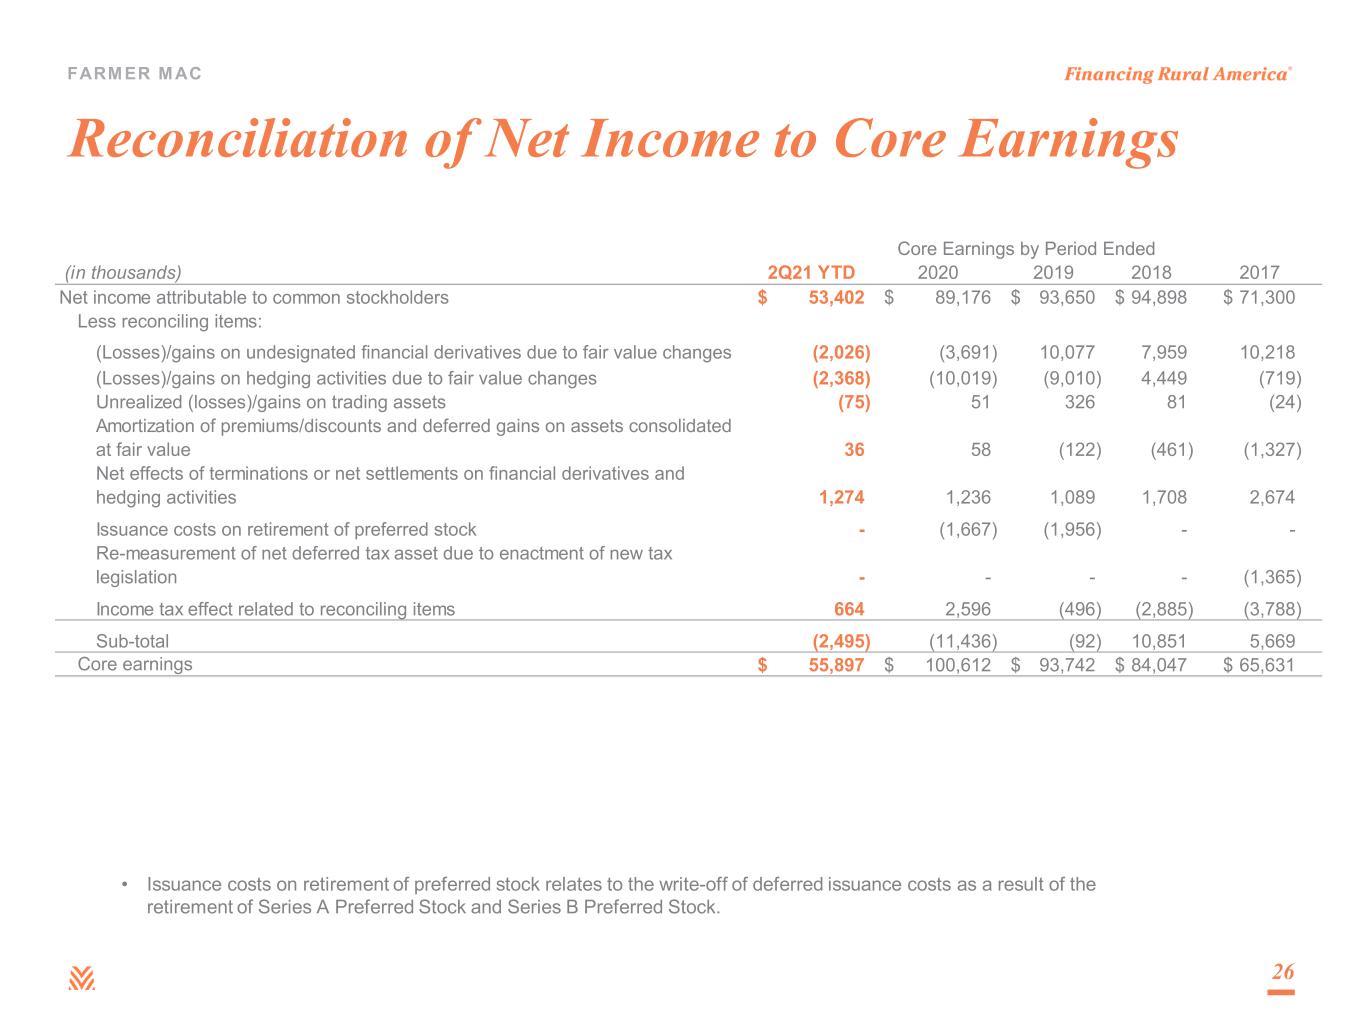
FARM ER M AC Reconciliation of Net Income to Core Earnings 26 (in thousands) 2Q21 YTD 2020 2019 2018 2017 Net income attributable to common stockholders 53,402$ 89,176$ 93,650$ 94,898$ 71,300$ Less reconciling items: (Losses)/gains on undesignated financial derivatives due to fair value changes (2,026) (3,691) 10,077 7,959 10,218 (Losses)/gains on hedging activities due to fair value changes (2,368) (10,019) (9,010) 4,449 (719) Unrealized (losses)/gains on trading assets (75) 51 326 81 (24) Amortization of premiums/discounts and deferred gains on assets consolidated at fair value 36 58 (122) (461) (1,327) Net effects of terminations or net settlements on financial derivatives and hedging activities 1,274 1,236 1,089 1,708 2,674 Issuance costs on retirement of preferred stock - (1,667) (1,956) - - Re-measurement of net deferred tax asset due to enactment of new tax legislation - - - - (1,365) Income tax effect related to reconciling items 664 2,596 (496) (2,885) (3,788) Sub-total (2,495) (11,436) (92) 10,851 5,669 Core earnings 55,897$ 100,612$ 93,742$ 84,047$ 65,631$ Core Earnings by Period Ended • Issuance costs on retirement of preferred stock relates to the write-off of deferred issuance costs as a result of the retirement of Series A Preferred Stock and Series B Preferred Stock.
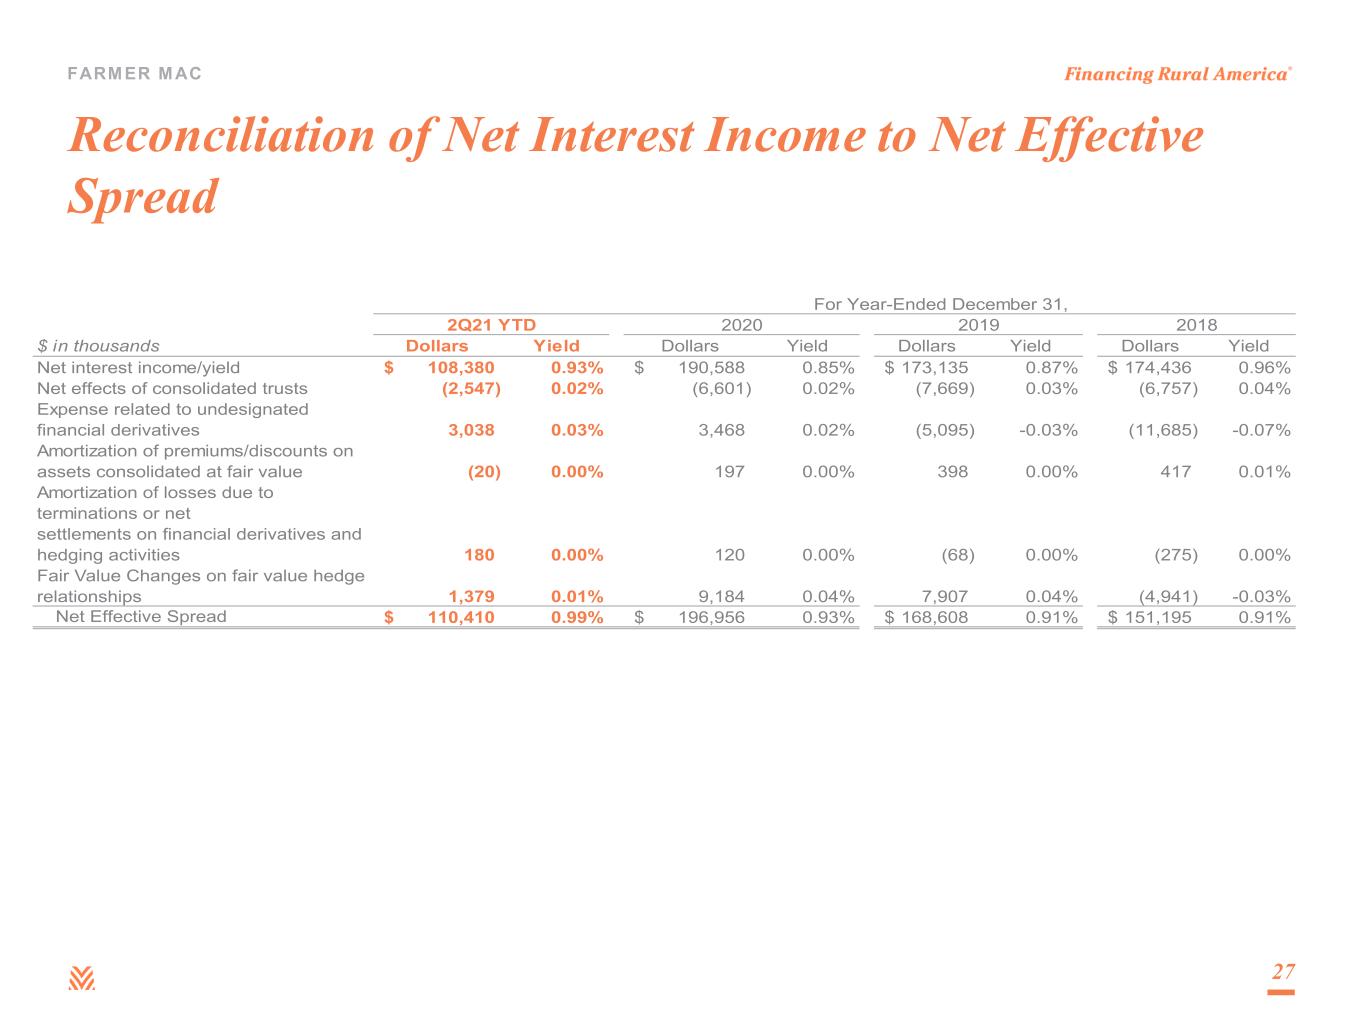
FARM ER M AC Reconciliation of Net Interest Income to Net Effective Spread 27 $ in thousands Dollars Yield Dollars Yield Dollars Yield Dollars Yield Net interest income/yield 108,380$ 0.93% 190,588$ 0.85% 173,135$ 0.87% 174,436$ 0.96% Net effects of consolidated trusts (2,547) 0.02% (6,601) 0.02% (7,669) 0.03% (6,757) 0.04% Expense related to undesignated financial derivatives 3,038 0.03% 3,468 0.02% (5,095) -0.03% (11,685) -0.07% Amortization of premiums/discounts on assets consolidated at fair value (20) 0.00% 197 0.00% 398 0.00% 417 0.01% Amortization of losses due to terminations or net settlements on financial derivatives and hedging activities 180 0.00% 120 0.00% (68) 0.00% (275) 0.00% Fair Value Changes on fair value hedge relationships 1,379 0.01% 9,184 0.04% 7,907 0.04% (4,941) -0.03% Net Effective Spread 110,410$ 0.99% 196,956$ 0.93% 168,608$ 0.91% 151,195$ 0.91% 2Q21 YTD 2020 2019 2018 For Year-Ended December 31,

FARM ER M AC Resources Footnote 1: USDA Economic Research Service year end 2019 balance sheet (https://data.ers.usda.gov/reports.aspx?ID=17835). Footnote 2: Farmer’s Mac’s total excludes loan purchases, LTSPCs, and AgVantage business with rural utilities customers. Market share represents Farmer Mac’s percentage of only Farm Sector Real Estate Debt outstanding. Footnote 3: Eligible ag real estate mortgage market structure shown includes the forecast for outstanding unpaid principal balance of first lien ag mortgage assets as of December 31, 2019. Footnote 4: USDA, Economic Research Service U.S. and State-Level Farm Income and Wealth Statistic (https://www.ers.usda.gov/data- products/farm-income-and-wealth-statistics/data-files-us-and-state-level-farm-income-and-wealth-statistics/) Footnote 5: USDA, National Agricultural Statistics Service (as of August 2015). Historic values are not necessarily predictive of future results or outcomes. Footnote 6: FDIC Call Report Data & Farm Credit Funding Corp Annual Information Statements – Non-accrual real estate loans and accruing loans that are 90 days or more past due made by commercial and Farm Credit System banks (as of June 2020). Footnote 7: Delinquencies include loans held and loans underlying off-balance sheet Farm & Ranch Guaranteed Securities and LTSPCs that are 90 days or more past due, in foreclosure, or in bankruptcy with at least one missed payment, excluding loans performing under either their original loan terms or a court-approved bankruptcy plan. Footnote 8: Kansas City Federal Reserve Agriculture Finance Databook (https://www.kansascityfed.org/agriculture/agfinance-updates/). Footnote 9: Banks’ charge-off rate is a percentage of agricultural loan assets. Footnote 10: Farm Credit Banks Funding Corporation Annual Information Statements; Farm Credit System’s charge-off rate is the percentage of total loans and guarantees. Footnote 11: Farmer Mac’s charge-off rate is the percentage of total loans and guarantees. Footnote 12: USDA, Economic Research Service Global Drivers of Agricultural Demand and Supply, September 2014. Footnote 13: Food and Agriculture Organization of the United Nations, “World Agriculture Towards 2030/2050,” June 2012. 28