
Ameresco, Inc 8-K, filed Mar 2, 2026
Ameresco, Inc. (AMRC)
8-K
2026-03-02
For: 2026-03-02
View Original
Added on
April 10, 2026
About this 8-K
Ameresco, Inc filed this 8-K on March 2, 2026.
Items reported
- Item 2.02: Financial results
- Item 9.01: Financial statements and exhibits
UNITED STATES
SECURITIES AND EXCHANGE COMMISSION
WASHINGTON, D.C. 20549
FORM 8-K
CURRENT REPORT
Pursuant to Section 13 or 15(d) of the
Securities Exchange Act of 1934
Date of Report (Date of earliest event reported): March 2, 2026
Ameresco, Inc.
(Exact Name of Registrant as Specified in Charter)
| Delaware | 001-34811 | 04-3512838 | ||||||||||||
| (State or Other Juris- diction of Incorporation) | (Commission File Number) | (IRS Employer Identification No.) | ||||||||||||
| 111 Speen Street, | Suite 410, | Framingham, | MA | 1701 | |||||||||||||
| (Address of Principal Executive Offices) | (Zip Code) | ||||||||||||||||
Registrant’s telephone number, including area code: (508) 661-2200
(Former Name or Former Address, if Changed Since Last Report)
Check the appropriate box below if the Form 8-K filing is intended to simultaneously satisfy the filing obligation of the registrant under any of the following provisions:
| ☐ | Written communications pursuant to Rule 425 under the Securities Act (17 CFR 230.425) | ||||||||||
| ☐ | Soliciting material pursuant to Rule 14a-12 under the Exchange Act (17 CFR 240.14a-12) | ||||||||||
| ☐ | Pre-commencement communications pursuant to Rule 14d-2(b) under the Exchange Act (17 CFR 240.14d-2(b)) | ||||||||||
| ☐ | Pre-commencement communications pursuant to Rule 13e-4(c) under the Exchange Act (17 CFR 240.13e-4(c)) | ||||||||||
Securities registered pursuant to Section 12(b) of the Act:
| Title of Each Class | Trading Symbol | Name of exchange on which registered | ||||||
| Class A Common Stock, par value $0.0001 per share | AMRC | New York Stock Exchange | ||||||
| Indicate by check mark whether the registrant is an emerging growth company as defined in Rule 405 of the Securities Act of 1933 (§230.405 of this chapter) or Rule 12b-2 of the Securities Exchange Act of 1934 (§240.12b-2 of this chapter). | |||||||||||
| Emerging growth company | ☐ | ||||||||||
| If an emerging growth company, indicate by check mark if the registrant has elected not to use the extended transition period for complying with any new or revised financial accounting standards provided pursuant to Section 13(a) of the Exchange Act. | ☐ | ||||||||||
Item 2.02. Results of Operations and Financial Condition.
On March 2, 2026, Ameresco, Inc. (“we” or the “Company”) announced its financial results for the quarter and fiscal year ended December 31, 2025. The Company also posted supplemental information with respect to its fourth quarter and full year results on the Investor Relations section of its website at www.ameresco.com. The press release and the supplemental information issued in connection with the announcement are furnished as Exhibit 99.1 and Exhibit 99.2, respectively, to this Current Report on Form 8-K.
The information in this Form 8-K (including Exhibit 99.1 and Exhibit 99.2) shall not be deemed “filed” for purposes of Section 18 of the Securities Exchange Act of 1934 (the “Exchange Act”) or otherwise subject to the liabilities of that section, nor shall it be deemed incorporated by reference in any filing under the Securities Act of 1933 or the Exchange Act, except as expressly set forth by specific reference in such a filing.
Item 9.01. Financial Statements and Exhibits.
(d) Exhibits
The exhibits listed on the Exhibit Index immediately preceding such exhibits are furnished as part of this Current Report on Form 8-K.
EXHIBIT INDEX
| Exhibit No. | Description | |||||||
| 99.1 | ||||||||
| 99.2 | ||||||||
| 104 | Cover Page Interactive Data File (formatted as Inline XBRL) | |||||||
SIGNATURE
Pursuant to the requirements of the Securities Exchange Act of 1934, the registrant has duly caused this report to be signed on its behalf by the undersigned hereunto duly authorized.
| AMERESCO, INC. | ||||||||||||||
| March 2, 2026 | By: | /s/ Mark Chiplock | ||||||||||||
| Mark Chiplock | ||||||||||||||
| Senior Vice President and Chief Financial Officer (duly authorized and principal financial officer) | ||||||||||||||
Exhibit 99.1

Ameresco Reports Fourth Quarter and Full Year 2025 Financial Results
Delivers Strong Q4 and Full Year Results
121 MWe of Energy Assets Placed in Service During the Year, Exceeding Guidance
$5 billion Project Backlog with Well Diversified Mix of Energy Infrastructure and Building Efficiency Solutions
Total Revenue Visibility Exceeds $10 Billion
Guides to Another Year of Strong Profitable Growth in 2026
Full Year and Fourth Quarter 2025 Financial Highlights:
•Revenues of $1,932.1 million and $581.0 million
•Net income attributable to common shareholders of $44.3 million and $18.4 million
•GAAP EPS of $0.83 and $0.34
•Non-GAAP EPS of $0.90 and $0.39
•Adjusted EBITDA of $237.2 million and $70.0 million
FRAMINGHAM, MA - March 2, 2026 – Ameresco, Inc. (NYSE: AMRC), a leading energy infrastructure solutions provider, today announced financial results for the fourth quarter ended December 31, 2025. The Company also furnished supplemental information in conjunction with this press release in a Current Report on Form 8-K. The supplemental information, which includes Non-GAAP financial measures, has been posted to the “Investors” section of the Company’s website at www.ameresco.com. Reconciliations of Non-GAAP measures to the appropriate GAAP measures are included herein. All financial result comparisons made are against the prior year period unless otherwise noted.
CEO George Sakellaris commented, “Strong fourth quarter results capped an excellent year for Ameresco in which we successfully navigated a dynamic business environment and reached the mid to high ends of our annual revenue and profit guidance ranges.
We achieved record quarterly revenue during the fourth quarter driven by our continued focus on project execution, together with the benefits of recurring revenue from our long-term Energy Asset and O&M businesses. The market for our energy infrastructure and building efficiency solutions remained robust in the fourth quarter, driving a 13% increase in awarded backlog compared to last year and signaling strong continued customer demand for our solutions. Total project backlog increased 5% to over $5 billion at year-end. Additionally, we placed 87 MWe into operation, including our 9th RNG facility, a large military solar plus storage installation and the Nucor BESS system. The Nucor asset highlights the increasing need for our solutions from energy intensive heavy industries, a large and growing opportunity for us. We also continued to selectively add additional assets into our development and construction pipeline during the quarter. Our project backlog together with our recurring Energy Asset and O&M businesses gives us over $10 billion in long-term revenue visibility, supporting our confidence in the Company’s future growth prospects.
Ameresco’s diversified mix of building efficiency and energy infrastructure Project and Energy Asset solutions continues to address key issues facing our customers, notably increased energy costs, rapidly growing energy demand and the need for energy to be highly resilient to power mission critical operations. Our decades of experience and our track record of successful execution have strengthened our competitive position, making us a go-to solutions provider,” Mr. Sakellaris concluded.
Fourth Quarter Financial Results
(All financial result comparisons made are against the prior year period unless otherwise noted.)
| (in millions) | Q4 2025 | Q4 2024 | ||||||||||||||||||
| Revenue | Net Income (1) | Adj. EBITDA | Revenue | Net Income (1) | Adj. EBITDA | |||||||||||||||
| Projects | $465,929 | $18,927 | $27,516 | $418,263 | $364 | $13,709 | ||||||||||||||
| Energy Assets | $60,689 | $(3,558) | $37,757 | $57,644 | $8,899 | $31,050 | ||||||||||||||
| O&M | $29,467 | $1,973 | $2,800 | $26,536 | $1,651 | $2,611 | ||||||||||||||
| Other | $24,941 | $1,029 | $1,938 | $30,224 | $26,171 | $39,815 | ||||||||||||||
Total (2) | $581,026 | $18,371 | $70,011 | $532,667 | $37,085 | $87,185 | ||||||||||||||
(1) Net Income represents net income attributable to common shareholders | ||||||||||||||||||||
(2) Numbers in table may not sum due to rounding. | ||||||||||||||||||||
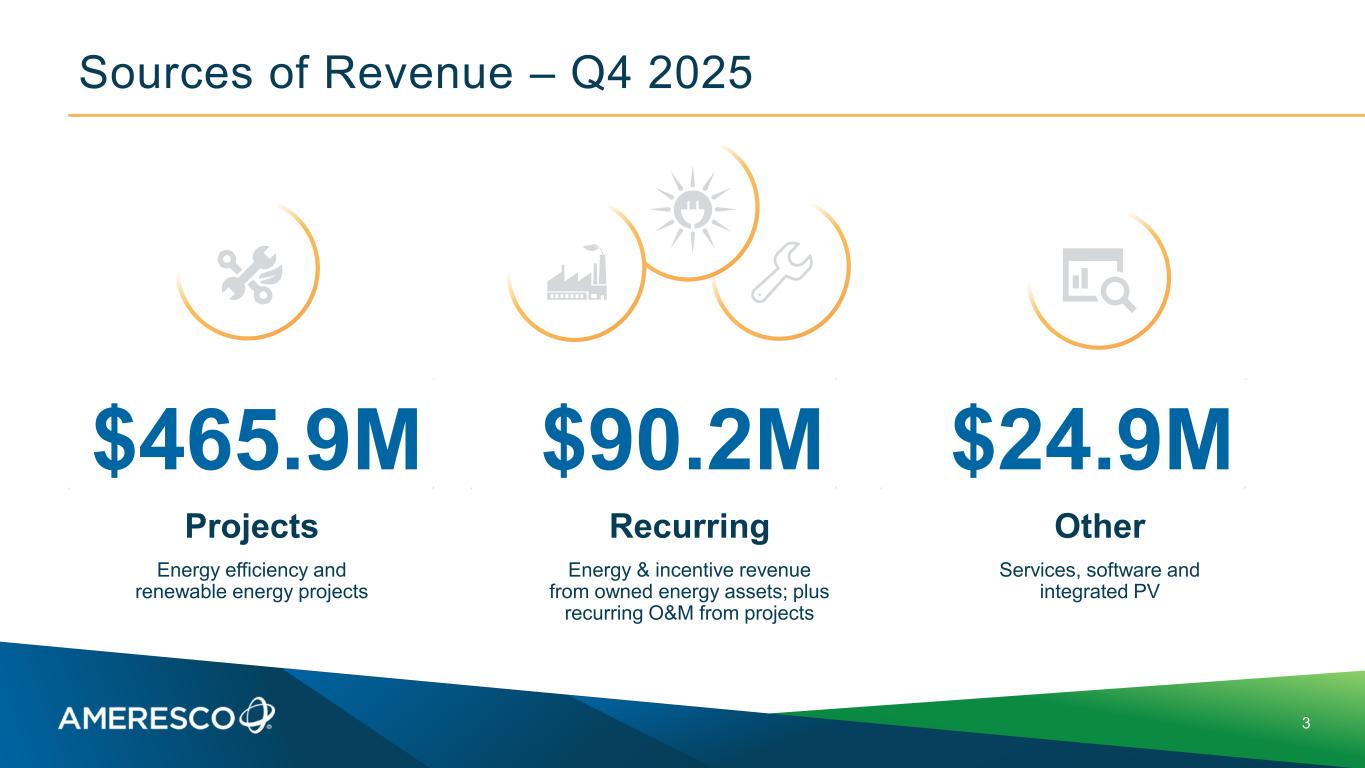
Total revenue was $581.0 million, up 9% year over year and represented a record quarterly result. Project revenue increased 11% to $465.9 million, driven by strong European performance and continued backlog conversion. Energy Asset revenue grew 5% to $60.7 million, reflecting the continued expansion of our operating asset portfolio, while O&M revenue increased 11% with the addition of new long-term contracts. Our other line of business, excluding the divestiture of our AEG business at the end of 2024, delivered solid year-over-year results. Gross margin improved to 16.2% reflecting both sequential and year-on-year improvement.
Interest and other expenses, net was $20.7 million, representing a decrease of 11.4%. The effective tax benefit rate was (26.0%) in 2025, compared to (58.9)% in 2024, reflecting higher taxable income and our election to sell certain investment tax credits through third-party sales,
rather than retaining them for internal tax use. Net income attributable to common shareholders was $18.4 million, or $0.34 per diluted share, with Non-GAAP EPS of $0.39. Adjusted EBITDA was $70.0 million. Fourth quarter 2024 Adjusted EBITDA of $87.2 million included approximately $38 million related to the gain on the sale of AEG.
Project and Asset Highlights
| ($ in millions) | At December 31, 2025 | |||||||
Awarded Project Backlog (1) | $2,569 | |||||||
| Contracted Project Backlog | $2,470 | |||||||
| Total Project Backlog | $5,039 | |||||||
12-month Contracted Backlog (2) | $1,065 | |||||||
| New Contracts | $461 | |||||||
New Awards (3) | $362 | |||||||
| O&M Revenue Backlog | $1,475 | |||||||
| 12-month O&M Backlog | $112 | |||||||
Total Energy Asset Visibility (4) | $3,850 | |||||||
| Total Revenue Visibility | $10,364 | |||||||
| Energy Assets Placed into Operation | 87 MWe | |||||||
| Energy Assets New Awards / Scope Changes | 30 MWe | |||||||
| Total Operating Energy Assets | 838 MWe | |||||||
Ameresco's Net Assets in Development (5) | 570 MWe | |||||||
(1) Customer contracts that have not been signed yet | ||||||||
(2) We define our 12-month backlog as the estimated amount of revenues that we expect to recognize in the next twelve months from our fully-contracted backlog | ||||||||
(3) Represents estimated future revenues from projects that have been awarded, though the contracts have not yet been signed | ||||||||
(4) Estimated contracted revenue and incentives during PPA period plus estimated additional revenue from operating RNG assets over a 20-year period, assuming RINs at $1.50/gallon and brown gas at $3.50/MMBtu with $3.00/MMBtu for LCFS on certain projects | ||||||||
(5) Net MWe capacity includes only our share of any jointly owned assets | ||||||||
Balance Sheet and Cash Flow Metrics
| ($ in millions) | December 31, 2025 | ||||
Total Corporate Debt (1) | $339.3 | ||||
Corporate Debt Leverage Ratio (2) | 2.7x | ||||
Non-Core Debt, International JVs (4) | $25.5 | ||||
Total Energy Asset Debt (3) | $1,517.1 | ||||
Energy Asset Book Value (5) | $2,081.2 | ||||
Energy Debt Advance Rate (6) | 73% | ||||
| Q4 Cash Flows from Operating Activities | $(42.9) | ||||
| Plus: Q4 proceeds from Sales of ITC | $61.6 | ||||
| Plus: Q4 Proceeds from Federal ESPC Projects | $17.7 | ||||
| Equals: Q4 Adjusted Cash from Operations | $36.4 | ||||
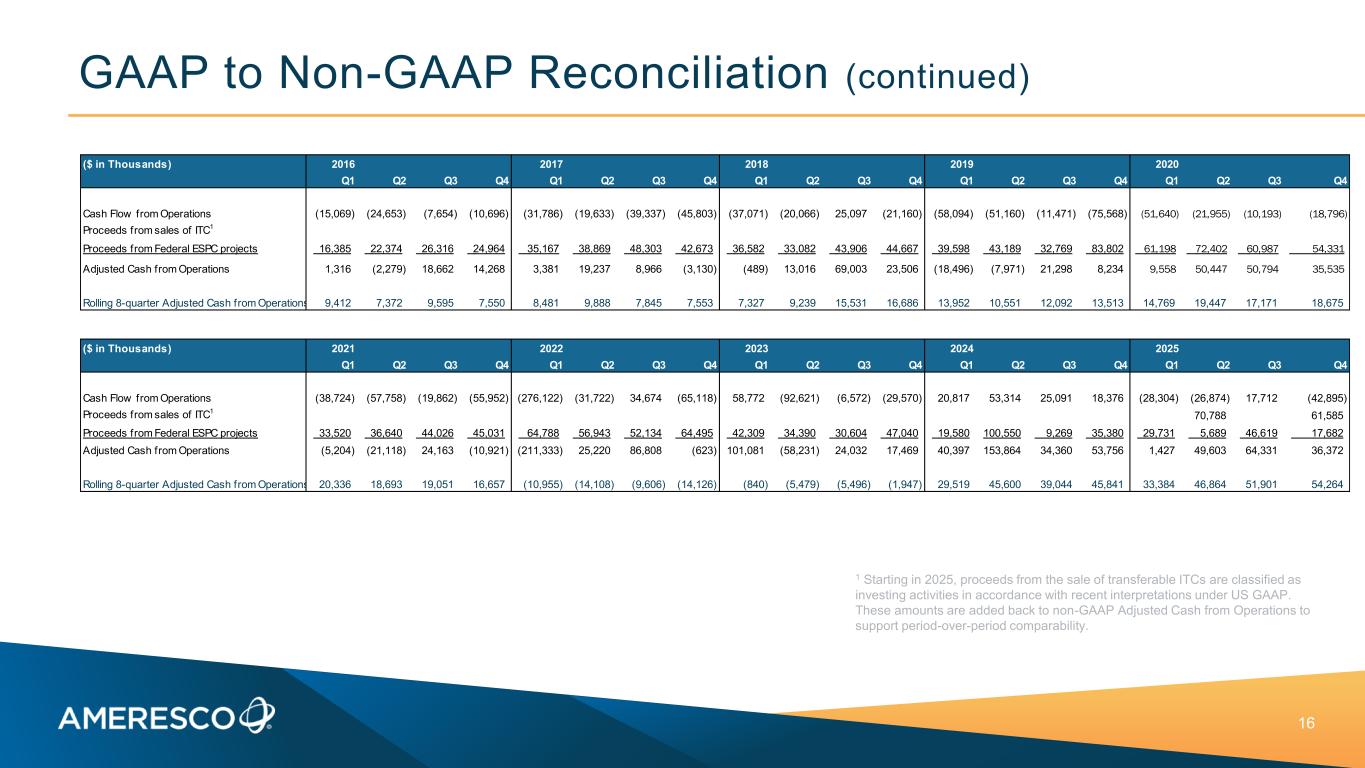
| 8-quarter rolling average Cash Flows from Operating Activities | $4.7 | ||||
| Plus: 8-quarter rolling average Proceeds from Sales of ITC | $16.5 | ||||
| Plus: 8-quarter rolling average Proceeds from Federal ESPC Projects | $33.1 | ||||
| Equals: 8-quarter rolling average Adjusted Cash from Operations | $54.3 | ||||
(1) Subordinated debt, term loans, and drawn amounts on the revolving line of credit, net of debt discount and issuance costs | |||||
(2) Debt to EBITDA, as calculated under our Sr. Secured Credit Facility | |||||
(3) Term loans, sale-leasebacks and construction loan project financings for our Energy Assets in operations and in-construction and development | |||||
(4) Non-core Debt associated with our international joint ventures, net of $58K unamortized debt discount | |||||
(5) Book Value of our Energy Assets in operations and in-construction and development | |||||
(6) Total Energy Asset Debt divided by Energy Asset Book Value | |||||
The Company ended 2025 with $71.8 million in unrestricted cash with total corporate debt including our subordinated debt, term loans and drawn amounts on our revolving line of credit increasing to $339.3 million. Corporate debt increased in order to support our working capital needs given the continued growth of our project and energy asset businesses. During the quarter the Company successfully executed approximately $175 million in project financing commitments. Our Energy Asset Debt was $1.5 billion with an Energy Debt Advance rate of 73% on the Energy Asset Book Value. Our Adjusted Cash from Operations during the quarter was $36.4 million. Our 8-quarter rolling average Adjusted Cash from Operations was $54.3 million.
Outlook
“We entered 2026 with positive business momentum and a more favorable operating environment than we faced at this time last year. With our diversified Project and Energy Asset offerings covering a comprehensive portfolio of building efficiency and infrastructure solutions, we believe Ameresco has the capabilities to consistently meet our global customers’ needs to increase their energy supplies, reduce their energy costs, and provide greater energy resiliency. This positioning underpins our confidence in Ameresco’s growth prospects in 2026 and beyond,” concluded CEO George Sakellaris.
The company is guiding revenue of $2.1 billion and adjusted EBITDA of $283 million at the midpoints of our ranges, representing growth of 9% and 19%, respectively. We anticipate placing approximately 100-120 MWe of energy assets in service, including 2 RNG plants. Our expected capex is $300 million to $350 million, the majority of which we expect to fund with additional energy asset debt, tax equity or tax credit sales.
The cadence of the year should follow our historical seasonal pattern, with a heavier weighting toward the second half. We expect revenues in the second half of the year to represent approximately 60% of our total revenue for 2026. This is consistent with our performance from the past couple of years.
Our first quarter is typically our seasonally lowest revenue quarter and has been further impacted by severe weather conditions. Therefore, we expect our first quarter revenue and Adjusted EBITDA to track similar to Q1 of last year. With the expected continued growth of our energy asset portfolio, depreciation and interest expenses are expected to continue to increase as those assets come into service. Given the linear nature of those costs, we expect first quarter EPS to be negative by approximately $0.30.
| FY 2026 Guidance Ranges | ||||||||||||||
| Revenue | $2.0 billion | $2.2 billion | ||||||||||||
| Gross Margin | 17.0% | 18.0% | ||||||||||||
| Adjusted EBITDA | $270 million | $295 million | ||||||||||||
| Depreciation & Amortization | $115 million | $116 million | ||||||||||||
| Interest Expense Net | $95 million | $100 million | ||||||||||||
| Effective Tax Rate | (20)% | (10)% | ||||||||||||
| Income Attributable to Non-Controlling Interest | ($20) million | ($25) million | ||||||||||||
| Non-GAAP EPS | $1.10 | $1.35 | ||||||||||||
The Company’s Adjusted EBITDA and Non-GAAP EPS guidance excludes the potential impact of redeemable non-controlling interest activity, one-time charges, energy asset and goodwill impairment charges, changes in contingent consideration, restructuring activities, as well as any related tax impact.
Conference Call/Webcast Information
The Company will host a conference call today at 4:30 p.m. ET to discuss fourth quarter 2025 financial results, business and financial outlook, and other business highlights. To participate on the day of the call, dial 1-888-596-4144, or internationally 1-646-968-2525, and enter the conference ID: 9798186, approximately 10 minutes before the call. A live, listen-only webcast of the conference call will also be available over the Internet. Individuals wishing to listen can
access the call through the “Investors” section of the Company’s website at www.ameresco.com. If you are unable to listen to the live call, an archived webcast will be available on the Company’s website for one year.
Use of Non-GAAP Financial Measures
This press release and the accompanying tables include references to adjusted EBITDA, Non- GAAP EPS, Non-GAAP net income and adjusted cash from operations, which are Non-GAAP financial measures. For a description of these Non-GAAP financial measures, including the reasons management uses these measures, please see the section following the accompanying tables titled “Exhibit A: Non-GAAP Financial Measures”. For a reconciliation of these Non-GAAP financial measures to the most directly comparable financial measures prepared in accordance with GAAP, please see Non-GAAP Financial Measures and Non-GAAP Financial Guidance in the accompanying tables.
About Ameresco, Inc.
Founded in 2000, Ameresco, Inc. (NYSE:AMRC) is a leading energy infrastructure solutions provider dedicated to helping customers reduce costs, enhance resilience, and decarbonize to net zero in the global energy transition. Our comprehensive portfolio includes implementing smart energy efficiency solutions, upgrading aging infrastructure, and developing, constructing, and operating distributed energy resources. As a trusted full-service partner, Ameresco shows the way by reducing energy use and delivering diversified generation solutions to Federal, state and local governments, utilities, data centers, educational and healthcare institutions, housing authorities, and commercial and industrial customers. Headquartered in Framingham, MA, Ameresco has more than 1,500 employees providing local expertise in North America and Europe. For more information, visit www.ameresco.com.
Contact: | Media Relations | Leila Dillon, 508.661.2264, news@ameresco.com | |||||||||
Investor Relations | Eric Prouty, AdvisIRy Partners, 212.750.5800, eric.prouty@advisiry.com | ||||||||||
Lynn Morgen, AdvisIRy Partners, 212.750.5800, lynn.morgen@advisiry.com | |||||||||||
Safe Harbor Statement
Any statements in this press release about future expectations, plans and prospects for Ameresco, Inc., including statements about market conditions, pipeline, visibility, backlog, pending agreements, new and expanding market opportunities, financial guidance including estimated future revenues, net income, adjusted EBITDA, Non-GAAP EPS, gross margin, effective tax rate, interest rate, depreciation, tax attributes and capital investments, as well as statements about our financing plans; the impact of the OBBB Act, other policies and regulatory changes; supply chain disruptions; shortage and cost of materials and labor; other macroeconomic and geopolitical challenges; our expectations related to our agreement with SCE including the impact of delays and any requirement to pay liquidated damages; and other statements containing the words “projects,” “believes,” “anticipates,” “plans,” “expects,” “will” and similar expressions, constitute forward-looking statements within the meaning of The Private Securities Litigation Reform Act of 1995. Actual results may differ materially from those indicated by such forward looking statements as a result of various important factors, including: demand for our energy efficiency and renewable energy solutions; the timing of, and ability to, enter into
contracts for awarded projects on the terms proposed or at all; the timing of work we do on projects where we recognize revenue on a percentage of completion basis; the ability to perform under signed contracts without delay and in accordance with their terms and the potential for liquidated and other damages we may be subject to; the fiscal health of the government and the impact of a prolonged government shutdown and reductions in the federal workforce; our ability to complete and operate our projects on a profitable basis and as committed to our customers; our cash flows from operations and our ability to arrange financing to fund our operations and projects; our customers’ ability to finance their projects and credit risk from our customers; our ability to comply with covenants in our existing debt agreements; the impact of macroeconomic challenges, weather related events and climate change; our reliance on third parties for our construction and installation work; availability and cost of labor and equipment particularly given global supply chain challenges, tariffs and global trade conflicts; global supply chain challenges, component shortages and inflationary pressures; changes in federal, state and local government policies and programs related to energy efficiency and renewable energy; the ability of customers to cancel or defer contracts included in our backlog; the output and performance of our energy plants and energy projects; cybersecurity incidents and breaches; regulatory and other risks inherent to constructing and operating energy assets; the effects of our acquisitions and joint ventures; seasonality in construction and in demand for our products and services; a customer’s decision to delay our work on, or other risks involved with, a particular project; the addition of new customers or the loss of existing customers; market price of our Class A Common stock prevailing from time to time; the nature of other investment opportunities presented to our Company from time to time; risks related to our international operation and international growth strategy; and other factors discussed in our most recent Annual Report on Form 10-K and our quarterly reports on Form 10-Q. The forward-looking statements included in this press release represent our views as of the date of this press release. We anticipate that subsequent events and developments will cause our views to change. However, while we may elect to update these forward-looking statements at some point in the future, we specifically disclaim any obligation to do so. These forward-looking statements should not be relied upon as representing our views as of any date subsequent to the date of this press release.
AMERESCO, INC.
CONSOLIDATED BALANCE SHEETS
(In thousands, except share amounts)
| December 31, | |||||||||||
| 2025 | 2024 | ||||||||||
| ASSETS | |||||||||||
| Current assets: | |||||||||||
| Cash and cash equivalents | $ | 71,785 | $ | 108,516 | |||||||
| Restricted cash | 92,515 | 69,706 | |||||||||
| Accounts receivable, net | 257,856 | 256,961 | |||||||||
| Accounts receivable retainage | 53,618 | 39,843 | |||||||||
| Unbilled revenue | 799,109 | 644,105 | |||||||||
| Inventory | 12,609 | 11,556 | |||||||||
| Prepaid expenses and other current assets | 239,865 | 145,906 | |||||||||
| Income tax receivable | 2,166 | 1,685 | |||||||||
| Project development costs, net | 23,010 | 22,856 | |||||||||
| Total current assets | 1,552,533 | 1,301,134 | |||||||||
| Federal ESPC receivable | 503,449 | 609,128 | |||||||||
| Property and equipment, net | 10,077 | 11,040 | |||||||||
| Energy assets, net | 2,081,224 | 1,915,311 | |||||||||
| Goodwill, net | 69,302 | 66,305 | |||||||||
| Intangible assets, net | 7,464 | 8,814 | |||||||||
| Right-of-use assets, net | 76,165 | 80,149 | |||||||||
| Restricted cash, non-current portion | 22,215 | 20,156 | |||||||||
| Deferred income tax assets, net | 96,868 | 56,523 | |||||||||
| Other assets | 117,797 | 89,948 | |||||||||
| Total assets | $ | 4,537,094 | $ | 4,158,508 | |||||||
| LIABILITIES, REDEEMABLE NON-CONTROLLING INTERESTS AND STOCKHOLDERS’ EQUITY | |||||||||||
| Current liabilities: | |||||||||||
| Current portions of long-term debt and financing lease liabilities, net | $ | 132,125 | $ | 149,363 | |||||||
| Accounts payable | 691,197 | 529,338 | |||||||||
| Accrued expenses and other current liabilities | 113,878 | 107,293 | |||||||||
| Current portions of operating lease liabilities | 7,959 | 10,536 | |||||||||
| Deferred revenue | 79,908 | 91,734 | |||||||||
| Income taxes payable | 3,845 | 744 | |||||||||
| Total current liabilities | 1,028,912 | 889,008 | |||||||||
| Long-term debt and financing lease liabilities, net of current portion, unamortized discount and debt issuance costs | 1,749,708 | 1,483,900 | |||||||||
| Federal ESPC liabilities | 478,970 | 555,396 | |||||||||
| Deferred income tax liabilities, net | 2,943 | 2,223 | |||||||||
| Deferred grant income | 5,385 | 6,436 | |||||||||
| Long-term operating lease liabilities, net of current portion | 55,938 | 59,479 | |||||||||
| Other liabilities | 91,003 | 114,454 | |||||||||
| Redeemable non-controlling interests, net | $ | 1,419 | $ | 2,463 | |||||||
AMERESCO, INC.
CONSOLIDATED BALANCE SHEETS - (Continued)
(In thousands, except share amounts)
| December 31, | |||||||||||
| 2025 | 2024 | ||||||||||
| Stockholders’ equity: | |||||||||||
Preferred stock, $0.0001 par value, 5,000,000 shares authorized, no shares issued and outstanding at December 31, 2025 and 2024 | — | — | |||||||||
| Class A common stock, $0.0001 par value, 500,000,000 shares authorized, 36,963,263 shares issued and 34,861,428 shares outstanding at December 31, 2025, 36,603,048 shares issued and 34,501,213 shares outstanding at December 31, 2024 | 3 | 3 | |||||||||
| Class B common stock, $0.0001 par value, 144,000,000 shares authorized, 18,000,000 shares issued and outstanding at December 31, 2025 and 2024 | 2 | 2 | |||||||||
| Additional paid-in capital | 395,656 | 378,321 | |||||||||
| Retained earnings | 696,737 | 652,561 | |||||||||
| Accumulated other comprehensive loss, net | (460) | (5,874) | |||||||||
Treasury stock, at cost, 2,101,835 shares at December 31, 2025 and 2024 | (11,788) | (11,788) | |||||||||
| Stockholders’ equity before non-controlling interest | 1,080,150 | 1,013,225 | |||||||||
| Non-controlling interests | 42,666 | 31,924 | |||||||||
| Total stockholders’ equity | 1,122,816 | 1,045,149 | |||||||||
Total liabilities, redeemable non-controlling interests and stockholders’ equity | $ | 4,537,094 | $ | 4,158,508 | |||||||
AMERESCO, INC.
CONSOLIDATED STATEMENTS OF INCOME
(In thousands, except per share amounts)
| Three Months Ended December 31, | Year Ended December 31, | ||||||||||||||||||||||||||||
| 2025 | 2024 | 2025 | 2024 | ||||||||||||||||||||||||||
| (Unaudited) | (Unaudited) | ||||||||||||||||||||||||||||
| Revenues | $ | 581,026 | $ | 532,667 | $ | 1,932,126 | $ | 1,769,928 | |||||||||||||||||||||
| Cost of revenues | 486,619 | 465,877 | 1,628,113 | 1,513,837 | |||||||||||||||||||||||||
| Gross profit | 94,407 | 66,790 | 304,013 | 256,091 | |||||||||||||||||||||||||
| Earnings from unconsolidated entities | (355) | 68 | 1,449 | 792 | |||||||||||||||||||||||||
| Gain on sale of business, net | — | 38,007 | — | 38,007 | |||||||||||||||||||||||||
| Selling, general and administrative expenses | 50,942 | 47,841 | 178,536 | 173,761 | |||||||||||||||||||||||||
| Asset impairments | 3,748 | 12,384 | 3,748 | 12,384 | |||||||||||||||||||||||||
| Operating income | 39,362 | 44,640 | 123,178 | 108,745 | |||||||||||||||||||||||||
| Interest expense and interest income, net | 29,108 | 22,722 | 87,936 | 70,182 | |||||||||||||||||||||||||
| Other (income) expenses, net | (8,359) | 684 | (9,733) | 4,623 | |||||||||||||||||||||||||
| Income before income taxes | 18,613 | 21,234 | 44,975 | 33,940 | |||||||||||||||||||||||||
| Income tax benefit | (6,310) | (16,676) | (11,700) | (20,000) | |||||||||||||||||||||||||
| Net income | 24,923 | 37,910 | 56,675 | 53,940 | |||||||||||||||||||||||||
| Net (income) loss attributable to non-controlling interests and redeemable non-controlling interests | (6,552) | (825) | (12,391) | 2,817 | |||||||||||||||||||||||||
| Net income attributable to common shareholders | $ | 18,371 | $ | 37,085 | $ | 44,284 | $ | 56,757 | |||||||||||||||||||||
| Net income per share attributable to common shareholders: | |||||||||||||||||||||||||||||
| Basic | $ | 0.35 | $ | 0.71 | $ | 0.84 | $ | 1.08 | |||||||||||||||||||||
| Diluted | $ | 0.34 | $ | 0.70 | $ | 0.83 | $ | 1.07 | |||||||||||||||||||||
| Weighted average common shares outstanding: | |||||||||||||||||||||||||||||
| Basic | 52,780 | 52,463 | 52,679 | 52,380 | |||||||||||||||||||||||||
| Diluted | 53,955 | 53,257 | 53,293 | 53,140 | |||||||||||||||||||||||||
AMERESCO, INC.
CONSOLIDATED STATEMENTS OF CASH FLOWS
(In thousands)
| Year Ended December 31, | |||||||||||
| 2025 | 2024 | ||||||||||
| Cash flows from operating activities: | |||||||||||
| Net income | $ | 56,675 | $ | 53,940 | |||||||
| Adjustments to reconcile net income to net cash flows from operating activities: | |||||||||||
| Depreciation of energy assets, net | 99,659 | 82,114 | |||||||||
| Depreciation of property and equipment | 2,213 | 4,963 | |||||||||
| Amortization of debt discount and debt issuance costs | 6,193 | 5,151 | |||||||||
| Amortization of intangible assets | 2,397 | 2,134 | |||||||||
| Increase in contingent consideration | 71 | 149 | |||||||||
| Accretion of ARO liabilities | 432 | 332 | |||||||||
| Provision for bad debts | 217 | 1,340 | |||||||||
| Impairment of long-lived assets / loss on disposal, net | 2,224 | 12,815 | |||||||||
| Gain on sale of business, net of transaction costs | — | (38,007) | |||||||||
| Non-cash production tax credits recognized | (12,160) | — | |||||||||
| Non-cash project revenue related to in-kind leases | (7,144) | (4,164) | |||||||||
| Earnings from unconsolidated entities | (322) | (792) | |||||||||
| Net gain from derivatives | (4,721) | (1,027) | |||||||||
| Stock-based compensation expense | 14,422 | 14,130 | |||||||||
| Deferred income taxes, net | (18,463) | (24,315) | |||||||||
| Unrealized foreign exchange (gain) loss | (3,083) | 2,216 | |||||||||
| Changes in operating assets and liabilities: | |||||||||||
| Accounts receivable | 15,484 | (96,867) | |||||||||
| Accounts receivable retainage | (11,648) | (14,342) | |||||||||
| Unbilled revenue | (190,931) | 54,953 | |||||||||
| Inventory, net | (1,053) | 2,081 | |||||||||
| Prepaid expenses and other current assets | (70,640) | 22,576 | |||||||||
| Project development costs | (2,419) | (3,255) | |||||||||
| Federal ESPC receivable | (84,239) | (158,937) | |||||||||
| Other assets | (8,612) | (5,287) | |||||||||
| Accounts payable, accrued expenses, and other current liabilities | 132,485 | 143,776 | 143,776 | ||||||||
| Deferred revenue | (6,426) | 50,738 | |||||||||
| Income taxes receivable, net | 2,625 | 3,679 | |||||||||
| Other liabilities | 6,404 | 7,504 | |||||||||
| Cash flows from operating activities | (80,360) | 117,598 | |||||||||
| Cash flows from investing activities: | |||||||||||
| Purchases of property and equipment | (968) | (4,291) | |||||||||
| Capital investment in energy assets | (326,034) | (416,992) | |||||||||
| Capital investment in major maintenance of energy assets | (28,997) | (17,063) | |||||||||
| Grant award received on energy asset | — | 400 | |||||||||
| Proceeds from sale of tax credits | 132,373 | — | |||||||||
| Net proceeds from sale of business | — | 54,249 | |||||||||
| Net proceeds from sale of equity investment | — | 13,091 | |||||||||
AMERESCO, INC.
CONSOLIDATED STATEMENTS OF CASH FLOWS - (Continued)
(In thousands)
| Year Ended December 31, | |||||||||||
| 2025 | 2024 | ||||||||||
| Acquisitions, net of cash received | (4,595) | — | |||||||||
| Contributions to equity and other investments | (27,819) | (11,757) | |||||||||
| Purchases of subsurface land easements | — | (4,274) | |||||||||
| Cash flows from investing activities | (256,040) | (386,637) | |||||||||
| Cash flows from financing activities: | |||||||||||
| Payments on long-term corporate debt financings | (18,000) | (127,000) | |||||||||
| Proceeds from long-term corporate debt financings | 100,000 | 100,000 | |||||||||
| Payments on senior secured revolving credit facility, net | 15,000 | (4,900) | |||||||||
| Proceeds from long-term energy asset debt financings | 552,560 | 643,529 | |||||||||
| Payments on long-term energy asset debt and financing leases | (417,527) | (424,421) | |||||||||
| Payment on seller's promissory note | — | (61,941) | |||||||||
| Payments of debt discount and debt issuance costs | (10,979) | (15,308) | |||||||||
| Proceeds from termination of swaps | $ | 2,808 | $ | — | |||||||
| Proceeds from Federal ESPC projects | 99,716 | 164,779 | |||||||||
| Net (payments on) proceeds from energy asset receivable financing arrangements | (725) | 6,012 | |||||||||
| Proceeds from exercises of options and ESPP | 2,913 | 2,763 | |||||||||
| Contributions from non-controlling interest | 4,723 | 35,407 | |||||||||
| Distributions to non-controlling interest | (7,387) | (1,368) | |||||||||
| Distributions to redeemable non-controlling interests, net | — | (422) | |||||||||
| Investment fund call option exercise | — | (3,186) | |||||||||
| Cash flows from financing activities | 323,102 | 313,944 | |||||||||
| Effect of exchange rate changes on cash | 1,435 | (203) | |||||||||
| Net (decrease) increase in cash, cash equivalents, and restricted cash | (11,863) | 44,702 | |||||||||
| Cash, cash equivalents, and restricted cash, beginning of year | 198,378 | 153,676 | |||||||||
| Cash, cash equivalents, and restricted cash, end of year | $ | 186,515 | $ | 198,378 | |||||||
Non-GAAP Financial Measures (Unaudited, in thousands)
| Three Months Ended December 31, 2025 | |||||||||||||||||
| Adjusted EBITDA: | Projects | Energy Assets | O&M | Other | Consolidated | ||||||||||||
| Net income (loss) attributable to common shareholders | $ | 18,927 | $ | (3,558) | $ | 1,973 | $ | 1,029 | $ | 18,371 | |||||||
| Impact from redeemable non-controlling interests | 1,139 | (162) | — | — | 977 | ||||||||||||
| Less: Income tax benefit | (3,959) | (2,254) | (59) | (38) | (6,310) | ||||||||||||
| Plus: Other expenses, net | 6,584 | 13,122 | 438 | 605 | 20,749 | ||||||||||||
| Plus: Depreciation and amortization | 948 | 26,550 | 245 | 152 | 27,895 | ||||||||||||
| Plus: Stock-based compensation | 3,284 | 419 | 204 | 174 | 4,081 | ||||||||||||
| Plus: Energy asset impairment charges | — | 3,748 | — | — | 3,748 | ||||||||||||
| Plus (less): Restructuring and other charges | 593 | (108) | (1) | 16 | 500 | ||||||||||||
| Adjusted EBITDA | $ | 27,516 | $ | 37,757 | $ | 2,800 | $ | 1,938 | $ | 70,011 | |||||||
| Adjusted EBITDA margin | 5.9 | % | 62.2 | % | 9.5 | % | 7.8 | % | 12.0 | % | |||||||
| Three Months Ended December 31, 2024 | |||||||||||||||||
| Adjusted EBITDA: | Projects | Energy Assets | O&M | Other | Consolidated | ||||||||||||
| Net income attributable to common shareholders | $ | 364 | $ | 8,899 | $ | 1,651 | $ | 26,171 | $ | 37,085 | |||||||
| (Less) plus: Income tax (benefit) provision | (1,096) | (26,787) | (8) | 11,215 | (16,676) | ||||||||||||
| Plus: Other expenses, net | 10,203 | 11,896 | 508 | 799 | 23,406 | ||||||||||||
| Plus: Depreciation and amortization | 1,032 | 24,245 | 276 | 992 | 26,545 | ||||||||||||
| Plus: Stock-based compensation | 2,974 | 398 | 180 | 210 | 3,762 | ||||||||||||
| Plus: Energy asset and goodwill impairment charges | — | 12,384 | — | — | 12,384 | ||||||||||||
| Plus: Contingent consideration, restructuring and other charges | 232 | 15 | 4 | 428 | 679 | ||||||||||||
| Adjusted EBITDA | $ | 13,709 | $ | 31,050 | $ | 2,611 | $ | 39,815 | $ | 87,185 | |||||||
| Adjusted EBITDA margin | 3.3 | % | 53.9 | % | 9.8 | % | 131.7 | % | 16.4 | % | |||||||
| Year Ended December 31, 2025 | |||||||||||||||||
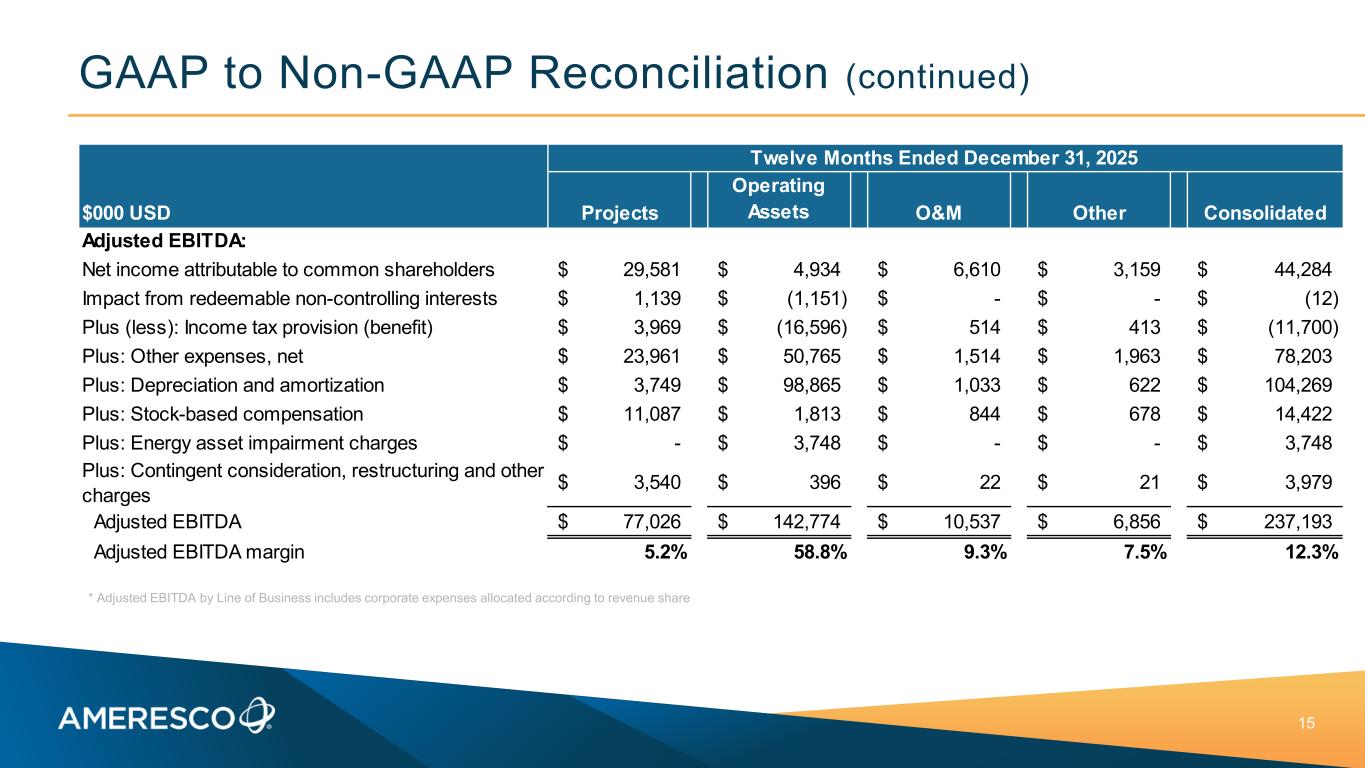
| Adjusted EBITDA: | Projects | Energy Assets | O&M | Other | Consolidated | ||||||||||||
| Net income attributable to common shareholders | $ | 29,581 | $ | 4,934 | $ | 6,610 | $ | 3,159 | $ | 44,284 | |||||||
| Impact from redeemable non-controlling interests | 1,139 | (1,151) | — | — | (12) | ||||||||||||
| (Less) plus: Income tax (benefit) provision | 3,969 | (16,596) | 514 | 413 | (11,700) | ||||||||||||
| Plus: Other expenses, net | 23,961 | 50,765 | 1,514 | 1,963 | 78,203 | ||||||||||||
| Plus: Depreciation and amortization | 3,749 | 98,865 | 1,033 | 622 | 104,269 | ||||||||||||
| Plus: Stock-based compensation | 11,087 | 1,813 | 844 | 678 | 14,422 | ||||||||||||
| Plus: Energy asset impairment charges | — | 3,748 | — | — | 3,748 | ||||||||||||
| Plus: Contingent consideration, restructuring and other charges | 3,540 | 396 | 22 | 21 | 3,979 | ||||||||||||
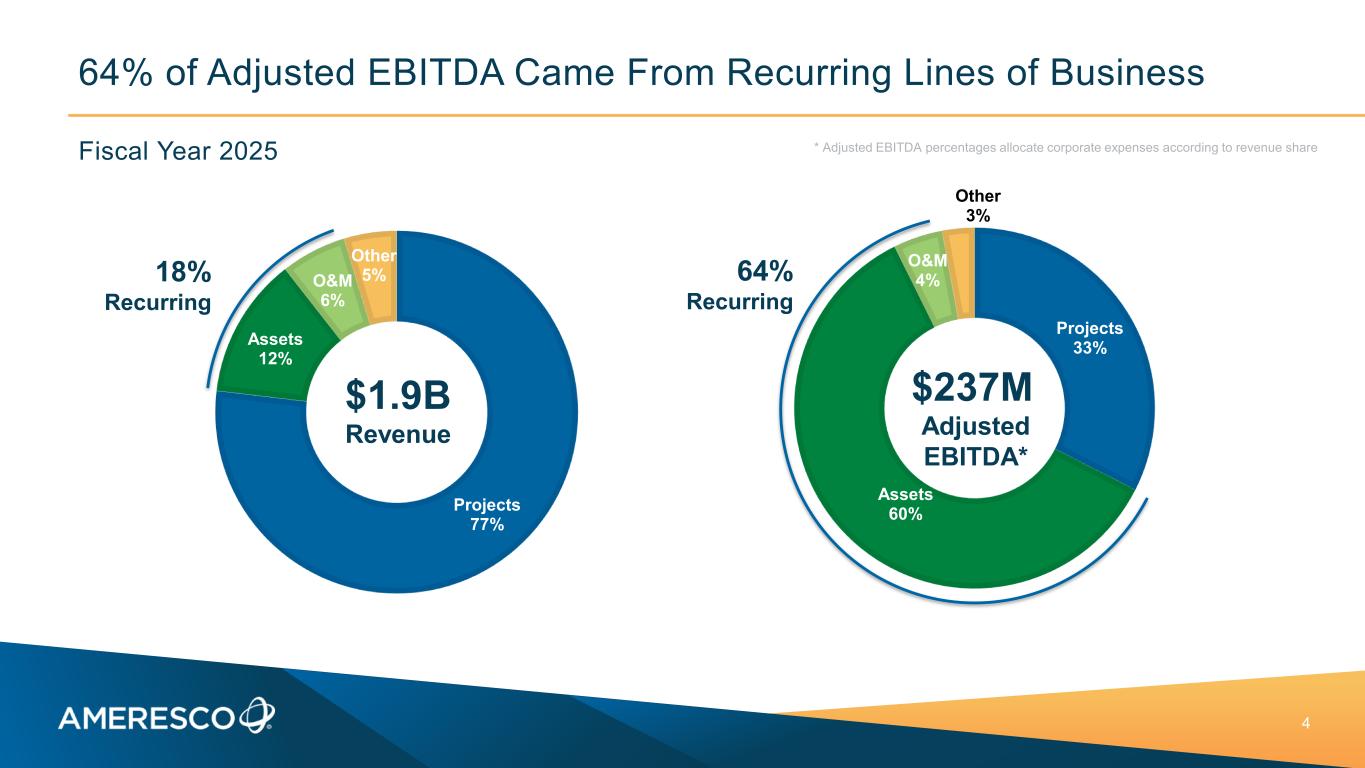
| Adjusted EBITDA | $ | 77,026 | $ | 142,774 | $ | 10,537 | $ | 6,856 | $ | 237,193 | |||||||
| Adjusted EBITDA margin | 5.2 | % | 58.8 | % | 9.3 | % | 7.5 | % | 12.3 | % | |||||||
| Year Ended December 31, 2024 | |||||||||||||||||
| Adjusted EBITDA: | Projects | Energy Assets | O&M | Other | Consolidated | ||||||||||||
| Net income attributable to common shareholders | $ | 1,779 | $ | 13,981 | $ | 12,252 | $ | 28,745 | $ | 56,757 | |||||||
| Impact from redeemable non-controlling interests | — | (3,766) | — | — | (3,766) | ||||||||||||
| (Less) plus: Income tax (benefit) provision | 1,762 | (34,170) | 588 | 11,820 | (20,000) | ||||||||||||
| Plus: Other expenses, net | 25,235 | 45,715 | 1,511 | 2,344 | 74,805 | ||||||||||||
| Plus: Depreciation and amortization | 3,929 | 80,849 | 1,232 | 3,201 | 89,211 | ||||||||||||
| Plus: Stock-based compensation | 10,687 | 1,703 | 850 | 890 | 14,130 | ||||||||||||
| Plus: Energy asset and goodwill impairment charges | — | 12,384 | — | — | 12,384 | ||||||||||||
| Plus: Contingent consideration, restructuring and other charges | 1,162 | 116 | 19 | 523 | 1,820 | ||||||||||||
| Adjusted EBITDA | $ | 44,554 | $ | 116,812 | $ | 16,452 | $ | 47,523 | $ | 225,341 | |||||||
| Adjusted EBITDA margin | 3.3 | % | 54.8 | % | 15.5 | % | 42.6 | % | 12.7 | % | |||||||
| Three Months Ended December 31, | Year Ended December 31, | |||||||||||||
| 2025 | 2024 | 2025 | 2024 | |||||||||||
| Non-GAAP net income and EPS: | ||||||||||||||
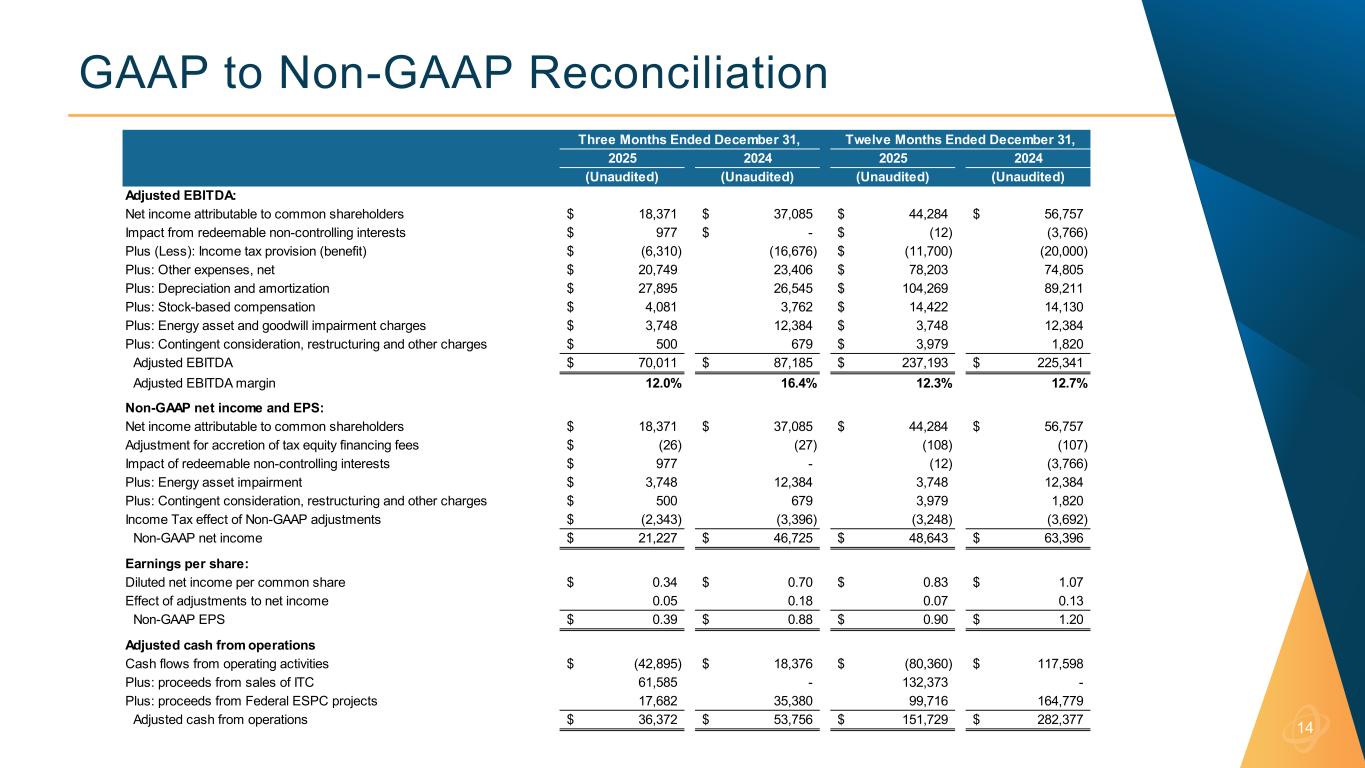
| Net income attributable to common shareholders | $ | 18,371 | $ | 37,085 | $ | 44,284 | $ | 56,757 | ||||||
| Adjustment for accretion of tax equity financing fees | (26) | (27) | (108) | (107) | ||||||||||
| Impact from redeemable non-controlling interests | 977 | — | (12) | (3,766) | ||||||||||
| Plus: Energy asset impairment | 3,748 | 12,384 | 3,748 | 12,384 | ||||||||||
| Plus: Contingent consideration, restructuring and other charges | 500 | 679 | 3,979 | 1,820 | ||||||||||
| Income tax effect of Non-GAAP adjustments | (2,343) | (3,396) | (3,248) | (3,692) | ||||||||||
| Non-GAAP net income | $ | 21,227 | $ | 46,725 | $ | 48,643 | $ | 63,396 | ||||||
| Diluted net income per common share | $ | 0.34 | $ | 0.70 | $ | 0.83 | $ | 1.07 | ||||||
| Effect of adjustments to net income | 0.05 | 0.18 | 0.07 | 0.13 | ||||||||||
| Non-GAAP EPS | $ | 0.39 | $ | 0.88 | $ | 0.90 | $ | 1.20 | ||||||
| Adjusted cash from operations: | ||||||||||||||
| Cash flows from operating activities | $ | (42,895) | $ | 18,376 | $ | (80,360) | $ | 117,598 | ||||||
| Plus: proceeds from sales of ITC | 61,585 | — | 132,373 | — | ||||||||||
| Plus: proceeds from Federal ESPC projects | 17,682 | 35,380 | 99,716 | 164,779 | ||||||||||
| Adjusted cash from operations | $ | 36,372 | $ | 53,756 | $ | 151,729 | $ | 282,377 | ||||||
Non-GAAP Financial Guidance
| Adjusted earnings before interest, taxes, depreciation and amortization (adjusted EBITDA): | ||||||||
Year Ended December 31, 2026 | ||||||||
| Low | High | |||||||
Operating income (1) | $161 million | $189 million | ||||||
| Depreciation and amortization | $115 million | $116 million | ||||||
| Stock-based compensation | $14 million | $15 million | ||||||
| Income attributable to non-controlling interest | $(20) million | $(25) million | ||||||
| Adjusted EBITDA | $270 million | $295 million | ||||||
(1) Although net income is the most directly comparable GAAP measure, this table reconciles adjusted EBITDA to operating income because we are not able to calculate forward-looking net income without unreasonable efforts due to significant uncertainties with respect to the impact of accounting for our redeemable non-controlling interests and taxes.
Exhibit A: Non-GAAP Financial Measures
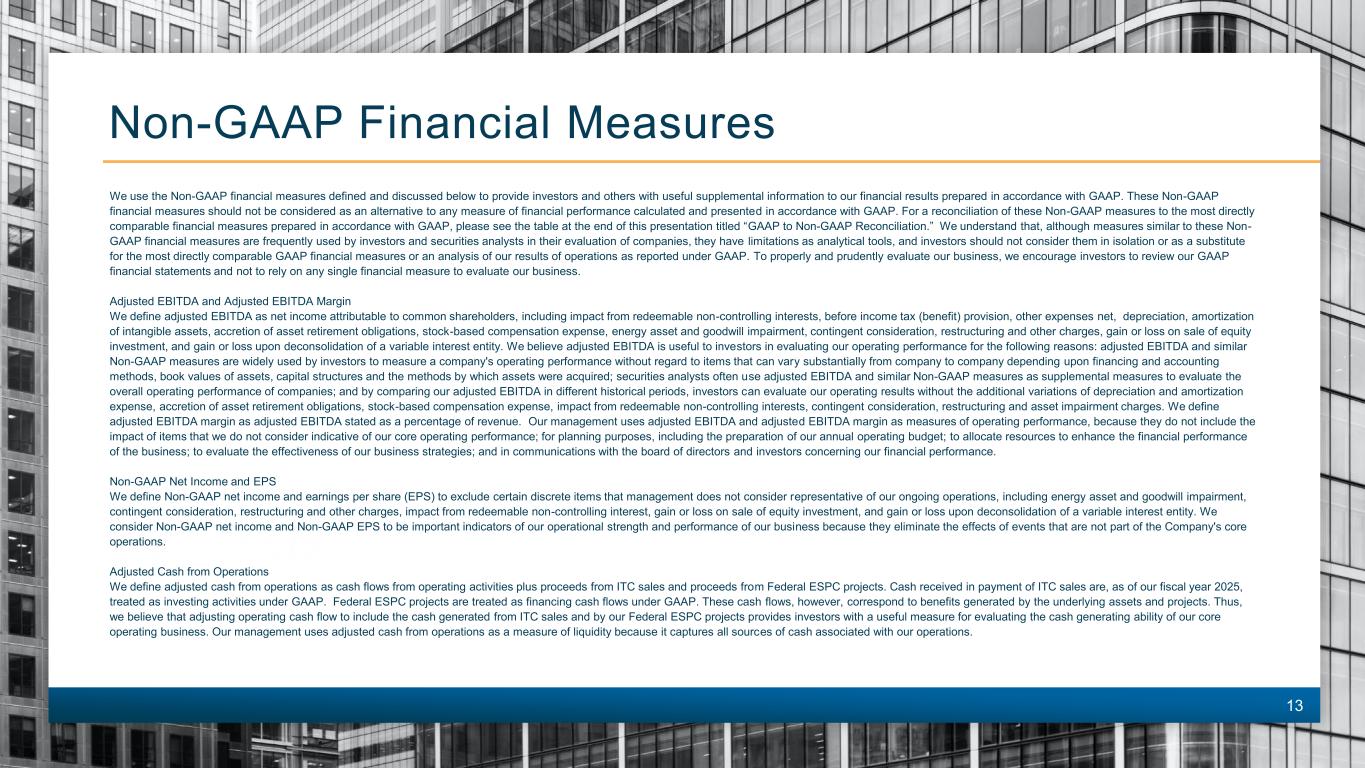
We use the Non-GAAP financial measures defined and discussed below to provide investors and others with useful supplemental information to our financial results prepared in accordance with GAAP. These Non-GAAP financial measures should not be considered as an alternative to any measure of financial performance calculated and presented in accordance with GAAP. For a reconciliation of these Non-GAAP measures to the most directly comparable financial measures prepared in accordance with GAAP, please see Non-GAAP Financial Measures and Non-GAAP Financial Guidance in the tables above.
We understand that, although measures similar to these Non-GAAP financial measures are frequently used by investors and securities analysts in their evaluation of companies, they have limitations as analytical tools, and investors should not consider them in isolation or as a substitute for the most directly comparable GAAP financial measures or an analysis of our results of operations as reported under GAAP. To properly and prudently evaluate our business, we encourage investors to review our GAAP financial statements included above, and not to rely on any single financial measure to evaluate our business.
Adjusted EBITDA and Adjusted EBITDA Margin
We define adjusted EBITDA as net income attributable to common shareholders, including impact from redeemable non-controlling interests, before income tax (benefit) provision, other expenses net, depreciation, amortization of intangible assets, accretion of asset retirement obligations, stock-based compensation expense, energy asset and goodwill impairment, contingent consideration, restructuring and other charges, gain or loss on sale of equity investment, and gain or loss upon deconsolidation of a variable interest entity. We believe adjusted EBITDA is useful to investors in evaluating our operating performance for the following reasons: adjusted EBITDA and similar Non-GAAP measures are widely used by investors to measure a company's operating performance without regard to items that can vary substantially from company to company depending upon financing and accounting methods, book values of assets, capital structures and the methods by which assets were acquired; securities analysts often use adjusted EBITDA and similar Non-GAAP measures as supplemental measures to evaluate the overall operating performance of companies; and by comparing our adjusted
EBITDA in different historical periods, investors can evaluate our operating results without the additional variations of depreciation and amortization expense, accretion of asset retirement obligations, stock-based compensation expense, impact from redeemable non-controlling interests, contingent consideration, restructuring and asset impairment charges. We define adjusted EBITDA margin as adjusted EBITDA stated as a percentage of revenue.
Our management uses adjusted EBITDA and adjusted EBITDA margin as measures of operating performance, because they do not include the impact of items that we do not consider indicative of our core operating performance; for planning purposes, including the preparation of our annual operating budget; to allocate resources to enhance the financial performance of the business; to evaluate the effectiveness of our business strategies; and in communications with the board of directors and investors concerning our financial performance.
Non-GAAP Net Income and EPS
We define Non-GAAP net income and earnings per share (EPS) to exclude certain discrete items that management does not consider representative of our ongoing operations, including energy asset and goodwill impairment, contingent consideration, restructuring and other charges, impact from redeemable non-controlling interest, gain or loss on sale of equity investment, and gain or loss upon deconsolidation of a variable interest entity. We consider Non-GAAP net income and Non-GAAP EPS to be important indicators of our operational strength and performance of our business because they eliminate the effects of events that are not part of the Company's core operations.
Adjusted Cash from Operations
We define adjusted cash from operations as cash flows from operating activities plus proceeds from ITC sales and proceeds from Federal ESPC projects. Cash received in payment of ITC sales are, as of our fiscal year 2025, treated as investing activities under GAAP. Federal ESPC projects are treated as financing cash flows under GAAP. These cash flows, however, correspond to benefits generated by the underlying assets and projects. Thus, we believe that adjusting operating cash flow to include the cash generated from ITC sales and by our Federal ESPC projects provides investors with a useful measure for evaluating the cash generating ability of our core operating business. Our management uses adjusted cash from operations as a measure of liquidity because it captures all sources of cash associated with our operations.
© 2025 Ameresco, Inc. All rights reserved. ameresco.com Q4 2025 Supplemental Information March 2, 2026
2 Safe Harbor Forward Looking Statements Any statements in this presentation about future expectations, plans and prospects for Ameresco, Inc., including statements about market conditions, pipeline, visibility, backlog, pending agreements, new and expanding market opportunities, financial guidance including estimated future revenues, net income, adjusted EBITDA, Non-GAAP EPS, gross margin, effective tax rate, interest rate, depreciation, tax attributes and capital investments, as well as statements about our financing plans, the impact of the OBBB Act, other policies and regulatory changes, supply chain disruptions, shortage and cost of materials and labor, other macroeconomic and geopolitical challenges,; our expectations related to our agreement with SCE including the impact of delays and any requirement to pay liquidated damages, and other statements containing the words “projects,” “believes,” “anticipates,” “plans,” “expects,” “will” and simi lar expressions, constitute forward-looking statements within the meaning of The Private Securities Litigation Reform Act of 1995. Actual results may differ materially from those indicated by such forward looking statements as a result of various important factors, including: demand for our energy efficiency and renewable energy solutions; the timing of, and ability to, enter into contracts for awarded projects on the terms proposed or at all; the timing of work we do on projects where we recognize revenue on a percentage of completion basis; the ability to perform under signed contracts without delay and in accordance with their terms and the potential for liquidated and other damages we may be subject to; the fiscal health of the government and the impact of a prolonged government shutdown and reductions in the federal workforce; our ability to complete and operate our projects on a profitable basis and as committed to our customers; our cash flows from operations and our ability to arrange financing to fund our operations and projects; our customers’ ability to finance their projects and credit risk from our customers; our ability to comply with covenants in our existing debt agreements; the impact of macroeconomic challenges, weather related events and climate change; our reliance on third parties for our construction and installation work; availability and cost of labor and equipment particularly given global supply chain challenges, tariffs and global trade conflicts; global supply chain challenges, component shortages and inflationary pressures; changes in federal, state and local government policies and programs related to energy efficiency and renewable energy; the ability of customers to cancel or defer contracts included in our backlog; the output and performance of our energy plants and energy projects; cybersecurity incidents and breaches; regulatory and other risks inherent to constructing and operating energy assets; the effects of our acquisitions and joint ventures; seasonality in construction and in demand for our products and services; a customer’s decision to delay our work on, or other risks involved with, a particular project; the addition of new customers or the loss of existing customers; market price of our Class A Common stock prevailing from time to time; the nature of other investment opportunities presented to our Company from time to time; risks related to our international operation and international growth strategy; and other factors discussed in our most recent Annual Report on Form 10-K and our quarterly reports on Form 10-Q. The forward-looking statements included in this presentation represent our views as of the date of this presentation. We anticipate that subsequent events and developments will cause our views to change. However, while we may elect to update these forward-looking statements at some point in the future, we specifically disclaim any obligation to do so. These forward-looking statements should not be relied upon as representing our views as of any date subsequent to the date of this presentation. Use of Non-GAAP Financial Measures This presentation and the accompanying tables include references to adjusted EBITDA, Non-GAAP EPS, Non-GAAP net income and adjusted cash from operations, which are Non-GAAP financial measures. For a description of these Non-GAAP financial measures, including the reasons management uses these measures, please see the section in the back of this presentation titled “Non-GAAP Financial Measures”. For a reconciliation of these Non-GAAP financial measures to the most directly comparable financial measures prepared in accordance with GAAP, please see the table at the end of this presentation titled “GAAP to Non-GAAP Reconciliation.”
Sources of Revenue – Q4 2025 3 Projects Energy efficiency and renewable energy projects Recurring Energy & incentive revenue from owned energy assets; plus recurring O&M from projects Other Services, software and integrated PV $465.9M $90.2M $24.9M
Projects 77% Assets 12% O&M 6% Other 5% $1.9B Revenue Projects 33% Assets 60% O&M 4% Other 3% $237M Adjusted EBITDA* 64% of Adjusted EBITDA Came From Recurring Lines of Business 4 * Adjusted EBITDA percentages allocate corporate expenses according to revenue shareFiscal Year 2025 64% Recurring 18% Recurring
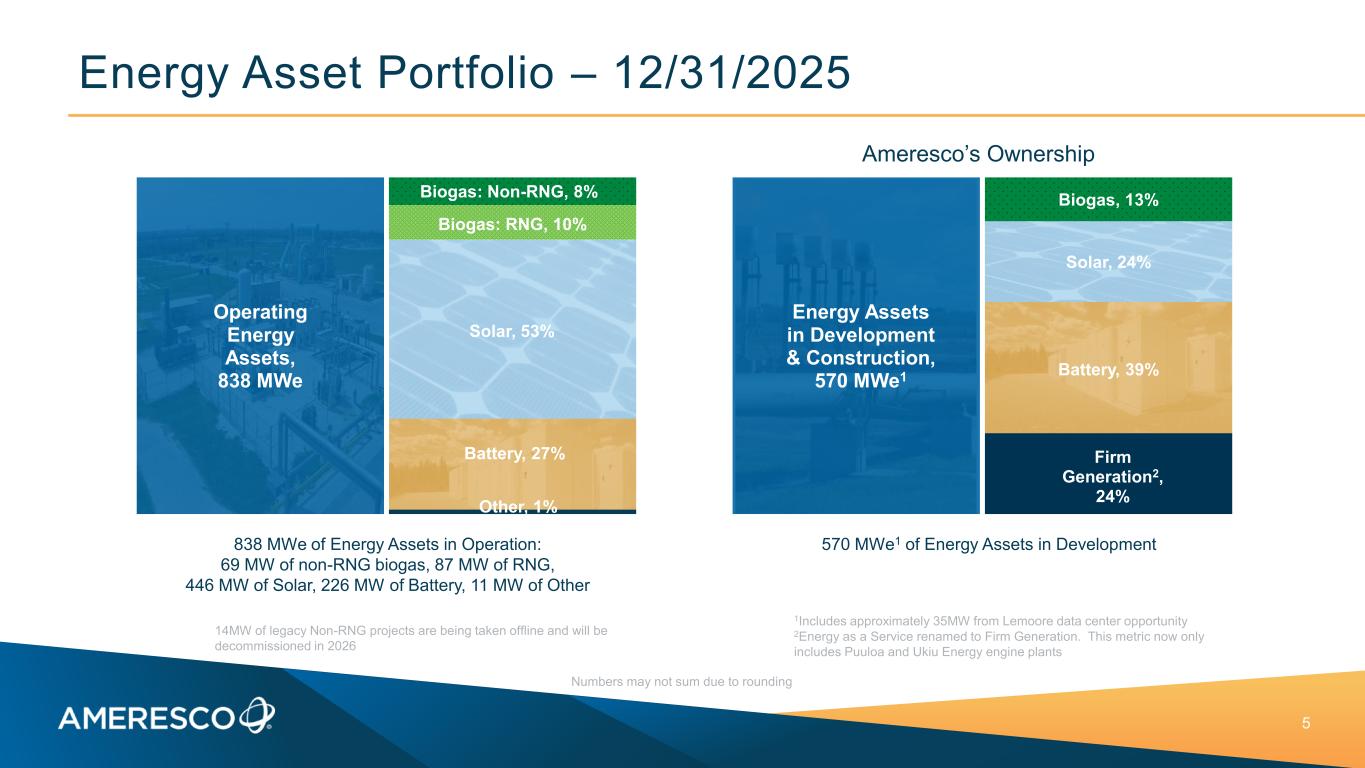
Energy Asset Portfolio – 12/31/2025 5 838 MWe of Energy Assets in Operation: 69 MW of non-RNG biogas, 87 MW of RNG, 446 MW of Solar, 226 MW of Battery, 11 MW of Other 570 MWe1 of Energy Assets in Development Operating Energy Assets, 838 MWe Other, 1% Battery, 27% Solar, 53% Biogas: RNG, 10% Biogas: Non-RNG, 8% Energy Assets in Development & Construction, 570 MWe1 Firm Generation2, 24% Battery, 39% Solar, 24% Biogas, 13% Numbers may not sum due to rounding Ameresco’s Ownership 1Includes approximately 35MW from Lemoore data center opportunity 2Energy as a Service renamed to Firm Generation. This metric now only includes Puuloa and Ukiu Energy engine plants 14MW of legacy Non-RNG projects are being taken offline and will be decommissioned in 2026
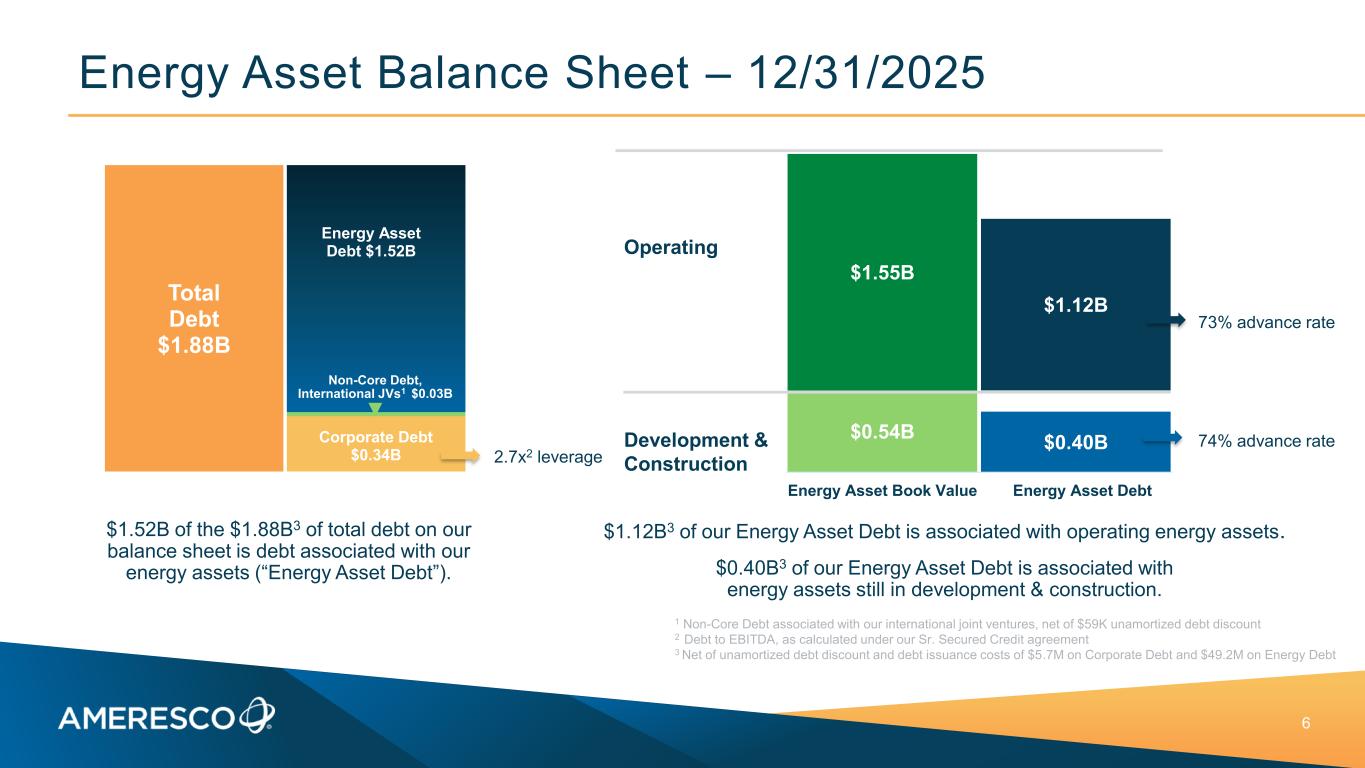
Energy Asset Balance Sheet – 12/31/2025 6 1 Non-Core Debt associated with our international joint ventures, net of $59K unamortized debt discount 2 Debt to EBITDA, as calculated under our Sr. Secured Credit agreement 3 Net of unamortized debt discount and debt issuance costs of $5.7M on Corporate Debt and $49.2M on Energy Debt $1.12B3 of our Energy Asset Debt is associated with operating energy assets. $0.40B3 of our Energy Asset Debt is associated with energy assets still in development & construction. $1.52B of the $1.88B3 of total debt on our balance sheet is debt associated with our energy assets (“Energy Asset Debt”). Total Debt $1.88B Corporate Debt $0.34B Non-Core Debt, International JVs1 $0.03B ▼ Energy Asset Debt $1.52B 2.7x2 leverage $0.54B $0.40B $1.55B $1.12B Energy Asset Book Value Energy Asset Debt 73% advance rate Operating Development & Construction 74% advance rate
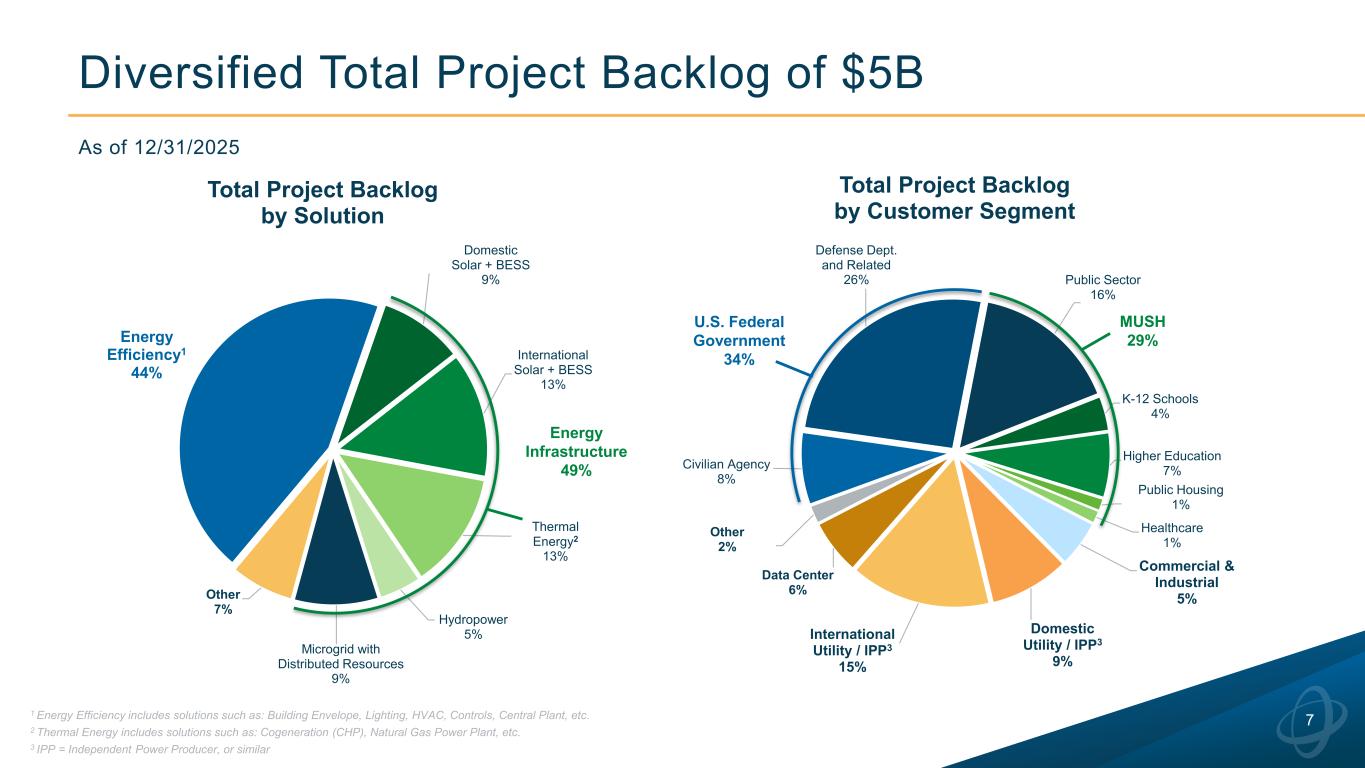
Energy Efficiency1 44% Domestic Solar + BESS 9% International Solar + BESS 13% Thermal Energy2 13% Hydropower 5% Microgrid with Distributed Resources 9% Other 7% Total Project Backlog by Solution Energy Infrastructure 49% Diversified Total Project Backlog of $5B 7 As of 12/31/2025 1 Energy Efficiency includes solutions such as: Building Envelope, Lighting, HVAC, Controls, Central Plant, etc. 2 Thermal Energy includes solutions such as: Cogeneration (CHP), Natural Gas Power Plant, etc. 3 IPP = Independent Power Producer, or similar Civilian Agency 8% Defense Dept. and Related 26% Public Sector 16% K-12 Schools 4% Higher Education 7% Public Housing 1% Healthcare 1% Commercial & Industrial 5% Domestic Utility / IPP3 9% International Utility / IPP3 15% Data Center 6% Other 2% Total Project Backlog by Customer Segment U.S. Federal Government 34% MUSH 29%
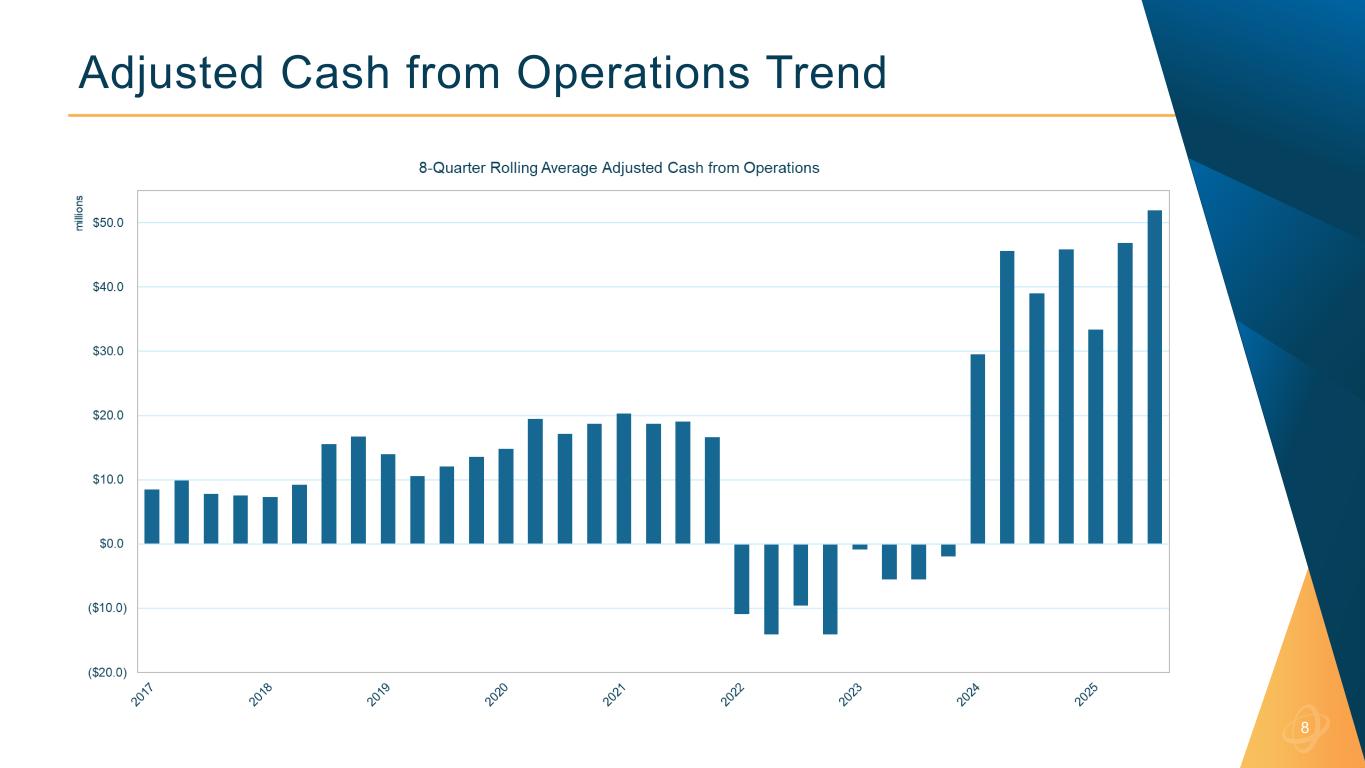
Adjusted Cash from Operations Trend 8
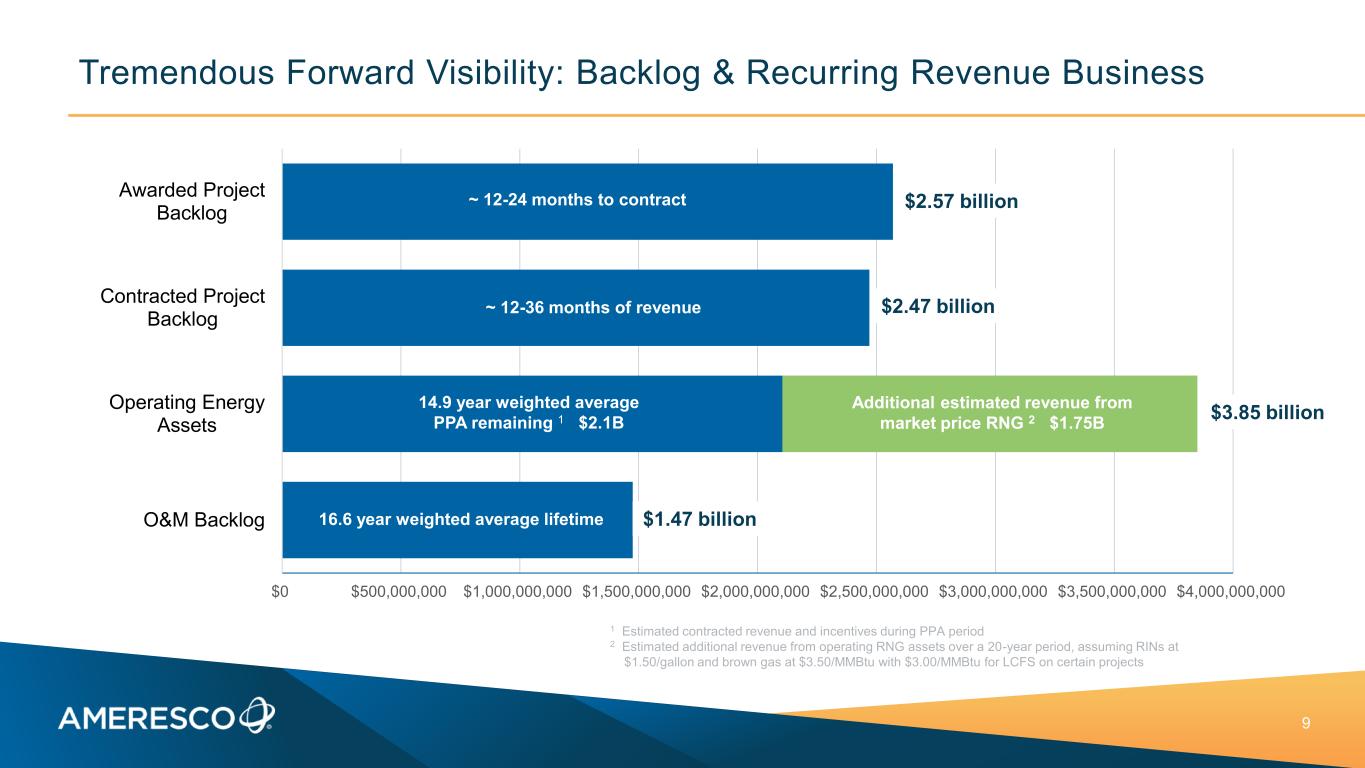
$0 $500,000,000 $1,000,000,000 $1,500,000,000 $2,000,000,000 $2,500,000,000 $3,000,000,000 $3,500,000,000 $4,000,000,000 Awarded Project Backlog Contracted Project Backlog Operating Energy Assets O&M Backlog Tremendous Forward Visibility: Backlog & Recurring Revenue Business 9 $2.47 billion $3.85 billion ~ 12-24 months to contract ~ 12-36 months of revenue 16.6 year weighted average lifetime $2.57 billion $1.47 billion 14.9 year weighted average PPA remaining 1 $2.1B Additional estimated revenue from market price RNG 2 $1.75B 1 Estimated contracted revenue and incentives during PPA period 2 Estimated additional revenue from operating RNG assets over a 20-year period, assuming RINs at $1.50/gallon and brown gas at $3.50/MMBtu with $3.00/MMBtu for LCFS on certain projects
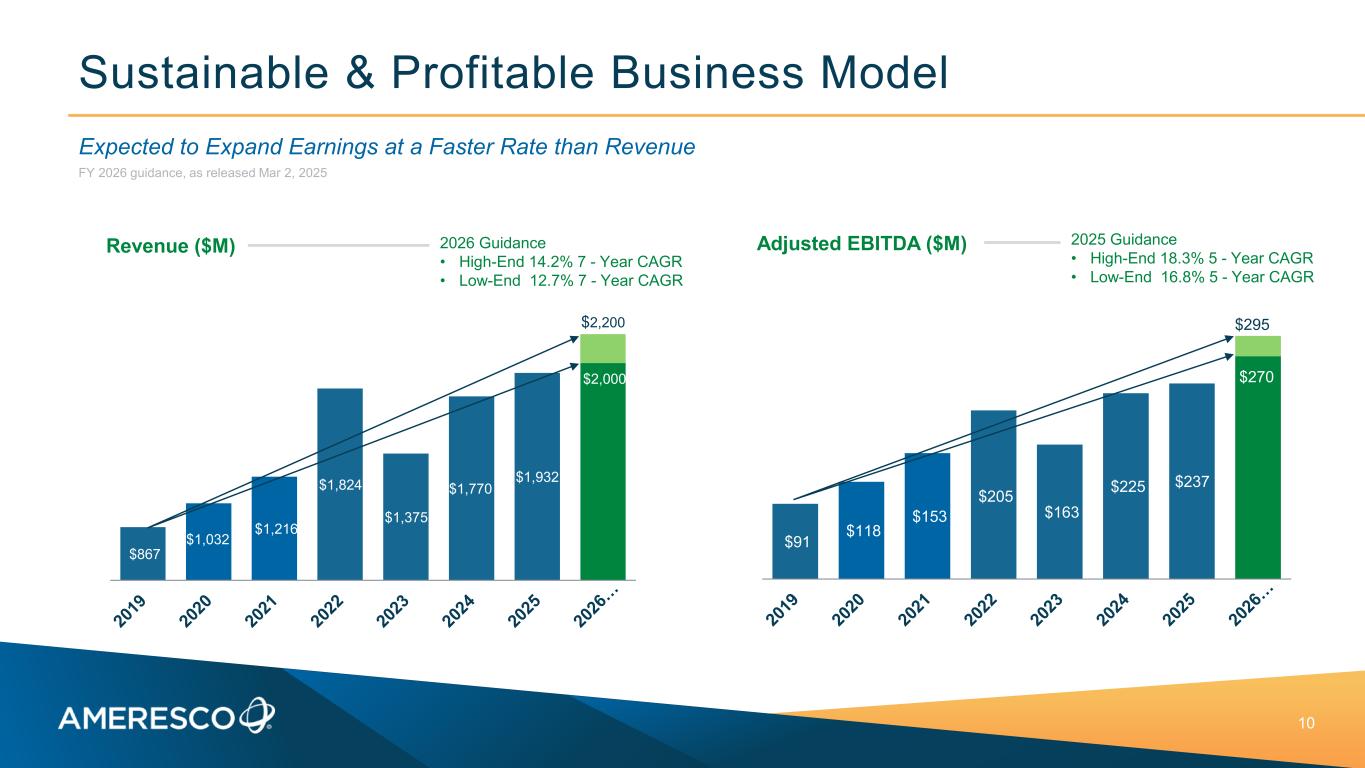
Sustainable & Profitable Business Model 10 Expected to Expand Earnings at a Faster Rate than Revenue FY 2026 guidance, as released Mar 2, 2025 Revenue ($M) $867 $1,032 $1,216 $1,824 $1,375 $1,770 $1,932 $2,000 $2,200 2026 Guidance • High-End 14.2% 7 - Year CAGR • Low-End 12.7% 7 - Year CAGR $91 $118 $153 $205 $163 $225 $237 $270 Adjusted EBITDA ($M) $295 2025 Guidance • High-End 18.3% 5 - Year CAGR • Low-End 16.8% 5 - Year CAGR
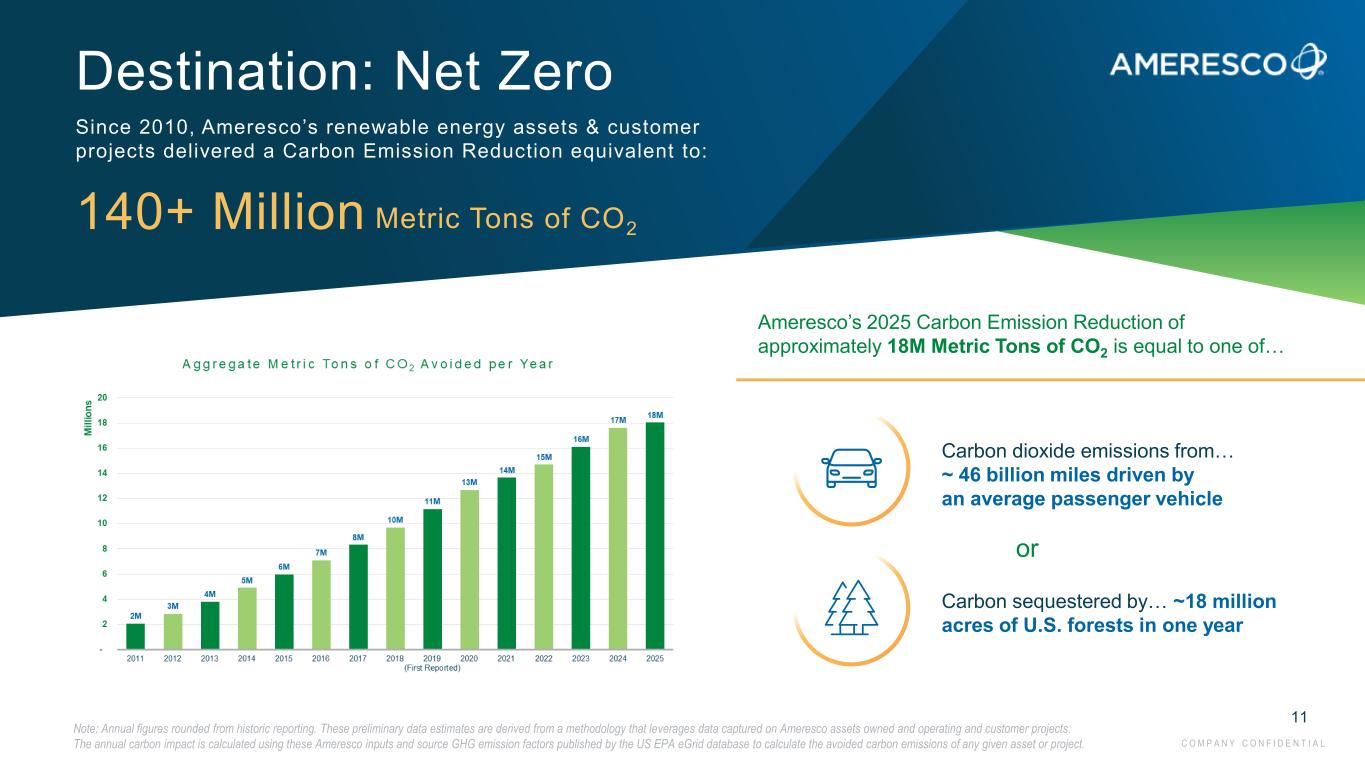
Destination: Net Zero Since 2010, Ameresco’s renewable energy assets & customer projects delivered a Carbon Emission Reduction equivalent to: 140+ Million Metric Tons of CO2 11 Carbon dioxide emissions from… ~ 46 billion miles driven by an average passenger vehicle Carbon sequestered by… ~18 million acres of U.S. forests in one year or Ameresco’s 2025 Carbon Emission Reduction of approximately 18M Metric Tons of CO2 is equal to one of… Note: Annual figures rounded from historic reporting. These preliminary data estimates are derived from a methodology that leverages data captured on Ameresco assets owned and operating and customer projects. The annual carbon impact is calculated using these Ameresco inputs and source GHG emission factors published by the US EPA eGrid database to calculate the avoided carbon emissions of any given asset or project. C O M P A N Y C O N F I D E N T I A L 11
ameresco.com © 2025 Ameresco, Inc. All rights reserved. to Our Customers, Employees, and Shareholders Thank You
13 Non-GAAP Financial Measures We use the Non-GAAP financial measures defined and discussed below to provide investors and others with useful supplemental information to our financial results prepared in accordance with GAAP. These Non-GAAP financial measures should not be considered as an alternative to any measure of financial performance calculated and presented in accordance with GAAP. For a reconciliation of these Non-GAAP measures to the most directly comparable financial measures prepared in accordance with GAAP, please see the table at the end of this presentation titled “GAAP to Non-GAAP Reconciliation.” We understand that, although measures similar to these Non- GAAP financial measures are frequently used by investors and securities analysts in their evaluation of companies, they have limitations as analytical tools, and investors should not consider them in isolation or as a substitute for the most directly comparable GAAP financial measures or an analysis of our results of operations as reported under GAAP. To properly and prudently evaluate our business, we encourage investors to review our GAAP financial statements and not to rely on any single financial measure to evaluate our business. Adjusted EBITDA and Adjusted EBITDA Margin We define adjusted EBITDA as net income attributable to common shareholders, including impact from redeemable non-controlling interests, before income tax (benefit) provision, other expenses net, depreciation, amortization of intangible assets, accretion of asset retirement obligations, stock-based compensation expense, energy asset and goodwill impairment, contingent consideration, restructuring and other charges, gain or loss on sale of equity investment, and gain or loss upon deconsolidation of a variable interest entity. We believe adjusted EBITDA is useful to investors in evaluating our operating performance for the following reasons: adjusted EBITDA and similar Non-GAAP measures are widely used by investors to measure a company's operating performance without regard to items that can vary substantially from company to company depending upon financing and accounting methods, book values of assets, capital structures and the methods by which assets were acquired; securities analysts often use adjusted EBITDA and similar Non-GAAP measures as supplemental measures to evaluate the overall operating performance of companies; and by comparing our adjusted EBITDA in different historical periods, investors can evaluate our operating results without the additional variations of depreciation and amortization expense, accretion of asset retirement obligations, stock-based compensation expense, impact from redeemable non-controlling interests, contingent consideration, restructuring and asset impairment charges. We define adjusted EBITDA margin as adjusted EBITDA stated as a percentage of revenue. Our management uses adjusted EBITDA and adjusted EBITDA margin as measures of operating performance, because they do not include the impact of items that we do not consider indicative of our core operating performance; for planning purposes, including the preparation of our annual operating budget; to allocate resources to enhance the financial performance of the business; to evaluate the effectiveness of our business strategies; and in communications with the board of directors and investors concerning our financial performance. Non-GAAP Net Income and EPS We define Non-GAAP net income and earnings per share (EPS) to exclude certain discrete items that management does not consider representative of our ongoing operations, including energy asset and goodwill impairment, contingent consideration, restructuring and other charges, impact from redeemable non-controlling interest, gain or loss on sale of equity investment, and gain or loss upon deconsolidation of a variable interest entity. We consider Non-GAAP net income and Non-GAAP EPS to be important indicators of our operational strength and performance of our business because they eliminate the effects of events that are not part of the Company's core operations. Adjusted Cash from Operations We define adjusted cash from operations as cash flows from operating activities plus proceeds from ITC sales and proceeds from Federal ESPC projects. Cash received in payment of ITC sales are, as of our fiscal year 2025, treated as investing activities under GAAP. Federal ESPC projects are treated as financing cash flows under GAAP. These cash flows, however, correspond to benefits generated by the underlying assets and projects. Thus, we believe that adjusting operating cash flow to include the cash generated from ITC sales and by our Federal ESPC projects provides investors with a useful measure for evaluating the cash generating ability of our core operating business. Our management uses adjusted cash from operations as a measure of liquidity because it captures all sources of cash associated with our operations.
GAAP to Non-GAAP Reconciliation 14 (Unaudited) (Unaudited) (Unaudited) (Unaudited) Adjusted EBITDA: Net income attributable to common shareholders 18,371$ 37,085$ 44,284$ 56,757$ Impact from redeemable non-controlling interests 977$ -$ (12)$ (3,766) Plus (Less): Income tax provision (benefit) (6,310)$ (16,676) (11,700)$ (20,000) Plus: Other expenses, net 20,749$ 23,406 78,203$ 74,805 Plus: Depreciation and amortization 27,895$ 26,545 104,269$ 89,211 Plus: Stock-based compensation 4,081$ 3,762 14,422$ 14,130 Plus: Energy asset and goodwill impairment charges 3,748$ 12,384 3,748$ 12,384 Plus: Contingent consideration, restructuring and other charges 500$ 679 3,979$ 1,820 Adjusted EBITDA 70,011$ 87,185$ 237,193$ 225,341$ Adjusted EBITDA margin 12.0% 16.4% 12.3% 12.7% Non-GAAP net income and EPS: Net income attributable to common shareholders 18,371$ 37,085$ 44,284$ 56,757$ Adjustment for accretion of tax equity financing fees (26)$ (27) (108) (107) Impact of redeemable non-controlling interests 977$ - (12) (3,766) Plus: Energy asset impairment 3,748$ 12,384 3,748 12,384 Plus: Contingent consideration, restructuring and other charges 500$ 679 3,979 1,820 Income Tax effect of Non-GAAP adjustments (2,343)$ (3,396) (3,248) (3,692) Non-GAAP net income 21,227$ 46,725$ 48,643$ 63,396$ Earnings per share: Diluted net income per common share 0.34$ 0.70$ 0.83$ 1.07$ Effect of adjustments to net income 0.05 0.18 0.07 0.13 Non-GAAP EPS 0.39$ 0.88$ 0.90$ 1.20$ Adjusted cash from operations Cash flows from operating activities (42,895)$ 18,376$ (80,360)$ 117,598$ Plus: proceeds from sales of ITC 61,585 - 132,373 - Plus: proceeds from Federal ESPC projects 17,682 35,380 99,716 164,779 Adjusted cash from operations 36,372$ 53,756$ 151,729$ 282,377$ 2025 2024 2025 2024 Twelve Months Ended December 31,Three Months Ended December 31,
GAAP to Non-GAAP Reconciliation (continued) 15 * Adjusted EBITDA by Line of Business includes corporate expenses allocated according to revenue share $000 USD Projects Operating Assets O&M Other Consolidated Adjusted EBITDA: Net income attributable to common shareholders 29,581$ 4,934$ 6,610$ 3,159$ 44,284$ Impact from redeemable non-controlling interests 1,139$ (1,151)$ -$ -$ (12)$ Plus (less): Income tax provision (benefit) 3,969$ (16,596)$ 514$ 413$ (11,700)$ Plus: Other expenses, net 23,961$ 50,765$ 1,514$ 1,963$ 78,203$ Plus: Depreciation and amortization 3,749$ 98,865$ 1,033$ 622$ 104,269$ Plus: Stock-based compensation 11,087$ 1,813$ 844$ 678$ 14,422$ Plus: Energy asset impairment charges -$ 3,748$ -$ -$ 3,748$ Plus: Contingent consideration, restructuring and other charges 3,540$ 396$ 22$ 21$ 3,979$ Adjusted EBITDA 77,026$ 142,774$ 10,537$ 6,856$ 237,193$ Adjusted EBITDA margin 5.2% 58.8% 9.3% 7.5% 12.3% Twelve Months Ended December 31, 2025
GAAP to Non-GAAP Reconciliation (continued) 16 1 Starting in 2025, proceeds from the sale of transferable ITCs are classified as investing activities in accordance with recent interpretations under US GAAP. These amounts are added back to non-GAAP Adjusted Cash from Operations to support period-over-period comparability. 1 1 ($ in Thousands) 2016 2017 2018 2019 2020 Q1 Q2 Q3 Q4 Q1 Q2 Q3 Q4 Q1 Q2 Q3 Q4 Q1 Q2 Q3 Q4 Q1 Q2 Q3 Q4 Cash Flow from Operations (15,069) (24,653) (7,654) (10,696) (31,786) (19,633) (39,337) (45,803) (37,071) (20,066) 25,097 (21,160) (58,094) (51,160) (11,471) (75,568) (51,640) (21,955) (10,193) (18,796) Proceeds from sales of ITC1 Proceeds from Federal ESPC projects 16,385 22,374 26,316 24,964 35,167 38,869 48,303 42,673 36,582 33,082 43,906 44,667 39,598 43,189 32,769 83,802 61,198 72,402 60,987 54,331 Adjusted Cash from Operations 1,316 (2,279) 18,662 14,268 3,381 19,237 8,966 (3,130) (489) 13,016 69,003 23,506 (18,496) (7,971) 21,298 8,234 9,558 50,447 50,794 35,535 Rolling 8-quarter Adjusted Cash from Operations 9,412 7,372 9,595 7,550 8,481 9,888 7,845 7,553 7,327 9,239 15,531 16,686 13,952 10,551 12,092 13,513 14,769 19,447 17,171 18,675 ($ in Thousands) 2021 2022 2023 2024 2025 Q1 Q2 Q3 Q4 Q1 Q2 Q3 Q4 Q1 Q2 Q3 Q4 Q1 Q2 Q3 Q4 Q1 Q2 Q3 Q4 Cash Flow from Operations (38,724) (57,758) (19,862) (55,952) (276,122) (31,722) 34,674 (65,118) 58,772 (92,621) (6,572) (29,570) 20,817 53,314 25,091 18,376 (28,304) (26,874) 17,712 (42,895) Proceeds from sales of ITC1 70,788 61,585 Proceeds from Federal ESPC projects 33,520 36,640 44,026 45,031 64,788 56,943 52,134 64,495 42,309 34,390 30,604 47,040 19,580 100,550 9,269 35,380 29,731 5,689 46,619 17,682 Adjusted Cash from Operations (5,204) (21,118) 24,163 (10,921) (211,333) 25,220 86,808 (623) 101,081 (58,231) 24,032 17,469 40,397 153,864 34,360 53,756 1,427 49,603 64,331 36,372 Rolling 8-quarter Adjusted Cash from Operations 20,336 18,693 19,051 16,657 (10,955) (14,108) (9,606) (14,126) (840) (5,479) (5,496) (1,947) 29,519 45,600 39,044 45,841 33,384 46,864 51,901 54,264