ANF 8-K
Abercrombie & Fitch Co /De/ (ANF)
8-K
2023-08-24
For: 2023-08-23
View Original
Added on
April 11, 2026
UNITED STATES
SECURITIES AND EXCHANGE COMMISSION
Washington, D.C. 20549
FORM 8-K
CURRENT REPORT
Pursuant to Section 13 or 15(d) of the Securities Exchange Act of 1934
Date of Report (Date of earliest event reported): August 23, 2023
| (Exact name of registrant as specified in its charter) | ||
| (State or other jurisdiction of incorporation) | (Commission File Number) | (I.R.S. Employer Identification No.) | ||||||||||||||||||
| (Address of principal executive offices) | (Zip Code) | |||||||||||||||||||
| Registrant’s telephone number, including area code: | ||||||||||||||||||||
| Not Applicable | ||
| (Former name or former address, if changed since last report) | ||
Check the appropriate box below if the Form 8-K filing is intended to simultaneously satisfy the filing obligation of the registrant under any of the following provisions:
Securities registered pursuant to Section 12(b) of the Act:
| Title of each class | Trading symbol(s) | Name of each exchange on which registered | ||||||||||||
Indicate by check mark whether the registrant is an emerging growth company as defined in Rule 405 of the Securities Act of 1933 (§230.405 of this chapter) or Rule 12b-2 of the Securities Exchange Act of 1934 (§240.12b-2 of this chapter).
Emerging growth company ☐
If an emerging growth company, indicate by check mark if the registrant has elected not to use the extended transition period for complying with any new or revised financial accounting standards provided pursuant to Section 13(a) of the Exchange Act. ☐
Item 2.02. Results of Operations and Financial Condition.
On August 23, 2023, Abercrombie & Fitch Co. (the “Company”) issued a news release (the “Release”) reporting the Company’s unaudited financial results for the second quarter ended July 29, 2023. A copy of the Release is included as Exhibit 99.1 to this Current Report on Form 8-K and is incorporated herein by reference.
In conjunction with the Release, the Company also made available additional unaudited quarterly financial information for the first quarter ended April 29, 2023, the second quarter ended July 29, 2023, and for each of the quarters in the fiscal year ended January 28, 2023. The Company also made available additional unaudited financial information for the fiscal years ended January 28, 2023, January 29, 2022, January 30, 2021, and February 1, 2020. The additional financial information is included as Exhibit 99.2 to this Current Report on Form 8-K and is incorporated herein by reference.
In conjunction with the Release, the Company also made available an investor presentation of results for the second quarter ended July 29, 2023. The presentation, which is available under the “Investors” section of the Company’s website, located at corporate.abercrombie.com, is included as Exhibit 99.3 to this Current Report on Form 8-K and is incorporated herein by reference. Information on the Company’s website is not, and will not be deemed to be, a part of this Current Report on Form 8-K or incorporated into any other filings the Company may make with the Securities and Exchange Commission.
The Company’s management conducted a conference call on August 23, 2023 to review the Company’s financial results for the second quarter ended July 29, 2023. A copy of the transcript of the conference call is included as Exhibit 99.4 to this Current Report on Form 8-K and is incorporated herein by reference.
The information in this Item 2.02, including the accompanying Exhibits, are being furnished and shall not be deemed “filed” for purposes of Section 18 of the Securities Exchange Act of 1934, as amended (the “Exchange Act”), or otherwise subject to the liabilities of that section and shall not be deemed to be incorporated by reference into any filing of the Company under the Securities Act of 1933, as amended, or the Exchange Act, except as expressly set forth by specific reference in such filing.
Item 9.01. Financial Statements and Exhibits.
(a) through (c) Not applicable
(d) Exhibits:
The following exhibits are included with this Current Report on Form 8-K:
| Exhibit No. | Description | |||||||
| 99.1 | ||||||||
| 99.2 | ||||||||
| 99.3 | ||||||||
| 99.4 | ||||||||
| 104 | Cover Page Interactive Data File (embedded within the Inline XBRL document) | |||||||
SIGNATURE
Pursuant to the requirements of the Securities Exchange Act of 1934, the registrant has duly caused this report to be signed on its behalf by the undersigned hereunto duly authorized.
| Abercrombie & Fitch Co. | |||||||||||
Dated: August 24, 2023 | By: | /s/ Scott D. Lipesky | |||||||||
| Scott D. Lipesky | |||||||||||
| Executive Vice President, Chief Financial Officer and Chief Operating Officer | |||||||||||
ABERCROMBIE & FITCH CO. REPORTS SECOND QUARTER RESULTS
•Company net sales growth of +16%, driven by Abercrombie brands +26% and Hollister brands +8%
•Operating margin of 9.6%, a significant expansion from approximately break even last year
•Inventory levels down 30% year-over-year with brands leveraging chase capabilities
•Company increases full year outlook ranges on sales and operating margin
New Albany, Ohio, August 23, 2023: Abercrombie & Fitch Co. (NYSE: ANF) today announced results for the second quarter ended July 29, 2023. These compare to results for the second quarter ended July 30, 2022. Descriptions of the use of non-GAAP financial measures and reconciliations of GAAP and non-GAAP financial measures accompany this release.
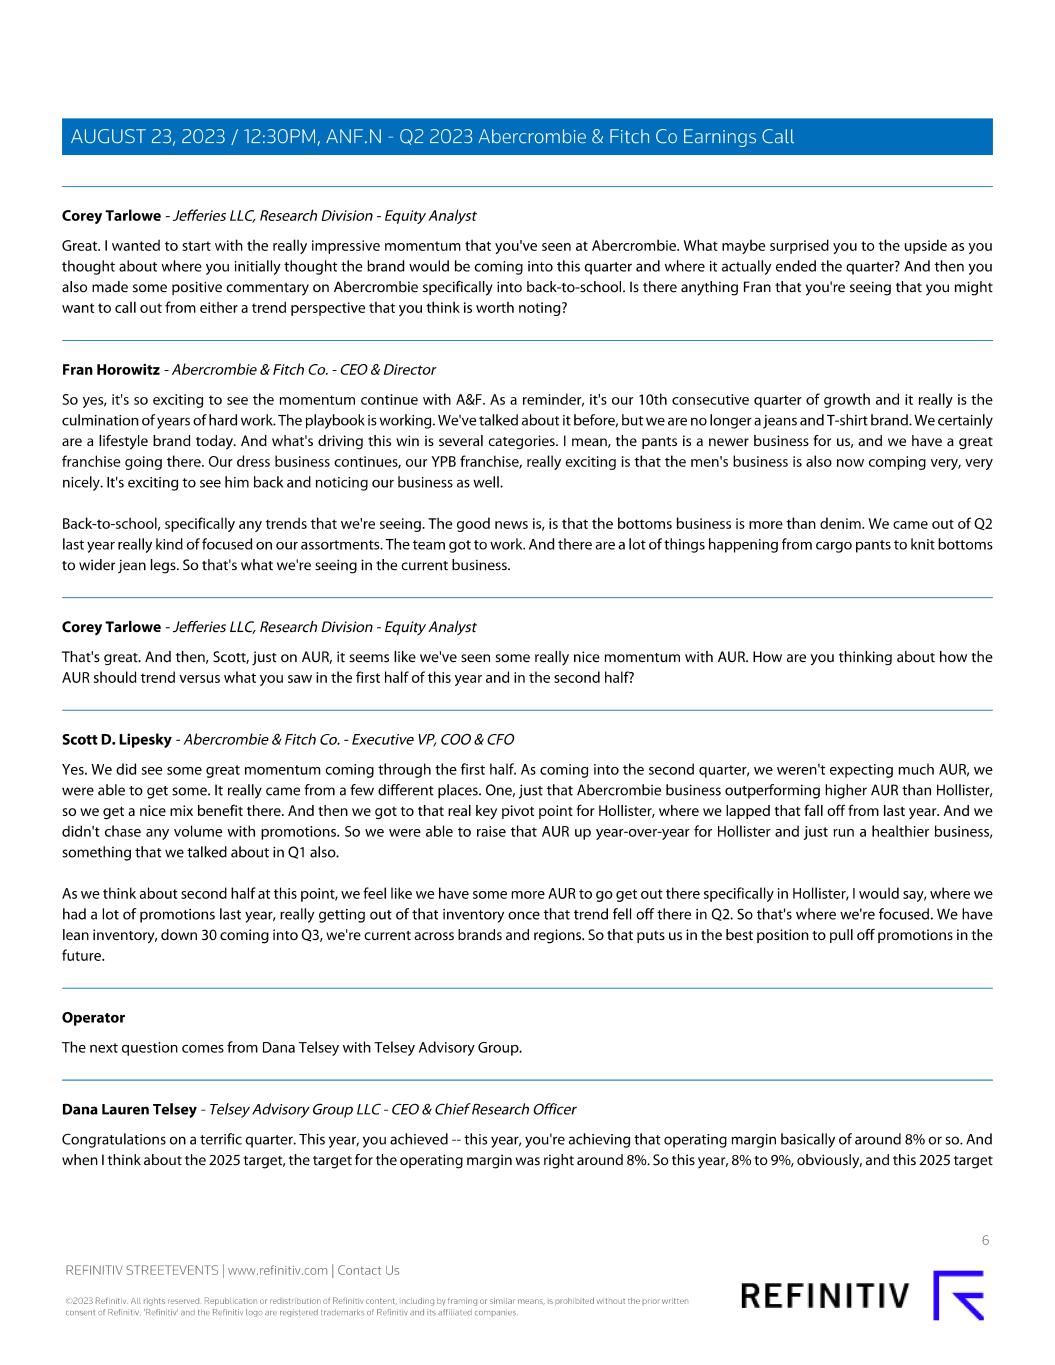
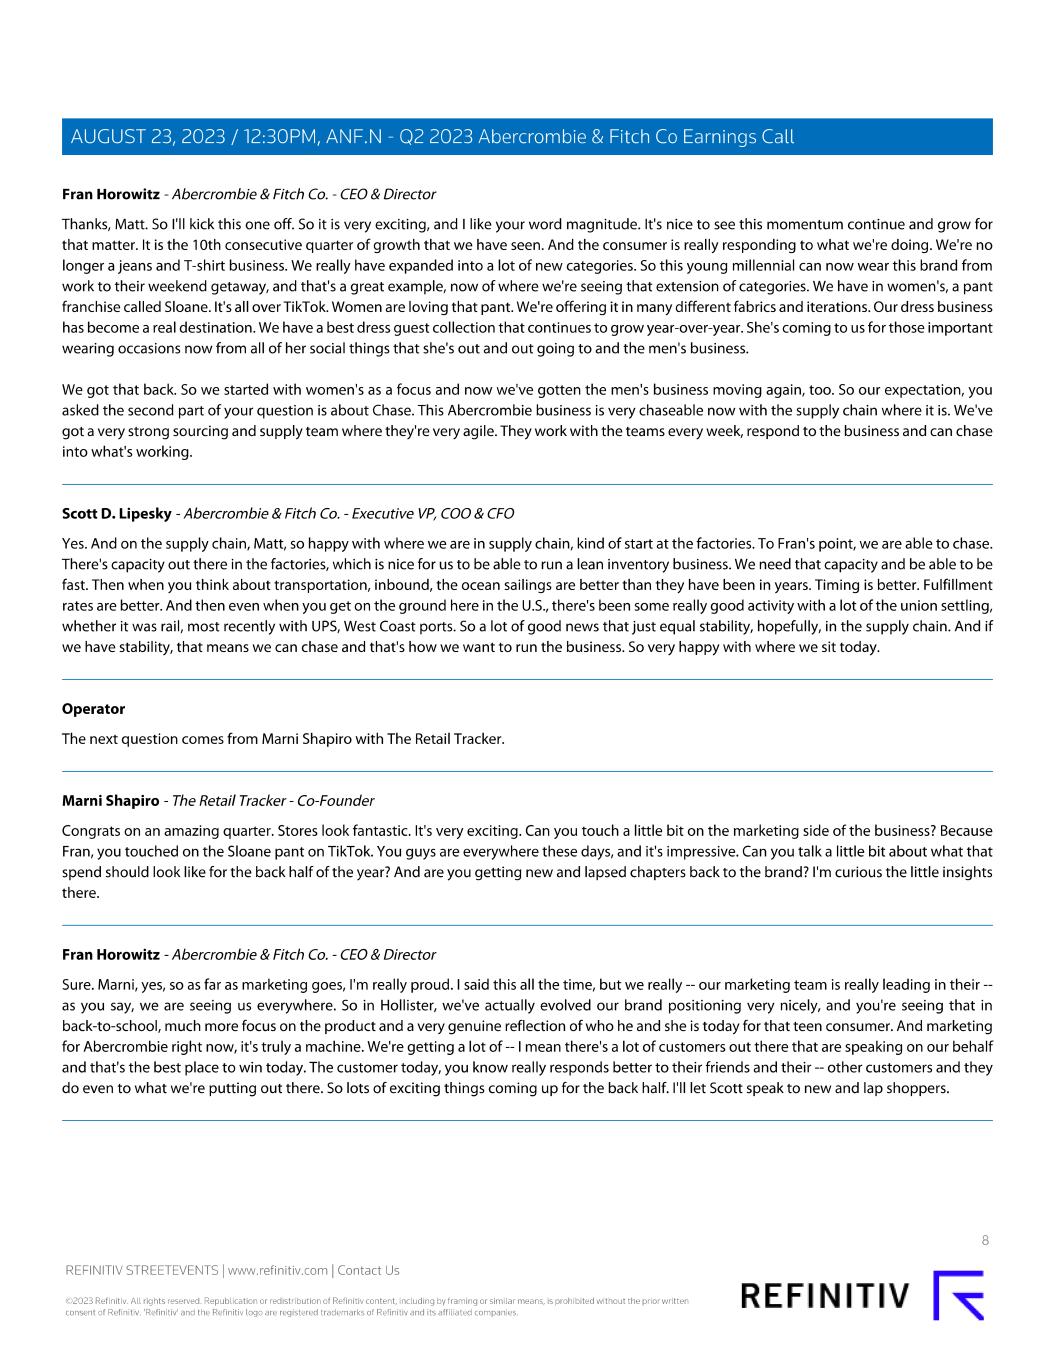
Fran Horowitz, Chief Executive Officer, said, “Our net sales and operating margin exceeded our expectations as global growth accelerated throughout the second quarter. We continue to see strong customer receptivity of our brands and product, led by 26% net sales growth in Abercrombie brands. To date, our efforts to evolve Hollister brands’ positioning and assortment are paying off, achieving a return to net sales growth at positive 8% for the quarter. Both brands saw gross profit rate improvement on higher average unit retail and lower freight costs. Operating leverage from sales growth and gross profit rate performance contributed to an operating margin of 9.6%, a significant expansion from second quarter of 2022. These strong results showcase the power of our playbook and our team’s ability to align product, voice, and experience to meet our customers’ needs. Operationally, we are strategically managing inventory, leveraging chase capabilities to support demand, and driving efficiency across our business.
While the macro environment remains dynamic, our first half results give us confidence to stay on offense for the second half. Consistent with our Always Forward Plan, we are continuing to open stores and make critical long-term investments in digital and technology that will keep our brands in position to exceed our customers’ expectations.”
Details related to reported net income (loss) per diluted share and adjusted net income (loss) per diluted share for the second quarter are as follows:
| 2023 | 2022 | |||||||||||||
| GAAP | $ | 1.10 | $ | (0.33) | ||||||||||
Excluded items, net of tax effect (1) | — | (0.03) | ||||||||||||
| Adjusted non-GAAP | $ | 1.10 | $ | (0.30) | ||||||||||
Impact from changes in foreign currency exchange rates (2) | — | (0.02) | ||||||||||||
| Adjusted non-GAAP constant currency | $ | 1.10 | $ | (0.32) | ||||||||||
(1)Excluded items consist of pre-tax store asset impairment charges in the prior year.
(2)The estimated impact from foreign currency is calculated by applying current period exchange rates to prior year results using a 26% tax rate.
A summary of results for the second quarter ended July 29, 2023 as compared to the second quarter ended July 30, 2022:
•Net sales of $935 million, up 16% as compared to last year on a reported basis and up 16% on a constant currency basis.
•Positive total company comparable sales of 13%.
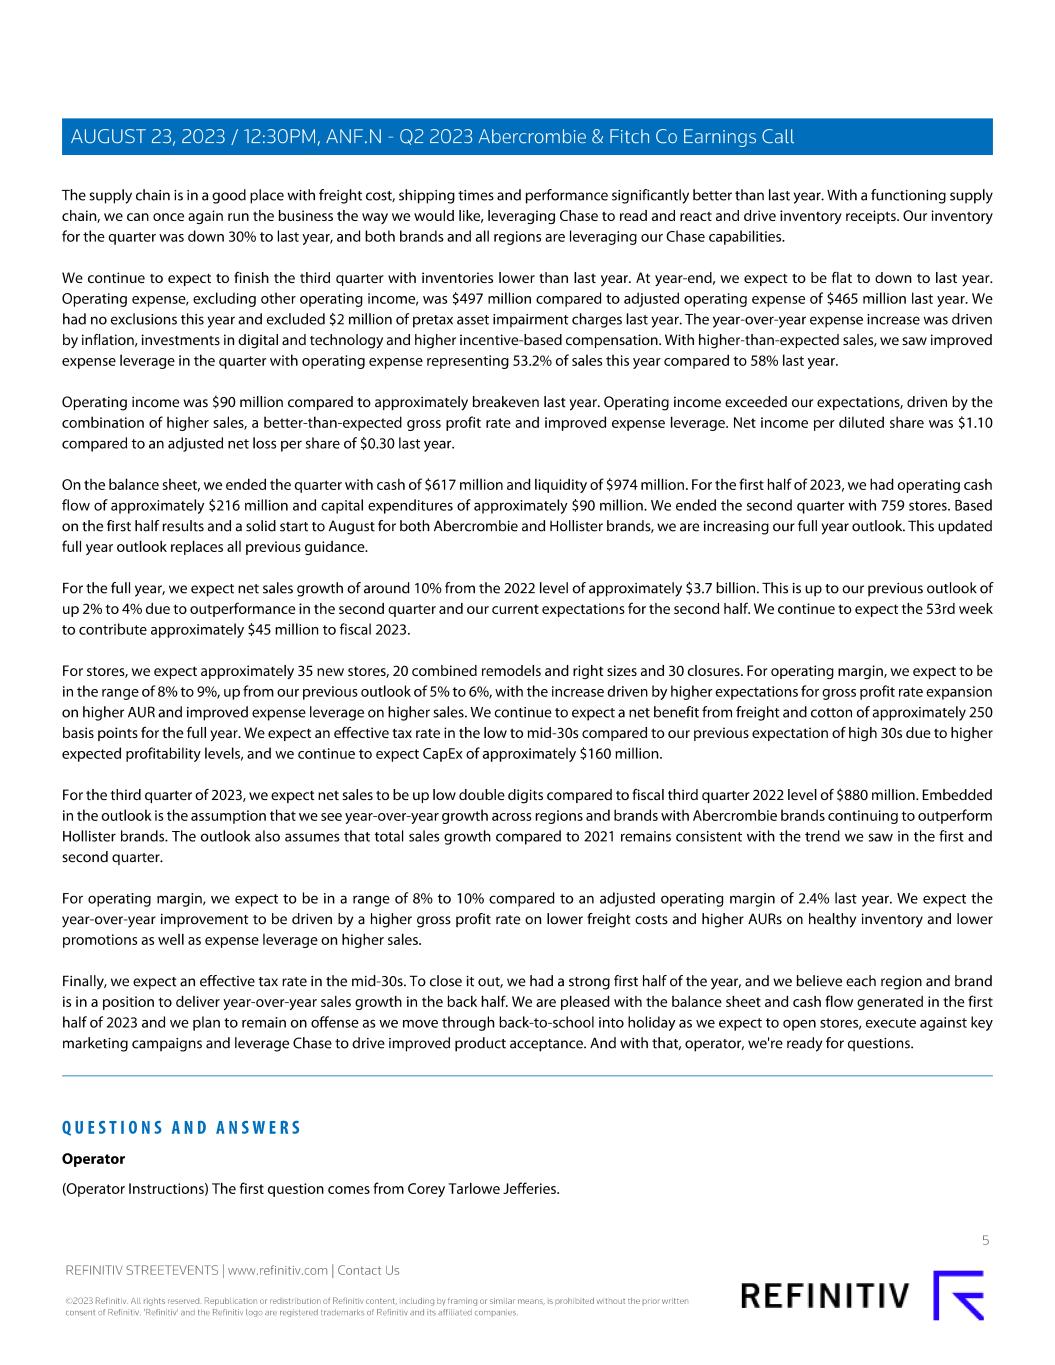
•Gross profit rate of 62.5%, up approximately 460 basis points as compared to last year. The year-over-year improvement was primarily driven by a benefit of 400 basis points from year-over-year AUR growth and 340 basis points from lower freight costs partially offset by 180 basis points from higher cotton and raw material costs and 60 basis points from the adverse impact from foreign currency.
•Operating expense, excluding other operating income, net, up $30 million or 6% compared to last year, driven by increases in incentive compensation, store occupancy and technology expenses. Operating expense as a percentage of sales decreased to 53.2% from 58.0% last year.
• Operating income of $90 million on a reported basis as compared to operating loss of $2 million and $0 million last year, on a reported and adjusted non-GAAP basis, respectively.
•Net income per diluted share of $1.10 on a reported basis as compared to net loss per diluted share last year of $0.33 and $0.30 on a reported and adjusted non-GAAP basis, respectively.
| Segment reorganization on geographic basis | ||
During the second quarter of 2023, to drive ongoing brand growth and leverage the knowledge and experience of its regional teams, the company reorganized its structure and now manages its business on a geographic basis, consisting of three reportable segments: Americas, Europe, the Middle East and Africa (EMEA) and Asia-Pacific (APAC). There were no changes on the consolidated results of operations. All prior periods presented are recast to conform to this classification.
1
| Net Sales | ||
Net sales by segment and brand for the second quarter are as follows:
Net sales by segment: (1) | 2023 | 2022 | 1 YR % Change | Comparable sales (2) | |||||||||||||||||||
| Americas | $ | 731,427 | $ | 613,244 | 19% | 14% | |||||||||||||||||
| EMEA | 171,962 | 164,827 | 4% | 6% | |||||||||||||||||||
| APAC | 31,956 | 27,020 | 18% | 26% | |||||||||||||||||||
| Total company | $ | 935,345 | $ | 805,091 | 16% | 13% | |||||||||||||||||
| (in thousands) | 2023 | 2022 | 1 YR % Change | Comparable sales (2) | |||||||||||||||||||
| Net sales by brand: | |||||||||||||||||||||||
Abercrombie (3) | 462,711 | 368,157 | 26% | 23% | |||||||||||||||||||
Hollister (4) | $ | 472,634 | $ | 436,934 | 8% | 5% | |||||||||||||||||
| Total company | $ | 935,345 | $ | 805,091 | 16% | 13% | |||||||||||||||||
(1) Net sales by segment are presented by attributing revenues to an individual country on the basis of the country in which the merchandise was sold for in-store purchases and on the basis of the shipping location provided by customers for digital orders.
(2) Comparable sales are calculated on a constant currency basis. Refer to "REPORTING AND USE OF GAAP AND NON-GAAP MEASURES," for further discussion.
(3) For purposes of the above table, Abercrombie includes the Abercrombie & Fitch and abercrombie kids brands.
(4) For purposes of the above table, Hollister includes the Hollister, Gilly Hicks and Social Tourist brands.
| Financial Position and Liquidity | ||
As of July 29, 2023 the company had:
•Cash and equivalents of $617 million. This compares to cash and equivalents of $518 million and $370 million as of January 28, 2023 and July 30, 2022, respectively.
•Inventories of $493 million, a decrease of 30% compared to July 30, 2022.
•Long-term gross borrowings under the company’s senior secured notes of $300 million (the “Senior Secured Notes”) which mature in July 2025 and bear interest at a rate of 8.75% per annum.
•Borrowing available under the senior-secured asset-based revolving credit facility (the “ABL Facility”) of $357 million.
•Liquidity, comprised of cash and equivalents and borrowing available under the ABL Facility, of approximately $974 million. This compares to liquidity of $866 million and $729 million as of January 28, 2023 and July 30, 2022, respectively.
Cash Flow and Capital Allocation | ||
Details related to the company’s cash flows for the year-to-date period ended July 29, 2023 are as follows:
•Net cash provided by operating activities of $216 million.
•Net cash used for investing activities of $90 million.
•Net cash used for financing activities of $23 million.
Depreciation and amortization was $72 million for the year-to-date period ended July 29, 2023.
Fiscal 2023 Full Year Outlook | ||
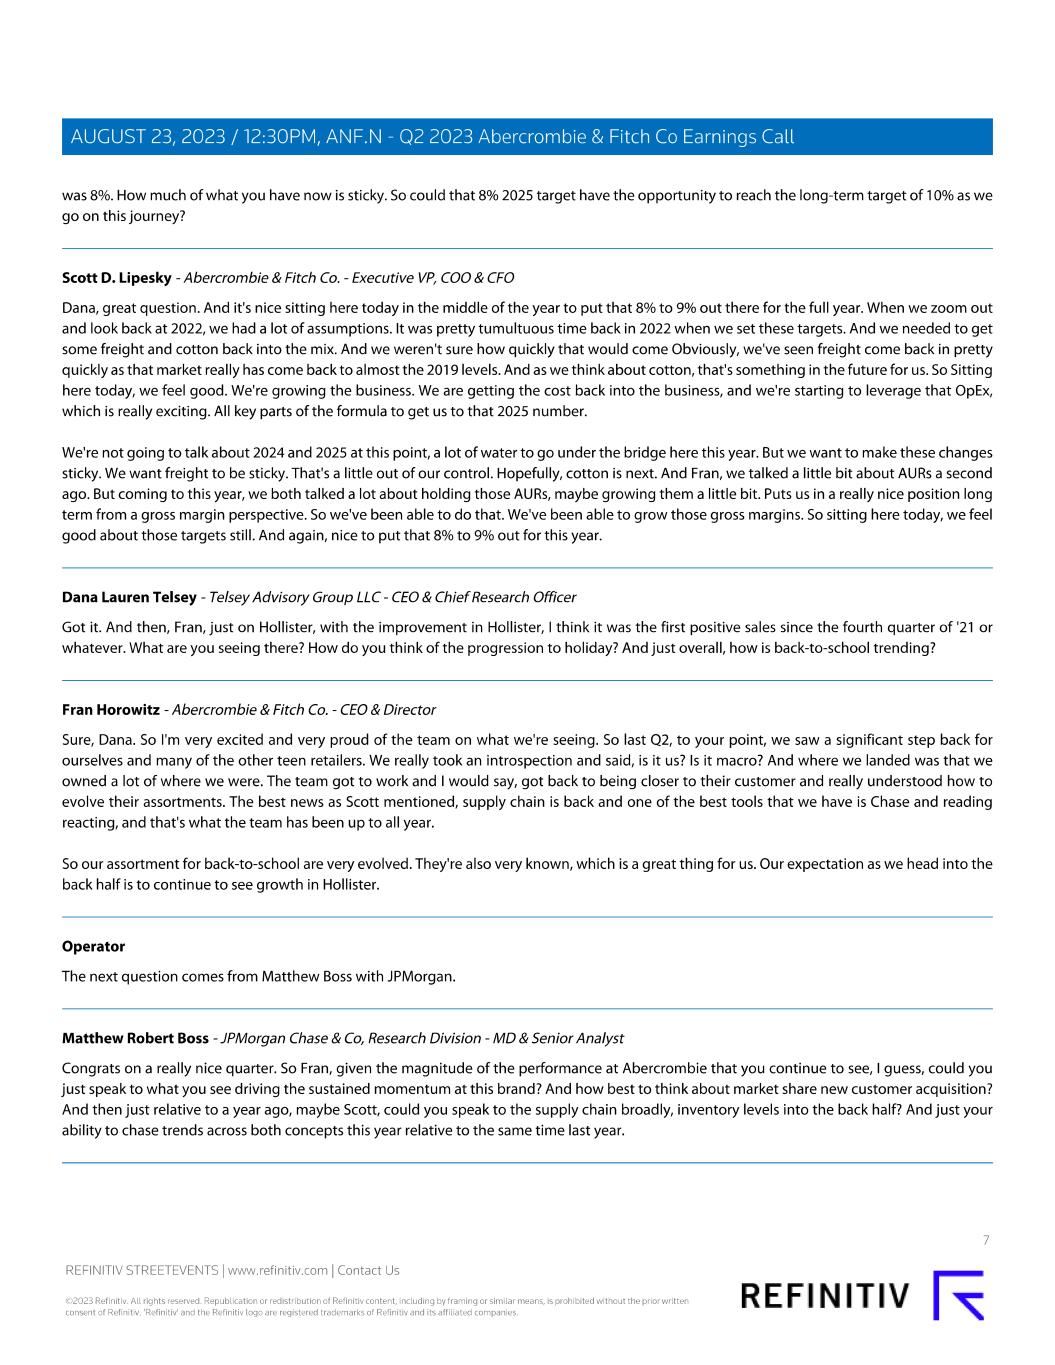
•Net sales growth of around 10% from $3.7 billion in 2022. This is an increase to the previous outlook of up 2% to 4%. The current outlook assumes that Abercrombie brands will continue to outperform Hollister brands. Also, fiscal 2023 includes a 53rd week for reporting purposes, along with net store expansion. The 53rd week is estimated to add approximately $45 million to total net sales in the fourth quarter and full year of 2023.
•Operating margin to be in the range of 8% to 9%. This range improves from the previous outlook of 5% to 6%. The current outlook includes a benefit of around 250 basis points from full year 2022 levels on expected net improvement in freight and raw material costs, and modest operating expense leverage with sales growth expected to more than offset higher expenses from the combination of inflation and increased investments for the 2025 Always Forward Plan initiatives, including an upgrade of our retail merchandising ERP system.
•Effective tax rate to be in the low-to-mid 30s. This replaces the previous outlook of high-30s. The current outlook assumes the continued inability to realize benefits on certain expected tax losses incurred outside of the U.S., although to a lesser extent than the prior outlook provided.
•Capital expenditures of approximately $160 million.
2
Fiscal 2023 Third Quarter Outlook | ||
•Net sales growth to be up low double-digits compared to fiscal third quarter 2022 level of $880 million. Included in this outlook is the expected benefit of approximately 140 basis points from foreign currency.
•Operating margin to be in the range of 8% to 10% compared to an adjusted operating margin of 2.4% in Q3 2022. We expect the year-over-year improvement to be driven by a higher gross profit rate on lower freight costs and higher AURs and modest operating expense leverage on higher sales.
•Effective tax rate to be in the mid-30s. This outlook assumes the continued inability to realize benefits on certain expected tax losses incurred outside of the U.S.
| Conference Call | ||
Today at 8:30 a.m. ET, the company will conduct a conference call and provide additional details around its quarterly results and its outlook for the third quarter. To access the call by phone, participants will need to register at the following URL address to obtain a dial-in number and passcode: https://register.vevent.com/register/BI00b7584485ee47f98eca556c6ffce3e8
A presentation of second quarter results will be available in the “Investors” section at corporate.abercrombie.com at approximately 7:30 a.m. ET, today. Important information may be disseminated initially or exclusively via the website; investors should consult the site to access this information.
| Safe Harbor Statement Under the Private Securities Litigation Reform Act of 1995 | ||
This Press Release and related statements by management or spokespeople of Abercrombie & Fitch Co. (A&F) contain forward-looking statements (as such term is defined in the Private Securities Litigation Reform Act of 1995). These statements, including, without limitation, statements regarding our third quarter and annual fiscal 2023 results, relate to our current assumptions, projections and expectations about our business and future events. Any such forward-looking statements involve risks and uncertainties and are subject to change based on various important factors, many of which may be beyond the company’s control. The inclusion of such information should not be regarded as a representation by the company, or any other person, that the objectives of the company will be achieved. Words such as “estimate,” “project,” “plan,” “believe,” “expect,” “anticipate,” “intend,” “should,” “are confident,” “will,” “could,” “outlook,” and similar expressions may identify forward-looking statements. Except as may be required by applicable law, we assume no obligation to publicly update or revise any forward-looking statements, including any financial targets or estimates, whether as a result of new information, future events, or otherwise. Factors that may cause results to differ from those expressed in our forward-looking statements include, but are not limited to, the factors disclosed in Part I, Item 1A. “Risk Factors” of the company’s Annual Report on Form 10-K for the fiscal year ended January 28, 2023, and otherwise in our reports and filings with the Securities and Exchange Commission, as well as the following factors: risks related to changes in global economic and financial conditions, and the resulting impact on consumer confidence and consumer spending, as well as other changes in consumer discretionary spending habits; risks related to continued inflationary pressures with respect to labor and raw materials and global supply chain constraints that have, and could continue, to affect freight, transit, and other costs; risks related to geopolitical conflict, including ongoing geopolitical challenges between the United States and China, the ongoing hostilities in Ukraine, acts of terrorism, mass casualty events, social unrest, civil disturbance or disobedience; risks related to our failure to engage our customers, anticipate customer demand and changing fashion trends, and manage our inventory; risks related to our failure to operate effectively in a highly competitive and constantly evolving industry; risks related to our ability to execute on our strategic and growth initiatives, including those outlined in our Always Forward Plan; risks related to fluctuations in foreign currency exchange rates; risks related to fluctuations in our tax obligations and effective tax rate, including as a result of earnings and losses generated from our international operations, may result in volatility in our results of operations; risks and uncertainty related to adverse public health developments, such as the COVID‐19 pandemic; risks associated with corporate responsibility issues; risks related to cybersecurity threats and privacy or data security breaches; and the potential loss or disruption to our information systems.
3
| Other Information | ||
This document includes certain adjusted non-GAAP financial measures where management believes it to be helpful in understanding the company's results of operations or financial position. Additional details about non-GAAP financial measures and a reconciliation of GAAP financial measures to non-GAAP financial measures can be found in the "Reporting and Use of GAAP and Non-GAAP Measures" section. Sub-totals and totals may not foot due to rounding. Net income (loss) and net income (loss) per share financial measures included herein are attributable to Abercrombie & Fitch Co., excluding net income attributable to noncontrolling interests.
Unless otherwise noted, as used in this document, unless otherwise defined "Abercrombie brands" refers to the company's Abercrombie & Fitch and abercrombie kids brands and "Hollister brands" refers to the company's Hollister, Gilly Hicks, and Social Tourist brands. Additionally, references to "Americas" includes North America and South America, "EMEA" includes Europe, the Middle East and Africa and "APAC" includes the Asia-Pacific region, including Asia and Oceania.
| About Abercrombie & Fitch Co. | ||
Abercrombie & Fitch Co. (NYSE: ANF) is a leading, global, omnichannel specialty retailer of apparel and accessories for men, women and kids. The iconic Abercrombie & Fitch brand was born in 1892 and aims to make every day feel as exceptional as the start of a long weekend. abercrombie kids sees the world through kids’ eyes, where play is life and every day is an opportunity to be anything and better anything. The Hollister brand believes in liberating the spirit of an endless summer inside everyone and making teens feel celebrated and comfortable in their own skin. Gilly Hicks, offering active lifestyle products, is designed to create happiness through movement. Social Tourist, the creative vision of Hollister and social media personalities, Dixie and Charli D’Amelio, offers trend forward apparel that allows teens to experiment with their style, while exploring the duality of who they are both on social media and in real life.
The brands share a commitment to offering products of enduring quality and exceptional comfort that allow consumers around the world to express their own individuality and style. Abercrombie & Fitch Co. operates approximately 760 stores under these brands across North America, Europe, Asia and the Middle East, as well as the e-commerce sites www.abercrombie.com, www.abercrombiekids.com, www.hollisterco.com, www.gillyhicks.com and www.socialtourist.com.
| Investor Contact: | Media Contact: | |||||||
| Mo Gupta | Kate Wagner | |||||||
| Abercrombie & Fitch Co. | Abercrombie & Fitch Co. | |||||||
| (614) 283-6751 | (614) 283-6192 | |||||||
| [email protected] | [email protected] | |||||||
4
| Abercrombie & Fitch Co. | |||||||||||||||||||||||
| Condensed Consolidated Statements of Operations | |||||||||||||||||||||||
| (in thousands, except per share data) | |||||||||||||||||||||||
| (Unaudited) | |||||||||||||||||||||||
| Thirteen Weeks Ended | Thirteen Weeks Ended | ||||||||||||||||||||||
| July 29, 2023 | % of Net Sales | July 30, 2022 | % of Net Sales | ||||||||||||||||||||
| Net sales | $ | 935,345 | 100.0 | % | $ | 805,091 | 100.0 | % | |||||||||||||||
| Cost of sales, exclusive of depreciation and amortization | 350,965 | 37.5 | % | 339,200 | 42.1 | % | |||||||||||||||||
| Gross profit | 584,380 | 62.5 | % | 465,891 | 57.9 | % | |||||||||||||||||
| Stores and distribution expense | 352,730 | 37.7 | % | 340,791 | 42.3 | % | |||||||||||||||||
| Marketing, general and administrative expense | 144,502 | 15.4 | % | 124,168 | 15.4 | % | |||||||||||||||||
| Asset impairment | — | — | % | 2,170 | 0.3 | % | |||||||||||||||||
| Other operating (income) loss, net | (2,694) | (0.3) | % | 953 | 0.1 | % | |||||||||||||||||
| Operating income (loss) | 89,842 | 9.6 | % | (2,191) | (0.3) | % | |||||||||||||||||
| Interest expense, net | 1,097 | 0.1 | % | 6,917 | 0.9 | % | |||||||||||||||||
| Income (loss) before income taxes | 88,745 | 9.5 | % | (9,108) | (1.1) | % | |||||||||||||||||
| Income tax expense | 30,014 | 3.2 | % | 5,634 | 0.7 | % | |||||||||||||||||
| Net income (loss) | 58,731 | 6.3 | % | (14,742) | (1.8) | % | |||||||||||||||||
| Less: Net income attributable to noncontrolling interests | 1,837 | 0.2 | % | 2,092 | 0.3 | % | |||||||||||||||||
| Net income (loss) attributable to A&F | $ | 56,894 | 6.1 | % | $ | (16,834) | (2.1) | % | |||||||||||||||
| Net income (loss) per share attributable to A&F | |||||||||||||||||||||||
| Basic | $ | 1.13 | $ | (0.33) | |||||||||||||||||||
| Diluted | $ | 1.10 | $ | (0.33) | |||||||||||||||||||
| Weighted-average shares outstanding: | |||||||||||||||||||||||
| Basic | 50,322 | 50,441 | |||||||||||||||||||||
| Diluted | 51,548 | 50,441 | |||||||||||||||||||||
5
| Abercrombie & Fitch Co. | |||||||||||||||||||||||
| Condensed Consolidated Statements of Operations | |||||||||||||||||||||||
| (in thousands, except per share data) | |||||||||||||||||||||||
| (Unaudited) | |||||||||||||||||||||||
| Twenty-Six Weeks Ended | Twenty-Six Weeks Ended | ||||||||||||||||||||||
| July 29, 2023 | % of Net Sales | July 30, 2022 | % of Net Sales | ||||||||||||||||||||
| Net sales | $ | 1,771,339 | 100.0 | % | $ | 1,617,853 | 100.0 | % | |||||||||||||||
| Cost of sales, exclusive of depreciation and amortization | 677,165 | 38.2 | % | 702,416 | 43.4 | % | |||||||||||||||||
| Gross profit | 1,094,174 | 61.8 | % | 915,437 | 56.6 | % | |||||||||||||||||
| Stores and distribution expense | 684,343 | 38.6 | % | 678,334 | 41.9 | % | |||||||||||||||||
| Marketing, general and administrative expense | 287,133 | 16.2 | % | 246,317 | 15.2 | % | |||||||||||||||||
| Asset impairment | 4,436 | 0.3 | % | 5,592 | 0.3 | % | |||||||||||||||||
| Other operating income, net | (5,588) | (0.3) | % | (2,889) | (0.2) | % | |||||||||||||||||
| Operating income (loss) | 123,850 | 7.0 | % | (11,917) | (0.7) | % | |||||||||||||||||
| Interest expense, net | 4,540 | 0.3 | % | 14,224 | 0.9 | % | |||||||||||||||||
| Income (loss) before income taxes | 119,310 | 6.7 | % | (26,141) | (1.6) | % | |||||||||||||||||
| Income tax expense | 42,732 | 2.4 | % | 3,447 | 0.2 | % | |||||||||||||||||
| Net income (loss) | 76,578 | 4.3 | % | (29,588) | (1.8) | % | |||||||||||||||||
| Less: Net income attributable to noncontrolling interests | 3,113 | 0.2 | % | 3,715 | 0.2 | % | |||||||||||||||||
| Net income (loss) attributable to A&F. | $ | 73,465 | 4.1 | % | $ | (33,303) | (2.1) | % | |||||||||||||||
| Net income (loss) per share attributable to A&F | |||||||||||||||||||||||
| Basic | $ | 1.47 | $ | (0.65) | |||||||||||||||||||
| Diluted | $ | 1.43 | $ | (0.65) | |||||||||||||||||||
| Weighted-average shares outstanding: | |||||||||||||||||||||||
| Basic | 49,952 | 51,262 | |||||||||||||||||||||
| Diluted | 51,535 | 51,262 | |||||||||||||||||||||
6
Reporting and Use of GAAP and Non-GAAP Measures
The company believes that each of the non-GAAP financial measures presented are useful to investors as they provide a measure of the company’s operating performance excluding the effect of certain items which the company believes do not reflect its future operating outlook, such as asset impairment charges, therefore supplementing investors’ understanding of comparability of operations across periods. Management used these non-GAAP financial measures during the periods presented to assess the company’s performance and to develop expectations for future operating performance. Non-GAAP financial measures should be used supplemental to, and not as an alternative to, the company’s GAAP financial results, and may not be calculated in the same manner as similar measures presented by other companies.
In addition, at times the company provides comparable sales, defined as the percentage year-over-year change in the aggregate of: (1) sales for stores that have been open as the same brand at least one year and whose square footage has not been expanded or reduced by more than 20% within the past year, with prior year’s net sales converted at the current year’s foreign currency exchange rate to remove the impact of foreign currency rate fluctuation, and (2) digital net sales with prior year’s net sales converted at the current year’s foreign currency exchange rate to remove the impact of foreign currency rate fluctuation.
The company also provides certain financial information on a constant currency basis to enhance investors’ understanding of underlying business trends and operating performance, by removing the impact of foreign currency exchange rate fluctuations. The effect from foreign currency, calculated on a constant currency basis, is determined by applying current year average exchange rates to prior year results and is net of the year-over-year impact from hedging. The per diluted share effect from foreign currency is calculated using a 26% tax rate.
| Abercrombie & Fitch Co. | |||||||||||||||||
| Schedule of Non-GAAP Financial Measures | |||||||||||||||||
| Twenty-Six Weeks Ended July 29, 2023 | |||||||||||||||||
| (in thousands, except per share data) | |||||||||||||||||
| (Unaudited) | |||||||||||||||||
GAAP (1) | Excluded items | Adjusted non-GAAP | |||||||||||||||
Asset impairment (2) | $ | 4,436 | $ | 4,436 | $ | — | |||||||||||
Operating income | 123,850 | (4,436) | 128,286 | ||||||||||||||
Income before income taxes | 119,310 | (4,436) | 123,746 | ||||||||||||||
Income tax expense (3) | 42,732 | (1,207) | 43,939 | ||||||||||||||
Net income attributable to A&F | $ | 73,465 | $ | (3,229) | $ | 76,694 | |||||||||||
Net income per diluted share attributable to A&F | $ | 1.43 | $ | (0.06) | $ | 1.49 | |||||||||||
| Diluted weighted-average shares outstanding: | 51,535 | 51,535 | |||||||||||||||
(1) “GAAP” refers to accounting principles generally accepted in the United States of America.
(2) Excluded items consist of pre-tax store impairment charges of $4.4 million.
(3) The tax effect of excluded items is the difference between the tax provision calculated on a GAAP basis and an adjusted non-GAAP basis.
7
| Abercrombie & Fitch Co. | |||||||||||||||||
| Schedule of Non-GAAP Financial Measures | |||||||||||||||||
| Twenty-Six Weeks Ended July 30, 2022 | |||||||||||||||||
| (in thousands, except per share data) | |||||||||||||||||
| (Unaudited) | |||||||||||||||||
GAAP (1) | Excluded items | Adjusted non-GAAP | |||||||||||||||
Asset impairment (2) | $ | 5,592 | $ | 5,592 | $ | — | |||||||||||
Operating loss | (11,917) | (5,592) | (6,325) | ||||||||||||||
Loss before income taxes | (26,141) | (5,592) | (20,549) | ||||||||||||||
Income tax expense (3) | 3,447 | (1,529) | 4,976 | ||||||||||||||
Net loss attributable to A&F | $ | (33,303) | $ | (4,063) | $ | (29,240) | |||||||||||
Net loss per diluted share attributable to A&F | $ | (0.65) | $ | (0.08) | $ | (0.57) | |||||||||||
| Diluted weighted-average shares outstanding: | 51,262 | 51,262 | |||||||||||||||
(1) “GAAP” refers to accounting principles generally accepted in the United States of America.
(2) Excluded items consist of pre-tax store asset impairment charges of $5.6 million.
(3) The tax effect of excluded items is the difference between the tax provision calculated on a GAAP basis and an adjusted non-GAAP basis.
8
| Abercrombie & Fitch Co. | |||||||||||||||||
| Reconciliation of Constant Currency Financial Measures | |||||||||||||||||
Thirteen Weeks Ended July 29, 2023 and July 30, 2022 | |||||||||||||||||
| (in thousands, except percentage and basis point changes and per share data) | |||||||||||||||||
| (Unaudited) | |||||||||||||||||
| 2023 | 2022 | % Change | |||||||||||||||
| Net sales | |||||||||||||||||
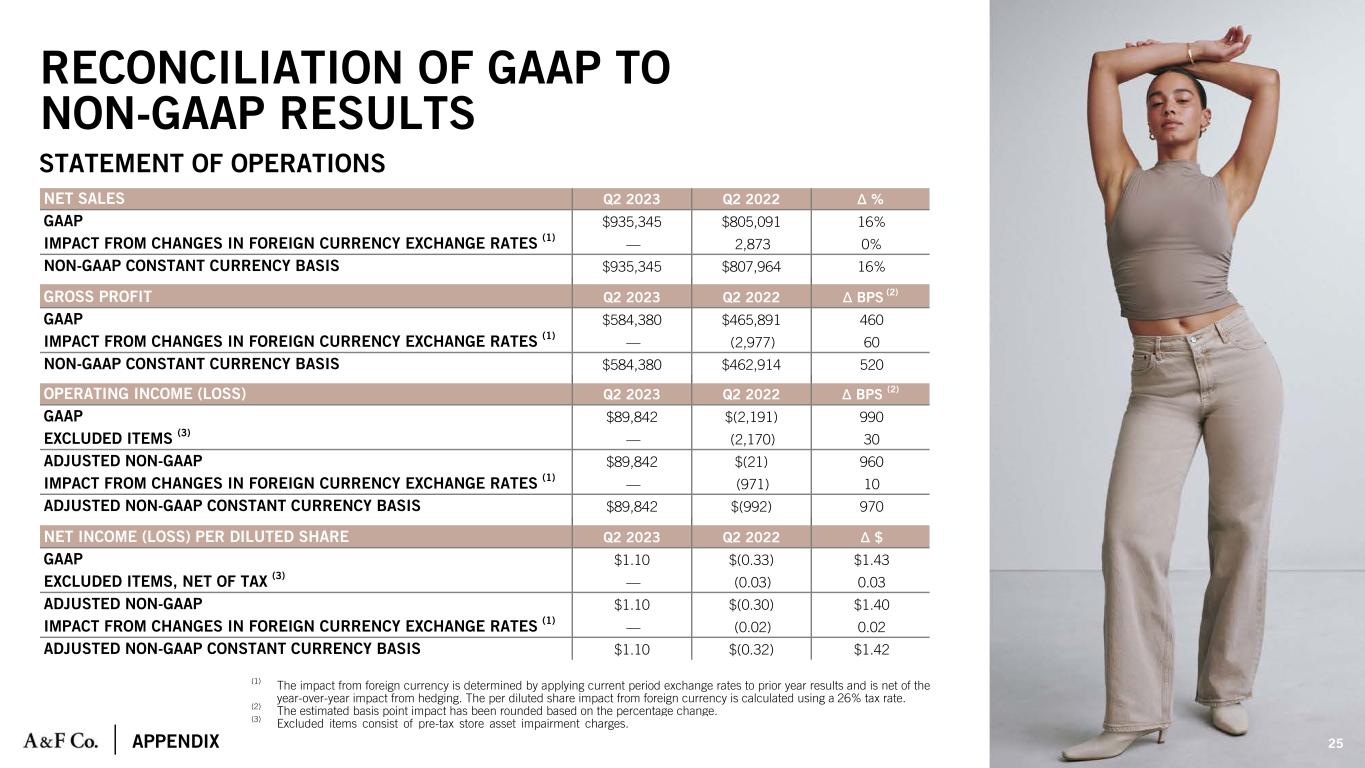
GAAP (1) | $ | 935,345 | $ | 805,091 | 16% | ||||||||||||
Impact from changes in foreign currency exchange rates (2) | — | 2,873 | —% | ||||||||||||||
| Net sales on a constant currency basis | $ | 935,345 | $ | 807,964 | 16% | ||||||||||||
| Gross profit | 2023 | 2022 | BPS Change (3) | ||||||||||||||
GAAP (1) | $ | 584,380 | $ | 465,891 | 460 | ||||||||||||
Impact from changes in foreign currency exchange rates (2) | — | (2,977) | 60 | ||||||||||||||
| Gross profit on a constant currency basis | $ | 584,380 | $ | 462,914 | 520 | ||||||||||||
| Operating income (loss) | 2023 | 2022 | BPS Change (3) | ||||||||||||||
GAAP (1) | $ | 89,842 | $ | (2,191) | 990 | ||||||||||||
Excluded items (4) | — | (2,170) | 30 | ||||||||||||||
| Adjusted non-GAAP | $ | 89,842 | $ | (21) | 960 | ||||||||||||
Impact from changes in foreign currency exchange rates (2) | — | (971) | 10 | ||||||||||||||
| Adjusted non-GAAP constant currency basis | $ | 89,842 | $ | (992) | 970 | ||||||||||||
| Net income (loss) attributable to A&F | 2023 | 2022 | $ Change | ||||||||||||||
GAAP (1) | $ | 1.10 | $ | (0.33) | $1.43 | ||||||||||||
Excluded items, net of tax (4) | — | (0.03) | 0.03 | ||||||||||||||
| Adjusted non-GAAP | $ | 1.10 | $ | (0.30) | $1.40 | ||||||||||||
Impact from changes in foreign currency exchange rates (2) | — | (0.02) | 0.02 | ||||||||||||||
| Adjusted non-GAAP constant currency basis | $ | 1.10 | $ | (0.32) | $1.42 | ||||||||||||
(1) “GAAP” refers to accounting principles generally accepted in the United States of America.
(2) The estimated impact from foreign currency is determined by applying current period exchange rates to prior year results and is net of the year-over-year impact from hedging. The per diluted share estimated impact from foreign currency is calculated using a 26% tax rate.
(3) The estimated basis point change has been rounded based on the percentage change.
(4) Excluded items consist of $2.2 million pre-tax store asset impairment charges for the prior year.
9
| Abercrombie & Fitch Co. | ||||||||||||||||||||||||||
| Reconciliation of Constant Currency Net Sales by Geography and Brand | ||||||||||||||||||||||||||
Thirteen Weeks Ended July 29, 2023 and July 30, 2022 | ||||||||||||||||||||||||||
| (in thousands, except percentage changes) | ||||||||||||||||||||||||||
| (Unaudited) | ||||||||||||||||||||||||||
| 2023 | 2022 | GAAP % Change | Non-GAAP Constant Currency Basis % Change | |||||||||||||||||||||||
| GAAP | GAAP | Impact From Changes In Foreign Currency Exchanges Rates (1) | Non-GAAP Constant Currency Basis | |||||||||||||||||||||||
Net sales by segment: (2) | ||||||||||||||||||||||||||
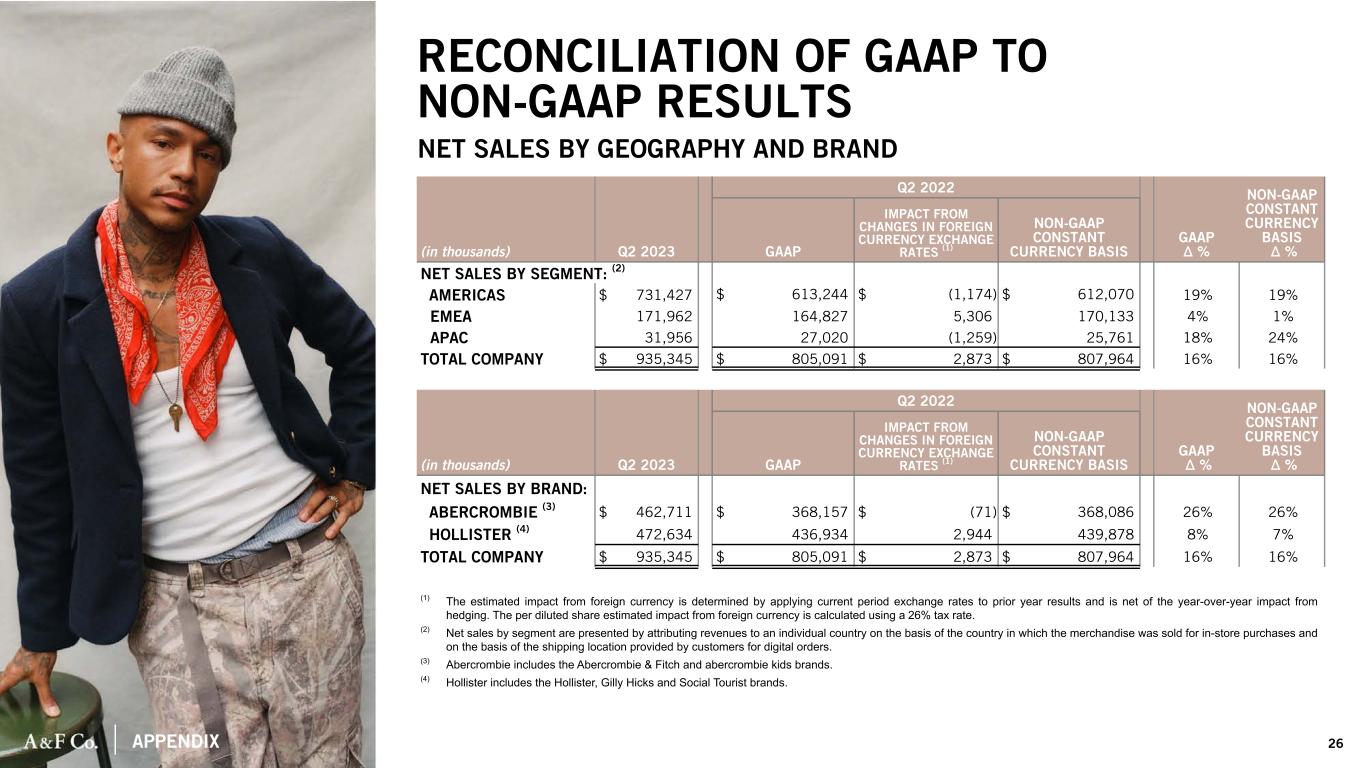
| Americas | $ | 731,427 | $ | 613,244 | $ | (1,174) | $ | 612,070 | 19% | 19% | ||||||||||||||||
| EMEA | 171,962 | 164,827 | 5,306 | 170,133 | 4% | 1% | ||||||||||||||||||||
| APAC | 31,956 | 27,020 | (1,259) | 25,761 | 18% | 24% | ||||||||||||||||||||
| Total company | $ | 935,345 | $ | 805,091 | $ | 2,873 | $ | 807,964 | 16% | 16% | ||||||||||||||||
| 2023 | 2022 | GAAP % Change | Non-GAAP Constant Currency Basis % Change | |||||||||||||||||||||||
| GAAP | GAAP | Impact From Changes In Foreign Currency Exchanges Rates (1) | Non-GAAP Constant Currency Basis | |||||||||||||||||||||||
| Net sales by brand: | ||||||||||||||||||||||||||
Abercrombie (3) | 462,711 | 368,157 | (71) | 368,086 | 26% | 26% | ||||||||||||||||||||
Hollister (4) | $ | 472,634 | $ | 436,934 | $ | 2,944 | $ | 439,878 | 8% | 7% | ||||||||||||||||
| Total company | $ | 935,345 | $ | 805,091 | $ | 2,873 | $ | 807,964 | 16% | 16% | ||||||||||||||||
(1)The estimated impact from foreign currency is determined by applying current period exchange rates to prior year results and is net of the year-over-year impact from hedging. The per diluted share estimated impact from foreign currency is calculated using a 26% tax rate.
(2)Net sales by segment are presented by attributing revenues to an individual country on the basis of the country in which the merchandise was sold for in-store purchases and on the basis of the shipping location provided by customers for digital orders.
(3)For purposes of the above table, Abercrombie includes the Abercrombie & Fitch and abercrombie kids brands.
(4)For purposes of the above table, Hollister includes the Hollister, Gilly Hicks and Social Tourist brands.
10
| Abercrombie & Fitch Co. | |||||||||||||||||
| Condensed Consolidated Balance Sheets | |||||||||||||||||
| (in thousands) | |||||||||||||||||
| (Unaudited) | |||||||||||||||||
| July 29, 2023 | January 28, 2023 | July 30, 2022 | |||||||||||||||
| Assets | |||||||||||||||||
| Current assets: | |||||||||||||||||
| Cash and equivalents | $ | 617,339 | $ | 517,602 | $ | 369,957 | |||||||||||
| Receivables | 112,597 | 104,506 | 79,820 | ||||||||||||||
| Inventories | 493,479 | 505,621 | 708,024 | ||||||||||||||
| Other current assets | 87,850 | 100,289 | 104,887 | ||||||||||||||
| Total current assets | 1,311,265 | 1,228,018 | 1,262,688 | ||||||||||||||
| Property and equipment, net | 553,680 | 551,585 | 511,181 | ||||||||||||||
| Operating lease right-of-use assets | 714,977 | 723,550 | 740,627 | ||||||||||||||
| Other assets | 216,792 | 209,947 | 219,598 | ||||||||||||||
| Total assets | $ | 2,796,714 | $ | 2,713,100 | $ | 2,734,094 | |||||||||||
| Liabilities and stockholders’ equity | |||||||||||||||||
| Current liabilities: | |||||||||||||||||
| Accounts payable | $ | 323,197 | $ | 258,895 | $ | 408,297 | |||||||||||
| Accrued expenses | 375,544 | 413,303 | 342,690 | ||||||||||||||
| Short-term portion of operating lease liabilities | 191,700 | 213,979 | 202,699 | ||||||||||||||
| Income taxes payable | 46,039 | 16,023 | 5,582 | ||||||||||||||
| Total current liabilities | 936,480 | 902,200 | 959,268 | ||||||||||||||
| Long-term liabilities: | |||||||||||||||||
| Long-term portion of operating lease liabilities | $ | 692,046 | $ | 713,361 | $ | 714,265 | |||||||||||
| Long-term borrowings, net | 297,385 | 296,852 | 304,219 | ||||||||||||||
| Other liabilities | 92,019 | 94,118 | 83,415 | ||||||||||||||
| Total long-term liabilities | 1,081,450 | 1,104,331 | 1,101,899 | ||||||||||||||
| Total Abercrombie & Fitch Co. stockholders’ equity | 768,306 | 694,841 | 661,788 | ||||||||||||||
| Noncontrolling interests | 10,478 | 11,728 | 11,139 | ||||||||||||||
| Total stockholders’ equity | 778,784 | 706,569 | 672,927 | ||||||||||||||
| Total liabilities and stockholders’ equity | $ | 2,796,714 | $ | 2,713,100 | $ | 2,734,094 | |||||||||||
11
| Abercrombie & Fitch Co. | |||||||||||
| Condensed Consolidated Statements of Cash Flows | |||||||||||
| (in thousands, except per share data) | |||||||||||
| (Unaudited) | |||||||||||
| Twenty-Six Weeks Ended | |||||||||||
| July 29, 2023 | July 30, 2022 | ||||||||||
| Operating activities | |||||||||||
| Net cash provided by (used for) operating activities | $ | 216,328 | $ | (259,733) | |||||||
| Investing activities | |||||||||||
| Purchases of property and equipment | $ | (89,780) | $ | (59,582) | |||||||
| Proceeds from sale of property and equipment | — | 7,972 | |||||||||
| Net cash used for investing activities | $ | (89,780) | $ | (51,610) | |||||||
| Financing activities | |||||||||||
| Payment of debt modification costs and fees | (17) | — | |||||||||
| Purchases of common stock | — | (117,775) | |||||||||
| Other financing activities | (23,325) | (17,649) | |||||||||
| Net cash used for financing activities | $ | (23,342) | $ | (135,424) | |||||||
| Effect of foreign currency exchange rates on cash | $ | (3,672) | $ | (7,567) | |||||||
| Net increase (decrease) in cash and equivalents, and restricted cash and equivalents | $ | 99,534 | $ | (454,334) | |||||||
| Cash and equivalents, and restricted cash and equivalents, beginning of period | $ | 527,569 | $ | 834,368 | |||||||
| Cash and equivalents, and restricted cash and equivalents, end of period | $ | 627,103 | $ | 380,034 | |||||||
12
| Abercrombie & Fitch Co. | |||||||||||||||||||||||||||||||||||||||||||||||||||||
| Financial Information | |||||||||||||||||||||||||||||||||||||||||||||||||||||
| (Unaudited) | |||||||||||||||||||||||||||||||||||||||||||||||||||||
| (in thousands, except per share data) | |||||||||||||||||||||||||||||||||||||||||||||||||||||
| Fiscal 2022 | Fiscal 2023 | ||||||||||||||||||||||||||||||||||||||||||||||||||||
| 2019 | 2020 | 2021 | Q1 | Q2 | Q3 | Q4 | 2022 | Q1 | Q2 | 2023 | |||||||||||||||||||||||||||||||||||||||||||
| Net sales | $ | 3,623,073 | $ | 3,125,384 | $ | 3,712,768 | $ | 812,762 | $ | 805,091 | $ | 880,084 | $ | 1,199,814 | $ | 3,697,751 | $ | 835,994 | $ | 935,345 | $ | 1,771,339 | |||||||||||||||||||||||||||||||
| Cost of sales, exclusive of depreciation and amortization | 1,472,155 | 1,234,179 | 1,400,773 | 363,216 | 339,200 | 359,268 | 531,529 | 1,593,213 | 326,200 | 350,965 | 677,165 | ||||||||||||||||||||||||||||||||||||||||||
| Gross profit | 2,150,918 | 1,891,205 | 2,311,995 | 449,546 | 465,891 | 520,816 | 668,285 | 2,104,538 | 509,794 | 584,380 | 1,094,174 | ||||||||||||||||||||||||||||||||||||||||||
| Stores and distribution expense | 1,598,500 | 1,379,948 | 1,428,323 | 337,543 | 340,791 | 367,333 | 437,264 | 1,482,931 | 331,613 | 352,730 | 684,343 | ||||||||||||||||||||||||||||||||||||||||||
| Marketing, general and administrative expense | 464,615 | 463,843 | 536,815 | 122,149 | 124,168 | 133,201 | 138,084 | 517,602 | 142,631 | 144,502 | 287,133 | ||||||||||||||||||||||||||||||||||||||||||
| Asset impairment | 19,135 | 72,937 | 12,100 | 3,422 | 2,170 | 3,744 | 4,695 | 14,031 | 4,436 | — | 4,436 | ||||||||||||||||||||||||||||||||||||||||||
| Other operating (income) loss, net | (1,400) | (5,054) | (8,327) | (3,842) | 953 | (1,005) | 1,220 | (2,674) | (2,893) | (2,694) | (5,586) | ||||||||||||||||||||||||||||||||||||||||||
| Operating income (loss) | 70,068 | (20,469) | 343,084 | (9,726) | (2,191) | 17,543 | 87,022 | 92,648 | 34,007 | 89,842 | 123,850 | ||||||||||||||||||||||||||||||||||||||||||
| Interest expense, net | 7,737 | 28,274 | 34,110 | 7,307 | 6,917 | 7,295 | 4,113 | 25,632 | 3,443 | 1,097 | 4,540 | ||||||||||||||||||||||||||||||||||||||||||
| Income (loss) before income taxes | 62,331 | (48,743) | 308,974 | (17,033) | (9,108) | 10,248 | 82,909 | 67,016 | 30,564 | 88,745 | 119,310 | ||||||||||||||||||||||||||||||||||||||||||
| Income tax expense (benefit) | 17,371 | 60,211 | 38,908 | (2,187) | 5,634 | 10,966 | 42,218 | 56,631 | 12,717 | 30,014 | 42,732 | ||||||||||||||||||||||||||||||||||||||||||
| Net income (loss) | 44,960 | (108,654) | 270,066 | (14,846) | (14,742) | (718) | 40,691 | 10,385 | 17,847 | 58,731 | 76,578 | ||||||||||||||||||||||||||||||||||||||||||
| Less: Net income attributable to noncontrolling interests | 5,602 | 5,067 | 7,056 | 1,623 | 2,092 | 1,496 | 2,358 | 7,569 | 1,276 | 1,837 | 3,113 | ||||||||||||||||||||||||||||||||||||||||||
| Net income (loss) attributable to Abercrombie & Fitch Co. | $ | 39,358 | $ | (114,021) | $ | 263,010 | $ | (16,469) | $ | (16,834) | $ | (2,214) | $ | 38,333 | $ | 2,816 | $ | 16,571 | $ | 56,894 | $ | 73,465 | |||||||||||||||||||||||||||||||
| Net income (loss) per share attributable to Abercrombie & Fitch Co.: | |||||||||||||||||||||||||||||||||||||||||||||||||||||
| Basic | $0.61 | $(1.82) | $4.41 | $(0.32) | $(0.33) | $(0.04) | $0.78 | $0.06 | $0.33 | $1.13 | $1.47 | ||||||||||||||||||||||||||||||||||||||||||
| Diluted | $0.60 | $(1.82) | $4.20 | $(0.32) | $(0.33) | $(0.04) | $0.75 | $0.05 | $0.32 | $1.10 | $1.43 | ||||||||||||||||||||||||||||||||||||||||||
| Weighted-average shares outstanding: | |||||||||||||||||||||||||||||||||||||||||||||||||||||
| Basic | 64,428 | 62,551 | 59,597 | 52,077 | 50,441 | 49,486 | 49,216 | 50,307 | 49,574 | 50,322 | 49,952 | ||||||||||||||||||||||||||||||||||||||||||
| Diluted | 65,778 | 62,551 | 62,636 | 52,077 | 50,441 | 49,486 | 51,217 | 52,327 | 51,467 | 51,548 | 51,535 | ||||||||||||||||||||||||||||||||||||||||||
1
| Abercrombie & Fitch Co. | |||||||||||||||||||||||||||||
| Financial Information | |||||||||||||||||||||||||||||
| (Unaudited) | |||||||||||||||||||||||||||||
| (in thousands, except per share data) | |||||||||||||||||||||||||||||
| Fiscal 2023 | |||||||||||||||||||||||||||||
| 2019 | 2020 | 2021 | 2022 | Q2 YTD | |||||||||||||||||||||||||
| Cash flow and capital allocation: | |||||||||||||||||||||||||||||
| Net cash provided by (used for) operating activities | $ | 300,685 | $ | 404,918 | $ | 277,782 | $ | (2,343) | $ | 216,328 | |||||||||||||||||||
| Net cash used for investing activities | $ | (202,784) | $ | (51,910) | $ | (96,979) | $ | (140,675) | $ | (89,780) | |||||||||||||||||||
| Net cash (used for) provided by financing activities (YTD) | $ | (147,873) | $ | 69,717 | $ | (446,898) | $ | (155,329) | $ | (23,342) | |||||||||||||||||||
| Capital expenditures | $ | 202,784 | $ | 101,910 | $ | 96,979 | $ | 164,566 | $ | 89,780 | |||||||||||||||||||
| Number of shares repurchased as part of publicly announced plans or programs | 3,957 | 1,397 | 10,200 | 4,770 | — | ||||||||||||||||||||||||
| Average price per share paid | $ | 16.06 | $ | 10.86 | $ | 36.99 | $ | 26.37 | $ | — | |||||||||||||||||||
| Cost of shares repurchased | $ | 63,542 | $ | 15,172 | $ | 377,290 | $ | 125,775 | $ | — | |||||||||||||||||||
| Dividends | 51,510 | 12,556 | — | — | — | ||||||||||||||||||||||||
| Total | $ | 115,052 | $ | 27,728 | $ | 377,290 | $ | 125,775 | $ | — | |||||||||||||||||||
| Shares outstanding | 62,786 | 62,399 | 52,985 | 49,002 | 50,141 | ||||||||||||||||||||||||
2
| Abercrombie & Fitch Co. | |||||||||||||||||||||||||||||||||||||||||||||||||||||
| Financial Information | |||||||||||||||||||||||||||||||||||||||||||||||||||||
| (Unaudited) | |||||||||||||||||||||||||||||||||||||||||||||||||||||
| Fiscal 2022 | Fiscal 2023 | ||||||||||||||||||||||||||||||||||||||||||||||||||||
| 2019 | 2020 | 2021 | Q1 | Q2 | Q3 | Q4 | 2022 | Q1 | Q2 | 2023 | |||||||||||||||||||||||||||||||||||||||||||
| Operating segment comparable sales | |||||||||||||||||||||||||||||||||||||||||||||||||||||
Americas (1) | Not provided | Not provided | Not provided | Not provided | Not provided | Not provided | Not provided | Not provided | Not provided | 14 | % | 9 | % | ||||||||||||||||||||||||||||||||||||||||
EMEA (1) | Not provided | Not provided | Not provided | Not provided | Not provided | Not provided | Not provided | Not provided | Not provided | 6 | % | 2 | % | ||||||||||||||||||||||||||||||||||||||||
APAC (1) | Not provided | Not provided | Not provided | Not provided | Not provided | Not provided | Not provided | Not provided | Not provided | 26 | % | 25 | % | ||||||||||||||||||||||||||||||||||||||||
Comparable sales (1) | 1 | % | Not provided | Not provided | Not provided | Not provided | Not provided | Not provided | Not provided | 3 | % | 13 | % | 8 | % | ||||||||||||||||||||||||||||||||||||||
| Branded comparable sales | |||||||||||||||||||||||||||||||||||||||||||||||||||||
Abercrombie comparable sales (1) (2) | 3 | % | Not provided | Not provided | Not provided | Not provided | Not provided | Not provided | Not provided | 14 | % | 23 | % | 19 | % | ||||||||||||||||||||||||||||||||||||||
Hollister comparable sales (1) (3) | -1 | % | Not provided | Not provided | Not provided | Not provided | Not provided | Not provided | Not provided | -3 | % | 5 | % | -1 | % | ||||||||||||||||||||||||||||||||||||||
Comparable sales (1) | 1 | % | Not provided | Not provided | Not provided | Not provided | Not provided | Not provided | Not provided | 3 | % | 13 | % | 8 | % | ||||||||||||||||||||||||||||||||||||||
(1) Comparable sales are calculated on a constant currency basis and exclude revenue other than store and online sales. The Company did not provide comparable sales results for fiscal 2020, fiscal 2021 or fiscal 2022 due to temporary store closures as a result of COVID-19. | |||||||||||||||||||||||||||||||||||||||||||||||||||||
(2) Abercrombie includes the Company's Abercrombie & Fitch and abercrombie kids brands. | |||||||||||||||||||||||||||||||||||||||||||||||||||||
(3) Hollister includes the Company's Hollister, Gilly Hicks, and Social Tourist brands. | |||||||||||||||||||||||||||||||||||||||||||||||||||||
3

INVESTOR PRESENTATION: SECOND QUARTER 2023
Safe Harbor and Other Information 3 Company Overview 4 Q2 2023 Results 14 Appendix 19 2 TABLE OF CONTENTS
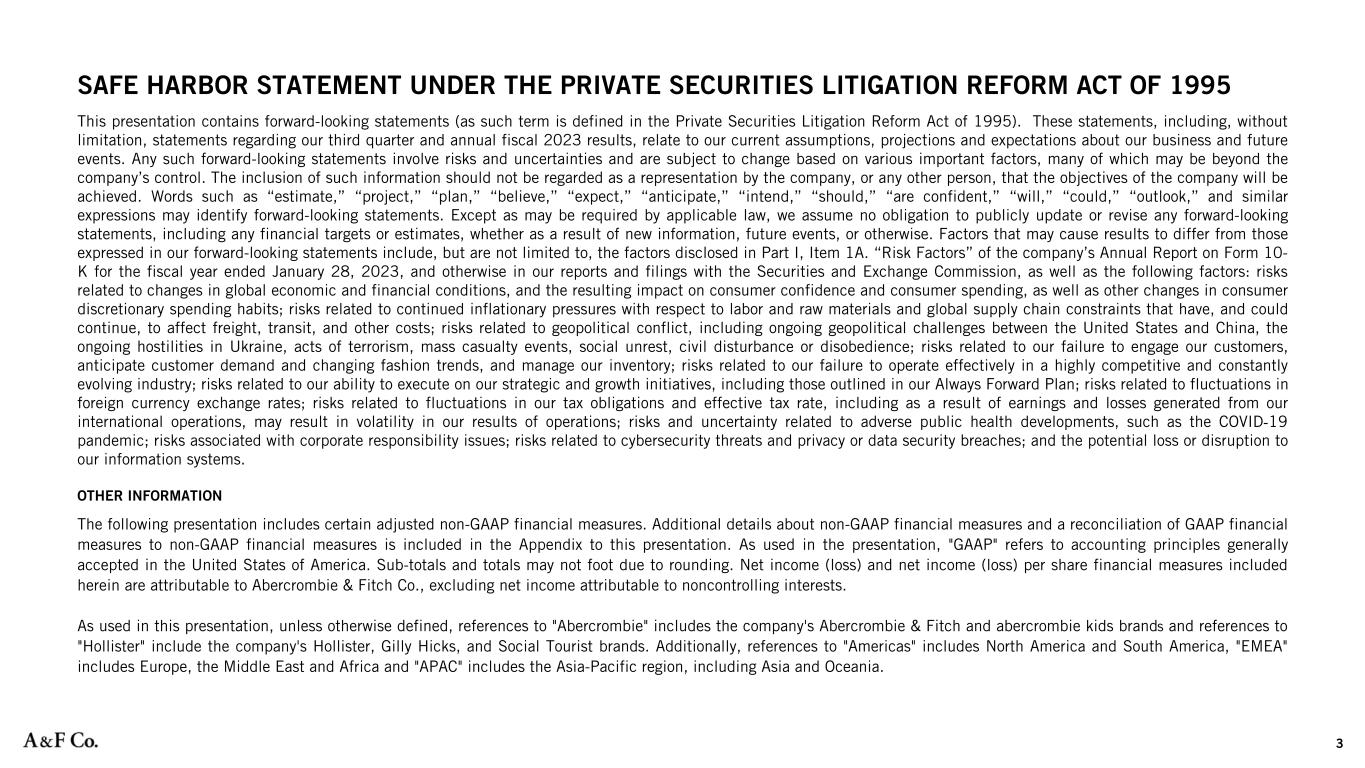
SAFE HARBOR STATEMENT UNDER THE PRIVATE SECURITIES LITIGATION REFORM ACT OF 1995 This presentation contains forward-looking statements (as such term is defined in the Private Securities Litigation Reform Act of 1995). These statements, including, without limitation, statements regarding our third quarter and annual fiscal 2023 results, relate to our current assumptions, projections and expectations about our business and future events. Any such forward-looking statements involve risks and uncertainties and are subject to change based on various important factors, many of which may be beyond the company’s control. The inclusion of such information should not be regarded as a representation by the company, or any other person, that the objectives of the company will be achieved. Words such as “estimate,” “project,” “plan,” “believe,” “expect,” “anticipate,” “intend,” “should,” “are confident,” “will,” “could,” “outlook,” and similar expressions may identify forward-looking statements. Except as may be required by applicable law, we assume no obligation to publicly update or revise any forward-looking statements, including any financial targets or estimates, whether as a result of new information, future events, or otherwise. Factors that may cause results to differ from those expressed in our forward-looking statements include, but are not limited to, the factors disclosed in Part I, Item 1A. “Risk Factors” of the company’s Annual Report on Form 10- K for the fiscal year ended January 28, 2023, and otherwise in our reports and filings with the Securities and Exchange Commission, as well as the following factors: risks related to changes in global economic and financial conditions, and the resulting impact on consumer confidence and consumer spending, as well as other changes in consumer discretionary spending habits; risks related to continued inflationary pressures with respect to labor and raw materials and global supply chain constraints that have, and could continue, to affect freight, transit, and other costs; risks related to geopolitical conflict, including ongoing geopolitical challenges between the United States and China, the ongoing hostilities in Ukraine, acts of terrorism, mass casualty events, social unrest, civil disturbance or disobedience; risks related to our failure to engage our customers, anticipate customer demand and changing fashion trends, and manage our inventory; risks related to our failure to operate effectively in a highly competitive and constantly evolving industry; risks related to our ability to execute on our strategic and growth initiatives, including those outlined in our Always Forward Plan; risks related to fluctuations in foreign currency exchange rates; risks related to fluctuations in our tax obligations and effective tax rate, including as a result of earnings and losses generated from our international operations, may result in volatility in our results of operations; risks and uncertainty related to adverse public health developments, such as the COVID-19 pandemic; risks associated with corporate responsibility issues; risks related to cybersecurity threats and privacy or data security breaches; and the potential loss or disruption to our information systems. OTHER INFORMATION The following presentation includes certain adjusted non-GAAP financial measures. Additional details about non-GAAP financial measures and a reconciliation of GAAP financial measures to non-GAAP financial measures is included in the Appendix to this presentation. As used in the presentation, "GAAP" refers to accounting principles generally accepted in the United States of America. Sub-totals and totals may not foot due to rounding. Net income (loss) and net income (loss) per share financial measures included herein are attributable to Abercrombie & Fitch Co., excluding net income attributable to noncontrolling interests. As used in this presentation, unless otherwise defined, references to "Abercrombie" includes the company's Abercrombie & Fitch and abercrombie kids brands and references to "Hollister" include the company's Hollister, Gilly Hicks, and Social Tourist brands. Additionally, references to "Americas" includes North America and South America, "EMEA" includes Europe, the Middle East and Africa and "APAC" includes the Asia-Pacific region, including Asia and Oceania. 3

Abercrombie & Fitch Co. is a global, digitally-led, omnichannel apparel and accessories retailer catering to kids through millennials with assortments curated for their specific lifestyle needs Our corporate purpose of 'Being here for you on the journey to being and becoming who you are' fuels our purpose-led brands and our global associates 4

COMPANY OVERVIEW 5 OUR BRANDS

for kids through millennials
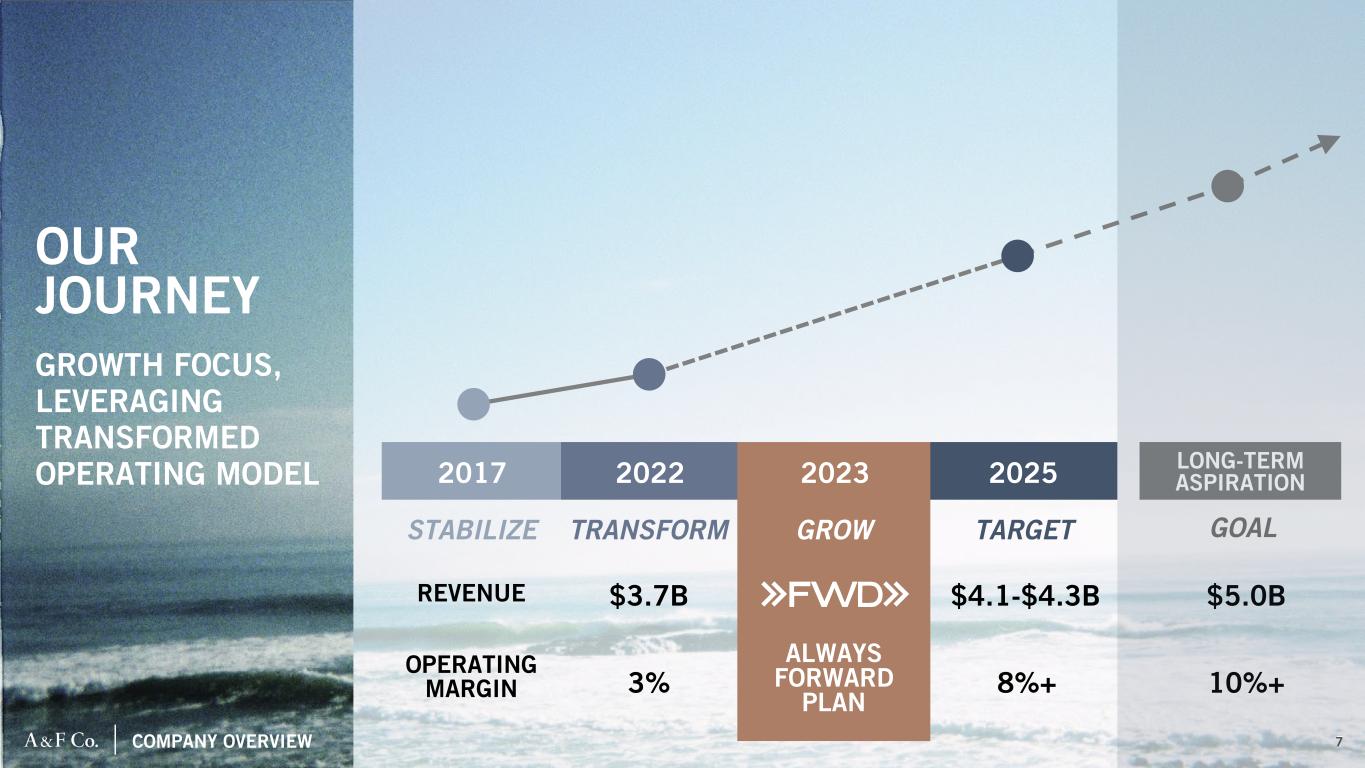
COMPANY OVERVIEW GROWTH FOCUS, LEVERAGING TRANSFORMED OPERATING MODEL 2017 2022 2025 REVENUE $3.7B $4.1-$4.3B $5.0B OPERATING MARGIN 3% 8%+ 10%+ LONG-TERM ASPIRATION OUR JOURNEY STABILIZE TRANSFORM TARGET 2023 GROW GOAL ALWAYS FORWARD PLAN 7
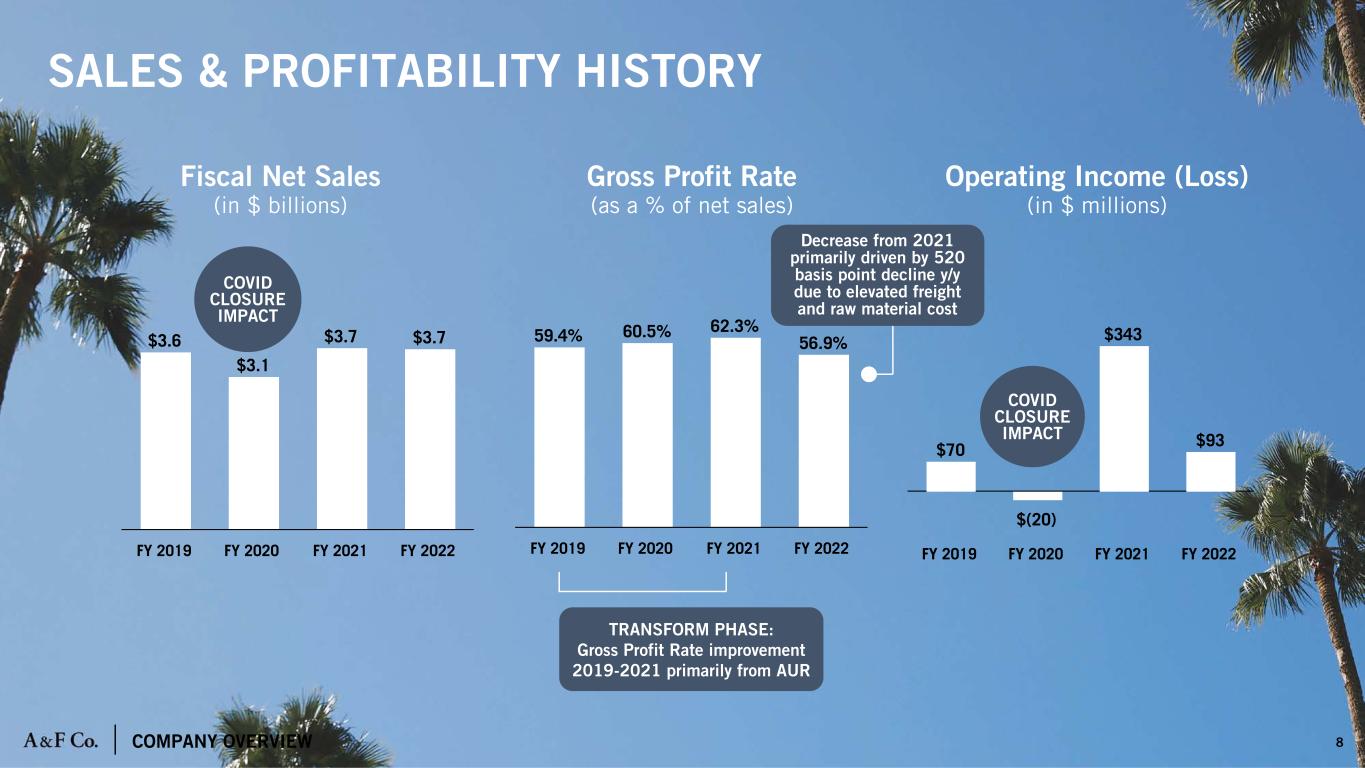
COMPANY OVERVIEW $3.6 $3.1 $3.7 $3.7 FY 2019 FY 2020 FY 2021 FY 2022 59.4% 60.5% 62.3% 56.9% FY 2019 FY 2020 FY 2021 FY 2022 SALES & PROFITABILITY HISTORY 8 $70 $(20) $343 $93 FY 2019 FY 2020 FY 2021 FY 2022 Fiscal Net Sales (in $ billions) Gross Profit Rate (as a % of net sales) Operating Income (Loss) (in $ millions) COVID CLOSURE IMPACT COVID CLOSURE IMPACT TRANSFORM PHASE: Gross Profit Rate improvement 2019-2021 primarily from AUR Decrease from 2021 primarily driven by 520 basis point decline y/y due to elevated freight and raw material cost
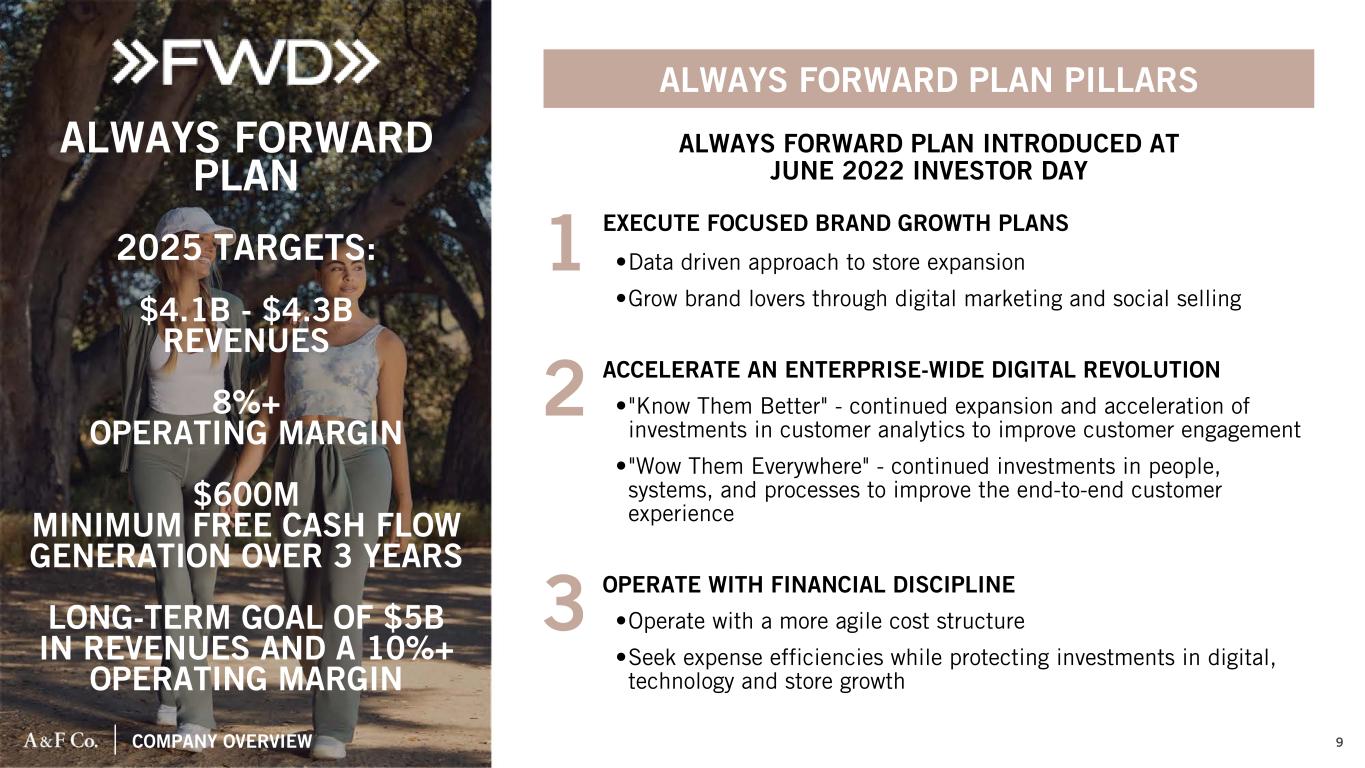
COMPANY OVERVIEW ALWAYS FORWARD PLAN EXECUTE FOCUSED BRAND GROWTH PLANS •Data driven approach to store expansion •Grow brand lovers through digital marketing and social selling ACCELERATE AN ENTERPRISE-WIDE DIGITAL REVOLUTION •"Know Them Better" - continued expansion and acceleration of investments in customer analytics to improve customer engagement •"Wow Them Everywhere" - continued investments in people, systems, and processes to improve the end-to-end customer experience OPERATE WITH FINANCIAL DISCIPLINE •Operate with a more agile cost structure •Seek expense efficiencies while protecting investments in digital, technology and store growth 2025 TARGETS: $4.1B - $4.3B REVENUES 8%+ OPERATING MARGIN $600M MINIMUM FREE CASH FLOW GENERATION OVER 3 YEARS LONG-TERM GOAL OF $5B IN REVENUES AND A 10%+ OPERATING MARGIN 1 2 3 9 ALWAYS FORWARD PLAN INTRODUCED AT JUNE 2022 INVESTOR DAY ALWAYS FORWARD PLAN PILLARS
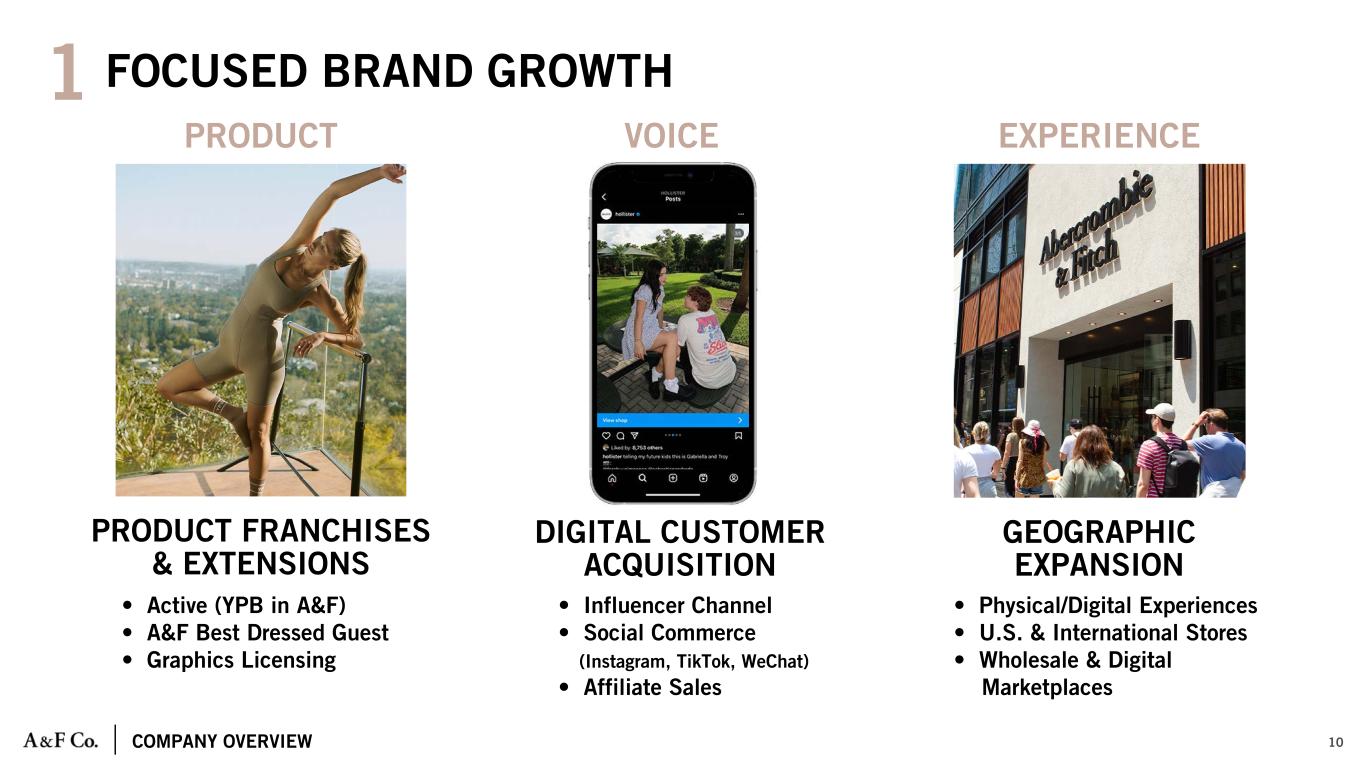
COMPANY OVERVIEW FOCUSED BRAND GROWTH 10 PRODUCT FRANCHISES & EXTENSIONS 1 • Active (YPB in A&F) • A&F Best Dressed Guest • Graphics Licensing DIGITAL CUSTOMER ACQUISITION • Influencer Channel • Social Commerce (Instagram, TikTok, WeChat) • Affiliate Sales GEOGRAPHIC EXPANSION • Physical/Digital Experiences • U.S. & International Stores • Wholesale & Digital Marketplaces PRODUCT VOICE EXPERIENCE
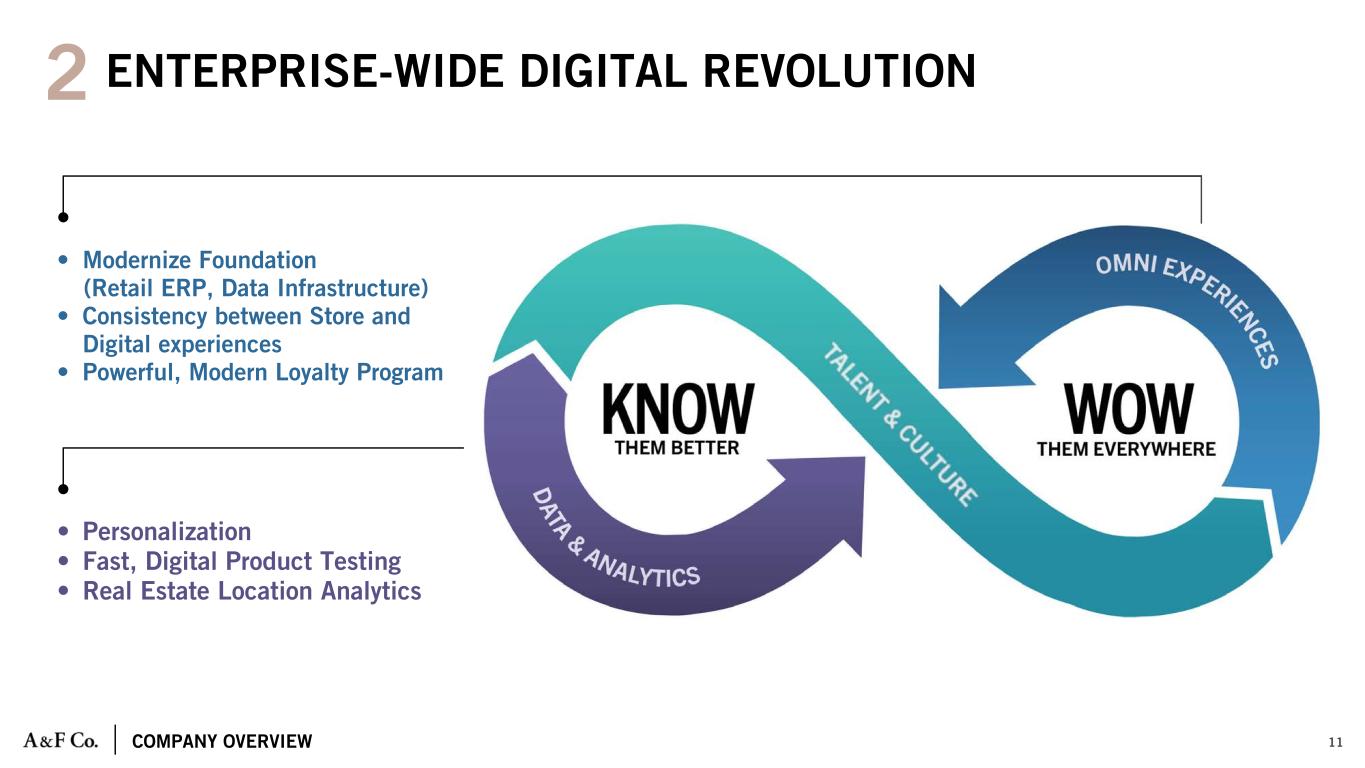
COMPANY OVERVIEW 11 • Personalization • Fast, Digital Product Testing • Real Estate Location Analytics • Modernize Foundation (Retail ERP, Data Infrastructure) • Consistency between Store and Digital experiences • Powerful, Modern Loyalty Program ENTERPRISE-WIDE DIGITAL REVOLUTION2
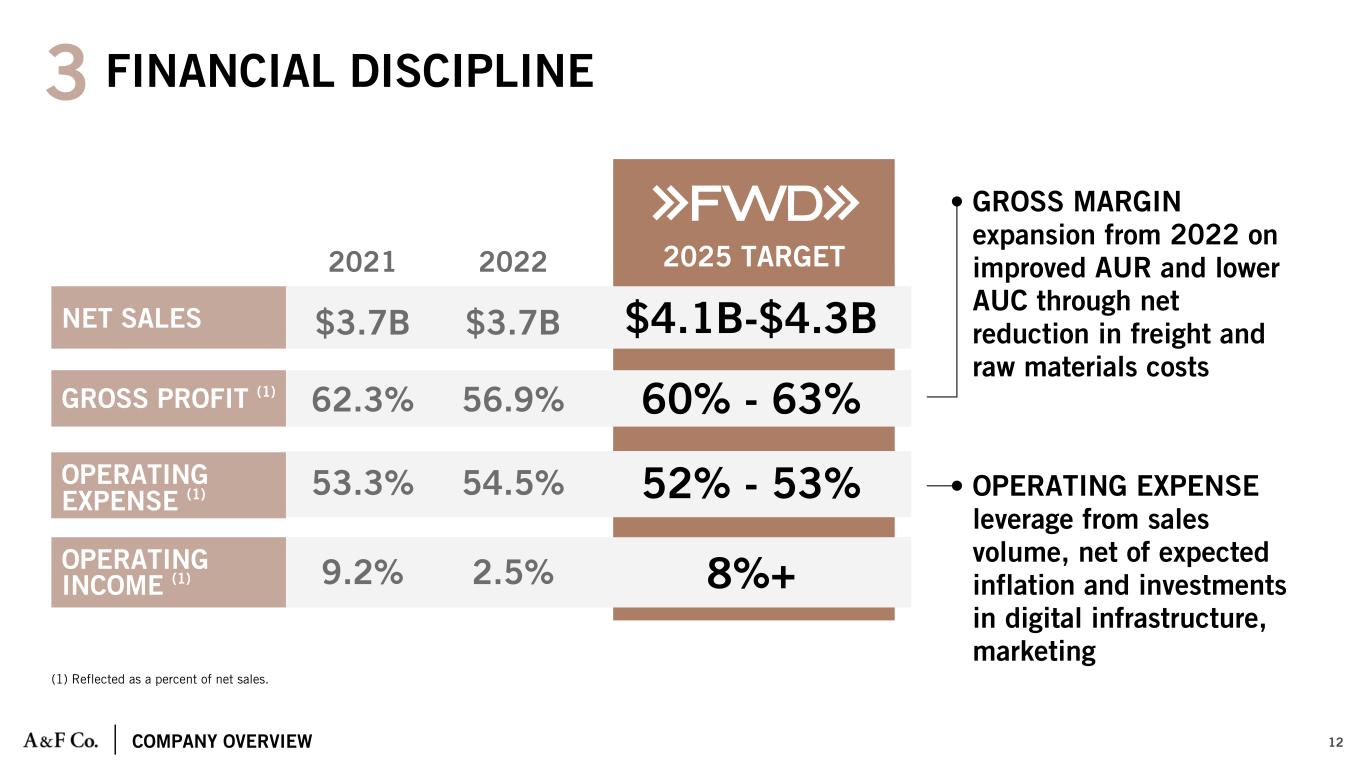
COMPANY OVERVIEW (1) Reflected as a percent of net sales. 12 $3.7B 56.9% 2022 54.5% 2.5% 2025 TARGET OPERATING EXPENSE (1) $4.1B-$4.3B 60% - 63% 52% - 53% 8%+OPERATING INCOME (1) GROSS MARGIN expansion from 2022 on improved AUR and lower AUC through net reduction in freight and raw materials costs OPERATING EXPENSE leverage from sales volume, net of expected inflation and investments in digital infrastructure, marketing GROSS PROFIT (1) NET SALES FINANCIAL DISCIPLINE3 $3.7B 62.3% 2021 53.3% 9.2%
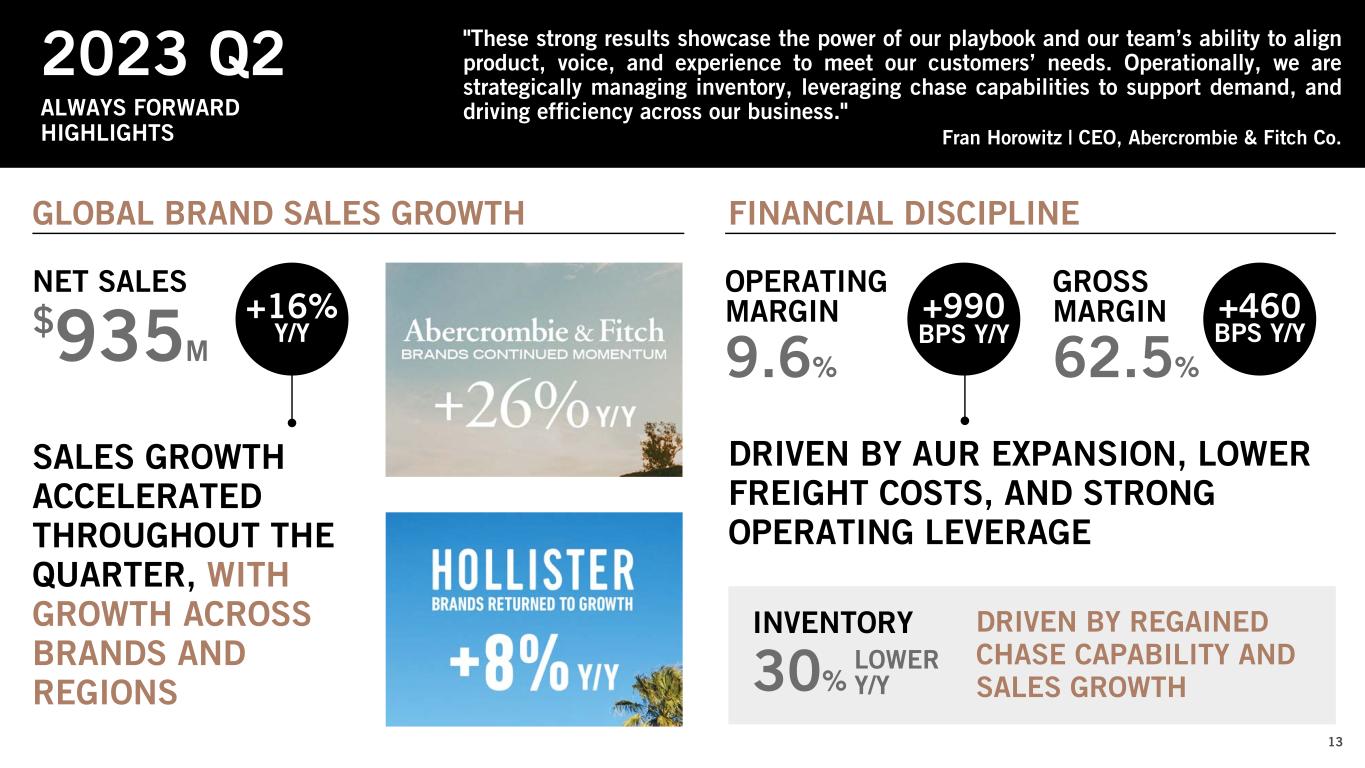
NET SALES GROSS MARGIN OPERATING MARGIN$935M 2023 Q2 62.5%9.6% ALWAYS FORWARD HIGHLIGHTS "These strong results showcase the power of our playbook and our team’s ability to align product, voice, and experience to meet our customers’ needs. Operationally, we are strategically managing inventory, leveraging chase capabilities to support demand, and driving efficiency across our business." Fran Horowitz | CEO, Abercrombie & Fitch Co. DRIVEN BY AUR EXPANSION, LOWER FREIGHT COSTS, AND STRONG OPERATING LEVERAGE +16% Y/Y +460 BPS Y/Y +990 BPS Y/Y 30% SALES GROWTH ACCELERATED THROUGHOUT THE QUARTER, WITH GROWTH ACROSS BRANDS AND REGIONS LOWER Y/Y DRIVEN BY REGAINED CHASE CAPABILITY AND SALES GROWTH GLOBAL BRAND SALES GROWTH FINANCIAL DISCIPLINE 13 INVENTORY
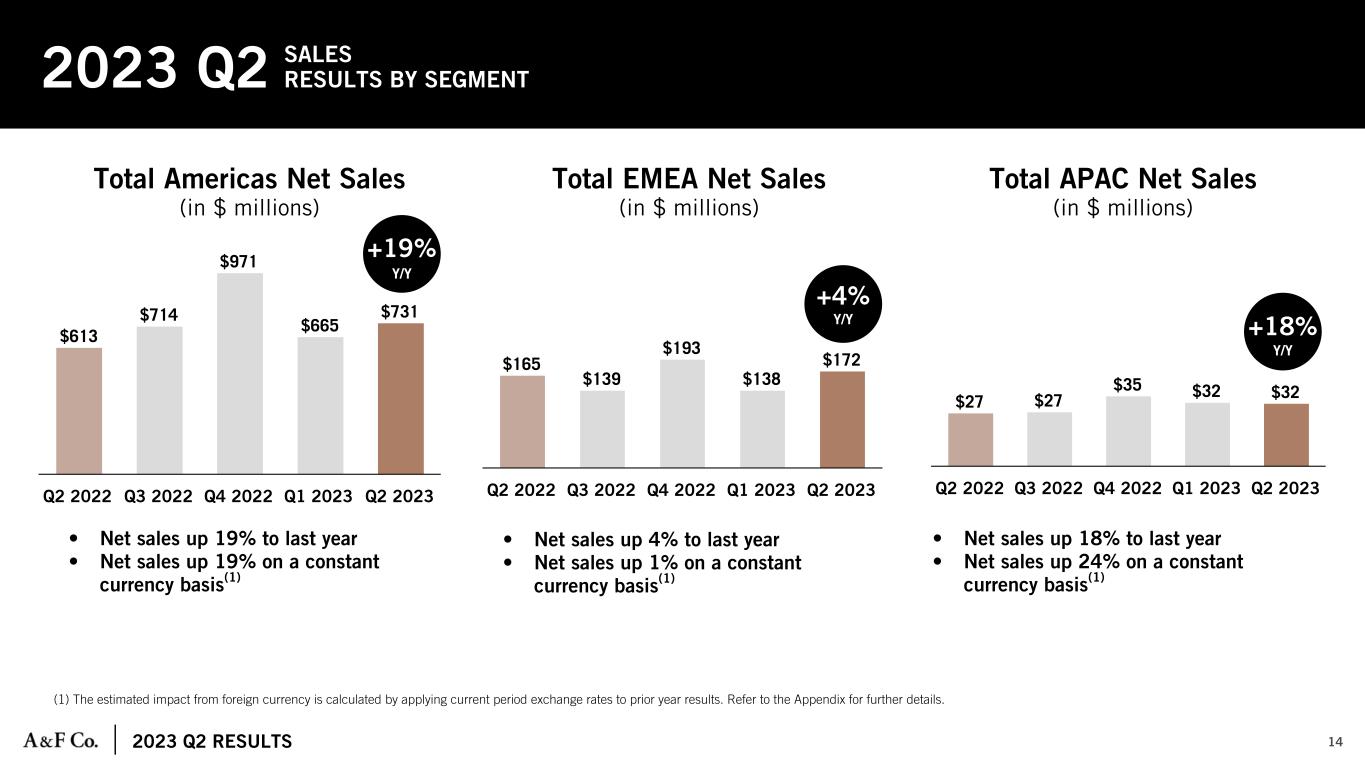
2023 Q2 RESULTS $27 $27 $35 $32 $32 Q2 2022 Q3 2022 Q4 2022 Q1 2023 Q2 2023 $613 $714 $971 $665 $731 Q2 2022 Q3 2022 Q4 2022 Q1 2023 Q2 2023 $165 $139 $193 $138 $172 Q2 2022 Q3 2022 Q4 2022 Q1 2023 Q2 2023 14 Total Americas Net Sales (in $ millions) Total EMEA Net Sales (in $ millions) Total APAC Net Sales (in $ millions) • Net sales up 19% to last year • Net sales up 19% on a constant currency basis(1) • Net sales up 4% to last year • Net sales up 1% on a constant currency basis(1) • Net sales up 18% to last year • Net sales up 24% on a constant currency basis(1) (1) The estimated impact from foreign currency is calculated by applying current period exchange rates to prior year results. Refer to the Appendix for further details. 2023 Q2 SALES RESULTS BY SEGMENT +19% Y/Y +4% Y/Y +18% Y/Y
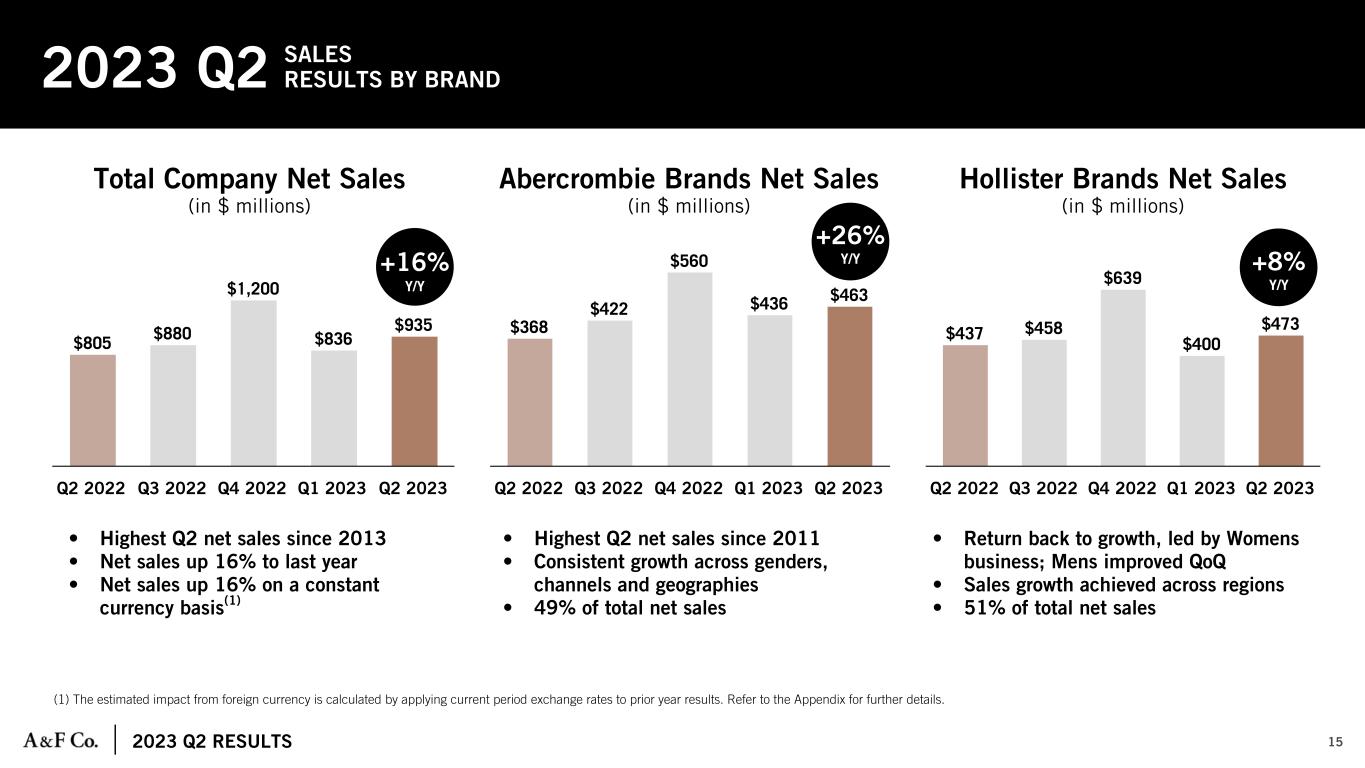
2023 Q2 RESULTS $437 $458 $639 $400 $473 Q2 2022 Q3 2022 Q4 2022 Q1 2023 Q2 2023 $805 $880 $1,200 $836 $935 Q2 2022 Q3 2022 Q4 2022 Q1 2023 Q2 2023 +26% Y/Y $368 $422 $560 $436 $463 Q2 2022 Q3 2022 Q4 2022 Q1 2023 Q2 2023 15 Total Company Net Sales (in $ millions) Abercrombie Brands Net Sales (in $ millions) Hollister Brands Net Sales (in $ millions) • Highest Q2 net sales since 2013 • Net sales up 16% to last year • Net sales up 16% on a constant currency basis(1) • Highest Q2 net sales since 2011 • Consistent growth across genders, channels and geographies • 49% of total net sales • Return back to growth, led by Womens business; Mens improved QoQ • Sales growth achieved across regions • 51% of total net sales (1) The estimated impact from foreign currency is calculated by applying current period exchange rates to prior year results. Refer to the Appendix for further details. 2023 Q2 SALES RESULTS BY BRAND +16% Y/Y +8% Y/Y
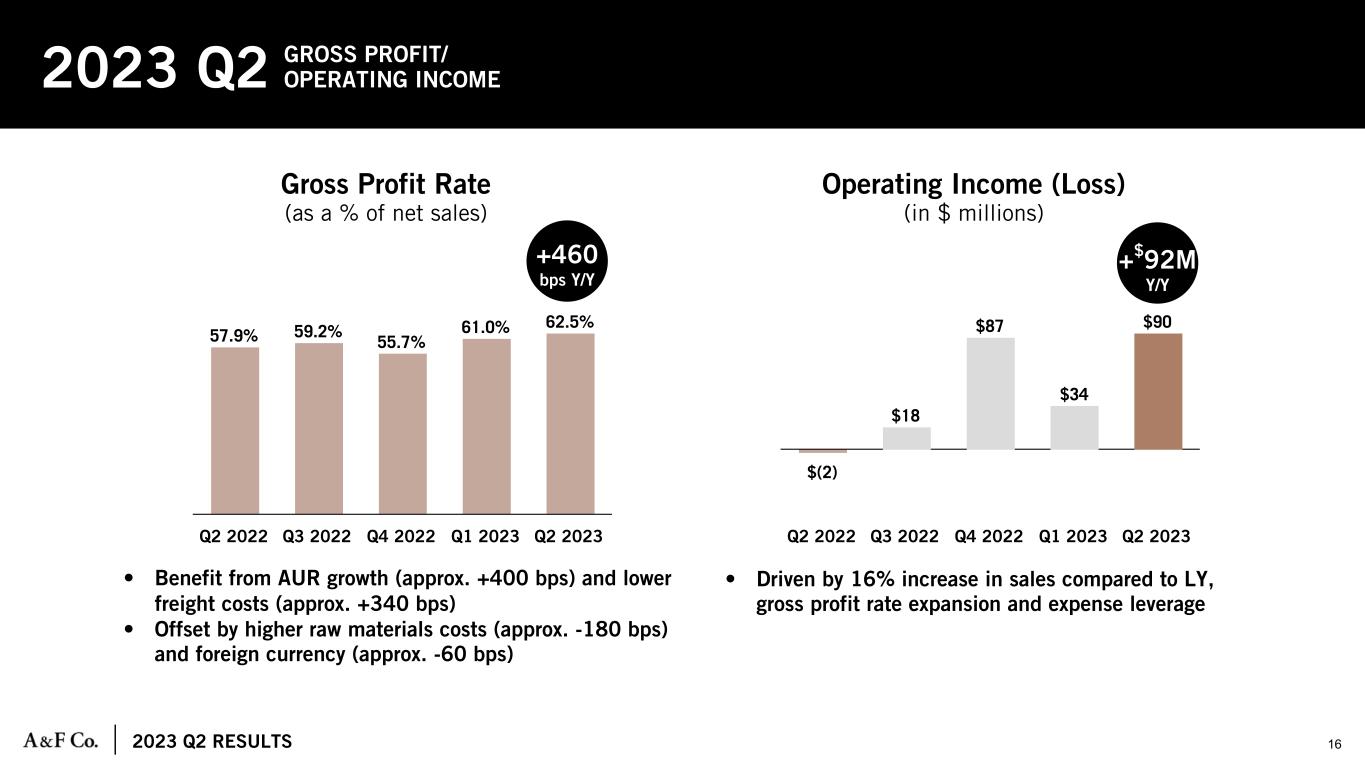
2023 Q2 RESULTS • Benefit from AUR growth (approx. +400 bps) and lower freight costs (approx. +340 bps) • Offset by higher raw materials costs (approx. -180 bps) and foreign currency (approx. -60 bps) 57.9% 59.2% 55.7% 61.0% 62.5% Q2 2022 Q3 2022 Q4 2022 Q1 2023 Q2 2023 $(2) $18 $87 $34 $90 Q2 2022 Q3 2022 Q4 2022 Q1 2023 Q2 2023 16 Gross Profit Rate (as a % of net sales) Operating Income (Loss) (in $ millions) • Driven by 16% increase in sales compared to LY, gross profit rate expansion and expense leverage 2023 Q2 GROSS PROFIT/ OPERATING INCOME +460 bps Y/Y +$92M Y/Y
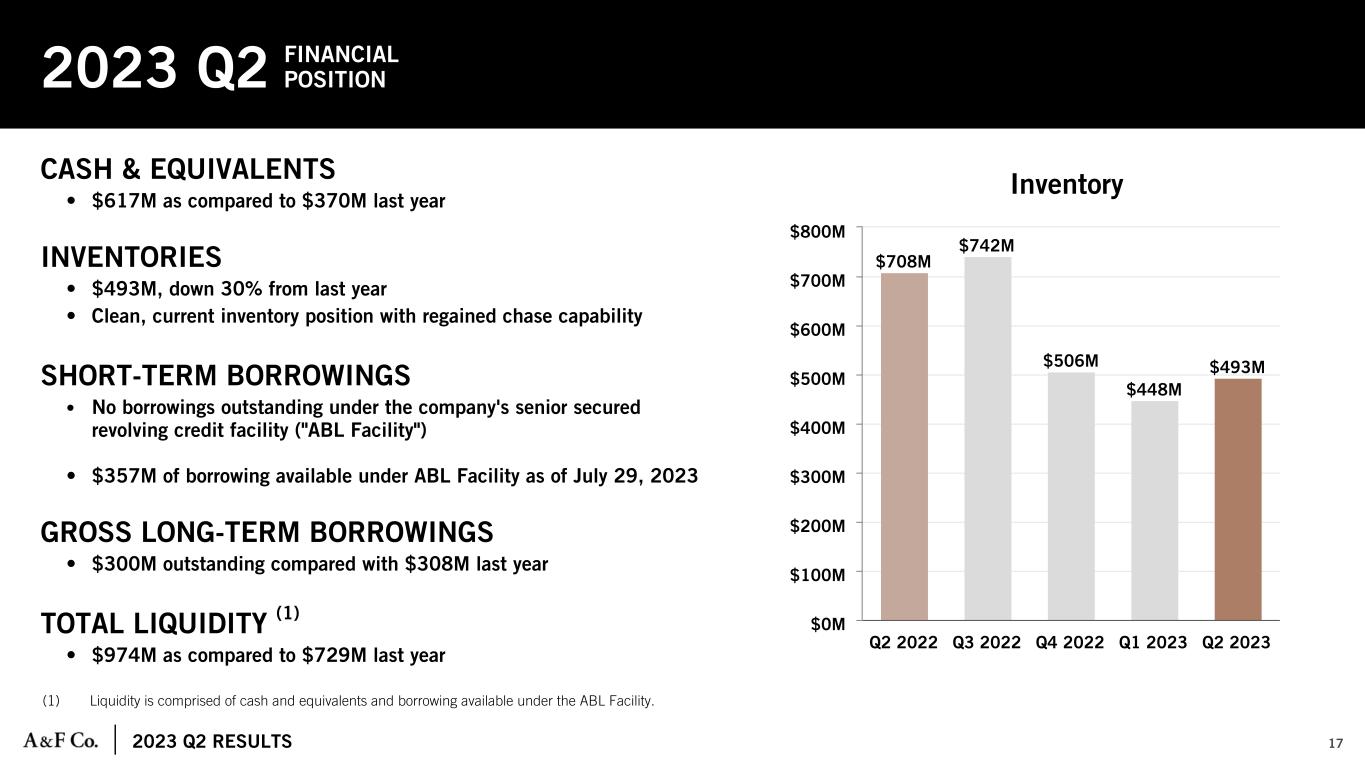
2023 Q2 RESULTS CASH & EQUIVALENTS • $617M as compared to $370M last year INVENTORIES • $493M, down 30% from last year • Clean, current inventory position with regained chase capability SHORT-TERM BORROWINGS • No borrowings outstanding under the company's senior secured revolving credit facility ("ABL Facility") • $357M of borrowing available under ABL Facility as of July 29, 2023 GROSS LONG-TERM BORROWINGS • $300M outstanding compared with $308M last year TOTAL LIQUIDITY (1) • $974M as compared to $729M last year $708M $742M $506M $448M $493M Q2 2022 Q3 2022 Q4 2022 Q1 2023 Q2 2023 $0M $100M $200M $300M $400M $500M $600M $700M $800M (1) Liquidity is comprised of cash and equivalents and borrowing available under the ABL Facility. 17 Inventory 2023 Q2 FINANCIAL POSITION
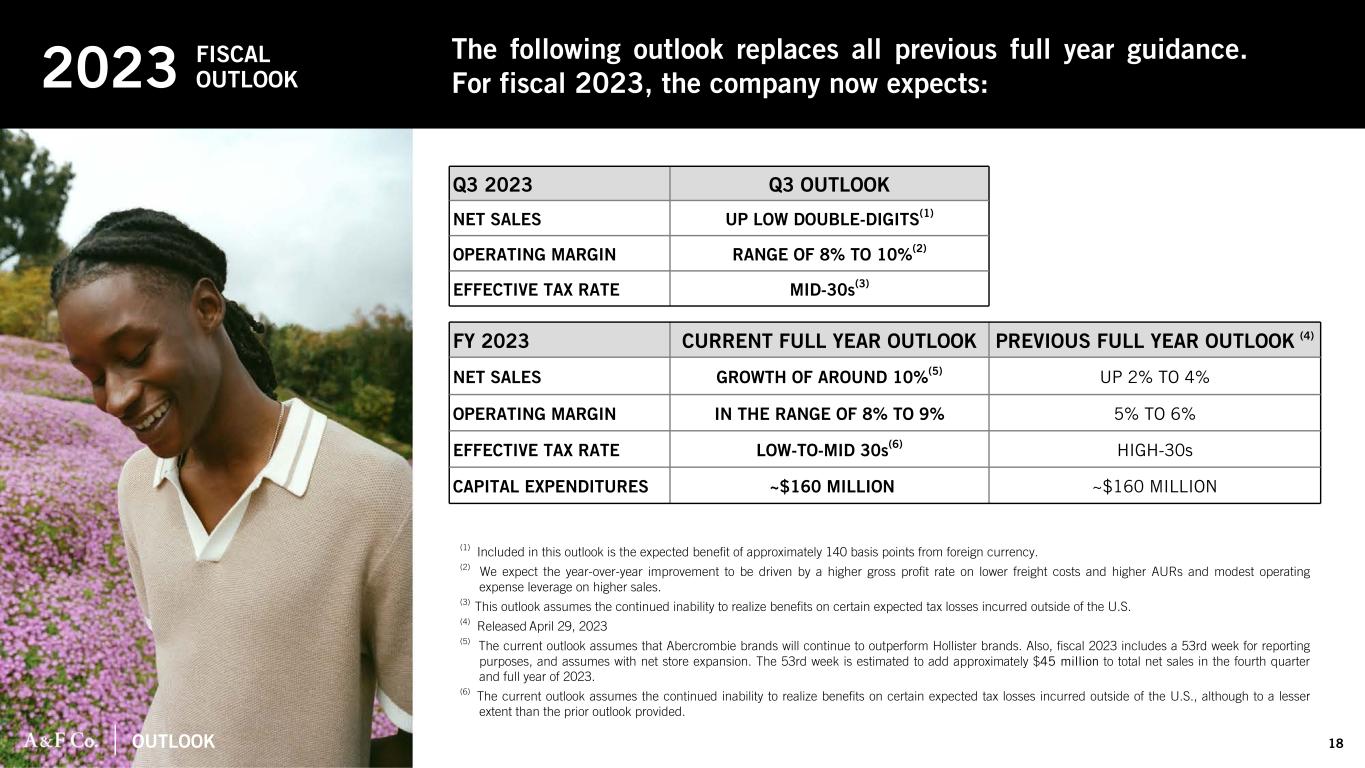
OUTLOOK 18 2023 FISCAL OUTLOOK The following outlook replaces all previous full year guidance. For fiscal 2023, the company now expects: PREVIOUS FULL YEAR OUTLOOK (1) Q3 2023 Q3 OUTLOOK NET SALES UP LOW DOUBLE-DIGITS(1) OPERATING MARGIN RANGE OF 8% TO 10%(2) EFFECTIVE TAX RATE MID-30s(3) FY 2023 CURRENT FULL YEAR OUTLOOK PREVIOUS FULL YEAR OUTLOOK (4) NET SALES GROWTH OF AROUND 10%(5) UP 2% TO 4% OPERATING MARGIN IN THE RANGE OF 8% TO 9% 5% TO 6% EFFECTIVE TAX RATE LOW-TO-MID 30s(6) HIGH-30s CAPITAL EXPENDITURES ~$160 MILLION ~$160 MILLION (1) Included in this outlook is the expected benefit of approximately 140 basis points from foreign currency. (2) We expect the year-over-year improvement to be driven by a higher gross profit rate on lower freight costs and higher AURs and modest operating expense leverage on higher sales. (3) This outlook assumes the continued inability to realize benefits on certain expected tax losses incurred outside of the U.S. (4) Released April 29, 2023 (5) The current outlook assumes that Abercrombie brands will continue to outperform Hollister brands. Also, fiscal 2023 includes a 53rd week for reporting purposes, and assumes with net store expansion. The 53rd week is estimated to add approximately $45 million to total net sales in the fourth quarter and full year of 2023. (6) The current outlook assumes the continued inability to realize benefits on certain expected tax losses incurred outside of the U.S., although to a lesser extent than the prior outlook provided.

19 APPENDIX
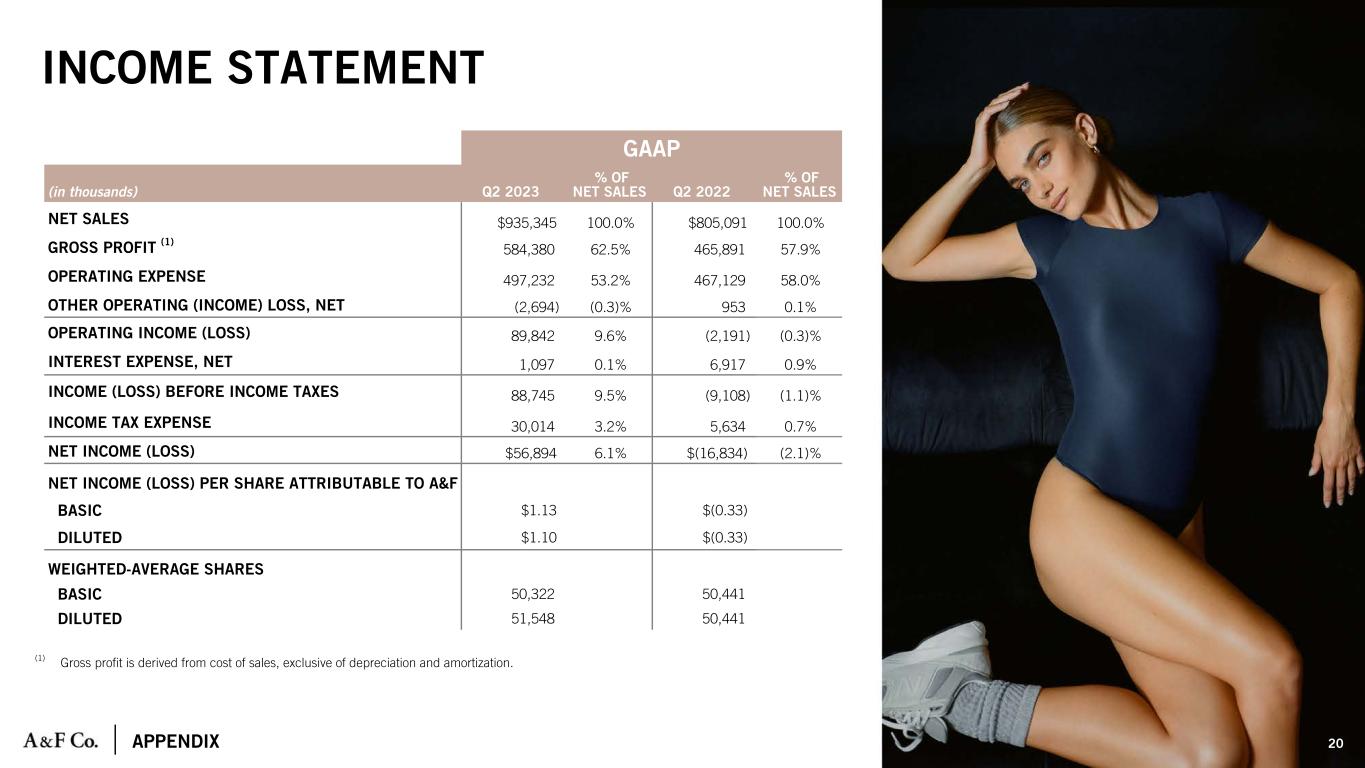
APPENDIX INCOME STATEMENT (1) Gross profit is derived from cost of sales, exclusive of depreciation and amortization. GAAP (in thousands) Q2 2023 % OF NET SALES Q2 2022 % OF NET SALES NET SALES $935,345 100.0% $805,091 100.0% GROSS PROFIT (1) 584,380 62.5% 465,891 57.9% OPERATING EXPENSE 497,232 53.2% 467,129 58.0% OTHER OPERATING (INCOME) LOSS, NET (2,694) (0.3)% 953 0.1% OPERATING INCOME (LOSS) 89,842 9.6% (2,191) (0.3)% INTEREST EXPENSE, NET 1,097 0.1% 6,917 0.9% INCOME (LOSS) BEFORE INCOME TAXES 88,745 9.5% (9,108) (1.1)% INCOME TAX EXPENSE 30,014 3.2% 5,634 0.7% NET INCOME (LOSS) $56,894 6.1% $(16,834) (2.1)% NET INCOME (LOSS) PER SHARE ATTRIBUTABLE TO A&F BASIC $1.13 $(0.33) DILUTED $1.10 $(0.33) WEIGHTED-AVERAGE SHARES BASIC 50,322 50,441 DILUTED 51,548 50,441 20
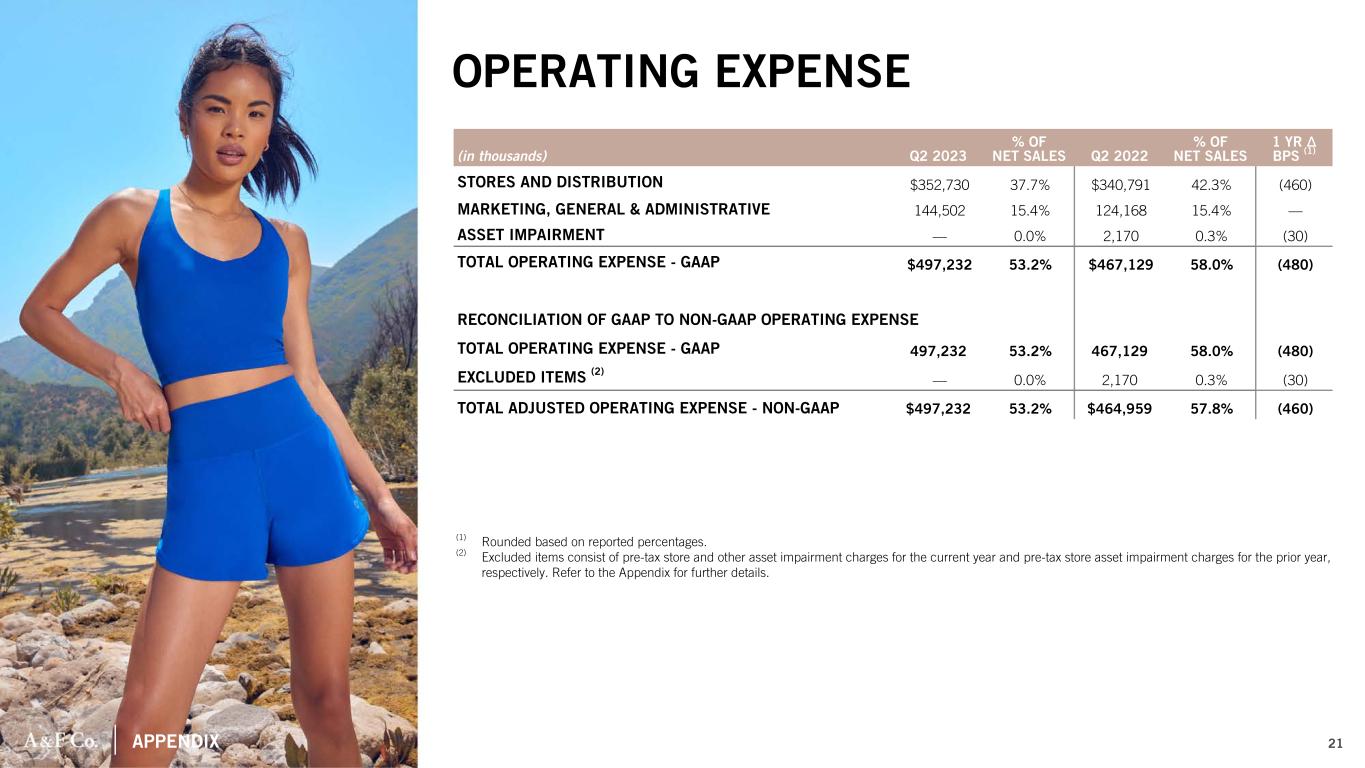
APPENDIX (in thousands) Q2 2023 % OF NET SALES Q2 2022 % OF NET SALES 1 YR Δ BPS (1) STORES AND DISTRIBUTION $352,730 37.7% $340,791 42.3% (460) MARKETING, GENERAL & ADMINISTRATIVE 144,502 15.4% 124,168 15.4% — ASSET IMPAIRMENT — 0.0% 2,170 0.3% (30) TOTAL OPERATING EXPENSE - GAAP $497,232 53.2% $467,129 58.0% (480) RECONCILIATION OF GAAP TO NON-GAAP OPERATING EXPENSE TOTAL OPERATING EXPENSE - GAAP 497,232 53.2% 467,129 58.0% (480) EXCLUDED ITEMS (2) — 0.0% 2,170 0.3% (30) TOTAL ADJUSTED OPERATING EXPENSE - NON-GAAP $497,232 53.2% $464,959 57.8% (460) (1) Rounded based on reported percentages. (2) Excluded items consist of pre-tax store and other asset impairment charges for the current year and pre-tax store asset impairment charges for the prior year, respectively. Refer to the Appendix for further details. OPERATING EXPENSE 21
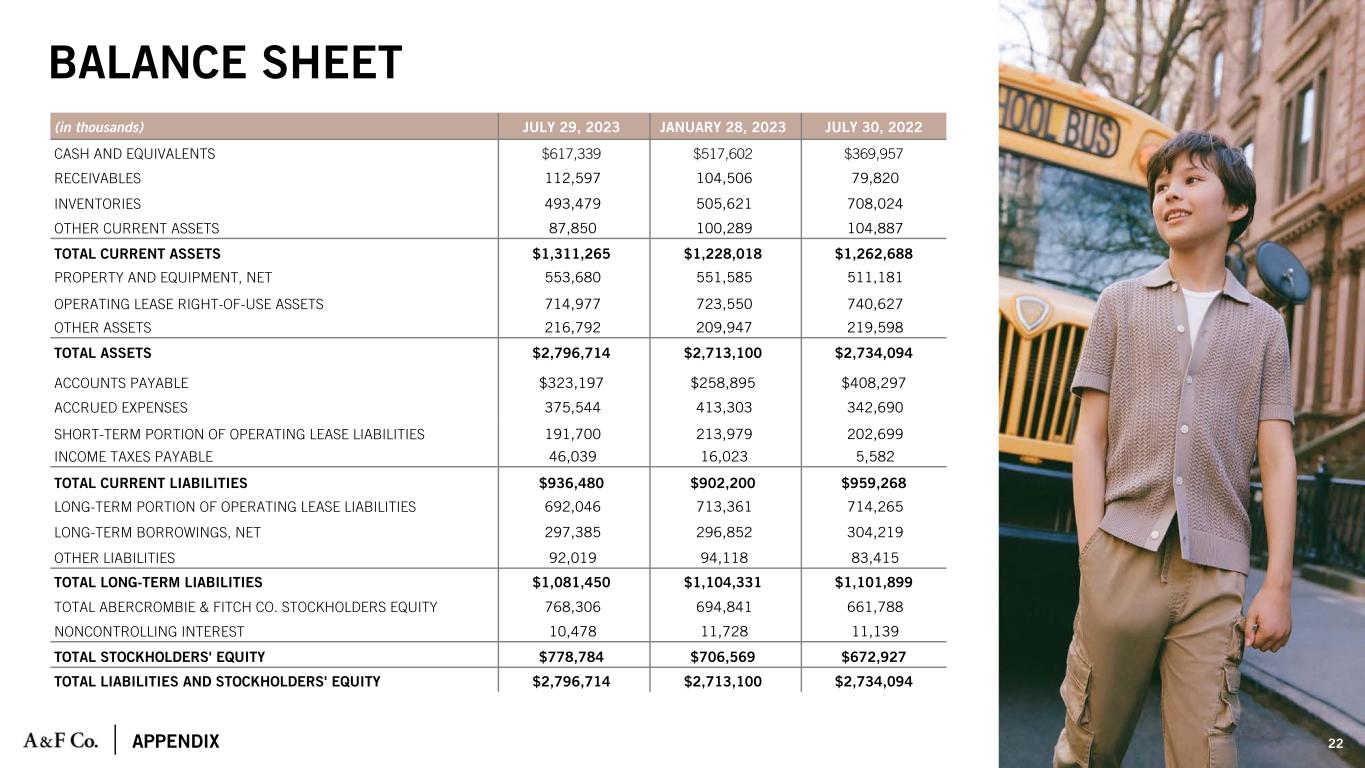
APPENDIX (in thousands) JULY 29, 2023 JANUARY 28, 2023 JULY 30, 2022 CASH AND EQUIVALENTS $617,339 $517,602 $369,957 RECEIVABLES 112,597 104,506 79,820 INVENTORIES 493,479 505,621 708,024 OTHER CURRENT ASSETS 87,850 100,289 104,887 TOTAL CURRENT ASSETS $1,311,265 $1,228,018 $1,262,688 PROPERTY AND EQUIPMENT, NET 553,680 551,585 511,181 OPERATING LEASE RIGHT-OF-USE ASSETS 714,977 723,550 740,627 OTHER ASSETS 216,792 209,947 219,598 TOTAL ASSETS $2,796,714 $2,713,100 $2,734,094 ACCOUNTS PAYABLE $323,197 $258,895 $408,297 ACCRUED EXPENSES 375,544 413,303 342,690 SHORT-TERM PORTION OF OPERATING LEASE LIABILITIES 191,700 213,979 202,699 INCOME TAXES PAYABLE 46,039 16,023 5,582 TOTAL CURRENT LIABILITIES $936,480 $902,200 $959,268 LONG-TERM PORTION OF OPERATING LEASE LIABILITIES 692,046 713,361 714,265 LONG-TERM BORROWINGS, NET 297,385 296,852 304,219 OTHER LIABILITIES 92,019 94,118 83,415 TOTAL LONG-TERM LIABILITIES $1,081,450 $1,104,331 $1,101,899 TOTAL ABERCROMBIE & FITCH CO. STOCKHOLDERS EQUITY 768,306 694,841 661,788 NONCONTROLLING INTEREST 10,478 11,728 11,139 TOTAL STOCKHOLDERS' EQUITY $778,784 $706,569 $672,927 TOTAL LIABILITIES AND STOCKHOLDERS' EQUITY $2,796,714 $2,713,100 $2,734,094 22 BALANCE SHEET
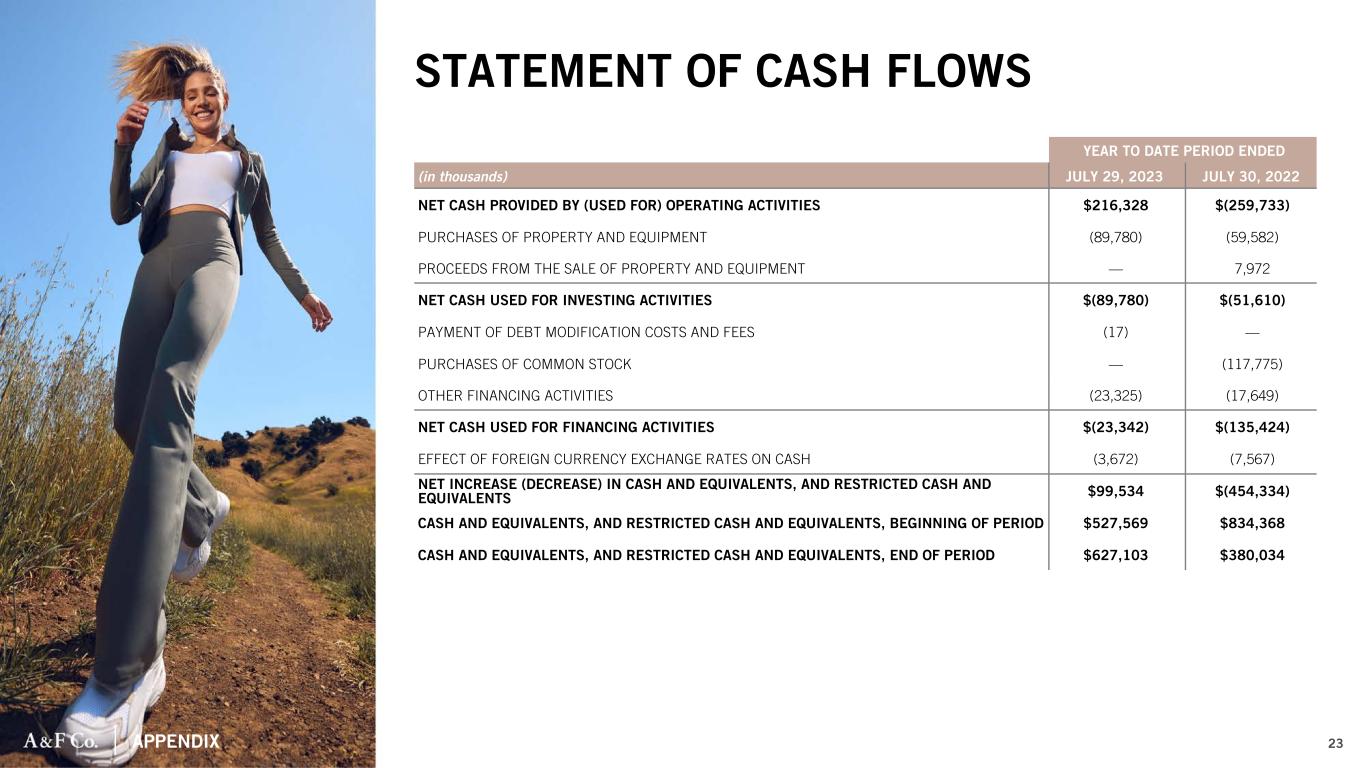
APPENDIX YEAR TO DATE PERIOD ENDED (in thousands) JULY 29, 2023 JULY 30, 2022 NET CASH PROVIDED BY (USED FOR) OPERATING ACTIVITIES $216,328 $(259,733) PURCHASES OF PROPERTY AND EQUIPMENT (89,780) (59,582) PROCEEDS FROM THE SALE OF PROPERTY AND EQUIPMENT — 7,972 NET CASH USED FOR INVESTING ACTIVITIES $(89,780) $(51,610) PAYMENT OF DEBT MODIFICATION COSTS AND FEES (17) — PURCHASES OF COMMON STOCK — (117,775) OTHER FINANCING ACTIVITIES (23,325) (17,649) NET CASH USED FOR FINANCING ACTIVITIES $(23,342) $(135,424) EFFECT OF FOREIGN CURRENCY EXCHANGE RATES ON CASH (3,672) (7,567) NET INCREASE (DECREASE) IN CASH AND EQUIVALENTS, AND RESTRICTED CASH AND EQUIVALENTS $99,534 $(454,334) CASH AND EQUIVALENTS, AND RESTRICTED CASH AND EQUIVALENTS, BEGINNING OF PERIOD $527,569 $834,368 CASH AND EQUIVALENTS, AND RESTRICTED CASH AND EQUIVALENTS, END OF PERIOD $627,103 $380,034 STATEMENT OF CASH FLOWS 23
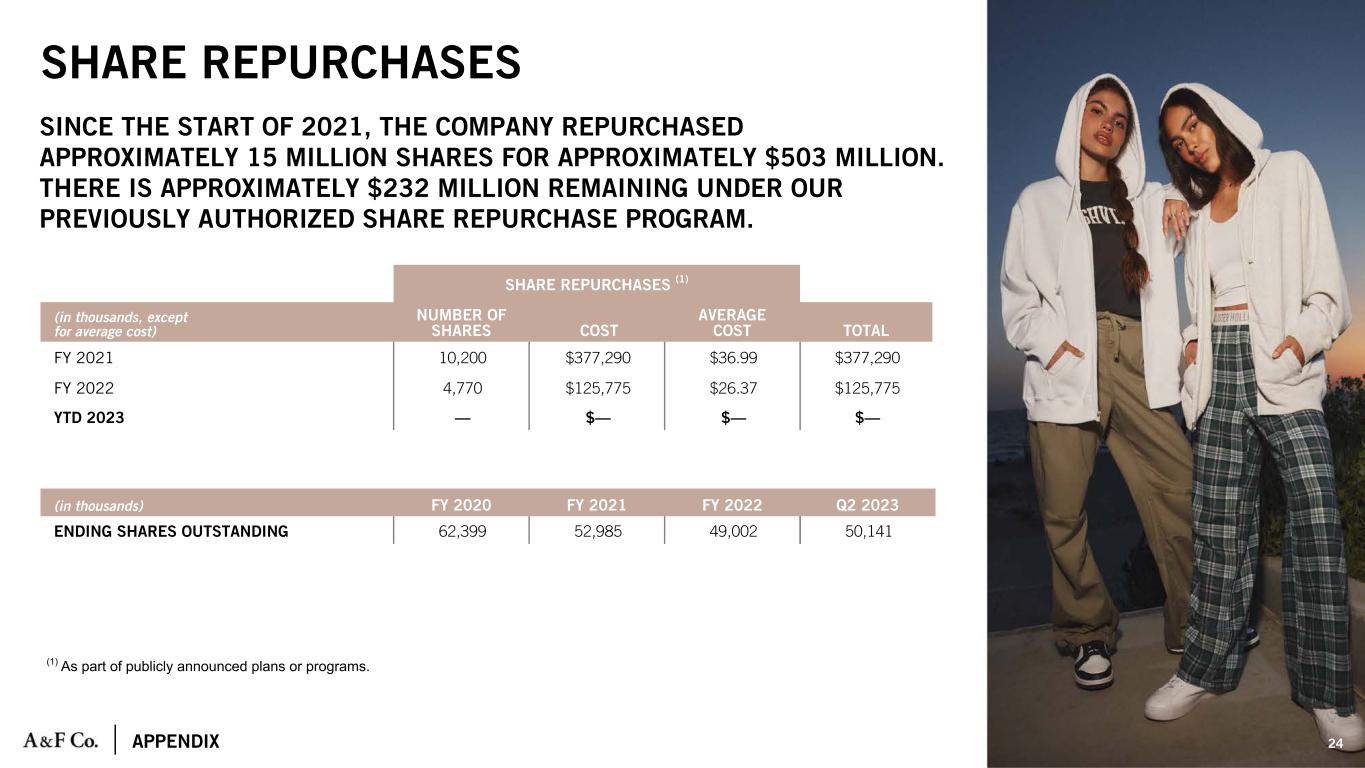
APPENDIX SINCE THE START OF 2021, THE COMPANY REPURCHASED APPROXIMATELY 15 MILLION SHARES FOR APPROXIMATELY $503 MILLION. THERE IS APPROXIMATELY $232 MILLION REMAINING UNDER OUR PREVIOUSLY AUTHORIZED SHARE REPURCHASE PROGRAM. SHARE REPURCHASES (1) (in thousands, except for average cost) NUMBER OF SHARES COST AVERAGE COST TOTAL FY 2021 10,200 $377,290 $36.99 $377,290 FY 2022 4,770 $125,775 $26.37 $125,775 YTD 2023 — $— $— $— (in thousands) FY 2020 FY 2021 FY 2022 Q2 2023 ENDING SHARES OUTSTANDING 62,399 52,985 49,002 50,141 24 SHARE REPURCHASES (1) As part of publicly announced plans or programs.
APPENDIX NET SALES Q2 2023 Q2 2022 Δ % GAAP $935,345 $805,091 16% IMPACT FROM CHANGES IN FOREIGN CURRENCY EXCHANGE RATES (1) — 2,873 0% NON-GAAP CONSTANT CURRENCY BASIS $935,345 $807,964 16% GROSS PROFIT Q2 2023 Q2 2022 Δ BPS (2) GAAP $584,380 $465,891 460 IMPACT FROM CHANGES IN FOREIGN CURRENCY EXCHANGE RATES (1) — (2,977) 60 NON-GAAP CONSTANT CURRENCY BASIS $584,380 $462,914 520 OPERATING INCOME (LOSS) Q2 2023 Q2 2022 Δ BPS (2) GAAP $89,842 $(2,191) 990 EXCLUDED ITEMS (3) — (2,170) 30 ADJUSTED NON-GAAP $89,842 $(21) 960 IMPACT FROM CHANGES IN FOREIGN CURRENCY EXCHANGE RATES (1) — (971) 10 ADJUSTED NON-GAAP CONSTANT CURRENCY BASIS $89,842 $(992) 970 NET INCOME (LOSS) PER DILUTED SHARE Q2 2023 Q2 2022 Δ $ GAAP $1.10 $(0.33) $1.43 EXCLUDED ITEMS, NET OF TAX (3) — (0.03) 0.03 ADJUSTED NON-GAAP $1.10 $(0.30) $1.40 IMPACT FROM CHANGES IN FOREIGN CURRENCY EXCHANGE RATES (1) — (0.02) 0.02 ADJUSTED NON-GAAP CONSTANT CURRENCY BASIS $1.10 $(0.32) $1.42 (1) The impact from foreign currency is determined by applying current period exchange rates to prior year results and is net of the year-over-year impact from hedging. The per diluted share impact from foreign currency is calculated using a 26% tax rate. (2) The estimated basis point impact has been rounded based on the percentage change. (3) Excluded items consist of pre-tax store asset impairment charges. for the current year and pre-tax store asset impairment charges for the prior year, respectively. RECONCILIATION OF GAAP TO NON-GAAP RESULTS 25 STATEMENT OF OPERATIONS
APPENDIX (1) The estimated impact from foreign currency is determined by applying current period exchange rates to prior year results and is net of the year-over-year impact from hedging. The per diluted share estimated impact from foreign currency is calculated using a 26% tax rate. (2) Net sales by segment are presented by attributing revenues to an individual country on the basis of the country in which the merchandise was sold for in-store purchases and on the basis of the shipping location provided by customers for digital orders. (3) Abercrombie includes the Abercrombie & Fitch and abercrombie kids brands. (4) Hollister includes the Hollister, Gilly Hicks and Social Tourist brands. (in thousands) Q2 2023 Q2 2022 GAAP Δ % NON-GAAP CONSTANT CURRENCY BASIS Δ %GAAP IMPACT FROM CHANGES IN FOREIGN CURRENCY EXCHANGE RATES (1) NON-GAAP CONSTANT CURRENCY BASIS NET SALES BY SEGMENT: (2) AMERICAS $ 731,427 $ 613,244 $ (1,174) $ 612,070 19% 19% EMEA 171,962 164,827 5,306 170,133 4% 1% APAC 31,956 27,020 (1,259) 25,761 18% 24% TOTAL COMPANY $ 935,345 $ 805,091 $ 2,873 $ 807,964 16% 16% (in thousands) Q2 2023 Q2 2022 GAAP Δ % NON-GAAP CONSTANT CURRENCY BASIS Δ % GAAP IMPACT FROM CHANGES IN FOREIGN CURRENCY EXCHANGE RATES (1) NON-GAAP CONSTANT CURRENCY BASIS NET SALES BY BRAND: ABERCROMBIE (3) $ 462,711 $ 368,157 $ (71) $ 368,086 26% 26% HOLLISTER (4) 472,634 436,934 2,944 439,878 8% 7% TOTAL COMPANY $ 935,345 $ 805,091 $ 2,873 $ 807,964 16% 16% RECONCILIATION OF GAAP TO NON-GAAP RESULTS 26 NET SALES BY GEOGRAPHY AND BRAND