
ANGO 8-K
Angiodynamics Inc (ANGO)
8-K
2022-07-12
For: 2022-07-12
View Original
Added on
April 10, 2026
UNITED STATES
SECURITIES AND EXCHANGE COMMISSION
WASHINGTON, D.C. 20549
__________
FORM 8-K
CURRENT REPORT
Pursuant to Section 13 or 15(d) of the
Securities Exchange Act of 1934
Date of Report (Date of earliest event reported): July 12, 2022
(Exact Name of Registrant as Specified in Charter)
|
|
|
|
|
(State or Other Jurisdiction of Incorporation)
|
(Commission File
Number)
|
(IRS Employer
Identification No.)
|
|
|
|
|
(Address of Principal Executive Offices)
|
(Zip Code) |
|
(
|
|
(Registrant’s telephone number, including area code)
|
Check the appropriate box below if the
Form 8-K filing is intended to simultaneously satisfy the filing obligation of the registrant under any of the following provisions:
|
Written communications pursuant to Rule 425 under the Securities Act (17 CFR 230.425)
|
|
Soliciting material pursuant to Rule 14a-12 under the Exchange Act (17 CFR 240.14a-12)
|
|
Pre-commencement communications pursuant to Rule 14d-2(b) under the Exchange Act (17 CFR 240.14d-2 (b))
|
|
Pre-commencement communications pursuant to Rule 13e-4(c) under the Exchange Act (17 CFR 240.13e-4 (c))
|
Securities registered pursuant to Section 12(b) of the Act:
|
Title of each class
|
Trading Symbol(s)
|
Name of each exchange on which
registered |
|
|
|
|
Indicate by check mark whether the registrant is an emerging growth company as defined in Rule 405 of the Securities Act
of 1933 (§230.405 of this chapter) or Rule 12b-2 of the Securities Exchange Act of 1934 (§240.12b-2 of this chapter).
Emerging growth company ☐
If an emerging growth company, indicate by check mark if the registrant has elected not to use the extended transition
period for complying with any new or revised financial accounting standards provided pursuant to Section 13(a) of the Exchange Act. ☐
Item 2.02 – Results of Operations and Financial Condition.
On July 12, 2022, AngioDynamics, Inc. (“AngioDynamics”) issued a press release announcing financial results for the fiscal fourth
quarter and full year ended May 31, 2022. A copy of the press release is furnished herewith as Exhibit 99.1.
The information set forth in Item 2.02 of this Form 8-K (including Exhibit 99.1) shall not be deemed “filed” for purposes of Section 18 of
the Securities Exchange Act of 1934, as amended (the “Exchange Act”), or otherwise subject to the liabilities under that Section. Furthermore, such information shall not be deemed to be incorporated by reference into any filing under the Securities
Act of 1933, as amended (the “Securities Act”), or the Exchange Act, except as shall be expressly set forth by specific reference in such a filing.
Item 7.01 – Regulation FD Disclosure.
Presentation slides discussing AngioDynamics and its fiscal fourth quarter and full year ended May 31, 2022 are furnished herewith as
Exhibit 99.2.
The presentation slides furnished pursuant to Item 7.01 of this Form 8-K (including Exhibit 99.2) shall not be deemed “filed” for
purposes of Section 18 of the Exchange Act, or otherwise subject to the liabilities under that Section. Furthermore, the presentation slides shall not be deemed to be incorporated by reference into any filing under the Securities Act or the Exchange
Act.
Forward-Looking Statements
This document and its attachments contain forward-looking statements within the meaning of the Private Securities Litigation Reform Act of
1995. All statements regarding AngioDynamics’ expected future financial position, results of operations, cash flows, business strategy, budgets, projected costs, capital expenditures, products, competitive positions, growth opportunities, plans and
objectives of management for future operations, as well as statements that include the words such as “expects,” “reaffirms,” “intends,” “anticipates,” “plans,” “believes,” “seeks,” “estimates,” “projects”, “optimistic,” or variations of such words
and similar expressions, are forward-looking statements. These forward-looking statements are not guarantees of future performance and are subject to risks and uncertainties. Investors are cautioned that actual events or results may differ materially
from AngioDynamics’ expectations, expressed or implied. Factors that may affect the actual results achieved by AngioDynamics include, without limitation, the scale and scope of the COVID-19 global pandemic, the ability of AngioDynamics to develop its
existing and new products, technological advances and patents attained by competitors, infringement of AngioDynamics’ technology or assertions that AngioDynamics’ technology infringes the technology of third parties, the ability of AngioDynamics to
effectively compete against competitors that have substantially greater resources, future actions by the FDA or other regulatory agencies, domestic and foreign health care reforms and government regulations, results of pending or future clinical
trials, overall economic conditions (including inflation, labor shortages and supply chain challenges including the cost and availability of raw materials), the results of on-going litigation, challenges with respect to third-party distributors or
joint venture partners or collaborators, the results of sales efforts, the effects of product recalls and product liability claims, changes in key personnel, the ability of AngioDynamics to execute on strategic initiatives, the effects of economic,
credit and capital market conditions, general market conditions, market acceptance, foreign currency exchange rate fluctuations, the effects on pricing from group purchasing organizations and competition, the ability of AngioDynamics to obtain
regulatory clearances or approval of its products, or to integrate acquired businesses, as well as the risk factors listed from time to time in AngioDynamics’ SEC filings, including but not limited to its Annual Report on Form 10-K for the year ended
May 31, 2021. AngioDynamics does not assume any obligation to publicly update or revise any forward-looking statements for any reason.
Item 9.01 – Financial Statements and Exhibits.
(d) Exhibits.
|
Exhibit No.
|
Description
|
|
SIGNATURE
Pursuant to the requirements of the Securities Exchange Act of 1934, the registrant has duly caused this report to be signed
on its behalf by the undersigned hereunto duly authorized.
| ANGIODYNAMICS, INC. |
|||
| (Registrant) |
|||
|
Date: July 12, 2022
|
By:
|
/s/ Richard C. Rosenzweig |
|
| Name: Richard C. Rosenzweig |
|||
| |
Title: Senior Vice President, General
Counsel and Secretary
|
||
Exhibit 99.1

PRESS RELEASE
Investor Contact:
AngioDynamics, Inc.
Stephen Trowbridge, Executive Vice President & CFO
(518) 795-1408
and Full-Year Financial Results;
Issues Fiscal Year 2023 Guidance
Fiscal Year 2022 Fourth Quarter Highlights
|
•
|
Net sales of $87.0 million increased 13.2% compared to the prior-year quarter
|
|
•
|
Gross margin of 53.4% declined 170 basis points year over year
|
|
•
|
GAAP loss per share of $0.16 and adjusted earnings per share of $0.01
|
|
•
|
Cash and cash equivalents at May 31, 2022 were $28.8 million
|
Full-Year 2022 Highlights
|
•
|
Net sales of $316.2 million increased 8.7% year over year
|
|
•
|
Gross margin declined 150 basis points year over year to 52.4%
|
|
•
|
GAAP loss per share of $0.68 and adjusted earnings per share of $0.00
|
Latham, New York, July 12, 2022 – AngioDynamics, Inc. (NASDAQ: ANGO), a leading and transformative medical technology company focused on restoring healthy blood flow in the body’s vascular system, expanding cancer treatment options
and improving quality of life for patients, today announced financial results for the fourth quarter and fiscal year 2022, which ended May 31, 2022.
“Our strong performance during the quarter, driven by our Med Tech portfolio, is a direct result of the continued hard work and commitment of our
AngioDynamics team,” commented Jim Clemmer, President and Chief Executive Officer of AngioDynamics, Inc. “We delivered on the strategic objectives for fiscal year 2022 that we laid out a year ago during our Investor and Technology Day while managing
through a number of macro-related headwinds, including supply chain disruptions and ongoing inflationary
pressures. During our fourth quarter, we reduced our backlog as our manufacturing capacity improved, exiting the quarter more than 40% above the
lows we experienced in December. In addition, we launched two new AlphaVac products and initiated two important clinical trials -- our PRESERVE Study for the use of NanoKnife in prostate cancer and our APEX study for the use of AlphaVac F18 in the
treatment of pulmonary embolism. We remain committed to balancing and prioritizing investments in our business and enhancing our growth platforms while managing through ongoing inflationary pressures and other macroeconomic challenges. I am excited
about the product launches and clinical milestones we expect to achieve in fiscal year 2023, and I look forward to the team’s continued transformation of AngioDynamics.”
Fourth Quarter 2022 Financial Results
Net sales for the fourth quarter of fiscal year 2022 were $87.0
million, an increase of 13.2% compared to the prior-year quarter. Foreign currency translation did not have a significant impact on the Company's net sales in the quarter.
Med Tech net sales were $22.6 million, a 40.0% increase from $16.2 million in the prior- year period, while Med Device net sales were $64.4
million, an increase of 6.1% compared to $60.7 million in the prior-year period. Med Tech includes the Auryon Peripheral Atherectomy platform, the thrombectomy platform and the NanoKnife irreversible electroporation platform.
Endovascular Therapies (formerly Vascular Interventions and Therapies) net sales were $45.1 million, an increase of 18.5%, compared to $38.1
million a year ago. Growth was driven by Auryon sales during the quarter of $9.6 million, continuing the sequential growth trend in the business as well as strength in the Company’s thrombectomy portfolio as compared to the prior year.
Oncology net sales were $15.1 million, an increase of 5.8%, compared to $14.3 million in the prior-year period. The year-over-year growth was
largely due to increased net sales of disposables of NanoKnife and Microwave.
Vascular Access net sales were $26.7 million, an increase of 9.3%, compared to $24.5 million a year ago.
U.S. net sales in the fourth quarter of fiscal 2022 were $73.7 million, an increase of 15.9% from $63.6 million a year ago. International net
sales were $13.3 million, an increase of 0.4%, compared to $13.2 million a year ago.
Gross margin for the fourth quarter of fiscal 2022 was 53.4%, a decrease of 170 basis points compared to the fourth quarter of fiscal 2021, but
up sequentially from 52.2% in the third quarter. During the quarter, gross margin was negatively impacted by macro forces including labor shortages and increased costs for labor, raw materials, and freight.
The Company recorded a net loss of $6.3 million, or a loss per share of $0.16, in the fourth quarter of fiscal 2022. This compares to a net loss
of $19.5 million, or a loss per share of $0.51, a year ago.
Excluding the items shown in the non-GAAP reconciliation table below, adjusted net income for the fourth quarter of fiscal 2022 was $0.3 million,
and adjusted earnings per share was $0.01, compared to adjusted net loss in the prior-year period of $0.1 million and adjusted earnings per share of $0.00.
Adjusted EBITDA in the fourth quarter of fiscal 2022, excluding the items shown in the reconciliation table below, was $6.2 million, compared to
$4.5 million in the fourth quarter of fiscal 2021.
In the fourth quarter of fiscal 2022, the Company generated $8.6 million in operating cash, had capital expenditures of $1.0 million and
additions to Auryon placement and evaluation units of $2.7 million. At May 31, 2022, the Company had $28.8 million in cash and cash equivalents compared to $23.9 million in cash and cash equivalents at February 28, 2022. The Company had $25.0 million
outstanding under its revolving credit facility at May 31, 2022 which was in line with February 28, 2022.
Full-Year 2022 Financial Results
For the twelve months ended May 31, 2022:
Net sales were $316.2 million, an increase of 8.7%, compared to $291.0 million for the same period a year ago.
Med Tech net sales were $78.7 million, a 41.2% increase from the prior year period. Med Device net sales were $237.5 million, an increase of 0.9%
from the prior year period.
Gross margin declined 150 basis points to 52.4% from 53.9% a year ago
due to elevated labor, material, and freight costs, as well as Auryon start-up costs.
The Company's net loss from continuing operations was $26.5 million, or a loss per share of $0.68, compared to a net loss of $31.5 million, or a
loss of $0.82 per share, a year ago.
Excluding the items shown in the non-GAAP reconciliation table below,
adjusted net loss was $0.2 million, with adjusted earnings per share of $0.00, compared to adjusted net income and adjusted earnings per share of $1.9 million, or $0.05 per share, a year ago. Adjusted net income and adjusted earnings per share in fiscal 2022 includes a $4.2 million, and $0.08 per share benefit, respectively, related to the reimbursement of
certain expenses under the employee retention credit as part of the
CARES Act. A similar reimbursement benefit of $1.9 million was included in the prior year period.
Adjusted EBITDA, excluding the items shown in the reconciliation table below, was $20.9 million, compared to $19.5 million for the same period a
year ago.
Fiscal Year 2023 Financial Guidance
The Company expects its fiscal year 2023 net sales to be in the range
of $342 to $348 million, gross margin to be approximately 52.5% to 54.5% and adjusted earnings per share in the range of $0.01 to $0.06 as it
continues to invest in new product launches to drive future growth.
Conference Call
The Company's management will host a conference call today at 8:00 a.m. ET to discuss its fourth quarter and fiscal year
2022 results.
To participate in the conference call, dial 1-877-407-0784 (domestic) or +1-201-689-8560 (international) and refer to the passcode 13730672.
This conference call will also be webcast and can be accessed from the
“Investors” section of the AngioDynamics website at www.angiodynamics.com. The webcast replay of the call will be available at the same site approximately one hour after the end of the call.
A recording of the call will also be available from 11:00 a.m. ET on Tuesday, July 12, 2022, until 11:59 p.m. ET on Tuesday, July 19, 2022. To
hear this recording, dial 1-844-512-2921 (domestic) or +1-412-317-6671 (international) and enter the passcode 13730672.
Use of Non-GAAP Measures
Management uses non-GAAP measures to establish operational goals and believes that non-GAAP measures may assist investors in analyzing the
underlying trends in AngioDynamics' business over time. Investors should consider these non-GAAP measures in addition to, not as a substitute for or as superior to, financial reporting measures prepared in accordance with GAAP. In this news release,
AngioDynamics has reported adjusted EBITDA, adjusted net income and adjusted earnings per share. Management uses these measures in its internal analysis and review of operational performance. Management believes that these measures provide investors
with useful information in comparing AngioDynamics' performance over different periods. By using these non-GAAP measures, management believes that investors get a better picture of the performance of AngioDynamics' underlying business. Management
encourages investors to review AngioDynamics' financial results prepared in accordance with GAAP
to understand AngioDynamics' performance taking into account all relevant factors, including those that may only occur from time to time but have
a material impact on AngioDynamics' financial results. Please see the tables that follow for a reconciliation of non-GAAP measures to measures prepared in accordance with GAAP.
About AngioDynamics, Inc.
AngioDynamics is a leading, and transformative medical technology
company focused on restoring healthy blood flow in the body’s vascular system, expanding cancer treatment options and improving quality of life for patients.
The Company’s innovative technologies and devices are chosen by
talented physicians in fast-growing healthcare markets to treat unmet patient needs. For more information, visit www.angiodynamics.com.
Safe Harbor
This release contains forward-looking statements within the meaning of the Private Securities Litigation Reform Act of 1995. All statements
regarding AngioDynamics' expected future financial position, results of operations, cash flows, business strategy, budgets, projected costs, capital expenditures, products, competitive positions, growth opportunities, plans and objectives of
management for future operations, as well as statements that include the words such as "expects," "reaffirms," "intends," "anticipates," "plans," "believes," "seeks," "estimates," “projects”, "optimistic," or variations of such words and similar
expressions, are forward-looking statements. These forward-looking statements are not guarantees of future performance and are subject to risks and uncertainties. Investors are cautioned that actual events or results may differ materially from
AngioDynamics' expectations, expressed or implied. Factors that may affect the actual results achieved by AngioDynamics include, without limitation, the scale and scope of the COVID-19 global pandemic, the ability of AngioDynamics to develop its
existing and new products, technological advances and patents attained by competitors, infringement of AngioDynamics' technology or assertions that AngioDynamics' technology infringes the technology of third parties, the ability of AngioDynamics to
effectively compete against competitors that have substantially greater resources, future actions by the FDA or other regulatory agencies, domestic and foreign health care reforms and government regulations, results of pending or future clinical
trials, overall economic conditions (including inflation, labor shortages and supply chain challenges including the cost and availability of raw materials), the results of on-going litigation, challenges with respect to
third-party distributors or joint venture partners or collaborators, the results of sales efforts, the effects of product recalls and product liability claims, changes in key personnel, the ability of AngioDynamics to execute on strategic
initiatives, the effects of economic, credit and capital market conditions, general market conditions, market acceptance, foreign currency exchange rate fluctuations, the effects on pricing from group purchasing organizations and competition, the
ability of AngioDynamics to obtain regulatory clearances or approval of
its products, or to integrate acquired businesses, as well as the risk factors listed from time to time in AngioDynamics' SEC filings, including
but not limited to its Annual Report on Form 10-K for the year ended May 31, 2021. AngioDynamics does not assume any obligation to publicly update or revise any forward-looking statements for any reason.
In the United States, the NanoKnife System has received a 510(k) clearance by the Food and Drug Administration for use in the surgical ablation
of soft tissue and is similarly approved for commercialization in Canada, the European Union, and Australia. The NanoKnife System has not been cleared for the treatment or therapy of a specific disease or condition.
|
ANGIODYNAMICS, INC. AND SUBSIDIARIES
|
|
CONSOLIDATED INCOME STATEMENTS
|
|
(in thousands, except per share data)
|
|
Three Months Ended
|
Twelve Months Ended
|
|||||||||||||||
|
May 31, 2022
|
May 31, 2021
|
May 31, 2022
|
May 31, 2021
|
|||||||||||||
|
(unaudited)
|
(unaudited)
|
(audited)
|
||||||||||||||
|
Net sales
|
$
|
86,998
|
$
|
76,842
|
$
|
316,219
|
$
|
291,010
|
||||||||
|
Cost of sales (exclusive of intangible amortization)
|
40,543
|
34,522
|
150,487
|
134,222
|
||||||||||||
|
Gross profit
|
46,455
|
42,320
|
165,732
|
156,788
|
||||||||||||
|
% of net sales
|
53.4
|
%
|
55.1
|
%
|
52.4
|
%
|
53.9
|
%
|
||||||||
|
Operating expenses
|
||||||||||||||||
|
Research and development
|
7,866
|
9,104
|
30,739
|
36,390
|
||||||||||||
|
Sales and marketing
|
26,833
|
23,820
|
95,301
|
81,306
|
||||||||||||
|
General and administrative
|
11,103
|
9,131
|
38,451
|
35,918
|
||||||||||||
|
Amortization of intangibles
|
4,853
|
4,298
|
19,458
|
18,136
|
||||||||||||
|
Change in fair value of contingent consideration
|
207
|
379
|
1,212
|
89
|
||||||||||||
|
Acquisition, restructuring and other items, net
|
1,990
|
17,175
|
9,042
|
20,232
|
||||||||||||
|
Total operating expenses
|
52,852
|
63,907
|
194,203
|
192,071
|
||||||||||||
|
Operating loss
|
(6,397
|
)
|
(21,587
|
)
|
(28,471
|
)
|
(35,283
|
)
|
||||||||
|
Interest expense, net
|
(185
|
)
|
(185
|
)
|
(688
|
)
|
(861
|
)
|
||||||||
|
Other income (expense), net
|
(139
|
)
|
(167
|
)
|
(790
|
)
|
92
|
|||||||||
|
Total other expense, net
|
(324
|
)
|
(352
|
)
|
(1,478
|
)
|
(769
|
)
|
||||||||
|
Loss before income tax benefit
|
(6,721
|
)
|
(21,939
|
)
|
(29,949
|
)
|
(36,052
|
)
|
||||||||
|
Income tax benefit
|
(455
|
)
|
(2,471
|
)
|
(3,402
|
)
|
(4,504
|
)
|
||||||||
|
Net loss
|
$
|
(6,266
|
)
|
$
|
(19,468
|
)
|
$
|
(26,547
|
)
|
$
|
(31,548
|
)
|
||||
|
Loss per share
|
||||||||||||||||
|
Basic
|
$
|
(0.16
|
)
|
$
|
(0.51
|
)
|
$
|
(0.68
|
)
|
$
|
(0.82
|
)
|
||||
|
Diluted
|
$
|
(0.16
|
)
|
$
|
(0.51
|
)
|
$
|
(0.68
|
)
|
$
|
(0.82
|
)
|
||||
|
Weighted average shares outstanding
|
||||||||||||||||
|
Basic
|
39,160
|
38,525
|
39,009
|
38,342
|
||||||||||||
|
Diluted
|
39,160
|
38,525
|
39,009
|
38,342
|
||||||||||||
|
ANGIODYNAMICS, INC. AND SUBSIDIARIES
|
|
GAAP TO NON-GAAP RECONCILIATION
|
|
(in thousands, except per share data)
|
|
Reconciliation of Net Loss to non-GAAP Adjusted Net Income (Loss):
|
||||||||||||||||
|
Three Months Ended
|
Twelve Months Ended
|
|||||||||||||||
|
May 31, 2022
|
May 31, 2021
|
May 31, 2022
|
May 31, 2021
|
|||||||||||||
|
(unaudited)
|
(unaudited)
|
|||||||||||||||
|
Net loss
|
$
|
(6,266
|
)
|
$
|
(19,468
|
)
|
$
|
(26,547
|
)
|
$
|
(31,548
|
)
|
||||
|
Amortization of intangibles
|
4,853
|
4,298
|
19,458
|
18,136
|
||||||||||||
|
Change in fair value of contingent consideration
|
207
|
379
|
1,212
|
89
|
||||||||||||
|
Acquisition, restructuring and other items, net (1)
|
1,990
|
17,175
|
9,042
|
20,232
|
||||||||||||
|
Tax effect of non-GAAP items (2)
|
(531
|
)
|
(2,451
|
)
|
(3,347
|
)
|
(5,057
|
)
|
||||||||
|
Adjusted net income (loss)
|
$
|
253
|
$
|
(67
|
)
|
$
|
(182
|
)
|
$
|
1,852
|
||||||
|
Reconciliation of Diluted Loss Per Share to non-GAAP Adjusted Diluted Earnings (Loss) Per Share:
|
||||||||||||||||
|
Three Months Ended
|
Twelve Months Ended
|
|||||||||||||||
|
May 31, 2022
|
May 31, 2021
|
May 31, 2022
|
May 31, 2021
|
|||||||||||||
|
(unaudited)
|
(unaudited)
|
|||||||||||||||
|
Diluted loss per share
|
$
|
(0.16
|
)
|
$
|
(0.51
|
)
|
$
|
(0.68
|
)
|
$
|
(0.82
|
)
|
||||
|
Amortization of intangibles
|
0.12
|
0.11
|
0.50
|
0.47
|
||||||||||||
|
Change in fair value of contingent consideration
|
0.01
|
0.01
|
0.03
|
—
|
||||||||||||
|
Acquisition, restructuring and other items, net (1)
|
0.05
|
0.45
|
0.24
|
0.53
|
||||||||||||
|
Tax effect of non-GAAP items (2)
|
(0.01
|
)
|
(0.06
|
)
|
(0.09
|
)
|
(0.13
|
)
|
||||||||
|
Adjusted diluted earnings (loss) per share
|
$
|
0.01
|
$
|
0.00
|
$
|
0.00
|
$
|
0.05
|
||||||||
|
Adjusted diluted sharecount (3)
|
40,250
|
38,525
|
39,009
|
39,110
|
||||||||||||
|
(1) Includes costs related to merger and acquisition activities, restructuring, and unusual items, including asset impairments and
write-offs, certain litigation, and other items. Fiscal year 2021 results include a $14.0 million write-off of OARtrac intangible assets.
|
|
(2) Adjustment to reflect the income tax provision on a non-GAAP basis has been calculated assuming no valuation allowance on the
Company's U.S. deferred tax assets and an effective tax rate of 23% for the periods ended May 31, 2022 and May 31, 2021.
|
|
(3) Diluted shares may differ for non-GAAP measures as compared to GAAP due to a GAAP loss.
|
|
ANGIODYNAMICS, INC. AND SUBSIDIARIES
|
|
GAAP TO NON-GAAP RECONCILIATION (Continued)
|
|
(in thousands, except per share data)
|
|
Reconciliation of Net Loss to Adjusted EBITDA:
|
||||||||||||||||
|
Three Months Ended
|
Twelve Months Ended
|
|||||||||||||||
|
May 31, 2022
|
May 31, 2021
|
May 31, 2022
|
May 31, 2021
|
|||||||||||||
|
(unaudited)
|
(unaudited)
|
|||||||||||||||
|
Net loss
|
$
|
(6,266
|
)
|
$
|
(19,468
|
)
|
$
|
(26,547
|
)
|
$
|
(31,548
|
)
|
||||
|
Income tax benefit
|
(455
|
)
|
(2,471
|
)
|
(3,402
|
)
|
(4,504
|
)
|
||||||||
|
Interest expense, net
|
185
|
185
|
688
|
861
|
||||||||||||
|
Depreciation and amortization
|
7,628
|
6,485
|
29,194
|
25,761
|
||||||||||||
|
Change in fair value of contingent consideration
|
207
|
379
|
1,212
|
89
|
||||||||||||
|
Stock based compensation
|
2,903
|
2,227
|
10,692
|
8,625
|
||||||||||||
|
Acquisition, restructuring and other items, net (1)
|
1,990
|
17,175
|
9,042
|
20,232
|
||||||||||||
|
Adjusted EBITDA
|
$
|
6,192
|
$
|
4,512
|
$
|
20,879
|
$
|
19,516
|
||||||||
|
Per diluted share:
|
||||||||||||||||
|
Adjusted EBITDA
|
$
|
0.15
|
$
|
0.12
|
$
|
0.54
|
$
|
0.50
|
||||||||
|
(1) Includes costs related to merger and acquisition activities, restructuring, and unusual items, including asset impairments and
write-offs, certain litigation, and other items. Fiscal year 2021 results include a $14.0 million write-off of OARtrac intangible assets.
|
|
ANGIODYNAMICS, INC. AND SUBSIDIARIES
|
|
NET SALES BY PRODUCT CATEGORY AND BY GEOGRAPHY
|
|
(in thousands)
|
|
Three Months Ended
|
Twelve Months Ended
|
|||||||||||||||||||||||||||||||||||||||
|
May 31, 2022
|
May 31, 2021
|
% Growth
|
Currency Impact
|
Constant Currency Growth
|
May 31, 2022
|
May 31, 2021
|
% Growth
|
Currency Impact
|
Constant Currency Growth
|
|||||||||||||||||||||||||||||||
|
(unaudited)
|
(unaudited)
|
|||||||||||||||||||||||||||||||||||||||
|
Net Sales
|
||||||||||||||||||||||||||||||||||||||||
|
Med Tech
|
$
|
22,611
|
$
|
16,150
|
40.0
|
%
|
$
|
78,717
|
$
|
55,731
|
41.2
|
%
|
||||||||||||||||||||||||||||
|
Med Device
|
64,387
|
60,692
|
6.1
|
%
|
237,502
|
235,279
|
0.9
|
%
|
||||||||||||||||||||||||||||||||
|
$
|
86,998
|
$
|
76,842
|
13.2
|
%
|
(0.4
|
)%
|
12.8
|
%
|
$
|
316,219
|
$
|
291,010
|
8.7
|
%
|
0.0
|
%
|
8.7
|
%
|
|||||||||||||||||||||
|
Net Sales by Product Category
|
||||||||||||||||||||||||||||||||||||||||
|
Endovascular Therapies
|
$
|
45,126
|
$
|
38,071
|
18.5
|
%
|
$
|
160,925
|
$
|
135,079
|
19.1
|
%
|
||||||||||||||||||||||||||||
|
Vascular Access
|
26,734
|
24,462
|
9.3
|
%
|
100,193
|
101,310
|
(1.1
|
)%
|
||||||||||||||||||||||||||||||||
|
Oncology
|
15,138
|
14,309
|
5.8
|
%
|
55,101
|
54,621
|
0.9
|
%
|
||||||||||||||||||||||||||||||||
|
$
|
86,998
|
$
|
76,842
|
13.2
|
%
|
(0.4
|
)%
|
12.8
|
%
|
$
|
316,219
|
$
|
291,010
|
8.7
|
%
|
0.0
|
%
|
8.7
|
%
|
|||||||||||||||||||||
|
—
|
—
|
|||||||||||||||||||||||||||||||||||||||
|
Net Sales by Geography
|
||||||||||||||||||||||||||||||||||||||||
|
United States
|
$
|
73,704
|
$
|
63,597
|
15.9
|
%
|
$
|
265,963
|
$
|
237,043
|
12.2
|
%
|
||||||||||||||||||||||||||||
|
International
|
13,294
|
13,245
|
0.4
|
%
|
(2.5
|
)%
|
(2.1
|
)%
|
50,256
|
53,967
|
(6.9
|
)%
|
0.2
|
%
|
(6.7
|
)%
|
||||||||||||||||||||||||
|
$
|
86,998
|
$
|
76,842
|
13.2
|
%
|
(0.4
|
)%
|
12.8
|
%
|
$
|
316,219
|
$
|
291,010
|
8.7
|
%
|
0.0
|
%
|
8.7
|
%
|
|||||||||||||||||||||
|
ANGIODYNAMICS, INC. AND SUBSIDIARIES
|
|
CONSOLIDATED BALANCE SHEETS
|
|
(in thousands)
|
|
May 31, 2022
|
May 31, 2021
|
|||||||
|
(unaudited)
|
(audited)
|
|||||||
|
Assets
|
||||||||
|
Current assets:
|
||||||||
|
Cash and cash equivalents
|
$
|
28,825
|
$
|
48,161
|
||||
|
Accounts receivable, net
|
52,304
|
35,405
|
||||||
|
Inventories
|
51,392
|
48,614
|
||||||
|
Prepaid expenses and other
|
10,824
|
8,699
|
||||||
|
Total current assets
|
143,345
|
140,879
|
||||||
|
Property, plant and equipment, net
|
45,005
|
37,073
|
||||||
|
Other assets
|
10,963
|
13,193
|
||||||
|
Intangible assets, net
|
152,380
|
168,977
|
||||||
|
Goodwill
|
201,058
|
201,316
|
||||||
|
Total assets
|
$
|
552,751
|
$
|
561,438
|
||||
|
Liabilities and stockholders' equity
|
||||||||
|
Current liabilities:
|
||||||||
|
Accounts payable
|
$
|
28,047
|
$
|
19,630
|
||||
|
Accrued liabilities
|
34,842
|
35,459
|
||||||
|
Current portion of contingent consideration
|
8,783
|
—
|
||||||
|
Other current liabilities
|
2,652
|
2,495
|
||||||
|
Total current liabilities
|
74,324
|
57,584
|
||||||
|
Long-term debt, net of current portion
|
25,000
|
20,000
|
||||||
|
Deferred income taxes
|
16,037
|
19,955
|
||||||
|
Contingent consideration, net of current portion
|
8,165
|
15,741
|
||||||
|
Other long-term liabilities
|
4,736
|
8,701
|
||||||
|
Total liabilities
|
128,262
|
121,981
|
||||||
|
Stockholders' equity
|
424,489
|
439,457
|
||||||
|
Total Liabilities and Stockholders' Equity
|
$
|
552,751
|
$
|
561,438
|
||||
|
ANGIODYNAMICS, INC. AND SUBSIDIARIES
|
|
CONSOLIDATED STATEMENTS OF CASH FLOWS
|
|
(in thousands)
|
|
Three Months Ended
|
Twelve Months Ended
|
|||||||||||||||
|
May 31, 2022
|
May 31, 2021
|
May 31, 2022
|
May 31, 2021
|
|||||||||||||
|
(unaudited)
|
(unaudited)
|
(audited)
|
||||||||||||||
|
Cash flows from operating activities:
|
||||||||||||||||
|
Net loss
|
$
|
(6,266
|
)
|
$
|
(19,468
|
)
|
$
|
(26,547
|
)
|
$
|
(31,548
|
)
|
||||
|
Adjustments to reconcile net loss to net cash provided by (used in) operating activities:
|
||||||||||||||||
|
Depreciation and amortization
|
7,667
|
6,524
|
29,349
|
25,916
|
||||||||||||
|
Non-cash lease expense
|
617
|
596
|
2,439
|
2,456
|
||||||||||||
|
Stock based compensation
|
2,903
|
2,227
|
10,692
|
8,625
|
||||||||||||
|
Change in fair value of contingent consideration
|
207
|
379
|
1,212
|
89
|
||||||||||||
|
Deferred income tax provision
|
(587
|
)
|
(2,618
|
)
|
(3,708
|
)
|
(4,805
|
)
|
||||||||
|
Change in accounts receivable allowances
|
184
|
176
|
118
|
207
|
||||||||||||
|
Asset impairments and disposals
|
146
|
14,038
|
391
|
14,228
|
||||||||||||
|
Other
|
(66
|
)
|
2
|
(93
|
)
|
(147
|
)
|
|||||||||
|
Changes in operating assets and liabilities, net of acquisitions:
|
||||||||||||||||
|
Accounts receivable
|
(10,710
|
)
|
(2,339
|
)
|
(17,151
|
)
|
(4,162
|
)
|
||||||||
|
Inventories
|
(3,384
|
)
|
420
|
(2,796
|
)
|
11,539
|
||||||||||
|
Prepaid expenses and other
|
2,135
|
5,640
|
(5,012
|
)
|
(3,181
|
)
|
||||||||||
|
Accounts payable, accrued and other liabilities
|
15,714
|
6,622
|
3,912
|
4,876
|
||||||||||||
|
Net cash provided by (used in) operating activities
|
8,560
|
12,199
|
(7,194
|
)
|
24,093
|
|||||||||||
|
Cash flows from investing activities:
|
||||||||||||||||
|
Additions to property, plant and equipment
|
(1,039
|
)
|
(620
|
)
|
(4,297
|
)
|
(5,187
|
)
|
||||||||
|
Additions to placement and evaluation units
|
(2,734
|
)
|
(8,524
|
)
|
(11,410
|
)
|
(8,524
|
)
|
||||||||
|
Acquisition of intangibles
|
—
|
—
|
—
|
—
|
||||||||||||
|
Cash paid in acquisition
|
—
|
—
|
(3,600
|
)
|
—
|
|||||||||||
|
Net cash used in investing activities
|
(3,773
|
)
|
(9,144
|
)
|
(19,307
|
)
|
(13,711
|
)
|
||||||||
|
Cash flows from financing activities:
|
||||||||||||||||
|
Repayment of long-term debt
|
—
|
(10,000
|
)
|
—
|
(20,000
|
)
|
||||||||||
|
Proceeds from borrowings on long-term debt
|
—
|
—
|
5,000
|
—
|
||||||||||||
|
Proceeds from exercise of stock options and employee stock purchase plan
|
329
|
555
|
2,683
|
3,014
|
||||||||||||
|
Net cash provided by (used in) financing activities
|
329
|
(9,445
|
)
|
7,683
|
(16,986
|
)
|
||||||||||
|
Effect of exchange rate changes on cash and cash equivalents
|
(181
|
)
|
82
|
(518
|
)
|
330
|
||||||||||
|
Increase (decrease) in cash and cash equivalents
|
4,935
|
(6,308
|
)
|
(19,336
|
)
|
(6,274
|
)
|
|||||||||
|
Cash and cash equivalents at beginning of period
|
23,890
|
54,469
|
48,161
|
54,435
|
||||||||||||
|
Cash and cash equivalents at end of period
|
$
|
28,825
|
$
|
48,161
|
$
|
28,825
|
$
|
48,161
|
||||||||
Exhibit 99.2

ANGIODYNAMICS Fourth Quarter 2022 Earnings Presentation July 12, 2022 1
2 Forward-Looking Statement Notice Regarding Forward-Looking Statements This presentation contains
forward-looking statements within the meaning of the Private Securities Litigation Reform Act of 1995. All statements regarding AngioDynamics’ expected future financial position, results of operations, cash flows, business strategy, budgets,
projected costs, capital expenditures, products, competitive positions, growth opportunities, plans and objectives of management for future operations, as well as statements that include the words such as “expects,” “reaffirms,” “intends,”
“anticipates,” “plans,” “projects,” “believes,” “seeks,” “estimates,” “optimistic,” or variations of such words and similar expressions, are forward-looking statements. These forward-looking statements are not guarantees of future performance
and are subject to risks and uncertainties. Investors are cautioned that actual events or results may differ materially from AngioDynamics’ expectations, expressed or implied. Factors that may affect the actual results achieved by AngioDynamics
include, without limitation, the scale and scope of the COVID-19 global pandemic, the ability of AngioDynamics to develop its existing and new products, technological advances and patents attained by competitors, infringement of AngioDynamics’
technology or assertions that AngioDynamics’ technology infringes the technology of third parties, the ability of AngioDynamics to effectively compete against competitors that have substantially greater resources, future actions by the FDA or
other regulatory agencies, domestic and foreign health care reforms and government regulations, results of pending or future clinical trials, overall economic conditions (including inflation, labor shortages and supply chain challenges
including the cost and availability of raw materials), the results of on-going litigation, challenges with respect to third-party distributors or joint venture partners or collaborators, the results of sales efforts, the effects of product
recalls and product liability claims, changes in key personnel, the ability of AngioDynamics to execute on strategic initiatives, the effects of economic, credit and capital market conditions, general market conditions, market acceptance,
foreign currency exchange rate fluctuations, the effects on pricing from group purchasing organizations and competition, the ability of AngioDynamics to obtain regulatory clearances or approval of its products, or to integrate acquired
businesses, as well as the risk factors listed from time to time in AngioDynamics’ SEC filings, including but not limited to its Annual Report on Form 10-K for the year ended May 31, 2021. AngioDynamics does not assume any obligation to
publicly update or revise any forward-looking statements for any reason. In the United States, the NanoKnife System has received a 510(k) clearance by the Food and Drug Administration for use in the surgical ablation of soft tissue, and is
similarly approved for commercialization in Canada, the European Union and Australia. The NanoKnife System has not been cleared for the treatment or therapy of a specific disease or condition. Notice Regarding Non-GAAP Financial
Measures Management uses non-GAAP measures to establish operational goals and believes that non-GAAP measures may assist investors in analyzing the underlying trends in AngioDynamics’ business over time. Investors should consider these
non-GAAP measures in addition to, not as a substitute for or as superior to, financial reporting measures prepared in accordance with GAAP. In this presentation, AngioDynamics has reported adjusted EBITDA (income before interest, taxes,
depreciation and amortization and stock-based compensation); adjusted net income and adjusted earnings per share. Management uses these measures in its internal analysis and review of operational performance. Management believes that these
measures provide investors with useful information in comparing AngioDynamics’ performance over different periods. By using these non-GAAP measures, management believes that investors get a better picture of the performance of AngioDynamics’
underlying business. Management encourages investors to review AngioDynamics’ financial results prepared in accordance with GAAP to understand AngioDynamics’ performance taking into account all relevant factors, including those that may only
occur from time to time but have a material impact on AngioDynamics’ financial results. Please see the tables that follow for a reconciliation of non-GAAP measures to measures prepared in accordance with GAAP.
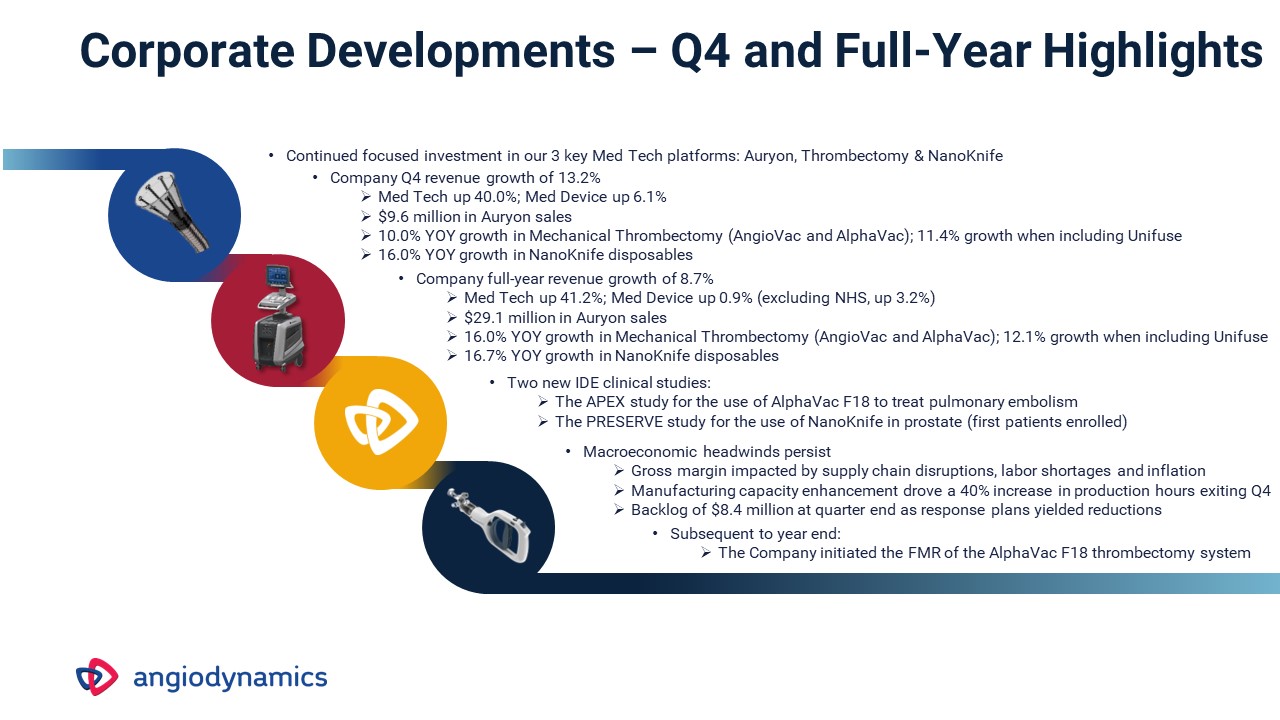
Corporate Developments – Q4 and Full-Year Highlights Continued focused investment in our 3 key Med Tech
platforms: Auryon, Thrombectomy & NanoKnife Macroeconomic headwinds persist Gross margin impacted by supply chain disruptions, labor shortages and inflation Manufacturing capacity enhancement drove a 40% increase in production hours
exiting Q4 Backlog of $8.4 million at quarter end as response plans yielded reductions Company Q4 revenue growth of 13.2% Med Tech up 40.0%; Med Device up 6.1% $9.6 million in Auryon sales 10.0% YOY growth in Mechanical Thrombectomy
(AngioVac and AlphaVac); 11.4% growth when including Unifuse 16.0% YOY growth in NanoKnife disposables Company full-year revenue growth of 8.7% Med Tech up 41.2%; Med Device up 0.9% (excluding NHS, up 3.2%) $29.1 million in Auryon sales
16.0% YOY growth in Mechanical Thrombectomy (AngioVac and AlphaVac); 12.1% growth when including Unifuse 16.7% YOY growth in NanoKnife disposables Subsequent to year end: The Company initiated the FMR of the AlphaVac F18 thrombectomy
system Two new IDE clinical studies: The APEX study for the use of AlphaVac F18 to treat pulmonary embolism The PRESERVE study for the use of NanoKnife in prostate (first patients enrolled)
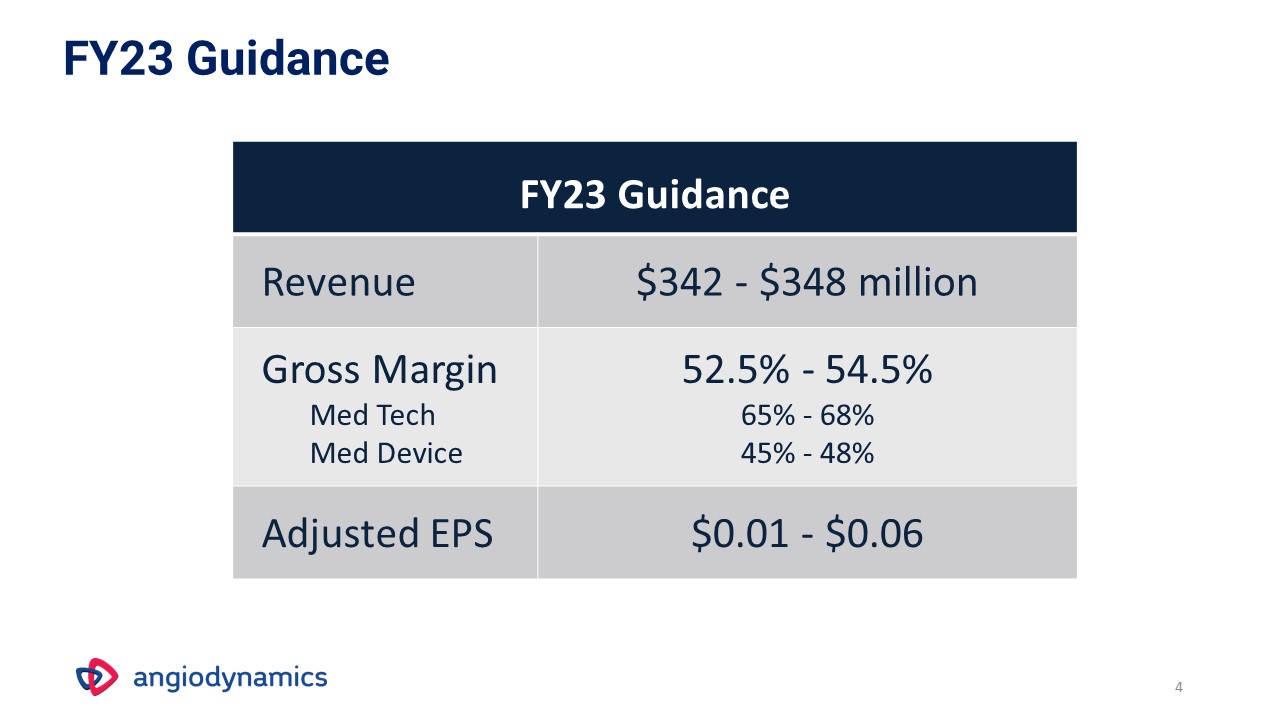
FY23 Guidance 4 FY23 Guidance Q4 FY2022 Revenue $342 - $348 million Gross Margin Med Tech Med
Device 52.5% - 54.5% 65% - 68% 45% - 48% Adjusted EPS $0.01 - $0.06
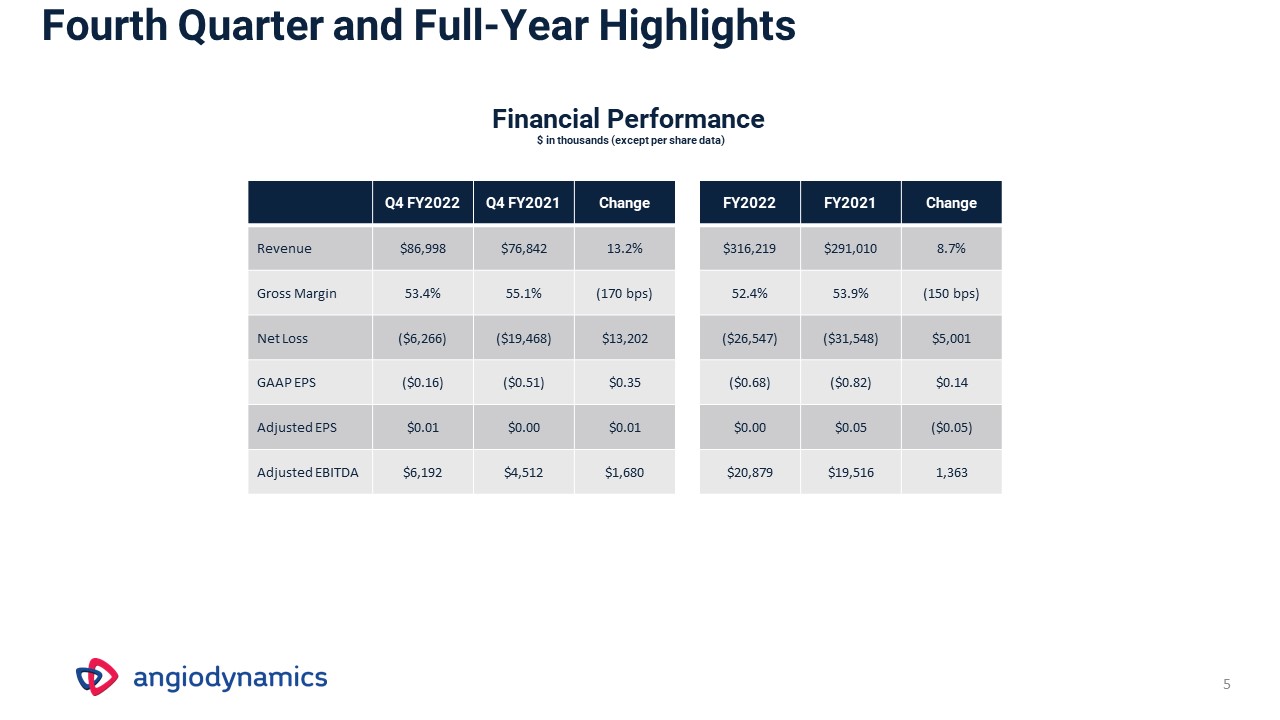
Fourth Quarter and Full-Year Highlights Q4 FY2022 Q4
FY2021 Change FY2022 FY2021 Change Revenue $86,998 $76,842 13.2% $316,219 $291,010 8.7% Gross Margin 53.4% 55.1% (170 bps) 52.4% 53.9% (150 bps) Net Loss ($6,266) ($19,468) $13,202 ($26,547) ($31,548) $5,001 GAAP
EPS ($0.16) ($0.51) $0.35 ($0.68) ($0.82) $0.14 Adjusted EPS $0.01 $0.00 $0.01 $0.00 $0.05 ($0.05) Adjusted EBITDA $6,192 $4,512 $1,680 $20,879 $19,516 1,363 Financial Performance $ in thousands (except per share data) 5
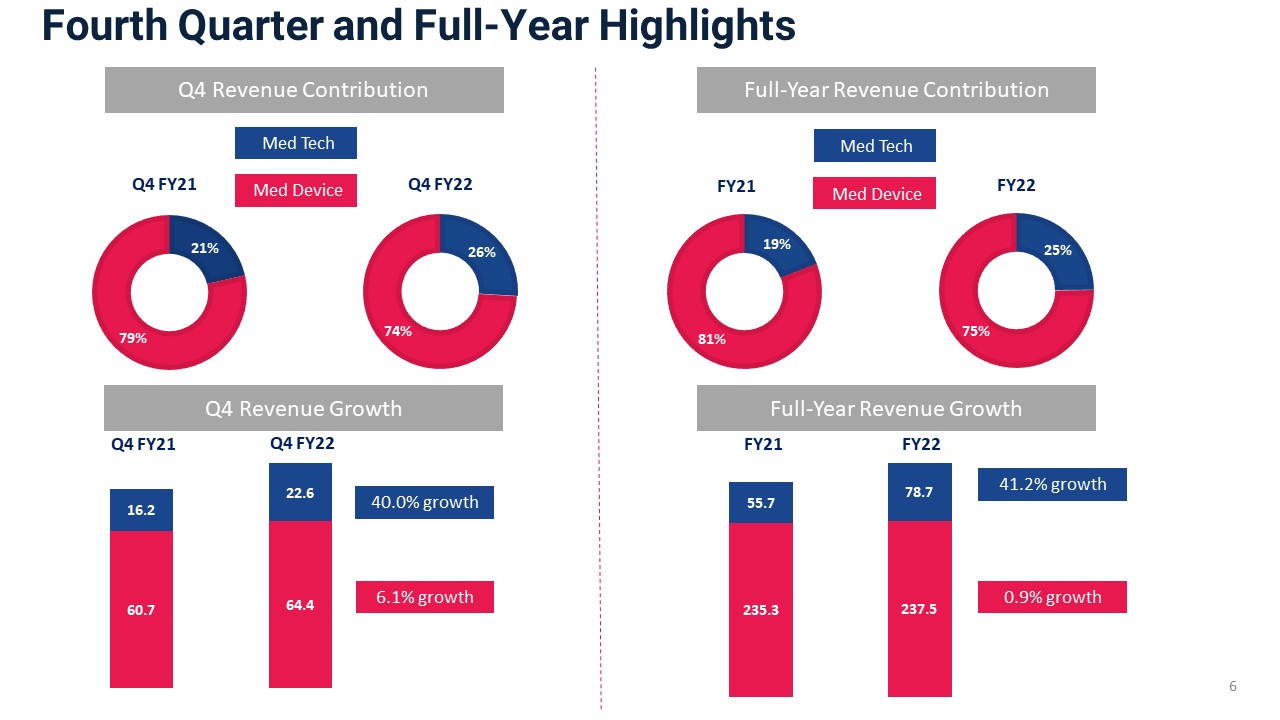
Fourth Quarter and Full-Year Highlights 6 Med Device Med Tech $10.5 $17.6 $59.7 40.0%
growth 6.1% growth Q4 Revenue Growth Q4 FY21 Q4 FY22 Full-Year Revenue Contribution Med Device Med Tech FY21 FY22 41.2% growth 0.9% growth Q4 Revenue Contribution Full-Year Revenue Growth 19.6 54.4 Q4 FY21
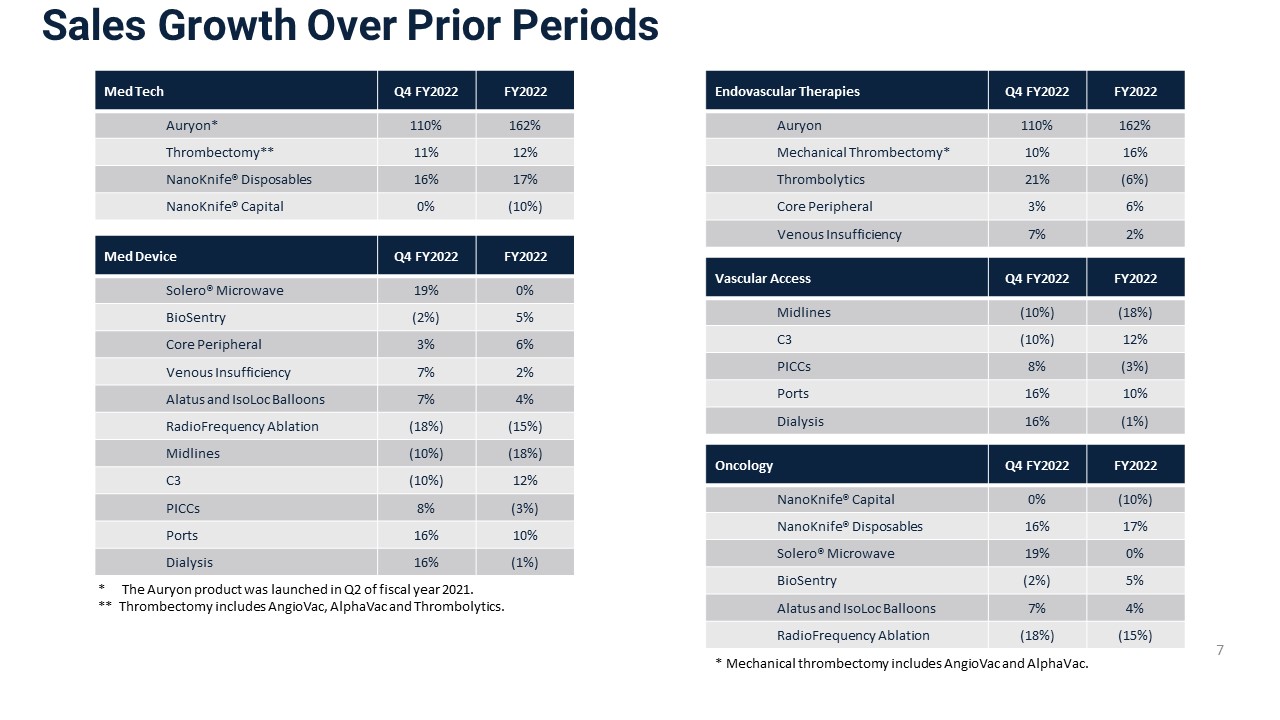
Sales Growth Over Prior Periods Endovascular Therapies Q4
FY2022 FY2022 Auryon 110% 162% Mechanical Thrombectomy* 10% 16% Thrombolytics 21% (6%) Core Peripheral 3% 6% Venous Insufficiency 7% 2% Vascular Access Q4
FY2022 FY2022 Midlines (10%) (18%) C3 (10%) 12% PICCs 8% (3%) Ports 16% 10% Dialysis 16% (1%) Oncology Q4 FY2022 FY2022 NanoKnife® Capital 0% (10%) NanoKnife® Disposables 16% 17% Solero®
Microwave 19% 0% BioSentry (2%) 5% Alatus and IsoLoc Balloons 7% 4% RadioFrequency Ablation (18%) (15%) 7 Med Tech Q4 FY2022 FY2022 Auryon* 110% 162% Thrombectomy** 11% 12% NanoKnife® Disposables 16% 17% NanoKnife®
Capital 0% (10%) Med Device Q4 FY2022 FY2022 Solero® Microwave 19% 0% BioSentry (2%) 5% Core Peripheral 3% 6% Venous Insufficiency 7% 2% Alatus and IsoLoc Balloons 7% 4% RadioFrequency
Ablation (18%) (15%) Midlines (10%) (18%) C3 (10%) 12% PICCs 8% (3%) Ports 16% 10% Dialysis 16% (1%) * The Auryon product was launched in Q2 of fiscal year 2021. ** Thrombectomy includes AngioVac, AlphaVac and
Thrombolytics. * Mechanical thrombectomy includes AngioVac and AlphaVac.
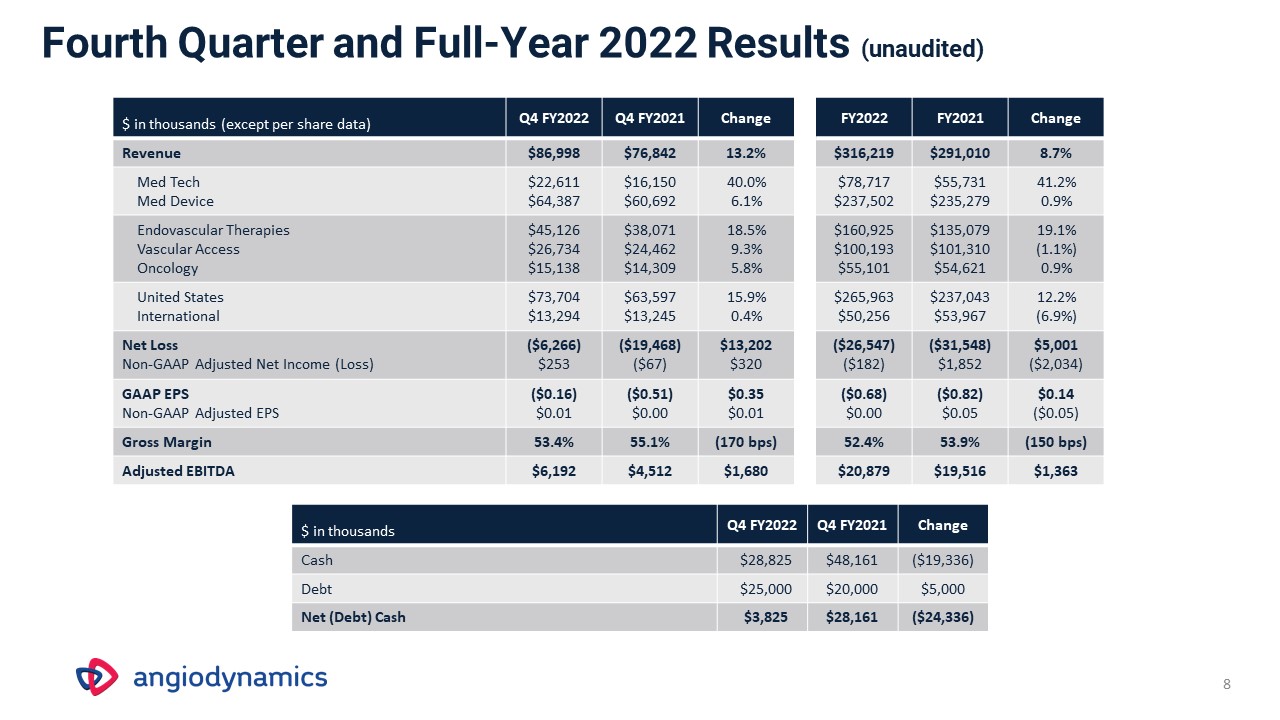
Fourth Quarter and Full-Year 2022 Results (unaudited) $ in thousands (except per share data) Q4
FY2022 Q4 FY2021 Change FY2022 FY2021 Change Revenue $86,998 $76,842 13.2% $316,219 $291,010 8.7% Med Tech Med Device $22,611 $64,387 $16,150 $60,692 40.0% 6.1% $78,717 $237,502 $55,731 $235,279 41.2% 0.9%
Endovascular Therapies Vascular Access Oncology $45,126 $26,734 $15,138 $38,071 $24,462 $14,309 18.5% 9.3% 5.8% $160,925 $100,193 $55,101 $135,079 $101,310 $54,621 19.1% (1.1%) 0.9% United States
International $73,704 $13,294 $63,597 $13,245 15.9% 0.4% $265,963 $50,256 $237,043 $53,967 12.2% (6.9%) Net Loss Non-GAAP Adjusted Net Income
(Loss) ($6,266) $253 ($19,468) ($67) $13,202 $320 ($26,547) ($182) ($31,548) $1,852 $5,001 ($2,034) GAAP EPS Non-GAAP Adjusted
EPS ($0.16) $0.01 ($0.51) $0.00 $0.35 $0.01 ($0.68) $0.00 ($0.82) $0.05 $0.14 ($0.05) Gross Margin 53.4% 55.1% (170 bps) 52.4% 53.9% (150 bps) Adjusted EBITDA $6,192 $4,512 $1,680 $20,879 $19,516 $1,363 $ in thousands
Q4 FY2022 Q4 FY2021 Change Cash $28,825 $48,161 ($19,336) Debt $25,000 $20,000 $5,000 Net (Debt) Cash $3,825 $28,161 ($24,336) 8
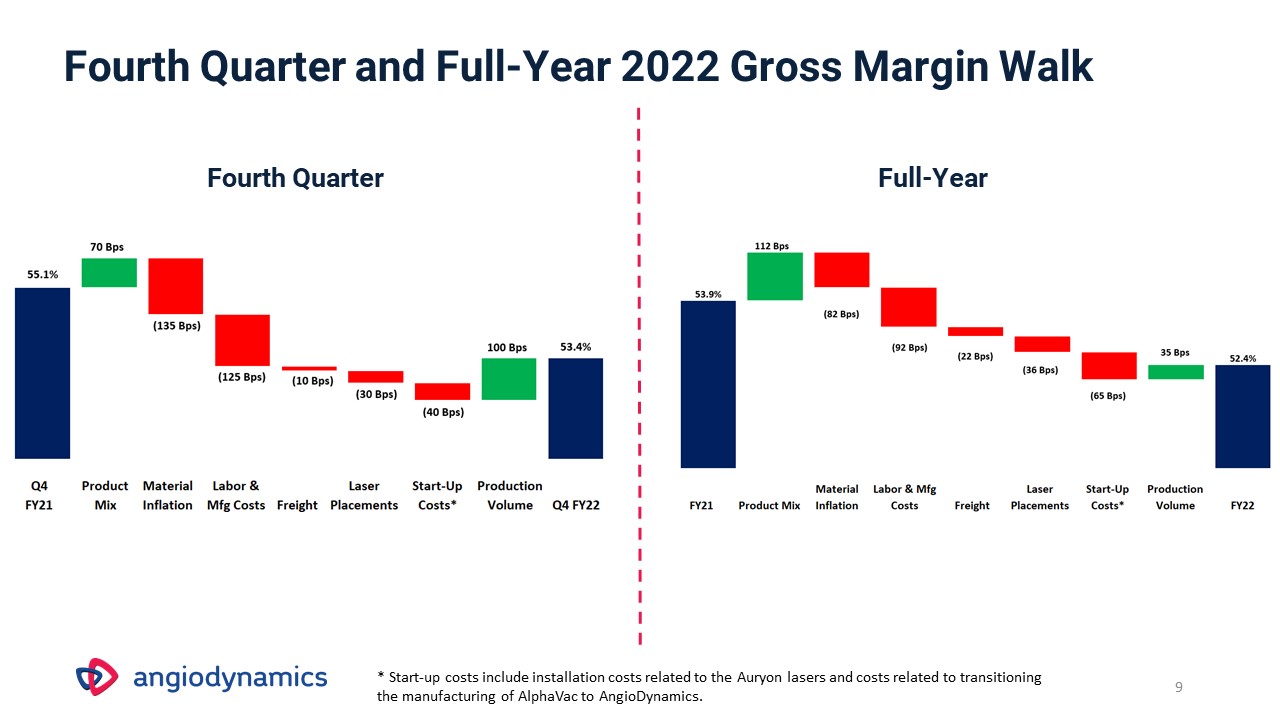
9 Fourth Quarter and Full-Year 2022 Gross Margin Walk Full-Year Fourth Quarter * Start-up costs
include installation costs related to the Auryon lasers and costs related to transitioning the manufacturing of AlphaVac to AngioDynamics.
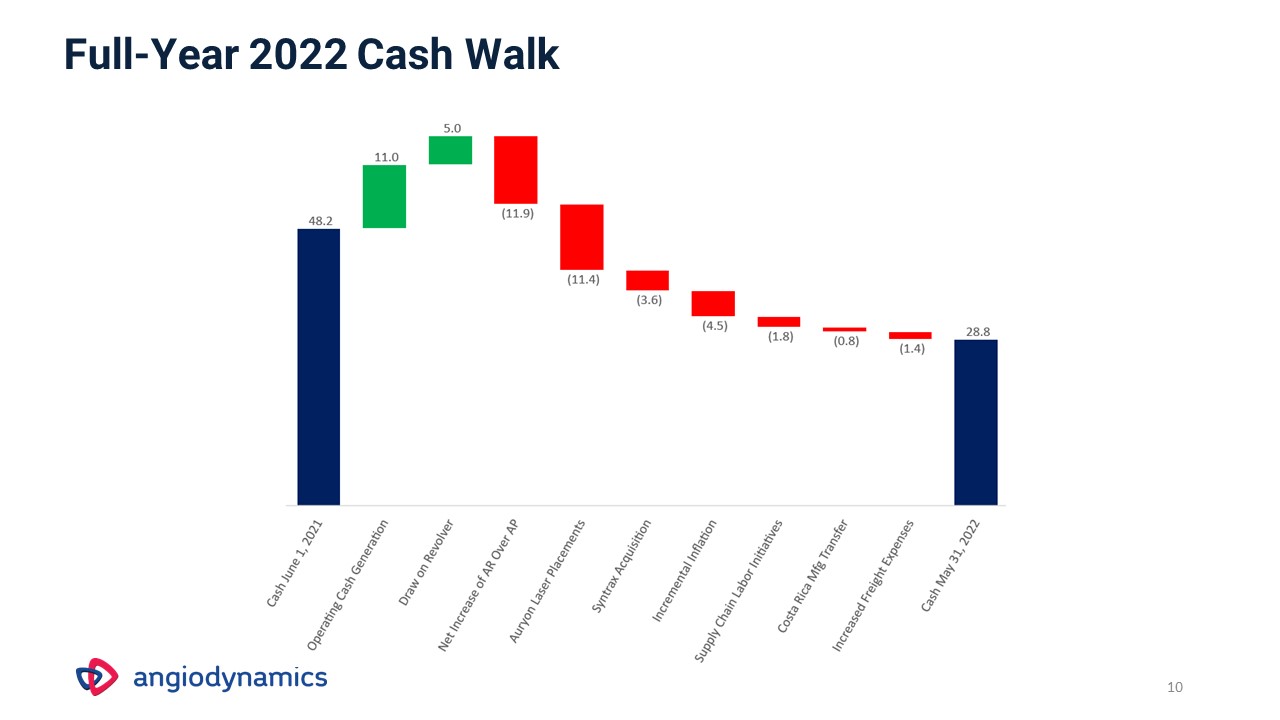
10 Full-Year 2022 Cash Walk
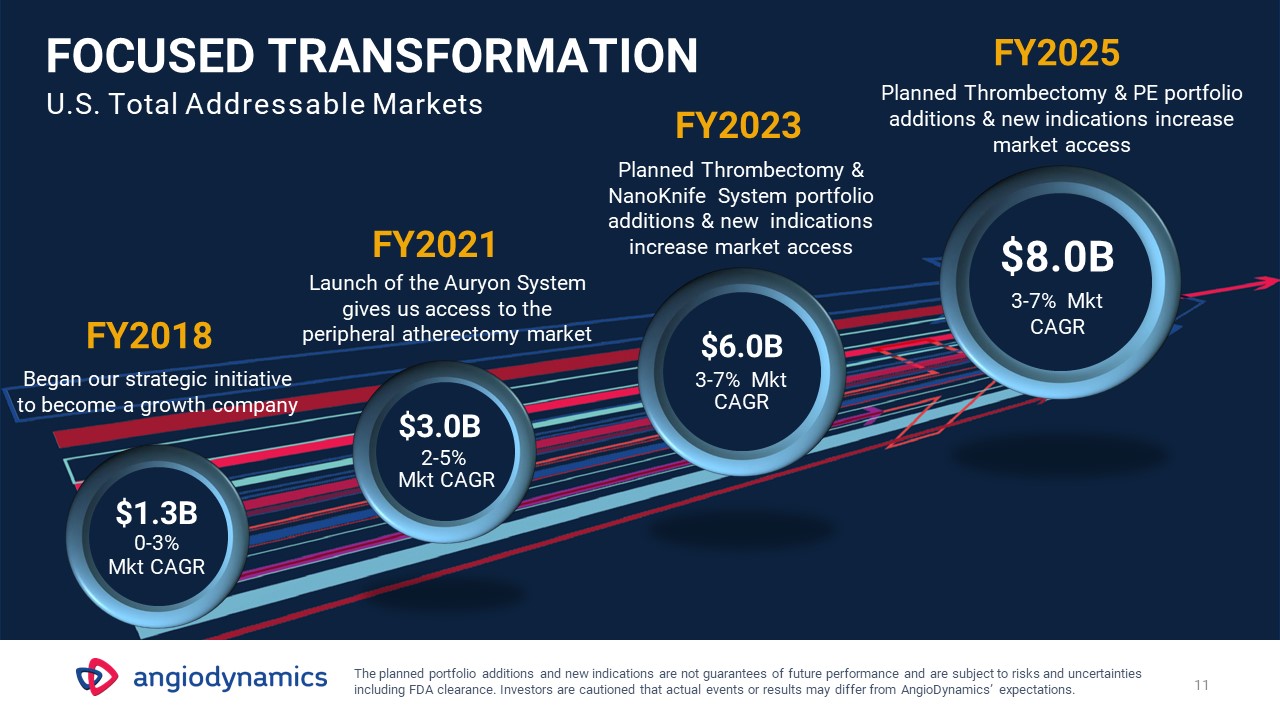
11 FOCUSED TRANSFORMATION U.S. Total Addressable Markets FY2021 Launch of the Auryon System gives us
access to the peripheral atherectomy market Planned Thrombectomy & NanoKnife System portfolio additions & new indications increase market access $3.0B 2-5% Mkt CAGR $6.0B 3-7% Mkt CAGR $8.0B 3-7% Mkt CAGR FY2023 The planned
portfolio additions and new indications are not guarantees of future performance and are subject to risks and uncertainties including FDA clearance. Investors are cautioned that actual events or results may differ from AngioDynamics’
expectations. FY2025 Planned Thrombectomy & PE portfolio additions & new indications increase market access FY2018 Began our strategic initiative to become a growth company $1.3B 0-3% Mkt CAGR
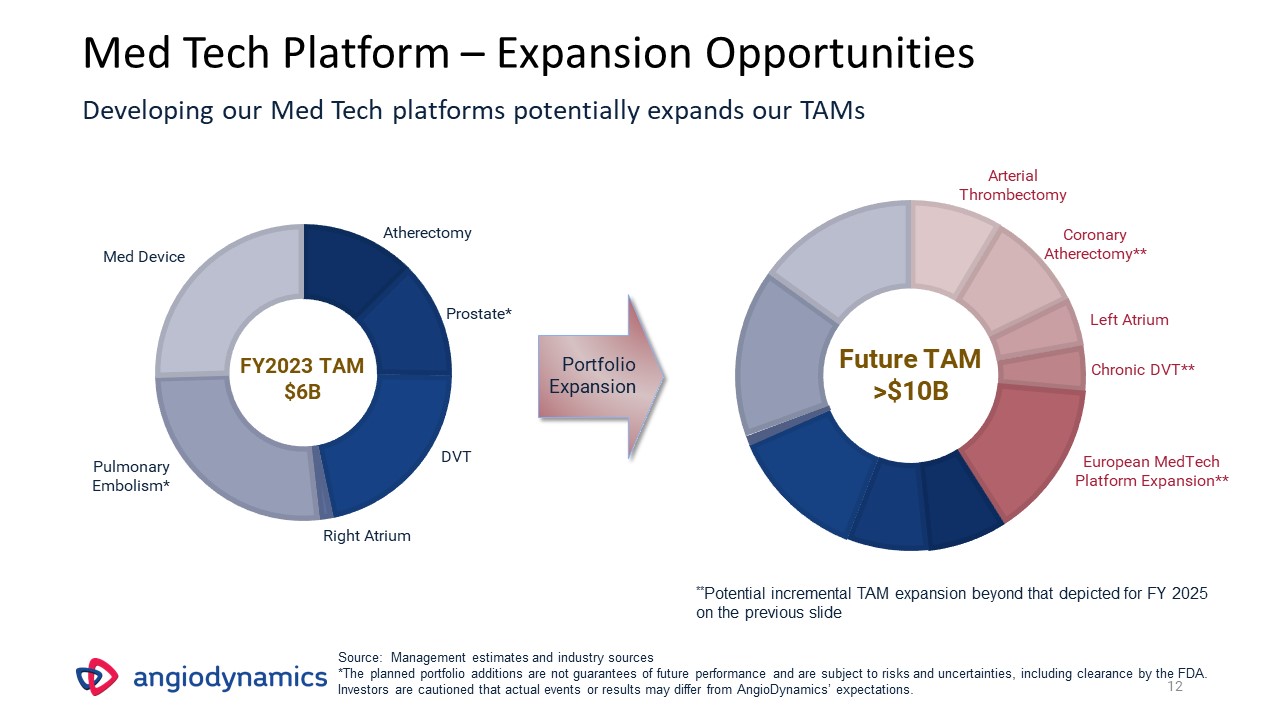
12 Med Tech Platform – Expansion Opportunities Developing our Med Tech platforms potentially expands
our TAMs FY2023 TAM $6B Portfolio Expansion Pulmonary Embolism* Left Atrium Coronary Atherectomy** Arterial Thrombectomy European MedTech Platform Expansion** DVT Atherectomy Right Atrium Prostate* Med Device Chronic
DVT** Future TAM >$10B Source: Management estimates and industry sources *The planned portfolio additions are not guarantees of future performance and are subject to risks and uncertainties, including clearance by the FDA. Investors are
cautioned that actual events or results may differ from AngioDynamics’ expectations. **Potential incremental TAM expansion beyond that depicted for FY 2025 on the previous slide
GAAP to Non-GAAP Reconciliation 13
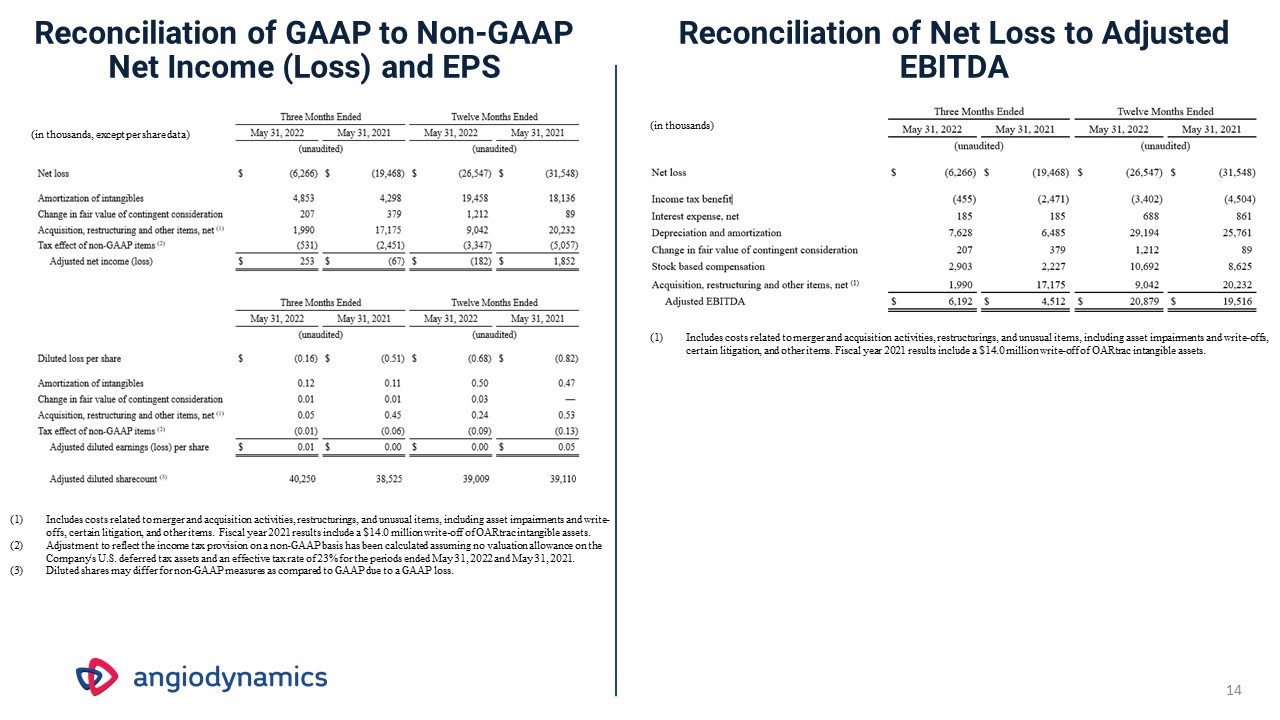
Reconciliation of GAAP to Non-GAAP Net Income (Loss) and EPS Reconciliation of Net Loss to Adjusted
EBITDA Includes costs related to merger and acquisition activities, restructurings, and unusual items, including asset impairments and write-offs, certain litigation, and other items. Fiscal year 2021 results include a $14.0 million write-off
of OARtrac intangible assets. Adjustment to reflect the income tax provision on a non-GAAP basis has been calculated assuming no valuation allowance on the Company's U.S. deferred tax assets and an effective tax rate of 23% for the periods
ended May 31, 2022 and May 31, 2021. Diluted shares may differ for non-GAAP measures as compared to GAAP due to a GAAP loss. 14 Includes costs related to merger and acquisition activities, restructurings, and unusual items, including asset
impairments and write-offs, certain litigation, and other items. Fiscal year 2021 results include a $14.0 million write-off of OARtrac intangible assets. (in thousands, except per share data) (in thousands)