
ARW 8-K
Arrow Electronics, Inc. (ARW)
8-K
2021-05-06
For: 2021-05-06
View Original
Added on
April 08, 2026
UNITED STATES
SECURITIES AND EXCHANGE COMMISSION
WASHINGTON, DC 20549
FORM 8-K
CURRENT REPORT
PURSUANT TO SECTION 13 OR 15(d) OF THE SECURITIES EXCHANGE ACT OF 1934
Date of Report (Date of earliest event reported): May 6, 2021
(Exact Name of Registrant as Specified in Charter)
| (State or Other Jurisdiction | (Commission | (IRS Employer | ||||||
| of Incorporation) | File Number) | Identification No.) | ||||||
| (Address of principal executive offices) | (Zip Code) | ||||||||||
Registrant's telephone number, including area code: (303) 824-4000
Not Applicable
(Former Name or Former Address, if Changed Since Last Report)
Check the appropriate box below if the Form 8-K filing is intended to simultaneously satisfy the filing obligation of the registrant under any of the following provisions:
| Written communications pursuant to Rule 425 under the Securities Act (17 CFR 230.425) | |||||
| Soliciting material pursuant to Rule 14a-12 under the Exchange Act (17 CFR 240.14a-12) | |||||
| Pre-commencement communications pursuant to Rule 14d-2(b) under the Exchange Act (17 CFR 240.14d-2(b)) | |||||
| Pre-commencement communications pursuant to Rule 13e-4(c) under the Exchange Act (17 CFR 240.13e-4(c)) | |||||
Securities registered pursuant to Section 12(b) of the Act:
| Title of each class | Trading Symbol(s) | Name of the exchange on which registered | ||||||||||||
Indicate by check mark whether the registrant is an emerging growth company as defined in Rule 405 of the Securities Act of 1933 (§230.405 of this chapter) or Rule 12b-2 of the Securities Exchange Act of 1934 (§240.12b-2 of this chapter).
Emerging growth company ☐
If an emerging growth company, indicate by check mark if the registrant has elected not to use the extended transition period for complying with any new or revised financial accounting standards provided pursuant to Section 13(a) of the Exchange Act. ☐
ITEM 2.02 RESULTS OF OPERATIONS AND FINANCIAL CONDITION
On May 6, 2021, the Registrant issued a press release announcing its first quarter 2021 earnings. A copy of the press release is attached hereto as an Exhibit (99.1).
On May 6, 2021, the Registrant also issued a press release containing a first quarter 2021 CFO commentary related to its first quarter 2021 earnings. A copy of that press release is attached hereto as an Exhibit (99.2).
The information in this Current Report on Form 8-K and Exhibits 99.1 and 99.2 attached hereto is being furnished and shall not be deemed "filed" for any purpose, including for the purposes of Section 18 of the Securities Exchange Act of 1934, as amended (the "Exchange Act"), or otherwise subject to the liabilities of that section, nor shall it be deemed incorporated by reference in any filing under the Securities Act of 1933, as amended or the Exchange Act, whether made before or after the date hereof, regardless of any general incorporation language in such filing.
ITEM 9.01 FINANCIAL STATEMENTS AND EXHIBITS
(d) EXHIBITS
| Exhibit Number | Description | ||||
| 104 | Cover Page Interactive Data File (embedded within the Inline XBRL document) | ||||
SIGNATURES
Pursuant to the requirements of the Securities Exchange Act of 1934, the registrant has duly caused this report to be signed on its behalf by the undersigned hereunto duly authorized.
| ARROW ELECTRONICS, INC. | ||||||||||||||
| Date: | May 6, 2021 | By: | /s/ Carine Jean-Claude | |||||||||||
| Name: | Carine Jean-Claude | |||||||||||||
| Title: | Vice President and Interim Chief Legal Officer | |||||||||||||
ARROW ELECTRONICS, INC. 9201 E. DRY CREEK ROAD CENTENNIAL, CO 80112 303-824-4000 | NEWS | |||||||
Exhibit 99.1
Arrow Electronics Reports First-Quarter 2021 Results
-- Record First-Quarter Sales, Operating Income, Net Income and Earnings per Share --
-- First-Quarter Earnings Per Share of $2.72; Non-GAAP Earnings Per Share of $2.84 --
CENTENNIAL, Colo.--(BUSINESS WIRE)-May 6, 2021--Arrow Electronics, Inc. (NYSE:ARW) today reported first-quarter 2021 sales of $8.39 billion, an increase of 31 percent from sales of $6.38 billion in the first quarter of 2020. First-quarter net income was $206 million, or $2.72 per share on a diluted basis, compared with a net income of $50 million, or $0.61 per share on a diluted basis, in the first quarter of 2020. Non-GAAP net income1 was $216 million, or $2.84 per share on a diluted basis, in the first quarter of 2021, compared with non-GAAP net income of $79 million, or $0.97 per share on a diluted basis, in the first quarter of 2020.
“Arrow’s commitment to guiding innovation forward on behalf of our customers and suppliers enabled us to deliver record results in the quarter. I am incredibly impressed with our team’s execution as we continued to help customers across key industries thrive and benefit by delivering the products, services and solutions they need,” said Michael J. Long, chairman, president, and chief executive officer. “Our continually evolving business model has adapted well to significant swings in demand and shifts in business priorities over the last year, and we look forward to further building on this strong momentum in the months ahead.”
Global components first-quarter sales of $6.44 billion reflected an increase of 42 percent year over year. Asia-Pacific components sales increased 88 percent year over year. Americas components first-quarter sales increased 10 percent year over year. Europe components first-quarter sales increased 20 percent year over year and non-GAAP sales in the region increased 10 percent year over year. Global components first-quarter operating income was $289 million and first-quarter non-GAAP operating income was $296 million.
“Strength and stability are the hallmarks of our global components business. Sales were above the high-end of our expectations for the fourth consecutive quarter, and, importantly, we are realizing robust operating leverage on our sales growth,” said Mr. Long. “We see current supply challenges as transitory and expect more balance with demand in the coming quarters.”
Global enterprise computing solutions first-quarter sales of $1.94 billion reflected an increase of 6 percent year over year and non-GAAP sales increased 2 percent year over year. Europe enterprise computing solutions first-quarter sales increased 13 percent year over year and non-GAAP sales in the region increased 4 percent year over year. Americas enterprise computing solutions first-quarter sales increased 2 percent year over year. Global enterprise computing solutions first-quarter operating income was $77 million and first-quarter non-GAAP operating income was $80 million.
Mr. Long said, “First-quarter global enterprise computing solutions sales were in-line with our prior outlook. We are seeing early indications that spending priorities are shifting to more complex projects with transformational business outcomes that are well-suited for our enterprise capabilities.”
“Our financial returns continue to improve meaningfully,” said Chris Stansbury, senior vice president and chief financial officer. “Through our disciplined working capital management, we are well-positioned to continue realizing operational leverage and converting growing profits to free cash flow in future quarters. As always, we remain committed to improving value to shareholders. During the first quarter, we repurchased approximately $150 million of shares through our stock repurchase program, ending the quarter with approximately $313 million of remaining authorization. Our balance sheet and liquidity position remain strong, and we are pleased to report return on invested capital increased year over year for the fourth straight quarter.”
1 A reconciliation of non-GAAP financial measures, including sales, gross profit, operating income, net income attributable to shareholders, and net income per share, to GAAP financial measures is presented in the reconciliation tables included herein.
 | 1 | |||||||
SECOND-QUARTER 2021 OUTLOOK
•Consolidated sales of $8.1 billion to $8.7 billion, with global components sales of $6.3 billion to $6.6 billion, and global enterprise computing solutions sales of $1.8 billion to $2.1 billion
•Net income per share on a diluted basis of $2.67 to $2.83, and non-GAAP net income per share on a diluted basis1 of $2.82 to $2.98
•Average tax rate of approximately 23 percent compared to the long-term range of 23 to 25 percent
•Average diluted shares outstanding of 75 million
•Interest expense of approximately $33 million
•Expecting average USD-to-Euro exchange rate of $1.18 to €1; changes in foreign currencies to increase sales by approximately $150 million, and earnings per share on a diluted basis by $.08 compared to the second quarter of 2020
Second-Quarter 2021 Outlook | ||||||||||||||
| Reported GAAP measure | Intangible amortization expense | Restructuring & integration charges | Non-GAAP measure | |||||||||||
| Net income per diluted share | $2.67 - $2.83 | $.10 | $.05 | $2.82 - $2.98 | ||||||||||
Please refer to the CFO commentary, which can be found at investor.arrow.com, as a supplement to the company’s earnings release.
Arrow Electronics guides innovation forward for over 180,000 leading technology manufacturers and service providers. With 2020 sales of $29 billion, Arrow develops technology solutions that improve business and daily life. Learn more at fiveyearsout.com.
Information Relating to Forward-Looking Statements
This press release includes “forward-looking” statements, as the term is defined under the federal securities laws, including but not limited to statements regarding: Arrow’s future financial performance, including its outlook on financial results for the second quarter of fiscal 2021, such as sales, net income per diluted share, non-GAAP net income per diluted share, average tax rate, average diluted shares outstanding, interest expense, average USD-to-Euro exchange rate, impact to sales due to changes in foreign currencies, intangible amortization expense per diluted share, restructuring and integration charges per diluted share, and expectation regarding market demand. These forward-looking statements are subject to numerous assumptions, risks, and uncertainties, which could cause actual results or facts to differ materially from such statements for a variety of reasons, including, but not limited to: potential adverse effects of the ongoing global COVID-19 pandemic, including actions taken to contain or treat COVID-19, industry conditions, changes in product supply, pricing and customer demand, competition, other vagaries in the global components and global enterprise computing solutions markets, changes in relationships with key suppliers, increased profit margin pressure, foreign currency fluctuation, changes in legal and regulatory matters, non-compliance with certain regulations, such as export, anti-trust, and anti-corruption laws, foreign tax and other loss contingencies, and the company's ability to generate cash flow. For a further discussion of these and other factors that could cause the company’s future results to differ materially from any forward-looking statements, see the section entitled “Risk Factors” in the company's periodic reports on Form 10-K and Form 10-Q and subsequent filings made with the Securities and Exchange Commission. Shareholders and other readers are cautioned not to place undue reliance on these forward-looking statements, which speak only as of the date on which they are made. The company undertakes no obligation to update publicly or revise any of the forward-looking statements.
Certain Non-GAAP Financial Information
In addition to disclosing financial results that are determined in accordance with accounting principles generally accepted in the United States (“GAAP”), the company also provides certain non-GAAP financial information relating to sales, operating income, net income attributable to shareholders, and net income per basic and diluted share.
The company provides non-GAAP sales, gross profit, operating income, income before income taxes, provision for income taxes, net income, and net income per share on a diluted basis which are adjusted GAAP measures for the impact of changes in foreign currencies (referred to as "changes in foreign currencies") by re-translating prior period results at current period foreign exchange rates and the impact of notes receivable reserves and recoveries related to the AFS business (referred to as “AFS notes receivable reserves and recoveries”). Non-GAAP operating income excludes identifiable intangible asset amortization, restructuring, integration, and other charges, AFS notes receivable reserves and recoveries. Non-GAAP effective tax rate excludes identifiable intangible asset amortization, restructuring, integration, and other charges, gain (loss) on investments, net, the impact of tax legislation charges, and AFS notes receivable recoveries. Net income attributable to shareholders, and net income per basic and diluted share as adjusted to exclude identifiable intangible asset amortization, restructuring, integration, and other charges, AFS notes receivable reserves and recoveries, net gains and losses on investments, and certain tax adjustments.
| 2 | |||||||
The company believes that such non-GAAP financial information is useful to investors to assist in assessing and understanding the company’s operating performance and underlying trends in the company’s business because management considers these items referred to above to be outside the company’s core operating results. This non-GAAP financial information is among the primary indicators management uses as a basis for evaluating the company’s financial and operating performance. In addition, the company’s Board of Directors may use this non-GAAP financial information in evaluating management performance and setting management compensation.
The presentation of non-GAAP financial information is not meant to be considered in isolation or as a substitute for, or alternative to, sales, operating income, net income and net income per basic and diluted share determined in accordance with GAAP. Analysis of results and outlook on a non-GAAP basis should be used as a complement to, and in conjunction with, data presented in accordance with GAAP.
A reconciliation of the company’s non-GAAP financial information to GAAP is set forth in the tables below.
| 3 | |||||||
| ARROW ELECTRONICS, INC. | |||||||||||||||||
| CONSOLIDATED STATEMENTS OF OPERATIONS | |||||||||||||||||
| (In thousands except per share data) | |||||||||||||||||
| (Unaudited) | |||||||||||||||||
| Quarter Ended | |||||||||||||||||
| April 3, 2021 | March 28, 2020 | ||||||||||||||||
| Sales | $ | 8,385,919 | $ | 6,381,417 | |||||||||||||
| Cost of sales | 7,455,809 | 5,653,026 | |||||||||||||||
| Gross profit | 930,110 | 728,391 | |||||||||||||||
| Operating expenses: | |||||||||||||||||
Selling, general, and administrative expenses | 574,567 | 533,839 | |||||||||||||||
Depreciation and amortization | 50,331 | 47,110 | |||||||||||||||
| Restructuring, integration, and other charges | 5,709 | 9,138 | |||||||||||||||
| 630,607 | 590,087 | ||||||||||||||||
| Operating income | 299,503 | 138,304 | |||||||||||||||
| Equity in earnings of affiliated companies | 844 | 530 | |||||||||||||||
| Gain (loss) on investments, net | 2,793 | (16,810) | |||||||||||||||
| Employee benefit plan (expense) credit | (1,230) | (1,109) | |||||||||||||||
| Interest and other financing expense, net | (33,656) | (43,268) | |||||||||||||||
| Income before income taxes | 268,254 | 77,647 | |||||||||||||||
| Provision for income taxes | 61,026 | 27,892 | |||||||||||||||
| Consolidated net income | 207,228 | 49,755 | |||||||||||||||
| Noncontrolling interests | 907 | 252 | |||||||||||||||
| Net income attributable to shareholders | $ | 206,321 | $ | 49,503 | |||||||||||||
| Net income (loss) per share: | |||||||||||||||||
Basic | $ | 2.76 | $ | 0.62 | |||||||||||||
Diluted | $ | 2.72 | $ | 0.61 | |||||||||||||
| Weighted-average shares outstanding: | |||||||||||||||||
Basic | 74,882 | 80,407 | |||||||||||||||
Diluted | 75,794 | 81,108 | |||||||||||||||
| 4 | |||||||
| ARROW ELECTRONICS, INC. | |||||||||||
| CONSOLIDATED BALANCE SHEETS | |||||||||||
| (In thousands except par value) | |||||||||||
| (Unaudited) | |||||||||||
| April 3, 2021 | December 31, 2020 | ||||||||||
| ASSETS | |||||||||||
| Current assets: | |||||||||||
| Cash and cash equivalents | $ | 227,701 | $ | 373,615 | |||||||
| Accounts receivable, net | 8,503,010 | 9,205,343 | |||||||||
| Inventories | 3,275,389 | 3,287,308 | |||||||||
| Other current assets | 360,968 | 286,633 | |||||||||
| Total current assets | 12,367,068 | 13,152,899 | |||||||||
| Property, plant, and equipment, at cost: | |||||||||||
| Land | 5,691 | 7,940 | |||||||||
| Buildings and improvements | 177,615 | 207,614 | |||||||||
| Machinery and equipment | 1,521,489 | 1,553,371 | |||||||||
| 1,704,795 | 1,768,925 | ||||||||||
| Less: Accumulated depreciation and amortization | (957,257) | (969,320) | |||||||||
| Property, plant, and equipment, net | 747,538 | 799,605 | |||||||||
| Investments in affiliated companies | 77,330 | 76,358 | |||||||||
| Intangible assets, net | 223,848 | 233,819 | |||||||||
| Goodwill | 2,101,938 | 2,115,469 | |||||||||
| Other assets | 655,838 | 675,761 | |||||||||
| Total assets | $ | 16,173,560 | $ | 17,053,911 | |||||||
| LIABILITIES AND EQUITY | |||||||||||
| Current liabilities: | |||||||||||
| Accounts payable | $ | 7,045,759 | $ | 7,937,889 | |||||||
| Accrued expenses | 985,928 | 1,034,361 | |||||||||
| Short-term borrowings, including current portion of long-term debt | 361,327 | 158,633 | |||||||||
| Total current liabilities | 8,393,014 | 9,130,883 | |||||||||
| Long-term debt | 1,903,848 | 2,097,940 | |||||||||
| Other liabilities | 662,252 | 676,136 | |||||||||
| Commitments and contingencies | |||||||||||
| Equity: | |||||||||||
| Shareholders’ equity: | |||||||||||
| Common stock, par value $1: | |||||||||||
| Authorized - 160,000 shares in both 2021 and 2020 | |||||||||||
| Issued - 125,424 shares in both 2021 and 2020 | 125,424 | 125,424 | |||||||||
| Capital in excess of par value | 1,166,554 | 1,165,850 | |||||||||
| Treasury stock (51,426 and 50,581 shares in 2021 and 2020, respectively), at cost | (2,898,830) | (2,776,821) | |||||||||
| Retained earnings | 6,886,072 | 6,679,751 | |||||||||
| Accumulated other comprehensive loss | (123,461) | (104,885) | |||||||||
| Total shareholders’ equity | 5,155,759 | 5,089,319 | |||||||||
| Noncontrolling interests | 58,687 | 59,633 | |||||||||
| Total equity | 5,214,446 | 5,148,952 | |||||||||
| Total liabilities and equity | $ | 16,173,560 | $ | 17,053,911 | |||||||
| 5 | |||||||
| ARROW ELECTRONICS, INC. | |||||||||||
| CONSOLIDATED STATEMENTS OF CASH FLOWS | |||||||||||
| (In thousands) | |||||||||||
| (Unaudited) | |||||||||||
| Quarter Ended | |||||||||||
| April 3, 2021 | March 28, 2020 | ||||||||||
| Cash flows from operating activities: | |||||||||||
| Consolidated net income | $ | 207,228 | $ | 49,755 | |||||||
| Adjustments to reconcile consolidated net income to net cash provided by operations: | |||||||||||
| Depreciation and amortization | 50,331 | 47,110 | |||||||||
| Amortization of stock-based compensation | 13,223 | 13,920 | |||||||||
| Equity in (earnings) losses of affiliated companies | (844) | (530) | |||||||||
| Deferred income taxes | 13,663 | 32,613 | |||||||||
| Gain on investments, net | (2,793) | 16,810 | |||||||||
| Other | 1,374 | (205) | |||||||||
| Change in assets and liabilities, net of effects of acquired and disposed businesses: | |||||||||||
| Accounts receivable, net | 596,777 | 558,605 | |||||||||
| Inventories | (13,147) | 133,392 | |||||||||
| Accounts payable | (840,124) | (343,051) | |||||||||
| Accrued expenses | 3,643 | (31,326) | |||||||||
| Other assets and liabilities | (33,867) | (10,228) | |||||||||
| Net cash provided by operating activities | (4,536) | 466,865 | |||||||||
| Cash flows from investing activities: | |||||||||||
| Acquisition of property, plant, and equipment | (20,180) | (27,971) | |||||||||
| Proceeds from sale of property, plant, and equipment | 22,171 | — | |||||||||
| Other | — | (5,466) | |||||||||
| Net cash used for investing activities | 1,991 | (33,437) | |||||||||
| Cash flows from financing activities: | |||||||||||
| Change in short-term and other borrowings | (12,452) | (84,354) | |||||||||
| Proceeds from (repayments of) long-term bank borrowings, net | 154,674 | (288,577) | |||||||||
| Redemption of notes | (130,860) | — | |||||||||
| Proceeds from exercise of stock options | 26,091 | 1,980 | |||||||||
| Repurchases of common stock | (160,619) | (158,989) | |||||||||
| Net cash used for financing activities | (123,166) | (529,940) | |||||||||
| Effect of exchange rate changes on cash | (20,203) | (2,593) | |||||||||
| Net increase (decrease) in cash and cash equivalents | (145,914) | (99,105) | |||||||||
| Cash and cash equivalents at beginning of period | 373,615 | 300,103 | |||||||||
| Cash and cash equivalents at end of period | $ | 227,701 | $ | 200,998 | |||||||
| 6 | |||||||
| ARROW ELECTRONICS, INC. | |||||||||||||||||
| NON-GAAP SALES RECONCILIATION | |||||||||||||||||
| (In thousands) | |||||||||||||||||
| (Unaudited) | |||||||||||||||||
| Quarter Ended | |||||||||||||||||
| April 3, 2021 | March 28, 2020 | % Change | |||||||||||||||
| Consolidated sales, as reported | $ | 8,385,919 | $ | 6,381,417 | 31.4 | % | |||||||||||
| Impact of changes in foreign currencies | — | 202,672 | |||||||||||||||
| Non-GAAP consolidated sales | $ | 8,385,919 | $ | 6,584,089 | 27.4 | % | |||||||||||
| Global components sales, as reported | $ | 6,443,253 | $ | 4,550,601 | 41.6 | % | |||||||||||
| Impact of changes in foreign currencies | — | 130,299 | |||||||||||||||
| Non-GAAP global components sales | $ | 6,443,253 | $ | 4,680,900 | 37.6 | % | |||||||||||
| Americas Components sales, as reported | $ | 1,701,173 | $ | 1,552,798 | 9.6 | % | |||||||||||
| Impact of changes in foreign currencies | — | (290) | |||||||||||||||
| Non-GAAP Americas Components sales | $ | 1,701,173 | $ | 1,552,508 | 9.6 | % | |||||||||||
| Europe components sales, as reported | $ | 1,568,602 | $ | 1,309,990 | 19.7 | % | |||||||||||
| Impact of changes in foreign currencies | — | 115,285 | |||||||||||||||
| Non-GAAP Europe components sales | $ | 1,568,602 | $ | 1,425,275 | 10.1 | % | |||||||||||
| Asia components sales, as reported | $ | 3,173,478 | $ | 1,687,813 | 88.0 | % | |||||||||||
| Impact of changes in foreign currencies | — | 15,304 | |||||||||||||||
| Non-GAAP Asia components sales | $ | 3,173,478 | $ | 1,703,117 | 86.3 | % | |||||||||||
| Global ECS sales, as reported | $ | 1,942,666 | $ | 1,830,816 | 6.1 | % | |||||||||||
| Impact of changes in foreign currencies | — | 72,373 | |||||||||||||||
| Non-GAAP global ECS sales | $ | 1,942,666 | $ | 1,903,189 | 2.1 | % | |||||||||||
| Europe ECS sales, as reported | $ | 791,328 | $ | 702,128 | 12.7 | % | |||||||||||
| Impact of changes in foreign currencies | — | 59,801 | |||||||||||||||
| Non-GAAP Europe ECS sales | $ | 791,328 | $ | 761,929 | 3.9 | % | |||||||||||
| Americas ECS sales, as reported | $ | 1,151,338 | $ | 1,128,688 | 2.0 | % | |||||||||||
| Impact of changes in foreign currencies | — | 12,572 | |||||||||||||||
| Non-GAAP Americas ECS sales | $ | 1,151,338 | $ | 1,141,260 | 0.9 | % | |||||||||||
| 7 | |||||||
| ARROW ELECTRONICS, INC. | |||||||||||||||||||||||
| NON-GAAP EARNINGS RECONCILIATION | |||||||||||||||||||||||
| (In thousands except per share data) | |||||||||||||||||||||||
| (Unaudited) | |||||||||||||||||||||||
| Three months ended April 3, 2021 | |||||||||||||||||||||||
| Reported GAAP measure | Intangible amortization expense | Restructuring & Integration charges | AFS Reserves & Recoveries | Non-recurring tax items | Other(1) | Non-GAAP measure | |||||||||||||||||
| Sales | $ | 8,385,919 | $ | — | $ | — | $ | — | $ | — | $ | — | $ | 8,385,919 | |||||||||
| Gross Profit | 930,110 | — | — | — | — | — | 930,110 | ||||||||||||||||
| Operating income | 299,503 | 9,326 | 5,709 | — | — | — | 314,538 | ||||||||||||||||
| Income before income taxes | 268,254 | 9,326 | 5,709 | — | — | (2,793) | 280,496 | ||||||||||||||||
| Provision for income taxes | 61,026 | 2,385 | 1,166 | — | — | (672) | 63,905 | ||||||||||||||||
| Consolidated net income | 207,228 | 6,941 | 4,543 | — | — | (2,121) | 216,591 | ||||||||||||||||
| Noncontrolling interests | 907 | 150 | — | — | — | — | 1,057 | ||||||||||||||||
| Net income attributable to shareholders | $ | 206,321 | $ | 6,791 | $ | 4,543 | $ | — | $ | — | $ | (2,121) | 215,534 | ||||||||||
| Net income per diluted share | $ | 2.72 | $ | 0.09 | $ | 0.06 | $ | — | $ | — | $ | (0.03) | $ | 2.84 | |||||||||
Effective tax rate (2) | 22.7 | % | 22.8 | % | |||||||||||||||||||
| Three months ended March 28, 2020 | |||||||||||||||||||||||
| Reported GAAP measure | Intangible amortization expense | Restructuring & Integration charges | AFS Reserves & Recoveries | Non-recurring tax items | Other(1) | Non-GAAP measure | |||||||||||||||||
| Sales | $ | 6,381,417 | $ | — | $ | — | $ | — | $ | — | $ | — | $ | 6,381,417 | |||||||||
| Gross Profit | 728,391 | — | — | — | — | — | 728,391 | ||||||||||||||||
| Operating income | 138,304 | 9,955 | 9,138 | (920) | — | — | 156,477 | ||||||||||||||||
| Income before income taxes | 77,647 | 9,955 | 9,138 | (920) | — | 16,810 | 112,630 | ||||||||||||||||
| Provision for income taxes | 27,892 | 2,564 | 2,571 | (222) | (3,615) | 4,057 | 33,247 | ||||||||||||||||
| Consolidated net income | 49,755 | 7,391 | 6,567 | (698) | 3,615 | 12,753 | 79,383 | ||||||||||||||||
| Noncontrolling interests | 252 | 137 | — | — | — | — | 389 | ||||||||||||||||
| Net income attributable to shareholders | $ | 49,503 | $ | 7,254 | $ | 6,567 | $ | (698) | $ | 3,615 | $ | 12,753 | $ | 78,994 | |||||||||
| Net income per diluted share | $ | 0.61 | $ | 0.09 | $ | 0.08 | $ | (0.01) | $ | 0.04 | $ | 0.16 | $ | 0.97 | |||||||||
Effective tax rate (2) | 35.9 | % | 29.5 | % | |||||||||||||||||||
| (1) Other includes (gain) loss on investments, net. | |||||||||||||||||||||||
| (2) The items as shown in this table, represent the reconciling items for the tax rate as reported by GAAP measure and as a non-GAAP measure. | |||||||||||||||||||||||
| 8 | |||||||
| ARROW ELECTRONICS, INC. | ||||||||||||||
| SEGMENT INFORMATION | ||||||||||||||
| (In thousands) | ||||||||||||||
| (Unaudited) | ||||||||||||||
| Quarter Ended | ||||||||||||||
| April 3, 2021 | March 28, 2020 | |||||||||||||
| Sales: | ||||||||||||||
| Global components | $ | 6,443,253 | $ | 4,550,601 | ||||||||||
| Global ECS | 1,942,666 | 1,830,816 | ||||||||||||
| Consolidated | $ | 8,385,919 | $ | 6,381,417 | ||||||||||
| Operating income (loss): | ||||||||||||||
| Global components | $ | 289,383 | $ | 164,767 | ||||||||||
| Global ECS (a) | 77,359 | 42,433 | ||||||||||||
| Corporate (b) | (67,239) | (68,896) | ||||||||||||
| Consolidated | $ | 299,503 | $ | 138,304 | ||||||||||
(a)Includes reserves and other adjustments of approximately $29.9 million primarily related to foreign tax and other loss contingencies for the first quarter of 2020. These reserves are principally associated with transactional taxes on activity from several prior years, not significant to any one year.
(b)Includes restructuring, integration, and other charges of $5.7 million for the first quarter of 2021, and $9.1 million for the first quarter of 2020, respectively.
| NON-GAAP SEGMENT RECONCILIATION | ||||||||||||||
| Quarter Ended | ||||||||||||||
| April 3, 2021 | March 28, 2020 | |||||||||||||
| Global components operating income (loss), as reported | $ | 289,383 | $ | 164,767 | ||||||||||
| Intangible assets amortization expense | 7,004 | 7,380 | ||||||||||||
| AFS notes receivable reserve (recoveries) | — | (920) | ||||||||||||
| Global components non-GAAP operating income | $ | 296,387 | $ | 171,227 | ||||||||||
| Global ECS operating income, as reported | $ | 77,359 | $ | 42,433 | ||||||||||
| Intangible assets amortization expense | 2,322 | 2,575 | ||||||||||||
| Global ECS non-GAAP operating income | $ | 79,681 | $ | 45,008 | ||||||||||
Contact: Steven O’Brien,
Vice President, Investor Relations
303-824-4544
Media Contact: John Hourigan,
Vice President, Global Communications
303-824-4586
| 9 | |||||||
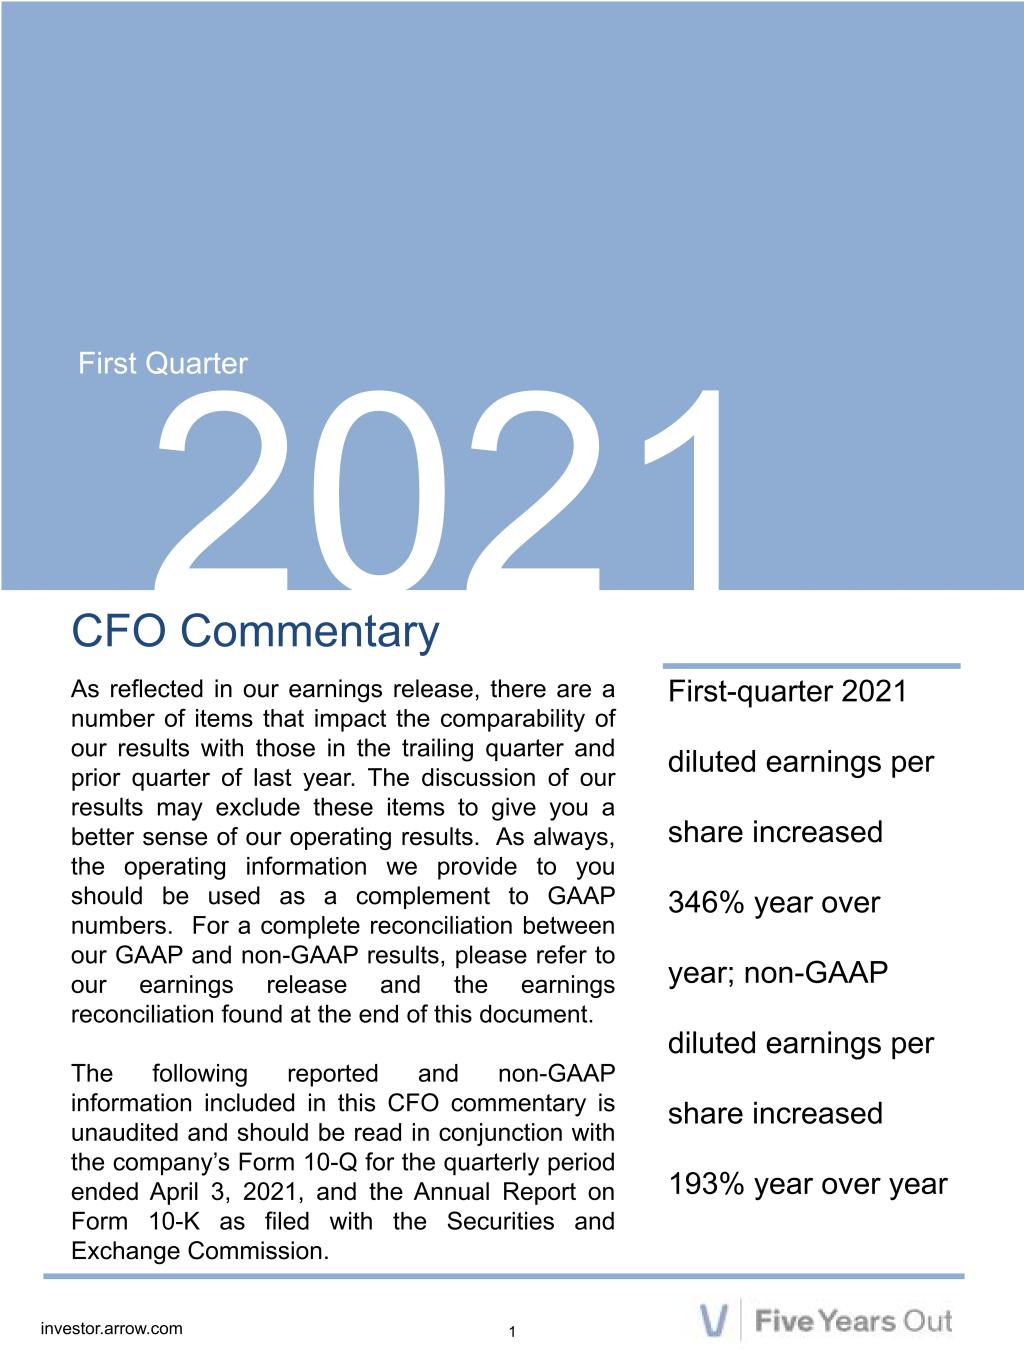
1investor.arrow.com First Quarter 2021 CFO Commentary As reflected in our earnings release, there are a number of items that impact the comparability of our results with those in the trailing quarter and prior quarter of last year. The discussion of our results may exclude these items to give you a better sense of our operating results. As always, the operating information we provide to you should be used as a complement to GAAP numbers. For a complete reconciliation between our GAAP and non-GAAP results, please refer to our earnings release and the earnings reconciliation found at the end of this document. The following reported and non-GAAP information included in this CFO commentary is unaudited and should be read in conjunction with the company’s Form 10-Q for the quarterly period ended April 3, 2021, and the Annual Report on Form 10-K as filed with the Securities and Exchange Commission. First-quarter 2021 diluted earnings per share increased 346% year over year; non-GAAP diluted earnings per share increased 193% year over year
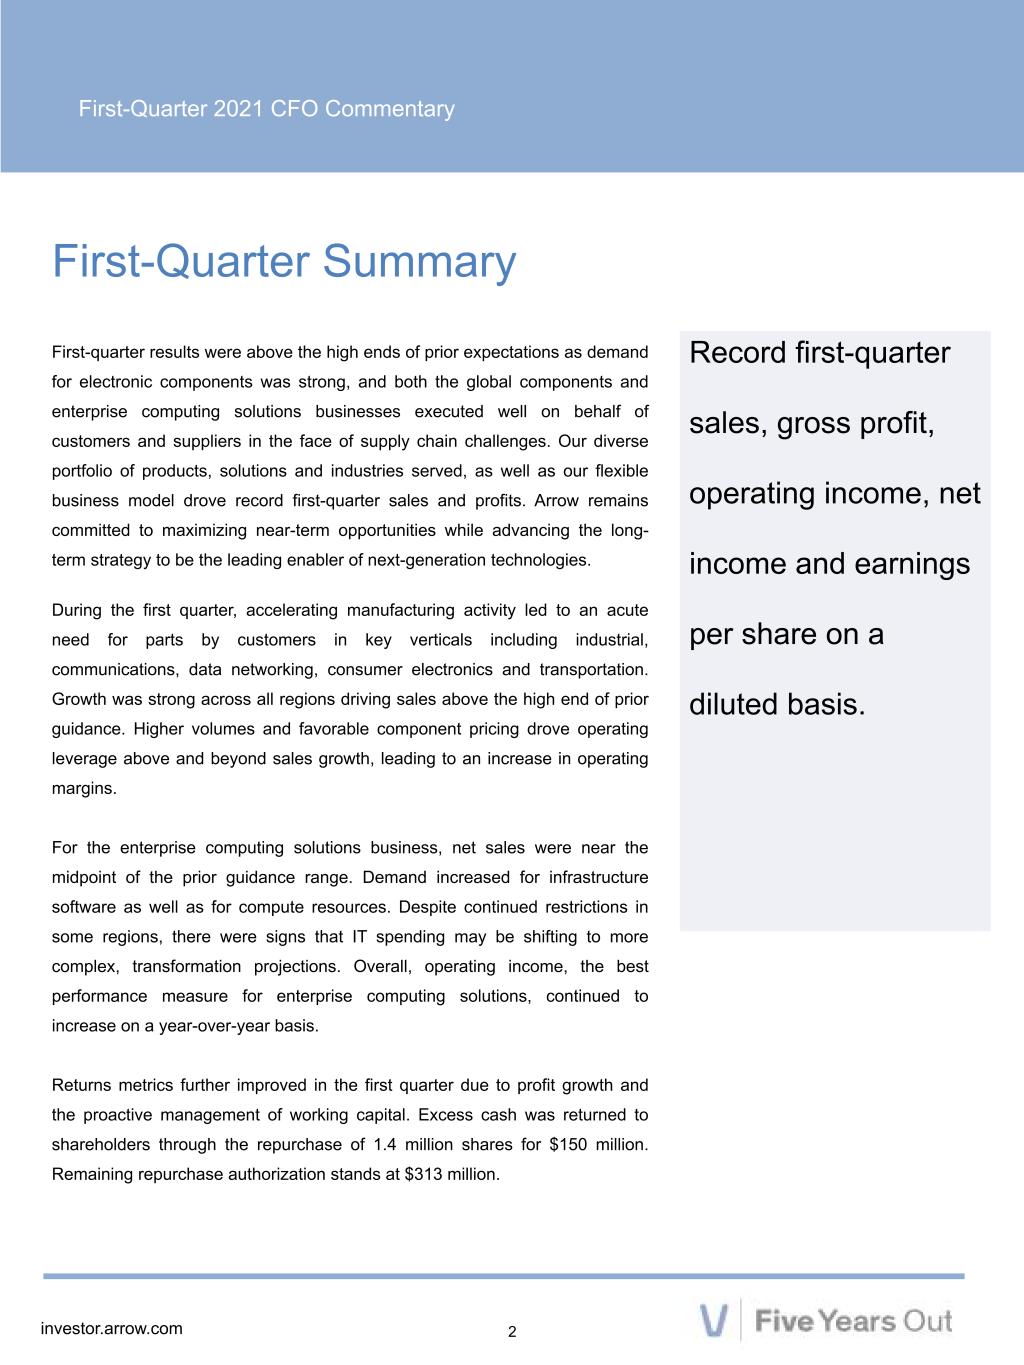
First-Quarter 2021 CFO Commentary 2investor.arrow.com First-Quarter Summary First-quarter results were above the high ends of prior expectations as demand for electronic components was strong, and both the global components and enterprise computing solutions businesses executed well on behalf of customers and suppliers in the face of supply chain challenges. Our diverse portfolio of products, solutions and industries served, as well as our flexible business model drove record first-quarter sales and profits. Arrow remains committed to maximizing near-term opportunities while advancing the long- term strategy to be the leading enabler of next-generation technologies. During the first quarter, accelerating manufacturing activity led to an acute need for parts by customers in key verticals including industrial, communications, data networking, consumer electronics and transportation. Growth was strong across all regions driving sales above the high end of prior guidance. Higher volumes and favorable component pricing drove operating leverage above and beyond sales growth, leading to an increase in operating margins. For the enterprise computing solutions business, net sales were near the midpoint of the prior guidance range. Demand increased for infrastructure software as well as for compute resources. Despite continued restrictions in some regions, there were signs that IT spending may be shifting to more complex, transformation projections. Overall, operating income, the best performance measure for enterprise computing solutions, continued to increase on a year-over-year basis. Returns metrics further improved in the first quarter due to profit growth and the proactive management of working capital. Excess cash was returned to shareholders through the repurchase of 1.4 million shares for $150 million. Remaining repurchase authorization stands at $313 million. Record first-quarter sales, gross profit, operating income, net income and earnings per share on a diluted basis.
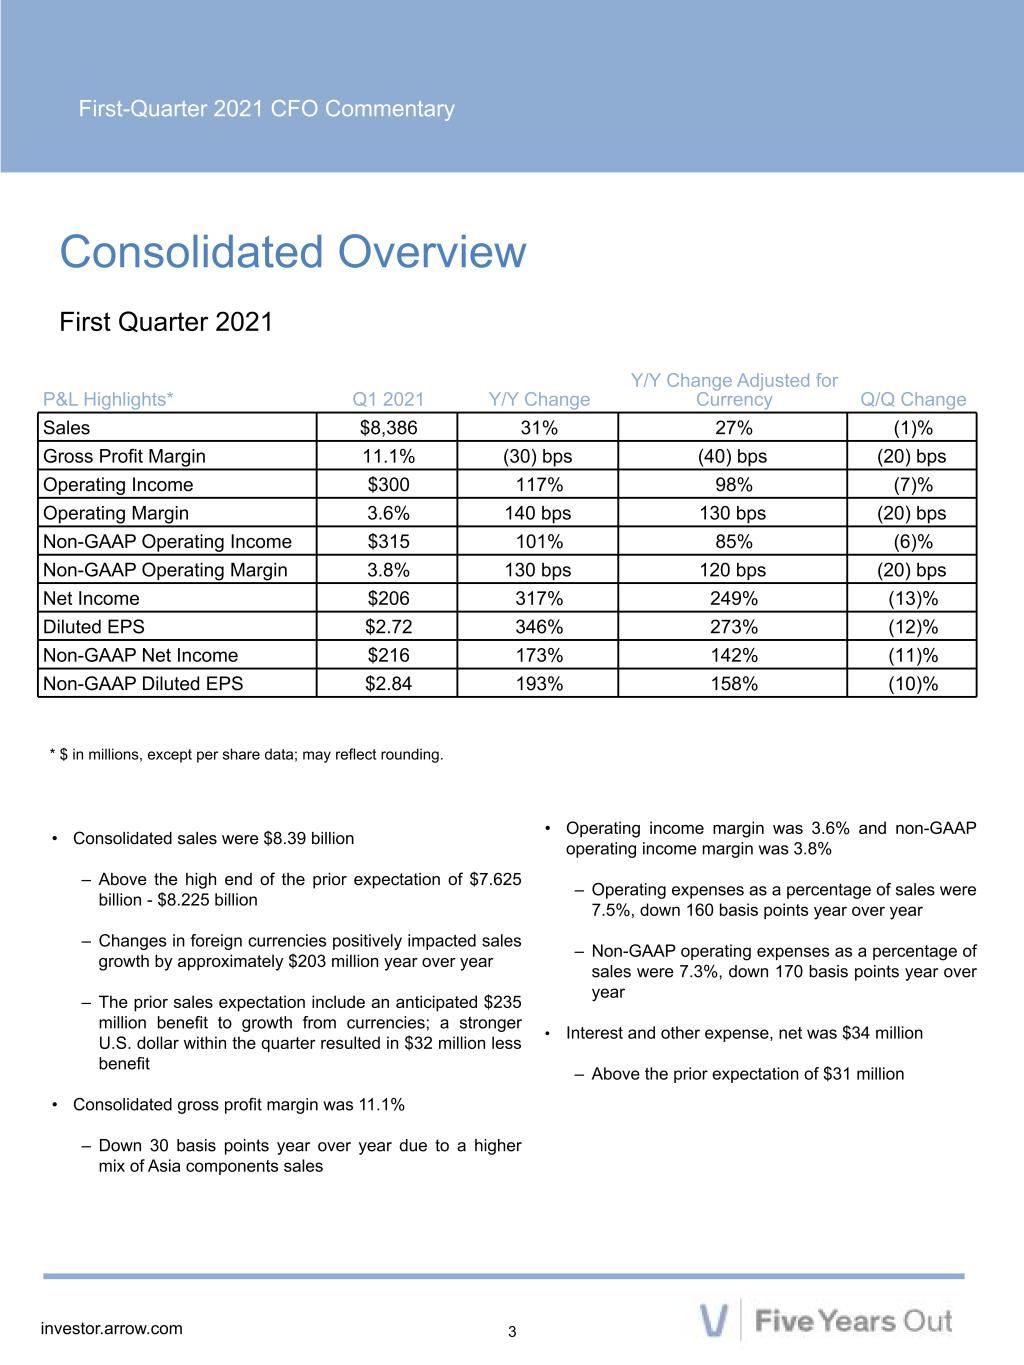
First-Quarter 2021 CFO Commentary 3investor.arrow.com P&L Highlights* Q1 2021 Y/Y Change Y/Y Change Adjusted for Currency Q/Q Change Sales $8,386 31% 27% (1)% Gross Profit Margin 11.1% (30) bps (40) bps (20) bps Operating Income $300 117% 98% (7)% Operating Margin 3.6% 140 bps 130 bps (20) bps Non-GAAP Operating Income $315 101% 85% (6)% Non-GAAP Operating Margin 3.8% 130 bps 120 bps (20) bps Net Income $206 317% 249% (13)% Diluted EPS $2.72 346% 273% (12)% Non-GAAP Net Income $216 173% 142% (11)% Non-GAAP Diluted EPS $2.84 193% 158% (10)% Consolidated Overview First Quarter 2021 * $ in millions, except per share data; may reflect rounding. • Consolidated sales were $8.39 billion – Above the high end of the prior expectation of $7.625 billion - $8.225 billion – Changes in foreign currencies positively impacted sales growth by approximately $203 million year over year – The prior sales expectation include an anticipated $235 million benefit to growth from currencies; a stronger U.S. dollar within the quarter resulted in $32 million less benefit • Consolidated gross profit margin was 11.1% – Down 30 basis points year over year due to a higher mix of Asia components sales • Operating income margin was 3.6% and non-GAAP operating income margin was 3.8% – Operating expenses as a percentage of sales were 7.5%, down 160 basis points year over year – Non-GAAP operating expenses as a percentage of sales were 7.3%, down 170 basis points year over year • Interest and other expense, net was $34 million – Above the prior expectation of $31 million
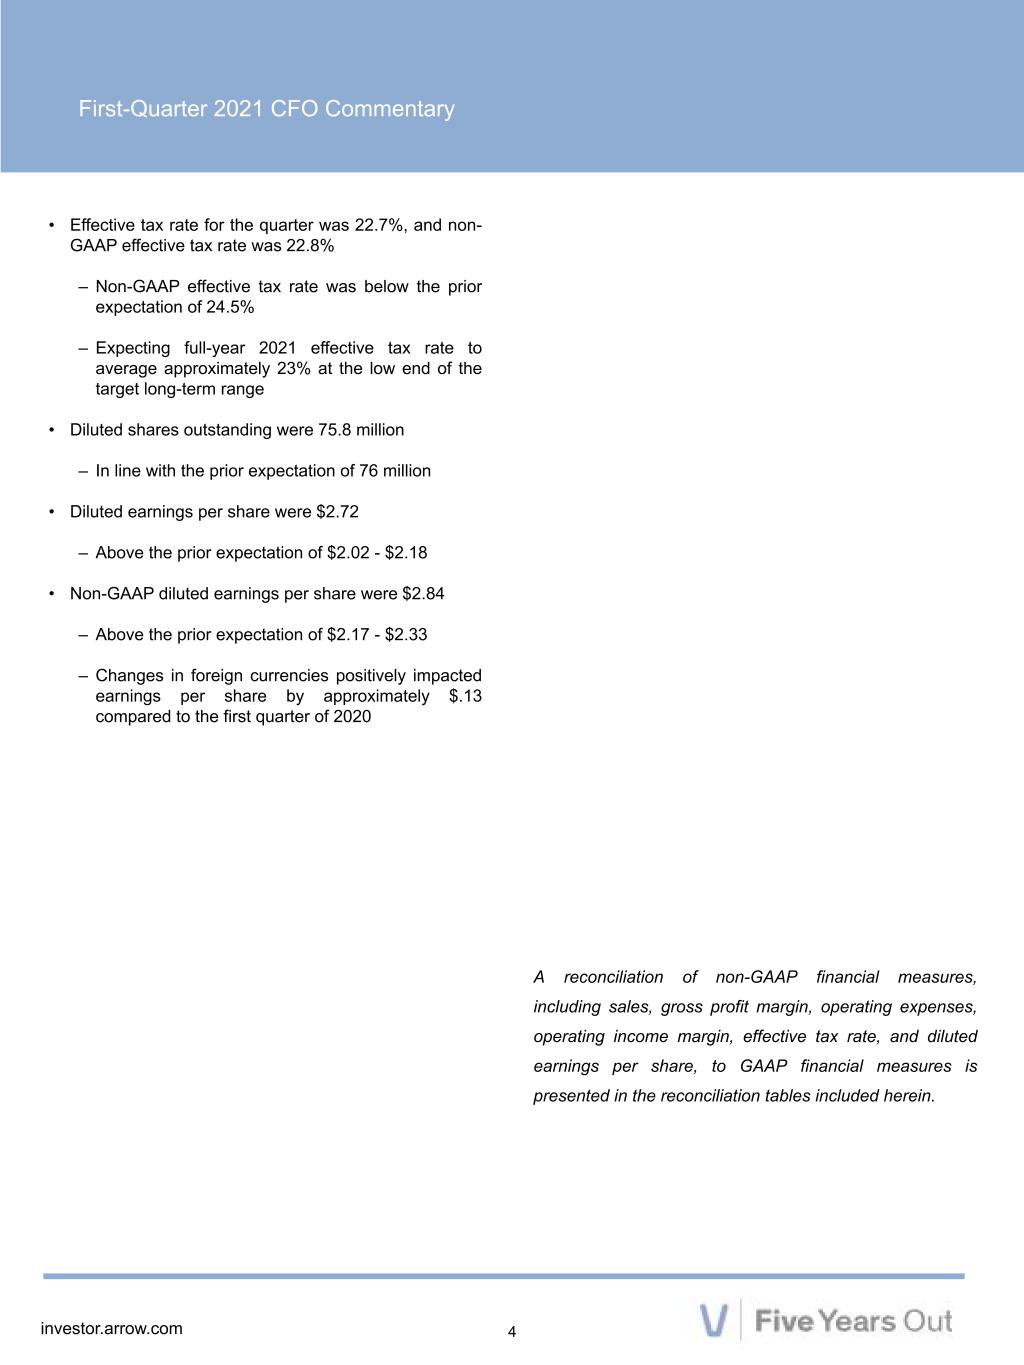
First-Quarter 2021 CFO Commentary 4investor.arrow.com • Effective tax rate for the quarter was 22.7%, and non- GAAP effective tax rate was 22.8% – Non-GAAP effective tax rate was below the prior expectation of 24.5% – Expecting full-year 2021 effective tax rate to average approximately 23% at the low end of the target long-term range • Diluted shares outstanding were 75.8 million – In line with the prior expectation of 76 million • Diluted earnings per share were $2.72 – Above the prior expectation of $2.02 - $2.18 • Non-GAAP diluted earnings per share were $2.84 – Above the prior expectation of $2.17 - $2.33 – Changes in foreign currencies positively impacted earnings per share by approximately $.13 compared to the first quarter of 2020 A reconciliation of non-GAAP financial measures, including sales, gross profit margin, operating expenses, operating income margin, effective tax rate, and diluted earnings per share, to GAAP financial measures is presented in the reconciliation tables included herein.
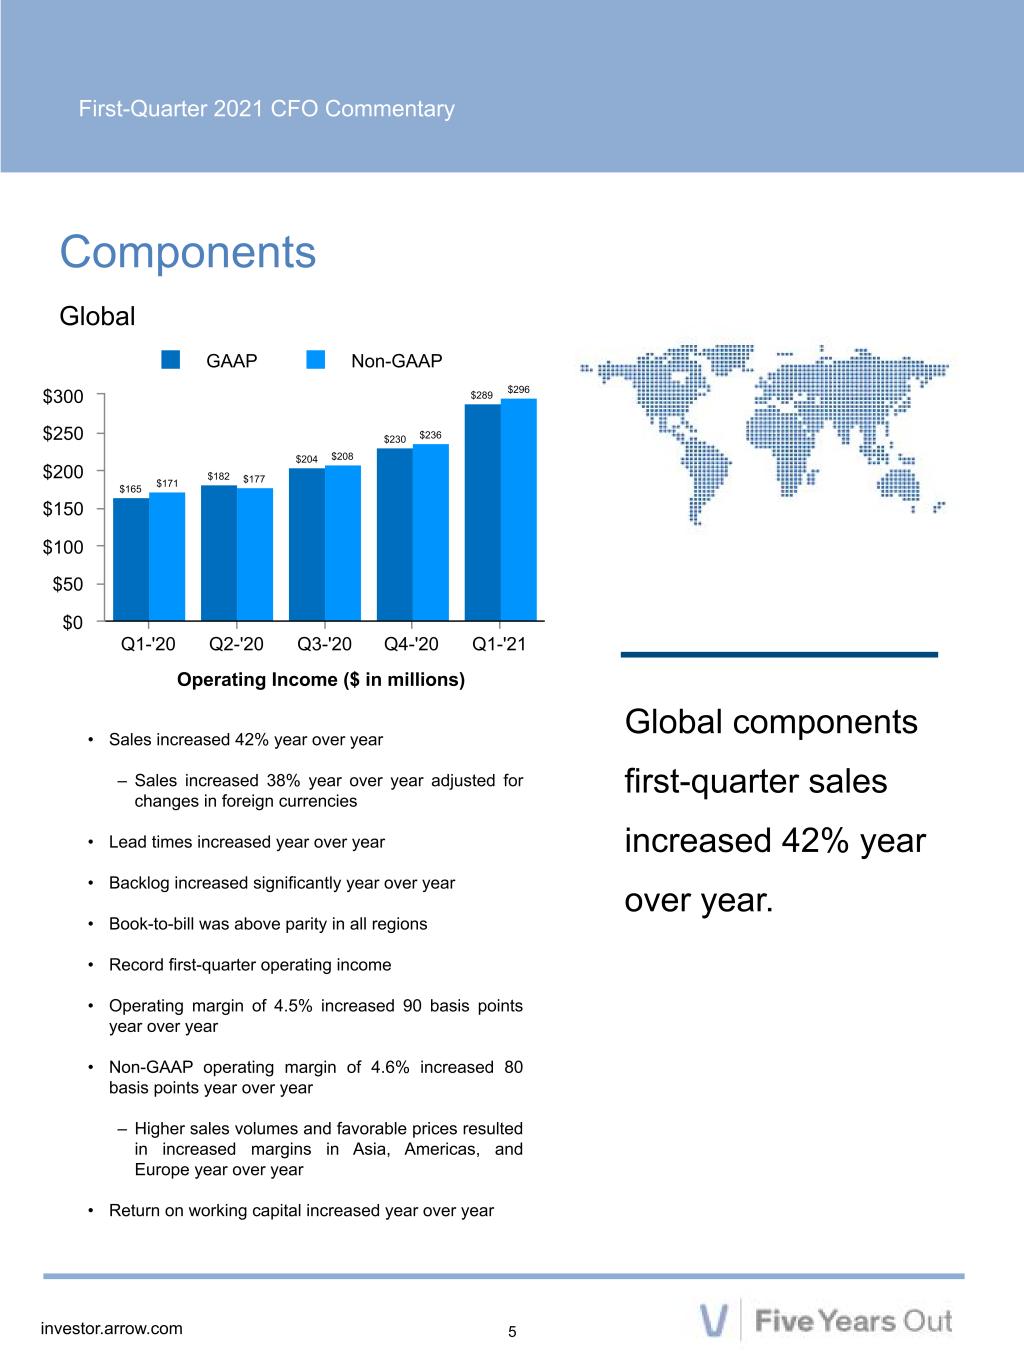
First-Quarter 2021 CFO Commentary 5investor.arrow.com $165 $182 $204 $230 $289 $171 $177 $208 $236 $296 GAAP Non-GAAP Q1-'20 Q2-'20 Q3-'20 Q4-'20 Q1-'21 $0 $50 $100 $150 $200 $250 $300 Components Global • Sales increased 42% year over year – Sales increased 38% year over year adjusted for changes in foreign currencies • Lead times increased year over year • Backlog increased significantly year over year • Book-to-bill was above parity in all regions • Record first-quarter operating income • Operating margin of 4.5% increased 90 basis points year over year • Non-GAAP operating margin of 4.6% increased 80 basis points year over year – Higher sales volumes and favorable prices resulted in increased margins in Asia, Americas, and Europe year over year • Return on working capital increased year over year Global components first-quarter sales increased 42% year over year. Operating Income ($ in millions)
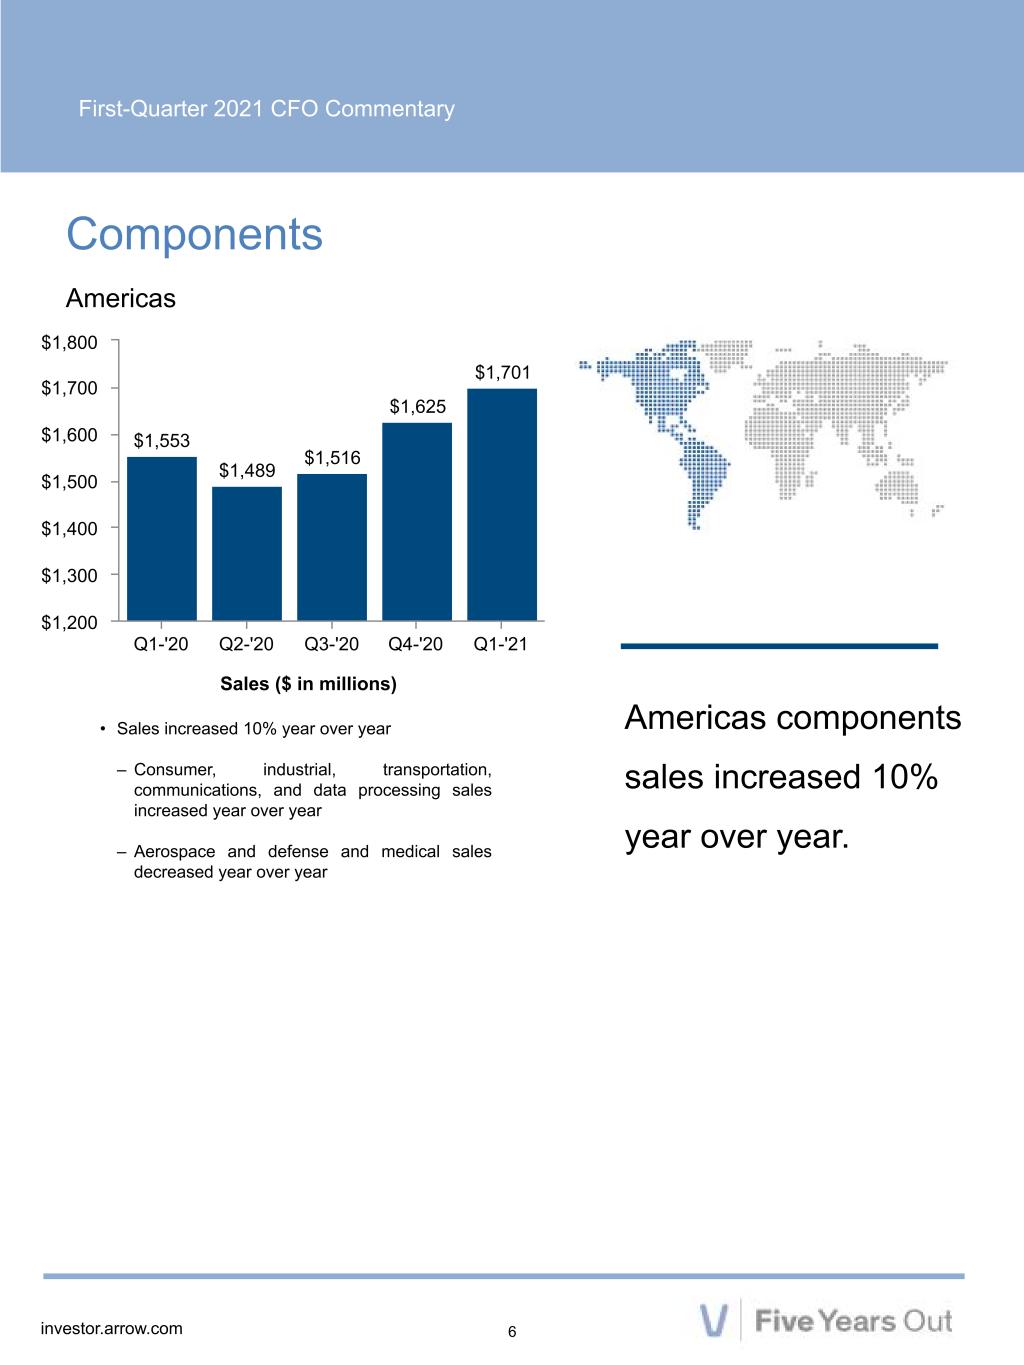
First-Quarter 2021 CFO Commentary 6investor.arrow.com $1,553 $1,489 $1,516 $1,625 $1,701 Q1-'20 Q2-'20 Q3-'20 Q4-'20 Q1-'21 $1,200 $1,300 $1,400 $1,500 $1,600 $1,700 $1,800 Components Americas • Sales increased 10% year over year – Consumer, industrial, transportation, communications, and data processing sales increased year over year – Aerospace and defense and medical sales decreased year over year Americas components sales increased 10% year over year. Sales ($ in millions)
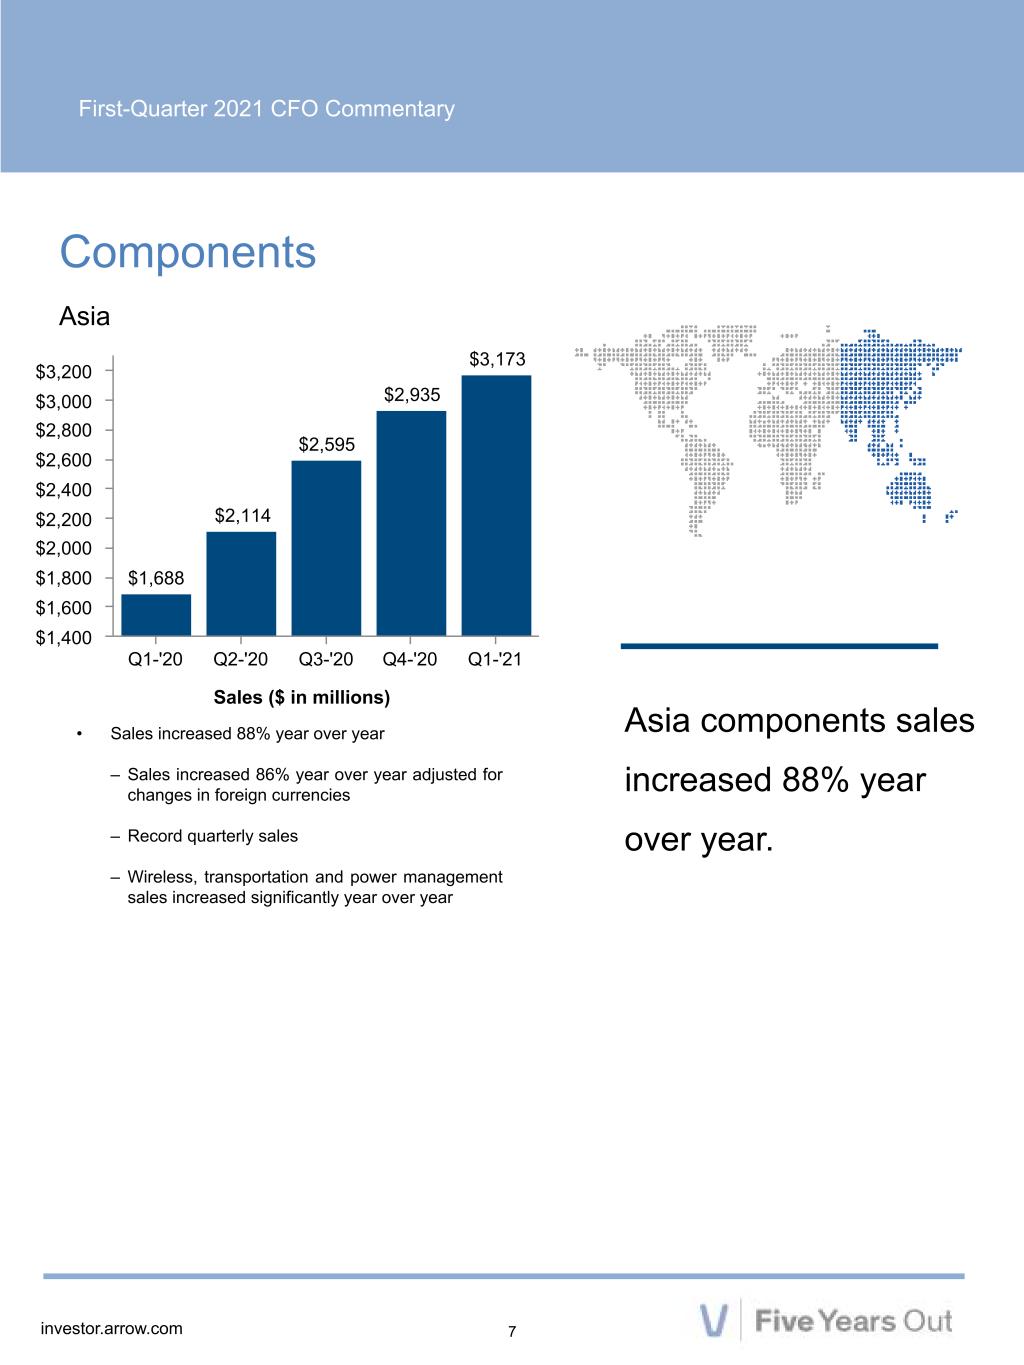
First-Quarter 2021 CFO Commentary 7investor.arrow.com $1,688 $2,114 $2,595 $2,935 $3,173 Q1-'20 Q2-'20 Q3-'20 Q4-'20 Q1-'21 $1,400 $1,600 $1,800 $2,000 $2,200 $2,400 $2,600 $2,800 $3,000 $3,200 Components Asia • Sales increased 88% year over year – Sales increased 86% year over year adjusted for changes in foreign currencies – Record quarterly sales – Wireless, transportation and power management sales increased significantly year over year Asia components sales increased 88% year over year. Sales ($ in millions)
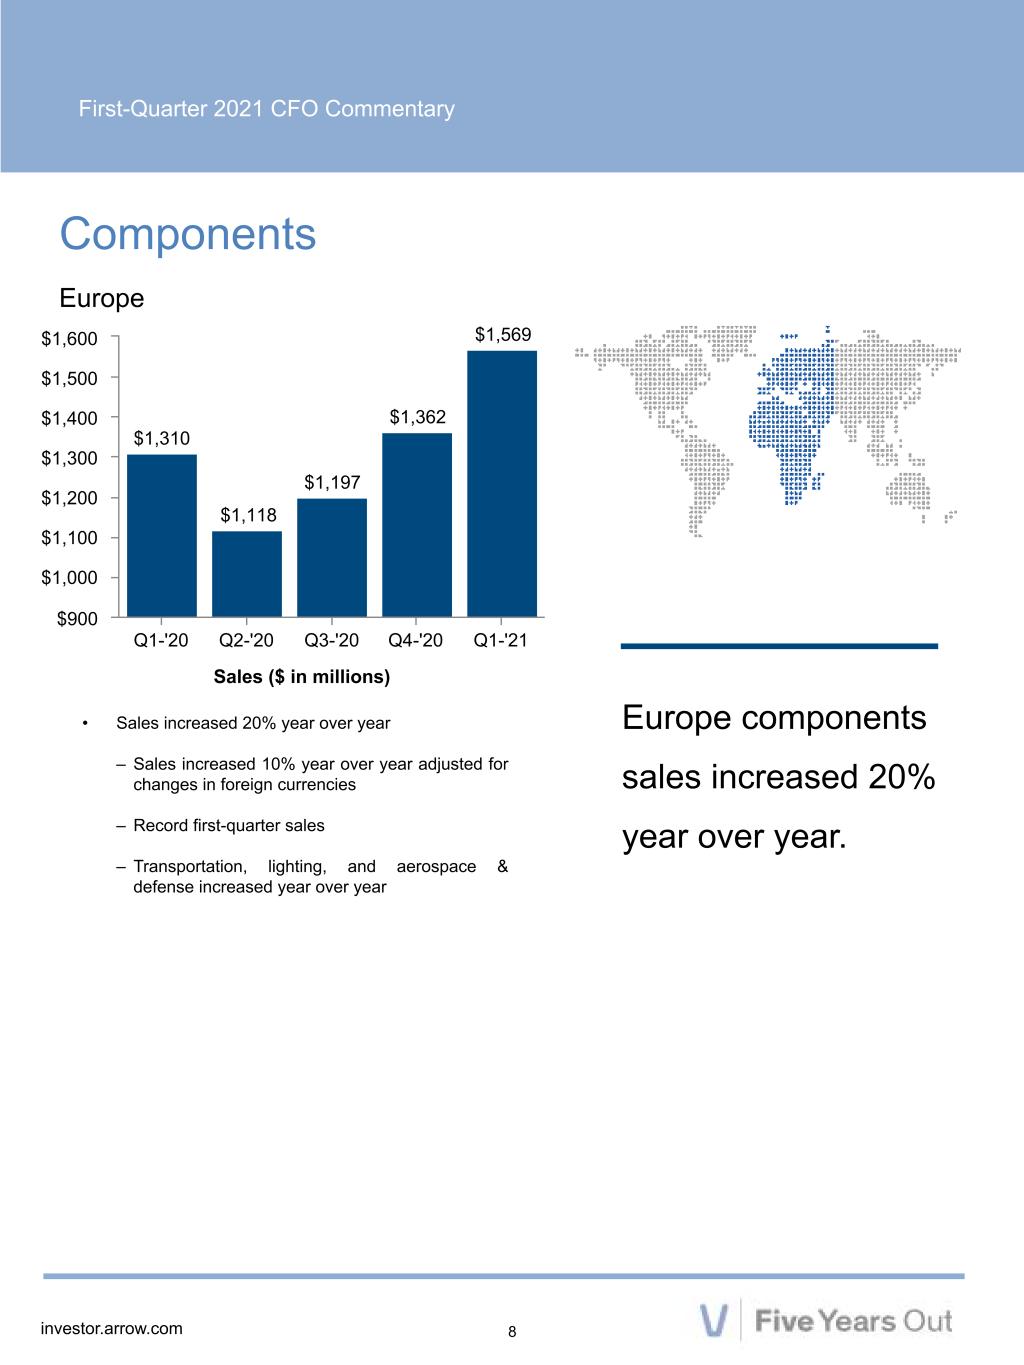
First-Quarter 2021 CFO Commentary 8investor.arrow.com $1,310 $1,118 $1,197 $1,362 $1,569 Q1-'20 Q2-'20 Q3-'20 Q4-'20 Q1-'21 $900 $1,000 $1,100 $1,200 $1,300 $1,400 $1,500 $1,600 Components Europe • Sales increased 20% year over year – Sales increased 10% year over year adjusted for changes in foreign currencies – Record first-quarter sales – Transportation, lighting, and aerospace & defense increased year over year Europe components sales increased 20% year over year. Sales ($ in millions)
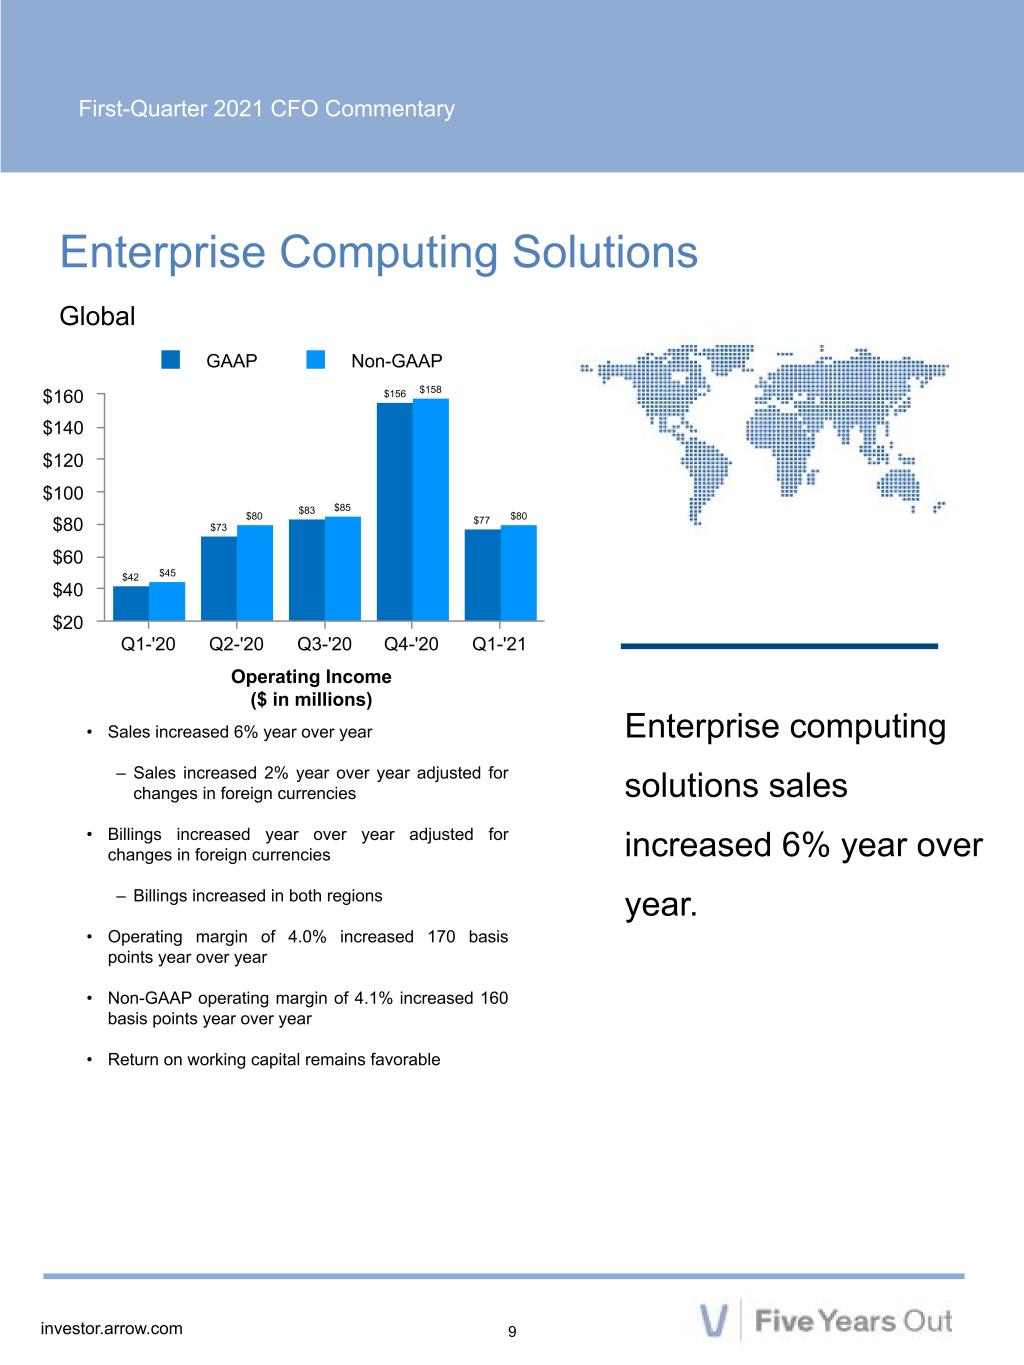
First-Quarter 2021 CFO Commentary 9investor.arrow.com $42 $73 $83 $156 $77 $45 $80 $85 $158 $80 GAAP Non-GAAP Q1-'20 Q2-'20 Q3-'20 Q4-'20 Q1-'21 $20 $40 $60 $80 $100 $120 $140 $160 Enterprise Computing Solutions Global • Sales increased 6% year over year – Sales increased 2% year over year adjusted for changes in foreign currencies • Billings increased year over year adjusted for changes in foreign currencies – Billings increased in both regions • Operating margin of 4.0% increased 170 basis points year over year • Non-GAAP operating margin of 4.1% increased 160 basis points year over year • Return on working capital remains favorable Enterprise computing solutions sales increased 6% year over year. Operating Income ($ in millions)
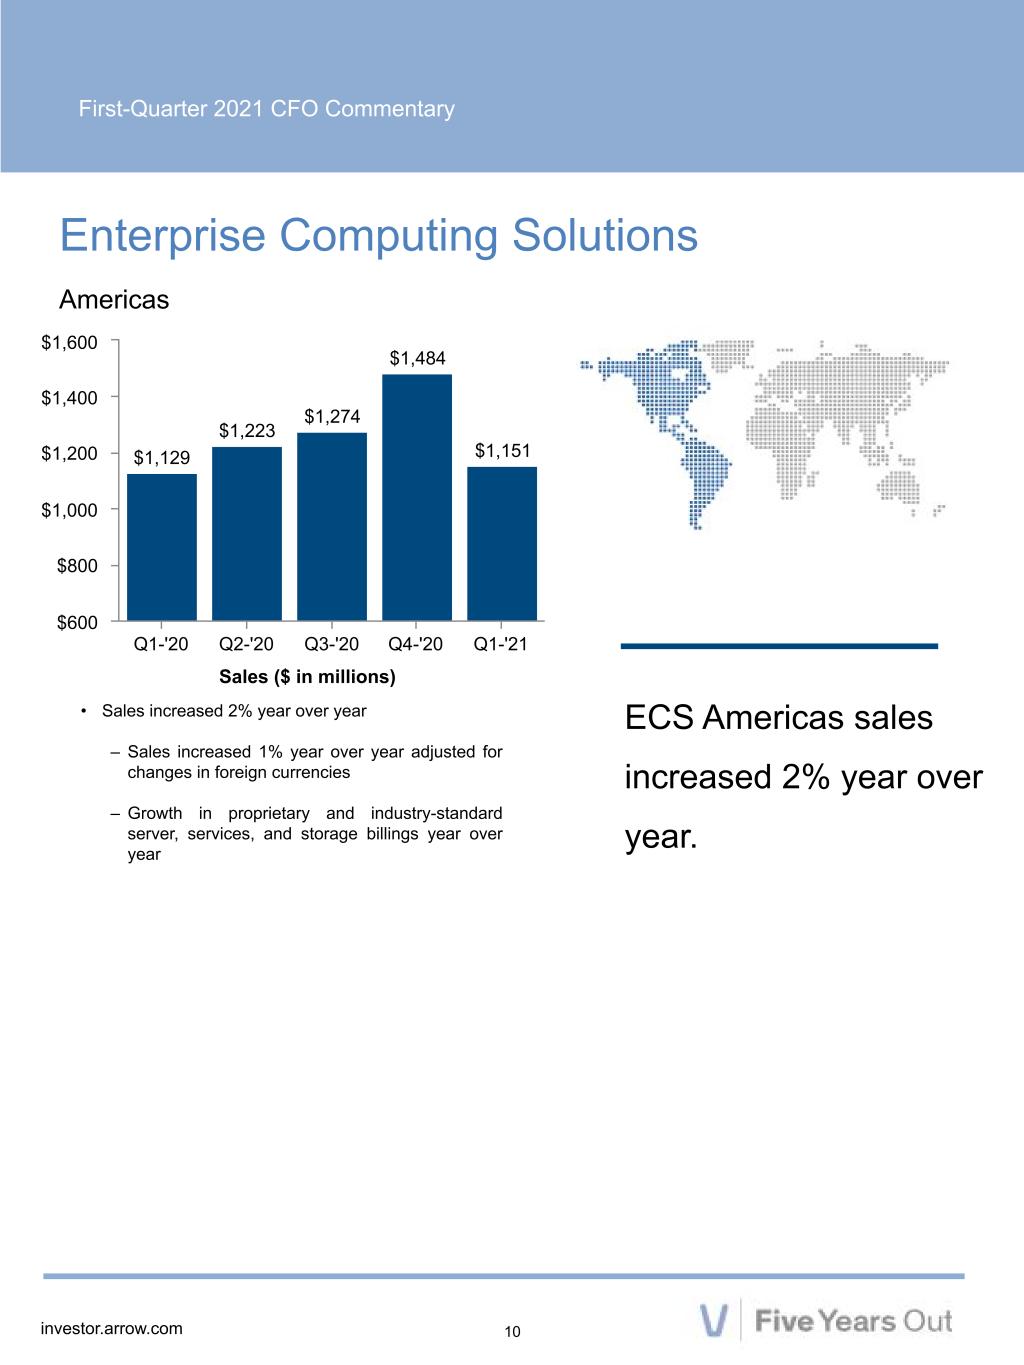
First-Quarter 2021 CFO Commentary 10investor.arrow.com $1,129 $1,223 $1,274 $1,484 $1,151 Q1-'20 Q2-'20 Q3-'20 Q4-'20 Q1-'21 $600 $800 $1,000 $1,200 $1,400 $1,600 Enterprise Computing Solutions Americas • Sales increased 2% year over year – Sales increased 1% year over year adjusted for changes in foreign currencies – Growth in proprietary and industry-standard server, services, and storage billings year over year ECS Americas sales increased 2% year over year. Sales ($ in millions)
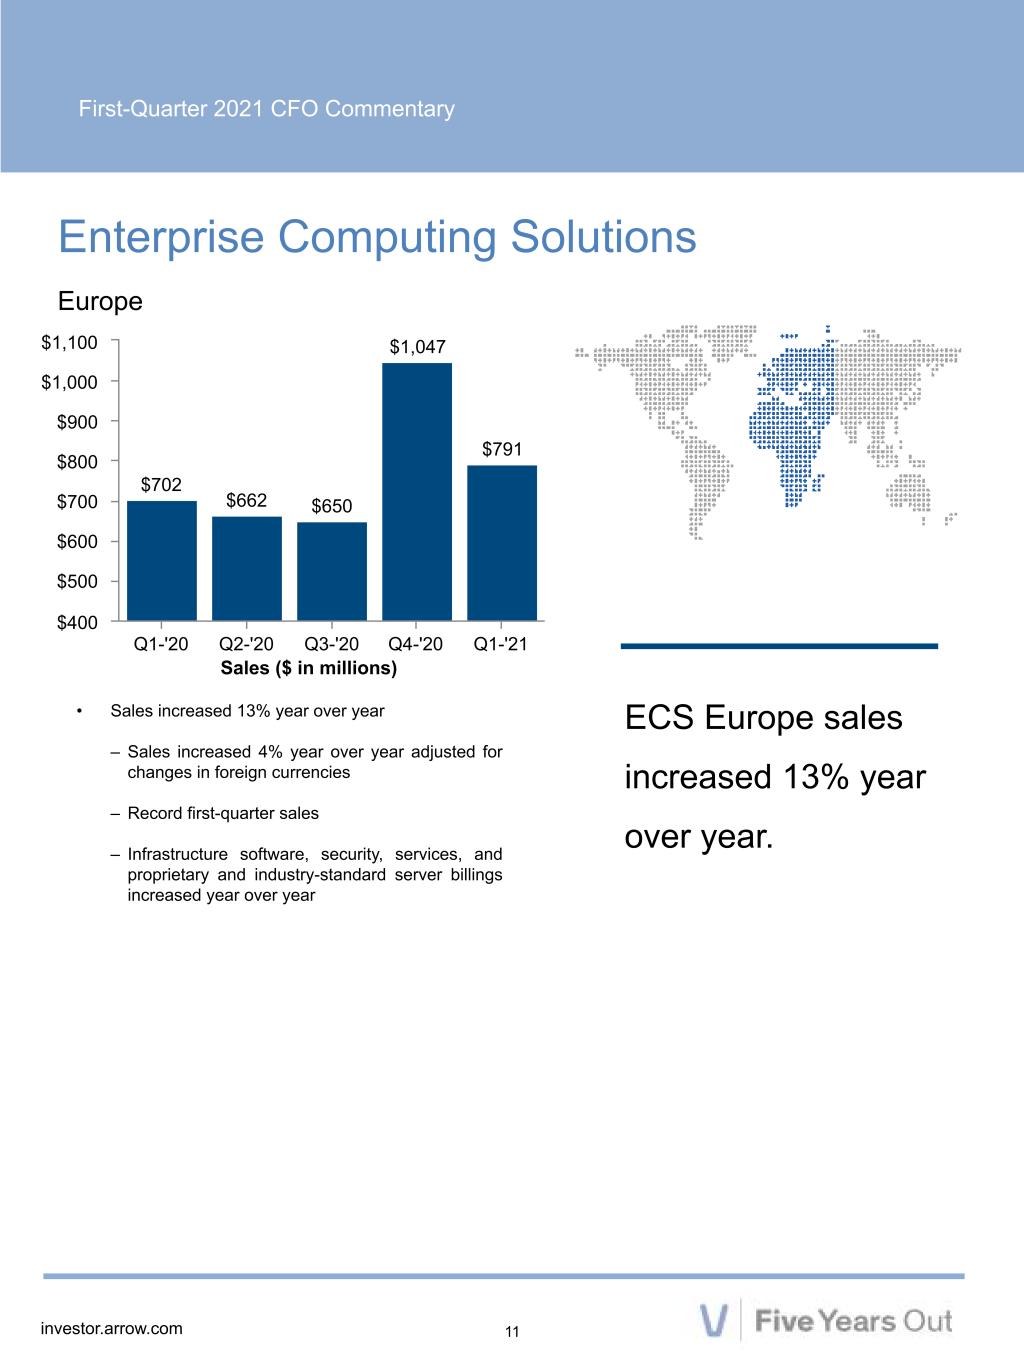
First-Quarter 2021 CFO Commentary 11investor.arrow.com $702 $662 $650 $1,047 $791 Q1-'20 Q2-'20 Q3-'20 Q4-'20 Q1-'21 $400 $500 $600 $700 $800 $900 $1,000 $1,100 Enterprise Computing Solutions Europe • Sales increased 13% year over year – Sales increased 4% year over year adjusted for changes in foreign currencies – Record first-quarter sales – Infrastructure software, security, services, and proprietary and industry-standard server billings increased year over year ECS Europe sales increased 13% year over year. Sales ($ in millions)
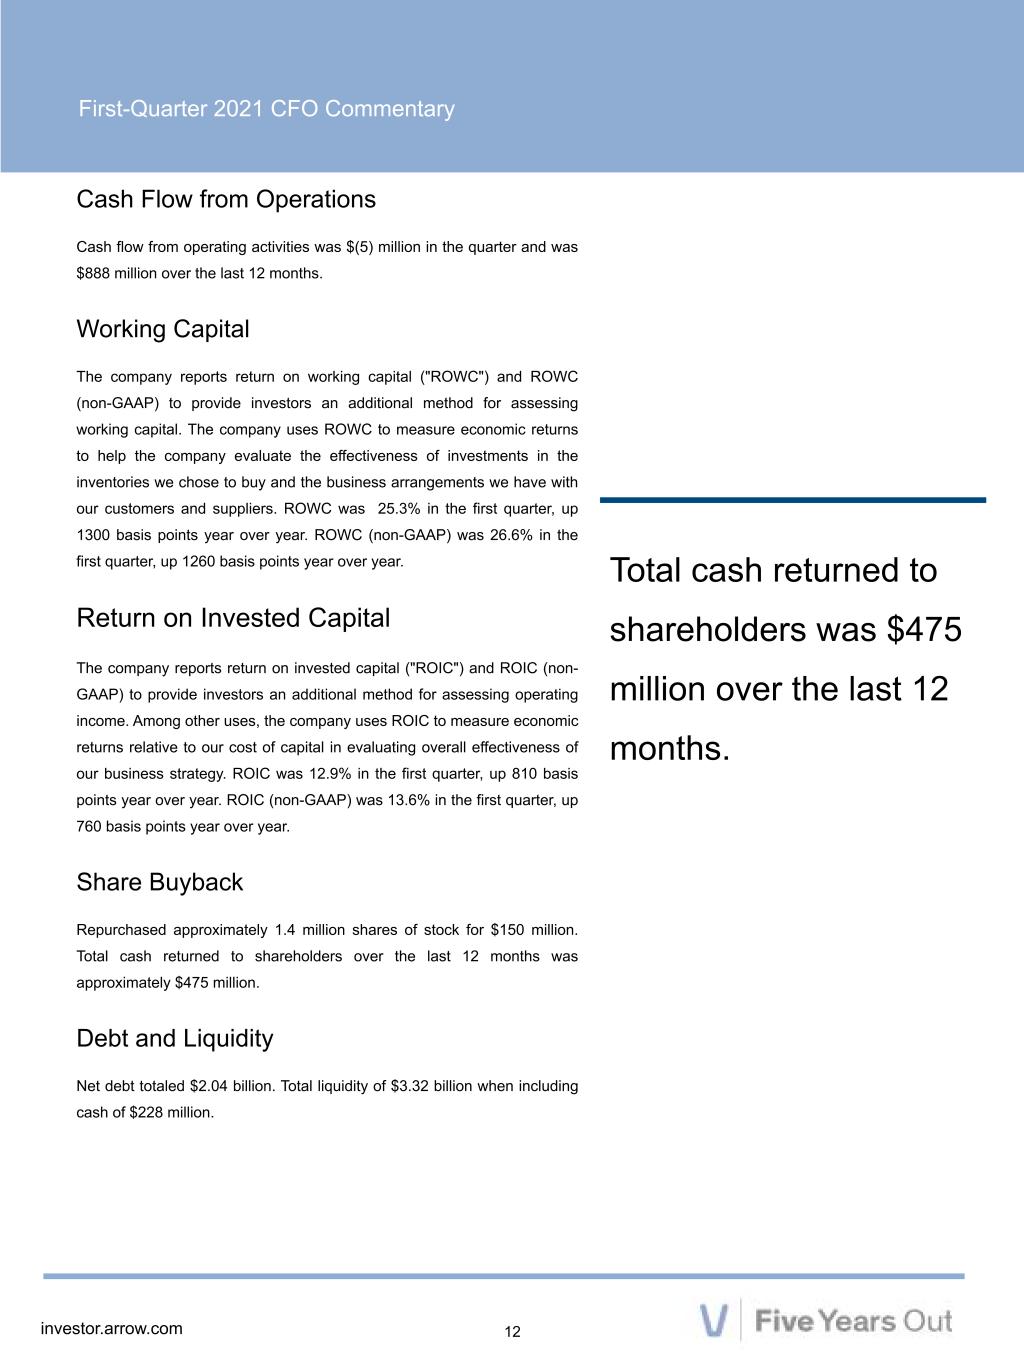
First-Quarter 2021 CFO Commentary 12investor.arrow.com Cash Flow from Operations Cash flow from operating activities was $(5) million in the quarter and was $888 million over the last 12 months. Working Capital The company reports return on working capital ("ROWC") and ROWC (non-GAAP) to provide investors an additional method for assessing working capital. The company uses ROWC to measure economic returns to help the company evaluate the effectiveness of investments in the inventories we chose to buy and the business arrangements we have with our customers and suppliers. ROWC was 25.3% in the first quarter, up 1300 basis points year over year. ROWC (non-GAAP) was 26.6% in the first quarter, up 1260 basis points year over year. Return on Invested Capital The company reports return on invested capital ("ROIC") and ROIC (non- GAAP) to provide investors an additional method for assessing operating income. Among other uses, the company uses ROIC to measure economic returns relative to our cost of capital in evaluating overall effectiveness of our business strategy. ROIC was 12.9% in the first quarter, up 810 basis points year over year. ROIC (non-GAAP) was 13.6% in the first quarter, up 760 basis points year over year. Share Buyback Repurchased approximately 1.4 million shares of stock for $150 million. Total cash returned to shareholders over the last 12 months was approximately $475 million. Debt and Liquidity Net debt totaled $2.04 billion. Total liquidity of $3.32 billion when including cash of $228 million. Total cash returned to shareholders was $475 million over the last 12 months.
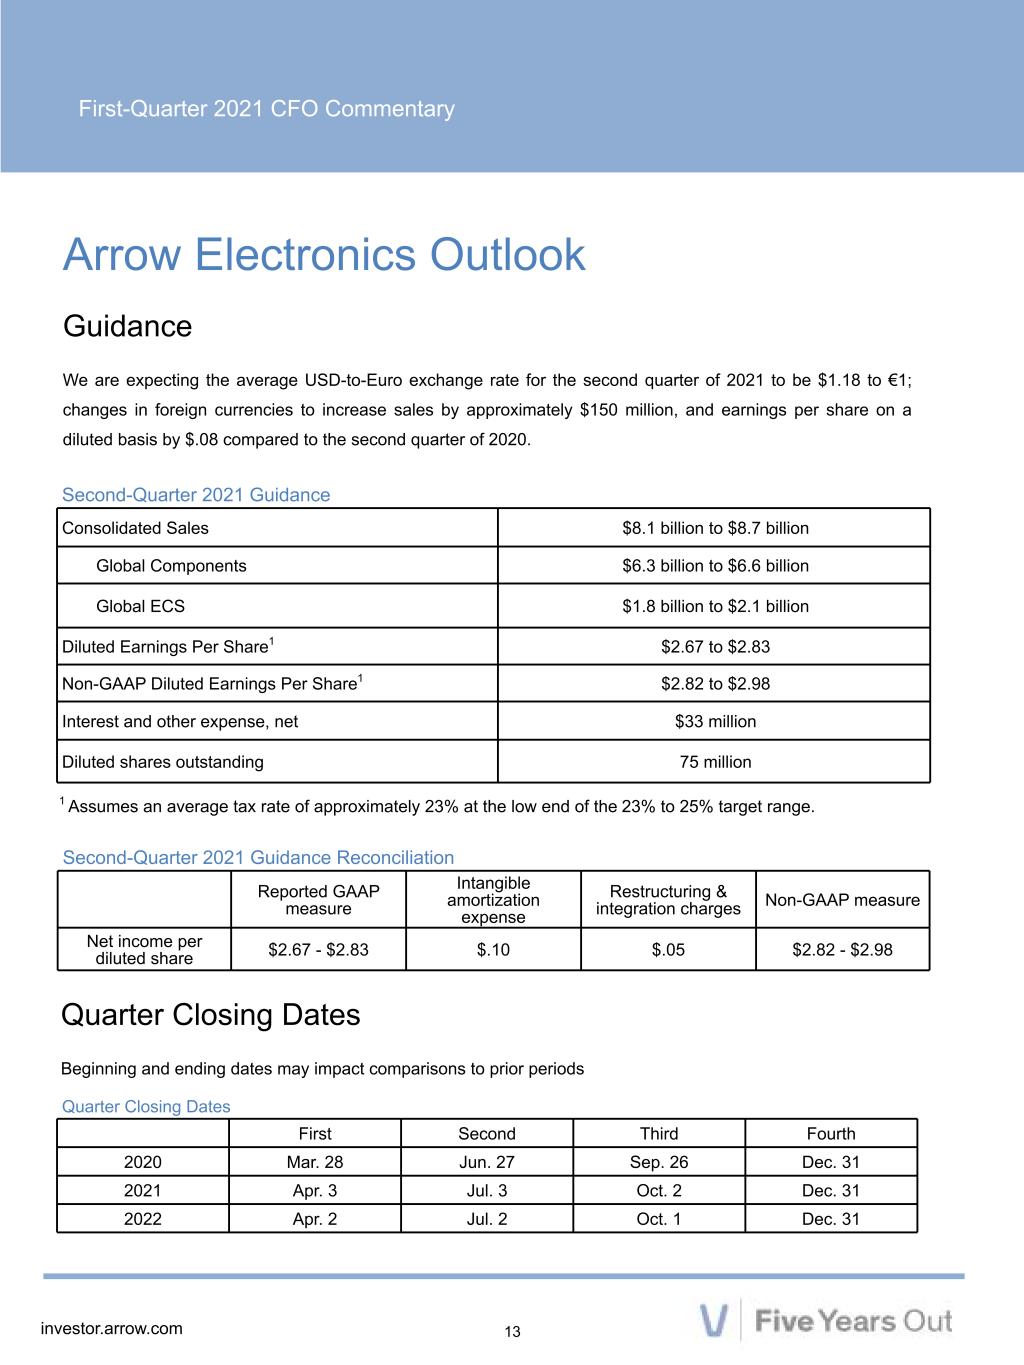
First-Quarter 2021 CFO Commentary 13investor.arrow.com Arrow Electronics Outlook Guidance We are expecting the average USD-to-Euro exchange rate for the second quarter of 2021 to be $1.18 to €1; changes in foreign currencies to increase sales by approximately $150 million, and earnings per share on a diluted basis by $.08 compared to the second quarter of 2020. . 1 Assumes an average tax rate of approximately 23% at the low end of the 23% to 25% target range. Quarter Closing Dates Beginning and ending dates may impact comparisons to prior periods Quarter Closing Dates First Second Third Fourth 2020 Mar. 28 Jun. 27 Sep. 26 Dec. 31 2021 Apr. 3 Jul. 3 Oct. 2 Dec. 31 2022 Apr. 2 Jul. 2 Oct. 1 Dec. 31 Second-Quarter 2021 Guidance Reconciliation Reported GAAP measure Intangible amortization expense Restructuring & integration charges Non-GAAP measure Net income per diluted share $2.67 - $2.83 $.10 $.05 $2.82 - $2.98 Second-Quarter 2021 Guidance Consolidated Sales $8.1 billion to $8.7 billion Global Components $6.3 billion to $6.6 billion Global ECS $1.8 billion to $2.1 billion Diluted Earnings Per Share1 $2.67 to $2.83 Non-GAAP Diluted Earnings Per Share1 $2.82 to $2.98 Interest and other expense, net $33 million Diluted shares outstanding 75 million
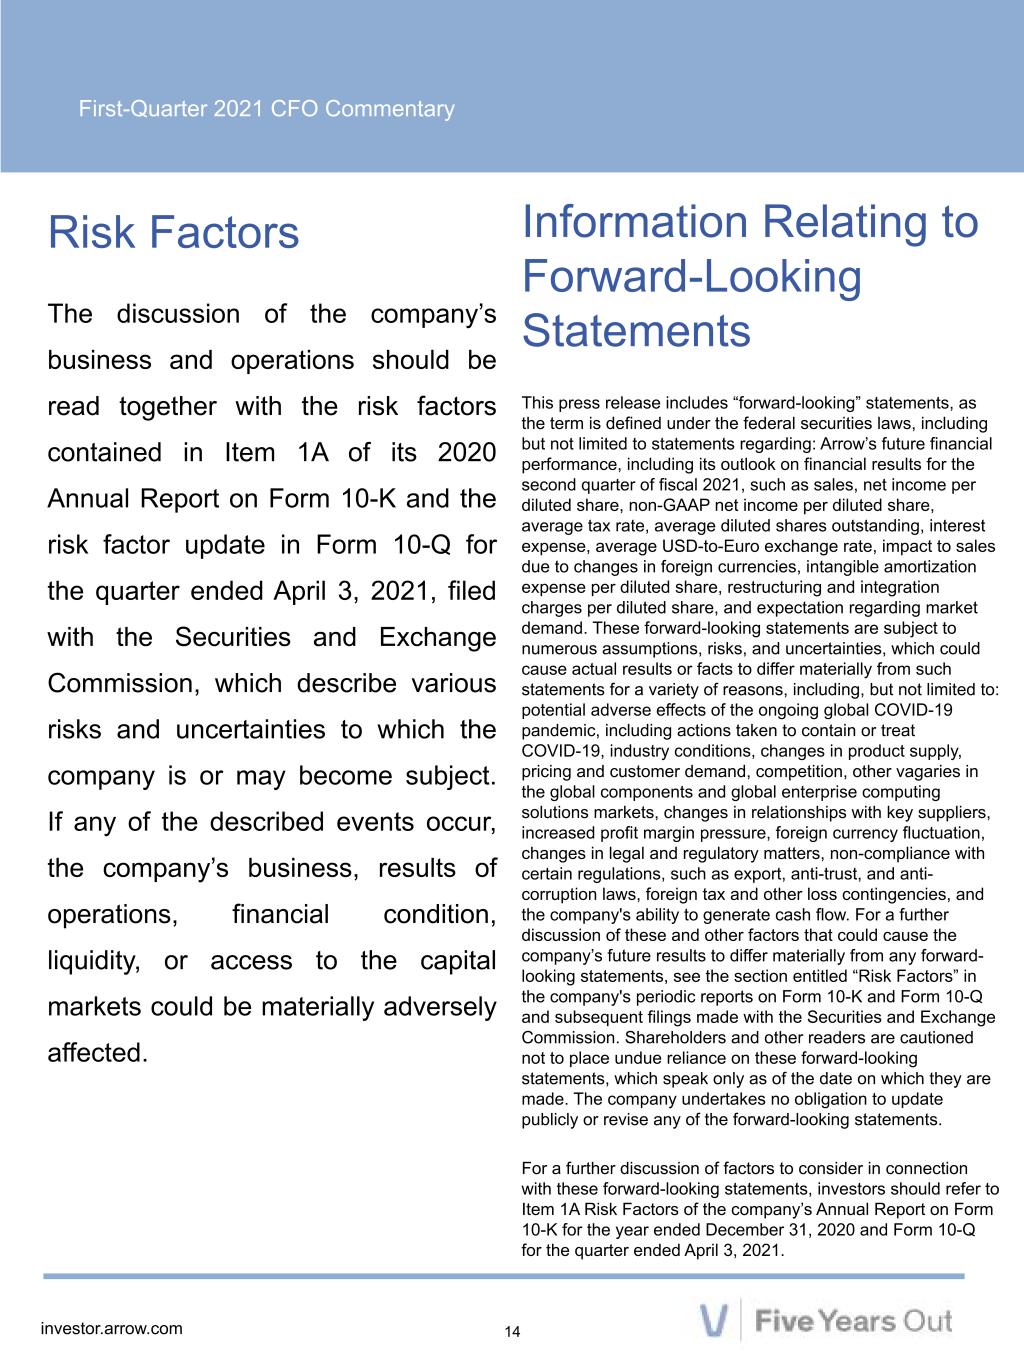
First-Quarter 2021 CFO Commentary 14investor.arrow.com Risk Factors The discussion of the company’s business and operations should be read together with the risk factors contained in Item 1A of its 2020 Annual Report on Form 10-K and the risk factor update in Form 10-Q for the quarter ended April 3, 2021, filed with the Securities and Exchange Commission, which describe various risks and uncertainties to which the company is or may become subject. If any of the described events occur, the company’s business, results of operations, financial condition, liquidity, or access to the capital markets could be materially adversely affected. Information Relating to Forward-Looking Statements This press release includes “forward-looking” statements, as the term is defined under the federal securities laws, including but not limited to statements regarding: Arrow’s future financial performance, including its outlook on financial results for the second quarter of fiscal 2021, such as sales, net income per diluted share, non-GAAP net income per diluted share, average tax rate, average diluted shares outstanding, interest expense, average USD-to-Euro exchange rate, impact to sales due to changes in foreign currencies, intangible amortization expense per diluted share, restructuring and integration charges per diluted share, and expectation regarding market demand. These forward-looking statements are subject to numerous assumptions, risks, and uncertainties, which could cause actual results or facts to differ materially from such statements for a variety of reasons, including, but not limited to: potential adverse effects of the ongoing global COVID-19 pandemic, including actions taken to contain or treat COVID-19, industry conditions, changes in product supply, pricing and customer demand, competition, other vagaries in the global components and global enterprise computing solutions markets, changes in relationships with key suppliers, increased profit margin pressure, foreign currency fluctuation, changes in legal and regulatory matters, non-compliance with certain regulations, such as export, anti-trust, and anti- corruption laws, foreign tax and other loss contingencies, and the company's ability to generate cash flow. For a further discussion of these and other factors that could cause the company’s future results to differ materially from any forward- looking statements, see the section entitled “Risk Factors” in the company's periodic reports on Form 10-K and Form 10-Q and subsequent filings made with the Securities and Exchange Commission. Shareholders and other readers are cautioned not to place undue reliance on these forward-looking statements, which speak only as of the date on which they are made. The company undertakes no obligation to update publicly or revise any of the forward-looking statements. For a further discussion of factors to consider in connection with these forward-looking statements, investors should refer to Item 1A Risk Factors of the company’s Annual Report on Form 10-K for the year ended December 31, 2020 and Form 10-Q for the quarter ended April 3, 2021.
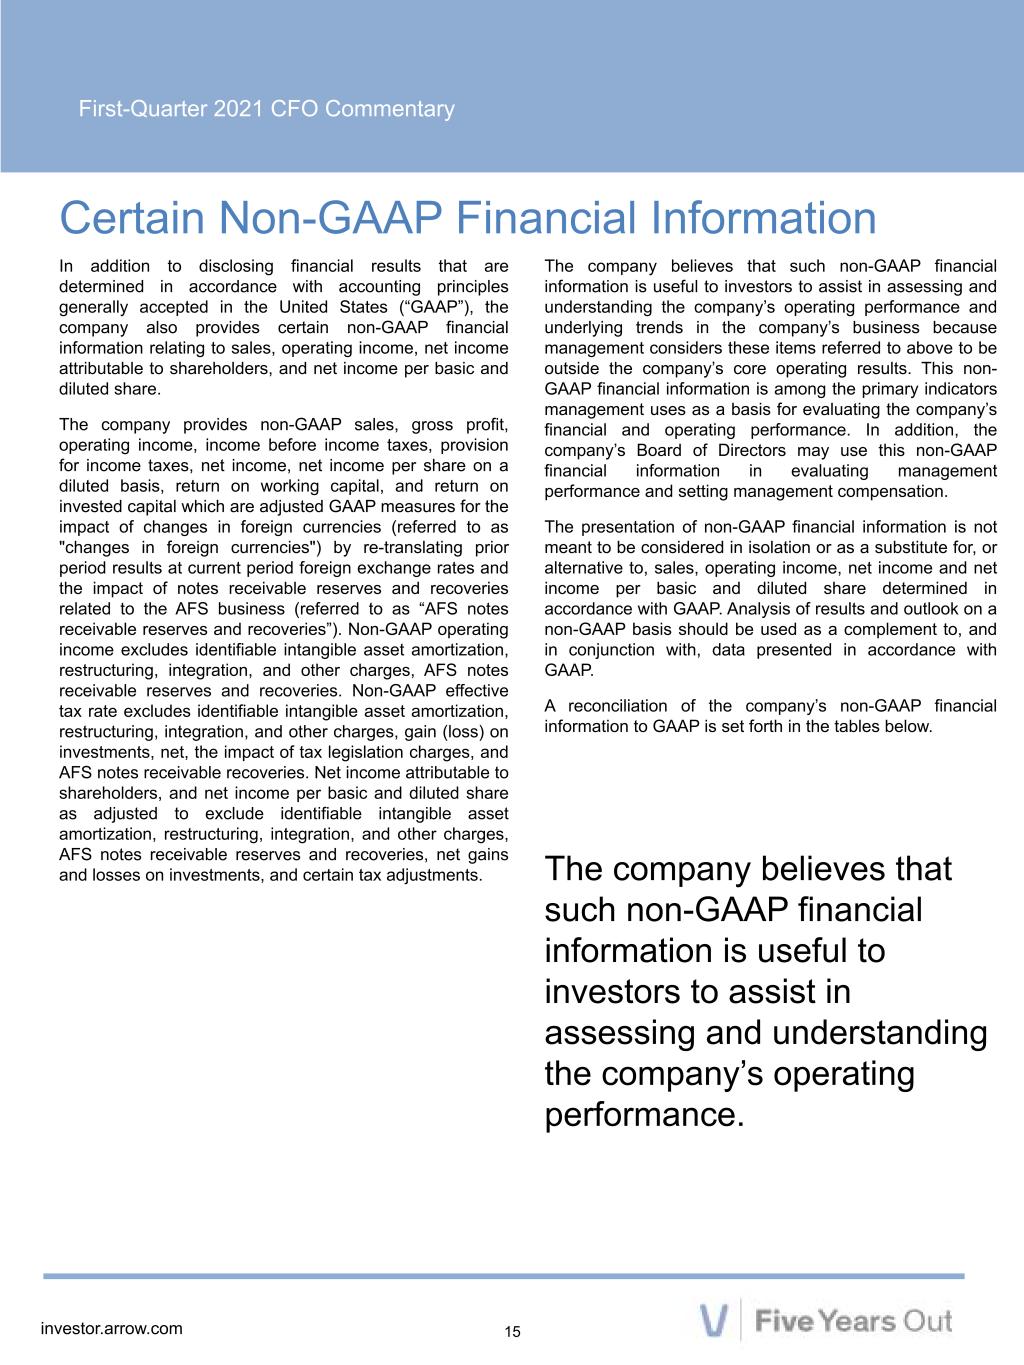
First-Quarter 2021 CFO Commentary 15investor.arrow.com In addition to disclosing financial results that are determined in accordance with accounting principles generally accepted in the United States (“GAAP”), the company also provides certain non-GAAP financial information relating to sales, operating income, net income attributable to shareholders, and net income per basic and diluted share. The company provides non-GAAP sales, gross profit, operating income, income before income taxes, provision for income taxes, net income, net income per share on a diluted basis, return on working capital, and return on invested capital which are adjusted GAAP measures for the impact of changes in foreign currencies (referred to as "changes in foreign currencies") by re-translating prior period results at current period foreign exchange rates and the impact of notes receivable reserves and recoveries related to the AFS business (referred to as “AFS notes receivable reserves and recoveries”). Non-GAAP operating income excludes identifiable intangible asset amortization, restructuring, integration, and other charges, AFS notes receivable reserves and recoveries. Non-GAAP effective tax rate excludes identifiable intangible asset amortization, restructuring, integration, and other charges, gain (loss) on investments, net, the impact of tax legislation charges, and AFS notes receivable recoveries. Net income attributable to shareholders, and net income per basic and diluted share as adjusted to exclude identifiable intangible asset amortization, restructuring, integration, and other charges, AFS notes receivable reserves and recoveries, net gains and losses on investments, and certain tax adjustments. Certain Non-GAAP Financial Information The company believes that such non-GAAP financial information is useful to investors to assist in assessing and understanding the company’s operating performance. The company believes that such non-GAAP financial information is useful to investors to assist in assessing and understanding the company’s operating performance and underlying trends in the company’s business because management considers these items referred to above to be outside the company’s core operating results. This non- GAAP financial information is among the primary indicators management uses as a basis for evaluating the company’s financial and operating performance. In addition, the company’s Board of Directors may use this non-GAAP financial information in evaluating management performance and setting management compensation. The presentation of non-GAAP financial information is not meant to be considered in isolation or as a substitute for, or alternative to, sales, operating income, net income and net income per basic and diluted share determined in accordance with GAAP. Analysis of results and outlook on a non-GAAP basis should be used as a complement to, and in conjunction with, data presented in accordance with GAAP. A reconciliation of the company’s non-GAAP financial information to GAAP is set forth in the tables below.
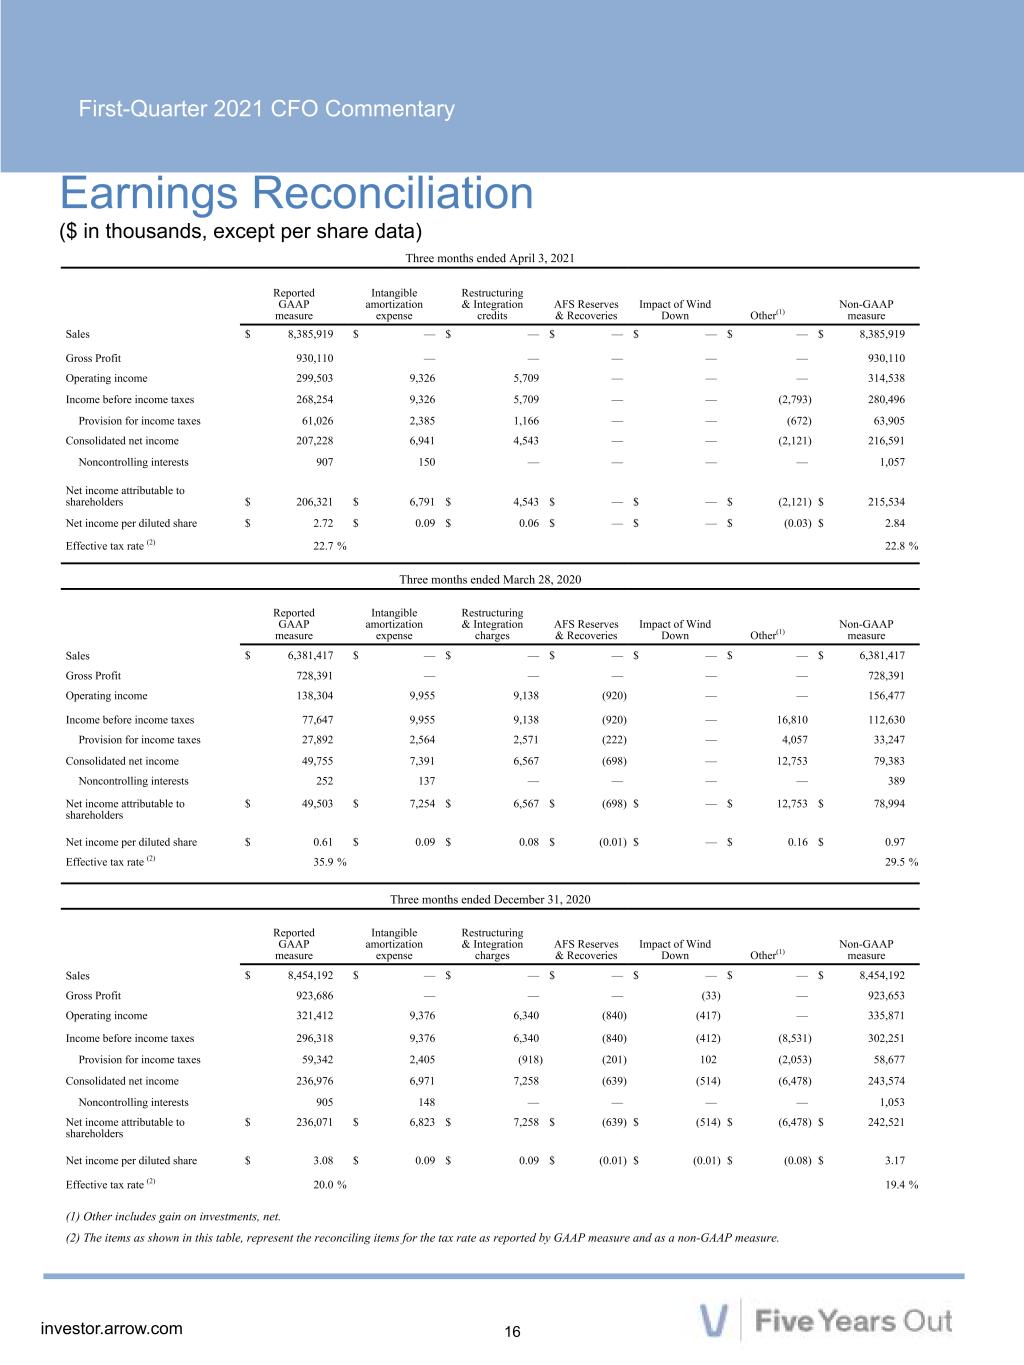
First-Quarter 2021 CFO Commentary 16investor.arrow.com Earnings Reconciliation Three months ended April 3, 2021 Reported GAAP measure Intangible amortization expense Restructuring & Integration credits AFS Reserves & Recoveries Impact of Wind Down Other(1) Non-GAAP measure Sales $ 8,385,919 $ — $ — $ — $ — $ — $ 8,385,919 Gross Profit 930,110 — — — — — 930,110 Operating income 299,503 9,326 5,709 — — — 314,538 Income before income taxes 268,254 9,326 5,709 — — (2,793) 280,496 Provision for income taxes 61,026 2,385 1,166 — — (672) 63,905 Consolidated net income 207,228 6,941 4,543 — — (2,121) 216,591 Noncontrolling interests 907 150 — — — — 1,057 Net income attributable to shareholders $ 206,321 $ 6,791 $ 4,543 $ — $ — $ (2,121) $ 215,534 Net income per diluted share $ 2.72 $ 0.09 $ 0.06 $ — $ — $ (0.03) $ 2.84 Effective tax rate (2) 22.7 % 22.8 % Three months ended March 28, 2020 Reported GAAP measure Intangible amortization expense Restructuring & Integration charges AFS Reserves & Recoveries Impact of Wind Down Other(1) Non-GAAP measure Sales $ 6,381,417 $ — $ — $ — $ — $ — $ 6,381,417 Gross Profit 728,391 — — — — — 728,391 Operating income 138,304 9,955 9,138 (920) — — 156,477 Income before income taxes 77,647 9,955 9,138 (920) — 16,810 112,630 Provision for income taxes 27,892 2,564 2,571 (222) — 4,057 33,247 Consolidated net income 49,755 7,391 6,567 (698) — 12,753 79,383 Noncontrolling interests 252 137 — — — — 389 Net income attributable to shareholders $ 49,503 $ 7,254 $ 6,567 $ (698) $ — $ 12,753 $ 78,994 Net income per diluted share $ 0.61 $ 0.09 $ 0.08 $ (0.01) $ — $ 0.16 $ 0.97 Effective tax rate (2) 35.9 % 29.5 % Three months ended December 31, 2020 Reported GAAP measure Intangible amortization expense Restructuring & Integration charges AFS Reserves & Recoveries Impact of Wind Down Other(1) Non-GAAP measure Sales $ 8,454,192 $ — $ — $ — $ — $ — $ 8,454,192 Gross Profit 923,686 — — — (33) — 923,653 Operating income 321,412 9,376 6,340 (840) (417) — 335,871 Income before income taxes 296,318 9,376 6,340 (840) (412) (8,531) 302,251 Provision for income taxes 59,342 2,405 (918) (201) 102 (2,053) 58,677 Consolidated net income 236,976 6,971 7,258 (639) (514) (6,478) 243,574 Noncontrolling interests 905 148 — — — — 1,053 Net income attributable to shareholders $ 236,071 $ 6,823 $ 7,258 $ (639) $ (514) $ (6,478) $ 242,521 Net income per diluted share $ 3.08 $ 0.09 $ 0.09 $ (0.01) $ (0.01) $ (0.08) $ 3.17 Effective tax rate (2) 20.0 % 19.4 % (1) Other includes gain on investments, net. (2) The items as shown in this table, represent the reconciling items for the tax rate as reported by GAAP measure and as a non-GAAP measure. ($ in thousands, except per share data)
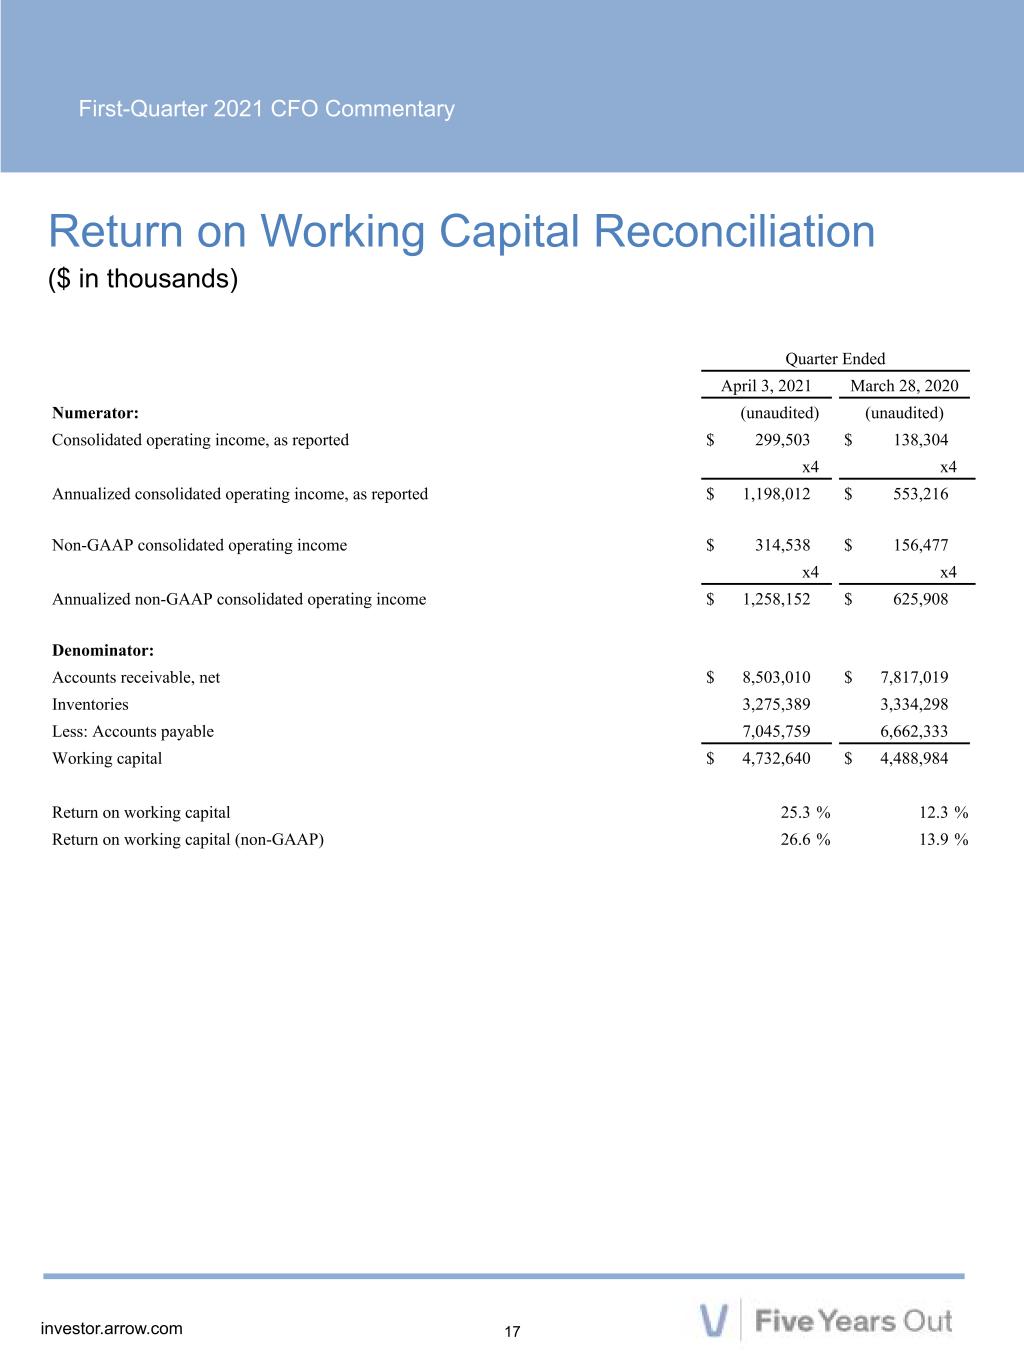
First-Quarter 2021 CFO Commentary 17investor.arrow.com Return on Working Capital Reconciliation ($ in thousands) Quarter Ended April 3, 2021 March 28, 2020 Numerator: (unaudited) (unaudited) Consolidated operating income, as reported $ 299,503 $ 138,304 x4 x4 Annualized consolidated operating income, as reported $ 1,198,012 $ 553,216 Non-GAAP consolidated operating income $ 314,538 $ 156,477 x4 x4 Annualized non-GAAP consolidated operating income $ 1,258,152 $ 625,908 Denominator: Accounts receivable, net $ 8,503,010 $ 7,817,019 Inventories 3,275,389 3,334,298 Less: Accounts payable 7,045,759 6,662,333 Working capital $ 4,732,640 $ 4,488,984 Return on working capital 25.3 % 12.3 % Return on working capital (non-GAAP) 26.6 % 13.9 %
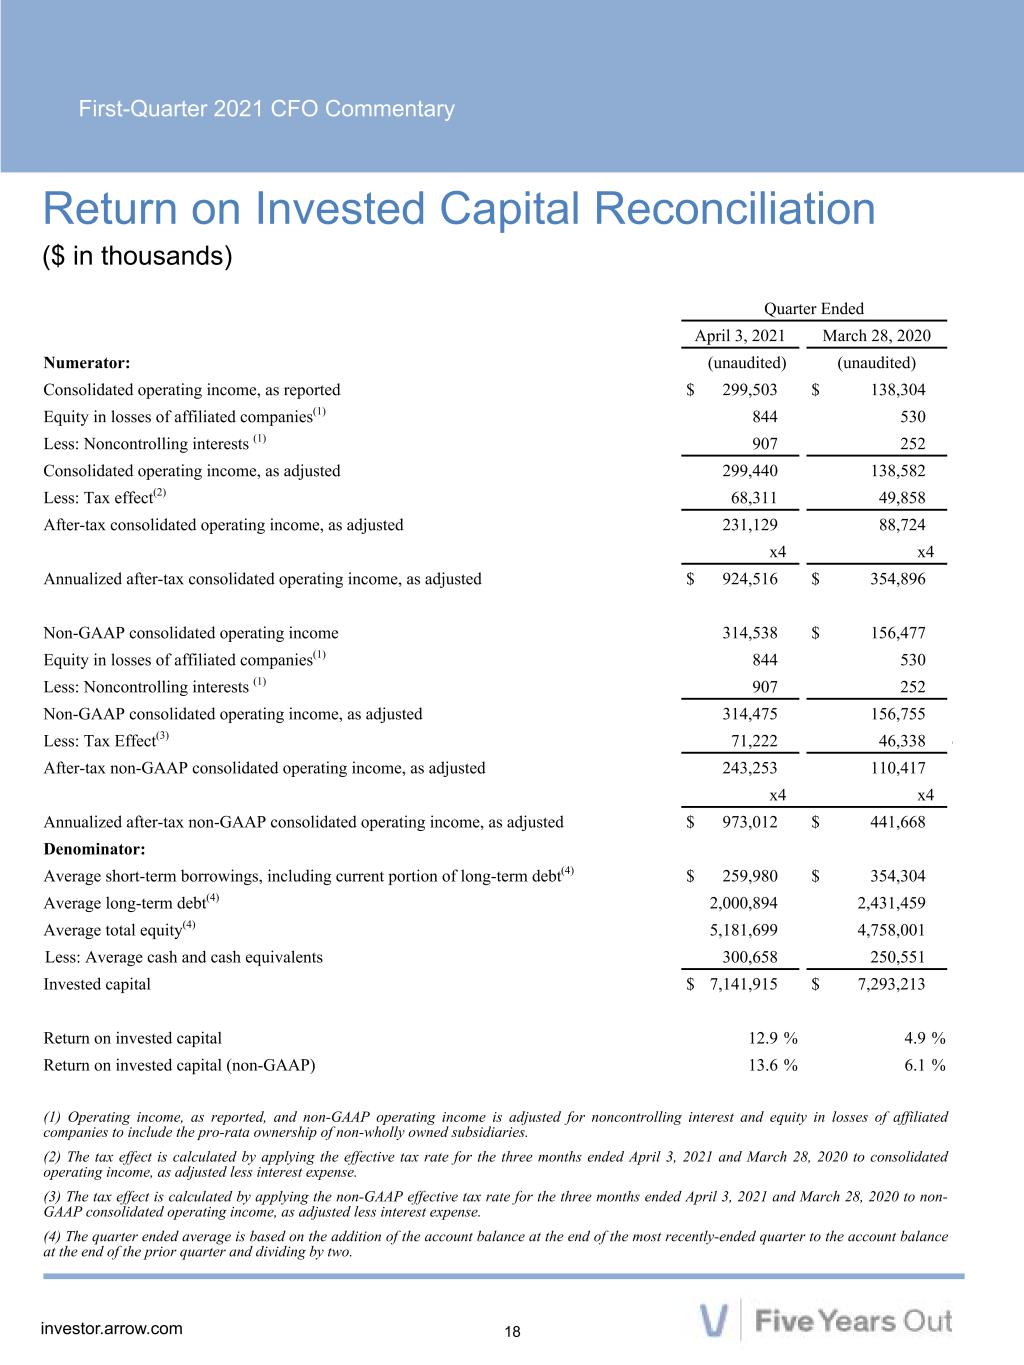
First-Quarter 2021 CFO Commentary 18investor.arrow.com Return on Invested Capital Reconciliation ($ in thousands) Quarter Ended April 3, 2021 March 28, 2020 Numerator: (unaudited) (unaudited) Consolidated operating income, as reported $ 299,503 $ 138,304 Equity in losses of affiliated companies(1) 844 530 Less: Noncontrolling interests (1) 907 252 Consolidated operating income, as adjusted 299,440 138,582 Less: Tax effect(2) 68,311 49,858 After-tax consolidated operating income, as adjusted 231,129 88,724 x4 x4 Annualized after-tax consolidated operating income, as adjusted $ 924,516 $ 354,896 Non-GAAP consolidated operating income 314,538 $ 156,477 Equity in losses of affiliated companies(1) 844 530 Less: Noncontrolling interests (1) 907 252 Non-GAAP consolidated operating income, as adjusted 314,475 156,755 Less: Tax Effect(3) 71,222 46,338 46,272 After-tax non-GAAP consolidated operating income, as adjusted 243,253 110,417 x4 x4 Annualized after-tax non-GAAP consolidated operating income, as adjusted $ 973,012 $ 441,668 Denominator: Average short-term borrowings, including current portion of long-term debt(4) $ 259,980 $ 354,304 Average long-term debt(4) 2,000,894 2,431,459 Average total equity(4) 5,181,699 4,758,001 Less: Average cash and cash equivalents 300,658 250,551 Invested capital $ 7,141,915 $ 7,293,213 Return on invested capital 12.9 % 4.9 % Return on invested capital (non-GAAP) 13.6 % 6.1 % (1) Operating income, as reported, and non-GAAP operating income is adjusted for noncontrolling interest and equity in losses of affiliated companies to include the pro-rata ownership of non-wholly owned subsidiaries. (2) The tax effect is calculated by applying the effective tax rate for the three months ended April 3, 2021 and March 28, 2020 to consolidated operating income, as adjusted less interest expense. (3) The tax effect is calculated by applying the non-GAAP effective tax rate for the three months ended April 3, 2021 and March 28, 2020 to non- GAAP consolidated operating income, as adjusted less interest expense. (4) The quarter ended average is based on the addition of the account balance at the end of the most recently-ended quarter to the account balance at the end of the prior quarter and dividing by two.