AUB 8-K
Atlantic Union Bankshares Corp (AUB)
United States
SECURITIES AND EXCHANGE COMMISSION
Washington, D.C. 20549
FORM
CURRENT REPORT
Pursuant to Section 13 or 15(d) of The Securities Exchange Act of 1934
Date of Report (Date of earliest event reported):
(Exact name of registrant as specified in its charter)
(State or other jurisdiction | (Commission | (I.R.S. Employer |
of incorporation) | File Number) | Identification No.) |
|
|
|
(Address of principal executive offices, including Zip Code)
Registrant’s telephone number, including area code:
Check the appropriate box below if the Form 8-K filing is intended to simultaneously satisfy the filing obligation of the registrant under any of the following provisions (see General Instruction A.2. below):
Written communications pursuant to Rule 425 under the Securities Act (17 CFR 230.425) |
Soliciting material pursuant to Rule 14a-12 under the Exchange Act (17 CFR 240.14a-12) |
Pre-commencement communications pursuant to Rule 14d-2(b) under the Exchange Act (17 CFR 240.14d-2(b)) |
Pre-commencement communications pursuant to Rule 13e-4(c) under the Exchange Act (17 CFR 240.13e-4(c)) |
Securities registered pursuant to Section 12(b) of the Act:
Title of each class |
| Trading Symbol(s) |
| Name of each exchange on which registered |
Indicate by check mark whether the registrant is an emerging growth company as defined in Rule 405 of the Securities Act of 1933 (§230.405 of this chapter) or Rule 12b-2 of the Securities Exchange Act of 1934 (§240.12b-2 of this chapter).
Emerging growth company |
If an emerging growth company, indicate by check mark if the registrant has elected not to use the extended transition period for complying with any new or revised financial accounting standards provided pursuant to Section 13(a) of the Exchange Act. | ☐ |
Item 2.02 Results of Operations and Financial Condition.
On January 26, 2021, Atlantic Union Bankshares Corporation (the “Company”) issued a press release announcing its financial results for the three and twelve months ended December 31, 2020. A copy of the press release is being furnished as Exhibit 99.1 hereto and is incorporated herein by reference.
Attached as Exhibit 99.2 and incorporated herein by reference is a presentation that the Company will use in connection with a webcast and conference call for analysts at 9:00 a.m. Eastern Time on Tuesday, January 26, 2021. This presentation is also available under the Presentations link in the Investor Relations section of the Company’s website at https://investors.atlanticunionbank.com.
The information disclosed in or incorporated by reference into this Item 2.02, including Exhibits 99.1 and 99.2, is furnished and shall not be deemed filed for purposes of Section 18 of the Securities Exchange Act of 1934.
Item 9.01 Financial Statements and Exhibits.
(d) Exhibits.
Exhibit No. |
| Description of Exhibit |
99.1 |
| Press release dated January 26, 2021 regarding fourth quarter and fiscal year 2020 results. |
99.2 | ||
104 | Cover Page Interactive Data File – the cover page iXBRL tags are embedded within the Inline XBRL document |
1
SIGNATURES
Pursuant to the requirements of the Securities Exchange Act of 1934, the registrant has duly caused this report to be signed on its behalf by the undersigned hereunto duly authorized.
| ATLANTIC UNION BANKSHARES CORPORATION | ||
|
|
|
|
|
|
|
|
|
|
|
|
Date: January 26, 2021 | By: | /s/ Robert M. Gorman |
|
|
| Robert M. Gorman |
|
|
| Executive Vice President and |
|
|
| Chief Financial Officer |
|
2
Exhibit 99.1

Contact: Robert M. Gorman - (804) 523-7828
Executive Vice President / Chief Financial Officer
ATLANTIC UNION BANKSHARES REPORTS FOURTH QUARTER AND FISCAL YEAR 2020 RESULTS
Richmond, Va., January 26, 2021 – Atlantic Union Bankshares Corporation (the “Company” or “Atlantic Union”) (Nasdaq: AUB) today reported net income available to common shareholders of $56.5 million and basic and diluted earnings per common share of $0.72 for the fourth quarter ended December 31, 2020. Adjusted operating earnings available to common shareholders(1) were $72.9 million, diluted operating earnings per common share(1) were $0.93, and pre-tax pre-provision adjusted operating earnings(1) were $77.0 million for the fourth quarter ended December 31, 2020.
Net income available to common shareholders was $152.6 million and basic and diluted earnings per common share were $1.93 for the twelve months ended December 31, 2020. Adjusted operating earnings available to common shareholders(1) were $168.8 million, diluted operating earnings per common share(1) were $2.14, and pre-tax pre-provision adjusted operating earnings(1) were $294.0 million, for the twelve months ended December 31, 2020.
“Despite the continued economic disruption caused by the pandemic in 2020, Atlantic Union delivered solid financial results in the fourth quarter and for the full year while demonstrating the flexibility and agility needed for success,” said John C. Asbury, president and chief executive officer of Atlantic Union. “Operating under the mantra of soundness, profitability and growth – in that order of priority - Atlantic Union remains in a strong financial position with ample liquidity and a well-fortified capital base.
“Our conservative credit culture is serving us well as we help our clients weather the storm. While we continue to face near-term uncertainty, as a result of benign credit quality metrics to date and a more optimistic economic outlook due to the roll-out of COVID-19 vaccines and additional government stimulus inclusive of more PPP funding, we are more confident that credit losses will not be as severe as initially feared.
“Looking forward, we are optimistic that the challenges of COVID-19 will ease as 2021 progresses and that Atlantic Union will emerge as a stronger company that is well positioned to generate sustainable, profitable growth and build long term value for our shareholders.”
Small Business Administration (“SBA”) Paycheck Protection Program (“PPP”)
During 2020, the Company participated in the SBA PPP under the Coronavirus Aid, Relief, and Economic Security (“CARES”) Act, which was intended to provide economic relief to small businesses that have been adversely impacted by the COVID-19 global pandemic (“COVID-19”). The Company processed over 11,000 PPP loans pursuant to the CARES Act, which totaled $1.7 billion with a recorded investment of $1.2 billion and unamortized deferred fees of $17.6 million, each as of December 31, 2020. The loans carry a 1% interest rate. In addition to an insignificant amount of PPP loan pay offs, the Company processed approximately $429.3 million of loan forgiveness on approximately 3,100 PPP loans during the fourth quarter of 2020.
Certain provisions of the CARES Act, including additional PPP funding, were extended as a result of the Consolidated Appropriations Act, 2021 (the “CAA”), which was signed into law on December 27, 2020. The Company began accepting applications on January 19, 2021 for additional PPP loans pursuant to the CAA.
| (1) | These are financial measures not calculated in accordance with generally accepted accounting principles (“GAAP”). For a reconciliation of these non-GAAP financial measures, see Alternative Performance Measures (non-GAAP) section of the Key Financial Results |
Expense Reduction Measures
During 2020, the Company launched several initiatives to reduce expenses in light of the current and expected operating environment, including the consolidation of certain branch locations.
The Company completed the consolidation of 14 branches in September 2020 and one branch in December 2020, and five branches are expected to be consolidated in February 2021. These actions resulted in expenses of approximately $6.8 million for the twelve months ended December 31, 2020 with approximately $3.4 million recognized in the second quarter of 2020, approximately $2.6 million in the third quarter of 2020 and approximately $790,000 in the fourth quarter of 2020, primarily related to lease termination costs, severance costs and real estate write-downs.
Additionally, in response to the current rate environment, the Company prepaid certain long-term Federal Home Loan Bank (“FHLB”) advances, which resulted in a prepayment penalty of $20.8 million in the fourth quarter of 2020.
NET INTEREST INCOME
For the fourth quarter of 2020, net interest income was $145.6 million, an increase from $137.4 million reported in the third quarter of 2020. Net interest income (FTE)(1) was $148.7 million in the fourth quarter of 2020, an increase of $8.4 million from the third quarter of 2020. The fourth quarter net interest margin increased 17 basis points to 3.25% from 3.08% in the previous quarter, while the net interest margin (FTE)(1) increased 18 basis points to 3.32% from 3.14% during the same period. The increases in the net interest margin and net interest margin (FTE) were principally due to the increase in PPP loan accretion to $15.0 million in the fourth quarter of 2020 from $9.9 million in the third quarter of 2020 driven by PPP loan forgiveness approved by the SBA during the fourth quarter.
The Company’s net interest margin (FTE) includes the impact of acquisition accounting fair value adjustments. Net accretion related to acquisition accounting increased $702,000 from the prior quarter to $4.4 million for the quarter ended December 31, 2020. The four quarters of 2020, and the remaining estimated net accretion impact are reflected in the following table (dollars in thousands):
| | | | | Deposit | | | | | | | |
| | Loan | | Accretion | | Borrowings | | | | |||
|
| Accretion |
| (Amortization) |
| Amortization |
| Total | ||||
For the quarter ended March 31, 2020 | | $ | 9,528 | | | 50 | | | (138) | | $ | 9,440 |
For the quarter ended June 30, 2020 | | | 6,443 | | | 34 | | | (140) | | | 6,337 |
For the quarter ended September 30, 2020 | |
| 3,814 | | | 26 | | | (167) | |
| 3,673 |
For the quarter ended December 31, 2020 | | | 4,541 | | | 22 | | | (188) | | | 4,375 |
For the years ending (estimated): | |
|
| |
|
| |
|
| |
|
|
2021 | |
| 8,625 | |
| 14 | |
| (807) | |
| 7,832 |
2022 | |
| 7,096 | |
| (43) | |
| (829) | |
| 6,224 |
2023 | |
| 5,213 | |
| (32) | |
| (852) | |
| 4,329 |
2024 | |
| 4,221 | |
| (4) | |
| (877) | |
| 3,340 |
2025 | |
| 3,160 | |
| (1) | |
| (900) | |
| 2,259 |
Thereafter | |
| 13,780 | |
| — | |
| (9,873) | |
| 3,907 |
Total remaining acquisition accounting fair value adjustments at December 31, 2020 | | | 42,095 | | | (66) | | | (14,138) | | | 27,891 |
ASSET QUALITY
Overview
During the fourth quarter of 2020, the Company’s asset quality metrics remained relatively stable. Nonperforming assets (“NPAs”) as a percentage of loans increased slightly, but, remained low at 0.32% at December 31, 2020. Accruing past due loan levels as a percentage of total loans held for investment at December 31, 2020 remained consistent with a 1 basis point increase as compared to September 30, 2020 and lower than accruing past due loan levels at December 31, 2019. Net charge-off levels remained low at 0.05% of average loans for the fourth quarter 2020, which is a 1 basis point increase from the third quarter of 2020 and a 10 basis point decrease from the fourth quarter 2019.
(1) These are financial measures not calculated in accordance with GAAP. For a reconciliation of these non-GAAP financial measures, see Alternative Performance Measures (non-GAAP) section of the Key Financial Results
The allowance for credit losses (“ACL”) decreased from September 30, 2020 due to improvements in the macroeconomic outlook which resulted in a decline in the provision for credit losses for the fourth quarter of 2020, as compared to the third quarter of 2020.
Loan Modifications for Borrowers Affected by COVID-19
On March 22, 2020, the five federal bank regulatory agencies and the Conference of State Bank Supervisors issued joint
guidance (subsequently revised on April 7, 2020) with respect to loan modifications for borrowers affected by COVID-19 (the “March 22 Joint Guidance”). The March 22 Joint Guidance encourages banks, savings associations, and credit unions to make loan modifications for borrowers affected by COVID-19 and, importantly, assures those financial institutions that they will not (i) receive supervisory criticism for such prudent loan modifications and (ii) be required by examiners to automatically categorize COVID-19-related loan modifications as TDRs. The federal banking regulators have confirmed with the Financial Accounting Standards Board (or FASB) that short-term loan modifications made on a good faith basis in response to COVID-19 to borrowers who were current (i.e., less than 30 days past due on contractual payments) when the modification program was implemented are not considered TDRs.
In addition, Section 4013 of the CARES Act, as amended by the CAA, provides banks, savings associations, and credit unions with the ability to make loan modifications related to COVID-19 without categorizing the loan as a TDR or conducting the analysis to make the determination, which is intended to streamline the loan modification process. Any such suspension is effective for the term of the loan modification; however, the suspension is only permitted for loan modifications made during the effective period of Section 4013 and only for those loans that were not more than thirty days past due as of December 31, 2019. The relief afforded by Section 4013 of the CARES Act, as amended by the CAA, is available to loans modified between March 1, 2020 and the earlier of 60 days after the date of termination of the COVID-19 national emergency and January 1, 2022.
The Company has made certain loan modifications pursuant to the March 22 Joint Guidance and Section 4013 of the CARES Act (as amended by the CAA), and as of December 31, 2020 approximately $146.1 million remain under their modified terms, a decline of $623.5 million as compared to September 30, 2020. The majority of the Company’s modifications as of December 31, 2020 were in the commercial real estate portfolios.
Nonperforming Assets
At December 31, 2020, NPAs totaled $45.2 million, an increase of $2.0 million from September 30, 2020. NPAs as a percentage of total outstanding loans at December 31, 2020 were 0.32%, an increase of 2 basis points from 0.30% at September 30, 2020. Excluding the impact of the PPP loans(1), NPAs as a percentage of total outstanding loans were 0.35%, an increase of 1 basis point from September 30, 2020.
The Company’s adoption of current expected credit loss (“CECL”) on January 1, 2020 resulted in a change in the accounting and reporting related to purchased credit impaired (“PCI”) loans, which are now defined as purchased credit deteriorated (“PCD”) and evaluated at the loan level instead of being evaluated in pools under PCI accounting. All prior period nonaccrual and past due loan metrics discussed herein have not been restated for CECL accounting and exclude PCI-related loan balances.
The following table shows a summary of nonperforming asset balances at the quarter ended (dollars in thousands):
|
| December 31, |
| September 30, |
| June 30, |
| March 31, |
| December 31, | |||||
| | 2020 | | 2020 | | 2020 | | 2020 | | 2019 | |||||
Nonaccrual loans | | $ | 42,448 | | $ | 39,023 | | $ | 39,624 | | $ | 44,022 | | $ | 28,232 |
Foreclosed properties | |
| 2,773 | |
| 4,159 | |
| 4,397 | |
| 4,444 | |
| 4,708 |
Total nonperforming assets | | $ | 45,221 | | $ | 43,182 | | $ | 44,021 | | $ | 48,466 | | $ | 32,940 |
(1) These are financial measures not calculated in accordance with GAAP. For a reconciliation of these non-GAAP financial measures, see Alternative Performance Measures (non-GAAP) section of the Key Financial Results
The following table shows the activity in nonaccrual loans for the quarter ended (dollars in thousands):
|
| December 31, |
| September 30, |
| June 30, |
| March 31, |
| December 31, | |||||
| | 2020 | | 2020 | | 2020 | | 2020 | | 2019 | |||||
Beginning Balance | | $ | 39,023 | | $ | 39,624 | | $ | 44,022 | | $ | 28,232 | | $ | 30,032 |
Net customer payments | |
| (4,640) | |
| (2,803) | |
| (6,524) | |
| (3,451) | |
| (5,741) |
Additions | |
| 8,211 | |
| 2,790 | |
| 3,206 | |
| 6,059 | |
| 5,631 |
Impact of CECL adoption | | | — | | | — | | | — | | | 14,381 | | | — |
Charge-offs | |
| (146) | |
| (588) | |
| (1,088) | |
| (1,199) | |
| (1,690) |
Loans returning to accruing status | |
| — | |
| — | |
| 8 | |
| — | |
| — |
Ending Balance | | $ | 42,448 | | $ | 39,023 | | $ | 39,624 | | $ | 44,022 | | $ | 28,232 |
The following table shows the activity in foreclosed properties for the quarter ended (dollars in thousands):
|
| December 31, |
| September 30, |
| June 30, |
| March 31, |
| December 31, | |||||
| | 2020 | | 2020 | | 2020 | | 2020 | | 2019 | |||||
Beginning Balance | | $ | 4,159 | | $ | 4,397 | | $ | 4,444 | | $ | 4,708 | | $ | 6,385 |
Additions of foreclosed property | |
| — | |
| — | |
| — | |
| 615 | |
| 62 |
Valuation adjustments | |
| (35) | |
| — | |
| — | |
| (44) | |
| (375) |
Proceeds from sales | |
| (1,357) | |
| (254) | |
| (55) | |
| (854) | |
| (1,442) |
Gains (losses) from sales | |
| 6 | |
| 16 | |
| 8 | |
| 19 | |
| 78 |
Ending Balance | | $ | 2,773 | | $ | 4,159 | | $ | 4,397 | | $ | 4,444 | | $ | 4,708 |
Past Due Loans
Past due loans still accruing interest totaled $49.8 million or 0.36% of total loans held for investment at December 31, 2020, compared to $50.9 million or 0.35% of total loans held for investment at September 30, 2020, and $76.6 million or 0.61% of total loans held for investment at December 31, 2019. Excluding the impact of the PPP loans(1), past due loans still accruing interest were 0.39% of total adjusted loans held for investment at December 31, 2020, compared to 0.40% of total adjusted loans held for investment at September 30, 2020. Of the total past due loans still accruing interest, $13.6 million or 0.10% of total loans held for investment were loans past due 90 days or more at December 31, 2020, compared to $15.7 million or 0.11% of total loans held for investment at September 30, 2020, and $13.4 million or 0.11% of total loans held for investment at December 31, 2019.
Net Charge-offs
For the fourth quarter of 2020, net charge-offs were $1.8 million or 0.05% of total average loans on an annualized basis, compared to $1.4 million or 0.04% for the third quarter of 2020 and $4.6 million or 0.15% for the fourth quarter last year. Excluding the impact of the PPP loans(1), net charge-offs were 0.06% of total adjusted average loans on an annualized basis, compared to 0.04% for the third quarter of 2020. The majority of net charge-offs in the fourth quarter of 2020 were related to the third-party consumer loan portfolio.
For the year ended December 31, 2020, net charge-offs were $11.4 million or 0.08% of total average loans, compared to $20.9 million or 0.17% for the year ended December 31, 2019. Excluding the impact of the PPP loans(1), net charge-offs were 0.09% of total average loans on an annualized basis, compared to 0.17% for the year ended December 31, 2019. The majority of net charge-offs for the year ended December 31, 2020 were related to the third-party consumer loan portfolio.
Provision for Credit Losses
The provision for credit losses decreased $20.4 million for the fourth quarter of 2020 compared to the previous quarter and decreased $16.7 million compared to the same quarter in 2019. The provision for credit losses for the fourth quarter of 2020 reflected a negative provision of $11.8 million in provision for loan losses and a negative provision of $2.0 million in provision for unfunded commitments. The decrease in the provision for credit losses was driven by the improvement in the economic forecast utilized in estimating the final allowance for credit losses (“ACL”) as of December 31, 2020.
(1) These are financial measures not calculated in accordance with GAAP. For a reconciliation of these non-GAAP financial measures, see Alternative Performance Measures (non-GAAP) section of the Key Financial Results.
Allowance for Credit Losses
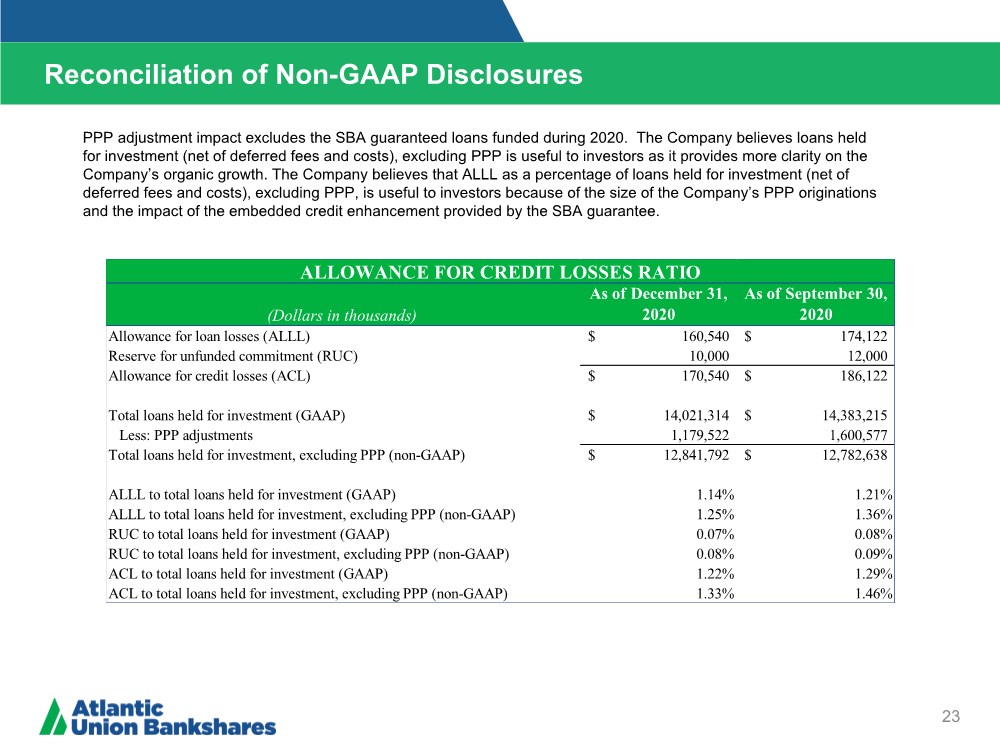
At December 31, 2020, the ACL was $170.5 million and included an allowance for loan and lease losses (“ALLL”) of $160.5 million and a reserve for unfunded commitments (“RUC”) of $10.0 million. The ACL decreased $15.6 million from September 30, 2020, due to lower expected losses than previously estimated as a result of improvements in Virginia’s unemployment rate, benign credit quality metrics to date, and an improved economic forecast due to the roll-out of COVID-19 vaccines and additional government stimulus inclusive of more PPP funding.
The ALLL decreased $13.6 million and the RUC decreased $2.0 million from September 30, 2020. The ALLL as a percentage of the total loan portfolio was 1.14% at December 31, 2020 and 1.21% at September 30, 2020. The ACL as percentage of total loans was 1.22% at December 31, 2020 and 1.29% at September 30, 2020. When excluding PPP loans(1), which are 100% guaranteed by the SBA, the ALLL as a percentage of adjusted loans decreased 11 basis points to 1.25% from the prior quarter and the ACL as a percentage of adjusted loans decreased 13 basis points to 1.33% from the prior quarter. The ratio of the ALLL to nonaccrual loans was 378.2% at December 31, 2020, compared to 446.2% at September 30, 2020.
NONINTEREST INCOME
Noninterest income decreased $2.2 million to $32.2 million for the quarter ended December 31, 2020 from $34.4 million in the prior quarter, primarily driven by a decline in bank owned life insurance income due to $1.4 million in death benefit proceeds received during the third quarter of 2020, lower insurance related income of approximately $530,000, reduced level of unrealized gains of approximately $550,000 related to the Company’s SBIC investments, and lower loan-related interest rate swap income of $460,000 due to lower transaction volumes. These quarterly declines were partially offset by increases in several other non-interest income categories including an increase in service charges on deposit accounts of $661,000, primarily due to higher NSF and overdraft fees.
NONINTEREST EXPENSE
Noninterest expense increased $28.5 million to $121.7 million for the quarter ended December 31, 2020 from $93.2 million in the prior quarter, primarily driven by the recognition of an approximately $20.8 million loss on debt extinguishment in the fourth quarter, resulting from the prepayment of approximately $350.0 million in long-term FHLB advances. In addition, during the fourth quarter of 2020, there was an increase of approximately $8.6 million in salaries and benefits, driven primarily by performance based variable incentive compensation and profit-sharing expenses of $7.4 million, including a $1.2 million contribution to the Company’s Employee Stock Ownership Plan (“ESOP”), as well as third party expenses of approximately $716,000 incurred to process PPP loans for SBA forgiveness. Other increases from the third quarter of 2020 included approximately $883,000 in professional services driven by higher consulting fees due to LIBOR transition and other projects, and an increase in FDIC assessment premiums of approximately $582,000, driven by the impact of lower PPP loan balances on the Company’s assessment rate. Noninterest expense for the fourth quarter of 2020 also included approximately $790,000 in costs related to the Company’s plans to close five branches in February 2021 and approximately $450,000 in costs related to the Company’s response to the COVID-19 pandemic.
INCOME TAXES
The effective tax rate for the three months ended December 31, 2020 was 15.1% compared to 15.3% for the three months ended September 30, 2020.
BALANCE SHEET
At December 31, 2020, total assets were $19.6 billion, a decrease of $302.2 million or approximately 6.0% (annualized) from September 30, 2020, and an increase of $2.1 billion or approximately 11.8% from December 31, 2019. The decrease in assets from the prior quarter was driven by PPP loan forgiveness, partially offset by organic loan growth while growth from the prior year was primarily a result of growth in both organic and PPP loans.
(1) These are financial measures not calculated in accordance with GAAP. For a reconciliation of these non-GAAP financial measures, see Alternative Performance Measures (non-GAAP) section of the Key Financial Results.
At December 31, 2020, loans held for investment (net of deferred fees and costs) were $14.0 billion, a decrease of $361.9 million or 10.0% (annualized) from September 30, 2020, while average loans decreased $170.0 million or 4.7% (annualized), from the prior quarter. Excluding the effects of the PPP(1), loans held for investment (net of deferred fees and costs) increased $59.2 million, or 1.8% (annualized), while average loans increased $22.6 million, or 0.7% (annualized) during this period. Loans held for investment (net of deferred fees and costs) increased $1.4 billion or 11.2% from December 31, 2019, while quarterly average loans increased $1.9 billion or 15.1% from the prior year. Excluding the effects of the PPP(1), loans held for investment (net of deferred fees and costs) at December 31, 2020 increased $230.9 million or 1.8% from the prior year, while quarterly average loans during the fourth quarter of 2020 increased $415.4 million or 3.4% from the prior year. In addition to an insignificant amount of PPP loan payoffs, the Company processed $429.3 million of loan forgiveness on approximately 3,100 PPP loans during the fourth quarter of 2020.
At December 31, 2020, total deposits were $15.7 billion, an increase of $146.7 million or approximately 3.7% (annualized) from September 30, 2020, while average deposits increased $315.7 million or 8.1% (annualized) from the prior quarter. Deposits increased $2.4 billion or 18.2% from December 31, 2019, while quarterly average deposits increased $2.6 billion or 19.5% from the prior year. The increase in deposits from the prior year was primarily due to the impact of PPP loan related deposits and government stimulus.
The following table shows the Company’s capital ratios at the quarters ended:
|
| December 31, |
| September 30, |
| December 31, |
|
| | 2020 | | 2020 | | 2019 |
|
Common equity Tier 1 capital ratio (2) |
| 10.26 | % | 10.05 | % | 10.24 | % |
Tier 1 capital ratio (2) |
| 11.39 | % | 11.18 | % | 10.24 | % |
Total capital ratio (2) |
| 14.00 | % | 13.93 | % | 12.63 | % |
Leverage ratio (Tier 1 capital to average assets) (2) |
| 8.95 | % | 8.82 | % | 8.79 | % |
Common equity to total assets |
| 12.95 | % | 12.52 | % | 14.31 | % |
Tangible common equity to tangible assets (1) |
| 8.31 | % | 7.91 | % | 9.08 | % |
| (1) | These are financial measures not calculated in accordance with GAAP. For a reconciliation of these non-GAAP financial measures, see Alternative Performance Measures (non-GAAP) section of the Key Financial Results. |
| (2) | All ratios at December 31, 2020 are estimates and subject to change pending the Company’s filing of its FR Y9-C. All other periods are presented as filed. |
On June 9, 2020, the Company issued and sold 6,900,000 depositary shares, each representing a 1/400th ownership interest in a share of the Company’s 6.875% Perpetual Non-Cumulative Preferred Stock, Series A (“Series A Preferred Stock”), par value $10.00 per share of Series A Preferred Stock with a liquidation preference of $10,000 per share of Series A Preferred Stock. The net proceeds received from the issuance of the Series A Preferred Stock was approximately $166.4 million after deducting the underwriting discount and other offering expenses payable by the Company. The Series A Preferred Stock is included in Tier 1 capital.
(1) These are financial measures not calculated in accordance with GAAP. For a reconciliation of these non-GAAP financial measures, see Alternative Performance Measures (non-GAAP) section of the Key Financial Results.
During the fourth quarter of 2020, the Company declared and paid cash dividends of $0.25 per common share, consistent with the third quarter of 2020 and the fourth quarter of 2019. During the fourth quarter of 2020, the Company also declared and paid a quarterly dividend on the outstanding shares of Series A Preferred Stock of $171.88 per share (equivalent to $0.43 per outstanding depositary share).
On July 10, 2019, the Company announced that its Board of Directors had authorized a share repurchase program (effective July 8, 2019) to purchase up to $150 million of the Company’s common stock through June 30, 2021 in open market transactions or privately negotiated transactions. On March 20, 2020, the Company suspended its share repurchase program, which had $20 million remaining in the authorization when it was suspended. The Company repurchased an aggregate of approximately 3.7 million shares, at an average price of $35.48, per share under the authorization prior to the suspension.
ABOUT ATLANTIC UNION BANKSHARES CORPORATION
Headquartered in Richmond, Virginia, Atlantic Union Bankshares Corporation (Nasdaq: AUB) is the holding company for Atlantic Union Bank. Atlantic Union Bank has 134 branches and approximately 155 ATMs located throughout Virginia, and in portions of Maryland and North Carolina. Middleburg Financial is a brand name used by Atlantic Union Bank and certain affiliates when providing trust, wealth management, private banking, and investment advisory products and services. Certain non-bank affiliates of Atlantic Union Bank include: Old Dominion Capital Management, Inc., and its subsidiary, Outfitter Advisors, Ltd., and Dixon, Hubard, Feinour, & Brown, Inc., which provide investment advisory services; Middleburg Investment Services, LLC, which provides brokerage services; and Union Insurance Group, LLC, which offers various lines of insurance products.
FOURTH QUARTER AND FISCAL YEAR 2020 EARNINGS RELEASE CONFERENCE CALL
The Company will hold a conference call and webcast for analysts on Tuesday, January 26, 2021 at 9:00 a.m. Eastern Time during which management will review the fourth quarter and fiscal year 2020 financial results and provide an update on recent activities. Interested parties may participate in the call toll-free by dialing (866) 220-4170; international callers wishing to participate may do so by dialing (864) 663-5235. The conference ID number is 2886812. Management will conduct a listen-only webcast with accompanying slides, which can be found at: https://edge.media-server.com/mmc/p/ze3ax9o8.
A replay of the webcast, and the accompanying slides, will be available on the Company’s website for 90 days at: https://investors.atlanticunionbank.com/.
NON-GAAP FINANCIAL MEASURES
In reporting the results of the quarter and fiscal year ended December 31, 2020, the Company has provided supplemental performance measures on a tax-equivalent, tangible, operating, adjusted or pre-tax pre-provision basis. These non-GAAP financial measures are a supplement to GAAP, which is used to prepare the Company’s financial statements, and should not be considered in isolation or as a substitute for comparable measures calculated in accordance with GAAP. In addition, the Company’s non-GAAP financial measures may not be comparable to non-GAAP financial measures of other companies. The Company uses the non-GAAP financial measures discussed herein in its analysis of the Company’s performance. The Company’s management believes that these non-GAAP financial measures provide additional understanding of ongoing operations, enhance comparability of results of operations with prior periods and show the effects of significant gains and charges in the periods presented without the impact of items or events that may obscure trends in the Company’s underlying performance. For a reconciliation of these measures to their most directly comparable GAAP measures and additional information about these non-GAAP financial measures, see Alternative Performance Measures (non-GAAP) section of the Key Financial Results.
FORWARD-LOOKING STATEMENTS
Certain statements in this press release may constitute “forward-looking statements” within the meaning of the Private Securities Litigation Reform Act of 1995. Forward-looking statements, including without limitation, statements made in Mr. Asbury’s quotes and statements regarding the Company’s planned branch consolidations and statements regarding the impact of additional PPP funding on the Company, are statements that include, projections, predictions, expectations, or beliefs about future events or results that are not statements of historical fact. Such forward-looking statements are
based on various assumptions as of the time they are made, and are inherently subject to known and unknown risks, uncertainties, and other factors, some of which cannot be predicted or quantified, that may cause actual results, performance, or achievements to be materially different from those expressed or implied by such forward-looking statements. Forward-looking statements are often accompanied by words that convey projected future events or outcomes such as “expect,” “believe,” “estimate,” “plan,” “project,” “anticipate,” “intend,” “will,” “may,” “view,” “opportunity,” “potential,” or words of similar meaning or other statements concerning opinions or judgment of the Company and its management about future events. Although the Company believes that its expectations with respect to forward-looking statements are based upon reasonable assumptions within the bounds of its existing knowledge of its business and operations, there can be no assurance that actual results, performance, or achievements of, or trends affecting, the Company will not differ materially from any projected future results, performance, or achievements expressed or implied by such forward-looking statements. Actual future results, performance, achievements or trends may differ materially from historical results or those anticipated depending on a variety of factors, including, but not limited to:
| ● | changes in interest rates; |
| ● | general economic and financial market conditions, in the United States generally and particularly in the markets in which the Company operates and which its loans are concentrated, including the effects of declines in real estate values, an increase in unemployment levels and slowdowns in economic growth, including as a result of COVID-19; |
| ● | the quality or composition of the loan or investment portfolios and changes therein; |
| ● | demand for loan products and financial services in the Company’s market area; |
| ● | the Company’s ability to manage its growth or implement its growth strategy; |
| ● | the effectiveness of expense reduction plans; |
| ● | the introduction of new lines of business or new products and services; |
| ● | the Company’s ability to recruit and retain key employees; |
| ● | the incremental cost and/or decreased revenues associated with exceeding $10 billion in assets; |
| ● | real estate values in the Bank’s lending area; |
| ● | an insufficient ACL; |
| ● | changes in accounting principles relating to loan loss recognition (CECL); |
| ● | the Company’s liquidity and capital positions; |
| ● | concentrations of loans secured by real estate, particularly commercial real estate; |
| ● | the effectiveness of the Company’s credit processes and management of the Company’s credit risk; |
| ● | the Company’s ability to compete in the market for financial services and increased competition relating to fintech; |
| ● | technological risks and developments, and cyber threats, attacks, or events; |
| ● | the potential adverse effects of unusual and infrequently occurring events, such as weather-related disasters, terrorist acts or public health events (such as COVID-19), and of governmental and societal responses thereto; these potential adverse effects may include, without limitation, adverse effects on the ability of the Company's borrowers to satisfy their obligations to the Company, on the value of collateral securing loans, on the demand for the Company's loans or its other products and services, on incidents of cyberattack and fraud, on the Company’s liquidity or capital positions, on risks posed by reliance on third-party service providers, on other aspects of the Company's business operations and on financial markets and economic growth; |
| ● | the effect of steps the Company takes in response to COVID-19, the severity and duration of the pandemic, the speed and efficacy of vaccine and treatment developments, the impact of loosening or tightening of government restrictions, the pace of recovery when the pandemic subsides and the heightened impact it has on many of the risks described herein; |
| ● | performance by the Company’s counterparties or vendors; |
| ● | deposit flows; |
| ● | the availability of financing and the terms thereof; |
| ● | the level of prepayments on loans and mortgage-backed securities; |
| ● | legislative or regulatory changes and requirements, including the impact of the CARES Act, as amended by the CAA, and other legislative and regulatory reactions to COVID-19; |
| ● | potential claims, damages, and fines related to litigation or government actions, including litigation or actions arising from the Company’s participation in and administration of programs related to COVID-19, including, among other things, the CARES Act, as amended by the CAA; |
| ● | the effects of changes in federal, state or local tax laws and regulations; |
| ● | monetary and fiscal policies of the U.S. government, including policies of the U.S. Department of the Treasury and the Federal Reserve; |
| ● | changes to applicable accounting principles and guidelines; and |
| ● | other factors, many of which are beyond the control of the Company. |
Please refer to the “Risk Factors” and “Management’s Discussion and Analysis of Financial Condition and Results of Operations” sections of the Company’s Annual Report on Form 10-K for the year ended December 31, 2019 and comparable “Risk Factors” sections of the Company’s Quarterly Reports on Form 10-Q and related disclosures in other filings, which have been filed with the SEC and are available on the SEC’s website at www.sec.gov. All of the forward-looking statements made in this press release are expressly qualified by the cautionary statements contained or referred to herein. The actual results or developments anticipated may not be realized or, even if substantially realized, they may not have the expected consequences to or effects on the Company or its businesses or operations. Readers are cautioned not to rely too heavily on the forward-looking statements contained in this press release. Forward-looking statements speak only as of the date they are made and the Company does not undertake any obligation to update, revise or clarify these forward-looking statements, whether as a result of new information, future events or otherwise.
ATLANTIC UNION BANKSHARES CORPORATION AND SUBSIDIARIES
KEY FINANCIAL RESULTS
(Dollars in thousands, except share data)
| | As of & For Three Months Ended |
| As of & For Year Ended | | |||||||||||
|
| 12/31/20 |
| 09/30/20 |
| 12/31/19 |
| 12/31/20 | | 12/31/19 | | |||||
Results of Operations | | (unaudited) | | (unaudited) | | (unaudited) |
| (unaudited) | | (unaudited) | | |||||
Interest and dividend income | | $ | 161,847 | | $ | 157,414 | | $ | 174,211 | | $ | 653,454 | | $ | 699,332 | |
Interest expense | |
| 16,243 | |
| 20,033 | |
| 39,081 | |
| 98,156 | |
| 161,460 | |
Net interest income | |
| 145,604 | |
| 137,381 | |
| 135,130 | |
| 555,298 | |
| 537,872 | |
Provision for credit losses | |
| (13,813) | |
| 6,558 | |
| 2,900 | |
| 87,141 | |
| 21,092 | |
Net interest income after provision for credit losses | |
| 159,417 | |
| 130,823 | |
| 132,230 | |
| 468,157 | |
| 516,780 | |
Noninterest income | |
| 32,241 | |
| 34,407 | |
| 29,193 | |
| 131,486 | |
| 132,815 | |
Noninterest expenses | |
| 121,668 | |
| 93,222 | |
| 94,318 | |
| 413,349 | |
| 418,340 | |
Income before income taxes | |
| 69,990 | |
| 72,008 | |
| 67,105 | |
| 186,294 | |
| 231,255 | |
Income tax expense | |
| 10,560 | |
| 11,008 | |
| 11,227 | |
| 28,066 | |
| 37,557 | |
Income from continuing operations | |
| 59,430 | |
| 61,000 | |
| 55,878 | |
| 158,228 | |
| 193,698 | |
Discontinued operations, net of tax | |
| — | |
| — | |
| (42) | |
| — | |
| (170) | |
Net income | | | 59,430 | | | 61,000 | | | 55,836 | | | 158,228 | | | 193,528 | |
Dividends on preferred stock | | | 2,967 | | | 2,691 | | | — | | | 5,658 | | | — | |
Net income available to common shareholders | | $ | 56,463 | | $ | 58,309 | | $ | 55,836 | | $ | 152,570 | | $ | 193,528 | |
| | | | | | | | | | | | | | | | |
Interest earned on earning assets (FTE) (1) | | $ | 164,931 | | $ | 160,315 | | $ | 176,868 | | $ | 665,001 | | $ | 710,453 | |
Net interest income (FTE) (1) | |
| 148,688 | |
| 140,282 | |
| 137,787 | |
| 566,845 | |
| 548,993 | |
Total revenue (FTE) (1) | | | 180,929 | | | 174,689 | | | 166,980 | | | 698,331 | | | 681,808 | |
Pre-tax pre-provision operating earnings (8) | | | 76,987 | | | 78,548 | | | 71,392 | | | 294,026 | | | 295,178 | |
| | | | | | | | | | | | | | | | |
Key Ratios | | | | | | | | | | | | | | | | |
Earnings per common share, diluted | | $ | 0.72 | | $ | 0.74 | | $ | 0.69 | | $ | 1.93 | | $ | 2.41 | |
Return on average assets (ROA) | |
| 1.19 | % |
| 1.23 | % |
| 1.27 | % |
| 0.83 | % |
| 1.15 | % |
Return on average equity (ROE) | |
| 8.82 | % |
| 9.16 | % |
| 8.81 | % |
| 6.14 | % |
| 7.89 | % |
Return on average tangible common equity (ROTCE) (2) (3) | |
| 15.60 | % |
| 16.49 | % |
| 15.64 | % |
| 11.18 | % |
| 14.26 | % |
Efficiency ratio | |
| 68.41 | % |
| 54.27 | % |
| 57.40 | % |
| 60.19 | % |
| 62.37 | % |
Net interest margin | |
| 3.25 | % |
| 3.08 | % |
| 3.48 | % |
| 3.26 | % |
| 3.61 | % |
Net interest margin (FTE) (1) | |
| 3.32 | % |
| 3.14 | % |
| 3.55 | % |
| 3.32 | % |
| 3.69 | % |
Yields on earning assets (FTE) (1) | |
| 3.69 | % |
| 3.59 | % |
| 4.55 | % |
| 3.90 | % |
| 4.77 | % |
Cost of interest-bearing liabilities | |
| 0.52 | % |
| 0.64 | % |
| 1.33 | % |
| 0.80 | % |
| 1.43 | % |
Cost of deposits | |
| 0.30 | % |
| 0.39 | % |
| 0.92 | % |
| 0.51 | % |
| 0.92 | % |
Cost of funds | |
| 0.37 | % |
| 0.45 | % |
| 1.00 | % |
| 0.58 | % |
| 1.08 | % |
| | | | | | | | | | | | | | | | |
Operating Measures (4) | | | | | | | | | | | | | | | | |
Adjusted operating earnings | | $ | 75,870 | | $ | 60,986 | | $ | 56,966 | | $ | 174,495 | | $ | 227,813 | |
Adjusted operating earnings available to common shareholders | | | 72,903 | | | 58,295 | | | 56,966 | | | 168,837 | | | 227,813 | |
Adjusted operating earnings per share, diluted | | $ | 0.93 | | $ | 0.74 | | $ | 0.71 | | $ | 2.14 | | $ | 2.84 | |
Adjusted operating ROA | |
| 1.52 | % |
| 1.23 | % |
| 1.30 | % |
| 0.91 | % |
| 1.35 | % |
Adjusted operating ROE | |
| 11.27 | % |
| 9.16 | % |
| 8.99 | % | | 6.77 | % |
| 9.29 | % |
Adjusted operating ROTCE (2) (3) | |
| 19.91 | % |
| 16.49 | % |
| 15.93 | % |
| 12.28 | % |
| 16.61 | % |
Adjusted operating efficiency ratio (FTE) (1)(7) | |
| 53.59 | % |
| 51.05 | % |
| 52.77 | % |
| 53.16 | % |
| 51.79 | % |
| | | | | | | | | | | | | | | | |
Per Share Data | | | | | | | | | | | | | | | | |
Earnings per common share, basic | | $ | 0.72 | | $ | 0.74 | | $ | 0.69 | | $ | 1.93 | | $ | 2.41 | |
Earnings per common share, diluted | |
| 0.72 | |
| 0.74 | |
| 0.69 | |
| 1.93 | |
| 2.41 | |
Cash dividends paid per common share | |
| 0.25 | |
| 0.25 | |
| 0.25 | |
| 1.00 | |
| 0.96 | |
Market value per share | |
| 32.94 | |
| 21.37 | |
| 37.55 | |
| 32.94 | |
| 37.55 | |
Book value per common share | |
| 32.46 | |
| 31.86 | |
| 31.58 | |
| 32.46 | |
| 31.58 | |
Tangible book value per common share (2) | |
| 19.78 | |
| 19.13 | |
| 18.90 | |
| 19.78 | |
| 18.90 | |
Price to earnings ratio, diluted | |
| 11.50 | |
| 7.26 | |
| 13.72 | |
| 17.07 | |
| 15.58 | |
Price to book value per common share ratio | |
| 1.01 | |
| 0.67 | |
| 1.19 | |
| 1.01 | |
| 1.19 | |
Price to tangible book value per common share ratio (2) | |
| 1.67 | |
| 1.12 | |
| 1.99 | |
| 1.67 | |
| 1.99 | |
Weighted average common shares outstanding, basic | |
| 78,721,530 | |
| 78,714,353 | |
| 80,439,007 | |
| 78,858,726 | |
| 80,200,950 | |
Weighted average common shares outstanding, diluted | |
| 78,740,351 | |
| 78,725,346 | |
| 80,502,269 | |
| 78,875,668 | |
| 80,263,557 | |
Common shares outstanding at end of period | |
| 78,729,212 | |
| 78,718,850 | |
| 80,001,185 | |
| 78,729,212 | |
| 80,001,185 | |
| | As of & For Three Months Ended |
| As of & For Year Ended | | |||||||||||
|
| 12/31/20 |
| 09/30/20 |
| 12/31/19 |
| 12/31/20 | | 12/31/19 |
| |||||
Capital Ratios | | (unaudited) | | (unaudited) | | (unaudited) |
| (unaudited) | | (unaudited) |
| |||||
Common equity Tier 1 capital ratio (5) |
| | 10.26 | % | | 10.05 | % | | 10.24 | % | | 10.26 | % | | 10.24 | % |
Tier 1 capital ratio (5) |
| | 11.39 | % | | 11.18 | % | | 10.24 | % | | 11.39 | % | | 10.24 | % |
Total capital ratio (5) |
| | 14.00 | % | | 13.93 | % | | 12.63 | % | | 14.00 | % | | 12.63 | % |
Leverage ratio (Tier 1 capital to average assets) (5) |
| | 8.95 | % | | 8.82 | % | | 8.79 | % | | 8.95 | % | | 8.79 | % |
Common equity to total assets |
| | 12.95 | % | | 12.52 | % | | 14.31 | % | | 12.95 | % | | 14.31 | % |
Tangible common equity to tangible assets (2) |
| | 8.31 | % | | 7.91 | % | | 9.08 | % | | 8.31 | % | | 9.08 | % |
| | | | | | | | | | | | | | | | |
Financial Condition |
| |
|
| |
|
| |
| | |
|
| |
| |
Assets | | $ | 19,628,449 | | $ | 19,930,650 | | $ | 17,562,990 | | $ | 19,628,449 | | $ | 17,562,990 | |
Loans held for investment | |
| 14,021,314 | |
| 14,383,215 | |
| 12,610,936 | |
| 14,021,314 | |
| 12,610,936 | |
Securities | |
| 3,180,052 | |
| 3,102,217 | |
| 2,631,437 | |
| 3,180,052 | |
| 2,631,437 | |
Earning Assets | |
| 17,624,618 | |
| 17,885,975 | |
| 15,576,208 | |
| 17,624,618 | |
| 15,576,208 | |
Goodwill | |
| 935,560 | |
| 935,560 | |
| 935,560 | |
| 935,560 | |
| 935,560 | |
Amortizable intangibles, net | |
| 57,185 | |
| 61,068 | |
| 73,669 | |
| 57,185 | |
| 73,669 | |
Deposits | |
| 15,722,765 | |
| 15,576,098 | |
| 13,304,981 | |
| 15,722,765 | |
| 13,304,981 | |
Borrowings | |
| 840,717 | |
| 1,314,322 | |
| 1,513,748 | |
| 840,717 | |
| 1,513,748 | |
Stockholders' equity | |
| 2,708,490 | |
| 2,660,885 | |
| 2,513,102 | |
| 2,708,490 | |
| 2,513,102 | |
Tangible common equity (2) | |
| 1,549,388 | |
| 1,497,900 | |
| 1,503,873 | |
| 1,549,388 | |
| 1,503,873 | |
| | | | | | | | | | | | | | | | |
Loans held for investment, net of deferred fees and costs | |
|
| |
|
| |
|
| |
|
| |
|
| |
Construction and land development | | $ | 925,798 | | $ | 1,207,190 | | $ | 1,250,924 | | $ | 925,798 | | $ | 1,250,924 | |
Commercial real estate - owner occupied | |
| 2,128,909 | |
| 2,107,333 | |
| 2,041,243 | |
| 2,128,909 | |
| 2,041,243 | |
Commercial real estate - non-owner occupied | |
| 3,657,562 | |
| 3,497,929 | |
| 3,286,098 | |
| 3,657,562 | |
| 3,286,098 | |
Multifamily real estate | |
| 814,745 | |
| 731,582 | |
| 633,743 | |
| 814,745 | |
| 633,743 | |
Commercial & Industrial | |
| 3,263,460 | |
| 3,536,249 | |
| 2,114,033 | |
| 3,263,460 | |
| 2,114,033 | |
Residential 1-4 Family - Commercial | |
| 671,949 | |
| 696,944 | |
| 724,337 | |
| 671,949 | |
| 724,337 | |
Residential 1-4 Family - Consumer | |
| 822,866 | |
| 830,144 | |
| 890,503 | |
| 822,866 | |
| 890,503 | |
Residential 1-4 Family - Revolving | |
| 596,996 | |
| 618,320 | |
| 659,504 | |
| 596,996 | |
| 659,504 | |
Auto | |
| 401,324 | |
| 387,417 | |
| 350,419 | |
| 401,324 | |
| 350,419 | |
Consumer | |
| 247,730 | |
| 276,023 | |
| 372,853 | |
| 247,730 | |
| 372,853 | |
Other Commercial | |
| 489,975 | |
| 494,084 | |
| 287,279 | |
| 489,975 | |
| 287,279 | |
Total loans held for investment | | $ | 14,021,314 | | $ | 14,383,215 | | $ | 12,610,936 | | $ | 14,021,314 | | $ | 12,610,936 | |
| | | | | | | | | | | | | | | | |
Deposits | |
|
| |
|
| |
|
| |
|
| |
|
| |
NOW accounts | | $ | 3,621,181 | | $ | 3,460,480 | | $ | 2,905,714 | | $ | 3,621,181 | | $ | 2,905,714 | |
Money market accounts | |
| 4,248,335 | |
| 4,269,696 | |
| 3,951,856 | |
| 4,248,335 | |
| 3,951,856 | |
Savings accounts | |
| 904,095 | |
| 861,685 | |
| 727,847 | |
| 904,095 | |
| 727,847 | |
Time deposits of $250,000 and over | |
| 654,224 | |
| 633,252 | |
| 684,797 | |
| 654,224 | |
| 684,797 | |
Other time deposits | | | 1,926,227 | | | 1,930,320 | | | 2,064,628 | | | 1,926,227 | | | 2,064,628 | |
Time deposits | |
| 2,580,451 | |
| 2,563,572 | |
| 2,749,425 | |
| 2,580,451 | |
| 2,749,425 | |
Total interest-bearing deposits | | $ | 11,354,062 | | $ | 11,155,433 | | $ | 10,334,842 | | $ | 11,354,062 | | $ | 10,334,842 | |
Demand deposits | |
| 4,368,703 | |
| 4,420,665 | |
| 2,970,139 | |
| 4,368,703 | |
| 2,970,139 | |
Total deposits | | $ | 15,722,765 | | $ | 15,576,098 | | $ | 13,304,981 | | $ | 15,722,765 | | $ | 13,304,981 | |
| | | | | | | | | | | | | | | | |
Averages | |
|
| |
|
| |
|
| |
|
| |
|
| |
Assets | | $ | 19,817,318 | | $ | 19,785,167 | | $ | 17,437,552 | | $ | 19,083,853 | | $ | 16,840,310 | |
Loans held for investment | |
| 14,188,661 | |
| 14,358,666 | |
| 12,327,692 | |
| 13,777,467 | |
| 11,949,171 | |
Loans held for sale | |
| 59,312 | |
| 45,201 | |
| 75,038 | |
| 53,016 | |
| 53,390 | |
Securities | |
| 3,140,243 | |
| 2,891,210 | |
| 2,608,942 | |
| 2,826,504 | |
| 2,663,184 | |
Earning assets | |
| 17,801,490 | |
| 17,748,152 | |
| 15,418,605 | |
| 17,058,795 | |
| 14,881,142 | |
Deposits | |
| 15,896,149 | |
| 15,580,469 | |
| 13,302,955 | |
| 14,950,295 | |
| 12,515,552 | |
Time deposits | |
| 2,571,639 | |
| 2,579,991 | |
| 2,847,366 | |
| 2,643,229 | |
| 2,627,987 | |
Interest-bearing deposits | |
| 11,482,105 | |
| 11,260,244 | |
| 10,265,986 | |
| 11,028,169 | |
| 9,624,396 | |
Borrowings | |
| 891,699 | |
| 1,183,839 | |
| 1,369,035 | |
| 1,215,676 | |
| 1,656,426 | |
Interest-bearing liabilities | |
| 12,373,804 | |
| 12,444,083 | |
| 11,635,021 | |
| 12,243,845 | |
| 11,280,822 | |
Stockholders' equity | |
| 2,679,170 | |
| 2,648,777 | |
| 2,515,303 | |
| 2,576,372 | |
| 2,451,435 | |
Tangible common equity (2) | |
| 1,518,223 | |
| 1,483,848 | |
| 1,509,001 | |
| 1,482,060 | |
| 1,459,509 | |
| | As of & For Three Months Ended |
| As of & For Year Ended | | |||||||||||
|
| 12/31/20 |
| 09/30/20 |
| 12/31/19 |
| 12/31/20 | | 12/31/19 |
| |||||
Asset Quality | | (unaudited) | | (unaudited) | | (unaudited) |
| (unaudited) | | (unaudited) |
| |||||
Allowance for Credit Losses (ACL) |
| |
|
| |
|
| |
| | |
|
| |
| |
Beginning balance, Allowance for loan and lease losses (ALLL) | | $ | 174,122 | | $ | 169,977 | | $ | 43,820 | | $ | 42,294 | | $ | 41,045 | |
Add: Day 1 impact from adoption of CECL | | | — | | | — | | | — | | | 47,484 | | | — | |
Add: Recoveries | |
| 1,617 | |
| 1,566 | |
| 2,292 | |
| 6,754 | |
| 7,232 | |
Less: Charge-offs | |
| 3,386 | |
| 2,978 | |
| 6,918 | |
| 18,193 | |
| 28,108 | |
Add: Provision for loan losses | |
| (11,813) | |
| 5,557 | |
| 3,100 | |
| 82,201 | |
| 22,125 | |
Ending balance, ALLL | | $ | 160,540 | | $ | 174,122 | | $ | 42,294 | | $ | 160,540 | | $ | 42,294 | |
| | | | | | | | | | | | | | | | |
Beginning balance, Reserve for unfunded commitment (RUC) | | $ | 12,000 | | $ | 11,000 | | $ | 1,100 | | | 900 | | | 900 | |
Add: Day 1 impact from adoption of CECL | | | — | | | — | | | — | | | 4,160 | | | — | |
Add: Impact of acquisition accounting | | | — | | | — | | | — | | | — | | | 1,033 | |
Add: Provision for unfunded commitments | | | (2,000) | | | 1,000 | | | (200) | | | 4,940 | | | (1,033) | |
Ending balance, RUC | | $ | 10,000 | | $ | 12,000 | | $ | 900 | | | 10,000 | | | 900 | |
Total ACL | | $ | 170,540 | | $ | 186,122 | | $ | 43,194 | | $ | 170,540 | | $ | 43,194 | |
| | | | | | | | | | | | | | | | |
ACL / total outstanding loans | | | 1.22 | % | | 1.29 | % | | 0.34 | % | | 1.22 | % | | 0.34 | % |
ACL / total adjusted loans(9) | | | 1.33 | % | | 1.46 | % | | 0.34 | % | | 1.33 | % | | 0.34 | % |
ALLL / total outstanding loans | |
| 1.14 | % |
| 1.21 | % |
| 0.34 | % |
| 1.14 | % |
| 0.34 | % |
ALLL / total adjusted loans(9) | | | 1.25 | % | | 1.36 | % | | 0.34 | % | | 1.25 | % | | 0.34 | % |
Net charge-offs / total average loans | |
| 0.05 | % |
| 0.04 | % |
| 0.15 | % |
| 0.08 | % |
| 0.17 | % |
Net charge-offs / total adjusted average loans(9) | | | 0.06 | % | | 0.04 | % | | 0.15 | % | | 0.09 | % | | 0.17 | % |
Provision for loan losses/ total average loans | |
| (0.33) | % |
| 0.15 | % |
| 0.10 | % |
| 0.60 | % |
| 0.19 | % |
Provision for loan losses/ total adjusted average loans(9) | | | (0.37) | % | | 0.17 | % | | 0.10 | % | | 0.65 | % | | 0.19 | % |
| ` | | | | | | | | | | | | | | | |
Nonperforming Assets(6) | |
|
| |
|
| |
|
| |
|
| |
|
| |
Construction and land development | | $ | 3,072 | | $ | 3,520 | | $ | 3,703 | | $ | 3,072 | | $ | 3,703 | |
Commercial real estate - owner occupied | |
| 7,128 | |
| 9,267 | |
| 6,003 | |
| 7,128 | |
| 6,003 | |
Commercial real estate - non-owner occupied | |
| 2,317 | |
| 1,992 | |
| 381 | |
| 2,317 | |
| 381 | |
Multifamily real estate | | | 33 | | | 33 | | | — | | | 33 | | | — | |
Commercial & Industrial | |
| 2,107 | |
| 1,592 | |
| 1,735 | |
| 2,107 | |
| 1,735 | |
Residential 1-4 Family - Commercial | |
| 9,993 | |
| 5,743 | |
| 4,301 | |
| 9,993 | |
| 4,301 | |
Residential 1-4 Family - Consumer | |
| 12,600 | |
| 12,620 | |
| 9,292 | |
| 12,600 | |
| 9,292 | |
Residential 1-4 Family - Revolving | |
| 4,629 | |
| 3,664 | |
| 2,080 | |
| 4,629 | |
| 2,080 | |
Auto | |
| 500 | |
| 517 | |
| 563 | |
| 500 | |
| 563 | |
Consumer | | | 69 | | | 75 | | | 77 | | | 69 | | | 77 | |
Other Commercial | | | — | | | — | | | 97 | | | — | |
| 97 | |
Nonaccrual loans | | $ | 42,448 | | $ | 39,023 | | $ | 28,232 | | $ | 42,448 | | $ | 28,232 | |
Foreclosed property | |
| 2,773 | |
| 4,159 | |
| 4,708 | |
| 2,773 | |
| 4,708 | |
Total nonperforming assets (NPAs) | | $ | 45,221 | | $ | 43,182 | | $ | 32,940 | | $ | 45,221 | | $ | 32,940 | |
Construction and land development | | $ | — | | $ | 93 | | $ | 189 | | $ | — | | $ | 189 | |
Commercial real estate - owner occupied | |
| 3,727 | |
| 1,726 | |
| 1,062 | |
| 3,727 | |
| 1,062 | |
Commercial real estate - non-owner occupied | | | 148 | | | 168 | | | 1,451 | | | 148 | | | 1,451 | |
Multifamily real estate | | | — | | | 359 | | | 474 | | | — | | | 474 | |
Commercial & Industrial | |
| 1,114 | |
| 604 | |
| 449 | |
| 1,114 | |
| 449 | |
Residential 1-4 Family - Commercial | |
| 1,560 | |
| 5,298 | |
| 674 | |
| 1,560 | |
| 674 | |
Residential 1-4 Family - Consumer | |
| 5,699 | |
| 4,495 | |
| 4,515 | |
| 5,699 | |
| 4,515 | |
Residential 1-4 Family - Revolving | |
| 826 | |
| 2,276 | |
| 3,357 | |
| 826 | |
| 3,357 | |
Auto | |
| 166 | |
| 315 | |
| 272 | |
| 166 | |
| 272 | |
Consumer | |
| 394 | |
| 327 | |
| 953 | |
| 394 | |
| 953 | |
Other Commercial | | | — | | | — | | | — | | | — | | | — | |
Loans ≥ 90 days and still accruing | | $ | 13,634 | | $ | 15,661 | | $ | 13,396 | | $ | 13,634 | | $ | 13,396 | |
Total NPAs and loans ≥ 90 days | | $ | 58,855 | | $ | 58,843 | | $ | 46,336 | | $ | 58,855 | | $ | 46,336 | |
NPAs / total outstanding loans | | | 0.32 | % |
| 0.30 | % |
| 0.26 | % |
| 0.32 | % |
| 0.26 | % |
NPAs / total adjusted loans(9) | | | 0.35 | % | | 0.34 | % | | 0.26 | % | | 0.35 | % | | 0.26 | % |
NPAs / total assets | |
| 0.23 | % |
| 0.22 | % |
| 0.19 | % |
| 0.23 | % |
| 0.19 | % |
ALLL / nonaccrual loans | |
| 378.20 | % |
| 446.20 | % |
| 149.81 | % |
| 378.20 | % |
| 149.81 | % |
ALLL/ nonperforming assets | |
| 355.01 | % |
| 403.23 | % |
| 128.40 | % |
| 355.01 | % |
| 128.40 | % |
| |
|
| |
|
| |
|
| |
|
| |
|
| |
| | As of & For Three Months Ended |
| As of & For Year Ended | | |||||||||||
|
| 12/31/20 |
| 09/30/20 |
| 12/31/19 |
| 12/31/20 | | 12/31/19 |
| |||||
Past Due Detail(6) | | (unaudited) | | (unaudited) | | (unaudited) |
| (unaudited) | | (unaudited) |
| |||||
Construction and land development | | $ | 1,903 | | $ | 2,625 | | $ | 4,563 | | $ | 1,903 | | $ | 4,563 | |
Commercial real estate - owner occupied | |
| 1,870 | |
| 4,924 | |
| 3,482 | |
| 1,870 | |
| 3,482 | |
Commercial real estate - non-owner occupied | |
| 2,144 | |
| 1,291 | |
| 457 | |
| 2,144 | |
| 457 | |
Multifamily real estate | |
| 617 | |
| — | |
| 223 | |
| 617 | |
| 223 | |
Commercial & Industrial | |
| 1,848 | |
| 4,322 | |
| 8,698 | |
| 1,848 | |
| 8,698 | |
Residential 1-4 Family - Commercial | |
| 2,227 | |
| 1,236 | |
| 1,479 | |
| 2,227 | |
| 1,479 | |
Residential 1-4 Family - Consumer | |
| 10,182 | |
| 2,998 | |
| 16,244 | |
| 10,182 | |
| 16,244 | |
Residential 1-4 Family - Revolving | |
| 2,975 | |
| 2,669 | |
| 10,190 | |
| 2,975 | |
| 10,190 | |
Auto | |
| 2,076 | |
| 1,513 | |
| 2,525 | |
| 2,076 | |
| 2,525 | |
Consumer | | | 1,166 | | | 1,020 | | | 2,128 | | | 1,166 | | | 2,128 | |
Other Commercial | | | 16 | | | 613 | | | 464 | | | 16 | | | 464 | |
Loans 30-59 days past due | | $ | 27,024 | | $ | 23,211 | | $ | 50,453 | | $ | 27,024 | | $ | 50,453 | |
Construction and land development | | $ | 547 | | $ | 223 | | $ | 482 | | $ | 547 | | $ | 482 | |
Commercial real estate - owner occupied | |
| 1,380 | |
| 1,310 | |
| 2,184 | |
| 1,380 | |
| 2,184 | |
Commercial real estate - non-owner occupied | |
| 1,721 | |
| 1,371 | |
| — | |
| 1,721 | |
| — | |
Multifamily real estate | | | — | | | — | | | — | | | — | | | — | |
Commercial & Industrial | |
| 1,190 | |
| 1,448 | |
| 1,598 | |
| 1,190 | |
| 1,598 | |
Residential 1-4 Family - Commercial | |
| 818 | |
| 937 | |
| 2,207 | |
| 818 | |
| 2,207 | |
Residential 1-4 Family - Consumer | |
| 1,533 | |
| 3,976 | |
| 3,072 | |
| 1,533 | |
| 3,072 | |
Residential 1-4 Family - Revolving | |
| 1,044 | |
| 1,141 | |
| 1,784 | |
| 1,044 | |
| 1,784 | |
Auto | |
| 376 | |
| 453 | |
| 236 | |
| 376 | |
| 236 | |
Consumer | | | 550 | | | 772 | | | 1,233 | | | 550 | | | 1,233 | |
Other Commercial | | | — | | | 427 | | | — | | | — | |
| — | |
Loans 60-89 days past due | | $ | 9,159 | | $ | 12,058 | | $ | 12,796 | | $ | 9,159 | | $ | 12,796 | |
| | | | | | | | | | | | | | | | |
Past Due and still accruing | | $ | 49,817 | | $ | 50,930 | | $ | 76,645 | | $ | 49,817 | | $ | 76,645 | |
Past Due and still accruing / total loans | | | 0.36 | % | | 0.35 | % | | 0.61 | % | | 0.36 | % | | 0.61 | % |
Past Due and still accruing / total adjusted loans(9) | | | 0.39 | % | | 0.40 | % | | 0.61 | % | | 0.39 | % | | 0.61 | % |
| | | | | | | | | | | | | | | | |
Troubled Debt Restructurings | |
|
| |
|
| |
|
| |
|
| |
|
| |
Performing | | $ | 13,961 | | $ | 14,515 | | $ | 15,686 | | $ | 13,961 | | $ | 15,686 | |
Nonperforming | |
| 6,655 | |
| 7,045 | |
| 3,810 | |
| 6,655 | |
| 3,810 | |
Total troubled debt restructurings | | $ | 20,616 | | $ | 21,560 | | $ | 19,496 | | $ | 20,616 | | $ | 19,496 | |
| | | | | | | | | | | | | | | | |
Alternative Performance Measures (non-GAAP) | |
|
| |
|
| |
|
| |
|
| |
|
| |
Net interest income (FTE) | |
|
| |
|
| |
|
| |
|
| |
|
| |
Net interest income (GAAP) | | $ | 145,604 | | $ | 137,381 | | $ | 135,130 | | $ | 555,298 | | $ | 537,872 | |
FTE adjustment | |
| 3,084 | |
| 2,901 | |
| 2,657 | |
| 11,547 | |
| 11,121 | |
Net interest income (FTE) (non-GAAP) (1) | | $ | 148,688 | | $ | 140,282 | | $ | 137,787 | | $ | 566,845 | | $ | 548,993 | |
Noninterest income (GAAP) | | | 32,241 | | | 34,407 | | | 29,193 | | | 131,486 | | | 132,815 | |
Total revenue (FTE) (non-GAAP) (1) | | $ | 180,929 | | $ | 174,689 | | $ | 166,980 | | $ | 698,331 | | $ | 681,808 | |
| | | | | | | | | | | | | | | | |
Average earning assets | | $ | 17,801,490 | | $ | 17,748,152 | | $ | 15,418,605 | | $ | 17,058,795 | | $ | 14,881,142 | |
Net interest margin | |
| 3.25 | % |
| 3.08 | % |
| 3.48 | % |
| 3.26 | % |
| 3.61 | % |
Net interest margin (FTE) (1) | |
| 3.32 | % |
| 3.14 | % |
| 3.55 | % |
| 3.32 | % |
| 3.69 | % |
| | | | | | | | | | | | | | | | |
Tangible Assets (2) | |
|
| |
|
| |
|
| |
|
| |
|
| |
Ending assets (GAAP) | | $ | 19,628,449 | | $ | 19,930,650 | | $ | 17,562,990 | | $ | 19,628,449 | | $ | 17,562,990 | |
Less: Ending goodwill | |
| 935,560 | |
| 935,560 | |
| 935,560 | |
| 935,560 | |
| 935,560 | |
Less: Ending amortizable intangibles | |
| 57,185 | |
| 61,068 | |
| 73,669 | |
| 57,185 | |
| 73,669 | |
Ending tangible assets (non-GAAP) | | $ | 18,635,704 | | $ | 18,934,022 | | $ | 16,553,761 | | $ | 18,635,704 | | $ | 16,553,761 | |
| | | | | | | | | | | | | | | | |
Tangible Common Equity (2) | |
|
| |
|
| |
|
| |
|
| |
|
| |
Ending equity (GAAP) | | $ | 2,708,490 | | $ | 2,660,885 | | $ | 2,513,102 | | $ | 2,708,490 | | $ | 2,513,102 | |
Less: Ending goodwill | |
| 935,560 | |
| 935,560 | |
| 935,560 | |
| 935,560 | |
| 935,560 | |
Less: Ending amortizable intangibles | |
| 57,185 | |
| 61,068 | |
| 73,669 | |
| 57,185 | |
| 73,669 | |
Less: Perpetual preferred stock | | | 166,357 | | | 166,357 | | | — | | | 166,357 | | | — | |
Ending tangible common equity (non-GAAP) | | $ | 1,549,388 | | $ | 1,497,900 | | $ | 1,503,873 | | $ | 1,549,388 | | $ | 1,503,873 | |
| | | | | | | | | | | | | | | | |
Average equity (GAAP) | | $ | 2,679,170 | | $ | 2,648,777 | | $ | 2,515,303 | | $ | 2,576,372 | | $ | 2,451,435 | |
Less: Average goodwill | |
| 935,560 | |
| 935,560 | |
| 930,457 | |
| 935,560 | |
| 912,521 | |
Less: Average amortizable intangibles | |
| 59,031 | |
| 63,016 | |
| 75,845 | |
| 65,094 | |
| 79,405 | |
Less: Average perpetual preferred stock | | | 166,356 | | | 166,353 | | | - | | | 93,658 | | | - | |
Average tangible common equity (non-GAAP) | | $ | 1,518,223 | | $ | 1,483,848 | | $ | 1,509,001 | | $ | 1,482,060 | | $ | 1,459,509 | |
| | | | | | | | | | | | | | | | |
ROTCE (2)(3) | | | | | | | | | | | | | | | | |
Net income available to common shareholders (GAAP) | | $ | 56,463 | | $ | 58,309 | | $ | 55,836 | | $ | 152,570 | | $ | 193,528 | |
Plus: Amortization of intangibles, tax effected | | | 3,079 | | | 3,202 | | | 3,636 | | | 13,093 | | | 14,632 | |
Net income available to common shareholders before amortization of intangibles (non-GAAP) | | $ | 59,542 | | $ | 61,511 | | $ | 59,472 | | $ | 165,663 | | $ | 208,160 | |
| | | | | | | | | | | | | | | | |
Return on average tangible common equity (ROTCE) (2) (3) | | | 15.60 | % | | 16.49 | % | | 15.64 | % | | 11.18 | % | | 14.26 | % |
| | As of & For Three Months Ended |
| As of & For Year Ended | | |||||||||||
|
| 12/31/20 |
| 09/30/20 |
| 12/31/19 |
| 12/31/20 |
| 12/31/19 |
| |||||
| | (unaudited) | | (unaudited) | | (unaudited) |
| (unaudited) | | (unaudited) |
| |||||
Operating Measures (4) | |
|
| |
|
| |
|
| |
|
| |
|
| |
Net income (GAAP) | | $ | 59,430 | | $ | 61,000 | | $ | 55,836 | | $ | 158,228 | | $ | 193,528 | |
Plus: Merger and rebranding-related costs, net of tax | |
| — | | | — | |
| 1,422 | |
| — | |
| 27,395 | |
Plus: Net loss related to balance sheet repositioning, net of tax | | | 16,440 | | | — | | | — | | | 25,979 | | | 12,953 | |
Less: Gain on sale of securities, net of tax | | | — | | | 14 | | | 292 | | | 9,712 | | | 6,063 | |
Adjusted operating earnings (non-GAAP) | | | 75,870 | | | 60,986 | | | 56,966 | | | 174,495 | | | 227,813 | |
Less: Dividends on preferred stock | | | 2,967 | | | 2,691 | | | — | | | 5,658 | | | — | |
Adjusted operating earnings available to common shareholders (non-GAAP) | | $ | 72,903 | | $ | 58,295 | | $ | 56,966 | | $ | 168,837 | | $ | 227,813 | |
| | | | | | | | | | | | | | | | |
Noninterest expense (GAAP) | | $ | 121,668 | | $ | 93,222 | | $ | 94,318 | | $ | 413,349 | | $ | 418,340 | |
Less: Merger Related Costs | |
| — | |
| — | |
| 896 | |
| — | |
| 27,824 | |
Less: Rebranding Costs | | | — | | | — | | | 902 | | | — | | | 6,455 | |
Less: Amortization of intangible assets | |
| 3,897 | |
| 4,053 | |
| 4,603 | |
| 16,574 | |
| 18,521 | |
Less: Losses related to balance sheet repositioning | | | 20,810 | | | — | | | — | | | 31,116 | | | 16,397 | |
Adjusted operating noninterest expense (non-GAAP) | | $ | 96,961 | | $ | 89,169 | | $ | 87,917 | | $ | 365,659 | | $ | 349,143 | |
| | | | | | | | | | | | | | | | |
Noninterest income (GAAP) | | $ | 32,241 | | $ | 34,407 | | $ | 29,193 | | $ | 131,486 | | $ | 132,815 | |
Less: Gains related to balance sheet repositioning | | | — | | | — | | | — | | | (1,769) | | | — | |
Less: Gain on sale of securities | | | — | | | 18 | | | 369 | | | 12,294 | | | 7,675 | |
Operating noninterest income (non-GAAP) | | $ | 32,241 | | $ | 34,389 | | $ | 28,824 | | $ | 120,961 | | $ | 125,140 | |
| | | | | | | | | | | | | | | | |
Net interest income (FTE) (non-GAAP) (1) | | $ | 148,688 | | $ | 140,282 | | $ | 137,787 | | $ | 566,845 | | $ | 548,993 | |
Operating noninterest income (non-GAAP) | |
| 32,241 | |
| 34,389 | |
| 28,824 | |
| 120,961 | |
| 125,140 | |
Total adjusted revenue (FTE) (non-GAAP) (1) | | $ | 180,929 | | $ | 174,671 | | $ | 166,611 | | $ | 687,806 | | $ | 674,133 | |
| | | | | | | | | | | | | | | | |
Efficiency ratio | |
| 68.41 | % |
| 54.27 | % |
| 57.40 | % |
| 60.19 | % |
| 62.37 | % |
Adjusted operating efficiency ratio (FTE) (1)(7) | |
| 53.59 | % |
| 51.05 | % |
| 52.77 | % |
| 53.16 | % |
| 51.79 | % |
| | | | | | | | | | | | | | | | |
Operating ROTCE (2)(3)(4) | |
|
| |
|
| |
|
| |
|
| |
|
| |
Adjusted operating earnings available to common shareholders (non-GAAP) | | $ | 72,903 | | $ | 58,295 | | $ | 56,966 | | $ | 168,837 | | $ | 227,813 | |
Plus: Amortization of intangibles, tax effected | |
| 3,079 | |
| 3,202 | |
| 3,636 | |
| 13,093 | |
| 14,632 | |
Adjusted operating earnings available to common shareholders before amortization of intangibles (non-GAAP) | | $ | 75,982 | | $ | 61,497 | | $ | 60,602 | | $ | 181,930 | | $ | 242,445 | |
| | | | | | | | | | | | | | | | |
Average tangible common equity (non-GAAP) | | $ | 1,518,223 | | $ | 1,483,848 | | $ | 1,509,001 | | $ | 1,482,060 | | $ | 1,459,509 | |
Adjusted operating return on average tangible common equity (non-GAAP) | |
| 19.91 | % |
| 16.49 | % |
| 15.93 | % |
| 12.28 | % |
| 16.61 | % |
| | | | | | | | | | | | | | | | |
Pre-tax pre-provision adjusted operating earnings (8) | | | | | | | | | | | | | | | | |
Net income (GAAP) | | $ | 59,430 | | $ | 61,000 | | $ | 55,836 | | $ | 158,228 | | $ | 193,528 | |
Plus: Provision for credit losses | | | (13,813) | | | 6,558 | | | 2,900 | | | 87,141 | | | 21,092 | |
Plus: Income tax expense | | | 10,560 | | | 11,008 | | | 11,227 | | | 28,066 | | | 37,557 | |
Plus: Merger and rebranding-related costs | | | — | | | — | | | 1,798 | | | — | | | 34,279 | |
Plus: Net loss related to balance sheet repositioning | | | 20,810 | | | — | | | — | | | 32,885 | | | 16,397 | |
Less: Gain on sale of securities | | | — | | | 18 | | | 369 | | | 12,294 | | | 7,675 | |
Pre-tax pre-provision adjusted operating earnings (non-GAAP) | | $ | 76,987 | | $ | 78,548 | | $ | 71,392 | | $ | 294,026 | | $ | 295,178 | |
| | | | | | | | | | | | | | | | |
Weighted average common shares outstanding, diluted | | | 78,740,351 | | | 78,725,346 | | | 80,502,269 | | | 78,875,668 | | | 80,263,557 | |
Pre-tax pre-provision earnings per share, diluted | | $ | 0.98 | | $ | 1.00 | | $ | 0.89 | | $ | 3.73 | | $ | 3.68 | |
| | | | | | | | | | | | | | | | |
Paycheck Protection Program adjustment impact (9) | | | | | | | | | | | | | | | | |
Loans held for investment (net of deferred fees and costs)(GAAP) | | $ | 14,021,314 | | $ | 14,383,215 | | $ | 12,610,936 | | $ | 14,021,314 | | $ | 12,610,936 | |
Less: PPP adjustments | | | 1,179,522 | | | 1,600,577 | | | — | | | 1,179,522 | | | — | |
Loans held for investment (net of deferred fees and costs),net adjustments, excluding PPP (non-GAAP) | | $ | 12,841,792 | | $ | 12,782,638 | | $ | 12,610,936 | | $ | 12,841,792 | | $ | 12,610,936 | |
| | | | | | | | | | | | | | | | |
Average loans held for investment (GAAP) | | $ | 14,188,661 | | $ | 14,358,666 | | $ | 12,327,692 | | $ | 13,777,467 | | $ | 11,949,171 | |
Less: Average PPP adjustments | | | 1,445,602 | | | 1,638,204 | | | — | | | 1,091,921 | | | — | |
Average loans held for investment, net adjustments, excluding PPP (non-GAAP) | | $ | 12,743,059 | | $ | 12,720,462 | | $ | 12,327,692 | | $ | 12,685,546 | | $ | 11,949,171 | |
| | As of & For Three Months Ended |
| As of & For Year Ended | | |||||||||||
|
| 12/31/20 |
| 09/30/20 |
| 12/31/19 |
| 12/31/20 |
| 12/31/19 | | |||||
| | (unaudited) | | (unaudited) | | (unaudited) |
| (unaudited) | | (unaudited) | | |||||
Mortgage Origination Volume | |
|
| |
|
| |
|
| |
|
| |
|
| |
Refinance Volume | | $ | 165,042 | | $ | 145,718 | | $ | 50,555 | | $ | 542,880 | | $ | 152,624 | |
Construction Volume | |
| — | |
| 6,448 | |
| 14,571 | |
| 27,251 | |
| 18,846 | |
Purchase Volume | |
| 83,214 | |
| 130,185 | |
| 63,836 | |
| 361,138 | |
| 258,282 | |
Total Mortgage loan originations | | $ | 248,256 | | $ | 282,351 | | $ | 128,962 | | $ | 931,269 | | $ | 429,752 | |
% of originations that are refinances | |
| 66.5 | % |
| 51.6 | % |
| 39.2 | % |
| 58.3 | % |
| 35.5 | % |
| | | | | | | | | | | | | | | | |
Wealth | |
|
| |
|
| |
|
| |
|
| |
|
| |
Assets under management ("AUM") | | $ | 5,865,264 | | $ | 5,455,268 | | $ | 5,650,757 | | $ | 5,865,264 | | $ | 5,650,757 | |
| | | | | | | | | | | | | | | | |
Other Data | |
|
| |
|
| |
|
| |
|
| |
|
| |
End of period full-time employees | |
| 1,879 | |
| 1,883 | |
| 1,989 | |
| 1,879 | |
| 1,989 | |
Number of full-service branches | |
| 134 | |
| 135 | |
| 149 | |
| 134 | |
| 149 | |
Number of full automatic transaction machines ("ATMs") | |
| 156 | |
| 157 | |
| 169 | |
| 156 | |
| 169 | |
| (1) | These are non-GAAP financial measures. Net interest income (FTE) and total adjusted revenue (FTE), which are used in computing net interest margin (FTE) and adjusted operating efficiency ratio (FTE), respectively, provide valuable additional insight into the net interest margin and the efficiency ratio by adjusting for differences in tax treatment of interest income sources. The entire FTE adjustment is attributable to interest income on earning assets, which is used in computing yield on earning assets. Interest expense and the related cost of interest-bearing liabilities and cost of funds ratios are not affected by the FTE components. |
| (2) | These are non-GAAP financial measures. Tangible common equity is used in the calculation of certain profitability, capital, and per share ratios. The Company believes tangible common equity and the related ratios are meaningful measures of capital adequacy because they provide a meaningful base for period-to-period and company-to-company comparisons, which the Company believes will assist investors in assessing the capital of the Company and its ability to absorb potential losses. |
| (3) | These are non-GAAP financial measures. The Company believes that ROTCE is a meaningful supplement to GAAP financial measures and useful to investors because it measures the performance of a business consistently across time without regard to whether components of the business were acquired or developed internally. |
| (4) | These are non-GAAP financial measures. Adjusted operating measures exclude the after-tax effect of merger and rebranding-related costs unrelated to the Company’s normal operations. In addition, adjusted operating measures now exclude the gains or losses related to balance sheet repositioning (principally composed of gains and losses on debt extinguishment) and gains or losses on sale of securities. The Company believes these non-GAAP adjusted measures provide investors with important information about the combined economic results of the organization’s operations. |
| (5) | All ratios at December 31, 2020 are estimates and subject to change pending the Company’s filing of its FR Y9-C. All other periods are presented as filed. |
| (6) | Amounts are not directly comparable due to the Company’s adoption of CECL on January 1, 2020. Prior to January 1, 2020, nonaccrual and past due loan information excluded PCI-related loan balances. These balances also reflect the impact of the CARES Act and March 22 Joint Guidance, which provides relief for TDR designations and also provides guidance on past due reporting for modified loans. |
| (7) | The adjusted operating efficiency ratio (FTE) excludes the amortization of intangible assets, merger and rebranding-related costs and gains or losses related to balance sheet repositioning (principally composed of gains and losses on debt extinguishment). This measure is similar to the measure utilized by the Company when analyzing corporate performance and is also similar to the measure utilized for incentive compensation. The Company believes this adjusted measure provides investors with important information about the combined economic results of the organization’s operations. |
| (8) | This is a non-GAAP financial measure. Pre-tax pre-provision adjusted earnings excludes the provision for credit losses, which can fluctuate significantly from period-to-period under the recently adopted CECL methodology, merger and rebranding-related costs, income tax expense, gains or losses related to balance sheet repositioning (principally composed of gains and losses on debt extinguishment), and gains or losses on sale of securities. The Company believes this adjusted measure provides investors with important information about the combined economic results of the organization’s operations. |
| (9) | These are non-GAAP financial measures. PPP adjustment impact excludes the SBA guaranteed loans funded during 2020. The Company believes loans held for investment (net of deferred fees and costs), excluding PPP is useful to investors as it provides more clarity on the Company’s organic growth. The Company also believes that the related non-GAAP financial measures of past due loans still accruing interest as a percentage of total loans held for investment (net of deferred fees and costs), excluding PPP, are useful to investors as loans originated under the PPP carry an SBA guarantee. The Company believes that the ALLL as a percentage of loans held for investment (net of deferred fees and costs), excluding PPP, is useful to investors because of the size of the Company’s PPP originations and the impact of the embedded credit enhancement provided by the SBA guarantee. |
ATLANTIC UNION BANKSHARES CORPORATION AND SUBSIDIARIES
CONSOLIDATED BALANCE SHEETS
(Dollars in thousands, except share data)
| December 31, | | September 30, | | December 31, | | |||
| 2020 | | 2020 |
| 2019 |
| |||
ASSETS | | (unaudited) | | | (unaudited) | | | (audited) | |
Cash and cash equivalents: | | | | | | | | | |
Cash and due from banks | $ | 172,307 | | $ | 178,563 | | $ | 163,050 | |
Interest-bearing deposits in other banks | | 318,974 | | | 335,111 | | | 234,810 | |
Federal funds sold | | 2,013 | | | 7,292 | | | 38,172 | |
Total cash and cash equivalents | | 493,294 | | | 520,966 | | | 436,032 | |
Securities available for sale, at fair value | | 2,540,419 | | | 2,443,340 | | | 1,945,445 | |
Securities held to maturity, at carrying value | | 544,851 | | | 546,661 | | | 555,144 | |
Restricted stock, at cost | | 94,782 | | | 112,216 | | | 130,848 | |
Loans held for sale, at fair value | | 96,742 | | | 52,607 | | | 55,405 | |
Loans held for investment, net of deferred fees and costs | | 14,021,314 | | | 14,383,215 | | | 12,610,936 | |
Less allowance for loan and lease losses | | 160,540 | | | 174,122 | | | 42,294 | |
Total loans held for investment, net | | 13,860,774 | | | 14,209,093 | | | 12,568,642 | |
Premises and equipment, net | | 163,829 | | | 156,934 | | | 161,073 | |
Goodwill | | 935,560 | | | 935,560 | | | 935,560 | |
Amortizable intangibles, net | | 57,185 | | | 61,068 | | | 73,669 | |
Bank owned life insurance | | 326,892 | | | 325,538 | | | 322,917 | |
Other assets | | 514,121 | | | 566,667 | | | 378,255 | |
Total assets | $ | 19,628,449 | | $ | 19,930,650 | | $ | 17,562,990 | |
LIABILITIES | | | | | | | | | |
Noninterest-bearing demand deposits | $ | 4,368,703 | | $ | 4,420,665 | | $ | 2,970,139 | |
Interest-bearing deposits | | 11,354,062 | | | 11,155,433 | | | 10,334,842 | |
Total deposits | | 15,722,765 | | | 15,576,098 | | | 13,304,981 | |
Securities sold under agreements to repurchase | | 100,888 | | | 91,086 | | | 66,053 | |
Other short-term borrowings | | 250,000 | | | 175,200 | | | 370,200 | |
Long-term borrowings | | 489,829 | | | 1,048,036 | | | 1,077,495 | |
Other liabilities | | 356,477 | | | 379,345 | | | 231,159 | |
Total liabilities | | 16,919,959 | | | 17,269,765 | | | 15,049,888 | |
Commitments and contingencies | | | | | | | | | |
STOCKHOLDERS' EQUITY | | | | | | | | | |
Preferred stock, $10.00 par value | | 173 | | | 173 | | | — | |
Common stock, $1.33 par value | | 104,169 | | | 104,141 | | | 105,827 | |
Additional paid-in capital | | 1,917,081 | | | 1,914,640 | | | 1,790,305 | |
Retained earnings | | 616,052 | | | 579,269 | | | 581,395 | |
Accumulated other comprehensive income (loss) | | 71,015 | | | 62,662 | | | 35,575 | |
Total stockholders' equity | | 2,708,490 | | | 2,660,885 | | | 2,513,102 | |
Total liabilities and stockholders' equity | $ | 19,628,449 | | $ | 19,930,650 | | $ | 17,562,990 | |
| | | | | | | | | |
Common shares outstanding | | 78,729,212 | | | 78,718,850 | | | 80,001,185 | |
Common shares authorized | | 200,000,000 | | | 200,000,000 | | | 200,000,000 | |
Preferred shares outstanding | | 17,250 | | | 17,250 | | | - | |
Preferred shares authorized | | 500,000 | | | 500,000 | | | 500,000 | |
ATLANTIC UNION BANKSHARES CORPORATION AND SUBSIDIARIES
CONSOLIDATED STATEMENTS OF INCOME
(Dollars in thousands, except share data)
| Three Months Ended | | Year Ended | |||||||||||
| December 31, | | September 30, | | December 31, | | December 31, | | December 31, | |||||
| 2020 |
| 2020 |
| 2019 |
| 2020 |
| 2019 | |||||
| (Unaudited) | | (Unaudited) | | (Unaudited) | | (Unaudited) | | (Audited) | |||||
Interest and dividend income: | | | | | | | | | | | | | | |
Interest and fees on loans | $ | 142,108 | | $ | 138,402 | | $ | 152,513 | | $ | 574,871 | | $ | 612,115 |
Interest on deposits in other banks | | 117 | | | 137 | | | 1,686 | | | 1,270 | | | 3,733 |
Interest and dividends on securities: | | | | | | | | | | | | | | |
Taxable | | 10,414 | | | 10,275 | | | 12,378 | | | 43,585 | | | 51,437 |
Nontaxable | | 9,208 | | | 8,600 | | | 7,634 | | | 33,728 | | | 32,047 |
Total interest and dividend income | | 161,847 | | | 157,414 | | | 174,211 | | | 653,454 | | | 699,332 |
Interest expense: | | | | | | | | | | | | | | |
Interest on deposits | | 12,000 | | | 15,568 | | | 30,884 | | | 75,943 | | | 114,972 |
Interest on short-term borrowings | | 93 | | | 72 | | | 1,166 | | | 1,691 | | | 15,479 |
Interest on long-term borrowings | | 4,150 | | | 4,393 | | | 7,031 | | | 20,522 | | | 31,009 |
Total interest expense | | 16,243 | | | 20,033 | | | 39,081 | | | 98,156 | | | 161,460 |
Net interest income | | 145,604 | | | 137,381 | | | 135,130 | | | 555,298 | | | 537,872 |
Provision for credit losses | | (13,813) | | | 6,558 | | | 2,900 | | | 87,141 | | | 21,092 |
Net interest income after provision for credit losses | | 159,417 | | | 130,823 | | | 132,230 | | | 468,157 | | | 516,780 |
Noninterest income: | | | | | | | | | | | | | | |
Service charges on deposit accounts | | 6,702 | | | 6,041 | | | 7,871 | | | 25,251 | | | 30,202 |
Other service charges, commissions and fees | | 1,692 | | | 1,621 | | | 1,544 | | | 6,292 | | | 6,423 |
Interchange fees | | 1,884 | | | 1,979 | | | 1,854 | | | 7,184 | | | 14,619 |
Fiduciary and asset management fees | | 6,107 | | | 6,045 | | | 6,531 | | | 23,650 | | | 23,365 |
Mortgage banking income | | 9,113 | | | 8,897 | | | 2,689 | | | 25,857 | | | 10,303 |
Gains on securities transactions | | — | | | 18 | | | 369 | | | 12,294 | | | 7,675 |
Bank owned life insurance income | | 2,057 | | | 3,421 | | | 2,119 | | | 9,554 | | | 8,311 |
Loan-related interest rate swap fees | | 2,704 | | | 3,170 | | | 3,470 | | | 15,306 | | | 14,126 |
Other operating income | | 1,982 | | | 3,215 | | | 2,746 | | | 6,098 | | | 17,791 |
Total noninterest income | | 32,241 | | | 34,407 | | | 29,193 | | | 131,486 | | | 132,815 |
Noninterest expenses: | | | | | | | | | | | | | | |
Salaries and benefits | | 57,649 | | | 49,000 | | | 47,233 | | | 206,662 | | | 195,349 |
Occupancy expenses | | 7,043 | | | 7,441 | | | 7,366 | | | 28,841 | | | 29,793 |
Furniture and equipment expenses | | 3,881 | | | 3,895 | | | 3,559 | | | 14,923 | | | 14,216 |
Technology and data processing | | 6,742 | | | 6,564 | | | 6,483 | | | 25,929 | | | 23,686 |
Professional services | | 3,797 | | | 2,914 | | | 3,636 | | | 13,007 | | | 11,905 |
Marketing and advertising expense | | 2,473 | | | 2,631 | | | 3,675 | | | 9,886 | | | 11,566 |
FDIC assessment premiums and other insurance | | 2,393 | | | 1,811 | | | 1,254 | | | 9,971 | | | 6,874 |
Other taxes | | 4,119 | | | 4,124 | | | 3,970 | | | 16,483 | | | 15,749 |
Loan-related expenses | | 2,004 | | | 2,314 | | | 2,793 | | | 9,515 | | | 10,043 |
OREO and credit-related expenses | | 511 | | | 413 | | | 1,547 | | | 2,023 | | | 4,708 |
Amortization of intangible assets | | 3,897 | | | 4,053 | | | 4,603 | | | 16,574 | | | 18,521 |
Merger-related costs | | — | | | — | | | 896 | | | — | | | 27,824 |
Rebranding expense | | — | | | — | | | 902 | | | — | | | 6,455 |
Loss on debt extinguishment | | 20,810 | | | — | | | — | | | 31,116 | | | 16,397 |
Other expenses | | 6,349 | | | 8,062 | | | 6,401 | | | 28,419 | | | 25,254 |
Total noninterest expenses | | 121,668 | | | 93,222 | | | 94,318 | | | 413,349 | | | 418,340 |
Income from continuing operations before income taxes | | 69,990 | | | 72,008 | | | 67,105 | | | 186,294 | | | 231,255 |
Income tax expense | | 10,560 | | | 11,008 | | | 11,227 | | | 28,066 | | | 37,557 |
Income from continuing operations | $ | 59,430 | | $ | 61,000 | | $ | 55,878 | | $ | 158,228 | | $ | 193,698 |
Discontinued operations: | | | | | | | | | | | | | | |
Income (loss) from operations of discontinued mortgage segment | $ | — | | $ | — | | $ | (56) | | $ | — | | $ | (230) |
Income tax expense (benefit) | | — | | | — | | | (14) | | | — | | | (60) |
Income (loss) on discontinued operations | | — | | | — | | | (42) | | | — | | | (170) |
Net income | | 59,430 | | | 61,000 | | | 55,836 | | | 158,228 | | | 193,528 |
Dividends on preferred stock | | 2,967 | | | 2,691 | | | — | | | 5,658 | | | — |
Net income available to common shareholders | $ | 56,463 | | $ | 58,309 | | $ | 55,836 | | $ | 152,570 | | $ | 193,528 |
| | | | | | | | | | | | | | |
Basic earnings per common share | $ | 0.72 | | $ | 0.74 | | $ | 0.69 | | $ | 1.93 | | $ | 2.41 |
Diluted earnings per common share | $ | 0.72 | | $ | 0.74 | | $ | 0.69 | | $ | 1.93 | | $ | 2.41 |
AVERAGE BALANCES, INCOME AND EXPENSES, YIELDS AND RATES (TAXABLE EQUIVALENT BASIS)
| For the Quarter Ended | ||||||||||||||
| December 31, 2020 | | September 30, 2020 | ||||||||||||
| Average |
| Interest |
| Yield / |
| Average |
| Interest |
| Yield / | ||||
| (unaudited) | | | (unaudited) | |||||||||||
Assets: | | | | | | | | | | | | | | | |
Securities: | | | | | | | | | | | | | | | |
Taxable | $ | 1,848,655 | | $ | 10,414 | | 2.24% | | $ | 1,738,033 | | $ | 10,275 | | 2.35% |
Tax-exempt | | 1,291,588 | | | 11,656 | | 3.59% | | | 1,153,177 | | | 10,886 | | 3.76% |
Total securities | | 3,140,243 | | | 22,070 | | 2.80% | | | 2,891,210 | | | 21,161 | | 2.91% |
Loans, net (3) (4) | | 14,188,661 | | | 142,289 | | 3.99% | | | 14,358,666 | | | 138,635 | | 3.84% |
Other earning assets | | 472,586 | | | 572 | | 0.48% | | | 498,276 | | | 519 | | 0.41% |
Total earning assets | | 17,801,490 | | $ | 164,931 | | 3.69% | | | 17,748,152 | | $ | 160,315 | | 3.59% |
Allowance for credit losses | | (174,761) | | | | | | | | (174,171) | | | | | |
Total non-earning assets | | 2,190,589 | | | | | | | | 2,211,186 | | | | | |
Total assets | $ | 19,817,318 | | | | | | | $ | 19,785,167 | | | | | |
| | | | | | | | | | | | | | | |
Liabilities and Stockholders' Equity: | | | | | | | | | | | | | | | |
Interest-bearing deposits: | | | | | | | | | | | | | | | |
Transaction and money market accounts | $ | 8,029,168 | | $ | 3,167 | | 0.16% | | $ | 7,834,317 | | $ | 4,684 | | 0.24% |
Regular savings | | 881,298 | | | 88 | | 0.04% | | | 845,936 | | | 128 | | 0.06% |
Time deposits (5) | | 2,571,639 | | | 8,745 | | 1.35% | | | 2,579,991 | | | 10,756 | | 1.66% |
Total interest-bearing deposits | | 11,482,105 | | | 12,000 | | 0.42% | | | 11,260,244 | | | 15,568 | | 0.55% |
Other borrowings (6) | | 891,699 | | | 4,243 | | 1.89% | | | 1,183,839 | | | 4,465 | | 1.50% |
Total interest-bearing liabilities | | 12,373,804 | | $ | 16,243 | | 0.52% | | | 12,444,083 | | $ | 20,033 | | 0.64% |
| | | | | | | | | | | | | | | |
Noninterest-bearing liabilities: | | | | | | | | | | | | | | | |
Demand deposits | | 4,414,044 | | | | | | | | 4,320,225 | | | | | |
Other liabilities | | 350,300 | | | | | | | | 372,082 | | | | | |
Total liabilities | | 17,138,148 | | | | | | | | 17,136,390 | | | | | |
Stockholders' equity | | 2,679,170 | | | | | | | | 2,648,777 | | | | | |
Total liabilities and stockholders' equity | $ | 19,817,318 | | | | | | | $ | 19,785,167 | | | | | |
Net interest income | | | | $ | 148,688 | | | | | | | $ | 140,282 | | |
| | | | | | | | | | | | | | | |
Interest rate spread | | | | | | | 3.17% | | | | | | | | 2.95% |
Cost of funds | | | | | | | 0.37% | | | | | | | | 0.45% |
Net interest margin | | | | | | | 3.32% | | | | | | | | 3.14% |
| (1) | Income and yields are reported on a taxable equivalent basis using the statutory federal corporate tax rate of 21%. |
| (2) | Rates and yields are annualized and calculated from actual, not rounded amounts in thousands, which appear above. |
| (3) | Nonaccrual loans are included in average loans outstanding. |
| (4) | Interest income on loans includes $4.5 million and $3.8 million for the three months ended December 31, 2020 and September 30, 2020, respectively, in accretion of the fair market value adjustments related to acquisitions. |
| (5) | Interest expense on time deposits includes $22,000 and $26,000 for the three months ended December 31, 2020 and September 30, 2020, respectively, in accretion of the fair market value adjustments related to acquisitions. |
| (6) | Interest expense on borrowings includes $188,000 and $167,000 for the three months ended December 31, 2020 and September 30, 2020, in amortization of the fair market value adjustments related to acquisitions. |
Exhibit 99.2
| 4th Quarter and FY2020 Earnings Presentation Nasdaq: AUB January 26, 2021 |

| Forward Looking Statements 2 Certain statements in this presentation may constitute “forward-looking statements” within the meaning of the Private Securities Litigation Reform Act of 1995. Forward-looking statements are statements that include, without limitation, projections, predictions, expectations or beliefs about future events or results that are not statements of historical fact. Such forward-looking statements are based on various assumptions as of the time they are made, and are inherently subject to known and unknown risks, uncertainties, and other factors, some of which cannot be predicted or quantified, that may cause actual results, performance or achievements to be materially different from those expressed or implied by such forward- looking statements. Forward-looking statements are often accompanied by words that convey projected future events or outcomes such as “expect,” “believe,” “estimate,” “plan,” “project,” “anticipate,” “intend,” “will,” “may,” “view,” “opportunity,” “potential,” or words of similar meaning or other statements concerning opinions or judgment of Atlantic Union Bankshares Corporation (“Atlantic Union” or the “Company”) and its management about future events. Although Atlantic Union believes that its expectations with respect to forward-looking statements are based upon reasonable assumptions within the bounds of its existing knowledge of its business and operations, there can be no assurance that actual results, performance, or achievements of, or trends affecting, the Company will not differ materially from any projected future results, performance, or achievements or trends expressed or implied by such forward-looking statements. Actual future results, performance, achievements or trends may differ materially from historical results or those anticipated depending on a variety of factors, including, but not limited to: changes in interest rates; general economic and financial market conditions in the United States generally and particularly in the markets in which the Company operates and which its loans are concentrated, including the effects of declines in real estate values, an increase in unemployment levels and slowdowns in economic growth, including as a result of COVID- 19; the quality or composition of the loan or investment portfolios and changes therein; demand for loan products and financial services in the Company’s market area; the Company’s ability to manage its growth or implement its growth strategy; the effectiveness of expense reduction plans; the introduction of new lines of business or new products and services; the Company’s ability to recruit and retain key employees; the incremental cost and/or decreased revenues associated with exceeding $10 billion in assets; real estate values in the Bank’s lending area; an insufficient ACL; changes in accounting principles relating to loan loss recognition (CECL); the Company’s liquidity and capital positions; concentrations of loans secured by real estate, particularly commercial real estate; the effectiveness of the Company’s credit processes and management of the Company’s credit risk; the Company’s ability to compete in the market for financial services and increased competition relating to fintech; technological risks and developments, and cyber threats, attacks, or events; the potential adverse effects of unusual and infrequently occurring events, such as weather-related disasters, terrorist acts or public health events (such as COVID-19), and of governmental and societal responses thereto; these potential adverse effects may include, without limitation, adverse effects on the ability of the Company's borrowers to satisfy their obligations to the Company, on the value of collateral securing loans, on the demand for the Company's loans or its other products and services, on incidents of cyberattack and fraud, on the Company’s liquidity or capital positions, on risks posed by reliance on third- party service providers, on other aspects of the Company's business operations and on financial markets and economic growth; the effect of steps the Company takes in response to COVID-19, the severity and duration of the pandemic, the speed and efficacy of vaccine and treatment developments, the impact of loosening or tightening of government restrictions, the pace of recovery when the pandemic subsides and the heightened impact it has on many of the risks described herein; performance by the Company’s counterparties or vendors; deposit flows; the availability of financing and the terms thereof; the level of prepayments on loans and mortgage-backed securities; legislative or regulatory changes and requirements, including the impact of the CARES Act, as amended by the CAA, and other legislative and regulatory reactions to COVID-19; potential claims, damages, and fines related to litigation or government actions, including litigation or actions arising from the Company’s participation in and administration of programs related to COVID-19, including, among other things, the CARES Act, as amended by the CAA; the effects of changes in federal, state or local tax laws and regulations; monetary and fiscal policies of the U.S. government, including policies of the U.S. Department of the Treasury and the Federal Reserve; changes to applicable accounting principles and guidelines; and other factors, many of which are beyond the control of the Company. Please refer to the “Risk Factors” and “Management’s Discussion and Analysis of Financial Condition and Results of Operations” sections of the Company’s Annual Report on Form 10-K for the year ended December 31, 2019, comparable “Risk Factors” sections of the Company’s Quarterly Reports on Form 10-Q, and related disclosures in other filings, which have been filed with the Securities and Exchange Commission (the “SEC”), and are available on the SEC’s website at www.sec.gov. All of the forward-looking statements made in this presentation are expressly qualified by the cautionary statements contained or referred to herein. The actual results or developments anticipated may not be realized or, even if substantially realized, they may not have the expected consequences to or effects on the Company or its businesses or operations. You are cautioned not to rely too heavily on the forward-looking statements contained in this presentation. Forward-looking statements speak only as of the date they are made and the Company does not undertake any obligation to update, revise or clarify these forward-looking statements, whether as a result of new information, future events or otherwise. |
| Additional Information 3 Non-GAAP Financial Measures This presentation contains certain financial information determined by methods other than in accordance with generally accepted accounting principles in the United States (“GAAP”). These non-GAAP disclosures have limitations as analytical tools and should not be considered in isolation or as a substitute for analysis of our results as reported under GAAP, nor are they necessarily comparable to non-GAAP performance measures that may be presented by other companies. The Company uses the non-GAAP financial measures discussed herein in its analysis of the Company’s performance. The Company’s management believes that these non-GAAP financial measures provide additional understanding of ongoing operations, enhance comparability of results of operations with prior periods and show the effects of significant gains and charges in the periods presented without the impact of items or events that may obscure trends in the Company’s underlying performance. Please see “Reconciliation of Non-GAAP Disclosures” at the end of this presentation for a reconciliation to the nearest GAAP financial measure. No Offer or Solicitation This presentation does not constitute an offer to sell or a solicitation of an offer to buy any securities. No offer of securities shall be made except by means of a prospectus meeting the requirements of the Securities Act of 1933, as amended, and no offer to sell or solicitation of an offer to buy shall be made in any jurisdiction in which such offer, solicitation or sale would be unlawful. About Atlantic Union Bankshares Corporation Headquartered in Richmond, Virginia, Atlantic Union Bankshares Corporation (Nasdaq: AUB) is the holding company for Atlantic Union Bank. Atlantic Union Bank has 134 branches and approximately 155 ATMs located throughout Virginia, and in portions of Maryland and North Carolina. Middleburg Financial is a brand name used by Atlantic Union Bank and certain affiliates when providing trust, wealth management, private banking, and investment advisory products and services. Certain non-bank affiliates of Atlantic Union Bank include: Old Dominion Capital Management, Inc., and its subsidiary, Outfitter Advisors, Ltd., and Dixon, Hubard, Feinour, & Brown, Inc., which provide investment advisory services; Middleburg Investment Services, LLC, which provides brokerage services; and Union Insurance Group, LLC, which offers various lines of insurance products. |
| 2020 Operating Environment 4 Soundness Profitability Growth At December 31,2020 Assets $19.6B Loans $14.0B Deposits $15.7B Managing through COVID- 19 pandemic: • Pivoted to a new remote work and branch operating model • Focused on Teammates, clients, communities and shareholders • SBA Paycheck Protection Program • Adapting to meet new reality AUB governing philosophy –“Soundness, Profitability, & Growth – in that order of priority” Focused on the safety, soundness and profitability of the Company: • Take care of our Teammates and clients • Mitigate credit risk • Align the expense base to the new revenue reality • Achieve and maintain top-tier financial performance Regardless of the operating environment, our goal of achieving and maintaining top-tier financial performance remains the same AUB(134) AUB LPO (3) |
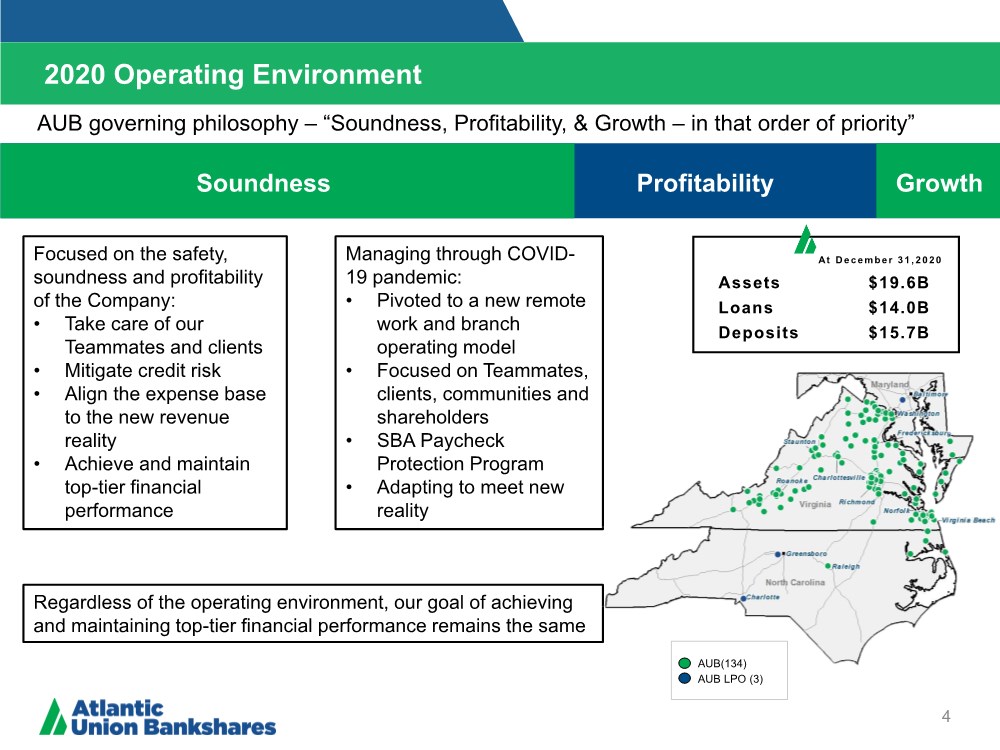
| Banking Differently 5 Digital logins 38% from December 31, 2019 to December 31, 2020 Mobile check deposits 37% from December 31, 2019 to December 31, 2020 Zelle utilization 162% from December 31, 2019 to December 31, 2020 Card control active users 177% from April 1, 2020 to December 31, 2020 Q4 2020 Banking Capability Enhancements • Rolled out a zoom video chat option to our current branch appointment options • Launched ability to digitally sign new account origination documentation to onboard new customers for Trust and Private Banking business • Began to pilot the enhanced wealth CRM platform using Black Diamond technology • Integrated the mortgage digital lending platform with Blend that will enable an end-to-end digital closing experience in Q1 2021 • Implemented DocuSign for Treasury Management documents |
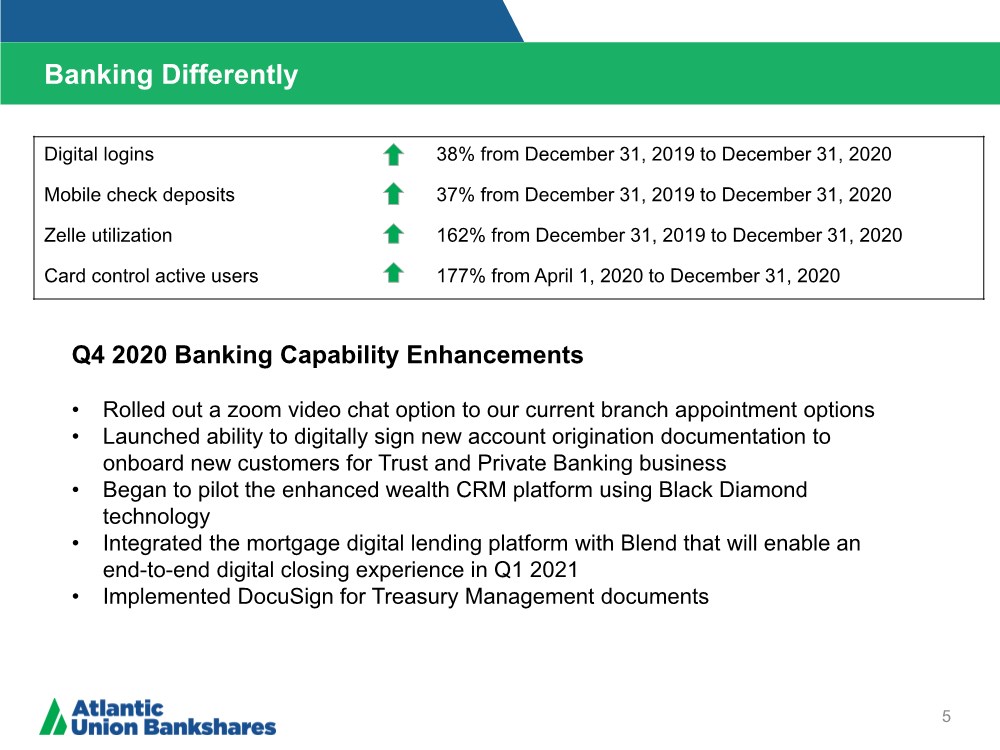
| Covid-19 Loan Modifications 6 • As of January 18, 2021 ~$132 million in loans, or 1% of the total loan portfolio excluding PPP loans, are in some form of a COVID Modification of which 89% of the balances are Commercial loans. • ~37% of the remaining commercial loan modifications as of January 18, 2021, are under a payment deferral modification and ~63% have an interest only modification Note: Figures may not total to 100% due to rounding 1) Consumer loan modifications as of January 18, 2021, except 3rd party consumer loans which are as of December 31,2020 2) For non-GAAP financial measures, see reconciliation to most directly comparable GAAP measures in “Appendix – Reconciliation of Non-GAAP Disclosures” Remaining COVID-19 Loan Modifications Loan Class Count Balances % Bal. Avg. Balance Commercial & Industrial 18 $ 12,099,275 9.1% $ 672,182 Commercial Real Estate 19 $ 104,870,696 79.2% $ 5,519,510 Construction, Land & Development 4 $ 417,423 0.3% $ 104,356 Consumer1 389 $ 14,955,550 11.3% $ 38,446 Residential 1-4 Family 37 $ 8,121,516 6.1% $ 219,500 Residential 1-4 Family - Revolving 13 $ 1,317,733 1.0% $ 101,364 Indirect Auto 187 $ 3,691,181 2.8% $ 19,739 Other Consumer 152 $ 1,825,120 1.4% $ 12,007 Total 430 $ 132,342,944 100.0% $ 307,774 COVID-19 Balance Mods as of January 18, 2021 as % Total Loan Portfolio as of December 31, 2020 0.9% COVID-19 Balance Mods as of January 18, 2021 as % Total Loan Portfolio as of December 31, 2020 excluding PPP (non-GAAP)2 1.0% |
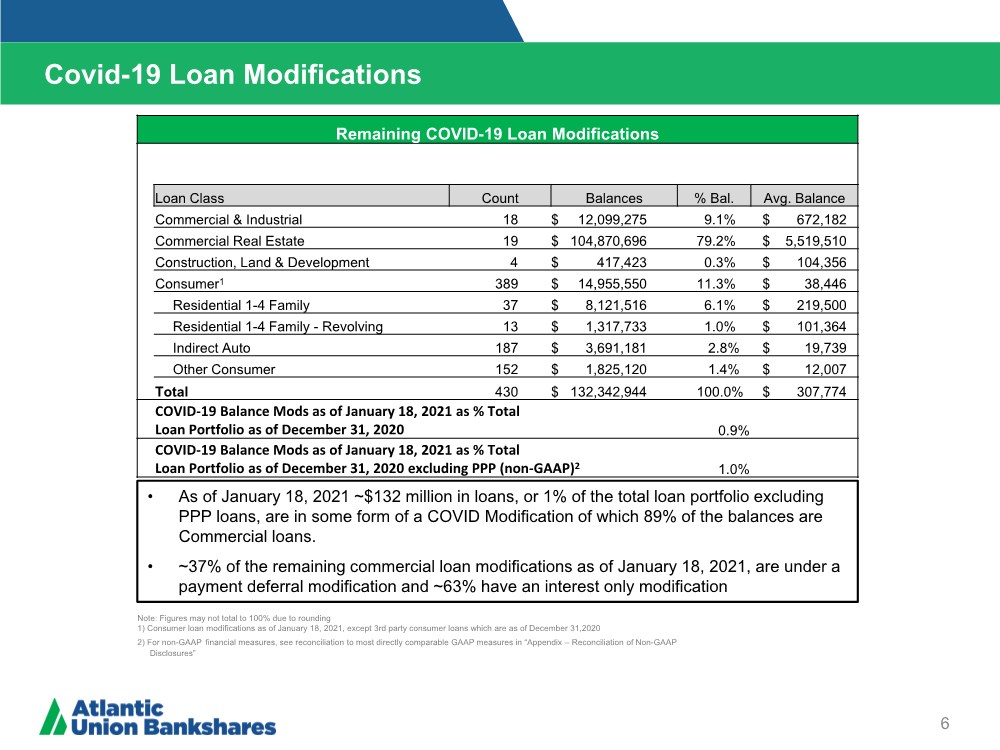
| COVID-19 Sensitive Loan Segment Details 7 Total Portfolio as of December 31, 2020 Remaining Modifications as of January 18, 2021 Count Balance Exposure % of Total Loans Ex PPP Count Balance % of Portfolio Retail Trade 1,145 $ 548,747,439 $ 624,335,325 4.3% 3 $ 1,204,504 0.2% Restaurant 550 $ 213,284,609 $ 222,064,267 1.7% 2 $ 3,373,276 1.6% Senior Living 54 $ 321,801,844 $ 344,883,680 2.5% - $ 0 0 % Hotels 229 $ 678,265,651 $ 754,785,470 5.3% 11 $ 78,708,095 11.6% Health Care 973 $ 600,994,810 $ 677,081,660 4.7% - $ 0 0% Total Sensitive Segments 2,951 $ 2,363,094,353 $ 2,623,150,402 18.5% 16 $ 83,285,875 3.5% Retail Trade: ~83% secured by real estate Restaurants: Early modifications made; 87% secured by real estate Senior Living: All clients have come off of modification Hotel: Primarily flagged non-resort hotel properties Health Care: ~85% secured by real estate; All clients have come off of modification |
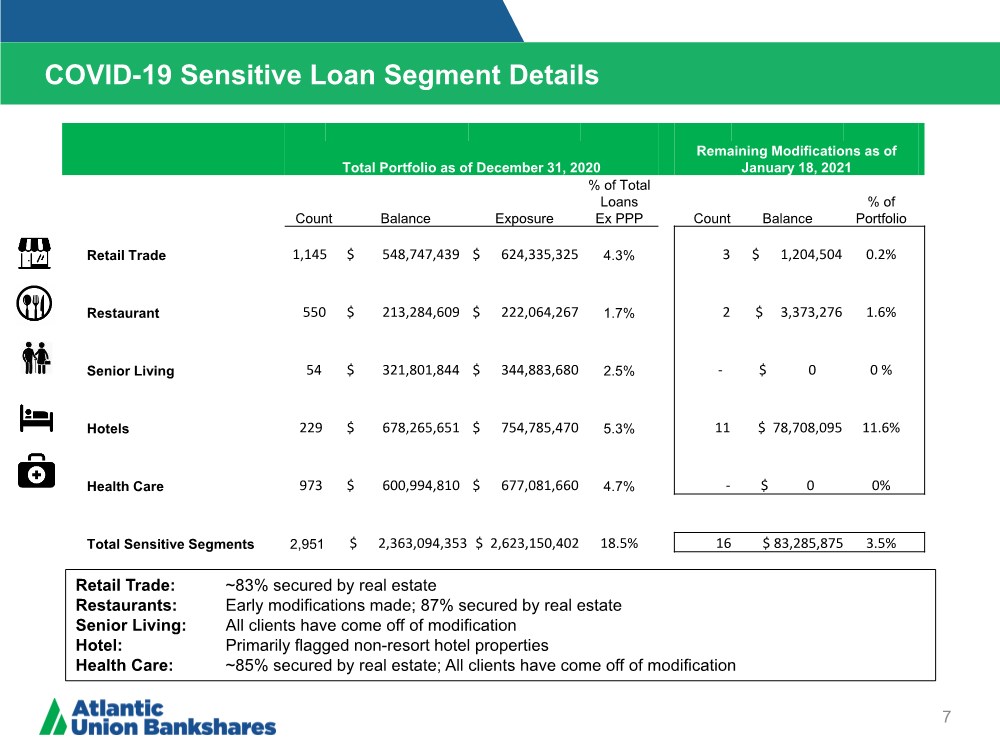
| 2020 Operating Environment – Adapting to the New Reality 8 Soundness Profitability Growth During challenging times, it is important to remember our governing philosophy –“Soundness, Profitability, & Growth – in that order of priority” We believe this core philosophy is serving us well as we manage the Company through the COVID- 19 pandemic crisis We are managing through an unprecedented crisis that requires intense focus on the safety, soundness and profitability of the Company at this time. Growth is not our main focus. What we are doing now is: Taking care of our Teammates and clients – they will remember how we treated them during this period Mitigating credit risk – We are focused on battening down the hatches and protecting the Bank working with our business and consumer clients to assist them through these tough times Aligning the expense base to the new revenue reality – We aim to ensure sustained top tier financial performance once the pandemic subsides We believe that by effectively managing through this crisis, we will become a stronger company that is well positioned to take advantage of growth opportunities as economic activity resumes aided by government support and stimulus |
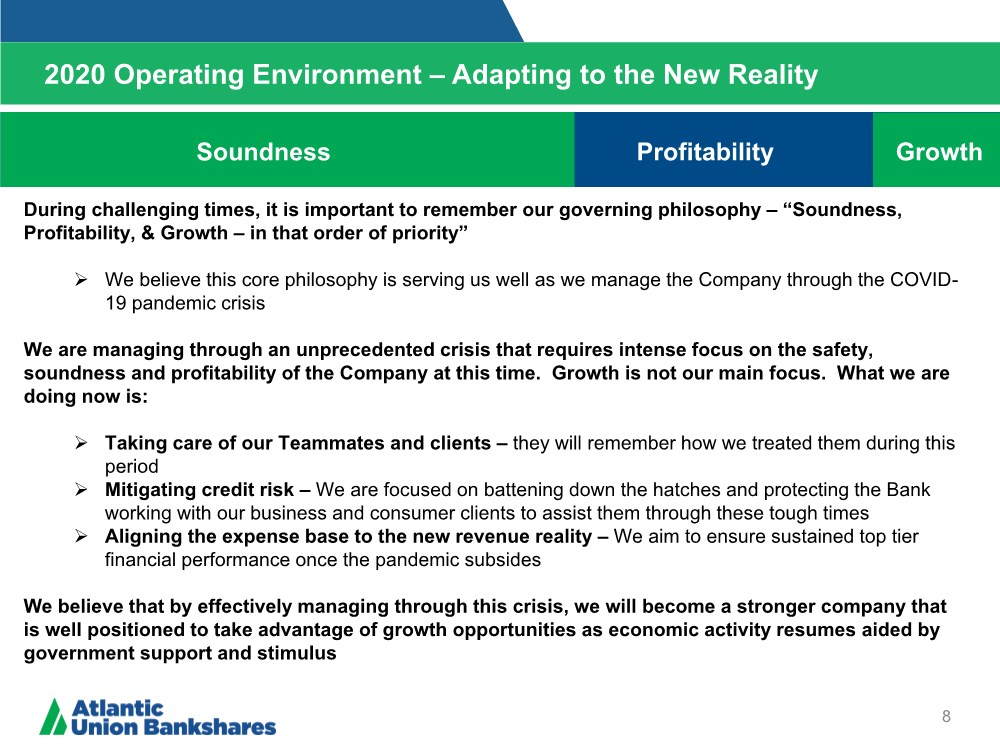
| Q4 2020 Financial Performance At-a-Glance 9 Summarized Income Statement 4Q2020 3Q2020 Net interest income $ 145,604 $ 137,381 Provision for credit losses (13,813) 6,558 Noninterest income 32,241 34,407 Noninterest expense 121,668 93,222 Taxes 10,560 11,008 Net income (GAAP) 59,430 61,000 - Gain on sale of securities, net of tax - 14 + Net losses related to balance sheet repositioning, net of tax 16,440 - Adjusted operating earnings (non-GAAP) $ 75,870 $ 60,986 Dollars in thousands Reported Earnings Metrics 4Q2020 3Q2020 Net income available common shareholders $ 56,463 $ 58,309 Common EPS, diluted $ 0.72 $ 0.74 ROE 8.82% 9.16% ROTCE (non-GAAP) 15.60% 16.49% ROA 1.19% 1.23% Efficiency ratio 68.41% 54.27% Net interest margin 3.25% 3.08% Dollars in thousands except per share amounts Adjusted Operating Earnings Metrics – non-GAAP 4Q2020 3Q2020 Adjusted operating earnings available to common shareholders $ 72,903 $ 58,295 Adjusted operating EPS, diluted $ 0.93 $ 0.74 Adjusted operating ROA 1.52% 1.23% Adjusted Operating ROTCE 19.91% 16.49% Adjusted Operating efficiency ratio (FTE) 53.59% 51.05% Net interest margin (FTE) 3.32% 3.14% PTPP adjusted operating earnings $ 76,987 $ 78,548 Dollars in thousands, PTPP = Pre-tax Pre-provision For non-GAAP financial measures, see reconciliation to most directly comparable GAAP measures in “Appendix – Reconciliation of Non-GAAP Disclosures” .. Net income available to common shareholders for the fourth quarter was $56.5 million or 72 cents per share down $1.8 million or 2 cents per share from the prior quarter primarily due the $20.4 million decline in the provision for credit losses offset by approximately $20.8 million in balance sheet restructuring costs. .. Adjusted operating earnings (non-GAAP) increased $14.9 million to $75.9 million at December 31, 2020, from $61.0 million in the third quarter primarily due to increased net interest income due to higher PPP loan fee accretion income and a negative provision for credit losses partially offset by higher noninterest expenses driven by elevated performance based variable incentive compensation and profit sharing costs of $7.4 million, including contributions to the Company’s ESOP in the fourth quarter. .. Fourth quarter net income and adjusted operating earnings also include branch closure costs of $790,000 related to the consolidation of 6 branches, including 5 that will consolidate in February, as well as third party expenses of $716,000 incurred to process PPP loans for SBA forgiveness. |
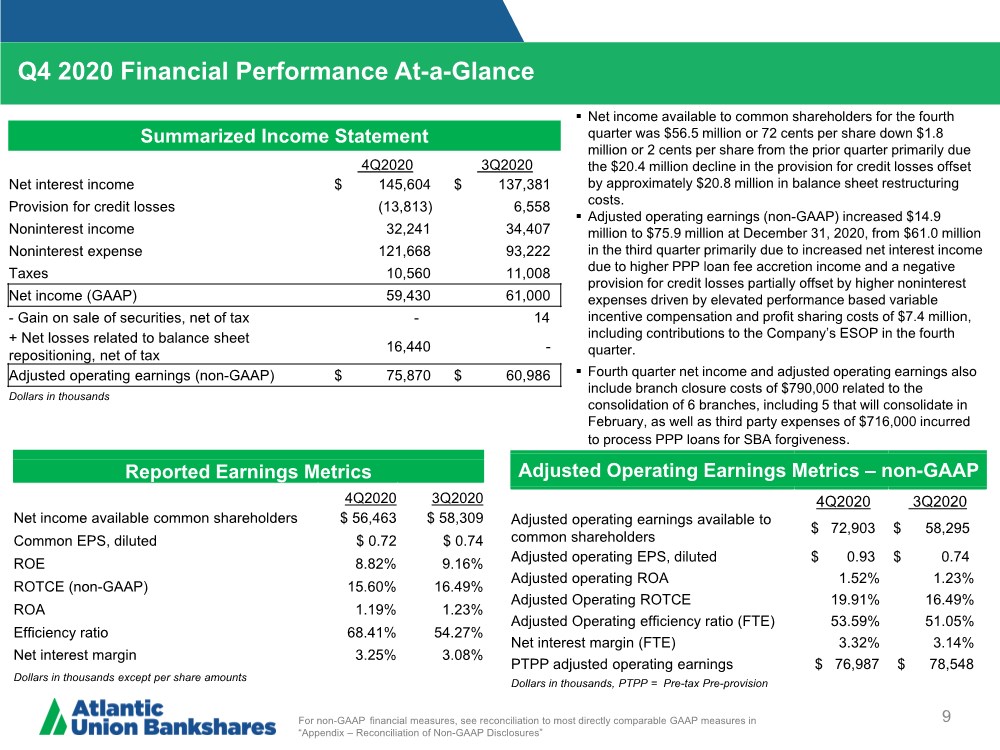
| Q4 Allowance For Credit Loss (ACL) and Provision for Credit Losses 10 Q4 Macroeconomic Forecast Q4 Additional Considerations Moody’s December Forecast • US GDP returns to pre-COVID levels in Q3 2021 and averages 4.1% in 2021 followed by 4.7% in 2022. The unemployment rate averages 6.9% in 2021 and ends 2022 below 6%. • Virginia’s unemployment rate averages 5% over the 2-year forecast, declining to under 4.5% by Q4 2022; compares to a September forecast of 6.3% average and ending over 5%. • 2-year reasonable and supportable period; followed by reversion to the historical loss average over 2 years. • Additional qualitative factors for COVID-19 sensitive portfolios and uncertainty regarding path of virus and efficacy of vaccine rollout • Reserve reflects impact of stimulus and payment deferrals • Does not consider political developments post-year end 2020 Regulatory Capital: Opted into 2 year CECL adoption capital impact delay with 25% of cumulative Day 2 impact added back to Common Equity Tier 1 capital through 2021. 3-year regulatory CECL capital phase-in begins in 2022 $ in millions Allowance for Loan & Lease Losses Reserve for Unfunded Commitments Allowance for Credit Losses 12/31/2019 Ending Balance % of loans $42MM ..34% $1MM < .01% $43MM ..34% CECL Adoption through Q3 2020 +$132MM • $48MM - Day 1 increase from consumer loans (life of loan) and “double-count” on acquired loans • $84MM - Day 2 increase attributable to COVID- 19; large increase for COVID-19 sensitive portfolios +$11MM • $4MM – Day 1 adjustment for lifetime losses • $7MM – Day 2 increase due to higher expected loss related to COVID-19 environment +$143MM • Day 1 - $52 million Capital Cumulative Effect Adjustment of CECL Adoption • Day 2 - $91 million build ($101 million provision for credit losses less $10 million net charge-offs through 9/30/2020) 9/30/2020 Ending Balance % of loans $174MM (1.21%; 1.36% excl. PPP loans) $12MM (.08%; ..09% excl. PPP loans) $186MM (1.29%; 1.46% excl. PPP loans) Q4 2020 -$14MM • Decrease due to improved economic outlook and continued strong credit performance -$2MM • Decrease due to lower loss forecasts from economic outlook and credit performance -$16MM • $14 million benefit from Provision for Credit Losses and $2 million net charge-offs in Q4 12/31/2020 Ending Balance % of loans $161MM (1.14%; 1.25% excl. PPP loans) $10MM (.07%; ..08% excl. PPP loans) $171MM (1.22%; 1.33% excl. PPP loans) Note: Figures may not foot due to rounding |
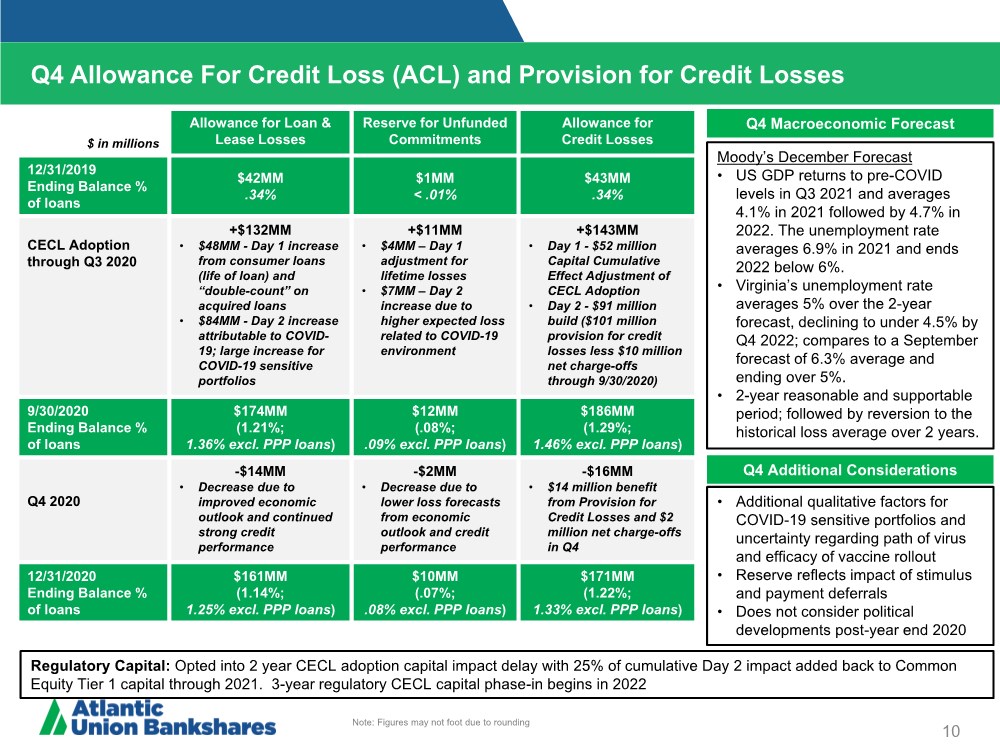
| Total Loan Yield 11 Q4 2020 Net Interest Margin Market Rates 4Q2020 3Q2020 EOP Avg EOP Avg Fed funds 0.25% 0.25% 0.25% 0.25% Prime 3.25% 3.25% 3.25% 3.25% 1-month Libor 0.14% 0.15% 0.15% 0.16% 2-year Treasury 0.12% 0.15% 0.13% 0.14% 10 - year Treasury 0.91% 0.85% 0.69% 0.65% Margin Overview 4Q2020 3Q2020 Net interest margin (FTE) 3.32% 3.14% Loan yield 3.99% 3.84% Investment yield 2.80% 2.91% Earning asset yield 3.69% 3.59% Cost of deposits 0.30% 0.39% Cost of interest-bearing deposits 0.42% 0.55% Cost of borrowings 1.89% 1.50% Cost of funds 0.37% 0.45% Presented on an FTE basis Approximately 12% of the loan portfolio (ex. PPP) have floors Loan Portfolio Pricing Mix with PPP w/o PPP Fixed 54% 50% 1 Month Libor 29% 32% Prime 10% 11% Other 7% 7% Total 100% 100% 11 bps |
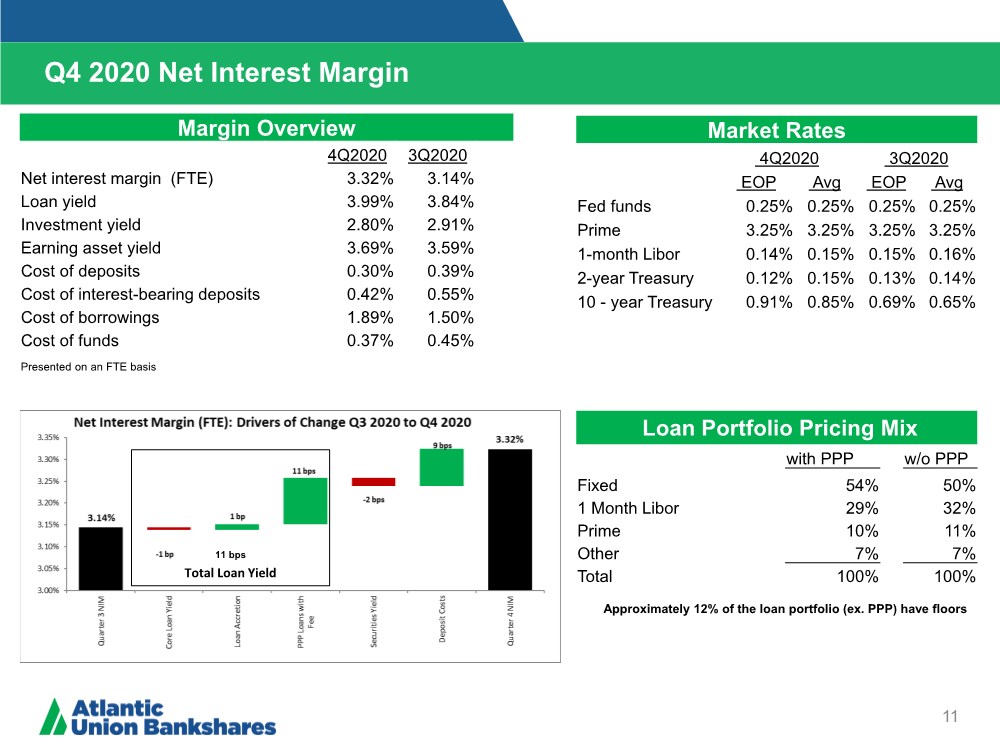
| 12 Noninterest income decreased from the prior quarter to $32.2 million from $34.4 million due to: .. An increase in service charges on deposit accounts of $661,000 due to higher overdraft volumes .. A decrease of $1.4 million in Bank owned life insurance income due to death benefit proceeds received in the third quarter .. A decrease in interest rate swap income of $466,000 due to lower transaction volumes .. A decline in other operating income driven by lower insurance related income of ~$530,000 and reduced levels of unrealized gains of ~$550,000 related to the Company’s SBIC investments. $ in thousands 4Q2020 3Q2020 Service charges on deposit accounts $ 6,702 $ 6,041 Other service charges, commissions and fees 1,692 1,621 Interchange fees 1,884 1,979 Fiduciary and asset management fees 6,107 6,045 Mortgage banking income 9,113 8,897 Bank owned life insurance income 2,057 3,421 Loan-related interest rate swap fees 2,704 3,170 Other operating income 1,982 3,233 Total noninterest income $ 32,241 $ 34,407 $ in thousands 4Q2020 3Q2020 Salaries and benefits $ 57,649 $ 49,000 Occupancy expenses 7,043 7,441 Furniture and equipment expenses 3,881 3,895 Technology and data processing 6,742 6,564 Professional services 3,797 2,914 Marketing and advertising expense 2,473 2,631 FDIC assessment premiums and other insurance 2,393 1,811 Other taxes 4,119 4,124 Loan-related expenses 2,004 2,314 OREO and credit-related expenses 511 413 Amortization of intangible assets 3,897 4,053 Less: Loss on debt extinguishment 20,810 - Other expenses 6,349 8,062 Total noninterest expenses $ 121,668 $ 93,222 Less: Amortization of intangible assets 3,897 4,053 Less: Loss on debt extinguishment 20,810 - Total adjusted operating noninterest expenses $ 96,961 $ 89,169 Q4 2020 Noninterest Income and Noninterest Expense Noninterest Income Noninterest Expense Noninterest expense increased from the prior quarter to $121.7 million from $93.2 million due to: .. A $20.8 million loss on debt extinguishment resulting from the prepayment of long-term Federal Home Loan Bank advances in the fourth quarter .. Approximately $7.4 million in incremental performance based variable incentive compensation and profit-sharing expenses, including a $1.2 million contribution to the Company’s ESOP .. $790,000 in branch closure costs incurred in the fourth quarter compared to $2.6 million in the third quarter .. $883,000 in professional services driven by higher consulting fees due to LIBOR transition and other projects .. COVID-19 related expenses of $447,000 for the fourth quarter down from $639,000 in the third quarter .. An increase of $582,000 in FDIC premium due to the impact of the lower level of PPP loans on the Company’s assessment rate .. Third party expenses of approximately $716,000 incurred in the fourth quarter to process PPP loans for SBA forgiveness |
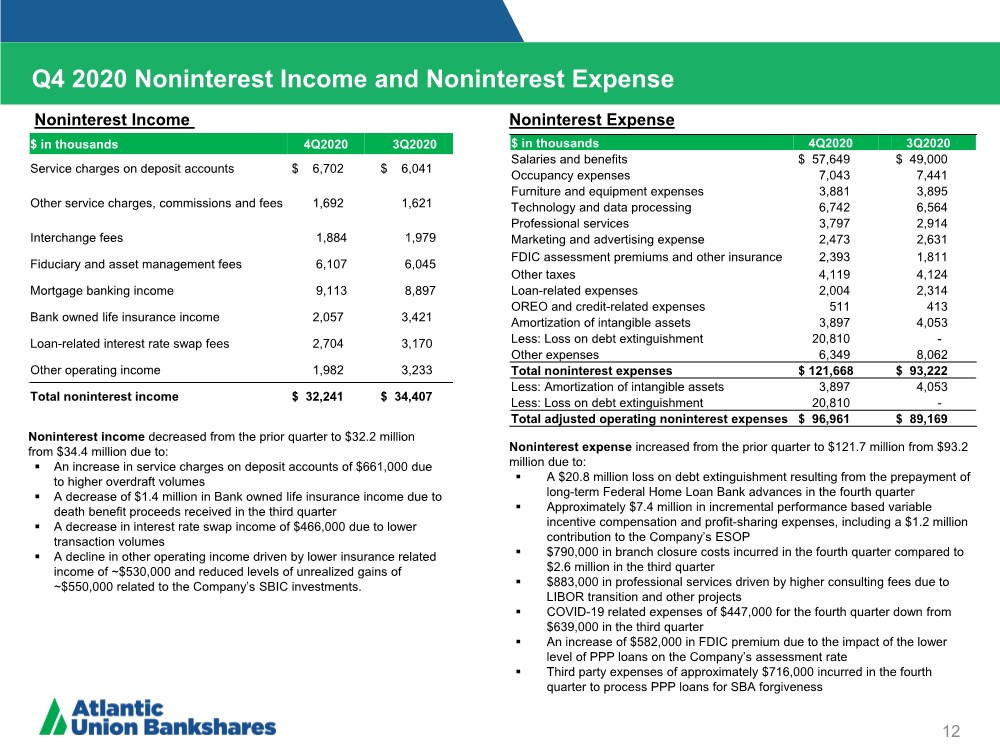
| 13 Q4 2020 Loan and Deposit Growth For non-GAAP financial measures, see reconciliation to most directly comparable GAAP measures in “Appendix – Reconciliation of Non-GAAP Disclosures” • At quarter end, loans held for investment decreased $361.9 million or 10% (annualized) from the prior quarter driven by ~ $430 million in PPP loans forgiven by the SBA • Excluding PPP loans, total loans grew by 1.8% (annualized) • For the fourth quarter, total Commercial loans grew ~4.0% on an annualized basis excluding PPP loans driven by growth in equipment finance loan balances and an increase in revolving lines of credit balances as the line utilization rate ticked up 1.8% from the prior quarter to 25.6% • Consumer loans declined ~8% annualized in the quarter driven by net attrition in the mortgage and home equity line loan portfolios and third party consumer balance run-off partially offset by growth in indirect auto balances • Average loan yields increased 15 basis points during the quarter primarily due to increased PPP fee accretion income resulting from SBA forgiven PPP loans during the fourth quarter • Deposits increased $146.7 million, or ~4% (annualized) in the fourth quarter from the prior quarter due to higher NOW accounts, savings accounts and time deposit balances partially offset by declines in money market and demand deposits • Low cost transaction accounts comprised 51% of total deposit balances at the end of the fourth quarter which is in-line with the third quarter levels • The cost of deposits declined by 9 basis points during the quarter due to the positive impact from favorable changes in the overall deposit mix between quarters as well as continued repricing of interest-bearing deposits as market interest rates remained historically low Deposit Growth (Dollars in thousands) 4Q2020 3Q2020 Annualized Growth NOW accounts 3,621,181 3,460,480 18.5% Money market accounts 4,248,335 4,269,696 -2.0% Savings accounts 904,095 861,685 19.6% Time deposits > $250,000 654,224 633,252 13.2% Other time deposits 1,926,227 1,930,320 -0.8% Total Time deposits 2,580,451 2,563,572 2.6% Total interest-bearing deposits 11,354,062 11,155,433 7.1% Demand deposits 4,368,703 4,420,665 -4.7% Total deposits $15,722,765 $15,576,098 3.7% Average Cost of Deposits 0.30% 0.39% Loan to Deposit Ratio 89.2% 92.3% Loan Growth (Dollars in thousands) 4Q2020 3Q2020 Annualized Growth Commercial & Industrial, ex PPP $ 2,095,236 $ 1,956,934 28.1% Commercial real estate - owner occupied 2,128,909 2,107,333 4.1% Other Commercial, ex PPP 478,677 472,822 4.9% Total Commercial & Industrial, ex PPP 4,702,822 4,537,089 14.5% Commercial real estate - non-owner occupied 3,657,562 3,497,929 18.2% Construction and land development 925,798 1,207,190 -92.7% Multifamily real estate 814,745 731,582 45.2% Residential 1-4 Family - Commercial 671,949 696,944 -14.3% Total CRE & Construction 6,070,054 6,133,645 -4.1% Total Commercial Loans, ex PPP 10,772,876 10,670,734 3.8% Residential 1-4 Family - Consumer 822,866 830,144 -3.5% Residential 1-4 Family - Revolving 596,996 618,320 -13.7% Auto 401,324 387,417 14.3% Consumer 247,730 276,023 -40.8% Total Consumer Loans 2,068,916 2,111,904 -8.1% PPP loans 1,179,522 1,600,577 -104.7% Total Loans Held for Investment 14,021,314 14,383,215 -10.0% Less: PPP Loans 1,179,522 1,600,577 -104.7% Total Loans Held for Investment, ex PPP $ 12,841,792 $ 12,782,638 1.8% Average Loan Yield 3.99% 3.84% Average Loan Yield, excl PPP 4.44% 4.34% |
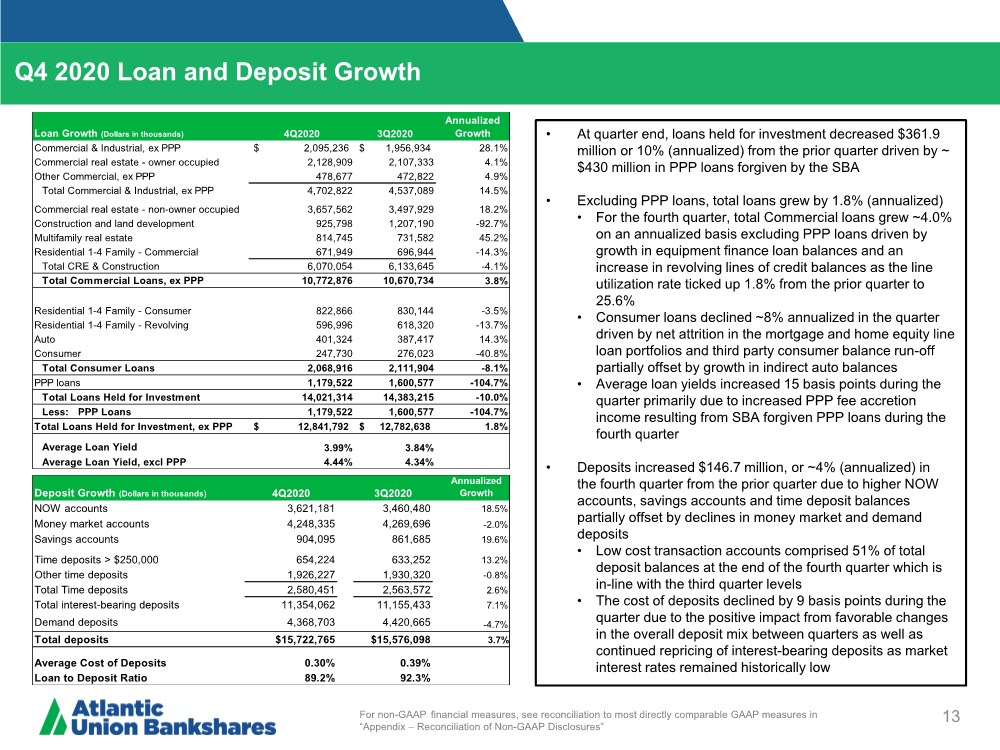
| Strong Liquidity Position and Multiple Sources of Liquidity 14 • Strong liquidity metrics: ~$7.6 billion in cash, unpledged securities, and secured and unsecured borrowing capacity as of December 31, 2020. Loans to Total Deposits Ratio of 89% at December 31, 2020 • Paycheck Protection Program loans of approximately $1.2 billion outstanding at 12/31/2020 are being funded with deposits and wholesale borrowings. During the fourth quarter the Company paid off the $190 million it had borrowed from the Federal Reserve’s Paycheck Protection Program Liquidity Facility (PPPLF) in the third quarter • Holding company cash of $116.7 million with available dividend capacity (net of current year’s dividends paid) of $273 million from bank to holding company without prior regulatory approval Liquidity Sources (December 31, 2020) Amount ($mm) Total Cash and Cash Equivalents $493 Unpledged Investment Securities (market value) $1,949 FHLB Borrowing Availability $2,813 Fed Discount Window Availability $251 PPP Liquidity Facility Availability $1,197 Fed Funds Lines $847 Line of Credit at Correspondent Bank $25 Total Liquidity Sources $7,575 |
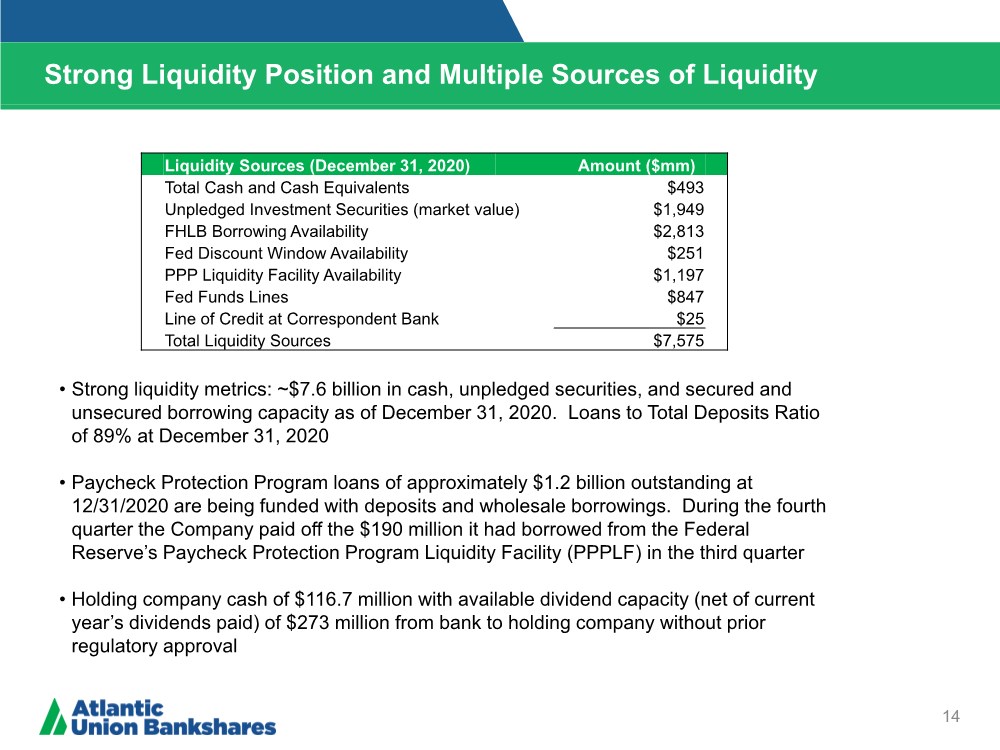
| Strong Capital Position at December 31, 2020 15 Capital Ratio Regulatory Well Capitalized Atlantic Union Bankshares* Atlantic Union Bank* Common Equity Tier 1 Ratio (CET1) 7.0% 10.3% 12.4% Tier 1 Capital Ratio 8.5% 11.4% 12.4% Total Risk Based Capital Ratio 10.5% 14.0% 13.1% Leverage Ratio 5.0% 8.9% 9.7% Tangible Common Equity Ratio (non- GAAP)4 - 8.3% 10.0% *Capital information presented herein is based on estimates and subject to change pending the Company’s filing of its regulatory reports Stress Testing • As a matter of sound enterprise risk management practice, the Company periodically conducts capital, credit and liquidity stress tests for scenarios such as the current operating environment • Results from these internal stress tests provides confidence that throughout the pandemic crisis AUB will remain well- capitalized and that it has the necessary liquidity and access to multiple funding sources to meet the challenges of COVID-19 Capital Management • Atlantic Union capital management objectives are to: • Maintain designation as a “well capitalized” institution • Ensure capital levels are commensurate with the Company’s risk profile, capital stress test projections, and strategic plan objectives • Tangible common equity above 8.5% is considered excess capital assuming “well capitalized” regulatory capital ratios are maintained. • Excess capital can be deployed for share repurchases, higher shareholder dividends and/or acquisitions • The Company’s capital ratios are well above regulatory well capitalized levels as of 12/31/2020 • During the fourth quarter, the Company paid dividends of $0.25 per common share and $171.88 per outstanding share of Series A Preferred Stock Figures may not foot due to rounding 4) Non-GAAP financial measure. For non-GAAP financial measures, see reconciliation to most directly comparable GAAP measures in “Appendix – Reconciliation of Non-GAAP Disclosures” Quarterly Roll Forward Common Equity Tier 1 Ratio Tangible Common Equity Ratio4 Tangible Book Value per Share4 At 9/30/2020 10.05% 7.91% $19.13 Pre-Provision Net Income 0.31% 0.24% 0.57 After-Tax Provision 0.08% 0.06% 0.15 CECL Transition Adjustment (1) -0.02% -- -- Common Dividends (2) -0.13% -0.10% (0.25) AOCI -- 0.04% 0.11 Other 0.06% 0.03% 0.08 Asset Growth -0.07% 0.13% -- At 12/31/20 - Reported 10.26% 8.31% $19.78 PPP Loan Balances Impact (3) -- 0.57% -- At 12/31/20 - Excluding PPP Balances 10.26% 8.88% $19.78 (1) 25% of the increase in ACL as compared to the Day 1 estimate of CECL (2) 25 cents per share (3) Approximately $1.2 billion |
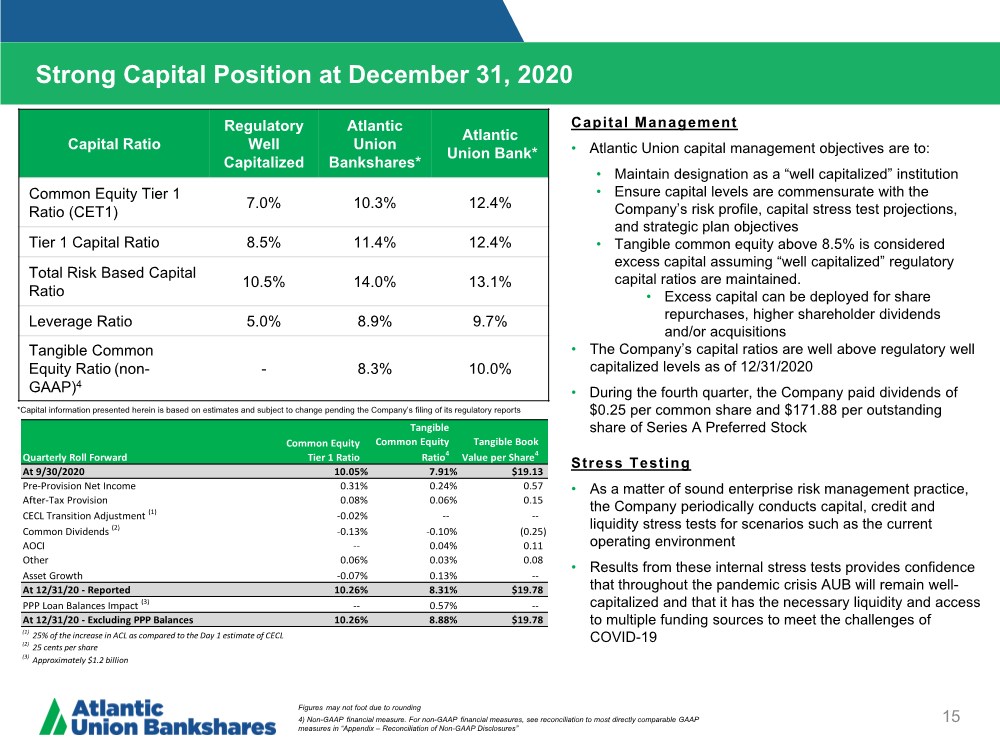
| Appendix |
| Reconciliation of Non-GAAP Disclosures 17 Operating Earnings Per Share The Company has provided supplemental performance measures on a tax-equivalent, tangible, operating, adjusted, or pre-tax pre-provision basis. These non-GAAP financial measures are supplements to GAAP, which is used to prepare the Company’s financial statements, and should not be considered in isolation or as a substitute for comparable measures calculated in accordance with GAAP. In addition, the Company’s non-GAAP financial measures may not be comparable to non-GAAP financial measures of other companies. The Company uses the non-GAAP financial measures discussed herein in its analysis of the Company’s performance. The Company’s management believes that these non-GAAP financial measures provide additional understanding of ongoing operations, enhance comparability of results of operations with prior periods and show the effects of significant gains and charges in the periods presented without the impact of items or events that may obscure trends in the Company’s underlying performance. |
| Reconciliation of Non-GAAP Disclosures 18 Operating Earnings Per Share Adjusted operating measures exclude the after-tax effect of merger and rebranding-related costs unrelated to the Company’s normal operations. In addition, adjusted operating measures now exclude the gains or losses related to balance sheet repositioning (principally composed of gains and losses on debt extinguishment) and gains or losses on sale of securities. The Company believes these non-GAAP adjusted measures provide investors with important information about the combined economic results of the organization’s operations Additionally, the Company believes that return on tangible common equity (ROTCE) is a meaningful supplement to GAAP financial measures and useful to investors because it measures the performance of a business consistently across time without regard to whether components of the business were acquired or developed internally. (Dollars in thousands, except per share amounts) 4Q2020 3Q2020 2020 2019 Net income Net Income (GAAP) 59,430 $ 61,000 $ 158,228 $ 193,528 $ Plus: Merger and rebranding-related costs, net of tax - - - 27,395 Plus: Net losses related to balance sheet repositioning, net of tax 16,440 - 25,979 12,953 Less: Gain on sale of securities, net of tax - 14 9,712 6,063 Adjusted operating earnings (non-GAAP) 75,870 $ 60,986 $ 174,495 $ 227,813 $ Less: Dividends on preferred stock 2,967 2,691 5,658 - Adjusted operating earnings available to common shareholders (non-GAAP) 72,903 $ 58,295 $ 168,837 $ 227,813 $ Earnings per share (EPS) Weighted average common shares outstanding, diluted 78,740,351 78,725,346 78,875,668 80,263,557 EPS available to common shareholders, diluted (GAAP) 0.72 $ 0.74 $ 1.93 $ 2.41 $ Adjusted operating EPS available to common shareholders, diluted (non-GAAP) 0.93 $ 0.74 $ 2.14 $ 2.84 $ Return on assets (ROA) Average assets 19,817,318 $ 19,785,167 $ 19,083,853 $ 16,840,310 $ ROA (GAAP) 1.19% 1.23% 0.83% 1.15% Adjusted operating ROA (non-GAAP) 1.52% 1.23% 0.91% 1.35% Return on equity (ROE) Adjusted operating earnings available to common shareholders (non-GAAP) 72,903 $ 58,295 $ 168,837 $ 227,813 $ Plus: Amortization of intangibles, tax effected 3,079 3,202 13,093 14,632 Net operating earnings available to common shareholders before amortization of intangibles (non-GAAP) 75,982 $ 61,497 $ 181,930 $ 242,445 $ Average common equity (GAAP) 2,679,170 $ 2,648,777 $ 2,576,372 $ 2,451,435 $ Less: Average intangible assets 994,591 998,576 1,000,654 991,926 Less: Average perpetual preferred stock 166,356 166,353 93,658 - Average tangible common equity (non-GAAP) 1,518,223 $ 1,483,848 $ 1,482,060 $ 1,459,509 $ ROE (GAAP) 8.82% 9.16% 6.14% 7.89% Return on tangible common equity (ROTCE) Net Income available to common shareholders (GAAP) 56,463 $ 58,309 $ 152,570 $ 193,528 $ Plus: Amortization of intangibles, tax effected 3,079 3,202 13,093 14,632 Net Income available to common shareholdes before amortization of intangibles (non- GAAP) 59,542 $ 61,511 $ 165,663 $ 208,160 $ ROTCE 15.60% 16.49% 11.18% 14.26% Adjusted operating ROTCE (non-GAAP) 19.91% 16.49% 12.28% 16.61% ADJUSTED OPERATING EARNINGS & FINANCIAL METRICS For the three months ended For the years ended December 31, |
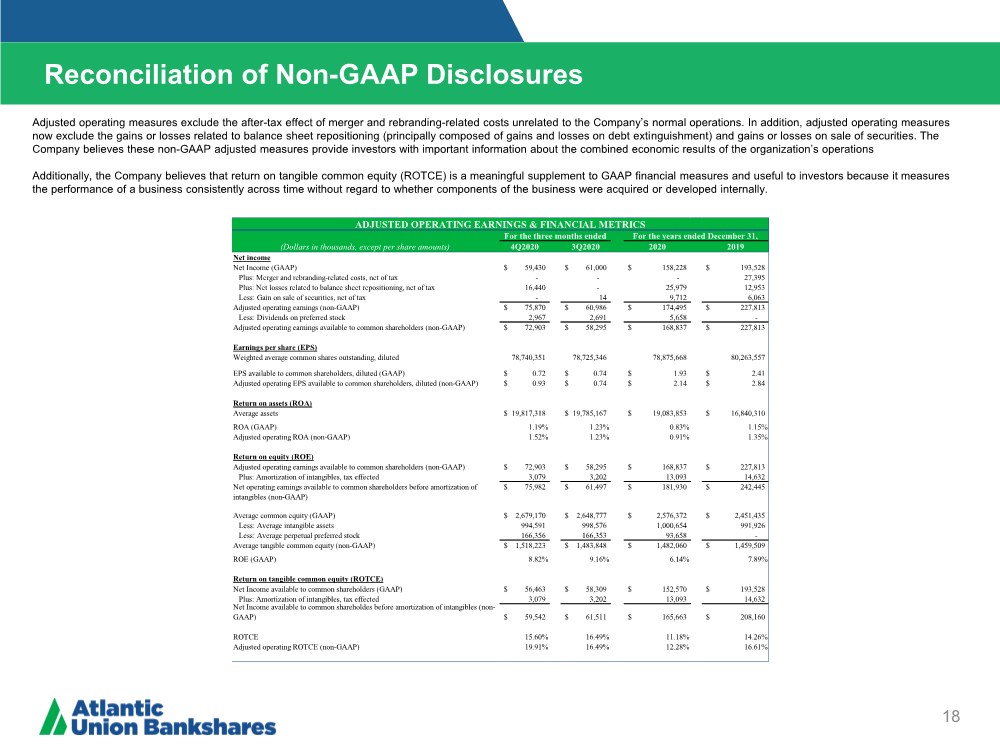
| Reconciliation of Non-GAAP Disclosures 19 Operating Earnings Per Share Pre-tax pre-provision adjusted earnings excludes the provision for credit losses, which can fluctuate significantly from period-to-period under the recently adopted CECL methodology, merger and rebranding-related costs, income tax expense, gains or losses related to balance sheet repositioning (principally composed of gains and losses on debt extinguishment), and gains or losses on sale of securities. The Company believes this adjusted measure provides investors with important information about the combined economic results of the organization’s operations. (Dollars in thousands, except per share amounts) 4Q2020 3Q2020 2020 2019 Net income Net income (GAAP) 59,430 $ 61,000 $ 158,228 $ 193,528 $ Plus: Provision for credit losses (13,813) 6,558 87,141 21,092 Plus: Income tax expense 10,560 11,008 28,066 37,557 Plus: Merger and rebranding-related costs - - - 34,279 Plus: Net losses related to balance sheet repositioning 20,810 - 32,885 16,397 Less: Gain on sale of securities - 18 12,294 7,675 PTPP adjusted operating earnings (non-GAAP) 76,987 $ 78,548 $ 294,026 $ 295,178 $ PRE-TAX PRE-PROVISION ADJUSTED OPERATING EARNINGS For the three months ended For the years ended December 31, |
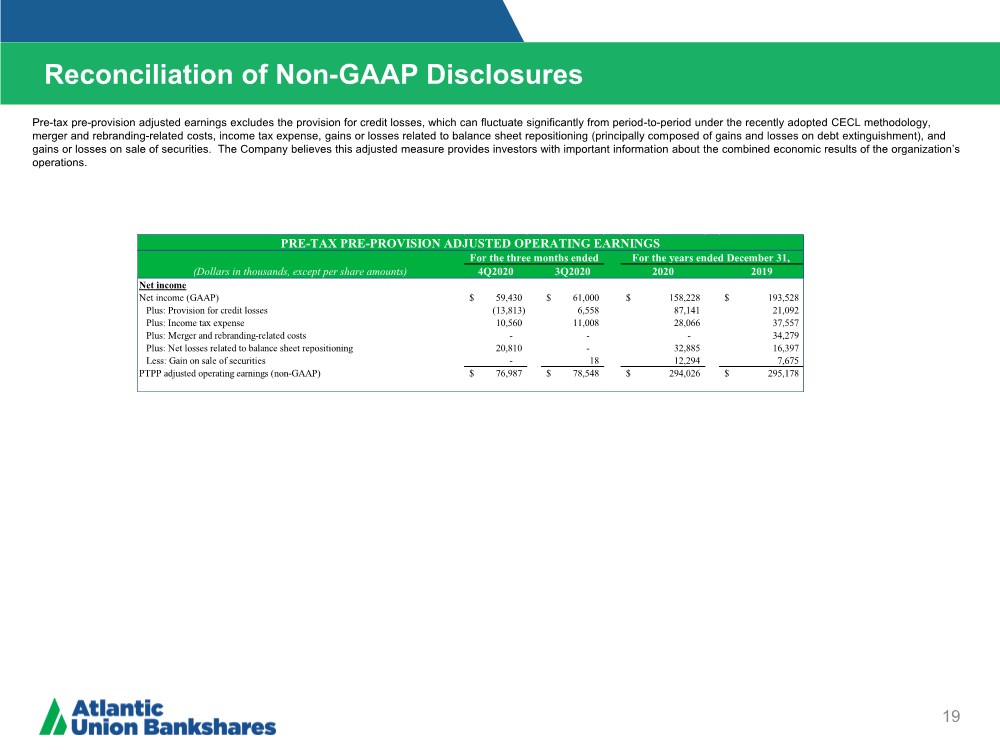
| Reconciliation of Non-GAAP Disclosures 20 Operating Earnings Per Share The adjusted operating efficiency ratio (FTE) excludes the amortization of intangible assets, merger and rebranding-related costs and gains or losses related to balance sheet repositioning (principally composed of gains and losses on debt extinguishment). This measure is similar to the measure utilized by the Company when analyzing corporate performance and is also similar to the measure utilized for incentive compensation. The Company believes this adjusted measure provides investors with important information about the combined economic results of the organization’s operations. (Dollars in thousands) 4Q2020 3Q2020 2020 2019 Noninterest expense (GAAP) 121,668 $ 93,222 $ 413,349 $ 418,340 $ Less: Merger-related costs - - - 27,824 Less: Rebranding costs - - - 6,455 Less: Amortization of intangible assets 3,897 4,053 16,574 18,521 Less: Losses related to balance sheet repositioning 20,810 - 31,116 16,397 Adjusted operating noninterest expense (non-GAAP) 96,961 $ 89,169 $ 365,659 $ 349,143 $ Net interest income (GAAP) 145,604 $ 137,381 $ 555,298 $ 537,872 $ Net interest income (FTE) (non-GAAP) 148,688 140,282 566,845 548,993 Noninterest income (GAAP) 32,241 $ 34,407 $ 131,486 $ 132,815 $ Less: Gains related to balance sheet repositioning - - (1,769) - Less: Gain on sale of securities - 18 12,294 7,675 Operating noninterest income (non-GAAP) 32,241 $ 34,389 $ 120,961 $ 125,140 $ Efficiency ratio (GAAP) 68.41% 54.27% 60.19% 62.37% Adjusted operating efficiency ratio (FTE) (non-GAAP) 53.59% 51.05% 53.16% 51.79% For the three months ended For the years ended December 31, ADJUSTED OPERATING EFFICIENCY RATIO |
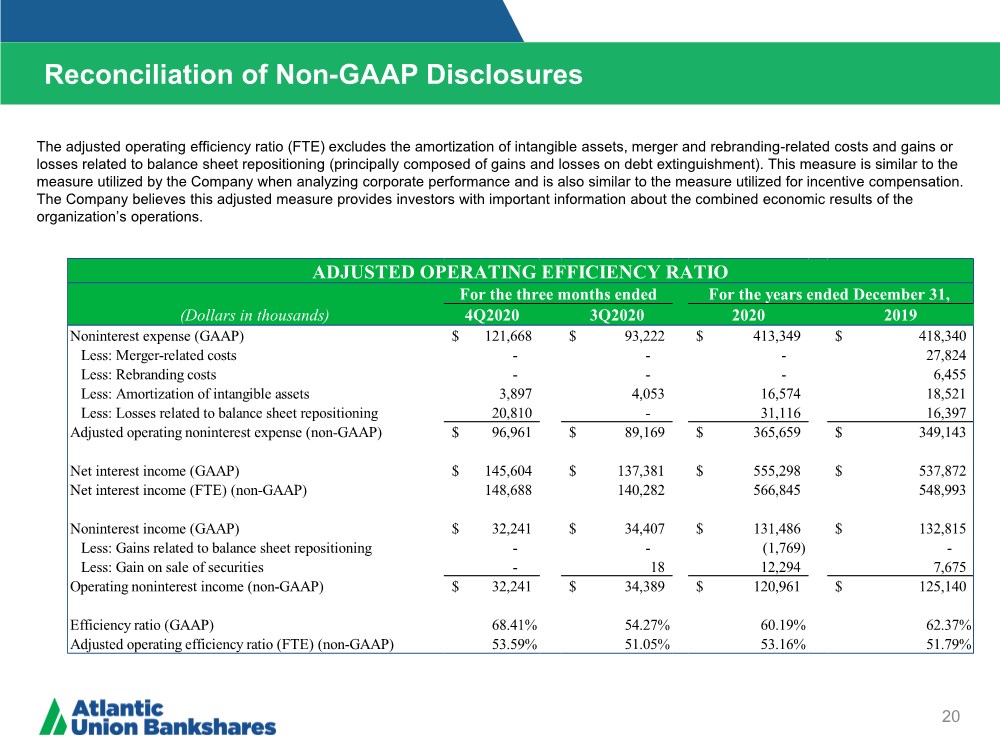
| Reconciliation of Non-GAAP Disclosures 21 Operating Earnings Per Share Net interest income (FTE), which is used in computing net interest margin (FTE), provides valuable additional insight into the net interest margin by adjusting for differences in tax treatment of interest income sources. The entire FTE adjustment is attributable to interest income on earning assets, which is used in computing yield on earning assets. Interest expense and the related cost of interest-bearing liabilities and cost of funds ratios are not affected by the FTE components. For the years ended December 31, (Dollars in thousands) 4Q2020 3Q2020 2020 2019 Net interest income (GAAP) 145,604 $ 137,381 $ 555,298 $ 537,872 $ FTE adjustment 3,084 2,901 11,547 11,121 Net interest income (FTE) (non-GAAP) 148,688 $ 140,282 $ 566,845 $ 548,993 $ Average earning assets 17,801,490 $ 17,748,152 $ 17,058,795 $ 14,881,142 $ Net interest margin (GAAP) 3.25% 3.08% 3.26% 3.61% Net interest margin (FTE) 3.32% 3.14% 3.32% 3.69% For the three months ended NET INTEREST MARGIN |
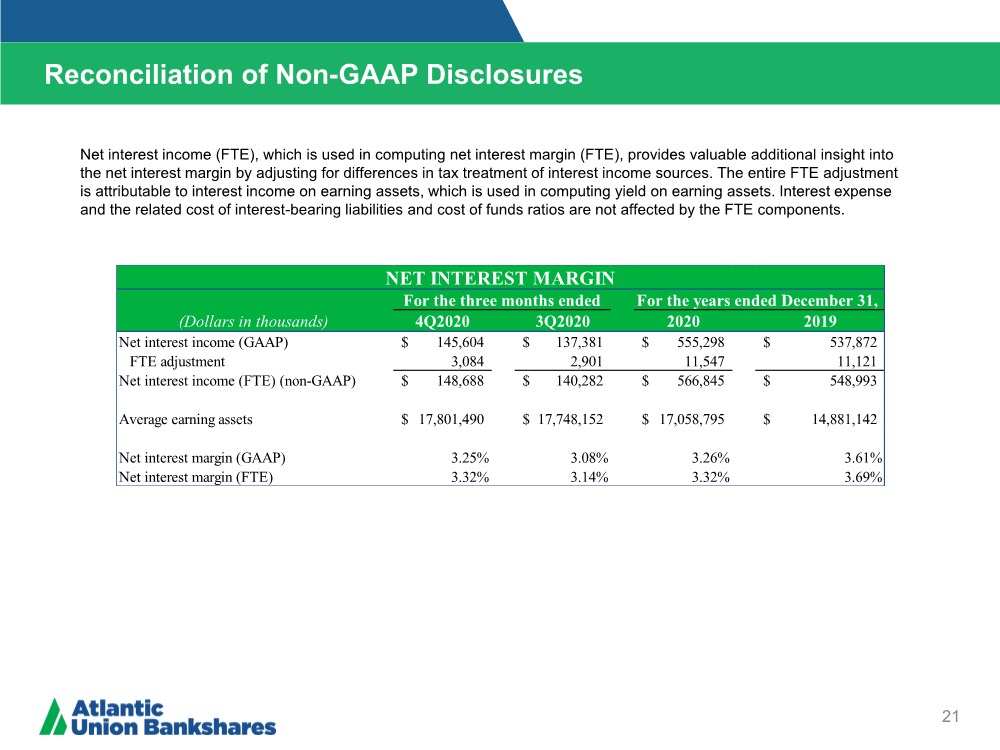
| Reconciliation of Non-GAAP Disclosures 22 Operating Earnings Per Share Tangible common equity is used in the calculation of certain profitability, capital, and per share ratios. The Company believes tangible common equity and the related ratios are meaningful measures of capital adequacy because they provide a meaningful base for period-to-period and company-to-company comparisons, which the Company believes will assist investors in assessing the capital of the Company and its ability to absorb potential losses. (Dollars in thousands) Atlantic Union Bankshares Atlantic Union Bank Assets (GAAP) 19,628,449 $ 19,578,173 $ Less: Intangible assets 992,745 992,745 Tangible assets (non-GAAP) 18,635,704 $ 18,585,428 $ Less: PPP loans 1,179,522 Tangible assets, excl PPP (non-GAAP) 17,456,182 $ Common equity (GAAP) 2,542,133 $ 2,847,657 $ Less: Intangible assets 992,745 992,746 Tangible common equity (non-GAAP) 1,549,388 $ 1,854,911 $ Common equity to assets (GAAP) 13.0% 14.5% Tangible common equity to tangible assets (non-GAAP) 8.3% 10.0% Tangible common equity to tangible assets, excl PPP (non-GAAP) 8.9% Book value per common share (GAAP) 32.46 $ Tangible book value per common share (non-GAAP) 19.78 $ TANGIBLE COMMON EQUITY As of December 31, 2020 |
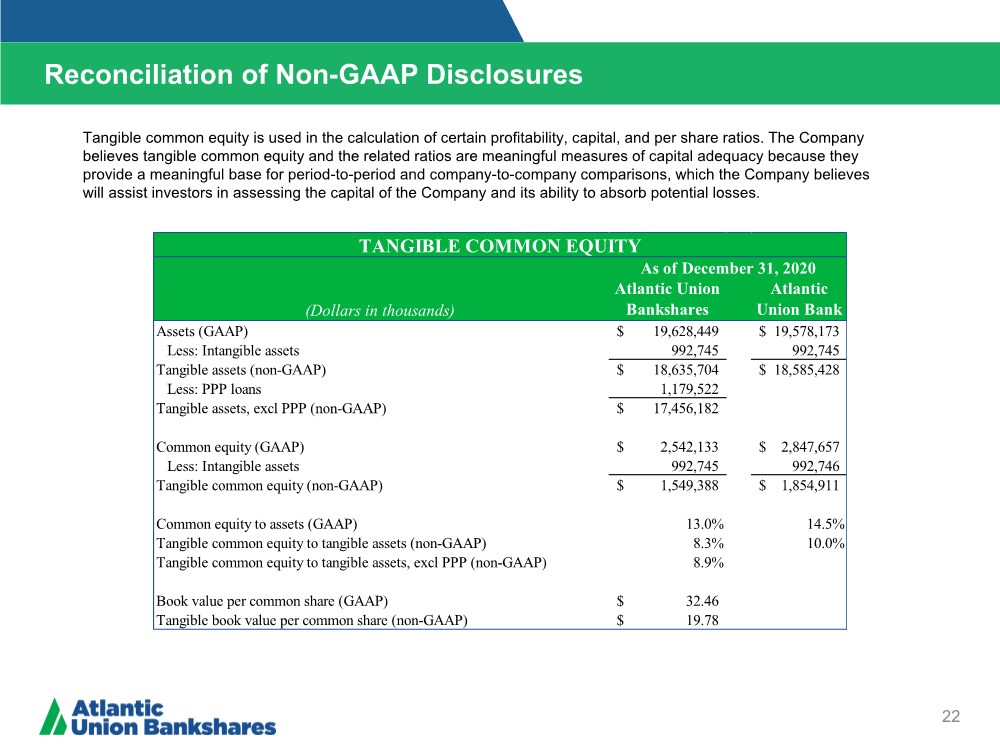
| Reconciliation of Non-GAAP Disclosures 23 ($ IN THOUSANDS) Operating Earnings Per Share PPP adjustment impact excludes the SBA guaranteed loans funded during 2020. The Company believes loans held for investment (net of deferred fees and costs), excluding PPP is useful to investors as it provides more clarity on the Company’s organic growth. The Company believes that ALLL as a percentage of loans held for investment (net of deferred fees and costs), excluding PPP, is useful to investors because of the size of the Company’s PPP originations and the impact of the embedded credit enhancement provided by the SBA guarantee. (Dollars in thousands) As of December 31, 2020 As of September 30, 2020 Allowance for loan losses (ALLL) 160,540 $ 174,122 $ Reserve for unfunded commitment (RUC) 10,000 12,000 Allowance for credit losses (ACL) 170,540 $ 186,122 $ Total loans held for investment (GAAP) 14,021,314 $ 14,383,215 $ Less: PPP adjustments 1,179,522 1,600,577 Total loans held for investment, excluding PPP (non-GAAP) 12,841,792 $ 12,782,638 $ ALLL to total loans held for investment (GAAP) 1.14% 1.21% ALLL to total loans held for investment, excluding PPP (non-GAAP) 1.25% 1.36% RUC to total loans held for investment (GAAP) 0.07% 0.08% RUC to total loans held for investment, excluding PPP (non-GAAP) 0.08% 0.09% ACL to total loans held for investment (GAAP) 1.22% 1.29% ACL to total loans held for investment, excluding PPP (non-GAAP) 1.33% 1.46% ALLOWANCE FOR CREDIT LOSSES RATIO |