
AWI 8-K
Armstrong World Industries Inc (AWI)
UNITED STATES
SECURITIES AND EXCHANGE COMMISSION
Washington, D.C. 20549
FORM
CURRENT REPORT
Pursuant to Section 13 or 15(d) of the Securities Exchange Act of 1934
Date of Report (Date of earliest event reported):
(Exact name of registrant as specified in its charter)
|
|
|
|
|
|
|
(State or other jurisdiction of incorporation or organization) |
|
(Commission File Number) |
|
(IRS Employer Identification No.) |
|
|
|
|
|
|
|
|
|
|
||
|
(Address of principal executive offices) |
|
(Zip Code) |
||
Registrant’s telephone number, including area code:
NA
(Former name or former address if changed since last report.)
Check the appropriate box below if the Form 8-K filing is intended to simultaneously satisfy the filing obligation of
|
|
Written communications pursuant to Rule 425 under the Securities Act (17 CFR 230.425) |
|
|
Soliciting material pursuant to Rule 14a-12 under the Exchange Act (17 CFR 240.14a-12) |
|
|
Pre-commencement communications pursuant to Rule 14d-2(b) under the Exchange Act (17 CFR 240.14d-2(b)) |
|
|
Pre-commencement communications pursuant to Rule 13e-4(c) under the Exchange Act (17 CFR 240.13e-4(c)) |
Securities registered pursuant to Section 12(b) of the Act:
|
Title of each class |
|
Trading Symbol(s) |
|
Name of each exchange on which registered |
Common Stock, $0.01 par value per share |
|
|
|
|
Indicate by check mark whether the registrant is an emerging growth company as defined in Rule 405 of the Securities Act of 1933 (§ 230.405 of this chapter) or Rule 12b-2 of the Securities Exchange Act of 1934 (§ 240.12b-2 of this chapter).
Emerging growth company
If an emerging growth company, indicate by check mark if the registrant has elected not to use the extended transition period for complying with any new or revised financial accounting standards provided pursuant to Section 13(a) of the Exchange Act. ◻
Section 2 - Financial Information
Item 2.02 Results of Operations and Financial Condition.
On April 27, 2020, Armstrong World Industries, Inc. (the “Company”) issued a press release announcing its first quarter 2020 consolidated financial results, and withdrawing its previously announced earnings guidance for fiscal year 2020. The full text of the press release is attached hereto as Exhibit 99.1.
The information in Item 2.02 of this Current Report on Form 8-K, including Exhibit 99.1, is being furnished herewith and shall not be deemed “filed” for the purposes of Section 18 of the Securities Exchange Act of 1934, as amended (the “Exchange Act”), or otherwise subject to the liabilities of that section, nor shall it be deemed incorporated by reference into any filing under the Securities Act of 1933, as amended (the “Act”), or the Exchange Act, except as expressly set forth by specific reference in such filing.
Section 7 – Regulation FD
Item 7.01 Regulation FD Disclosure.
On April 27, 2020, the Company issued a press release announcing that it will report its first quarter 2020 consolidated financial results via a webcast and conference call on Monday, April 27, 2020 at 11:00 a.m. Eastern Time which can be accessed through the “Investors” section of the Company’s website, www.armstrongceilings.com. During this report, the Company will reference a slide presentation, a copy of which is attached hereto as Exhibit 99.2 and incorporated herein by reference.
The information in Item 7.01 of this Current Report on Form 8-K, including Exhibit 99.2, is being furnished herewith and shall not be deemed “filed” for the purposes of Section 18 of the Exchange Act, or otherwise subject to the liabilities of that section, nor shall it be deemed incorporated by reference into any filing under the Act, or the Exchange Act, except as expressly set forth by specific reference in such filing.
Caution Concerning Forward-Looking Statements
This Current Report on Form 8-K includes certain forward-looking statements within the meaning of Section 27A of the Securities Act, and Section 21E of the Exchange Act. Such forward-looking statements include, but are not limited to, statements about the plans, objectives, expectations and intentions of the Company, including the consummation of the Sale, and other statements that are not historical facts. These statements are based on the current expectations and beliefs of the Company’s management, and are subject to uncertainty and changes in circumstances. The Company cautions readers that any forward-looking information is not a guarantee of future performance and that actual results may vary materially from those expressed or implied by the statements herein, due to changes in economic, business, competitive, technological, strategic or other regulatory factors, as well as factors affecting the operation of the business of the Company. More detailed information about certain of these and other factors may be found in filings by the Company with the U.S. Securities and Exchange Commission, including its most recent Annual Report on Form 10-K in the sections entitled “Caution Concerning Forward-Looking Statements” and “Risk Factors”, Quarterly Reports on Form 10-Q, and Current Reports on Form 8-K. Various factors could cause actual results to differ from those set forth in the forward-looking statements including, without limitation, the risk that the anticipated benefits from the Sale may not be fully realized or may take longer to realize than expected. The Company is under no obligation to, and expressly disclaims any obligation to, update or alter the forward-looking statements contained in this document, whether as a result of new information, future events or otherwise.
Section 9 – Financial Statements and Exhibits
Item 9.01 Financial Statements and Exhibits.
(d) Exhibits
2
|
|
|
|
|
No. 99.2 |
|
Earnings Call Presentation First Quarter 2020 dated April 27, 2020 |
|
|
|
|
|
No. 104 |
|
Cover Page Interactive Data File (embedded within the Inline XBRL document) |
3
SIGNATURES
Pursuant to the requirements of the Securities Exchange Act of 1934, the registrant has duly caused this report to be signed on its behalf by the undersigned hereunto duly authorized.
|
ARMSTRONG WORLD INDUSTRIES, INC. |
||
|
|
|
|
|
By: |
|
/s/ Mark A. Hershey |
|
|
|
Mark A. Hershey |
|
|
|
Senior Vice President, General Counsel, Secretary and Chief Compliance Officer |
Date: April 27, 2020
4
Exhibit 99.1

Armstrong World Industries Reports
First Quarter 2020 Results
Key Highlights
|
|
• |
Net sales of $248.7 million, up 3% versus the prior year quarter |
|
|
• |
Operating income of $76.0 million, up 39% versus the prior year quarter |
|
|
• |
$1 billion pension risk transfer results in $374.4 million non-cash charge to non-operating income |
|
|
• |
Adjusted EBITDA and EPS grew 5% and 10%, respectively, versus the prior year quarter |
|
|
• |
Withdrawing and suspending 2020 guidance due to COVID-19 |
LANCASTER, Pa., April 27, 2020 -- Armstrong World Industries, Inc. (NYSE:AWI), a leader in the design, innovation and manufacture of commercial and residential ceiling, wall and suspension system solutions, today reported financial results for the first quarter of 2020.
COVID-19 Update
In response to the COVID-19 pandemic, AWI has taken numerous actions to support all of its stakeholders, while operating within CDC guidelines and maintaining a safe working environment for employees and business partners. Manufacturing operations have altered crewing; adjusted line speeds; reconfigured work and common areas; installed barriers to maintain recommended social distancing; and increased the frequency with which facilities are cleaned. Corporate and sales staffs are working remotely, and an extended emergency leave process has been instituted and made available for all employees. The Company remains focused on serving and supporting customers, particularly priority healthcare projects.
As demand slowed in April, AWI implemented appropriate measures to reduce production and manage inventory while maintaining service levels. The Company is also working closely with suppliers and distribution partners to ensure adequate raw material and finished goods inventory at appropriate locations. To date, there have been no significant interruptions in the supply chain. Overall, all of the Company’s responsive actions are being deployed and phased in a manner designed to maximize safety, minimize disruption and allow for timely and full scale reactivation when market and public health conditions improve.
AWI has also taken steps to address the financial implications of COVID-19, including restricting travel, reducing spending, suspending hiring, deferring non-essential and non-growth oriented capital investments,

and temporarily suspending the Company’s share repurchase program. AWI is withdrawing and suspending 2020 financial guidance, but its regular quarterly dividend remains unchanged.
“While first quarter results came in broadly as expected, our focus has shifted to the impacts of COVID-19 and the safety and well-being of all of our stakeholders,” said Vic Grizzle, President and CEO of AWI. “Safety has always been a non-negotiable operating principle at Armstrong, and while COVID-19 presents significant challenges, our teams are delivering. Our employees have worked methodically, collaboratively and with great agility to adapt our processes to enable social distancing and to operate within CDC guidelines across our entire network. Staying closely connected with customers and employees remains a top priority, and teams in every part of our business are using digital tools to manage this transition as seamlessly as possible. I’m particularly proud of how our manufacturing teams have been able to prioritize and serve a surge in orders that support life-sustaining healthcare facility expansions and re-purposing spaces for medical use. Armstrong is a strong company with a 160 year history, an experienced leadership team, a strong balance sheet, and a deep set of core values. Armstrong has weathered crises in the past and we will weather this one as well.”
First Quarter Results from Continuing Operations
|
(Dollar amounts in millions except per-share data) |
|
For the Three Months Ended March 31, |
|
|
|
|
|
|||||
|
|
|
2020 |
|
|
2019 |
|
|
Change |
|
|||
|
Net sales |
|
$ |
248.7 |
|
|
$ |
242.1 |
|
|
|
2.7 |
% |
|
Operating income |
|
$ |
76.0 |
|
|
$ |
54.7 |
|
|
|
38.9 |
% |
|
(Loss) earnings from continuing operations |
|
$ |
(222.6 |
) |
|
$ |
36.4 |
|
|
Unfavorable |
|
|
|
Diluted (loss) earnings per share |
|
$ |
(4.64 |
) |
|
$ |
0.73 |
|
|
Unfavorable |
|
|
Net sales increased compared to the prior year quarter, driven by higher volumes in the Architectural Specialties segment as well as higher Mineral Fiber volume, partially offset by unfavorable Mineral Fiber AUV. The unfavorable AUV was driven by mix due to volume growth in Latin America and the Big Box channel which have lower AUV than the Mineral Fiber segment average.
Operating income increased over the prior year quarter, driven primarily by lower SG&A expenses, volume growth in the Architectural Specialties segment and manufacturing productivity. The decrease in SG&A expenses for the first quarter of 2020 as compared to the same period in 2019 was driven primarily by a $20 million decrease in legal and professional fees incurred in the first quarter of 2019.
Additional (non-GAAP*) Financial Metrics from Continuing Operations
|
(Dollar amounts in millions except per-share data) |
|
For the Three Months Ended March 31, |
|
|
|
|
|
|||||
|
|
|
2020 |
|
|
2019 |
|
|
Change |
|
|||
|
Adjusted EBITDA |
|
$ |
97 |
|
|
$ |
92 |
|
|
|
5.2 |
% |
|
Adjusted net income |
|
$ |
54 |
|
|
$ |
49 |
|
|
|
8.7 |
% |
|
Adjusted diluted earnings per share |
|
$ |
1.10 |
|
|
$ |
1.00 |
|
|
|
10.4 |
% |
|
Adjusted free cash flow |
|
$ |
36 |
|
|
$ |
18 |
|
|
|
105.6 |
% |
* The Company uses the above non-GAAP adjusted measures in managing the business and believes the adjustments provide meaningful comparisons of operating performance between periods. The Company also believes that the adjustments help users of our financial information understand the effect of those
2
adjusted items on our selected reported results and provide useful alternative measurements of performance. See Supplemental Reconciliations of GAAP to non-GAAP results (below) for a breakdown of the adjustments and a reconciliation of the selected reported results to these non-GAAP measures.
|
(Dollar amounts in millions) |
|
For the Three Months Ended March 31, |
|
|
|
|
|
|||||
|
|
|
2020 |
|
|
2019 |
|
|
Change |
|
|||
|
Adjusted EBITDA |
|
|
|
|
|
|
|
|
|
|
|
|
|
Mineral Fiber |
|
$ |
87 |
|
|
$ |
82 |
|
|
|
6.1 |
% |
|
Architectural Specialties |
|
|
10 |
|
|
|
10 |
|
|
|
(2.1 |
)% |
|
Consolidated Adjusted EBITDA |
|
$ |
97 |
|
|
$ |
92 |
|
|
|
5.2 |
% |
Consolidated adjusted EBITDA improved 5% in the first quarter when compared to the same prior year period, driven by volume growth in the Architectural Specialties segment, manufacturing productivity, and lower SG&A expenses, offset partially by unfavorable AUV fall-through to profit in the Mineral Fiber segment.
First Quarter Segment Highlights
Mineral Fiber
|
(Dollar amounts in millions) |
|
For the Three Months Ended March 31, |
|
|
|
|
|
|||||
|
|
|
2020 |
|
|
2019 |
|
|
Change |
|
|||
|
Net sales (as reported) |
|
$ |
197.7 |
|
|
$ |
196.7 |
|
|
|
0.5 |
% |
|
Operating income (as reported) |
|
$ |
70.0 |
|
|
$ |
47.6 |
|
|
|
47.1 |
% |
|
Adjusted EBITDA |
|
$ |
87 |
|
|
$ |
82 |
|
|
|
6.1 |
% |
Mineral Fiber net sales increased due to higher volume, partially offset by unfavorable AUV. The unfavorable AUV was driven by mix due to volume growth in Latin America and the Big Box channel which have lower AUV than the Mineral Fiber segment average.
Operating income increased in the first quarter of 2020 primarily due to a $20 million decrease in legal and professional fees associated with the 2019 litigation matter with Rockfon and a $4 million decrease in manufacturing costs. Also contributing to the increase in operating income was lower incentive and deferred compensation expenses partially offset by the negative impact of lower AUV driven by mix due to volume growth in Latin America and the Big Box channel.
Architectural Specialties
|
(Dollar amounts in millions) |
|
For the Three Months Ended March 31, |
|
|
|
|
|
|||||
|
|
|
2020 |
|
|
2019 |
|
|
Change |
|
|||
|
Net sales (as reported) |
|
$ |
51.0 |
|
|
$ |
45.4 |
|
|
|
12.3 |
% |
|
Operating income (as reported) |
|
$ |
7.5 |
|
|
$ |
9.2 |
|
|
|
(18.1 |
)% |
|
Adjusted EBITDA |
|
$ |
10 |
|
|
$ |
10 |
|
|
|
(2.1 |
)% |
Net sales in Architectural Specialties grew from higher sales volume from the recent acquisition of ACGI, partially offset by unfavorable project timing.
Operating income decreased due to additional investments in selling and design capacities and the integration of recent acquisitions, partially offset by the positive impact of higher sales volume.
3
Unallocated Corporate
Unallocated corporate expense of $1.5 million decreased from $2.1 million in the prior year quarter, primarily due to the absence of depreciation and amortization related to our idled mineral fiber plant in China.
Pension Plan Annuitization
During the first quarter of 2020, the Company entered into an agreement to transfer approximately $1 billion of outstanding retiree pension benefit obligations and administration related to approximately 10,000 retirees and beneficiaries under its U.S. Retirement Income Plan (“RIP”) to Athene Annuity and Life Company and Athene Annuity & Life Assurance Company of New York. As a result of the transaction, the Company recorded a non-cash expense of $374.4 million in the first quarter of 2020 as a component of non-operating expense to reflect a partial plan settlement charge. The Company did not make any cash contributions to the RIP as a result of the transaction.
Market Outlook and 2020 Guidance
“Given external uncertainty and the high levels of variability in our financial scenario modeling, we have withdrawn our financial guidance for 2020. We currently expect, however, to generate a free cash flow margin of 22-25% this fiscal year, consistent with the range of outcomes in our current 2020 models,” said Brian MacNeal, CFO of AWI. “With a strong balance sheet, ample liquidity, and no meaningful debt maturities until 2024, we are well positioned to navigate through the impact of COVID-19.”
Earnings Webcast
Management will host a live Internet broadcast beginning at 11:00 a.m. Eastern time today, to discuss first quarter 2020 results. This event will be broadcast live on the Company's website. To access the call and accompanying slide presentation, go to www.armstrongceilings.com and click Investors. The replay of this event will also be available on the Company's website for up to one year after the date of the call.
4
Uncertainties Affecting Forward-Looking Statements
Disclosures in this release, including without limitation, those relating to future financial results, market conditions and guidance, and in our other public documents and comments, contain forward-looking statements within the meaning of the Private Securities Litigation Reform Act of 1995. Those statements provide our future expectations or forecasts and can be identified by our use of words such as “anticipate,” “estimate,” “expect,” “project,” “intend,” “plan,” “believe,” “outlook,” “target,” “predict,” “may,” “will,” “would,” “could,” “should,” “seek,” and other words or phrases of similar meaning in connection with any discussion of future operating or financial performance. Forward-looking statements, by their nature, address matters that are uncertain and involve risks because they relate to events and depend on circumstances that may or may not occur in the future. As a result, our actual results may differ materially from our expected results and from those expressed in our forward-looking statements. A more detailed discussion of the risks and uncertainties that could cause our actual results to differ materially from those projected, anticipated or implied is included in the “Risk Factors” and “Management’s Discussion and Analysis” section of our report on Forms 10-K and 10-Q filed with the U.S. Securities and Exchange Commission (“SEC”). Forward-looking statements speak only as of the date they are made. We undertake no obligation to update any forward-looking statements beyond what is required under applicable securities law.
About Armstrong and Additional Information
More details on the Company’s performance can be found in its quarterly report on Form 10-Q for the quarter ended March 31, 2020 that the Company expects to file with the SEC today.
Armstrong World Industries, Inc. (AWI) is a leader in the design and manufacture of innovative commercial and residential ceiling, wall and suspension system solutions in the Americas. With over $1 billion in revenue, AWI has approximately 2,500 employees and a manufacturing network of 12 active facilities. For more information, visit www.armstrongceilings.com.
Additional forward looking non-GAAP metrics are available on the Company’s website at www.armstrongceilings.com under the Investors tab. The website is not part of this release and references to our website address in this release are intended to be inactive textual references only.
5
As Reported Financial Highlights
FINANCIAL HIGHLIGHTS
Armstrong World Industries, Inc. and Subsidiaries
(Amounts in millions, except for per-share amounts, quarterly data is unaudited)
|
|
|
|
|
For the Three Months Ended March 31, |
|
|||||
|
|
|
|
|
2020 |
|
|
2019 |
|
||
|
Net sales |
|
|
$ |
248.7 |
|
|
$ |
242.1 |
|
|
|
Cost of goods sold |
|
|
|
157.4 |
|
|
|
150.7 |
|
|
|
Gross profit |
|
|
|
91.3 |
|
|
|
91.4 |
|
|
|
Selling, general and administrative expenses |
|
|
|
34.8 |
|
|
|
55.6 |
|
|
|
Equity earnings from joint venture |
|
|
|
(19.5 |
) |
|
|
(18.9 |
) |
|
|
Operating income |
|
|
|
76.0 |
|
|
|
54.7 |
|
|
|
Interest expense |
|
|
|
6.7 |
|
|
|
10.4 |
|
|
|
Other non-operating expense (income), net |
|
|
|
369.4 |
|
|
|
(5.5 |
) |
|
|
(Loss) earnings from continuing operations before income taxes |
|
|
|
(300.1 |
) |
|
|
49.8 |
|
|
|
Income tax (benefit) expense |
|
|
|
(77.5 |
) |
|
|
13.4 |
|
|
|
(Loss) earnings from continuing operations |
|
|
|
(222.6 |
) |
|
|
36.4 |
|
|
|
Net (loss) gain from discontinued operations |
|
|
|
(3.6 |
) |
|
|
2.7 |
|
|
|
Net (loss) earnings |
|
|
$ |
(226.2 |
) |
|
$ |
39.1 |
|
|
|
|
|
|
|
|
|
|
|
|
|
|
|
(Loss) earnings per diluted share of common stock, continuing operations |
|
|
$ |
(4.64 |
) |
|
$ |
0.73 |
|
|
|
|
|
|
|
|
|
|
|
|
|
|
|
(Loss) earnings per diluted share of common stock, discontinued operations |
|
|
$ |
(0.07 |
) |
|
$ |
0.05 |
|
|
|
|
|
|
|
|
|
|
|
|
|
|
|
Net (loss) earnings per diluted share of common stock |
|
|
$ |
(4.71 |
) |
|
$ |
0.78 |
|
|
|
|
|
|
|
|
|
|
|
|
|
|
|
Average number of diluted common shares outstanding |
|
|
|
48.0 |
|
|
|
49.5 |
|
|
6
SEGMENT RESULTS
Armstrong World Industries, Inc. and Subsidiaries
(Amounts in millions)
(Unaudited)
|
|
|
Three Months Ended |
|
|||||
|
|
|
March 31, |
|
|||||
|
|
|
2020 |
|
|
2019 |
|
||
|
Net Sales |
|
|
|
|
|
|
|
|
|
Mineral Fiber |
|
$ |
197.7 |
|
|
$ |
196.7 |
|
|
Architectural Specialties |
|
|
51.0 |
|
|
|
45.4 |
|
|
Total net sales |
|
$ |
248.7 |
|
|
$ |
242.1 |
|
|
|
|
|
|
|
|
|
|
|
|
|
|
Three Months Ended |
|
|||||
|
|
|
March 31, |
|
|||||
|
|
|
2020 |
|
|
2019 |
|
||
|
Segment operating income (loss) |
|
|
|
|
|
|
|
|
|
Mineral Fiber |
|
$ |
70.0 |
|
|
$ |
47.6 |
|
|
Architectural Specialties |
|
|
7.5 |
|
|
|
9.2 |
|
|
Unallocated Corporate |
|
|
(1.5 |
) |
|
|
(2.1 |
) |
|
Total consolidated operating income |
|
$ |
76.0 |
|
|
$ |
54.7 |
|
Selected Balance Sheet Information
(Amounts in millions)
|
|
|
March 31, 2020 |
|
|
December 31, 2019 |
|
||
|
Assets |
|
|
|
|
|
|
|
|
|
Current assets |
|
$ |
345.4 |
|
|
$ |
244.4 |
|
|
Property, plant and equipment, net |
|
|
521.3 |
|
|
|
524.6 |
|
|
Other noncurrent assets |
|
|
723.6 |
|
|
|
724.3 |
|
|
Total assets |
|
$ |
1,590.3 |
|
|
$ |
1,493.3 |
|
|
Liabilities and shareholders’ equity |
|
|
|
|
|
|
|
|
|
Current liabilities |
|
$ |
169.8 |
|
|
$ |
155.2 |
|
|
Noncurrent liabilities |
|
|
1,050.1 |
|
|
|
973.2 |
|
|
Equity |
|
|
370.4 |
|
|
|
364.9 |
|
|
Total liabilities and shareholders’ equity |
|
$ |
1,590.3 |
|
|
$ |
1,493.3 |
|
7
Selected Cash Flow Information
(Amounts in millions)
(Unaudited)
|
|
|
For the Three Months Ended March 31, |
|
|||||
|
|
|
2020 |
|
|
2019 |
|
||
|
Net (loss) earnings |
|
$ |
(226.2 |
) |
|
$ |
39.1 |
|
|
Other adjustments to reconcile net (loss) earnings to net cash provided by operating activities |
|
|
283.4 |
|
|
|
(0.9 |
) |
|
Changes in operating assets and liabilities, net |
|
|
(31.5 |
) |
|
|
(23.5 |
) |
|
Net cash provided by operating activities |
|
|
25.7 |
|
|
|
14.7 |
|
|
Net cash provided by (used for) investing activities |
|
|
9.9 |
|
|
|
(38.0 |
) |
|
Net cash provided by (used for) financing activities |
|
|
66.8 |
|
|
|
(29.9 |
) |
|
Effect of exchange rate changes on cash and cash equivalents |
|
|
(0.8 |
) |
|
|
1.3 |
|
|
Net increase (decrease) in cash and cash equivalents |
|
|
101.6 |
|
|
|
(51.9 |
) |
|
Cash and cash equivalents at beginning of year |
|
|
45.3 |
|
|
|
335.7 |
|
|
Cash and cash equivalents at end of period |
|
$ |
146.9 |
|
|
$ |
283.8 |
|
Supplemental Reconciliations of GAAP to non-GAAP Results (unaudited)
(Amounts in millions, except per share data)
To supplement its consolidated financial statements presented in accordance with accounting principles generally accepted in the United States (“GAAP”), the Company provides additional measures of performance adjusted to exclude the impact of certain discrete expenses and income. Examples include plant closures, restructuring charges and related costs, impairments, separation costs, environmental site expenses and related insurance recoveries, and certain other gains and losses. The Company also excludes RIP income/expense in the non-GAAP results as it represents the actuarial net periodic benefit credit/cost recorded as a component of operating income. For all periods presented, the Company was not required and did not make cash contributions to the RIP based on guidelines established by the Pension Benefit Guaranty Corporation, nor does the Company expect to make cash contributions to the plan in 2020. Adjusted free cash flow is defined as cash from operating and investing activities, adjusted to remove the impact of cash used or proceeds received for acquisitions and divestitures, legacy environmental matters and litigation. The Company believes adjusted free cash flow is useful because it provides insight into the amount of cash that the Company generates for discretionary uses, after expenditures for capital commitments and adjustments for acquisitions and divestitures. The Company uses these adjusted performance measures in managing the business, including communications with its Board of Directors and employees, and believes that they provide users of this financial information with meaningful comparisons of operating performance between current results and results in prior periods. The Company believes that these non-GAAP financial measures are appropriate to enhance understanding of its past performance, as well as prospects for its future performance. A reconciliation of these adjustments to the most directly comparable GAAP measures is included in this release and on the Company’s website. These non-GAAP measures should not be considered in isolation or as a substitute for the most comparable GAAP measures. Non-GAAP financial measures utilized by the Company may not be comparable to non-GAAP financial measures used by other companies.
In the following charts, numbers may not sum due to rounding.
8
Consolidated Results From Continuing Operations – Adjusted EBITDA
|
|
|
For the Three Months Ended March 31, |
|
|||||
|
|
|
2020 |
|
|
2019 |
|
||
|
(Loss) earnings from continuing operations, As Reported |
|
$ |
(223 |
) |
|
$ |
36 |
|
|
(Less)/Add: Income tax (benefit) expense, as reported |
|
|
(78 |
) |
|
|
13 |
|
|
(Loss) earnings before tax, As Reported |
|
$ |
(300 |
) |
|
$ |
50 |
|
|
Add: Interest/other income and expense, net |
|
|
376 |
|
|
|
5 |
|
|
Operating Income, As Reported |
|
$ |
76 |
|
|
$ |
55 |
|
|
Add: RIP Cost (1) |
|
|
1 |
|
|
|
1 |
|
|
Add: Litigation Expense |
|
|
- |
|
|
|
20 |
|
|
Add: Net Environmental Expenses |
|
|
1 |
|
|
|
- |
|
|
Operating Income, Adjusted |
|
$ |
78 |
|
|
$ |
76 |
|
|
Add: D&A |
|
|
18 |
|
|
|
16 |
|
|
Adjusted EBITDA |
|
$ |
97 |
|
|
$ |
92 |
|
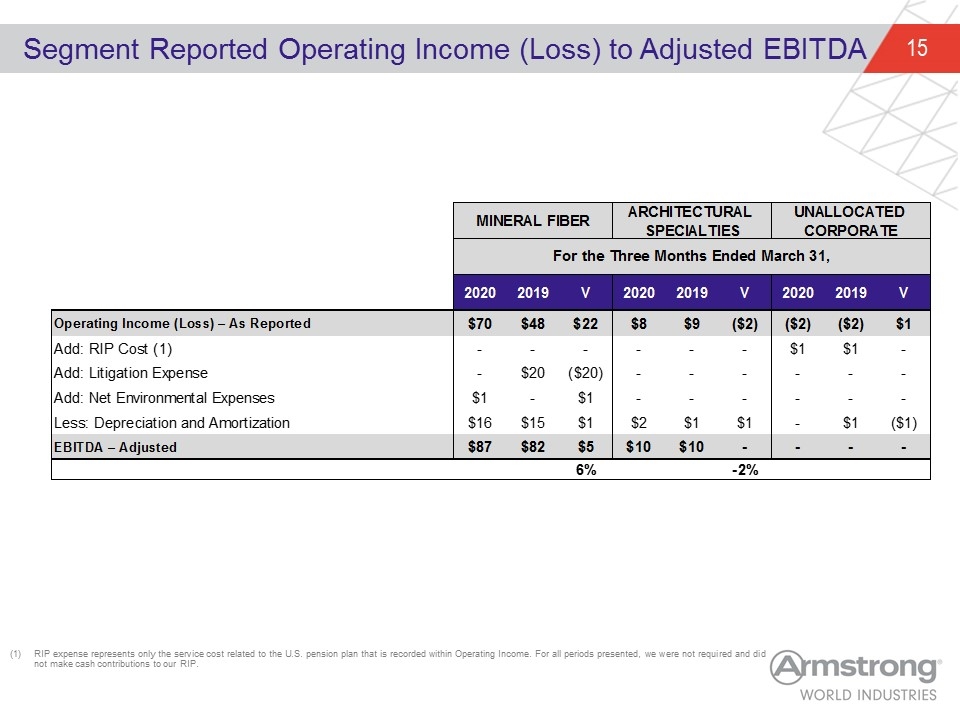
(1) U.S. pension expense represents only the service cost related to the RIP that is recorded within Operating Income. For all periods presented, we were not required and did not make cash contributions to our RIP.
Mineral Fiber
|
|
|
For the Three Months Ended March 31, |
|
|||||
|
|
|
2020 |
|
|
2019 |
|
||
|
Operating Income, As Reported |
|
$ |
70 |
|
|
$ |
48 |
|
|
Add: Litigation Expense (1) |
|
|
- |
|
|
|
20 |
|
|
Add: Net Environmental Expenses |
|
|
1 |
|
|
|
- |
|
|
Operating Income, Adjusted |
|
$ |
71 |
|
|
$ |
67 |
|
|
Add: D&A |
|
|
16 |
|
|
|
15 |
|
|
Adjusted EBITDA |
|
$ |
87 |
|
|
$ |
82 |
|
(1) Represents Rockfon litigation costs and settlement.
Architectural Specialties
|
|
|
For the Three Months Ended March 31, |
|
|||||
|
|
|
2020 |
|
|
2019 |
|
||
|
Operating Income, As Reported |
|
$ |
8 |
|
|
$ |
9 |
|
|
Add: D&A |
|
|
2 |
|
|
|
1 |
|
|
Adjusted EBITDA |
|
$ |
10 |
|
|
$ |
10 |
|
Unallocated Corporate
|
|
|
For the Three Months Ended March 31, |
|
|||||
|
|
|
2020 |
|
|
2019 |
|
||
|
Operating (Loss), As Reported |
|
$ |
(2 |
) |
|
$ |
(2 |
) |
|
Add: U.S. Pension Cost (1) |
|
|
1 |
|
|
|
1 |
|
|
Operating (Loss), Adjusted |
|
$ |
(0 |
) |
|
$ |
(1 |
) |
|
Add: D&A |
|
|
- |
|
|
|
1 |
|
|
Adjusted EBITDA |
|
$ |
- |
|
|
$ |
- |
|
(1) U.S. pension expense represents only the service cost related to the U.S. pension plan that is recorded within Operating Income. For all periods presented, we were not required and did not make cash contributions to our U.S. Retirement Income Plan.
9
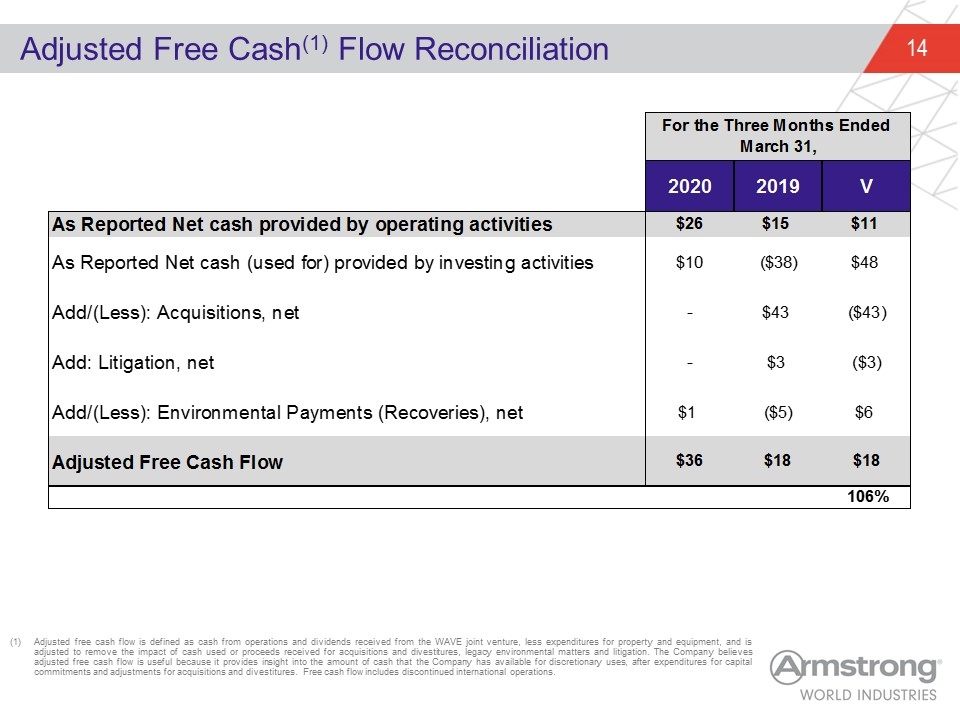
Adjusted Free Cash Flow
|
|
|
For the Three Months Ended March 31, |
|
|||||
|
|
|
2020 |
|
|
2019 |
|
||
|
Net cash provided by operations |
|
$ |
26 |
|
|
$ |
15 |
|
|
Net cash provided by (used for) investing activities |
|
|
10 |
|
|
|
(38 |
) |
|
Add: Acquisitions, net |
|
|
- |
|
|
|
43 |
|
|
Add: Litigation, net |
|
|
- |
|
|
|
3 |
|
|
Add/(Less): Environmental Payments (Recoveries), net |
|
|
1 |
|
|
|
(5 |
) |
|
Adjusted Free Cash Flow |
|
$ |
36 |
|
|
$ |
18 |
|
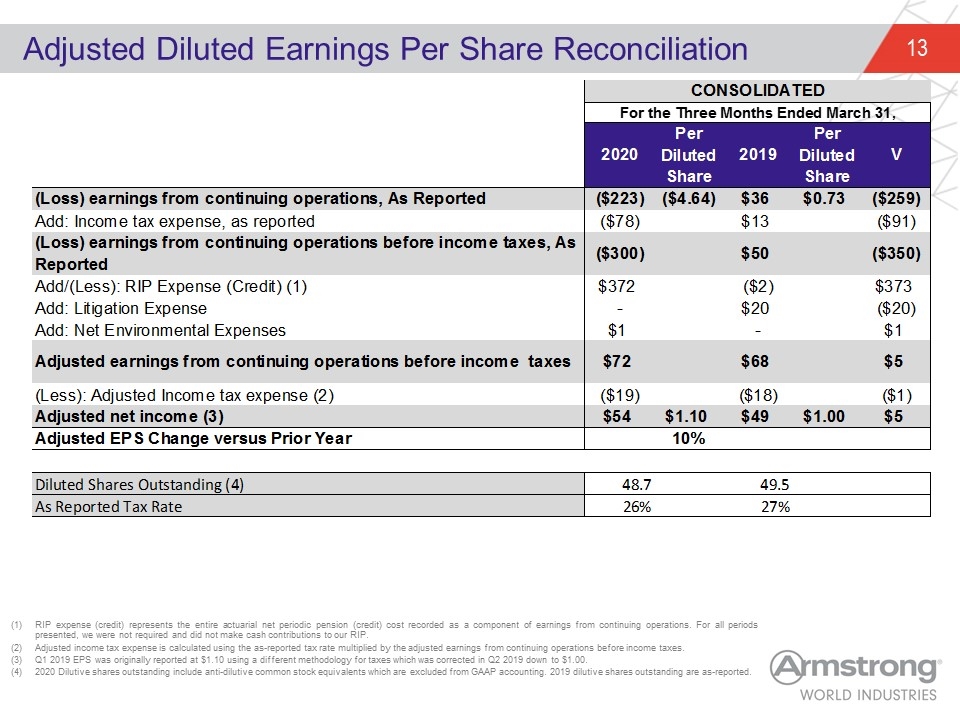
Consolidated Results From Continuing Operations – Adjusted Diluted Earnings Per Share
|
|
|
For the Three Months Ended March 31, |
|
|||||||||||||
|
|
|
2020 |
|
|
2019 |
|
||||||||||
|
|
|
Total |
|
|
Per Diluted Share |
|
|
Total |
|
|
Per Diluted Share |
|
||||
|
(Loss) earnings from continuing operations, As Reported |
|
$ |
(223 |
) |
|
$ |
(4.64 |
) |
|
$ |
36 |
|
|
$ |
0.73 |
|
|
Add: Income tax expense, as reported |
|
|
(78 |
) |
|
|
|
|
|
|
13 |
|
|
|
|
|
|
(Loss) earnings from continuing operations before income taxes, As Reported |
|
$ |
(300 |
) |
|
|
|
|
|
$ |
50 |
|
|
|
|
|
|
Add/(Less): RIP Expense (Credit) (1) |
|
|
372 |
|
|
|
|
|
|
|
(2 |
) |
|
|
|
|
|
Add: Litigation Expense |
|
|
- |
|
|
|
|
|
|
|
20 |
|
|
|
|
|
|
Add: Net Environmental Expenses |
|
|
1 |
|
|
|
|
|
|
|
- |
|
|
|
|
|
|
Adjusted earnings from continuing operations before income taxes |
|
$ |
72 |
|
|
|
|
|
|
$ |
68 |
|
|
|
|
|
|
(Less): Adjusted Income tax expense (2) |
|
|
(19 |
) |
|
|
|
|
|
|
(18 |
) |
|
|
|
|
|
Adjusted net income (3) |
|
$ |
54 |
|
|
$ |
1.10 |
|
|
$ |
49 |
|
|
$ |
1.00 |
|
|
Adjusted EPS Change versus Prior Year |
|
10% |
|
|
|
|
|
|
|
|
|
|||||
|
|
|
|
|
|
|
|
|
|
|
|
|
|
|
|
|
|
|
Diluted Shares Outstanding (4) |
|
48.7 |
|
|
49.5 |
|
||||||||||
|
As Reported Tax Rate |
|
26% |
|
|
27% |
|
||||||||||
|
|
|
|
|
|
|
|
|
|
|
|
|
|
|
|
|
|
(1) RIP expense (credit) represents the entire actuarial net periodic pension expense (credit) recorded as a component of earnings from continuing operations. For all periods presented, we were not required and did not make cash contributions to our RIP.
(2) Adjusted income tax expense is calculated using the as reported tax rate multiplied by the adjusted earnings from continuing operations before income taxes.
(3) Q1 2019 EPS was originally reported at $1.10 using a different methodology for taxes which was corrected in Q2 2019 down to $1.00.
(4) 2020 Dilutive shares outstanding include anti-dilutive common stock equivalents which are excluded from GAAP accounting. 2019 dilutive shares outstanding are as-reported.
10
Earnings Call Presentation 1st Quarter 2020 April 27, 2020 Exhibit 99.2
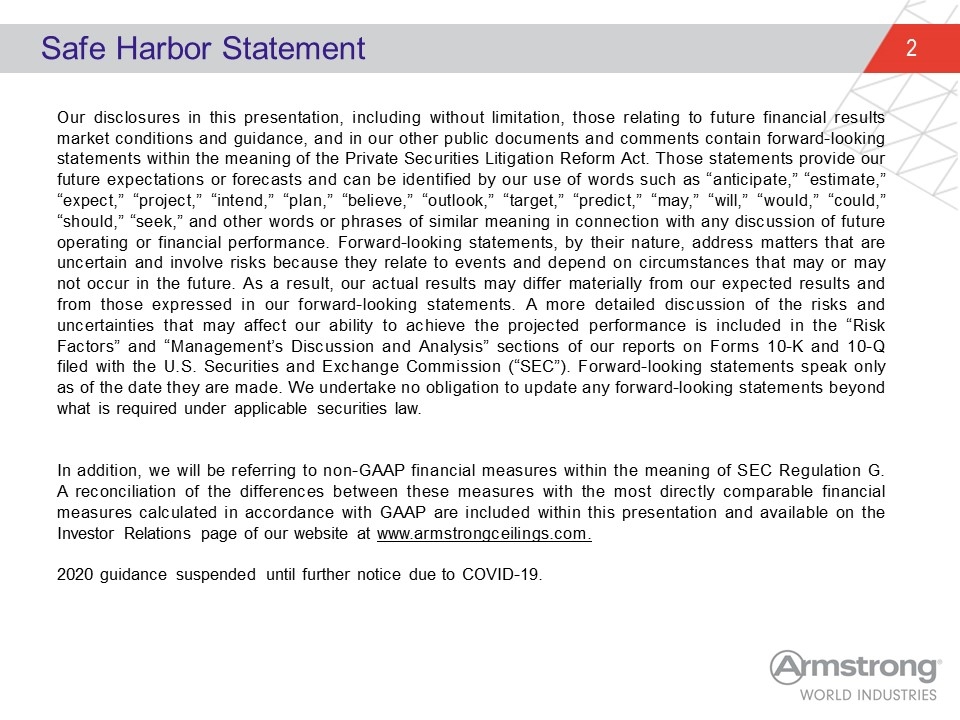
Our disclosures in this presentation, including without limitation, those relating to future financial results market conditions and guidance, and in our other public documents and comments contain forward-looking statements within the meaning of the Private Securities Litigation Reform Act. Those statements provide our future expectations or forecasts and can be identified by our use of words such as “anticipate,” “estimate,” “expect,” “project,” “intend,” “plan,” “believe,” “outlook,” “target,” “predict,” “may,” “will,” “would,” “could,” “should,” “seek,” and other words or phrases of similar meaning in connection with any discussion of future operating or financial performance. Forward-looking statements, by their nature, address matters that are uncertain and involve risks because they relate to events and depend on circumstances that may or may not occur in the future. As a result, our actual results may differ materially from our expected results and from those expressed in our forward-looking statements. A more detailed discussion of the risks and uncertainties that may affect our ability to achieve the projected performance is included in the “Risk Factors” and “Management’s Discussion and Analysis” sections of our reports on Forms 10-K and 10-Q filed with the U.S. Securities and Exchange Commission (“SEC”). Forward-looking statements speak only as of the date they are made. We undertake no obligation to update any forward-looking statements beyond what is required under applicable securities law. In addition, we will be referring to non-GAAP financial measures within the meaning of SEC Regulation G. A reconciliation of the differences between these measures with the most directly comparable financial measures calculated in accordance with GAAP are included within this presentation and available on the Investor Relations page of our website at www.armstrongceilings.com. 2020 guidance suspended until further notice due to COVID-19. Safe Harbor Statement
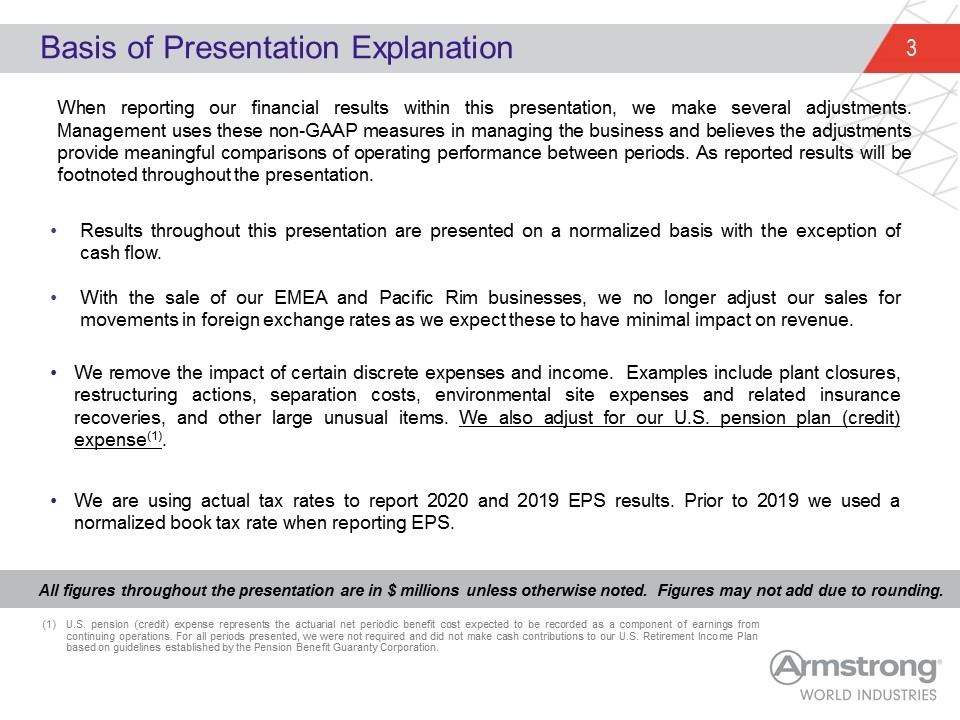
All figures throughout the presentation are in $ millions unless otherwise noted. Figures may not add due to rounding. When reporting our financial results within this presentation, we make several adjustments. Management uses these non-GAAP measures in managing the business and believes the adjustments provide meaningful comparisons of operating performance between periods. As reported results will be footnoted throughout the presentation. Basis of Presentation Explanation Results throughout this presentation are presented on a normalized basis with the exception of cash flow. With the sale of our EMEA and Pacific Rim businesses, we no longer adjust our sales for movements in foreign exchange rates as we expect these to have minimal impact on revenue. We remove the impact of certain discrete expenses and income. Examples include plant closures, restructuring actions, separation costs, environmental site expenses and related insurance recoveries, and other large unusual items. We also adjust for our U.S. pension plan (credit) expense(1). We are using actual tax rates to report 2020 and 2019 EPS results. Prior to 2019 we used a normalized book tax rate when reporting EPS. U.S. pension (credit) expense represents the actuarial net periodic benefit cost expected to be recorded as a component of earnings from continuing operations. For all periods presented, we were not required and did not make cash contributions to our U.S. Retirement Income Plan based on guidelines established by the Pension Benefit Guaranty Corporation.
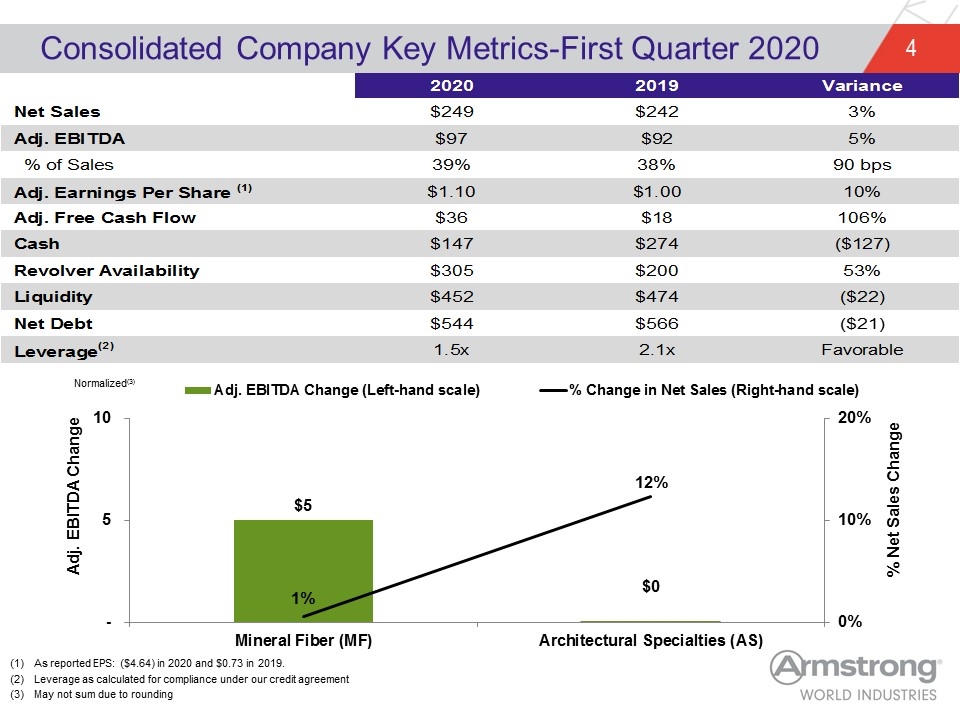
Consolidated Company Key Metrics-First Quarter 2020 As reported EPS: ($4.64) in 2020 and $0.73 in 2019. Leverage as calculated for compliance under our credit agreement May not sum due to rounding Normalized(3) $0 2020 2019 Variance Net Sales $248.7 $0 $242.1 2.7261462205700138E-2 Adj. EBITDA $96.609472999999994 $0 $91.8 $0 5.2390773420479375E-2 % of Sales 0.3884578729392843 0.379182156133829 90 bps hardcode watchout Adj. Earnings Per Share (1) $1.1026671862014512 $0.99841549073059932 0.10441714540563152 Adj. Free Cash Flow $36.400000000000006 $17.700000000000003 1.0564971751412429 Cash $147 $274 $-,127 Revolver Availability $305 $200 0.52500000000000002 Liquidity $452 $474 $-22 Net Debt $544 $566 $-21 Leverage(2) 1.5x 2.1x Favorable
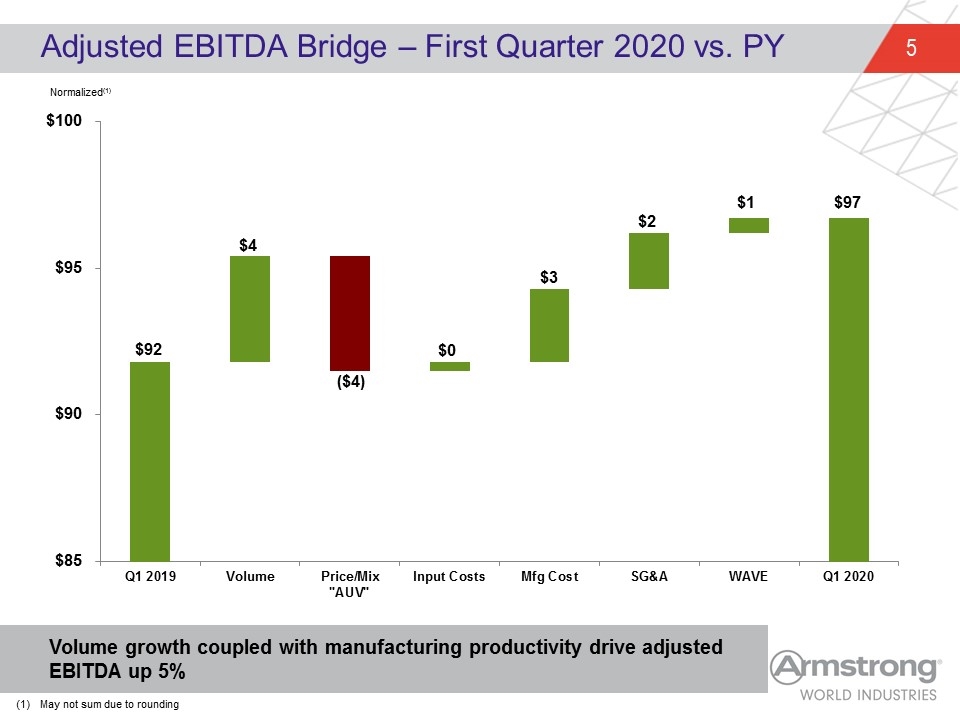
Adjusted EBITDA Bridge – First Quarter 2020 vs. PY $4 ($4) $0 $2 $3 $1 Volume growth coupled with manufacturing productivity drive adjusted EBITDA up 5% Normalized(1) May not sum due to rounding
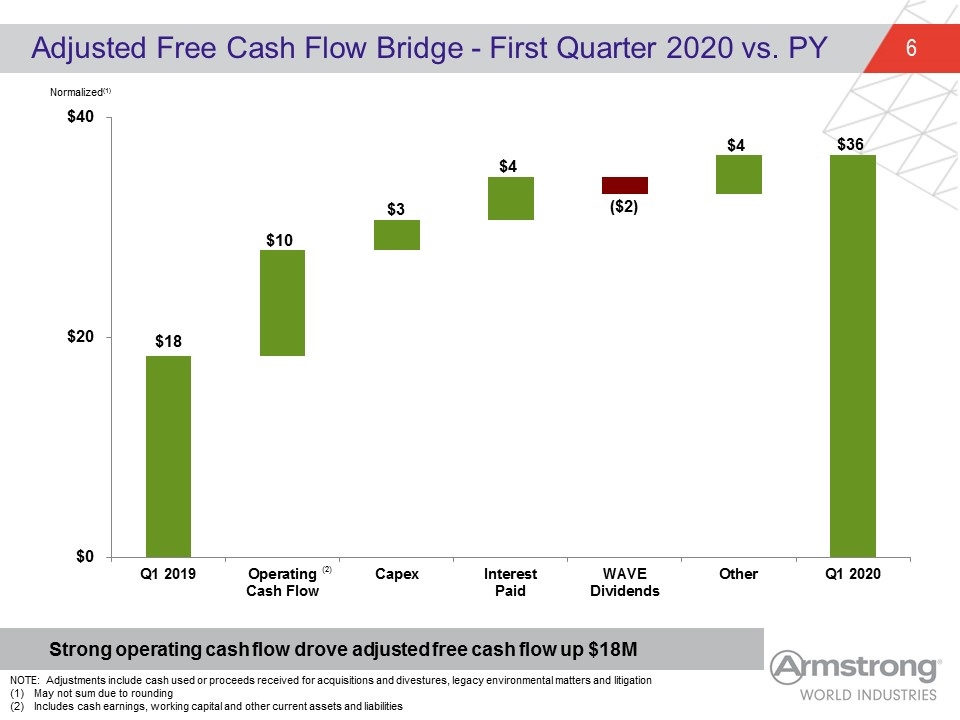
Adjusted Free Cash Flow Bridge - First Quarter 2020 vs. PY $3 Strong operating cash flow drove adjusted free cash flow up $18M $10 $4 $4 (2) NOTE: Adjustments include cash used or proceeds received for acquisitions and divestures, legacy environmental matters and litigation May not sum due to rounding Includes cash earnings, working capital and other current assets and liabilities Normalized(1) $36 ($2)
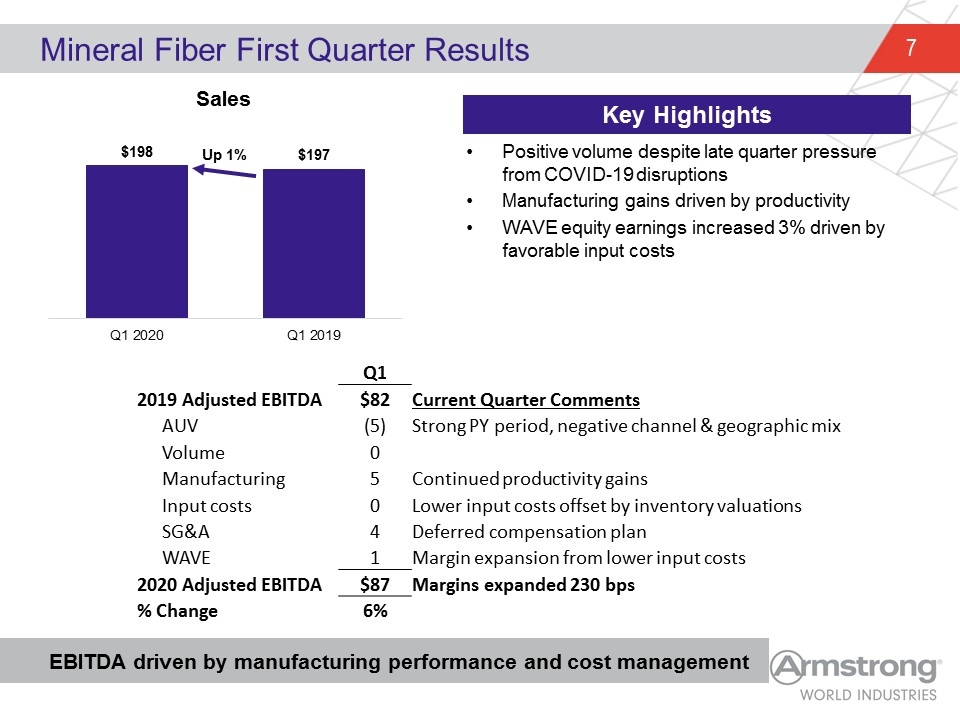
Positive volume despite late quarter pressure from COVID-19 disruptions Manufacturing gains driven by productivity WAVE equity earnings increased 3% driven by favorable input costs Mineral Fiber First Quarter Results EBITDA driven by manufacturing performance and cost management Key Highlights Q1 2019 Adjusted EBITDA $82 Current Quarter Comments AUV (5) Strong PY period, negative channel & geographic mix Volume 0 Manufacturing 5 Continued productivity gains Input costs 0 Lower input costs offset by inventory valuations SG&A 4 Deferred compensation plan WAVE 1 Margin expansion from lower input costs 2020 Adjusted EBITDA $87 Margins expanded 230 bps % Change 6%
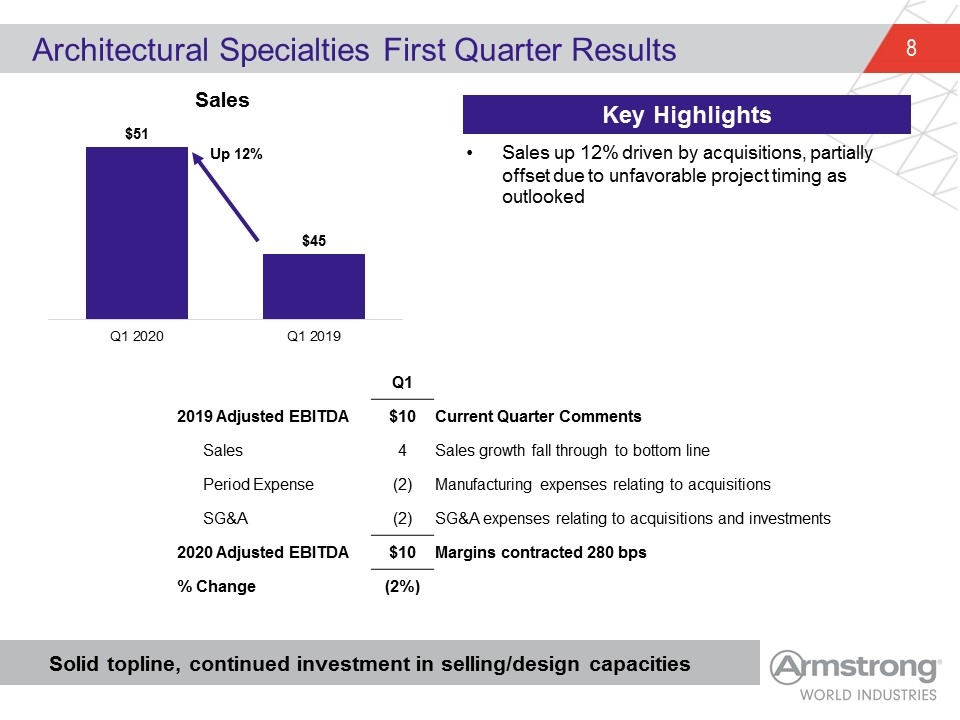
Sales up 12% driven by acquisitions, partially offset due to unfavorable project timing as outlooked Architectural Specialties First Quarter Results Solid topline, continued investment in selling/design capacities Key Highlights Q1 2019 Adjusted EBITDA $10 Current Quarter Comments Sales 4 Sales growth fall through to bottom line Period Expense (2) Manufacturing expenses relating to acquisitions SG&A (2) SG&A expenses relating to acquisitions and investments 2020 Adjusted EBITDA $10 Margins contracted 280 bps % Change (2%)
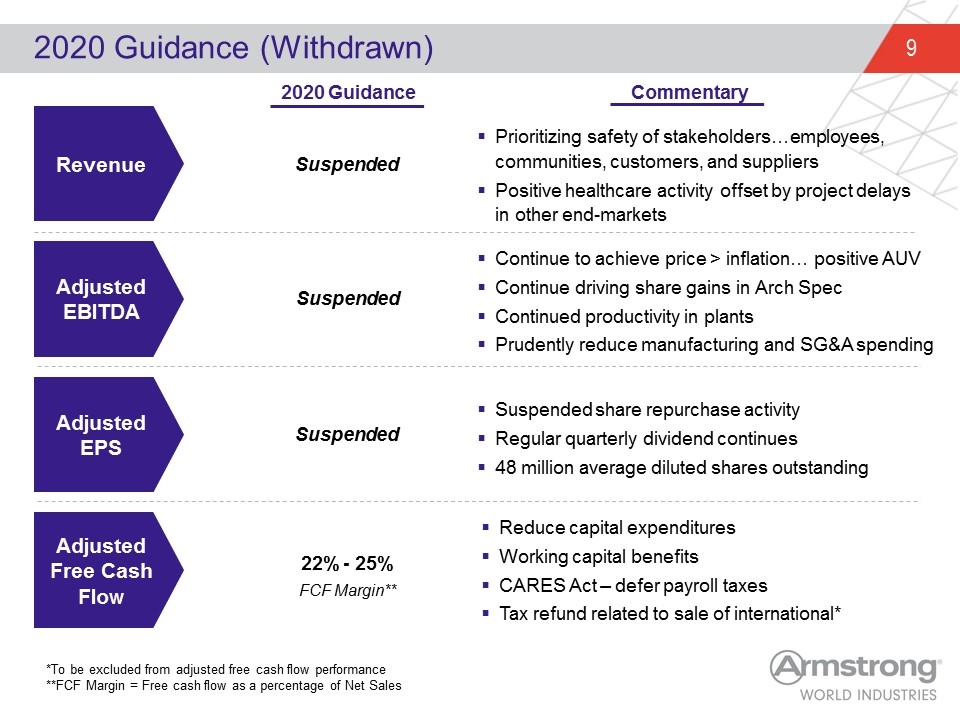
2020 Guidance (Withdrawn) Adjusted EBITDA Adjusted EPS Adjusted Free Cash Flow Revenue Suspended Prioritizing safety of stakeholders…employees, communities, customers, and suppliers Positive healthcare activity offset by project delays in other end-markets Continue to achieve price > inflation… positive AUV Continue driving share gains in Arch Spec Continued productivity in plants Prudently reduce manufacturing and SG&A spending Reduce capital expenditures Working capital benefits CARES Act – defer payroll taxes Tax refund related to sale of international* 2020 Guidance Suspended share repurchase activity Regular quarterly dividend continues 48 million average diluted shares outstanding Suspended Suspended Commentary *To be excluded from adjusted free cash flow performance **FCF Margin = Free cash flow as a percentage of Net Sales 22% - 25% FCF Margin**
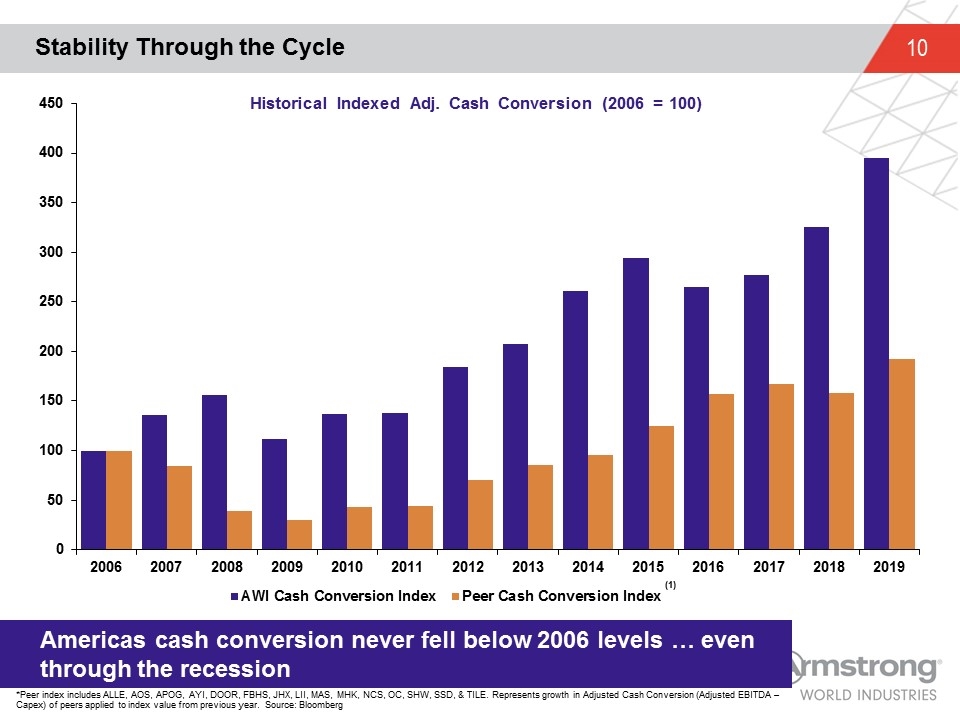
Historical Indexed Adj. Cash Conversion (2006 = 100) Stability Through the Cycle *Peer index includes ALLE, AOS, APOG, AYI, DOOR, FBHS, JHX, LII, MAS, MHK, NCS, OC, SHW, SSD, & TILE. Represents growth in Adjusted Cash Conversion (Adjusted EBITDA – Capex) of peers applied to index value from previous year. Source: Bloomberg Americas cash conversion never fell below 2006 levels … even through the recession
Appendix
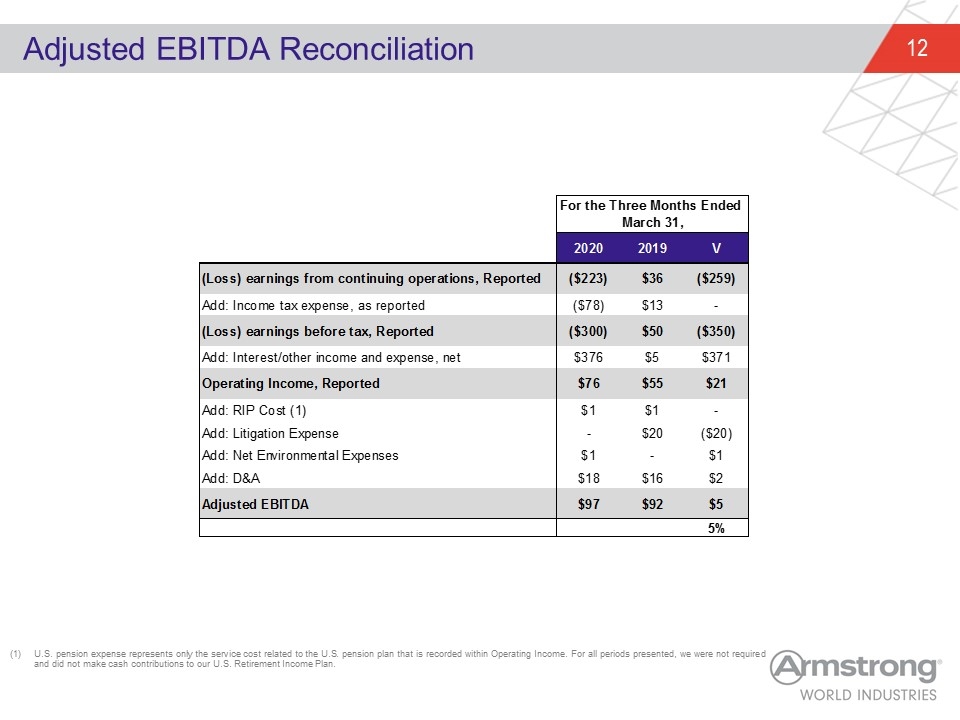
Adjusted EBITDA Reconciliation U.S. pension expense represents only the service cost related to the U.S. pension plan that is recorded within Operating Income. For all periods presented, we were not required and did not make cash contributions to our U.S. Retirement Income Plan. CONSOLIDATED For the Three Months Ended March 31, qtr YTD 2020 2019 V 2019 V (Loss) earnings from continuing operations, Reported -222.60000000000002 36.400000000000006 -259 189.6 52.699999999999875 rounding Add: Income tax expense, as reported -77.5 13.4 0 53.1 4 (Loss) earnings before tax, Reported -300.10000000000002 49.800000000000004 -349.90000000000003 242.7 56.699999999999875 rounding Add: Interest/other income and expense, net 376.09999999999997 4.9000000000000004 371.2 6.7000000000000028 11.299999999999997 Operating Income, Reported 76 54.699999999999996 21.300000000000004 249.40000000000003 67.999999999999943 Add: RIP Cost (1) 1.3660650000000001 1.1902507499999999 0 5.7387230000000002 -0.97768999999999995 Add: Litigation Expense 0 20 -20 6.5 13.080649000000001 Add: Net Environmental Expenses 1 0 1 -1.17395 2.24038 Add: D&A 18 16 2 78.016097999999943 -3.0443094999999403 Adjusted EBITDA 97 92 5 353 50.149728999999979 rounding 5.4347826086956541E-2 0.14206722096317276
Adjusted Diluted Earnings Per Share Reconciliation RIP expense (credit) represents the entire actuarial net periodic pension (credit) cost recorded as a component of earnings from continuing operations. For all periods presented, we were not required and did not make cash contributions to our RIP. Adjusted income tax expense is calculated using the as-reported tax rate multiplied by the adjusted earnings from continuing operations before income taxes. Q1 2019 EPS was originally reported at $1.10 using a different methodology for taxes which was corrected in Q2 2019 down to $1.00. 2020 Dilutive shares outstanding include anti-dilutive common stock equivalents which are excluded from GAAP accounting. 2019 dilutive shares outstanding are as-reported. CONSOLIDATED For the Three Months Ended March 31, 2020 Per Diluted 2019 Per Diluted V Per Diluted 2018 Per Diluted V Share Share Share Share (Loss) earnings from continuing operations, As Reported $-,222.60000000000002 $-4.6399999999999997 $36.400000000000006 $0.73 $-,259 $4.88 $189.6 $3.63 $52.699999999999875 Add: Income tax expense, as reported $-77.5 $13.4 $-90.9 $53.1 $4 (Loss) earnings from continuing operations before income taxes, As Reported $-,300.10000000000002 $49.800000000000004 $-,349.90000000000003 $242.7 $56.699999999999875 Add/(Less): RIP Expense (Credit) (1) $371.6 $-1.8847795000000001 $373.4847795 $-26.275746999999999 $18.736629000000001 Add: Litigation Expense 0 $20 $-20 $6.5 $13.080649000000001 Add: Net Environmental Expenses $1 0 $1 $-1.17395 $2.24038 0 Adjusted earnings from continuing operations before income taxes $72.395946000000009 $67.615220500000007 $4.7807255000000026 $254.526432 $42.951357499999915 (Less): Adjusted Income tax expense (2) $-18.696054031989338 $-18.193653708835342 $-0.50240032315399574 $-64 $3.0647054332647983 Adjusted net income (3) $53.699891968010675 $1.1026671862014512 $49.421566791164665 $0.99841549073059932 $5 $4.78 $190.6 $3.66 $45.942494933264726 Adjusted EPS Change versus Prior Year 0.10441714540563148 0.30601092896174864 Diluted Shares Outstanding (4) 48.7 49.5 52.1 As Reported Tax Rate 0.25824725091636119 0.26907630522088349 0.21878862793572312
Adjusted Free Cash(1) Flow Reconciliation Adjusted free cash flow is defined as cash from operations and dividends received from the WAVE joint venture, less expenditures for property and equipment, and is adjusted to remove the impact of cash used or proceeds received for acquisitions and divestitures, legacy environmental matters and litigation. The Company believes adjusted free cash flow is useful because it provides insight into the amount of cash that the Company has available for discretionary uses, after expenditures for capital commitments and adjustments for acquisitions and divestitures. Free cash flow includes discontinued international operations. For the Three Months Ended March 31, 2020 2019 V 2018 V As Reported Net cash provided by operating activities $25.700000000000003 $14.700000000000005 $10.999999999999998 $203.2 $-20.499999999999972 As Reported Net cash (used for) provided by investing activities $9.9000000000000021 $-38 $47.900000000000006 $309.59999999999997 $-,398.69999999999993 Add/(Less): Acquisitions, net - $43 $-43 $22 $34.4 Add: Litigation, net - $3 $-3 - $23 Add/(Less): Environmental Payments (Recoveries), net $1 $-5 $6 $-27 $32 Adjusted Free Cash Flow $36.400000000000006 $17.700000000000003 $18 $235.79999999999995 $8.1999999999999993 1.0564971751412431 3.4775233248515697E-2
Segment Reported Operating Income (Loss) to Adjusted EBITDA RIP expense represents only the service cost related to the U.S. pension plan that is recorded within Operating Income. For all periods presented, we were not required and did not make cash contributions to our RIP. MINERAL FIBER ARCHITECTURAL SPECIALTIES UNALLOCATED CORPORATE For the Three Months Ended March 31, 2016 V 2020 2019 V 2020 2019 V 2020 2019 V Operating Income (Loss) – As Reported 70 47.6 22.4 7.5149999999999997 9.173 -1.6580000000000004 -1.5 -2.1 0.60000000000000009 Add: RIP Cost (1) 0 0 0 0 0 0 1.3660650000000001 1.1902507499999999 0 Add: Litigation Expense 0 19.7 -19.7 0 0 0 0 0 0 Add: Net Environmental Expenses 1 0 1 0 0 0 0 0 0 Less: Depreciation and Amortization 16 15 1 2.1601369999999998 0.70899999999999963 1.4511370000000001 0 0.90974925000000018 -0.90974925000000018 EBITDA – Adjusted 87 82.3 4.7000000000000028 9.6751369999999994 9.8819999999999997 0 0 0 0 5.7108140947752073E-2 -2.0933313094515293E-2