BNY 8-K
Bank of New York Mellon Corp (BNY)
8-K
2020-04-16
For: 2020-04-16
View Original
Added on
April 09, 2026
UNITED STATES
SECURITIES AND EXCHANGE COMMISSION
Washington, D.C. 20549
FORM 8-K
CURRENT REPORT
Pursuant to Section 13 or 15(d) of the Securities Exchange Act of 1934
Date of Report (Date of earliest event reported) – April 16, 2020
(Exact name of registrant as specified in its charter)
(State or other jurisdiction of incorporation) | (Commission File Number) | (I.R.S. Employer Identification No.) |
(Address of principal executive offices) (Zip Code)
Registrant’s telephone number, including area code – (212 ) 495-1784
Not Applicable
(Former name or former address, if changed since last report)
Check the appropriate box below if the Form 8-K filing is intended to simultaneously satisfy the filing obligation of the registrant under any of the following provisions:
Securities registered pursuant to Section 12(b) of the Act: Title of each class | Trading symbol(s) | Name of each exchange on which registered |
(fully and unconditionally guaranteed by The Bank of New York Mellon Corporation) | ||
Indicate by check mark whether the registrant is an emerging growth company as defined in Rule 405 under the Securities Act (17 CFR 230.405) or Rule 12b-2 under the Exchange Act (17 CFR 240.12b-2).
Emerging growth company ☐
If an emerging growth company, indicate by check mark if the registrant has elected not to use the extended transition period for complying with any new or revised financial accounting standards provided pursuant to Section 13(a) of the Exchange Act. ☐
ITEM 2.02. RESULTS OF OPERATIONS AND FINANCIAL CONDITION.
On April 16, 2020, The Bank of New York Mellon Corporation (“BNY Mellon”) released information on its financial results for the first quarter ended March 31, 2020. Copies of the Earnings Release and the Financial Supplement are attached hereto as Exhibit 99.1 and Exhibit 99.2, respectively, and are incorporated herein by reference.
ITEM 7.01. REGULATION FD DISCLOSURE.
On April 16, 2020, BNY Mellon will hold a conference call and webcast to discuss its financial results for the first quarter ended March 31, 2020 and outlook. A copy of the Financial Highlights presentation for the conference call and webcast is attached hereto as Exhibit 99.3.
ITEM 9.01. FINANCIAL STATEMENTS AND EXHIBITS.
(d) EXHIBITS.
Exhibit | |||
Number | Description | ||
99.1 | |||
The quotation in Exhibit 99.1 (the “Excluded Section”) shall not be deemed “filed” for purposes of Section 18 of the Securities Exchange Act of 1934 (“Exchange Act”) or otherwise subject to the liabilities under that Section and shall not be deemed to be incorporated by reference into any filing of BNY Mellon under the Securities Act of 1933 or the Exchange Act. The information included in Exhibit 99.1, other than in the Excluded Section, shall be deemed “filed” for purposes of the Exchange Act. | |||
99.2 | |||
The information included in Exhibit 99.2 shall be deemed “filed” for purposes of the Exchange Act. | |||
99.3 | |||
The information included in Exhibit 99.3 shall not be deemed “filed” for purposes of Section 18 of the Exchange Act or otherwise subject to the liabilities under that Section and shall not be deemed to be incorporated by reference into any filing of BNY Mellon under the Securities Act of 1933 or the Exchange Act. | |||
104 | Cover Page Interactive Data File - the cover page XBRL tags are embedded within the Inline XBRL document. | ||
2
SIGNATURES
Pursuant to the requirements of the Securities Exchange Act of 1934, the Registrant has duly caused this report to be signed on its behalf by the undersigned hereunto duly authorized.
The Bank of New York Mellon Corporation | |
Date: April 16, 2020 | By: /s/ James J. Killerlane III |
Name: James J. Killerlane III Title: Secretary | |
3
News Release |  |
BNY MELLON REPORTS FIRST QUARTER 2020 EARNINGS OF
$944 MILLION OR $1.05 PER COMMON SHARE
Revenue up 5% | EPS up 12% | ROE 10% ROTCE 20% (a) | CET1 11.3% SLR 5.6% | |||
NEW YORK, April 16, 2020 – The Bank of New York Mellon Corporation (“BNY Mellon”) (NYSE: BK) today reported:
1Q20 vs. | |||||||||||||
1Q20 | 4Q19 | 1Q19 | 4Q19 | 1Q19 | |||||||||
Net income applicable to common shareholders (in millions) | $ | 944 | $ | 1,391 | $ | 910 | (32 | )% | 4 | % | |||
Diluted earnings per common share | $ | 1.05 | $ | 1.52 | $ | 0.94 | (31 | )% | 12 | % | |||
First Quarter Results |
Total revenue of $4.1 billion, increased 5%
• | Fee revenue increased 10% |
• | Net interest revenue decreased 3% |
Provision for credit losses of $169 million
Total noninterest expense of $2.7 billion, increased slightly
• | Continued investments in technology |
Investment Services
• | Total revenue increased 9% |
• | Income before taxes increased 13% |
• | AUC/A of $35.2 trillion, increased 2% |
Investment Management
• | Total revenue decreased 4% |
• | Income before taxes decreased 27% |
• | AUM of $1.8 trillion, decreased 2% |
Capital
Repurchased 21.7 million common shares for $985 million, and paid dividends of $282 million to common shareholders.
• | 1Q20 share repurchases completed prior to the temporary suspension announced jointly with the Financial Services Forum on March 15. |
CEO Commentary |
“Throughout the coronavirus crisis, we remain focused on the health and wellbeing of our people, providing continuity of service to our clients and maintaining our balance sheet so we are able to assist our clients. Despite the unprecedented global market disruption, we have stayed fully operational, demonstrating our resiliency and our commitment and capacity to support our clients when they need us most,” Todd Gibbons, Chief Executive Officer, said.
“Our fee revenue increased 10 percent as we experienced elevated transaction volumes and heightened volatility in March. Looking ahead, we and our clients face continued market and economic uncertainty. While it is too early to predict the impact, our business model is financially resilient. We plan to maintain our conservative risk profile, strong capital and high-quality, liquid balance sheet, which will position us to withstand severe stress and to support our clients,” Mr. Gibbons added.
“I am deeply honored to become CEO of this great company. While looking ahead to drive improved performance and capabilities and ensure BNY Mellon remains a great place to work, in the immediate term we are focused on being there for our clients. Our team’s efforts on this front have been exceptional. I have been incredibly gratified by the feedback from clients, who see our people going above and beyond to deliver great service. I want to thank our clients for their ongoing partnership and thank our employees around the globe for their exceptional dedication and professionalism. I am confident in our ability to weather this adversity and to carry forward that energy into advancing our growth agenda as the world recovers,” Mr. Gibbons concluded.
Media Relations: Jennifer Hendricks Sullivan (212) 635-1374 | Investor Relations: Magda Palczynska (212) 635-8529 |
(a) For information on this Non-GAAP measure, see “Supplemental Information – Explanation of GAAP and Non-GAAP financial measures” on page 8. | |
Note: Above comparisons are 1Q20 vs. 1Q19. | |
BNY Mellon 1Q20 Earnings Release |
CONSOLIDATED FINANCIAL HIGHLIGHTS
(in millions, except per share amounts and unless otherwise noted; not meaningful - N/M) | 1Q20 vs. | ||||||||||||
1Q20 | 4Q19 (a) | 1Q19 | 4Q19 | 1Q19 | |||||||||
Fee revenue | $ | 3,323 | $ | 3,971 | $ | 3,031 | (16 | )% | 10 | % | |||
Net securities gains (losses) | 9 | (25 | ) | 1 | N/M | N/M | |||||||
Total fee and other revenue | 3,332 | 3,946 | 3,032 | (16 | ) | 10 | |||||||
(Loss) income from consolidated investment management funds | (38 | ) | 17 | 26 | N/M | N/M | |||||||
Net interest revenue | 814 | 815 | 841 | — | (3 | ) | |||||||
Total revenue | 4,108 | 4,778 | 3,899 | (14 | ) | 5 | |||||||
Provision for credit losses | 169 | (8 | ) | 7 | N/M | N/M | |||||||
Noninterest expense | 2,712 | 2,964 | 2,699 | (9 | ) | — | |||||||
Income before income taxes | 1,227 | 1,822 | 1,193 | (33 | ) | 3 | |||||||
Provision for income taxes | 265 | 373 | 237 | (29 | ) | 12 | |||||||
Net income | $ | 962 | $ | 1,449 | $ | 956 | (34 | )% | 1 | % | |||
Net income applicable to common shareholders of The Bank of New York Mellon Corporation | $ | 944 | $ | 1,391 | $ | 910 | (32 | )% | 4 | % | |||
Operating leverage (b) | (552 | ) bps | 488 | bps | |||||||||
Diluted earnings per common share | $ | 1.05 | $ | 1.52 | $ | 0.94 | (31 | )% | 12 | % | |||
Average common shares and equivalents outstanding - diluted (in thousands) | 896,689 | 914,739 | 965,960 | ||||||||||
Pre-tax operating margin | 30 | % | 38 | % | 31 | % | |||||||
(a) | Includes a net benefit of $460 million, or $0.50 per diluted common share, related to a gain on sale of an equity investment, partially offset by severance, net securities losses and litigation expense. |
(b) | Operating leverage is the rate of increase (decrease) in total revenue less the rate of increase (decrease) in total noninterest expense. |
bps – basis points.
KEY DRIVERS (comparisons are 1Q20 vs. 1Q19, unless otherwise stated)
• | Total revenue increased 5% primarily reflecting: |
• | Fee revenue increased 10% primarily reflecting higher foreign exchange and other trading revenue, higher transaction volumes across the investment services businesses and higher performance fees, partially offset by equity investment losses, including seed capital. |
• | Net interest revenue decreased 3% primarily reflecting lower interest rates on interest-earning assets and the impact of hedging activities (primarily offset in foreign exchange and other trading revenue). This was partially offset by the benefit of lower deposit and funding rates and higher deposits, securities and loans. |
• | Provision for credit losses of $169 million primarily reflecting the macroeconomic environment in conjunction with the application of the new current expected credit losses accounting standard. |
• | Noninterest expense increased slightly primarily reflecting the continued investments in technology and higher pension expense, partially offset by lower staff expense and the favorable impact of a stronger U.S. dollar. |
• | Effective tax rate of 21.6%. |
Assets under custody and/or administration (“AUC/A”) and Assets under management (“AUM”)
• | AUC/A of $35.2 trillion, increased 2%, primarily reflecting higher client inflows, partially offset by lower market values and the unfavorable impact of a stronger U.S. dollar. |
• | AUM of $1.8 trillion, decreased 2%, primarily reflecting the unfavorable impact of a stronger U.S. dollar (principally versus the British pound). |
Capital and liquidity
• | Repurchased 21.7 million common shares for $985 million and paid $282 million in dividends to common shareholders. |
• | Return on common equity (“ROE”) of 10%; Return on tangible common equity (“ROTCE”) of 20% (a). |
• | Common Equity Tier 1 (“CET1”) ratio – 11.3%. |
• | Supplementary leverage ratio (“SLR”) – 5.6%. |
• | Average liquidity coverage ratio (“LCR”) – 115%. |
• | Total Loss Absorbing Capacity (“TLAC”) ratios exceed minimum requirements. |
(a) | See “Supplemental information – Explanation of GAAP and Non-GAAP financial measures” on page 8 for additional information. |
Note: Throughout this document, sequential growth rates are unannualized.
Page - 2 |
BNY Mellon 1Q20 Earnings Release |
INVESTMENT SERVICES BUSINESS HIGHLIGHTS
(dollars in millions, unless otherwise noted; not meaningful - N/M) | 1Q20 vs. | ||||||||||||
1Q20 | 4Q19 (a) | 1Q19 (a) | 4Q19 | 1Q19 | |||||||||
Total revenue by line of business: | |||||||||||||
Asset Servicing | $ | 1,531 | $ | 1,411 | $ | 1,415 | 9 | % | 8 | % | |||
Pershing | 653 | 579 | 561 | 13 | 16 | ||||||||
Issuer Services | 419 | 415 | 396 | 1 | 6 | ||||||||
Treasury Services | 339 | 329 | 317 | 3 | 7 | ||||||||
Clearance and Collateral Management | 300 | 280 | 276 | 7 | 9 | ||||||||
Total revenue by line of business | 3,242 | 3,014 | 2,965 | 8 | 9 | ||||||||
Provision for credit losses | 149 | (5 | ) | 8 | N/M | N/M | |||||||
Noninterest expense | 1,987 | 2,179 | 1,981 | (9 | ) | — | |||||||
Income before taxes | $ | 1,106 | $ | 840 | $ | 976 | 32 | % | 13 | % | |||
Pre-tax operating margin | 34 | % | 28 | % | 33 | % | |||||||
Foreign exchange and other trading revenue | $ | 261 | $ | 151 | $ | 157 | 73 | % | 66 | % | |||
Securities lending revenue | $ | 46 | $ | 40 | $ | 44 | 15 | % | 5 | % | |||
Metrics: | |||||||||||||
Average loans | $ | 41,789 | $ | 38,721 | $ | 37,235 | 8 | % | 12 | % | |||
Average deposits | $ | 242,187 | $ | 215,388 | $ | 195,082 | 12 | % | 24 | % | |||
AUC/A at period end (in trillions) (current period is preliminary) (b) | $ | 35.2 | $ | 37.1 | $ | 34.5 | (5 | )% | 2 | % | |||
Market value of securities on loan at period end (in billions) (c) | $ | 389 | $ | 378 | $ | 377 | 3 | % | 3 | % | |||
(a) | Prior periods have been restated. See “Segment Reporting Changes” on page 8 for additional information. |
(b) | Includes the AUC/A of CIBC Mellon Global Securities Services Company (“CIBC Mellon”), a joint venture with the Canadian Imperial Bank of Commerce, of $1.2 trillion at March 31, 2020, $1.5 trillion at Dec. 31, 2019 and $1.3 trillion at March 31, 2019. |
(c) | Represents the total amount of securities on loan in our agency securities lending program managed by the Investment Services business. Excludes securities for which BNY Mellon acts as agent on behalf of CIBC Mellon clients, which totaled $59 billion at March 31, 2020, $60 billion at Dec. 31, 2019 and $62 billion at March 31, 2019. |
KEY DRIVERS
• | The drivers of the total revenue variances by line of business are indicated below. |
• | Asset Servicing - Both increases primarily reflect higher foreign exchange and other trading revenue. The year-over-year increase also reflects higher volumes from existing clients, partially offset by lower net interest revenue. The decrease in net interest revenue primarily reflects lower rates, partially offset by higher deposits and loans. |
• | Pershing - Both increases primarily reflect higher clearing volumes and a one-time fee. The year-over-year increase also reflects growth in client assets and accounts. |
• | Issuer Services - The year-over-year increase reflects higher Corporate Trust and Depositary Receipts fees. The sequential increase primarily reflects higher Depositary Receipts fees. |
• | Treasury Services - Both increases primarily reflect higher fees and net interest revenue. The increase in net interest revenue was driven by deposit growth. |
• | Clearance and Collateral Management - Both increases primarily reflect growth in collateral management and clearance volumes and higher net interest revenue. |
• | Noninterest expense increased slightly year-over-year primarily driven by continued investments in technology. The sequential decrease primarily reflects lower severance and litigation expenses, partially offset by higher other staff expense. |
Page - 3 |
BNY Mellon 1Q20 Earnings Release |
INVESTMENT MANAGEMENT BUSINESS HIGHLIGHTS
(dollars in millions, unless otherwise noted; not meaningful - N/M) | 1Q20 vs. | ||||||||||||
1Q20 | 4Q19 (a) | 1Q19 (a) | 4Q19 | 1Q19 | |||||||||
Total revenue by line of business: | |||||||||||||
Asset Management | $ | 620 | $ | 692 | $ | 640 | (10 | )% | (3 | )% | |||
Wealth Management | 278 | 279 | 296 | — | (6 | ) | |||||||
Total revenue by line of business | 898 | 971 | 936 | (8 | ) | (4 | ) | ||||||
Provision for credit losses | 9 | — | 1 | N/M | N/M | ||||||||
Noninterest expense | 695 | 731 | 669 | (5 | ) | 4 | |||||||
Income before taxes | $ | 194 | $ | 240 | $ | 266 | (19 | )% | (27 | )% | |||
Pre-tax operating margin | 22 | % | 25 | % | 28 | % | |||||||
Adjusted pre-tax operating margin – Non-GAAP (b) | 24 | % | 27 | % | 31 | % | |||||||
Metrics: | |||||||||||||
Average loans | $ | 12,124 | $ | 12,022 | $ | 12,339 | 1 | % | (2 | )% | |||
Average deposits | $ | 16,144 | $ | 15,195 | $ | 15,815 | 6 | % | 2 | % | |||
AUM (in billions) (current period is preliminary) (c) | $ | 1,796 | $ | 1,910 | $ | 1,841 | (6 | )% | (2 | )% | |||
Wealth Management client assets (in billions) (current period is preliminary) (d) | $ | 236 | $ | 266 | $ | 253 | (11 | )% | (7 | )% | |||
(a) | Prior periods have been restated. See “Segment Reporting Changes” on page 8 for additional information. |
(b) | Net of distribution and servicing expense. See “Supplemental information – Explanation of GAAP and Non-GAAP financial measures” on page 8 for information on this Non-GAAP measure. |
(c) | Excludes securities lending cash management assets and assets managed in the Investment Services business. |
(d) | Includes AUM and AUC/A in the Wealth Management business. |
KEY DRIVERS
• | The drivers of the total revenue variances by line of business are indicated below. |
• | Asset Management - The year-over-year decrease primarily reflects equity investment losses, including seed capital, and an unfavorable change in the mix of AUM since 1Q19, partially offset by higher performance fees and market values. The sequential decrease primarily reflects equity investment losses, including seed capital, the impact of hedging activities and lower market values. |
• | Wealth Management - The year-over-year decrease primarily reflects lower net interest revenue due to lower interest rates, partially offset by the impact of higher deposits. |
• | Noninterest expense increased year-over-year primarily reflecting higher professional, legal and other purchased services expense. The sequential decrease primarily reflects lower severance expense. |
Page - 4 |
BNY Mellon 1Q20 Earnings Release |
OTHER SEGMENT primarily includes leasing operations, certain corporate treasury activities, derivatives, business exits and other corporate revenue and expense items.
(in millions) | 1Q20 | 4Q19 (a) | 1Q19 (a) | ||||||
Fee revenue | $ | 21 | $ | 817 | $ | 17 | |||
Net securities gains (losses) | 9 | (23 | ) | 1 | |||||
Total fee and other revenue | 30 | 794 | 18 | ||||||
Net interest (expense) | (44 | ) | (10 | ) | (30 | ) | |||
Total (loss) revenue | (14 | ) | 784 | (12 | ) | ||||
Provision for credit losses | 11 | (3 | ) | (2 | ) | ||||
Noninterest expense | 30 | 54 | 49 | ||||||
(Loss) income before taxes | $ | (55 | ) | $ | 733 | $ | (59 | ) | |
(a) | Prior periods have been restated. See “Segment Reporting Changes” on page 8 for additional information. |
KEY DRIVERS
• | Fee revenue, net securities losses and net interest expense include corporate treasury and other investment activity, including hedging activity which offsets between fee revenue and net interest expense. Total revenue decreased sequentially primarily reflecting the gain on the sale of an equity investment recorded in 4Q19. Net interest expense increased sequentially primarily reflecting corporate treasury activity. |
• | Noninterest expense decreased year-over-year primarily reflecting lower staff expense. The sequential decrease primarily reflects lower severance, partially offset by higher other staff expense, including pension expense. |
Page - 5 |
BNY Mellon 1Q20 Earnings Release |
CAPITAL AND LIQUIDITY
Capital and liquidity ratios | March 31, 2020 | Dec. 31, 2019 | ||||
Consolidated regulatory capital ratios: (a) | ||||||
CET1 ratio | 11.3 | % | 11.5 | % | ||
Tier 1 capital ratio | 13.5 | 13.7 | ||||
Total capital ratio | 14.3 | 14.4 | ||||
Tier 1 leverage ratio | 6.0 | 6.6 | ||||
SLR | 5.6 | 6.1 | ||||
BNY Mellon shareholders’ equity to total assets ratio | 8.8 | % | 10.9 | % | ||
BNY Mellon common shareholders’ equity to total assets ratio | 8.0 | % | 9.9 | % | ||
Average LCR | 115 | % | 120 | % | ||
Book value per common share | $ | 42.47 | $ | 42.12 | ||
Tangible book value per common share – Non-GAAP (b) | $ | 21.53 | $ | 21.33 | ||
Common shares outstanding (in thousands) | 885,443 | 900,683 | ||||
(a) | Regulatory capital ratios for March 31, 2020 are preliminary. For our CET1, Tier 1 capital and Total capital ratios, our effective capital ratios under the U.S. capital rules are the lower of the ratios as calculated under the Standardized and Advanced Approaches, which for Dec. 31, 2019, was the Advanced Approaches, and for March 31, 2020 was the Standardized Approaches for the CET1 and Tier 1 capital ratios and the Advanced Approach for the Total capital ratio. |
(b) | Tangible book value per common share – Non-GAAP excludes goodwill and intangible assets, net of deferred tax liabilities. See “Supplemental information – Explanation of GAAP and Non-GAAP financial measures” on page 8 for information on this Non-GAAP measure. |
CET1 capital totaled $18.5 billion at March 31, 2020, a decrease of $75 million compared with Dec. 31, 2019. The decrease primarily reflects capital deployed through common stock repurchases and dividend payments, partially offset by capital generated through earnings.
NET INTEREST REVENUE
Net interest revenue | 1Q20 vs. | ||||||||||||
(dollars in millions; not meaningful - N/M) | 1Q20 | 4Q19 | 1Q19 | 4Q19 | 1Q19 | ||||||||
Net interest revenue | $ | 814 | $ | 815 | $ | 841 | — | (3 | )% | ||||
Add: Tax equivalent adjustment | 2 | 2 | 4 | N/M | N/M | ||||||||
Net interest revenue, on a fully taxable equivalent (“FTE”) basis – Non-GAAP (a) | $ | 816 | $ | 817 | $ | 845 | — | (3 | )% | ||||
Net interest margin | 1.01 | % | 1.09 | % | 1.20 | % | (8 | ) bps | (19 | ) bps | |||
Net interest margin (FTE) – Non-GAAP (a) | 1.01 | % | 1.09 | % | 1.20 | % | (8 | ) bps | (19 | ) bps | |||
(a) | Net interest revenue (FTE) – Non-GAAP and net interest margin (FTE) – Non-GAAP include the tax equivalent adjustments on tax-exempt income. See “Supplemental information – Explanation of GAAP and Non-GAAP financial measures” on page 8 for information on this Non-GAAP measure. |
bps – basis points.
Net interest revenue decreased year-over-year, primarily reflecting lower interest rates on interest-earning assets and the impact of hedging activities (primarily offset in foreign exchange and other trading revenue). This was partially offset by the benefit of lower deposit and funding rates and higher deposits, securities and loans.
Sequentially, the favorable impact of higher deposits, securities and loans was offset by the impact of hedging activities (primarily offset in foreign exchange and other trading revenue) and lower rates.
Page - 6 |
BNY Mellon 1Q20 Earnings Release |
THE BANK OF NEW YORK MELLON CORPORATION
Condensed Consolidated Income Statement
(in millions) | Quarter ended | |||||||||
March 31, 2020 | Dec. 31, 2019 | March 31, 2019 | ||||||||
Fee and other revenue | ||||||||||
Investment services fees: | ||||||||||
Asset servicing fees | $ | 1,159 | $ | 1,148 | $ | 1,122 | ||||
Clearing services fees | 470 | 421 | 398 | |||||||
Issuer services fees | 263 | 264 | 251 | |||||||
Treasury services fees | 149 | 147 | 132 | |||||||
Total investment services fees | 2,041 | 1,980 | 1,903 | |||||||
Investment management and performance fees | 862 | 883 | 841 | |||||||
Foreign exchange and other trading revenue | 319 | 168 | 170 | |||||||
Financing-related fees | 59 | 46 | 51 | |||||||
Distribution and servicing | 31 | 34 | 31 | |||||||
Investment and other income | 11 | 860 | 35 | |||||||
Total fee revenue | 3,323 | 3,971 | 3,031 | |||||||
Net securities gains (losses) | 9 | (25 | ) | 1 | ||||||
Total fee and other revenue | 3,332 | 3,946 | 3,032 | |||||||
Operations of consolidated investment management funds | ||||||||||
Investment (loss) income | (38 | ) | 17 | 26 | ||||||
Interest of investment management fund note holders | — | — | — | |||||||
(Loss) income from consolidated investment management funds | (38 | ) | 17 | 26 | ||||||
Net interest revenue | ||||||||||
Interest revenue | 1,570 | 1,721 | 1,920 | |||||||
Interest expense | 756 | 906 | 1,079 | |||||||
Net interest revenue | 814 | 815 | 841 | |||||||
Total revenue | 4,108 | 4,778 | 3,899 | |||||||
Provision for credit losses (a) | 169 | (8 | ) | 7 | ||||||
Noninterest expense | ||||||||||
Staff | 1,482 | 1,639 | 1,524 | |||||||
Professional, legal and other purchased services | 330 | 367 | 325 | |||||||
Software and equipment | 326 | 326 | 283 | |||||||
Net occupancy | 135 | 151 | 137 | |||||||
Sub-custodian and clearing | 105 | 119 | 105 | |||||||
Distribution and servicing | 91 | 92 | 91 | |||||||
Business development | 42 | 65 | 45 | |||||||
Bank assessment charges | 35 | 32 | 31 | |||||||
Amortization of intangible assets | 26 | 28 | 29 | |||||||
Other | 140 | 145 | 129 | |||||||
Total noninterest expense | 2,712 | 2,964 | 2,699 | |||||||
Income | ||||||||||
Income before income taxes | 1,227 | 1,822 | 1,193 | |||||||
Provision for income taxes | 265 | 373 | 237 | |||||||
Net income | 962 | 1,449 | 956 | |||||||
Net loss (income) attributable to noncontrolling interests (includes $18, $(9), and $(10) related to consolidated investment management funds, respectively) | 18 | (9 | ) | (10 | ) | |||||
Net income applicable to shareholders of The Bank of New York Mellon Corporation | 980 | 1,440 | 946 | |||||||
Preferred stock dividends | (36 | ) | (49 | ) | (36 | ) | ||||
Net income applicable to common shareholders of The Bank of New York Mellon Corporation | $ | 944 | $ | 1,391 | $ | 910 | ||||
(a) | In the first quarter of 2020, we adopted new accounting guidance included in ASU 2016-13, Financial Instruments - Credit Losses: Measurement of Credit Losses On Financial Instruments, on a prospective basis. |
Earnings per share applicable to the common shareholders of The Bank of New York Mellon Corporation | Quarter ended | ||||||||
March 31, 2020 | Dec. 31, 2019 | March 31, 2019 | |||||||
(in dollars) | |||||||||
Basic | $ | 1.05 | $ | 1.52 | $ | 0.94 | |||
Diluted | $ | 1.05 | $ | 1.52 | $ | 0.94 | |||
Page - 7 |
BNY Mellon 1Q20 Earnings Release |
SEGMENT REPORTING CHANGES
In the first quarter of 2020, we reclassified the results of certain services provided between the segments from noninterest expense to fee and other revenue. This activity is offset in the Other segment and relates to services that are also provided to third-parties and provides consistency with the reporting of the revenues. This adjustment had no impact on income before taxes of the businesses. Prior periods have been restated.
In the first quarter of 2020, we reclassified the results related to certain lending activities from the Wealth Management business to the Pershing business. These loans were originated by the Wealth Management business as a service to Pershing clients. This resulted in an increase in total revenue, noninterest expense and income before taxes in the Pershing business and corresponding decrease in the Wealth Management business. Prior periods have been restated.
For additional information on the segment reporting changes, see “Segment Reporting Changes” in the Financial Supplement available at www.bnymellon.com.
SUPPLEMENTAL INFORMATION – EXPLANATION OF GAAP AND NON-GAAP FINANCIAL MEASURES
BNY Mellon has included in this Earnings Release certain Non-GAAP financial measures on a tangible basis as a supplement to GAAP information, which exclude goodwill and intangible assets, net of deferred tax liabilities. BNY Mellon believes that the return on tangible common equity is additional useful information for investors because it presents a measure of those assets that can generate income, and the tangible book value per common share is additional useful information because it presents the level of tangible assets in relation to shares of common stock outstanding.
Net interest revenue, on a fully taxable equivalent (“FTE”) basis – Non-GAAP and net interest margin (FTE) – Non-GAAP and other FTE measures include the tax equivalent adjustments on tax-exempt income which allows for the comparison of amounts arising from both taxable and tax-exempt sources and is consistent with industry practice. The adjustment to an FTE basis has no impact on net income.
BNY Mellon has also included the operating margin for the Investment Management business net of distribution and servicing expense that was passed to third parties who distribute or service our managed funds. BNY Mellon believes that this measure is useful when evaluating the performance of the Investment Management business relative to industry competitors.
For the reconciliations of these Non-GAAP measures, see “Supplemental Information - Explanation of GAAP and Non-GAAP Financial Measures” in the Financial Supplement available at www.bnymellon.com.
Page - 8 |
BNY Mellon 1Q20 Earnings Release |
CAUTIONARY STATEMENT
A number of statements (i) in this Earnings Release, (ii) in our Financial Supplement, (iii) in our presentations and (iv) in the responses to questions on our conference call discussing our quarterly results and other public events may contain “forward-looking statements” within the meaning of the Private Securities Litigation Reform Act of 1995 including statements about our capital plans, strategic priorities, financial goals, organic growth, performance, organizational quality and efficiency, investments, including in technology and product development, resiliency, capabilities, revenue, net interest revenue, fees, expenses, cost discipline, sustainable growth, company management, deposits, interest rates and yield curves, securities portfolio, taxes, business opportunities, divestments, volatility, preliminary business metrics and regulatory capital ratios and statements regarding our aspirations, as well as our overall plans, strategies, goals, objectives, expectations, outlooks, estimates, intentions, targets, opportunities, focus and initiatives, including the potential effects of the coronavirus pandemic on any of the foregoing. These statements may be expressed in a variety of ways, including the use of future or present tense language. Words such as “estimate,” “forecast,” “project,” “anticipate,” “likely,” “target,” “expect,” “intend,” “continue,” “seek,” “believe,” “plan,” “goal,” “could,” “should,” “would,” “may,” “might,” “will,” “strategy,” “synergies,” “opportunities,” “trends,” “future” and words of similar meaning signify forward-looking statements. These statements and other forward-looking statements contained in other public disclosures of The Bank of New York Mellon Corporation which make reference to the cautionary factors described in this Earnings Release are based upon current beliefs and expectations and are subject to significant risks and uncertainties (some of which are beyond BNY Mellon’s control). Actual results may differ materially from those expressed or implied as a result of these risks and uncertainties, including, but not limited to, the risk factors and other uncertainties set forth in BNY Mellon’s Annual Report on Form 10-K for the year ended Dec. 31, 2019 and BNY Mellon’s other filings with the Securities and Exchange Commission. Statements about the effects of the current and near-term market and macroeconomic environment on BNY Mellon, including on its business, operations, financial performance and prospects, may constitute forward-looking statements, and are based on assumptions that involve risks and uncertainties and that are subject to change based on various important factors (some of which are beyond BNY Mellon’s control), including the scope and duration of the pandemic, actions taken by governmental authorities in response to the pandemic, and the direct and indirect impact of the pandemic on BNY Mellon, our clients, customers and third parties. Preliminary business metrics and regulatory capital ratios are subject to change, possibly materially, as BNY Mellon completes its Quarterly Report on Form 10-Q for the quarter ended March 31, 2020. All forward-looking statements in this Earnings Release speak only as of April 16, 2020, and BNY Mellon undertakes no obligation to update any forward-looking statement to reflect events or circumstances after that date or to reflect the occurrence of unanticipated events.
ABOUT BNY MELLON
BNY Mellon is a global investments company dedicated to helping its clients manage and service their financial assets throughout the investment lifecycle. Whether providing financial services for institutions, corporations or individual investors, BNY Mellon delivers informed investment management and investment services in 35 countries. As of March 31, 2020, BNY Mellon had $35.2 trillion in assets under custody and/or administration, and $1.8 trillion in assets under management. BNY Mellon can act as a single point of contact for clients looking to create, trade, hold, manage, service, distribute or restructure investments. BNY Mellon is the corporate brand of The Bank of New York Mellon Corporation (NYSE: BK). Additional information is available on www.bnymellon.com. Follow us on Twitter @BNYMellon or visit our newsroom at www.bnymellon.com/newsroom for the latest company news.
Page - 9 |
BNY Mellon 1Q20 Earnings Release |
CONFERENCE CALL INFORMATION
Todd Gibbons, Chief Executive Officer, and Mike Santomassimo, Chief Financial Officer, will host a conference call and simultaneous live audio webcast at 8:00 a.m. EDT on April 16, 2020. This conference call and audio webcast will include forward-looking statements and may include other material information.
Investors and analysts wishing to access the conference call and audio webcast may do so by dialing (800) 390-5696 (U.S.) or (720) 452-9082 (International), and using the passcode: 807070, or by logging onto www.bnymellon.com/investorrelations. Earnings materials will be available at www.bnymellon.com/investorrelations beginning at approximately 6:30 a.m. EDT on April 16, 2020. Replays of the conference call and audio webcast will be available beginning April 16, 2020 at approximately 2:00 p.m. EDT through May 16, 2020 by dialing (888) 203-1112 (U.S.) or (719) 457-0820 (International), and using the passcode: 5375940. The archived version of the conference call and audio webcast will also be available at www.bnymellon.com/investorrelations for the same time period.
Page - 10 |
The Bank of New York Mellon Corporation |
Financial Supplement |
First Quarter 2020 |
Table of Contents |  | |
Consolidated Results | Page | |
Consolidated Financial Highlights | ||
Condensed Consolidated Income Statement | ||
Condensed Consolidated Balance Sheet | ||
Fee and Other Revenue | ||
Average Balances and Interest Rates | ||
Capital and Liquidity | ||
Business Segment Results | ||
Investment Services Business | ||
Investment Management Business | ||
AUM by Product, AUM Flows and Wealth Management Client Assets | ||
Other Segment | ||
Other | ||
Securities Portfolio | ||
Allowance for Credit Losses and Nonperforming Assets | ||
Supplemental Information – Explanation of GAAP and Non-GAAP Financial Measures | ||
Segment Reporting Changes | ||
THE BANK OF NEW YORK MELLON CORPORATION | | |||||||||||||||||||
CONSOLIDATED FINANCIAL HIGHLIGHTS | ||||||||||||||||||||
(dollars in millions, except per common share amounts, or unless otherwise noted) | 1Q20 vs. | |||||||||||||||||||
1Q20 | 4Q19 | 3Q19 | 2Q19 | 1Q19 | 4Q19 | 1Q19 | ||||||||||||||
Selected income statement data | ||||||||||||||||||||
Fee revenue | $ | 3,323 | $ | 3,971 | $ | 3,129 | $ | 3,105 | $ | 3,031 | (16 | )% | 10 | % | ||||||
Net securities gains (losses) | 9 | (25 | ) | (1 | ) | 7 | 1 | N/M | N/M | |||||||||||
Total fee and other revenue | 3,332 | 3,946 | 3,128 | 3,112 | 3,032 | (16 | ) | 10 | ||||||||||||
(Loss) income from consolidated investment management funds | (38 | ) | 17 | 3 | 10 | 26 | N/M | N/M | ||||||||||||
Net interest revenue | 814 | 815 | 730 | 802 | 841 | — | (3 | ) | ||||||||||||
Total revenue | 4,108 | 4,778 | 3,861 | 3,924 | 3,899 | (14 | ) | 5 | ||||||||||||
Provision for credit losses | 169 | (8 | ) | (16 | ) | (8 | ) | 7 | N/M | N/M | ||||||||||
Noninterest expense | 2,712 | 2,964 | 2,590 | 2,647 | 2,699 | (9 | ) | — | ||||||||||||
Income before income taxes | 1,227 | 1,822 | 1,287 | 1,285 | 1,193 | (33 | ) | 3 | ||||||||||||
Provision for income taxes | 265 | 373 | 246 | 264 | 237 | (29 | ) | 12 | ||||||||||||
Net income | $ | 962 | $ | 1,449 | $ | 1,041 | $ | 1,021 | $ | 956 | (34 | )% | 1 | % | ||||||
Net income applicable to common shareholders of The Bank of New York Mellon Corporation | $ | 944 | $ | 1,391 | $ | 1,002 | $ | 969 | $ | 910 | (32 | )% | 4 | % | ||||||
Diluted earnings per common share | $ | 1.05 | $ | 1.52 | $ | 1.07 | $ | 1.01 | $ | 0.94 | (31 | )% | 12 | % | ||||||
Average common shares and equivalents outstanding - diluted (in thousands) | 896,689 | 914,739 | 935,677 | 953,928 | 965,960 | (2 | )% | (7 | )% | |||||||||||
Financial ratios (Quarterly returns are annualized) | ||||||||||||||||||||
Pre-tax operating margin | 30 | % | 38 | % | 33 | % | 33 | % | 31 | % | ||||||||||
Return on common equity | 10.1 | % | 14.6 | % | 10.6 | % | 10.4 | % | 10.0 | % | ||||||||||
Return on tangible common equity – Non-GAAP (a) | 20.4 | % | 29.3 | % | 21.4 | % | 21.2 | % | 20.7 | % | ||||||||||
Non-U.S. revenue as a percentage of total revenue | 36 | % | 31 | % | 37 | % | 36 | % | 36 | % | ||||||||||
Period end | ||||||||||||||||||||
Assets under custody and/or administration (“AUC/A”) (in trillions) (b) | $ | 35.2 | $ | 37.1 | $ | 35.8 | $ | 35.5 | $ | 34.5 | (5 | )% | 2 | % | ||||||
Assets under management (“AUM”) (in trillions) | $ | 1.80 | $ | 1.91 | $ | 1.88 | $ | 1.84 | $ | 1.84 | (6 | )% | (2 | )% | ||||||
Full-time employees | 47,900 | 48,400 | 48,700 | 49,100 | 49,800 | (1 | )% | (4 | )% | |||||||||||
Book value per common share | $ | 42.47 | $ | 42.12 | $ | 40.75 | $ | 40.30 | $ | 39.36 | ||||||||||
Tangible book value per common share – Non-GAAP (a) | $ | 21.53 | $ | 21.33 | $ | 20.59 | $ | 20.45 | $ | 19.74 | ||||||||||
Cash dividends per common share | $ | 0.31 | $ | 0.31 | $ | 0.31 | $ | 0.28 | $ | 0.28 | ||||||||||
Common dividend payout ratio | 30 | % | 20 | % | 29 | % | 28 | % | 30 | % | ||||||||||
Closing stock price per common share | $ | 33.68 | $ | 50.33 | $ | 45.21 | $ | 44.15 | $ | 50.43 | ||||||||||
Market capitalization | $ | 29,822 | $ | 45,331 | $ | 41,693 | $ | 41,619 | $ | 48,288 | ||||||||||
Common shares outstanding (in thousands) | 885,443 | 900,683 | 922,199 | 942,662 | 957,517 | |||||||||||||||
Capital ratios at period end (c) | ||||||||||||||||||||
Common Equity Tier 1 ("CET1") ratio | 11.3 | % | 11.5 | % | 11.1 | % | 11.1 | % | 11.1 | % | ||||||||||
Tier 1 capital ratio | 13.5 | % | 13.7 | % | 13.2 | % | 13.2 | % | 13.2 | % | ||||||||||
Total capital ratio | 14.3 | % | 14.4 | % | 14.0 | % | 14.0 | % | 14.0 | % | ||||||||||
Tier 1 leverage ratio | 6.0 | % | 6.6 | % | 6.5 | % | 6.8 | % | 6.8 | % | ||||||||||
Supplementary leverage ratio ("SLR") | 5.6 | % | 6.1 | % | 6.0 | % | 6.3 | % | 6.3 | % | ||||||||||
(a) Non-GAAP information, for all periods presented, excludes goodwill and intangible assets, net of deferred tax liabilities. See "Supplemental Information - Explanation of GAAP and Non-GAAP Financial Measures" beginning on page 16 for the reconciliation of Non-GAAP measures. | ||||||||||||||||||||
(b) Includes the AUC/A of CIBC Mellon Global Securities Services Company ("CIBC Mellon"), a joint venture with the Canadian Imperial Bank of Commerce, of $1.2 trillion at March 31, 2020, $1.5 trillion at Dec. 31, 2019, $1.4 trillion at Sept. 30, 2019 and June 30, 2019 and $1.3 trillion at March 31, 2019. | ||||||||||||||||||||
(c) Regulatory capital ratios for March 31, 2020 are preliminary. For our CET1, Tier 1 capital and Total capital ratios, our effective capital ratios under the U.S. capital rules are the lower of the ratios as calculated under the Standardized and Advanced Approaches, which for the prior periods, was the Advanced Approaches, and for March 31, 2020 was the Standardized Approaches for the CET1 and Tier 1 capital ratios and the Advanced Approach for the Total capital ratio. | ||||||||||||||||||||
N/M - Not meaningful. | ||||||||||||||||||||
3
THE BANK OF NEW YORK MELLON CORPORATION | | |||||||||||||||||||
CONDENSED CONSOLIDATED INCOME STATEMENT | ||||||||||||||||||||
(dollars in millions, except per share amounts; common shares in thousands) | 1Q20 vs. | |||||||||||||||||||
1Q20 | 4Q19 | 3Q19 | 2Q19 | 1Q19 | 4Q19 | 1Q19 | ||||||||||||||
Revenue | ||||||||||||||||||||
Investment services fees: | ||||||||||||||||||||
Asset servicing fees | $ | 1,159 | $ | 1,148 | $ | 1,152 | $ | 1,141 | $ | 1,122 | 1 | % | 3 | % | ||||||
Clearing services fees | 470 | 421 | 419 | 410 | 398 | 12 | 18 | |||||||||||||
Issuer services fees | 263 | 264 | 324 | 291 | 251 | — | 5 | |||||||||||||
Treasury services fees | 149 | 147 | 140 | 140 | 132 | 1 | 13 | |||||||||||||
Total investment services fees | 2,041 | 1,980 | 2,035 | 1,982 | 1,903 | 3 | 7 | |||||||||||||
Investment management and performance fees | 862 | 883 | 832 | 833 | 841 | (2 | ) | 2 | ||||||||||||
Foreign exchange and other trading revenue | 319 | 168 | 150 | 166 | 170 | 90 | 88 | |||||||||||||
Financing-related fees | 59 | 46 | 49 | 50 | 51 | 28 | 16 | |||||||||||||
Distribution and servicing | 31 | 34 | 33 | 31 | 31 | (9 | ) | — | ||||||||||||
Investment and other income | 11 | 860 | 30 | 43 | 35 | N/M | N/M | |||||||||||||
Total fee revenue | 3,323 | 3,971 | 3,129 | 3,105 | 3,031 | (16 | ) | 10 | ||||||||||||
Net securities gains (losses) | 9 | (25 | ) | (1 | ) | 7 | 1 | N/M | N/M | |||||||||||
Total fee and other revenue | 3,332 | 3,946 | 3,128 | 3,112 | 3,032 | (16 | ) | 10 | ||||||||||||
(Loss) income from consolidated investment management funds | (38 | ) | 17 | 3 | 10 | 26 | N/M | N/M | ||||||||||||
Net interest revenue | 814 | 815 | 730 | 802 | 841 | — | (3 | ) | ||||||||||||
Total revenue | 4,108 | 4,778 | 3,861 | 3,924 | 3,899 | (14 | ) | 5 | ||||||||||||
Provision for credit losses | 169 | (8 | ) | (16 | ) | (8 | ) | 7 | N/M | N/M | ||||||||||
Noninterest expense | ||||||||||||||||||||
Staff | 1,482 | 1,639 | 1,479 | 1,421 | 1,524 | (10 | ) | (3 | ) | |||||||||||
Professional, legal and other purchased services | 330 | 367 | 316 | 337 | 325 | (10 | ) | 2 | ||||||||||||
Software and equipment | 326 | 326 | 309 | 304 | 283 | — | 15 | |||||||||||||
Net occupancy | 135 | 151 | 138 | 138 | 137 | (11 | ) | (1 | ) | |||||||||||
Sub-custodian and clearing | 105 | 119 | 111 | 115 | 105 | (12 | ) | — | ||||||||||||
Distribution and servicing | 91 | 92 | 97 | 94 | 91 | (1 | ) | — | ||||||||||||
Business development | 42 | 65 | 47 | 56 | 45 | (35 | ) | (7 | ) | |||||||||||
Bank assessment charges | 35 | 32 | 31 | 31 | 31 | 9 | 13 | |||||||||||||
Amortization of intangible assets | 26 | 28 | 30 | 30 | 29 | (7 | ) | (10 | ) | |||||||||||
Other | 140 | 145 | 32 | 121 | 129 | (3 | ) | 9 | ||||||||||||
Total noninterest expense | 2,712 | 2,964 | 2,590 | 2,647 | 2,699 | (9 | ) | — | ||||||||||||
Income before income taxes | 1,227 | 1,822 | 1,287 | 1,285 | 1,193 | (33 | ) | 3 | ||||||||||||
Provision for income taxes | 265 | 373 | 246 | 264 | 237 | (29 | ) | 12 | ||||||||||||
Net income | 962 | 1,449 | 1,041 | 1,021 | 956 | (34 | ) | 1 | ||||||||||||
Net loss (income) attributable to noncontrolling interests | 18 | (9 | ) | (3 | ) | (4 | ) | (10 | ) | N/M | N/M | |||||||||
Preferred stock dividends | (36 | ) | (49 | ) | (36 | ) | (48 | ) | (36 | ) | N/M | N/M | ||||||||
Net income applicable to common shareholders of The Bank of New York Mellon Corporation | $ | 944 | $ | 1,391 | $ | 1,002 | $ | 969 | $ | 910 | (32 | )% | 4 | % | ||||||
Average common shares and equivalents outstanding: Basic | 894,122 | 911,324 | 933,264 | 951,281 | 962,397 | (2 | )% | (7 | )% | |||||||||||
Diluted | 896,689 | 914,739 | 935,677 | 953,928 | 965,960 | (2 | )% | (7 | )% | |||||||||||
Earnings per common share: Basic | $ | 1.05 | $ | 1.52 | $ | 1.07 | $ | 1.01 | $ | 0.94 | (31 | )% | 12 | % | ||||||
Diluted | $ | 1.05 | $ | 1.52 | $ | 1.07 | $ | 1.01 | $ | 0.94 | (31 | )% | 12 | % | ||||||
N/M - Not meaningful. | ||||||||||||||||||||
4
THE BANK OF NEW YORK MELLON CORPORATION | | |||||||||||||||
CONDENSED CONSOLIDATED BALANCE SHEET | ||||||||||||||||
2020 | 2019 | |||||||||||||||
(in millions) | March 31 | Dec. 31 | Sept. 30 | June 30 | March 31 | |||||||||||
Assets | ||||||||||||||||
Cash and due from banks | $ | 5,091 | $ | 4,830 | $ | 6,718 | $ | 5,556 | $ | 5,980 | ||||||
Interest-bearing deposits with the Federal Reserve and other central banks | 146,535 | 95,042 | 73,811 | 69,700 | 60,699 | |||||||||||
Interest-bearing deposits with banks | 22,672 | 14,811 | 15,417 | 15,491 | 13,681 | |||||||||||
Federal funds sold and securities purchased under resale agreements | 27,363 | 30,182 | 43,723 | 61,201 | 40,158 | |||||||||||
Securities | 139,273 | 123,033 | 122,340 | 120,142 | 117,504 | |||||||||||
Trading assets | 12,918 | 13,571 | 10,180 | 8,629 | 6,868 | |||||||||||
Loans | 62,368 | 54,953 | 54,881 | 52,396 | 53,487 | |||||||||||
Allowance for loan losses | (140 | ) | (122 | ) | (127 | ) | (146 | ) | (146 | ) | ||||||
Net loans | 62,228 | 54,831 | 54,754 | 52,250 | 53,341 | |||||||||||
Premises and equipment | 3,514 | 3,625 | 3,149 | 2,970 | 3,010 | |||||||||||
Accrued interest receivable | 576 | 624 | 596 | 658 | 651 | |||||||||||
Goodwill | 17,240 | 17,386 | 17,248 | 17,337 | 17,367 | |||||||||||
Intangible assets | 3,070 | 3,107 | 3,124 | 3,160 | 3,193 | |||||||||||
Other assets | 27,446 | 20,221 | 21,727 | 23,737 | 23,228 | |||||||||||
Subtotal assets of operations | 467,926 | 381,263 | 372,787 | 380,831 | 345,680 | |||||||||||
Assets of consolidated investment management funds, at fair value | 229 | 245 | 381 | 337 | 452 | |||||||||||
Total assets | $ | 468,155 | $ | 381,508 | $ | 373,168 | $ | 381,168 | $ | 346,132 | ||||||
Liabilities | ||||||||||||||||
Deposits | $ | 336,717 | $ | 259,466 | $ | 249,660 | $ | 252,877 | $ | 222,382 | ||||||
Federal funds purchased and securities sold under repurchase agreements | 13,128 | 11,401 | 11,796 | 11,757 | 11,761 | |||||||||||
Trading liabilities | 6,625 | 4,841 | 4,756 | 3,768 | 3,892 | |||||||||||
Payables to customers and broker-dealers | 24,016 | 18,758 | 18,364 | 18,946 | 19,310 | |||||||||||
Commercial paper | 1,121 | 3,959 | 3,538 | 8,894 | 2,773 | |||||||||||
Other borrowed funds | 1,544 | 599 | 820 | 1,921 | 3,932 | |||||||||||
Accrued taxes and other expenses | 4,705 | 5,642 | 5,081 | 5,045 | 4,686 | |||||||||||
Other liabilities | 11,425 | 7,612 | 9,796 | 7,916 | 8,050 | |||||||||||
Long-term debt | 27,494 | 27,501 | 27,872 | 28,203 | 27,874 | |||||||||||
Subtotal liabilities of operations | 426,775 | 339,779 | 331,683 | 339,327 | 304,660 | |||||||||||
Liabilities of consolidated investment management funds, at fair value | 1 | 1 | 15 | 6 | 3 | |||||||||||
Total liabilities | 426,776 | 339,780 | 331,698 | 339,333 | 304,663 | |||||||||||
Temporary equity | ||||||||||||||||
Redeemable noncontrolling interests | 140 | 143 | 147 | 136 | 122 | |||||||||||
Permanent equity | ||||||||||||||||
Preferred stock | 3,542 | 3,542 | 3,542 | 3,542 | 3,542 | |||||||||||
Common stock | 14 | 14 | 14 | 14 | 14 | |||||||||||
Additional paid-in capital | 27,644 | 27,515 | 27,471 | 27,406 | 27,349 | |||||||||||
Retained earnings | 32,601 | 31,894 | 30,789 | 30,081 | 29,382 | |||||||||||
Accumulated other comprehensive loss, net of tax | (2,827 | ) | (2,638 | ) | (2,893 | ) | (2,688 | ) | (2,990 | ) | ||||||
Less: Treasury stock, at cost | (19,829 | ) | (18,844 | ) | (17,803 | ) | (16,822 | ) | (16,072 | ) | ||||||
Total The Bank of New York Mellon Corporation shareholders’ equity | 41,145 | 41,483 | 41,120 | 41,533 | 41,225 | |||||||||||
Nonredeemable noncontrolling interests of consolidated investment management funds | 94 | 102 | 203 | 166 | 122 | |||||||||||
Total permanent equity | 41,239 | 41,585 | 41,323 | 41,699 | 41,347 | |||||||||||
Total liabilities, temporary equity and permanent equity | $ | 468,155 | $ | 381,508 | $ | 373,168 | $ | 381,168 | $ | 346,132 | ||||||
5
THE BANK OF NEW YORK MELLON CORPORATION | | |||||||||||||||||||
FEE AND OTHER REVENUE | ||||||||||||||||||||
1Q20 vs. | ||||||||||||||||||||
(dollars in millions) | 1Q20 | 4Q19 | 3Q19 | 2Q19 | 1Q19 | 4Q19 | 1Q19 | |||||||||||||
Investment services fees: | ||||||||||||||||||||
Asset servicing fees (a) | $ | 1,108 | $ | 1,104 | $ | 1,109 | $ | 1,097 | $ | 1,074 | — | % | 3 | % | ||||||
Securities lending revenue | 51 | 44 | 43 | 44 | 48 | 16 | 6 | |||||||||||||
Clearing services fees (b) | 470 | 421 | 419 | 410 | 398 | 12 | 18 | |||||||||||||
Issuer services fees | 263 | 264 | 324 | 291 | 251 | — | 5 | |||||||||||||
Treasury services fees | 149 | 147 | 140 | 140 | 132 | 1 | 13 | |||||||||||||
Total investment services fees | 2,041 | 1,980 | 2,035 | 1,982 | 1,903 | 3 | 7 | |||||||||||||
Investment management and performance fees (c) | ||||||||||||||||||||
Investment management fee | 812 | 835 | 830 | 831 | 810 | (3 | ) | — | ||||||||||||
Performance fees | 50 | 48 | 2 | 2 | 31 | N/M | N/M | |||||||||||||
Total investment management and performance fees (d) | 862 | 883 | 832 | 833 | 841 | (2 | ) | 2 | ||||||||||||
Foreign exchange and other trading revenue: | ||||||||||||||||||||
Foreign exchange | 253 | 138 | 129 | 150 | 160 | 83 | 58 | |||||||||||||
Other trading revenue | 66 | 30 | 21 | 16 | 10 | N/M | N/M | |||||||||||||
Total foreign exchange and other trading revenue | 319 | 168 | 150 | 166 | 170 | 90 | 88 | |||||||||||||
Financing-related fees | 59 | 46 | 49 | 50 | 51 | 28 | 16 | |||||||||||||
Distribution and servicing | 31 | 34 | 33 | 31 | 31 | (9 | ) | — | ||||||||||||
Investment and other income: | ||||||||||||||||||||
Corporate/bank-owned life insurance | 36 | 43 | 33 | 32 | 30 | N/M | N/M | |||||||||||||
Expense reimbursements from joint venture | 21 | 20 | 21 | 19 | 19 | N/M | N/M | |||||||||||||
Asset-related gains | 4 | 815 | 2 | 1 | 1 | N/M | N/M | |||||||||||||
Seed capital (losses) gains (c) | (31 | ) | 4 | — | 8 | 2 | N/M | N/M | ||||||||||||
Other (loss) | (19 | ) | (22 | ) | (26 | ) | (17 | ) | (17 | ) | N/M | N/M | ||||||||
Total investment and other income (c) | 11 | 860 | 30 | 43 | 35 | N/M | N/M | |||||||||||||
Total fee revenue | 3,323 | 3,971 | 3,129 | 3,105 | 3,031 | (16 | ) | 10 | ||||||||||||
Net securities gains (losses) | 9 | (25 | ) | (1 | ) | 7 | 1 | N/M | N/M | |||||||||||
Total fee and other revenue | $ | 3,332 | $ | 3,946 | $ | 3,128 | $ | 3,112 | $ | 3,032 | (16 | )% | 10 | % | ||||||
(a) Asset servicing fees include the fees from the Clearance and Collateral Management business. | ||||||||||||||||||||
(b) Clearing services fees are almost entirely earned by our Pershing business. | ||||||||||||||||||||
(c) Excludes seed capital gains related to consolidated investment management funds, which are reflected in operations of consolidated investment management funds. | ||||||||||||||||||||
(d) On a constant currency basis (Non-GAAP), investment management and performance fees increased 3% compared with 1Q19. See "Supplemental Information - Explanation of GAAP and Non-GAAP Financial Measures" beginning on page 16 for the reconciliation of this Non-GAAP measure. | ||||||||||||||||||||
N/M - Not meaningful. | ||||||||||||||||||||
6
THE BANK OF NEW YORK MELLON CORPORATION | | |||||||||||||||||||||||||||||
AVERAGE BALANCES AND INTEREST RATES | ||||||||||||||||||||||||||||||
1Q20 | 4Q19 | 3Q19 | 2Q19 | 1Q19 | ||||||||||||||||||||||||||
Average balance | Average rate | Average balance | Average rate | Average balance | Average rate | Average balance | Average rate | Average balance | Average rate | |||||||||||||||||||||
(dollars in millions; average rates are annualized) | ||||||||||||||||||||||||||||||
Assets | ||||||||||||||||||||||||||||||
Interest-earning assets: | ||||||||||||||||||||||||||||||
Interest-bearing deposits with the Federal Reserve and other central banks | $ | 80,403 | 0.39 | % | $ | 61,627 | 0.60 | % | $ | 60,030 | 0.67 | % | $ | 61,756 | 0.72 | % | $ | 63,583 | 0.87 | % | ||||||||||
Interest-bearing deposits with banks (primarily foreign banks) | 17,081 | 1.37 | 15,788 | 1.63 | 15,324 | 1.89 | 13,666 | 1.87 | 13,857 | 1.85 | ||||||||||||||||||||
Federal funds sold and securities purchased under resale agreements (a) | 34,109 | 4.67 | 38,846 | 4.62 | 40,816 | 6.42 | 38,038 | 5.99 | 28,968 | 6.63 | ||||||||||||||||||||
Margin loans | 12,984 | 2.69 | 11,609 | 3.25 | 10,303 | 4.02 | 10,920 | 4.36 | 12,670 | 4.34 | ||||||||||||||||||||
Non-margin loans: | ||||||||||||||||||||||||||||||
Domestic offices | 31,720 | 3.02 | 29,690 | 3.36 | 29,285 | 2.75 | (b) | 29,492 | 3.86 | 28,177 | 3.85 | |||||||||||||||||||
Foreign offices | 11,170 | 2.55 | 11,418 | 2.70 | 11,247 | 2.97 | 9,961 | 3.29 | 10,511 | 3.32 | ||||||||||||||||||||
Total non-margin loans | 42,890 | 2.89 | 41,108 | 3.18 | 40,532 | 2.81 | (b) | 39,453 | 3.71 | 38,688 | 3.70 | |||||||||||||||||||
Securities: | ||||||||||||||||||||||||||||||
U.S. government obligations | 23,175 | 1.87 | 18,444 | 2.08 | 19,315 | 2.11 | 18,870 | 2.19 | 23,597 | 2.22 | ||||||||||||||||||||
U.S. government agency obligations | 69,046 | 2.32 | 67,494 | 2.36 | 67,235 | 2.49 | 66,445 | 2.58 | 64,867 | 2.63 | ||||||||||||||||||||
State and political subdivisions (c) | 1,033 | 3.06 | 1,134 | 3.03 | 1,217 | 3.05 | 1,735 | 2.89 | 2,206 | 2.71 | ||||||||||||||||||||
Other securities (c) | 36,375 | 0.95 | 35,242 | 1.64 | 33,729 | 1.75 | 30,770 | 2.04 | 28,647 | 2.13 | ||||||||||||||||||||
Trading securities (c) | 6,840 | 2.36 | 6,695 | 2.41 | 5,653 | 2.80 | 5,764 | 2.72 | 5,102 | 2.91 | ||||||||||||||||||||
Total securities (c) | 136,469 | 1.88 | 129,009 | 2.13 | 127,149 | 2.25 | 123,584 | 2.40 | 124,419 | 2.45 | ||||||||||||||||||||
Total interest-earning assets (c) | $ | 323,936 | 1.95 | % | $ | 297,987 | 2.30 | % | $ | 294,154 | 2.63 | % | (b) | $ | 287,417 | 2.74 | % | $ | 282,185 | 2.75 | % | |||||||||
Noninterest-earning assets | 61,342 | 56,354 | 56,525 | 54,967 | 53,980 | |||||||||||||||||||||||||
Total assets | $ | 385,278 | $ | 354,341 | $ | 350,679 | $ | 342,384 | $ | 336,165 | ||||||||||||||||||||
Liabilities and equity | ||||||||||||||||||||||||||||||
Interest-bearing liabilities: | ||||||||||||||||||||||||||||||
Interest-bearing deposits: | ||||||||||||||||||||||||||||||
Domestic offices | $ | 99,915 | 0.69 | % | $ | 87,162 | 0.98 | % | $ | 82,663 | 1.28 | % | $ | 74,180 | 1.36 | % | $ | 70,562 | 1.29 | % | ||||||||||
Foreign offices | 97,717 | 0.29 | 95,262 | 0.49 | 94,738 | 0.71 | 93,365 | 0.78 | 89,317 | 0.76 | ||||||||||||||||||||
Total interest-bearing deposits | 197,632 | 0.49 | 182,424 | 0.73 | 177,401 | 0.98 | 167,545 | 1.04 | 159,879 | 0.99 | ||||||||||||||||||||
Federal funds purchased and securities sold under repurchase agreements (a) | 13,919 | 7.96 | 12,668 | 9.11 | 13,432 | 13.08 | 11,809 | 12.64 | 11,922 | 11.26 | ||||||||||||||||||||
Trading liabilities | 1,626 | 1.61 | 1,504 | 2.25 | 1,371 | 2.33 | 1,735 | 2.47 | 1,305 | 2.25 | ||||||||||||||||||||
Other borrowed funds | 719 | 2.27 | 709 | 2.83 | 1,148 | 3.24 | 2,455 | 3.36 | 3,305 | 2.87 | ||||||||||||||||||||
Commercial paper | 1,581 | 1.56 | 1,792 | 1.66 | 3,796 | 2.26 | 2,957 | 2.43 | 1,377 | 2.44 | ||||||||||||||||||||
Payables to customers and broker-dealers | 16,386 | 0.73 | 15,178 | 1.07 | 15,440 | 1.52 | 15,666 | 1.76 | 16,108 | 1.76 | ||||||||||||||||||||
Long-term debt | 27,231 | 2.83 | 28,117 | 3.09 | 28,386 | 3.24 | 27,681 | 3.45 | 28,254 | 3.52 | ||||||||||||||||||||
Total interest-bearing liabilities | $ | 259,094 | 1.17 | % | $ | 242,392 | 1.48 | % | $ | 240,974 | 1.99 | % | $ | 229,848 | 2.03 | % | $ | 222,150 | 1.96 | % | ||||||||||
Total noninterest-bearing deposits | 60,577 | 49,632 | 49,027 | 52,956 | 54,583 | |||||||||||||||||||||||||
Other noninterest-bearing liabilities | 24,229 | 20,681 | 19,280 | 18,362 | 18,628 | |||||||||||||||||||||||||
Total The Bank of New York Mellon Corporation shareholders’ equity | 41,206 | 41,384 | 41,139 | 41,029 | 40,628 | |||||||||||||||||||||||||
Noncontrolling interests | 172 | 252 | 259 | 189 | 176 | |||||||||||||||||||||||||
Total liabilities and equity | $ | 385,278 | $ | 354,341 | $ | 350,679 | $ | 342,384 | $ | 336,165 | ||||||||||||||||||||
Net interest margin | 1.01 | % | 1.09 | % | 0.99 | % | (b) | 1.12 | % | 1.20 | % | |||||||||||||||||||
Net interest margin (FTE) – Non-GAAP (d) | 1.01 | % | 1.09 | % | 1.00 | % | (b) | 1.12 | % | 1.20 | % | |||||||||||||||||||
(a) Includes the average impact of offsetting under enforceable netting agreements of approximately $80 billion for 1Q20, $60 billion for 4Q19, $68 billion for 3Q19, $51 billion for 2Q19 and $44 billion for 1Q19. On a Non-GAAP basis, excluding the impact of offsetting, the yield on federal funds sold and securities purchased under resale agreements would have been 1.39% for 1Q20, 1.82% for 4Q19, 2.42% for 3Q19, 2.57% for 2Q19 and 2.63% for 1Q19. On a Non-GAAP basis, excluding the impact of offsetting, the rate on federal funds purchased and securities sold under repurchase agreements would have been 1.18% for 1Q20, 1.59% for 4Q19, 2.17% for 3Q19, 2.39% for 2Q19 and 2.40% for 1Q19. We believe providing the rates excluding the impact of netting is useful to investors as it is more reflective of the actual rates earned and paid. | ||||||||||||||||||||||||||||||
(b) Includes the impact of the lease-related impairment of $70 million in 3Q19. On a Non-GAAP basis, excluding the lease-related impairment, the yield on non-margin loans in domestic offices would have been 3.70%, the yield on total non-margin loans would have been 3.50%, the yield on total interest-earning assets would have been 2.72% and the net interest margin and the net interest margin (FTE) – Non-GAAP would have been 1.09% in 3Q19. | ||||||||||||||||||||||||||||||
(c) Average rates were calculated on an FTE basis, at tax rates of approximately 21%. | ||||||||||||||||||||||||||||||
(d) See "Supplemental Information - Explanation of GAAP and Non-GAAP Financial Measures" beginning on page 16 for the reconciliation of this Non-GAAP measure. | ||||||||||||||||||||||||||||||
7
THE BANK OF NEW YORK MELLON CORPORATION | | |||||||||||||||
CAPITAL AND LIQUIDITY | ||||||||||||||||
2020 | 2019 | |||||||||||||||
(dollars in millions) | March 31 | Dec. 31 | Sept. 30 | June 30 | March 31 | |||||||||||
Consolidated regulatory capital ratios (a) | ||||||||||||||||
Standardized Approach: | ||||||||||||||||
CET1 capital | $ | 18,465 | $ | 18,540 | $ | 18,196 | $ | 18,534 | $ | 18,156 | ||||||
Tier 1 capital | 21,934 | 21,996 | 21,677 | 22,015 | 21,639 | |||||||||||
Total capital | 23,491 | 23,449 | 23,145 | 23,500 | 23,136 | |||||||||||
Risk-weighted assets | 162,872 | 148,695 | 148,399 | 149,226 | 151,101 | |||||||||||
CET1 ratio | 11.3 | % | 12.5 | % | 12.3 | % | 12.4 | % | 12.0 | % | ||||||
Tier 1 capital ratio | 13.5 | 14.8 | 14.6 | 14.8 | 14.3 | |||||||||||
Total capital ratio | 14.4 | 15.8 | 15.6 | 15.7 | 15.3 | |||||||||||
Advanced Approaches: | ||||||||||||||||
CET1 capital | $ | 18,465 | $ | 18,540 | $ | 18,196 | $ | 18,534 | $ | 18,156 | ||||||
Tier 1 capital | 21,934 | 21,996 | 21,677 | 22,015 | 21,639 | |||||||||||
Total capital | 23,241 | 23,233 | 22,921 | 23,300 | 22,941 | |||||||||||
Risk-weighted assets | 162,386 | 160,898 | 164,172 | 166,570 | 163,618 | |||||||||||
CET1 ratio | 11.4 | % | 11.5 | % | 11.1 | % | 11.1 | % | 11.1 | % | ||||||
Tier 1 capital ratio | 13.5 | 13.7 | 13.2 | 13.2 | 13.2 | |||||||||||
Total capital ratio | 14.3 | 14.4 | 14.0 | 14.0 | 14.0 | |||||||||||
Tier 1 leverage ratio | 6.0 | % | 6.6 | % | 6.5 | % | 6.8 | % | 6.8 | % | ||||||
SLR: | ||||||||||||||||
Leverage exposure | $ | 392,708 | $ | 362,452 | $ | 359,023 | $ | 350,747 | $ | 344,829 | ||||||
SLR | 5.6 | % | 6.1 | % | 6.0 | % | 6.3 | % | 6.3 | % | ||||||
Average liquidity coverage ratio | 115 | % | 120 | % | 117 | % | 117 | % | 118 | % | ||||||
(a) Regulatory capital ratios for March 31, 2020 are preliminary. For our CET1, Tier 1 capital and Total capital ratios, our effective capital ratios under the U.S. capital rules are the lower of the ratios as calculated under the Standardized and Advanced Approaches, which for the prior periods, was the Advanced Approaches, and for March 31, 2020 was the Standardized Approaches for the CET1 and Tier 1 capital ratios and the Advanced Approach for the Total capital ratio. . | ||||||||||||||||
8
THE BANK OF NEW YORK MELLON CORPORATION | | |||||||||||||||||||||||
INVESTMENT SERVICES BUSINESS | ||||||||||||||||||||||||
1Q20 vs. | ||||||||||||||||||||||||
(dollars in millions) | 1Q20 | 4Q19 | (a) | 3Q19 | (a) | 2Q19 | (a) | 1Q19 | (a) | 4Q19 | 1Q19 | |||||||||||||
Revenue: | ||||||||||||||||||||||||
Investment services fees: | ||||||||||||||||||||||||
Asset servicing fees (ex. securities lending revenue) (b) | $ | 1,101 | $ | 1,098 | $ | 1,099 | $ | 1,086 | $ | 1,067 | — | % | 3 | % | ||||||||||
Securities lending revenue | 46 | 40 | 39 | 40 | 44 | 15 | 5 | |||||||||||||||||
Clearing services fees (c) | 470 | 421 | 419 | 411 | 398 | 12 | 18 | |||||||||||||||||
Issuer services fees | 263 | 264 | 324 | 291 | 251 | — | 5 | |||||||||||||||||
Treasury services fees | 149 | 147 | 139 | 140 | 132 | 1 | 13 | |||||||||||||||||
Total investment services fees | 2,029 | 1,970 | 2,020 | 1,968 | 1,892 | 3 | 7 | |||||||||||||||||
Foreign exchange and other trading revenue | 261 | 151 | 160 | 153 | 157 | 73 | 66 | |||||||||||||||||
Other (d) | 146 | 115 | 116 | 112 | 112 | 27 | 30 | |||||||||||||||||
Total fee and other revenue | 2,436 | 2,236 | 2,296 | 2,233 | 2,161 | 9 | 13 | |||||||||||||||||
Net interest revenue | 806 | 778 | 761 | 783 | 804 | 4 | — | |||||||||||||||||
Total revenue | 3,242 | 3,014 | 3,057 | 3,016 | 2,965 | 8 | 9 | |||||||||||||||||
Provision for credit losses | 149 | (5 | ) | (15 | ) | (4 | ) | 8 | N/M | N/M | ||||||||||||||
Noninterest expense (ex. amortization of intangible assets) | 1,969 | 2,160 | 1,952 | 1,943 | 1,961 | (9 | ) | — | ||||||||||||||||
Amortization of intangible assets | 18 | 19 | 21 | 20 | 20 | (5 | ) | (10 | ) | |||||||||||||||
Total noninterest expense | 1,987 | 2,179 | 1,973 | 1,963 | 1,981 | (9 | ) | — | ||||||||||||||||
Income before taxes | $ | 1,106 | $ | 840 | $ | 1,099 | $ | 1,057 | $ | 976 | 32 | % | 13 | % | ||||||||||
Pre-tax operating margin | 34 | % | 28 | % | 36 | % | 35 | % | 33 | % | ||||||||||||||
Total revenue by line of business: | ||||||||||||||||||||||||
Asset Servicing | $ | 1,531 | $ | 1,411 | $ | 1,411 | $ | 1,397 | $ | 1,415 | 9 | % | 8 | % | ||||||||||
Pershing | 653 | 579 | 575 | 572 | 561 | 13 | 16 | |||||||||||||||||
Issuer Services | 419 | 415 | 466 | 446 | 396 | 1 | 6 | |||||||||||||||||
Treasury Services | 339 | 329 | 312 | 317 | 317 | 3 | 7 | |||||||||||||||||
Clearance and Collateral Management | 300 | 280 | 293 | 284 | 276 | 7 | 9 | |||||||||||||||||
Total revenue by line of business | $ | 3,242 | $ | 3,014 | $ | 3,057 | $ | 3,016 | $ | 2,965 | 8 | % | 9 | % | ||||||||||
(a) Prior periods have been restated. See “Segment Reporting Changes” on page 19 for additional information. | ||||||||||||||||||||||||
(b) Asset servicing fees include the fees from the Clearance and Collateral Management business. | ||||||||||||||||||||||||
(c) Clearing services fees are almost entirely earned by our Pershing business. | ||||||||||||||||||||||||
(d) Other revenue includes investment management fees, financing-related fees, distribution and servicing revenue, securities gains and losses and investment and other income. | ||||||||||||||||||||||||
N/M - Not meaningful. | ||||||||||||||||||||||||
9
THE BANK OF NEW YORK MELLON CORPORATION | | |||||||||||||||||||||||
INVESTMENT SERVICES BUSINESS | ||||||||||||||||||||||||
1Q20 vs. | ||||||||||||||||||||||||
(dollars in millions, unless otherwise noted) | 1Q20 | 4Q19 | 3Q19 | 2Q19 | 1Q19 | 4Q19 | 1Q19 | |||||||||||||||||
Average loans | $ | 41,789 | $ | 38,721 | (a) | $ | 37,005 | (a) | $ | 36,404 | (a) | $ | 37,235 | (a) | 8 | % | 12 | % | ||||||
Average assets | $ | 304,089 | $ | 278,098 | (a) | $ | 269,926 | (a) | $ | 264,781 | (a) | $ | 256,034 | (a) | 9 | % | 19 | % | ||||||
Average deposits | $ | 242,187 | $ | 215,388 | (a) | $ | 208,044 | (a) | $ | 201,146 | (a) | $ | 195,082 | (a) | 12 | % | 24 | % | ||||||
AUC/A at period end (in trillions) (b)(c) | $ | 35.2 | $ | 37.1 | $ | 35.8 | $ | 35.5 | $ | 34.5 | (5 | )% | 2 | % | ||||||||||
Market value of securities on loan at period end (in billions) (d) | $ | 389 | $ | 378 | $ | 362 | $ | 369 | $ | 377 | 3 | % | 3 | % | ||||||||||
Pershing | ||||||||||||||||||||||||
Net new assets (U.S. platform) (in billions) (e) | $ | 31 | $ | 33 | $ | 19 | $ | 21 | $ | — | (6 | )% | N/M | |||||||||||
Average active clearing accounts (U.S. platform) (in thousands) | 6,437 | 6,340 | 6,283 | 6,254 | 6,169 | 2 | % | 4 | % | |||||||||||||||
Average long-term mutual fund assets (U.S. platform) | $ | 549,206 | $ | 573,475 | $ | 547,522 | $ | 532,384 | $ | 507,606 | (4 | )% | 8 | % | ||||||||||
Average investor margin loans (U.S. platform) | $ | 9,419 | $ | 9,420 | $ | 9,222 | $ | 9,440 | $ | 10,093 | — | (7 | )% | |||||||||||
Clearance and Collateral Management | ||||||||||||||||||||||||
Average tri-party collateral management balances (in billions) | $ | 3,724 | $ | 3,562 | $ | 3,550 | $ | 3,400 | $ | 3,266 | 5 | % | 14 | % | ||||||||||
(a) Prior periods have been restated. See “Segment Reporting Changes” on page 19 for additional information. | ||||||||||||||||||||||||
(b) March 31, 2020 information is preliminary. | ||||||||||||||||||||||||
(c) Includes the AUC/A of CIBC Mellon of $1.2 trillion at March 31, 2020, $1.5 trillion at Dec. 31, 2019, $1.4 trillion at Sept. 30, 2019 and June 30, 2019 and $1.3 trillion at March 31, 2019. | ||||||||||||||||||||||||
(d) Represents the total amount of securities on loan in our agency securities lending program managed by the Investment Services business. Excludes securities for which BNY Mellon acts as agent on behalf of CIBC Mellon clients, which totaled $59 billion at March 31, 2020, $60 billion at Dec. 31, 2019, $66 billion at Sept. 30, 2019, $64 billion at June 30, 2019 and $62 billion at March 31, 2019. | ||||||||||||||||||||||||
(e) Net new assets represents net flows of assets (e.g., net cash deposits and net securities transfers) in customer accounts in Pershing LLC, a U.S. broker-dealer. | ||||||||||||||||||||||||
N/M - Not meaningful. | ||||||||||||||||||||||||
10
THE BANK OF NEW YORK MELLON CORPORATION | | |||||||||||||||||||||||
INVESTMENT MANAGEMENT BUSINESS | ||||||||||||||||||||||||
1Q20 vs. | ||||||||||||||||||||||||
(dollars in millions) | 1Q20 | 4Q19 | (a) | 3Q19 | (a) | 2Q19 | (a) | 1Q19 | (a) | 4Q19 | 1Q19 | |||||||||||||
Revenue: | ||||||||||||||||||||||||
Investment management fees (b) | $ | 812 | $ | 836 | $ | 830 | $ | 831 | $ | 810 | (3 | )% | — | % | ||||||||||
Performance fees | 50 | 48 | 2 | 2 | 31 | N/M | 61 | |||||||||||||||||
Investment management and performance fees (c) | 862 | 884 | 832 | 833 | 841 | (2 | ) | 2 | ||||||||||||||||
Distribution and servicing | 43 | 44 | 45 | 44 | 45 | (2 | ) | (4 | ) | |||||||||||||||
Other (b) | (59 | ) | (4 | ) | (39 | ) | (23 | ) | (17 | ) | N/M | N/M | ||||||||||||
Total fee and other revenue (b) | 846 | 924 | 838 | 854 | 869 | (8 | ) | (3 | ) | |||||||||||||||
Net interest revenue | 52 | 47 | 49 | 59 | 67 | 11 | (22 | ) | ||||||||||||||||
Total revenue | 898 | 971 | 887 | 913 | 936 | (8 | ) | (4 | ) | |||||||||||||||
Provision for credit losses | 9 | — | — | (2 | ) | 1 | N/M | N/M | ||||||||||||||||
Noninterest expense (ex. amortization of intangible assets) | 687 | 722 | 582 | 646 | 660 | (5 | ) | 4 | ||||||||||||||||
Amortization of intangible assets | 8 | 9 | 10 | 9 | 9 | (11 | ) | (11 | ) | |||||||||||||||
Total noninterest expense | 695 | 731 | 592 | 655 | 669 | (5 | ) | 4 | ||||||||||||||||
Income before taxes | $ | 194 | $ | 240 | $ | 295 | $ | 260 | $ | 266 | (19 | )% | (27 | )% | ||||||||||
Pre-tax operating margin | 22 | % | 25 | % | 33 | % | 29 | % | 28 | % | ||||||||||||||
Adjusted pre-tax operating margin – Non-GAAP (d) | 24 | % | 27 | % | 37 | % | 32 | % | 31 | % | ||||||||||||||
Total revenue by line of business: | ||||||||||||||||||||||||
Asset Management | $ | 620 | $ | 692 | $ | 608 | $ | 622 | $ | 640 | (10 | )% | (3 | )% | ||||||||||
Wealth Management | 278 | 279 | 279 | 291 | 296 | — | (6 | ) | ||||||||||||||||
Total revenue by line of business | $ | 898 | $ | 971 | $ | 887 | $ | 913 | $ | 936 | (8 | )% | (4 | )% | ||||||||||
Average loans | $ | 12,124 | $ | 12,022 | $ | 12,013 | $ | 12,205 | $ | 12,339 | 1 | % | (2 | )% | ||||||||||
Average assets | $ | 30,543 | $ | 28,481 | $ | 27,840 | $ | 29,793 | $ | 31,857 | 7 | % | (4 | )% | ||||||||||
Average deposits | $ | 16,144 | $ | 15,195 | $ | 14,083 | $ | 14,615 | $ | 15,815 | 6 | % | 2 | % | ||||||||||
(a) Prior periods have been restated. See “Segment Reporting Changes” on page 19 for additional information. | ||||||||||||||||||||||||
(b) Total fee and other revenue includes the impact of the consolidated investment management funds, net of noncontrolling interests. Additionally, other revenue includes asset servicing fees, treasury services fees, foreign exchange and other trading revenue and investment and other income. | ||||||||||||||||||||||||
(c) On a constant currency basis (Non-GAAP), investment management and performance fees increased 3% compared with 1Q19. See "Supplemental Information - Explanation of GAAP and Non-GAAP Financial Measures" beginning on page 16 for the reconciliation of this Non-GAAP measure. | ||||||||||||||||||||||||
(d) Net of distribution and servicing expense. See "Supplemental Information - Explanation of GAAP and Non-GAAP Financial Measures" beginning on page 16 for the reconciliation of this Non-GAAP measure. | ||||||||||||||||||||||||
N/M - Not meaningful. | ||||||||||||||||||||||||
11
THE BANK OF NEW YORK MELLON CORPORATION | | |||||||||||||||||||
AUM BY PRODUCT, AUM FLOWS AND WEALTH MANAGEMENT CLIENT ASSETS | ||||||||||||||||||||
1Q20 vs. | ||||||||||||||||||||
(dollars in billions) | 1Q20 | 4Q19 | 3Q19 | 2Q19 | 1Q19 | 4Q19 | 1Q19 | |||||||||||||
AUM by product type (a)(b) | ||||||||||||||||||||
Equity | $ | 120 | $ | 154 | $ | 147 | $ | 152 | $ | 149 | (22 | )% | (19 | )% | ||||||
Fixed income | 211 | 224 | 211 | 209 | 208 | (6 | ) | 1 | ||||||||||||
Index | 274 | 339 | 321 | 322 | 333 | (19 | ) | (18 | ) | |||||||||||
Liability-driven investments | 705 | 728 | 742 | 709 | 709 | (3 | ) | (1 | ) | |||||||||||
Multi-asset and alternative investments | 171 | 192 | 182 | 184 | 178 | (11 | ) | (4 | ) | |||||||||||
Cash | 315 | 273 | 278 | 267 | 264 | 15 | 19 | |||||||||||||
Total AUM by product type | $ | 1,796 | $ | 1,910 | $ | 1,881 | $ | 1,843 | $ | 1,841 | (6 | )% | (2 | )% | ||||||
Changes in AUM (a)(b) | ||||||||||||||||||||
Beginning balance of AUM | $ | 1,910 | $ | 1,881 | $ | 1,843 | $ | 1,841 | $ | 1,722 | ||||||||||
Net (outflows) inflows: | ||||||||||||||||||||
Long-term strategies: | ||||||||||||||||||||
Equity | (2 | ) | (6 | ) | (4 | ) | (2 | ) | (4 | ) | ||||||||||
Fixed income | — | 5 | 2 | (4 | ) | 3 | ||||||||||||||
Liability-driven investments | (5 | ) | (3 | ) | (4 | ) | 1 | 5 | ||||||||||||
Multi-asset and alternative investments | (1 | ) | 3 | (1 | ) | 1 | (4 | ) | ||||||||||||
Total long-term active strategies (outflows) | (8 | ) | (1 | ) | (7 | ) | (4 | ) | — | |||||||||||
Index | 3 | (5 | ) | (3 | ) | (22 | ) | (2 | ) | |||||||||||
Total long-term strategies (outflows) | (5 | ) | (6 | ) | (10 | ) | (26 | ) | (2 | ) | ||||||||||
Short-term strategies: | ||||||||||||||||||||
Cash | 43 | (7 | ) | 11 | 2 | 2 | ||||||||||||||
Total net inflows (outflows) | 38 | (13 | ) | 1 | (24 | ) | — | |||||||||||||
Net market impact | (91 | ) | (20 | ) | 66 | 42 | 103 | |||||||||||||
Net currency impact | (61 | ) | 62 | (29 | ) | (16 | ) | 16 | ||||||||||||
Ending balance of AUM | $ | 1,796 | $ | 1,910 | $ | 1,881 | $ | 1,843 | $ | 1,841 | (6 | )% | (2 | )% | ||||||
Wealth Management client assets (a)(c) | $ | 236 | $ | 266 | $ | 259 | $ | 257 | $ | 253 | (11 | )% | (7 | )% | ||||||
(a) March 31, 2020 information is preliminary. | ||||||||||||||||||||
(b) Excludes securities lending cash management assets and assets managed in the Investment Services business. | ||||||||||||||||||||
(c) Includes AUM and AUC/A in the Wealth Management business. | ||||||||||||||||||||
12
THE BANK OF NEW YORK MELLON CORPORATION | | ||||||||||||||||||
OTHER SEGMENT | |||||||||||||||||||
(in millions) | 1Q20 | 4Q19 | (a) | 3Q19 | (a) | 2Q19 | (a) | 1Q19 | (a) | ||||||||||
Fee revenue | $ | 21 | $ | 817 | (b) | $ | (5 | ) | $ | 24 | $ | 17 | |||||||
Net securities gains (losses) | 9 | (23 | ) | (1 | ) | 7 | 1 | ||||||||||||
Total fee and other revenue | 30 | 794 | (6 | ) | 31 | 18 | |||||||||||||
Net interest (expense) | (44 | ) | (10 | ) | (80 | ) | (40 | ) | (30 | ) | |||||||||
Total (loss) revenue | (14 | ) | 784 | (86 | ) | (9 | ) | (12 | ) | ||||||||||
Provision for credit losses | 11 | (3 | ) | (1 | ) | (2 | ) | (2 | ) | ||||||||||
Noninterest expense | 30 | 54 | 25 | 29 | 49 | ||||||||||||||
(Loss) income before taxes | $ | (55 | ) | $ | 733 | $ | (110 | ) | $ | (36 | ) | $ | (59 | ) | |||||
Average loans and leases | $ | 1,961 | $ | 1,974 | $ | 1,817 | $ | 1,764 | $ | 1,784 | |||||||||
Average assets | $ | 50,646 | $ | 47,762 | $ | 52,913 | $ | 47,810 | $ | 48,274 | |||||||||
(a) Prior periods have been restated. See “Segment Reporting Changes” on page 19 for additional information. | |||||||||||||||||||
(b) Includes a gain on sale of an equity investment. | |||||||||||||||||||
13
THE BANK OF NEW YORK MELLON CORPORATION | | |||||||||||||||||||||||||||||||
SECURITIES PORTFOLIO | ||||||||||||||||||||||||||||||||
(dollars in millions) | Dec. 31, 2019 | 1Q20 change in unrealized gain (loss) | March 31, 2020 | Fair value as a % of amortized cost (a) | Unrealized gain (loss) | Ratings (b) | ||||||||||||||||||||||||||
Amortized cost | Fair value | AAA/ AA- | A+/ A- | BBB+/ BBB- | BB+ and lower | A1+/ A1 | Not rated | |||||||||||||||||||||||||
Fair value | ||||||||||||||||||||||||||||||||
Agency RMBS | $ | 54,646 | $ | 809 | $ | 56,002 | $ | 57,078 | 102 | % | $ | 1,076 | 100 | % | — | % | — | % | — | % | — | % | — | % | ||||||||
U.S. Treasury | 18,865 | 368 | 24,367 | 24,803 | 102 | 436 | 100 | — | — | — | — | — | ||||||||||||||||||||
Sovereign debt/sovereign guaranteed | 13,404 | 23 | 13,710 | 13,833 | 101 | 123 | 72 | 6 | 21 | 1 | — | — | ||||||||||||||||||||
Agency commercial MBS | 10,613 | 295 | 11,183 | 11,534 | 103 | 351 | 100 | — | — | — | — | — | ||||||||||||||||||||
Foreign covered bonds | 4,276 | (20 | ) | 5,361 | 5,349 | 100 | (12 | ) | 100 | — | — | — | — | — | ||||||||||||||||||
Supranational | 3,734 | 13 | 4,316 | 4,339 | 101 | 23 | 100 | — | — | — | — | — | ||||||||||||||||||||
CLOs | 4,063 | (228 | ) | 4,341 | 4,098 | 94 | (243 | ) | 99 | — | — | — | — | 1 | ||||||||||||||||||
Commercial paper and certificates of deposits (c)(d) | — | 1 | 3,464 | 3,465 | 100 | 1 | — | — | — | — | 100 | — | ||||||||||||||||||||
U.S. government agencies | 2,933 | 98 | 3,303 | 3,421 | 104 | 118 | 100 | — | — | — | — | — | ||||||||||||||||||||
Foreign government agencies | 2,641 | 22 | 2,736 | 2,761 | 101 | 25 | 95 | 5 | — | — | — | — | ||||||||||||||||||||
Non-agency commercial MBS | 2,165 | (80 | ) | 2,501 | 2,452 | 98 | (49 | ) | 100 | — | — | — | — | — | ||||||||||||||||||
Other asset-backed securities | 2,143 | (39 | ) | 2,257 | 2,220 | 98 | (37 | ) | 100 | — | — | — | — | — | ||||||||||||||||||
Non-agency RMBS (e) | 1,316 | (129 | ) | 1,479 | 1,548 | 105 | 69 | 47 | 8 | 2 | 26 | — | 17 | |||||||||||||||||||
State and political subdivisions | 1,061 | (9 | ) | 983 | 1,001 | 102 | 18 | 76 | 23 | — | — | — | 1 | |||||||||||||||||||
Corporate bonds | 853 | (7 | ) | 804 | 818 | 102 | 14 | 18 | 69 | 13 | — | — | — | |||||||||||||||||||
Other | 1 | — | 1 | 1 | 100 | — | — | — | — | — | — | 100 | ||||||||||||||||||||
Total securities | $ | 122,714 | (f) | $ | 1,117 | $ | 136,808 | $ | 138,721 | (f)(g) | 101 | % | $ | 1,913 | (f)(h) | 94 | % | 1 | % | 2 | % | — | % | 3 | % | — | % | |||||
(a) Amortized cost reflects historical impairments. | ||||||||||||||||||||||||||||||||
(b) Represents ratings by S&P, or the equivalent. | ||||||||||||||||||||||||||||||||
(c) Includes $2,145 million purchased from affiliated money market funds at March 31, 2020. | ||||||||||||||||||||||||||||||||
(d) Includes $651 million funded by borrowings from the Federal Reserve Bank under its Money Market Mutual Fund Liquidity Facility (“MMLF”) program at March 31, 2020. | ||||||||||||||||||||||||||||||||
(e) Includes RMBS that were included in the former Grantor Trust of $640 million at Dec. 31, 2019 and $535 million at March 31, 2020. | ||||||||||||||||||||||||||||||||
(f) Includes net unrealized losses on derivatives hedging securities available-for-sale of $641 million at Dec. 31, 2019 and $1,665 million at March 31, 2020. | ||||||||||||||||||||||||||||||||
(h) Includes unrealized gains of $800 million at March 31, 2020 related to available-for-sale securities, net of hedges. | ||||||||||||||||||||||||||||||||
(g) At March 31, 2020, the securities portfolio, including the impact of interest rate swap hedges, is 69% fixed rate and 31% floating rate. | ||||||||||||||||||||||||||||||||
14
THE BANK OF NEW YORK MELLON CORPORATION | | ||||||||||||||||||
ALLOWANCE FOR CREDIT LOSSES AND NONPERFORMING ASSETS | |||||||||||||||||||
2020 | 2019 | ||||||||||||||||||
(dollars in millions) | March 31 | Dec. 31 | Sept. 30 | June 30 | March 31 | ||||||||||||||
Allowance for credit losses - beginning of period: | |||||||||||||||||||
Allowance for loan losses | $ | 122 | $ | 127 | $ | 146 | $ | 146 | $ | 146 | |||||||||
Allowance for lending-related commitments | 94 | 97 | 95 | 102 | 106 | ||||||||||||||
Allowance for credit losses - beginning of period | $ | 216 | $ | 224 | $ | 241 | $ | 248 | $ | 252 | |||||||||
Impact of adopting ASU 2016-13, Financial Instruments – Credit Losses: Measurement of Credit Losses on Financial Instruments, effective Jan. 1, 2020 | (55 | ) | (a) | N/A | N/A | N/A | N/A | ||||||||||||
Net (charge-offs) recoveries: | |||||||||||||||||||
Charge-offs | (1 | ) | (1 | ) | (1 | ) | (1 | ) | (11 | ) | |||||||||
Recoveries | — | 1 | — | 2 | — | ||||||||||||||
Total net (charge-offs) recoveries | (1 | ) | — | (1 | ) | 1 | (11 | ) | |||||||||||
Provision for credit losses | 169 | (a) | (8 | ) | (16 | ) | (8 | ) | 7 | ||||||||||
Allowance for credit losses - end of period | $ | 329 | $ | 216 | $ | 224 | $ | 241 | $ | 248 | |||||||||
Allowance for credit losses - end of period: | |||||||||||||||||||
Allowance for loan losses | $ | 140 | $ | 122 | $ | 127 | $ | 146 | $ | 146 | |||||||||
Allowance for lending-related commitments | 148 | 94 | 97 | 95 | 102 | ||||||||||||||
Allowance for other financial instruments | 41 | (b) | N/A | N/A | N/A | N/A | |||||||||||||
Allowance for credit losses - end of period | $ | 329 | $ | 216 | $ | 224 | $ | 241 | $ | 248 | |||||||||
Allowance for loan losses as a percentage of total loans | 0.22 | % | 0.22 | % | 0.23 | % | 0.28 | % | 0.27 | % | |||||||||
Nonperforming assets | $ | 88 | $ | 89 | $ | 88 | $ | 186 | (c) | $ | 174 | (c) | |||||||
(a) Includes all instruments within the scope of ASU 2016-13, Financial Instruments – Credit Losses: Measurement of Credit Losses on Financial Instruments. | |||||||||||||||||||
(b) Includes allowance for credit losses on federal funds sold and securities purchased under resale agreements, available-for-sale securities, accounts receivable, cash and due from banks and interest-bearing deposits with banks. | |||||||||||||||||||
(c) Includes nonperforming loans to a California utility company that filed for bankruptcy that were sold in 3Q19. | |||||||||||||||||||
N/A - Not applicable. | |||||||||||||||||||
15
THE BANK OF NEW YORK MELLON CORPORATION | | ||||||||||||||
SUPPLEMENTAL INFORMATION – EXPLANATION OF GAAP AND NON-GAAP FINANCIAL MEASURES | |||||||||||||||
BNY Mellon has included in this Financial Supplement certain Non-GAAP financial measures on a tangible basis as a supplement to GAAP information, which exclude goodwill and intangible assets, net of deferred tax liabilities. BNY Mellon believes that the return on tangible common equity is additional useful information for investors because it presents a measure of those assets that can generate income, and the tangible book value per common share is additional useful information because it presents the level of tangible assets in relation to shares of common stock outstanding. | |||||||||||||||
Net interest revenue, on a fully taxable equivalent ("FTE") basis – Non-GAAP and net interest margin (FTE) – Non-GAAP and other FTE measures include the tax equivalent adjustments on tax-exempt income which allows for the comparison of amounts arising from both taxable and tax-exempt sources and is consistent with industry practice. The adjustment to an FTE basis has no impact on net income. | |||||||||||||||
BNY Mellon has also included the operating margin for the Investment Management business net of distribution and servicing expense that was passed to third parties who distribute or service our managed funds. BNY Mellon believes that this measure is useful when evaluating the performance of the Investment Management business relative to industry competitors. | |||||||||||||||
The presentation of the growth rates of investment management and performance fees on a constant currency basis permits investors to assess the significance of changes in foreign currency exchange rates. Growth rates on a constant currency basis were determined by applying the current period foreign currency exchange rates to the prior period revenue. BNY Mellon believes that this presentation, as a supplement to GAAP information, gives investors a clearer picture of the related revenue results without the variability caused by fluctuations in foreign currency exchange rates. | |||||||||||||||
Notes: | |||||||||||||||
Certain immaterial reclassifications/revisions have been made to prior periods to place them on a basis comparable with the current period's presentation. | |||||||||||||||
In businesses where average deposits are greater than average loans, average assets include an allocation of investment securities equal to the difference. | |||||||||||||||
Quarterly return on common and tangible common equity ratios are annualized. | |||||||||||||||
Return on common equity and tangible common equity reconciliation | |||||||||||||||
(dollars in millions) | 1Q20 | 4Q19 | 3Q19 | 2Q19 | 1Q19 | ||||||||||
Net income applicable to common shareholders of The Bank of New York Mellon Corporation – GAAP | $ | 944 | $ | 1,391 | $ | 1,002 | $ | 969 | $ | 910 | |||||
Add: Amortization of intangible assets | 26 | 28 | 30 | 30 | 29 | ||||||||||
Less: Tax impact of amortization of intangible assets | 6 | 7 | 7 | 7 | 7 | ||||||||||
Adjusted net income applicable to common shareholders of The Bank of New York Mellon Corporation, excluding amortization of intangible assets – Non-GAAP | $ | 964 | $ | 1,412 | $ | 1,025 | $ | 992 | $ | 932 | |||||
Average common shareholders’ equity | $ | 37,664 | $ | 37,842 | $ | 37,597 | $ | 37,487 | $ | 37,086 | |||||
Less: Average goodwill | 17,311 | 17,332 | 17,267 | 17,343 | 17,376 | ||||||||||
Average intangible assets | 3,089 | 3,119 | 3,141 | 3,178 | 3,209 | ||||||||||
Add: Deferred tax liability – tax deductible goodwill | 1,109 | 1,098 | 1,103 | 1,094 | 1,083 | ||||||||||
Deferred tax liability – intangible assets | 666 | 670 | 679 | 687 | 690 | ||||||||||
Average tangible common shareholders’ equity – Non-GAAP | $ | 19,039 | $ | 19,159 | $ | 18,971 | $ | 18,747 | $ | 18,274 | |||||
Return on common equity – GAAP | 10.1 | % | 14.6 | % | 10.6 | % | 10.4 | % | 10.0 | % | |||||
Return on tangible common equity – Non-GAAP | 20.4 | % | 29.3 | % | 21.4 | % | 21.2 | % | 20.7 | % | |||||
16
THE BANK OF NEW YORK MELLON CORPORATION | | |||||||||||||||
SUPPLEMENTAL INFORMATION – EXPLANATION OF GAAP AND NON-GAAP FINANCIAL MEASURES | ||||||||||||||||
Book value and tangible book value per common share reconciliation | 2020 | 2019 | ||||||||||||||
(dollars in millions, except common shares) | March 31 | Dec. 31 | Sept. 30 | June 30 | March 31 | |||||||||||
BNY Mellon shareholders’ equity at period end – GAAP | $ | 41,145 | $ | 41,483 | $ | 41,120 | $ | 41,533 | $ | 41,225 | ||||||
Less: Preferred stock | 3,542 | 3,542 | 3,542 | 3,542 | 3,542 | |||||||||||
BNY Mellon common shareholders’ equity at period end – GAAP | 37,603 | 37,941 | 37,578 | 37,991 | 37,683 | |||||||||||
Less: Goodwill | 17,240 | 17,386 | 17,248 | 17,337 | 17,367 | |||||||||||
Intangible assets | 3,070 | 3,107 | 3,124 | 3,160 | 3,193 | |||||||||||
Add: Deferred tax liability – tax deductible goodwill | 1,109 | 1,098 | 1,103 | 1,094 | 1,083 | |||||||||||
Deferred tax liability – intangible assets | 666 | 670 | 679 | 687 | 690 | |||||||||||
BNY Mellon tangible common shareholders’ equity at period end – Non-GAAP | $ | 19,068 | $ | 19,216 | $ | 18,988 | $ | 19,275 | $ | 18,896 | ||||||
Period-end common shares outstanding (in thousands) | 885,443 | 900,683 | 922,199 | 942,662 | 957,517 | |||||||||||
Book value per common share – GAAP | $ | 42.47 | $ | 42.12 | $ | 40.75 | $ | 40.30 | $ | 39.36 | ||||||
Tangible book value per common share – Non-GAAP | $ | 21.53 | $ | 21.33 | $ | 20.59 | $ | 20.45 | $ | 19.74 | ||||||
Net interest margin reconciliation | ||||||||||||||||
(dollars in millions) | 1Q20 | 4Q19 | 3Q19 | 2Q19 | 1Q19 | |||||||||||
Net interest revenue – GAAP | $ | 814 | $ | 815 | $ | 730 | $ | 802 | $ | 841 | ||||||
Add: Tax equivalent adjustment | 2 | 2 | 3 | 4 | 4 | |||||||||||
Net interest revenue (FTE) – Non-GAAP | $ | 816 | $ | 817 | $ | 733 | $ | 806 | $ | 845 | ||||||
Average interest-earning assets | $ | 323,936 | $ | 297,987 | $ | 294,154 | $ | 287,417 | $ | 282,185 | ||||||
Net interest margin – GAAP (a) | 1.01 | % | 1.09 | % | 0.99 | % | 1.12 | % | 1.20 | % | ||||||
Net interest margin (FTE) – Non-GAAP (a) | 1.01 | % | 1.09 | % | 1.00 | % | 1.12 | % | 1.20 | % | ||||||
(a) Net interest margin is annualized. | ||||||||||||||||
17
THE BANK OF NEW YORK MELLON CORPORATION | | ||||||||||||||
SUPPLEMENTAL INFORMATION – EXPLANATION OF GAAP AND NON-GAAP FINANCIAL MEASURES | |||||||||||||||
Pre-tax operating margin reconciliation - Investment Management business | |||||||||||||||
(dollars in millions) | 1Q20 | 4Q19 | 3Q19 | 2Q19 | 1Q19 | ||||||||||
Income before income taxes – GAAP | $ | 194 | $ | 240 | $ | 295 | $ | 260 | $ | 266 | |||||
Total revenue – GAAP | $ | 898 | $ | 971 | $ | 887 | $ | 913 | $ | 936 | |||||
Less: Distribution and servicing expense | 91 | 93 | 98 | 94 | 91 | ||||||||||
Adjusted total revenue, net of distribution and servicing expense – Non-GAAP | $ | 807 | $ | 878 | $ | 789 | $ | 819 | $ | 845 | |||||
Pre-tax operating margin – GAAP (a) | 22 | % | 25 | % | 33 | % | 29 | % | 28 | % | |||||
Adjusted pre-tax operating margin, net of distribution and servicing expense – Non-GAAP (a) | 24 | % | 27 | % | 37 | % | 32 | % | 31 | % | |||||
(a) Income before income taxes divided by total revenue. | |||||||||||||||
Constant currency reconciliations | 1Q20 vs. | ||||||||||||||
(dollars in millions) | 1Q20 | 1Q19 | 1Q19 | ||||||||||||
Consolidated: | |||||||||||||||
Investment management and performance fees – GAAP | $ | 862 | $ | 841 | 2 | % | |||||||||
Impact of changes in foreign currency exchange rates | — | (5 | ) | ||||||||||||
Adjusted investment management and performance fees – Non-GAAP | $ | 862 | $ | 836 | 3 | % | |||||||||
Investment Management business: | |||||||||||||||
Investment management and performance fees – GAAP | $ | 862 | $ | 841 | 2 | % | |||||||||
Impact of changes in foreign currency exchange rates | — | (5 | ) | ||||||||||||
Adjusted investment management and performance fees – Non-GAAP | $ | 862 | $ | 836 | 3 | % | |||||||||
18
THE BANK OF NEW YORK MELLON CORPORATION | | |||||||||||||||||||||||||||||||||||||
SEGMENT REPORTING CHANGES | ||||||||||||||||||||||||||||||||||||||
In the first quarter of 2020, we reclassified the results of certain services provided between the segments from noninterest expense to fee and other revenue. This activity is offset in the Other segment and relates to services that are also provided to third-parties and provides consistency with the reporting of the revenues. This adjustment had no impact on income before taxes of the businesses. Prior periods have been restated. | ||||||||||||||||||||||||||||||||||||||
In the first quarter of 2020, we reclassified the results related to certain lending activities from the Wealth Management business to the Pershing business. These loans were originated by the Wealth Management business as a service to Pershing clients. This resulted in an increase in total revenue, noninterest expense and income before taxes in the Pershing business and corresponding decrease in the Wealth Management business. Prior periods have been restated. | ||||||||||||||||||||||||||||||||||||||
INVESTMENT SERVICES BUSINESS | INVESTMENT MANAGEMENT BUSINESS | OTHER SEGMENT | ||||||||||||||||||||||||||||||||||||
(dollars in millions) | 4Q19 | 3Q19 | 2Q19 | 1Q19 | 4Q19 | 3Q19 | 2Q19 | 1Q19 | 4Q19 | 3Q19 | 2Q19 | 1Q19 | ||||||||||||||||||||||||||
Before restatement | ||||||||||||||||||||||||||||||||||||||
Fee and other revenue | $ | 2,222 | $ | 2,291 | $ | 2,227 | $ | 2,154 | $ | 919 | $ | 833 | $ | 850 | $ | 864 | $ | 813 | $ | 4 | $ | 41 | $ | 30 | ||||||||||||||
Net interest revenue | 769 | 753 | 775 | 796 | 56 | 57 | 67 | 75 | (10 | ) | (80 | ) | (40 | ) | (30 | ) | ||||||||||||||||||||||
Total revenue | 2,991 | 3,044 | 3,002 | 2,950 | 975 | 890 | 917 | 939 | 803 | (76 | ) | 1 | — | |||||||||||||||||||||||||
Provision for credit losses | (5 | ) | (15 | ) | (4 | ) | 8 | — | — | (2 | ) | 1 | (3 | ) | (1 | ) | (2 | ) | (2 | ) | ||||||||||||||||||
Total noninterest expense | 2,161 | 1,965 | 1,954 | 1,969 | 730 | 590 | 654 | 669 | 73 | 35 | 39 | 61 | ||||||||||||||||||||||||||
Income before taxes | $ | 835 | $ | 1,094 | $ | 1,052 | $ | 973 | $ | 245 | $ | 300 | $ | 265 | $ | 269 | $ | 733 | $ | (110 | ) | $ | (36 | ) | $ | (59 | ) | |||||||||||
Restatements: (a) | ||||||||||||||||||||||||||||||||||||||
Fee and other revenue | $ | 14 | $ | 5 | $ | 6 | $ | 7 | $ | 5 | $ | 5 | $ | 4 | $ | 5 | $ | (19 | ) | $ | (10 | ) | $ | (10 | ) | $ | (12 | ) | ||||||||||
Net interest revenue | 9 | 8 | 8 | 8 | (9 | ) | (8 | ) | (8 | ) | (8 | ) | — | — | — | — | ||||||||||||||||||||||
Total revenue | 23 | 13 | 14 | 15 | (4 | ) | (3 | ) | (4 | ) | (3 | ) | (19 | ) | (10 | ) | (10 | ) | (12 | ) | ||||||||||||||||||
Provision for credit losses | — | — | — | — | — | — | — | — | — | — | — | — | ||||||||||||||||||||||||||
Total noninterest expense | 18 | 8 | 9 | 12 | 1 | 2 | 1 | — | (19 | ) | (10 | ) | (10 | ) | (12 | ) | ||||||||||||||||||||||
Income before taxes | $ | 5 | $ | 5 | $ | 5 | $ | 3 | $ | (5 | ) | $ | (5 | ) | $ | (5 | ) | $ | (3 | ) | $ | — | $ | — | $ | — | $ | — | ||||||||||
After restatement | ||||||||||||||||||||||||||||||||||||||
Fee and other revenue | $ | 2,236 | $ | 2,296 | $ | 2,233 | $ | 2,161 | $ | 924 | $ | 838 | $ | 854 | $ | 869 | $ | 794 | $ | (6 | ) | $ | 31 | $ | 18 | |||||||||||||
Net interest revenue | 778 | 761 | 783 | 804 | 47 | 49 | 59 | 67 | (10 | ) | (80 | ) | (40 | ) | (30 | ) | ||||||||||||||||||||||
Total revenue | 3,014 | 3,057 | 3,016 | 2,965 | 971 | 887 | 913 | 936 | 784 | (86 | ) | (9 | ) | (12 | ) | |||||||||||||||||||||||
Provision for credit losses | (5 | ) | (15 | ) | (4 | ) | 8 | — | — | (2 | ) | 1 | (3 | ) | (1 | ) | (2 | ) | (2 | ) | ||||||||||||||||||
Total noninterest expense | 2,179 | 1,973 | 1,963 | 1,981 | 731 | 592 | 655 | 669 | 54 | 25 | 29 | 49 | ||||||||||||||||||||||||||
Income before taxes | $ | 840 | $ | 1,099 | $ | 1,057 | $ | 976 | $ | 240 | $ | 295 | $ | 260 | $ | 266 | $ | 733 | $ | (110 | ) | $ | (36 | ) | $ | (59 | ) | |||||||||||
(a) The impact to fee and other revenue is primarily due to the change in reporting of inter-segment activity and primarily impacted the Asset Servicing and Asset Management lines of business. The impact to net interest revenue is primarily related to the Wealth Management to Pershing reclassification. The impact to noninterest expense reflects the impact of both changes, which had a mostly offsetting impact in Investment Management. | ||||||||||||||||||||||||||||||||||||||
19

First Quarter 2020 Financial Highlights April 16, 2020
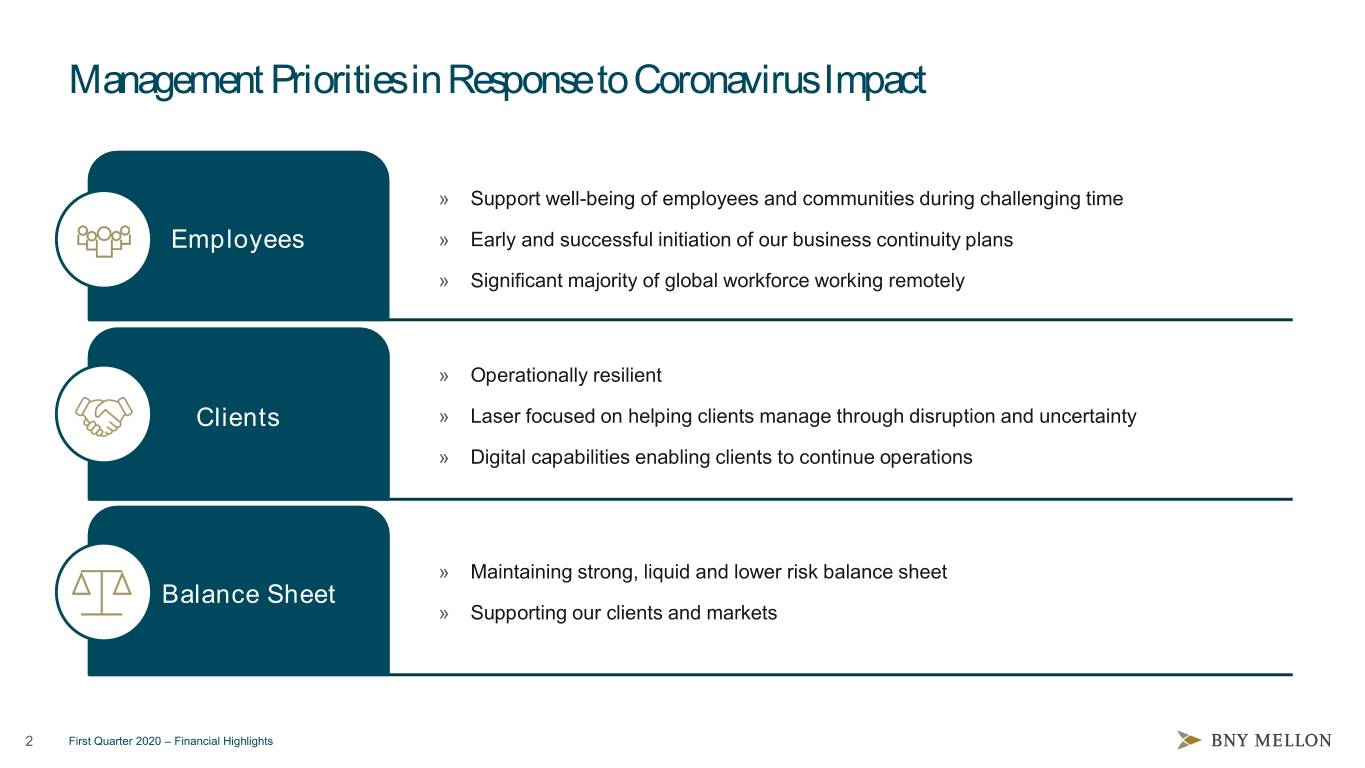
Management Priorities in Response to Coronavirus Impact » Support well-being of employees and communities during challenging time Employees » Early and successful initiation of our business continuity plans » Significant majority of global workforce working remotely » Operationally resilient Clients » Laser focused on helping clients manage through disruption and uncertainty » Digital capabilities enabling clients to continue operations » Maintaining strong, liquid and lower risk balance sheet Balance Sheet » Supporting our clients and markets 2 First Quarter 2020 – Financial Highlights

Resilient During Volatile Markets » Performs relatively well under stress Attractive » Client base of leading institutional clients, governments, endowments and pension funds business model » Diversified and stable business mix with high percentage of recurring revenue » Lower credit and market risk Lower » High quality loan portfolio supporting broad relationships risk profile » Predominantly AAA/AA and government securities » Controlling expenses during uncertain times Disciplined » Prior investments strengthened technology infrastructure and operations execution » Executing on comprehensive business continuity plans » Continuing to focus on long-term strategic priorities » Capital and liquidity ratios remain comfortably above internal targets and regulatory minimums Strong and liquid » Using our substantial resources to support client activities balance sheet » Consistent returns and proven capital generation 3 First Quarter 2020 – Financial Highlights
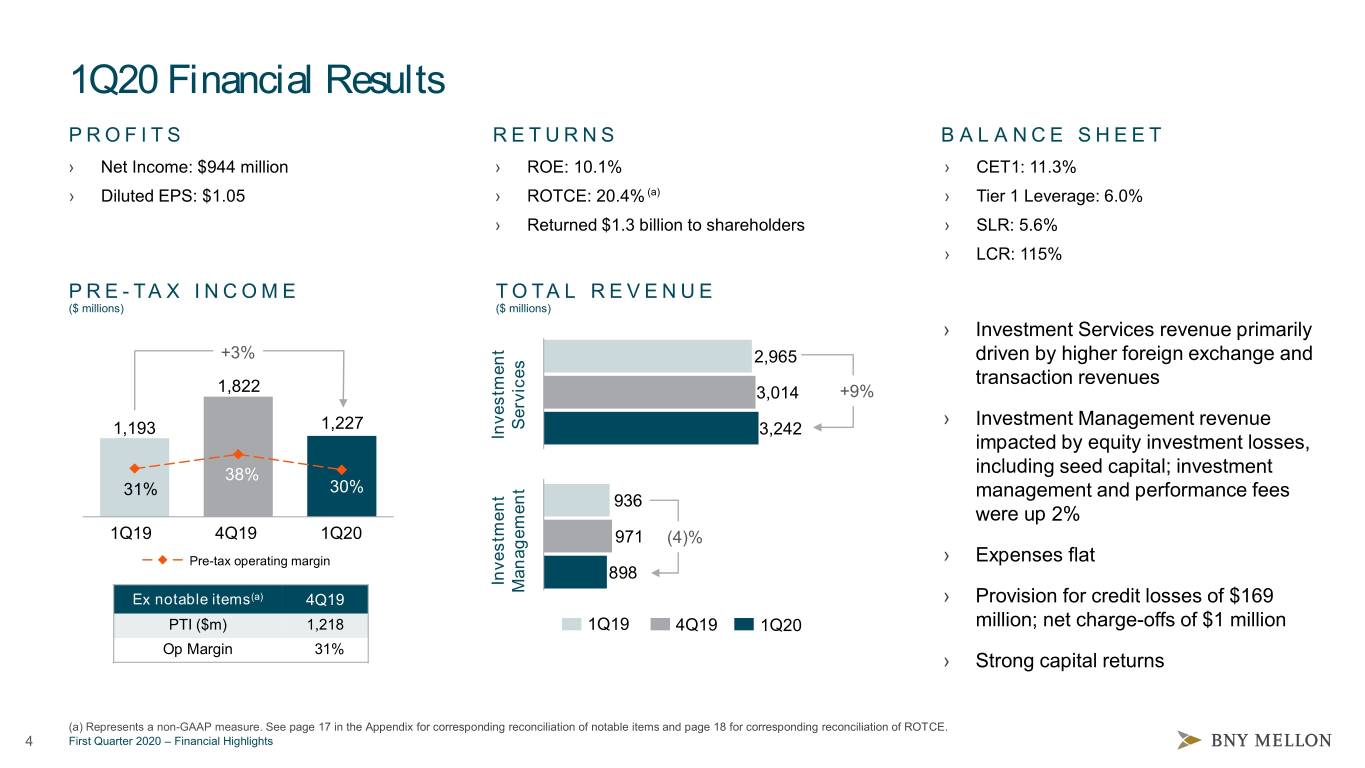
1Q20 Financial Results PROFITS RETURNS BALANCE SHEET › Net Income: $944 million › ROE: 10.1% › CET1: 11.3% › Diluted EPS: $1.05 › ROTCE: 20.4% (a) › Tier 1 Leverage: 6.0% › Returned $1.3 billion to shareholders › SLR: 5.6% › LCR: 115% PRE - T A X I N C O M E TOTAL REVENUE ($ millions) ($ millions) › Investment Services revenue primarily +3% 2,965 driven by higher foreign exchange and transaction revenues 1,822 75 3,014 +9% 6570 60 › Investment Management revenue 1,193 1,227 55 Services 3,242 50 Investment 4045 impacted by equity investment losses, 35 including seed capital; investment 38% 2530 31% 30% 20 management and performance fees 15 936 510 were up 2% 1Q19 4Q19 1Q20 971 (4)% Pre-tax operating margin › Expenses flat 898 Investment Investment Ex notable items(a) 4Q19 Management › Provision for credit losses of $169 PTI ($m) 1,218 1Q19 4Q19 1Q20 million; net charge-offs of $1 million Op Margin 31% › Strong capital returns (a) Represents a non-GAAP measure. See page 17 in the Appendix for corresponding reconciliation of notable items and page 18 for corresponding reconciliation of ROTCE. 4 First Quarter 2020 – Financial Highlights

1Q20 Financial Highlights ($ millions, except per share data) 1 Q 2 0 4 Q 1 9 1 Q 1 9 TOTAL REVENUE $4,108 (14)% 5% Fee revenue 3,323 (16) 10 Net interest revenue 814 - (3) Provision for credit losses 169 N/M N/M Noninterest expense 2,712 (9) - Income before income taxes 1,227 (33) 3 Net income applicable to common shareholders $944 (32)% 4% EARNINGS PER COMMON SHARE $1.05 (31)% 12% Operating leverage (a) (552) bps 488 bps Pre-tax operating margin 30% (829) bps (72) bps Return on common equity (annualized) 10.1% (451) bps 13 bps Return on tangible common equity (annualized) (b) 20.4% (891) bps (32) bps NOTABLE ITEMS (C) Increase / (decrease) Revenue Expense EPS 4Q19 includes gain from the sale of an equity investment, partially 4Q19 790 186 $0.50 offset by severance, net securities losses and litigation Note: See page 16 in the Appendix for corresponding footnotes. N/M - not meaningful; bps - basis points 5 First Quarter 2020 – Financial Highlights
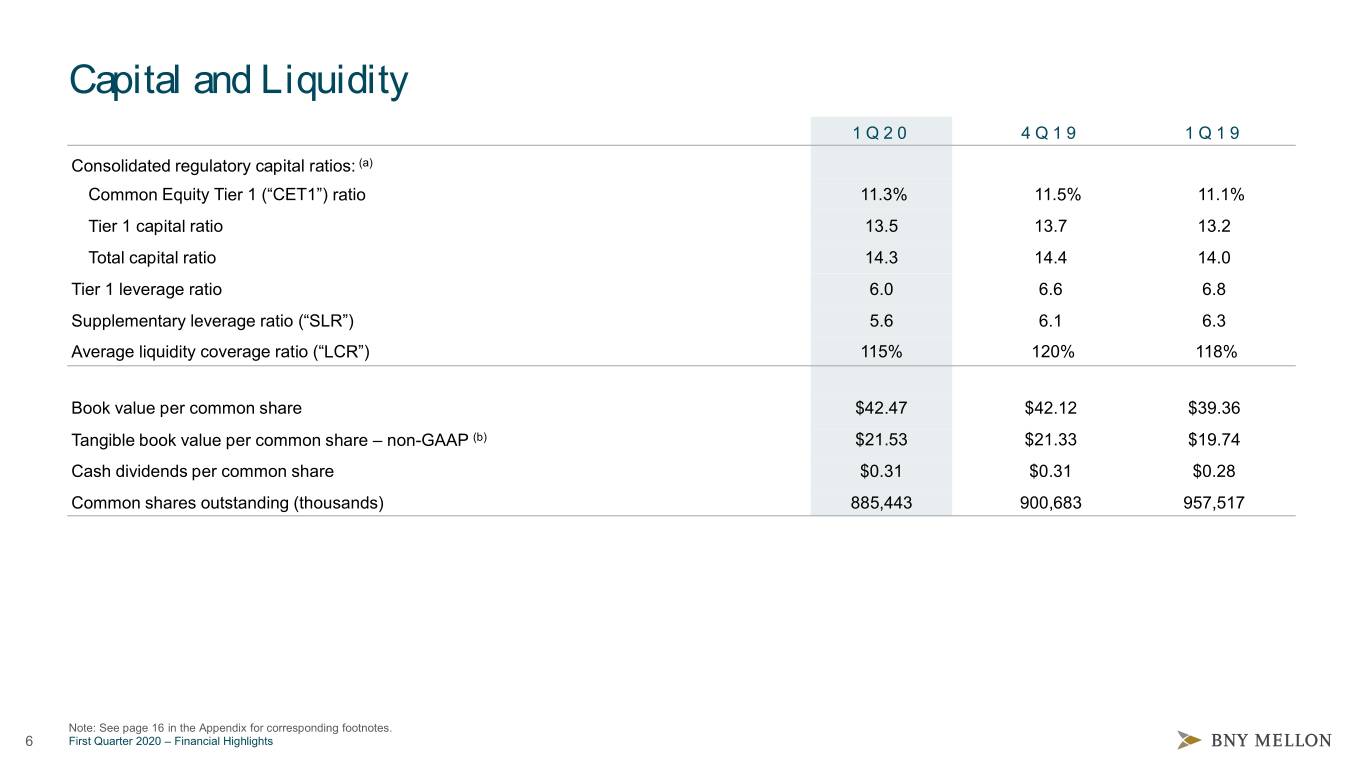
Capital and Liquidity 1 Q 20 4 Q 1 9 1 Q19 Consolidated regulatory capital ratios: (a) Common Equity Tier 1 (“CET1”) ratio 11.3% 11.5% 11.1% Tier 1 capital ratio 13.5 13.7 13.2 Total capital ratio 14.3 14.4 14.0 Tier 1 leverage ratio 6.0 6.6 6.8 Supplementary leverage ratio (“SLR”) 5.6 6.1 6.3 Average liquidity coverage ratio (“LCR”) 115% 120% 118% Book value per common share $42.47 $42.12 $39.36 Tangible book value per common share – non-GAAP (b) $21.53 $21.33 $19.74 Cash dividends per common share $0.31 $0.31 $0.28 Common shares outstanding (thousands) 885,443 900,683 957,517 Note: See page 16 in the Appendix for corresponding footnotes. 6 First Quarter 2020 – Financial Highlights
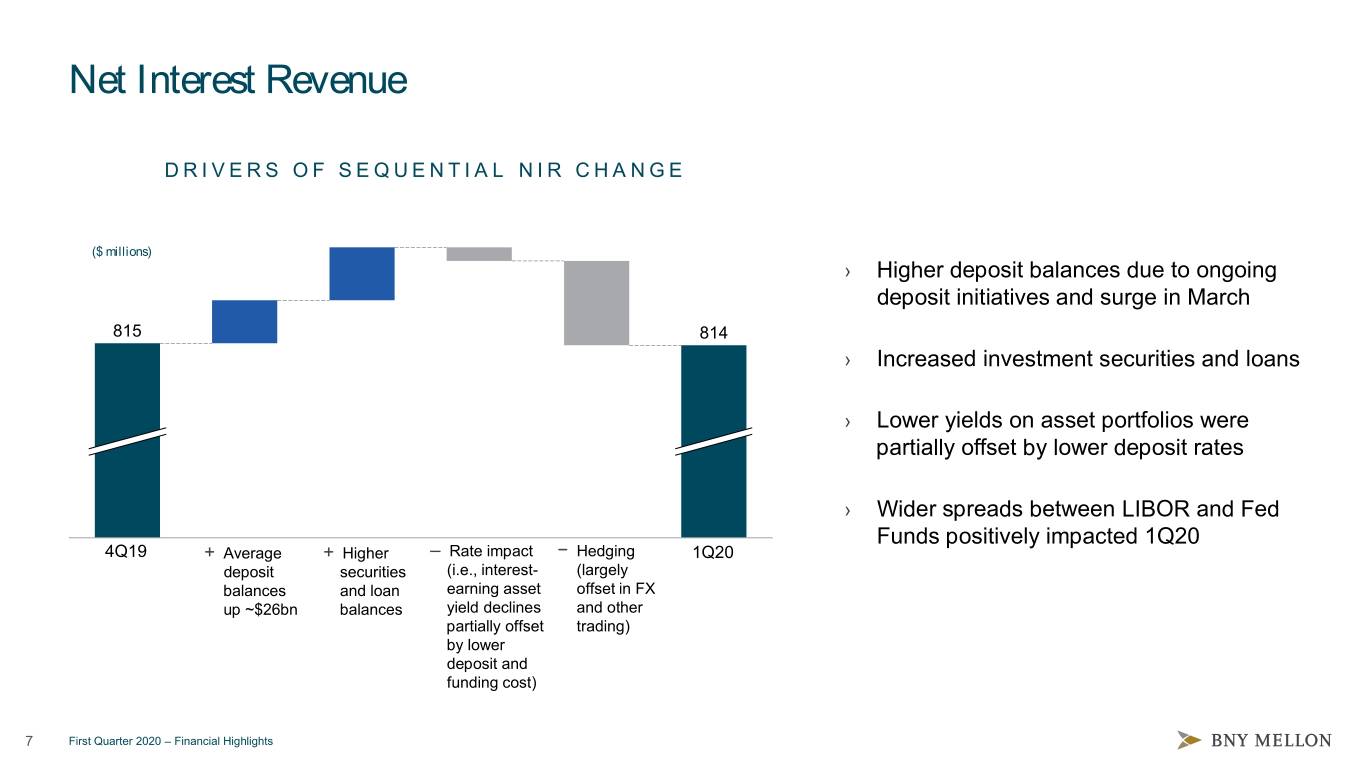
Net Interest Revenue DRIVERS OF SEQUENTIAL NIR CHANGE ($ millions) › Higher deposit balances due to ongoing deposit initiatives and surge in March 815 814 › Increased investment securities and loans › Lower yields on asset portfolios were partially offset by lower deposit rates › Wider spreads between LIBOR and Fed Funds positively impacted 1Q20 4Q19 + Average + Higher – Rate impact − Hedging 1Q20 deposit securities (i.e., interest- (largely balances and loan earning asset offset in FX up ~$26bn balances yield declines and other partially offset trading) by lower deposit and funding cost) 7 First Quarter 2020 – Financial Highlights
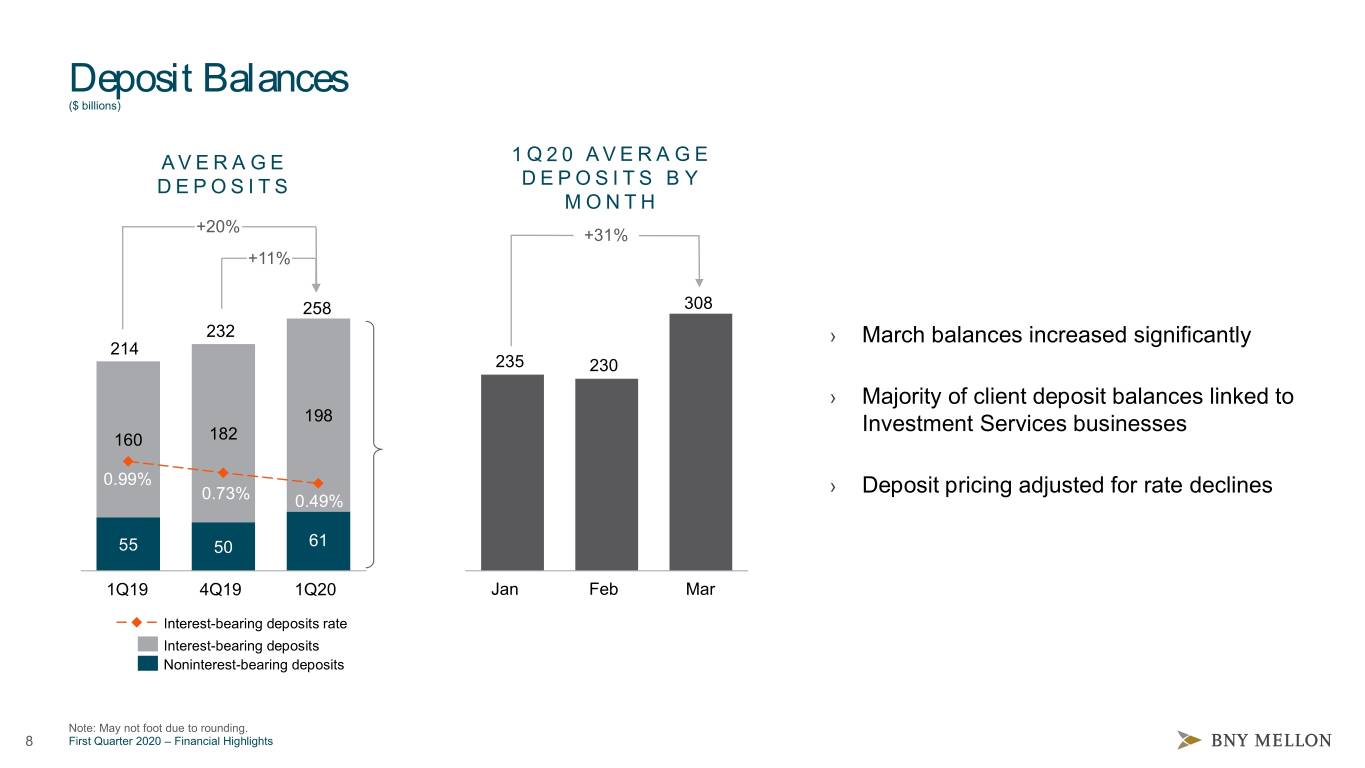
Deposit Balances ($ billions) AV E R A G E 1Q20 AVERAGE DEPOSITS DEPOSITS BY MONTH +20% +31% +11% 258 308 232 › March balances increased significantly 214 235 230 › Majority of client deposit balances linked to 198 Investment Services businesses 160 182 0.99% › Deposit pricing adjusted for rate declines 0.73% 0.49% 55 50 61 1Q19 4Q19 1Q20 Jan Feb Mar Interest-bearing deposits rate Interest-bearing deposits Noninterest-bearing deposits Note: May not foot due to rounding. 8 First Quarter 2020 – Financial Highlights
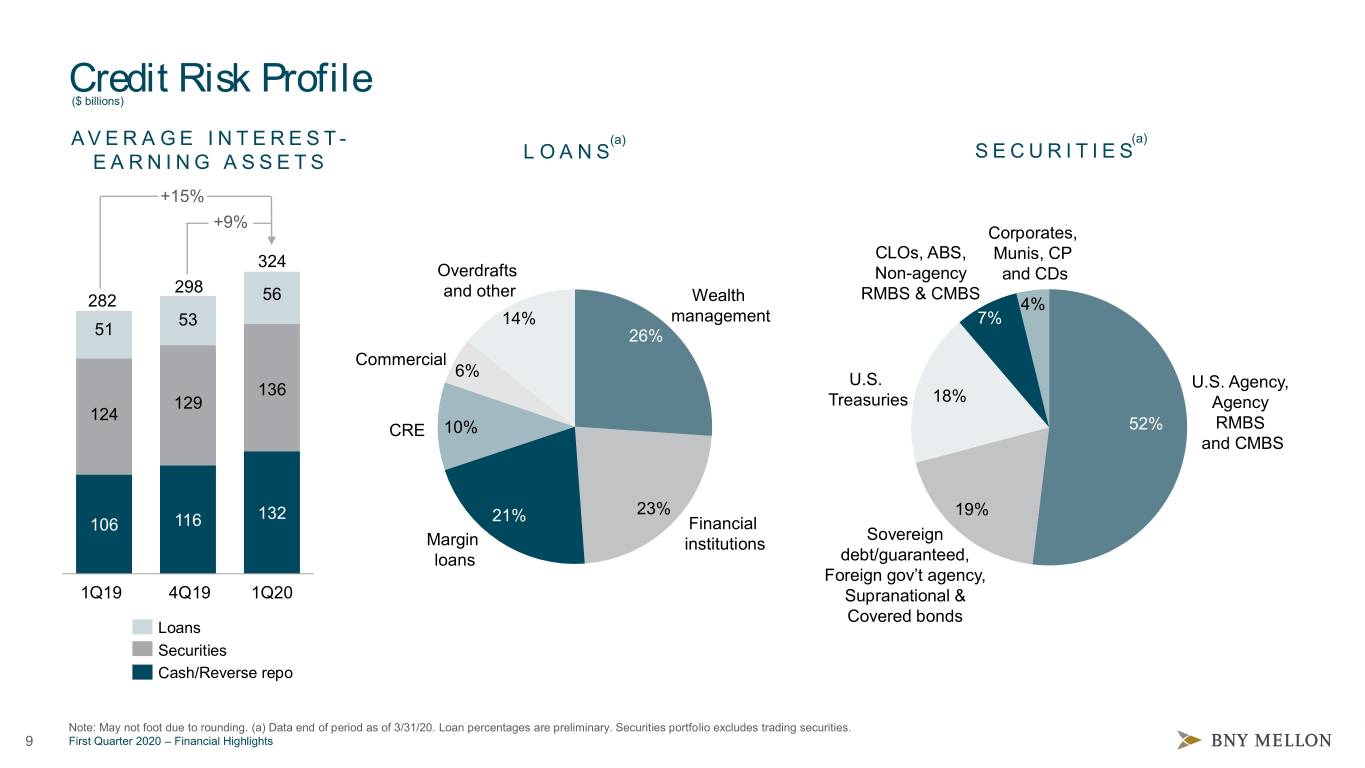
Credit Risk Profile ($ billions) AVERAGE INTEREST - (a) (a) LOANS SECURITIES EARNING ASSETS +15% +9% Corporates, CLOs, ABS, 324 Munis, CP Overdrafts Non-agency and CDs 298 56 and other Wealth RMBS & CMBS 282 4% 53 14% management 7% 51 26% Commercial 6% U.S. 136 U.S. Agency, 129 Treasuries 18% Agency 124 CRE 10% 52% RMBS and CMBS 132 21% 23% 19% 106 116 Financial Sovereign Margin institutions loans debt/guaranteed, Foreign gov’t agency, 1Q19 4Q19 1Q20 Supranational & Covered bonds Loans Securities Cash/Reverse repo Note: May not foot due to rounding. (a) Data end of period as of 3/31/20. Loan percentages are preliminary. Securities portfolio excludes trading securities. 9 First Quarter 2020 – Financial Highlights
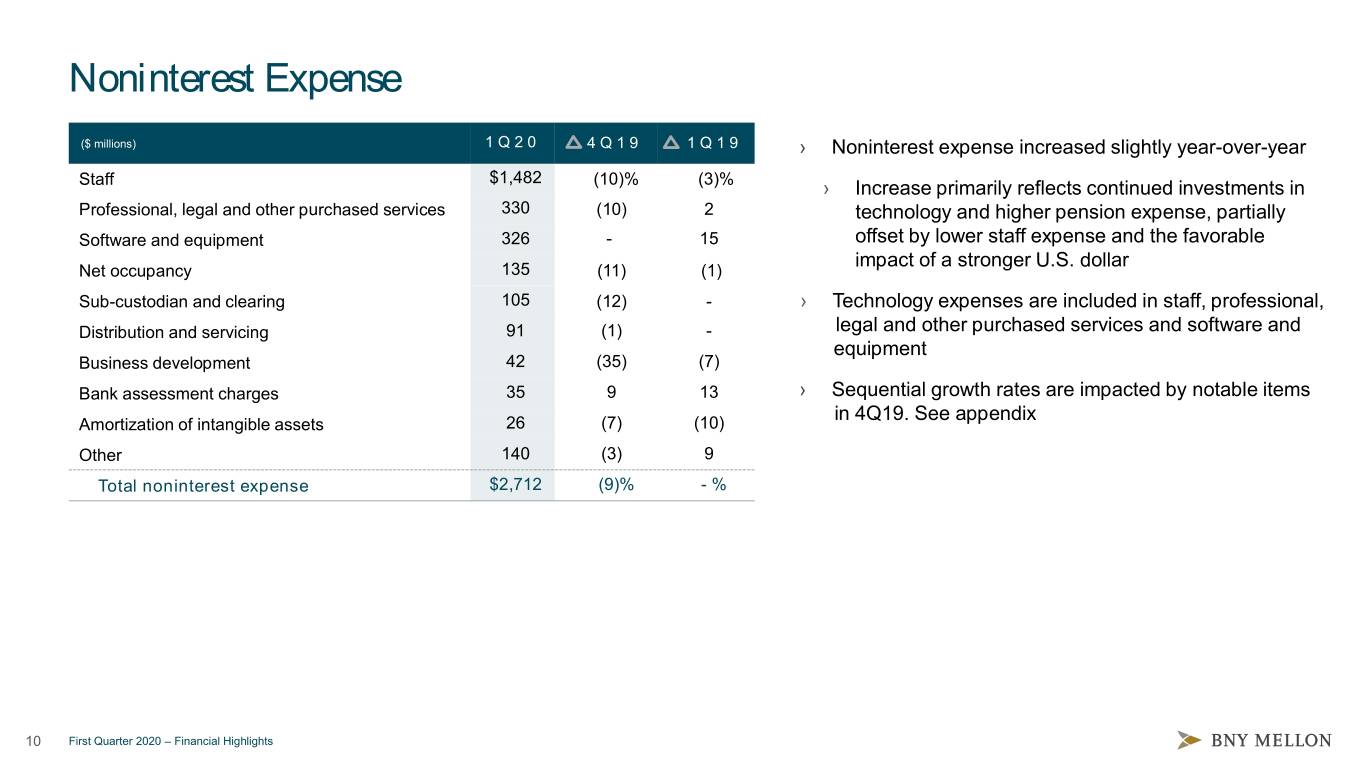
Noninterest Expense ($ millions) 1 Q 2 0 4 Q 1 9 1 Q19 › Noninterest expense increased slightly year-over-year $1,482 Staff (10)% (3)% › Increase primarily reflects continued investments in Professional, legal and other purchased services 330 (10) 2 technology and higher pension expense, partially Software and equipment 326 - 15 offset by lower staff expense and the favorable impact of a stronger U.S. dollar Net occupancy 135 (11) (1) Sub-custodian and clearing 105 (12) - › Technology expenses are included in staff, professional, Distribution and servicing 91 (1) - .legal and other purchased services and software and .equipment Business development 42 (35) (7) Bank assessment charges 35 9 13 › Sequential growth rates are impacted by notable items .in 4Q19. See appendix Amortization of intangible assets 26 (7) (10) Other 140 (3) 9 Total noninterest expense $2,712 (9)% - % 10 First Quarter 2020 – Financial Highlights
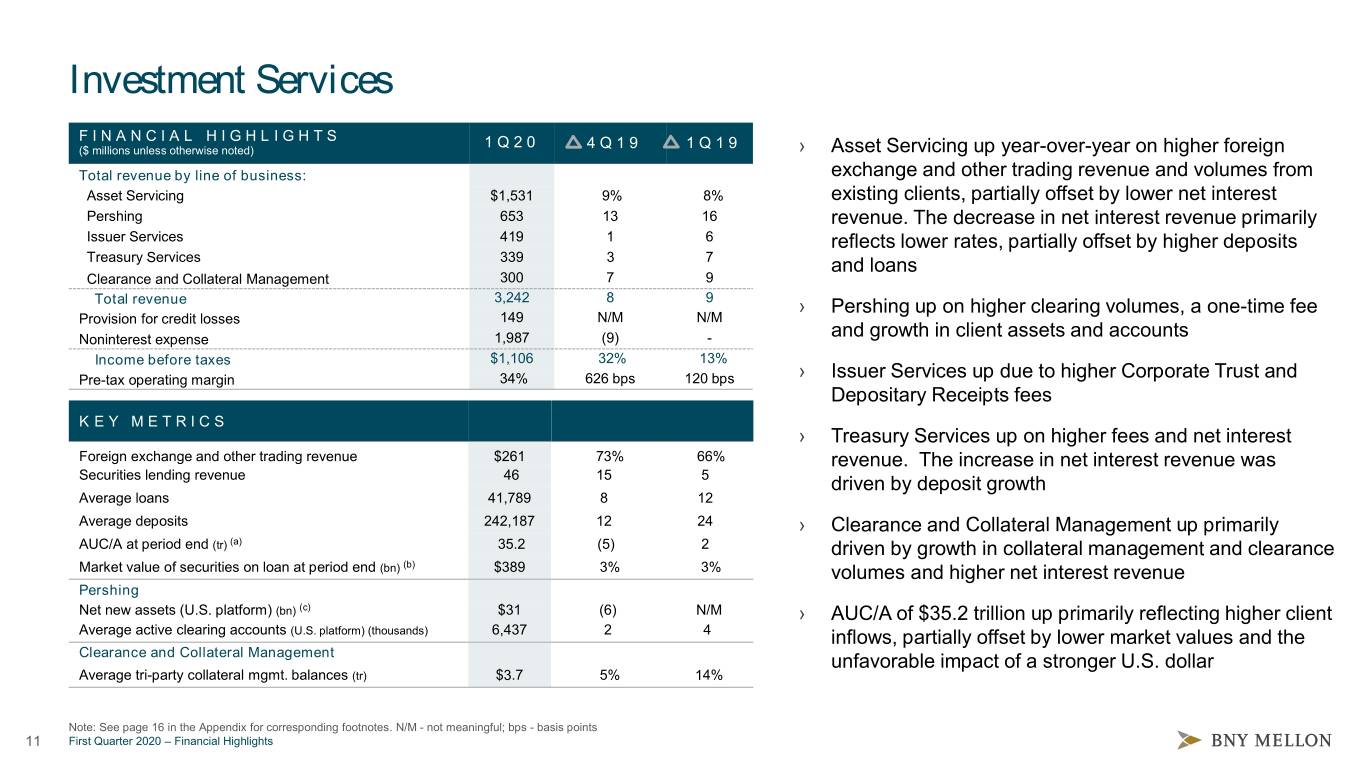
Investment Services FINANCIAL HIGHLIGHTS 1 Q 2 0 ($ millions unless otherwise noted) 4 Q 1 9 1 Q 1 9 › Asset Servicing up year-over-year on higher foreign Total revenue by line of business: exchange and other trading revenue and volumes from Asset Servicing $1,531 9% 8% existing clients, partially offset by lower net interest Pershing 653 13 16 revenue. The decrease in net interest revenue primarily Issuer Services 419 1 6 reflects lower rates, partially offset by higher deposits Treasury Services 339 3 7 and loans Clearance and Collateral Management 300 7 9 Total revenue 3,242 8 9 › Pershing up on higher clearing volumes, a one-time fee Provision for credit losses 149 N/M N/M Noninterest expense 1,987 (9) - and growth in client assets and accounts Income before taxes $1,106 32% 13% Pre-tax operating margin 34% 626 bps 120 bps › Issuer Services up due to higher Corporate Trust and Depositary Receipts fees KEY METRICS › Treasury Services up on higher fees and net interest Foreign exchange and other trading revenue $261 73% 66% revenue. The increase in net interest revenue was Securities lending revenue 46 15 5 driven by deposit growth Average loans 41,789 8 12 Average deposits 242,187 12 24 › Clearance and Collateral Management up primarily AUC/A at period end (tr) (a) 35.2 (5) 2 driven by growth in collateral management and clearance Market value of securities on loan at period end (bn) (b) $389 3% 3% volumes and higher net interest revenue Pershing Net new assets (U.S. platform) (bn) (c) $31 (6) N/M › AUC/A of $35.2 trillion up primarily reflecting higher client Average active clearing accounts (U.S. platform) (thousands) 6,437 2 4 inflows, partially offset by lower market values and the Clearance and Collateral Management unfavorable impact of a stronger U.S. dollar Average tri-party collateral mgmt. balances (tr) $3.7 5% 14% Note: See page 16 in the Appendix for corresponding footnotes. N/M - not meaningful; bps - basis points 11 First Quarter 2020 – Financial Highlights
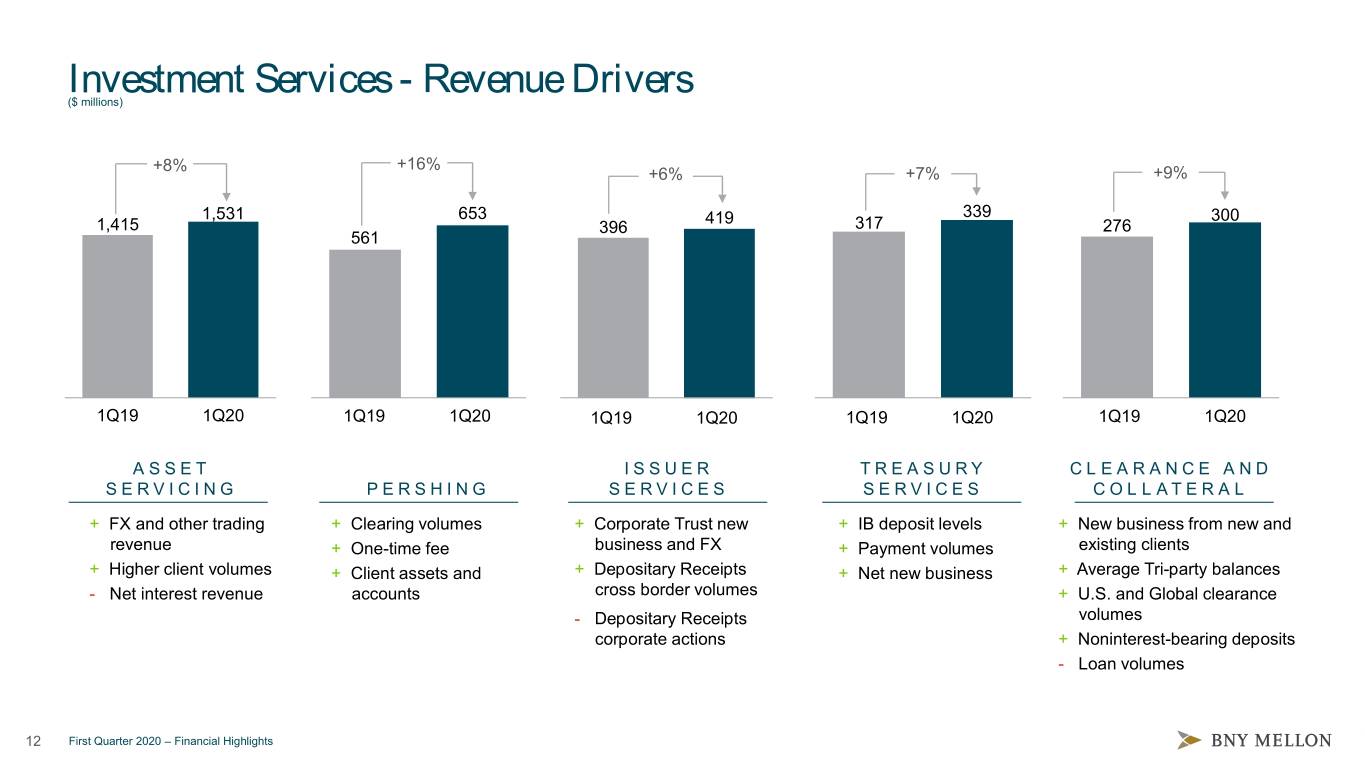
Investment Services - Revenue Drivers ($ millions) +8% +16% +6% +7% +9% 1,531 653 419 339 300 1,415 396 317 276 561 1Q19 1Q20 1Q19 1Q20 1Q19 1Q20 1Q19 1Q20 1Q19 1Q20 A S S E T I S S U E R T R E A S U R Y CLEARANCE AND SERVICING PERSHING SERVICES SERVICES COLLATERAL + FX and other trading + Clearing volumes + Corporate Trust new + IB deposit levels + New business from new and revenue + One-time fee business and FX + Payment volumes existing clients + Higher client volumes + Client assets and + Depositary Receipts + Net new business + Average Tri-party balances - Net interest revenue accounts cross border volumes + U.S. and Global clearance - Depositary Receipts volumes corporate actions + Noninterest-bearing deposits - Loan volumes 12 First Quarter 2020 – Financial Highlights
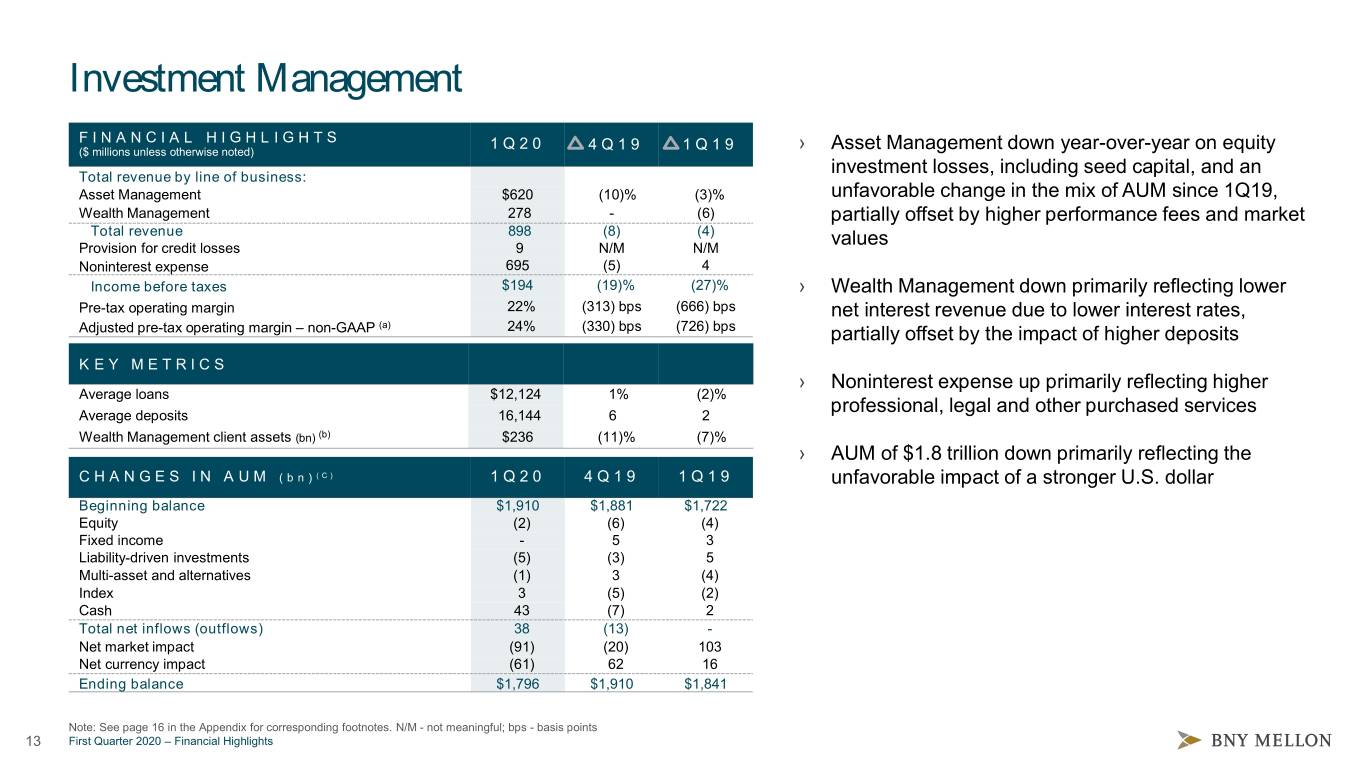
Investment Management FINANCIAL HIGHLIGHTS 1 Q 2 0 ($ millions unless otherwise noted) 4 Q 1 9 1 Q 1 9 › Asset Management down year-over-year on equity investment losses, including seed capital, and an Total revenue by line of business: Asset Management $620 (10)% (3)% unfavorable change in the mix of AUM since 1Q19, Wealth Management 278 - (6) partially offset by higher performance fees and market Total revenue 898 (8) (4) Provision for credit losses 9 N/M N/M values Noninterest expense 695 (5) 4 Income before taxes $194 (19)% (27)% › Wealth Management down primarily reflecting lower Pre-tax operating margin 22% (313) bps (666) bps net interest revenue due to lower interest rates, Adjusted pre-tax operating margin – non-GAAP (a) 24% (330) bps (726) bps partially offset by the impact of higher deposits KEY METRICS › Noninterest expense up primarily reflecting higher Average loans $12,124 1% (2)% professional, legal and other purchased services Average deposits 16,144 6 2 Wealth Management client assets (bn) (b) $236 (11)% (7)% › AUM of $1.8 trillion down primarily reflecting the CHANGES IN AUM (bn)(C) 1 Q 2 0 4 Q 1 9 1 Q 1 9 unfavorable impact of a stronger U.S. dollar Beginning balance $1,910 $1,881 $1,722 Equity (2) (6) (4) Fixed income - 5 3 Liability-driven investments (5) (3) 5 Multi-asset and alternatives (1) 3 (4) Index 3 (5) (2) Cash 43 (7) 2 Total net inflows (outflows) 38 (13) - Net market impact (91) (20) 103 Net currency impact (61) 62 16 Ending balance $1,796 $1,910 $1,841 Note: See page 16 in the Appendix for corresponding footnotes. N/M - not meaningful; bps - basis points 13 First Quarter 2020 – Financial Highlights
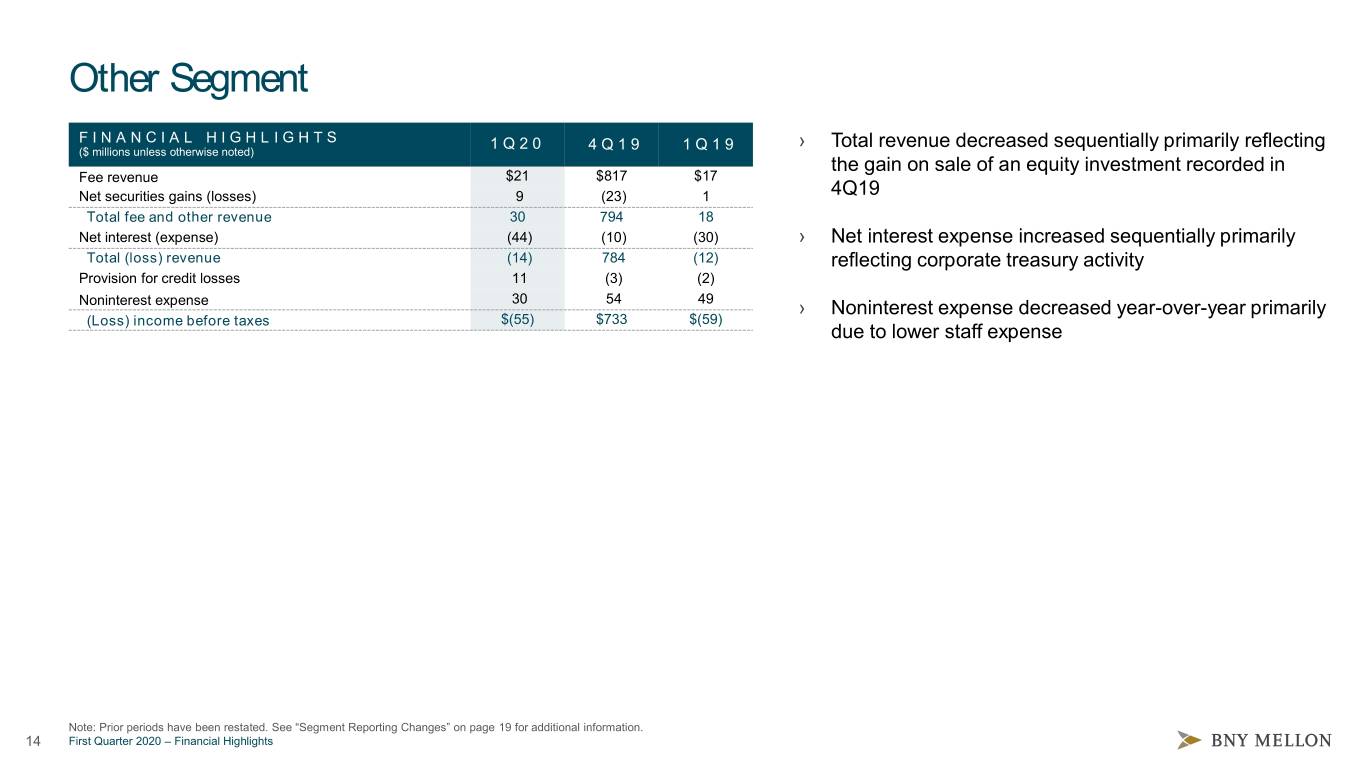
Other Segment FINANCIAL HIGHLIGHTS 1 Q 2 0 › Total revenue decreased sequentially primarily reflecting ($ millions unless otherwise noted) 4 Q 1 9 1 Q 1 9 the gain on sale of an equity investment recorded in Fee revenue $21 $817 $17 Net securities gains (losses) 9 (23) 1 4Q19 Total fee and other revenue 30 794 18 Net interest (expense) (44) (10) (30) › Net interest expense increased sequentially primarily Total (loss) revenue (14) 784 (12) reflecting corporate treasury activity Provision for credit losses 11 (3) (2) Noninterest expense 30 54 49 › Noninterest expense decreased year-over-year primarily (Loss) income before taxes $(55) $733 $(59) due to lower staff expense Note: Prior periods have been restated. See “Segment Reporting Changes” on page 19 for additional information. 14 First Quarter 2020 – Financial Highlights

Appendix
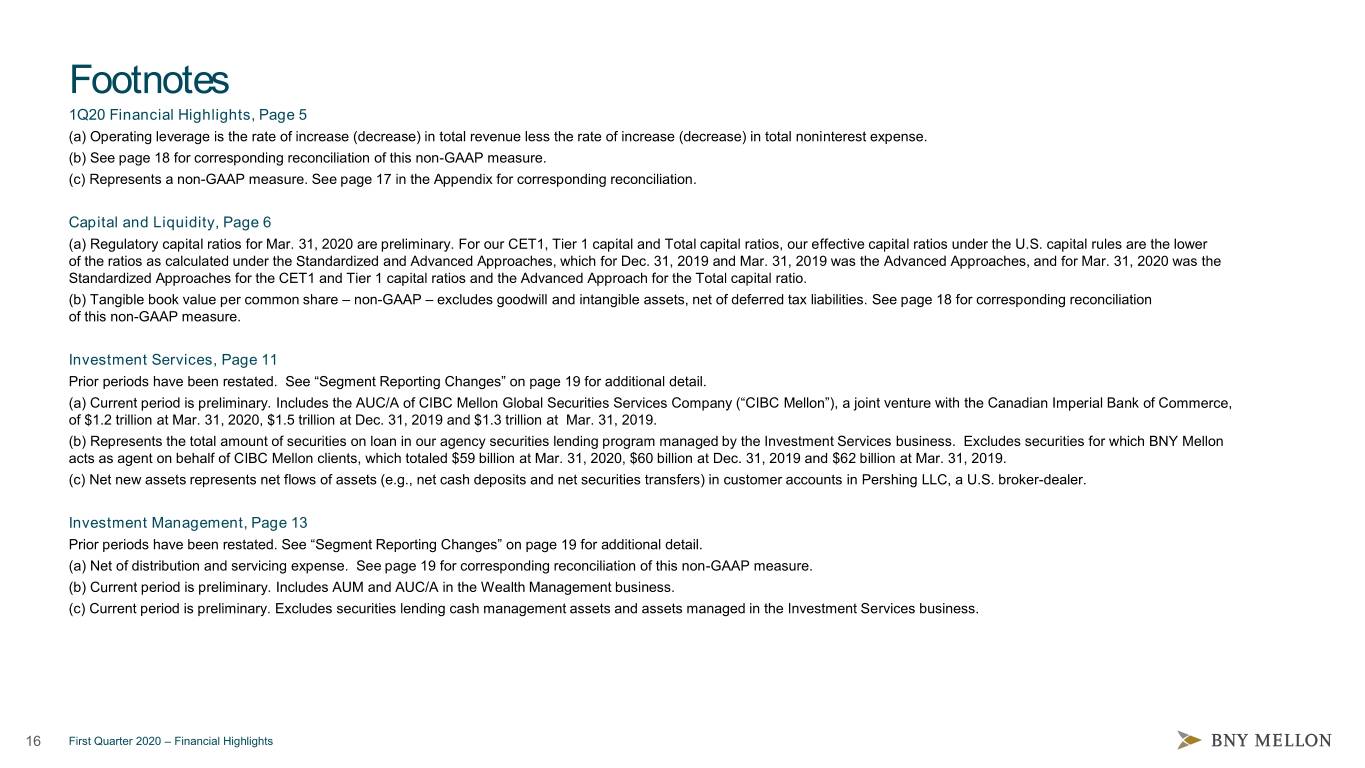
Footnotes 1Q20 Financial Highlights, Page 5 (a) Operating leverage is the rate of increase (decrease) in total revenue less the rate of increase (decrease) in total noninterest expense. (b) See page 18 for corresponding reconciliation of this non-GAAP measure. (c) Represents a non-GAAP measure. See page 17 in the Appendix for corresponding reconciliation. Capital and Liquidity, Page 6 (a) Regulatory capital ratios for Mar. 31, 2020 are preliminary. For our CET1, Tier 1 capital and Total capital ratios, our effective capital ratios under the U.S. capital rules are the lower of the ratios as calculated under the Standardized and Advanced Approaches, which for Dec. 31, 2019 and Mar. 31, 2019 was the Advanced Approaches, and for Mar. 31, 2020 was the Standardized Approaches for the CET1 and Tier 1 capital ratios and the Advanced Approach for the Total capital ratio. (b) Tangible book value per common share – non-GAAP – excludes goodwill and intangible assets, net of deferred tax liabilities. See page 18 for corresponding reconciliation of this non-GAAP measure. Investment Services, Page 11 Prior periods have been restated. See “Segment Reporting Changes” on page 19 for additional detail. (a) Current period is preliminary. Includes the AUC/A of CIBC Mellon Global Securities Services Company (“CIBC Mellon”), a joint venture with the Canadian Imperial Bank of Commerce, of $1.2 trillion at Mar. 31, 2020, $1.5 trillion at Dec. 31, 2019 and $1.3 trillion at Mar. 31, 2019. (b) Represents the total amount of securities on loan in our agency securities lending program managed by the Investment Services business. Excludes securities for which BNY Mellon acts as agent on behalf of CIBC Mellon clients, which totaled $59 billion at Mar. 31, 2020, $60 billion at Dec. 31, 2019 and $62 billion at Mar. 31, 2019. (c) Net new assets represents net flows of assets (e.g., net cash deposits and net securities transfers) in customer accounts in Pershing LLC, a U.S. broker-dealer. Investment Management, Page 13 Prior periods have been restated. See “Segment Reporting Changes” on page 19 for additional detail. (a) Net of distribution and servicing expense. See page 19 for corresponding reconciliation of this non-GAAP measure. (b) Current period is preliminary. Includes AUM and AUC/A in the Wealth Management business. (c) Current period is preliminary. Excludes securities lending cash management assets and assets managed in the Investment Services business. 16 First Quarter 2020 – Financial Highlights
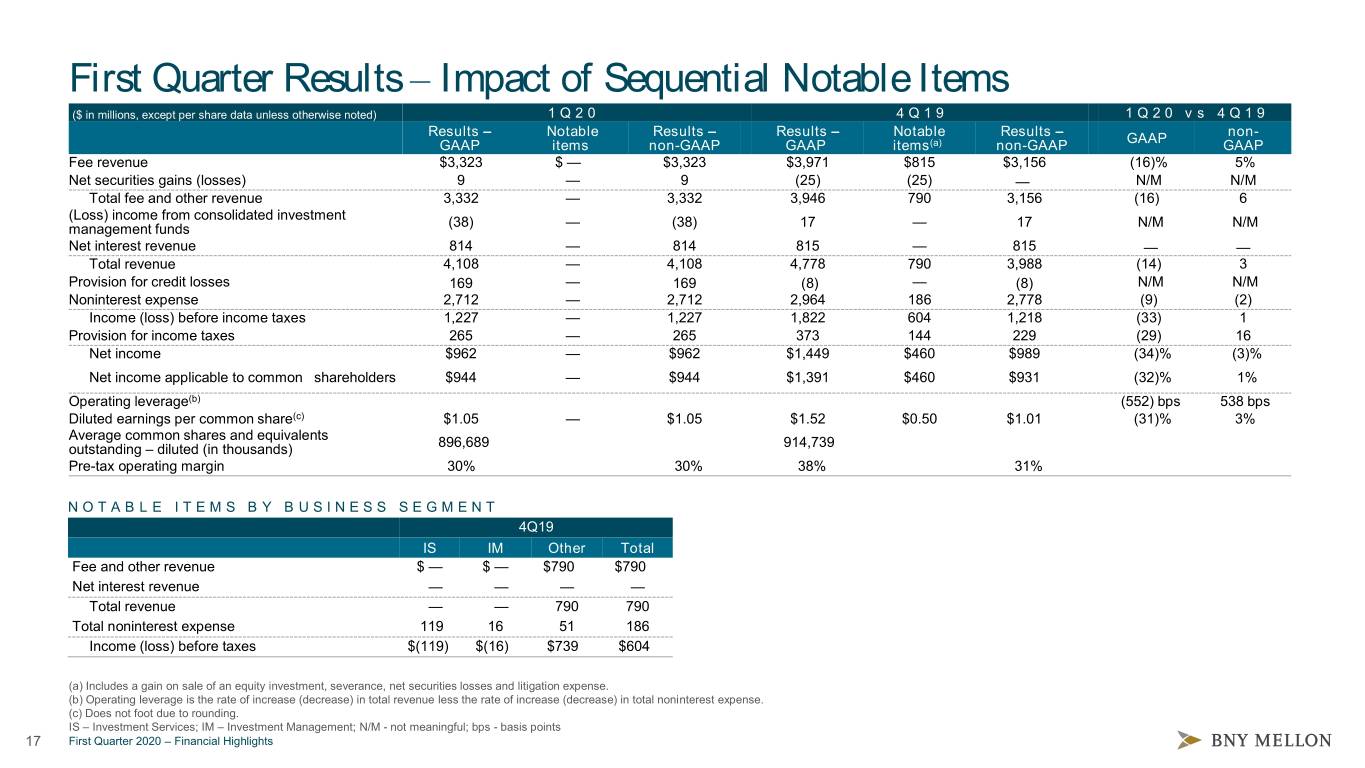
First Quarter Results – Impact of Sequential Notable Items ($ in millions, except per share data unless otherwise noted) 1 Q 20 4 Q 1 9 1 Q 20 vs 4 Q 1 9 Results – Notable Results – Results – Notable Results – GAAP non- GAAP items non-GAAP GAAP items(a) non-GAAP GAAP Fee revenue $3,323 $ — $3,323 $3,971 $815 $3,156 (16)% 5% Net securities gains (losses) 9 — 9 (25) (25) — N/M N/M Total fee and other revenue 3,332 — 3,332 3,946 790 3,156 (16) 6 (Loss) income from consolidated investment (38) — (38) 17 — 17 N/M N/M management funds Net interest revenue 814 — 814 815 — 815 — — Total revenue 4,108 — 4,108 4,778 790 3,988 (14) 3 Provision for credit losses 169 — 169 (8) — (8) N/M N/M Noninterest expense 2,712 — 2,712 2,964 186 2,778 (9) (2) Income (loss) before income taxes 1,227 — 1,227 1,822 604 1,218 (33) 1 Provision for income taxes 265 — 265 373 144 229 (29) 16 Net income $962 — $962 $1,449 $460 $989 (34)% (3)% Net income applicable to common shareholders $944 — $944 $1,391 $460 $931 (32)% 1% Operating leverage(b) (552) bps 538 bps Diluted earnings per common share(c) $1.05 — $1.05 $1.52 $0.50 $1.01 (31)% 3% Average common shares and equivalents outstanding – diluted (in thousands) 896,689 914,739 Pre-tax operating margin 30% 30% 38% 31% NOTABLE ITEMS BY BUSINESS SEGMENT 4Q19 IS IM Other Total Fee and other revenue $ — $ — $790 $790 Net interest revenue $ — $ — — — Total revenue $ — $ — 790 790 Total noninterest expense 119 16 51 186 Income (loss) before taxes $(119) $(16) $739 $604 (a) Includes a gain on sale of an equity investment, severance, net securities losses and litigation expense. (b) Operating leverage is the rate of increase (decrease) in total revenue less the rate of increase (decrease) in total noninterest expense. (c) Does not foot due to rounding. IS – Investment Services; IM – Investment Management; N/M - not meaningful; bps - basis points 17 First Quarter 2020 – Financial Highlights
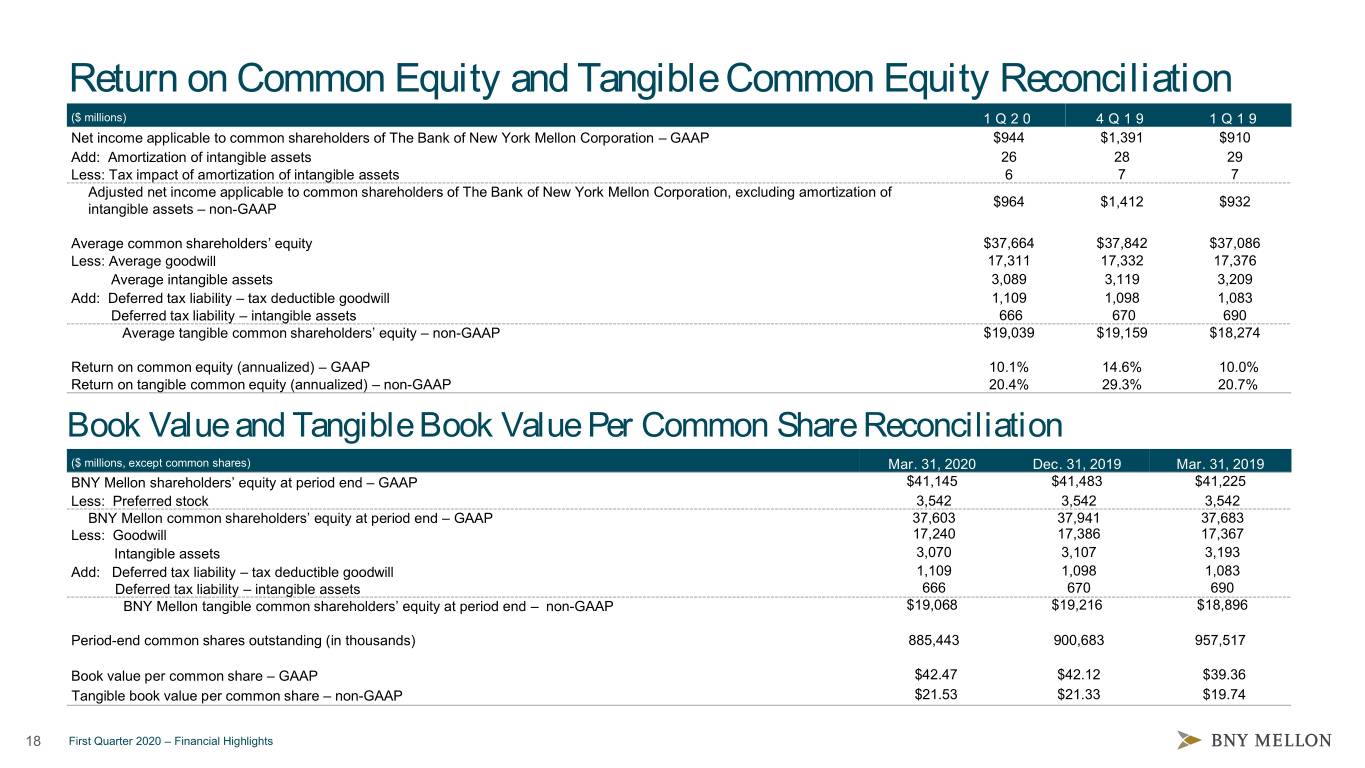
Return on Common Equity and Tangible Common Equity Reconciliation ($ millions) 1 Q 20 4 Q 1 9 1 Q19 Net income applicable to common shareholders of The Bank of New York Mellon Corporation – GAAP $944 $1,391 $910 Add: Amortization of intangible assets 26 28 29 Less: Tax impact of amortization of intangible assets 6 7 7 Adjusted net income applicable to common shareholders of The Bank of New York Mellon Corporation, excluding amortization of $964 $1,412 $932 intangible assets – non-GAAP Average common shareholders’ equity $37,664 $37,842 $37,086 Less: Average goodwill 17,311 17,332 17,376 Average intangible assets 3,089 3,119 3,209 Add: Deferred tax liability – tax deductible goodwill 1,109 1,098 1,083 Deferred tax liability – intangible assets 666 670 690 Average tangible common shareholders’ equity – non-GAAP $19,039 $19,159 $18,274 Return on common equity (annualized) – GAAP 10.1% 14.6% 10.0% Return on tangible common equity (annualized) – non-GAAP 20.4% 29.3% 20.7% Book Value and Tangible Book Value Per Common Share Reconciliation ($ millions, except common shares) Mar. 31, 2020 Dec. 31, 2019 Mar. 31, 2019 BNY Mellon shareholders’ equity at period end – GAAP $41,145 $41,483 $41,225 Less: Preferred stock 3,542 3,542 3,542 BNY Mellon common shareholders’ equity at period end – GAAP 37,603 37,941 37,683 Less: Goodwill 17,240 17,386 17,367 Intangible assets 3,070 3,107 3,193 Add: Deferred tax liability – tax deductible goodwill 1,109 1,098 1,083 Deferred tax liability – intangible assets 666 670 690 BNY Mellon tangible common shareholders’ equity at period end – non-GAAP $19,068 $19,216 $18,896 Period-end common shares outstanding (in thousands) 885,443 900,683 957,517 Book value per common share – GAAP $42.47 $42.12 $39.36 Tangible book value per common share – non-GAAP $21.53 $21.33 $19.74 18 First Quarter 2020 – Financial Highlights
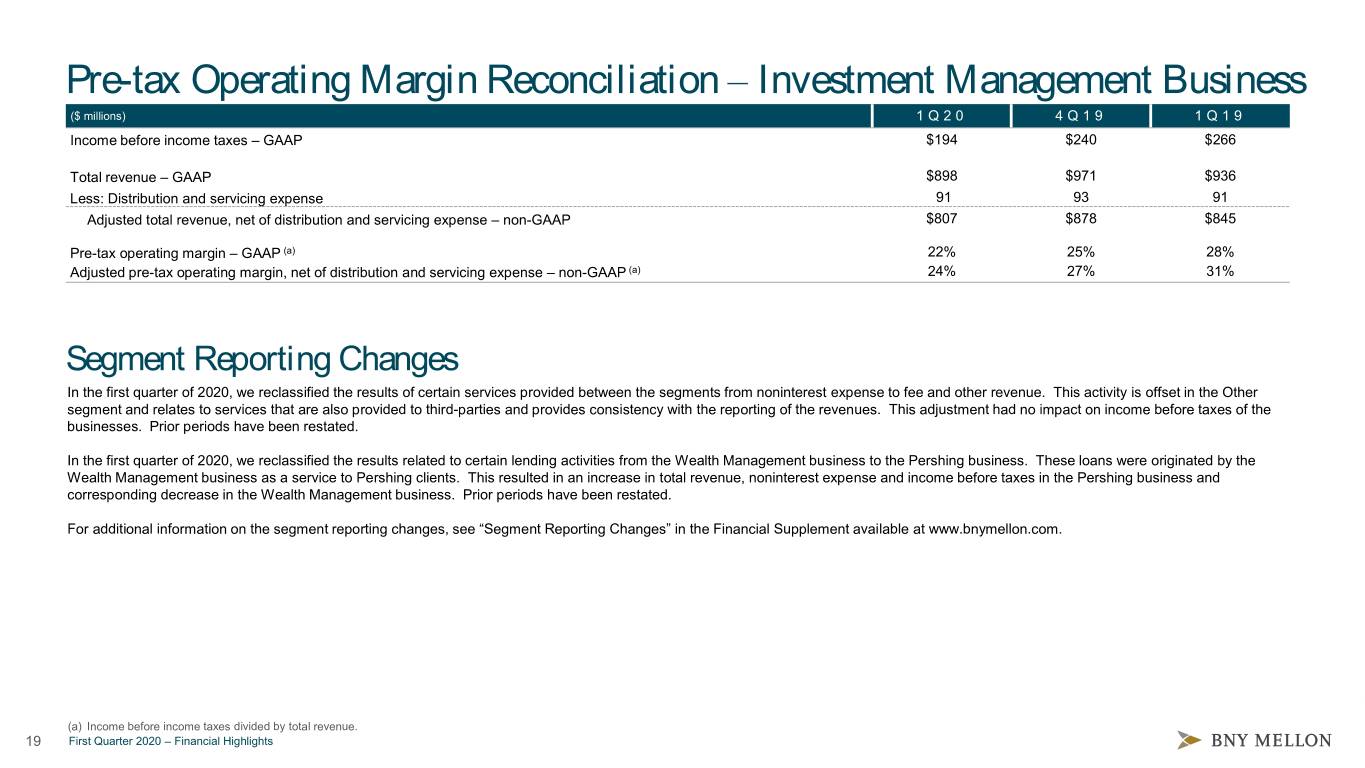
Pre-tax Operating Margin Reconciliation – Investment Management Business ($ millions) 1 Q 20 4 Q 1 9 1 Q19 Income before income taxes – GAAP $194 $240 $266 Total revenue – GAAP $898 $971 $936 Less: Distribution and servicing expense 91 93 91 Adjusted total revenue, net of distribution and servicing expense – non-GAAP $807 $878 $845 Pre-tax operating margin – GAAP (a) 22% 25% 28% Adjusted pre-tax operating margin, net of distribution and servicing expense – non-GAAP (a) 24% 27% 31% Segment Reporting Changes In the first quarter of 2020, we reclassified the results of certain services provided between the segments from noninterest expense to fee and other revenue. This activity is offset in the Other segment and relates to services that are also provided to third-parties and provides consistency with the reporting of the revenues. This adjustment had no impact on income before taxes of the businesses. Prior periods have been restated. In the first quarter of 2020, we reclassified the results related to certain lending activities from the Wealth Management business to the Pershing business. These loans were originated by the Wealth Management business as a service to Pershing clients. This resulted in an increase in total revenue, noninterest expense and income before taxes in the Pershing business and corresponding decrease in the Wealth Management business. Prior periods have been restated. For additional information on the segment reporting changes, see “Segment Reporting Changes” in the Financial Supplement available at www.bnymellon.com. (a) Income before income taxes divided by total revenue. 19 First Quarter 2020 – Financial Highlights
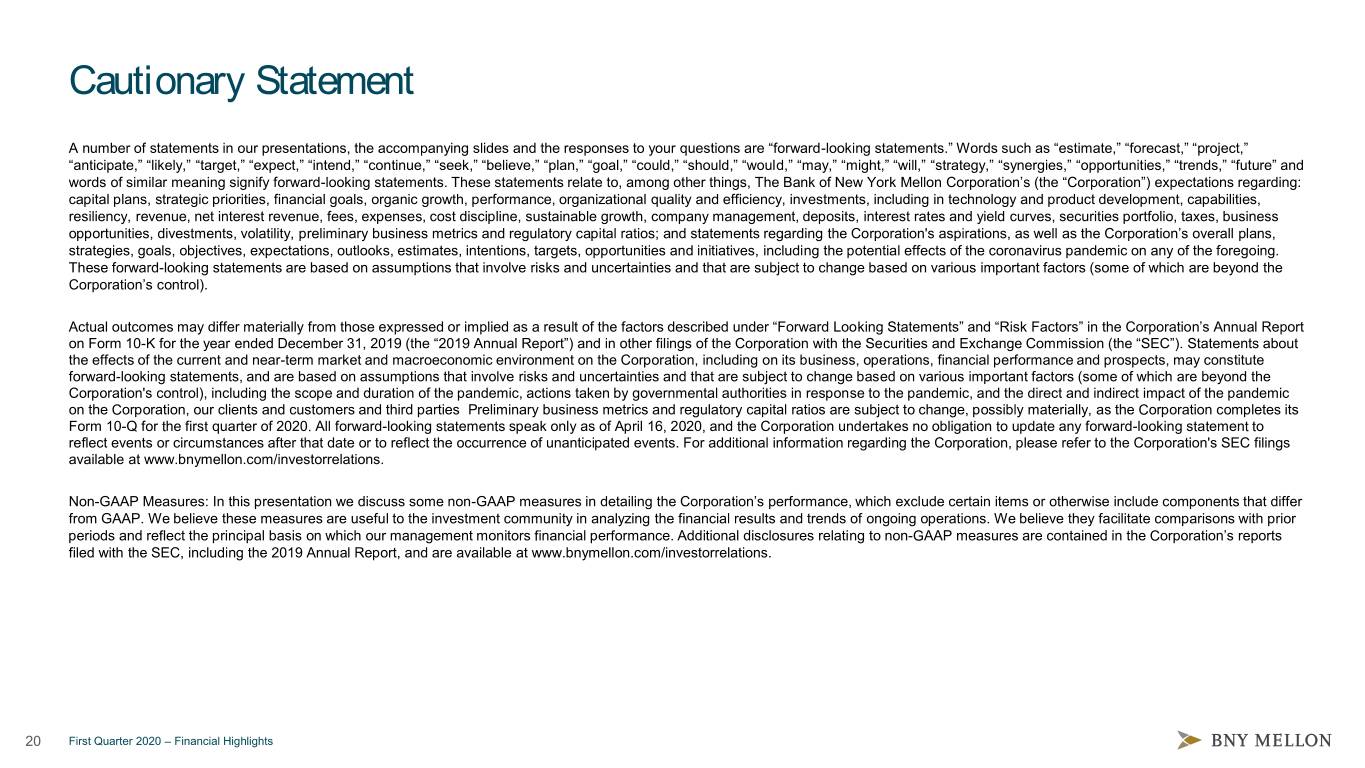
Cautionary Statement A number of statements in our presentations, the accompanying slides and the responses to your questions are “forward-looking statements.” Words such as “estimate,” “forecast,” “project,” “anticipate,” “likely,” “target,” “expect,” “intend,” “continue,” “seek,” “believe,” “plan,” “goal,” “could,” “should,” “would,” “may,” “might,” “will,” “strategy,” “synergies,” “opportunities,” “trends,” “future” and words of similar meaning signify forward-looking statements. These statements relate to, among other things, The Bank of New York Mellon Corporation’s (the “Corporation”) expectations regarding: capital plans, strategic priorities, financial goals, organic growth, performance, organizational quality and efficiency, investments, including in technology and product development, capabilities, resiliency, revenue, net interest revenue, fees, expenses, cost discipline, sustainable growth, company management, deposits, interest rates and yield curves, securities portfolio, taxes, business opportunities, divestments, volatility, preliminary business metrics and regulatory capital ratios; and statements regarding the Corporation's aspirations, as well as the Corporation’s overall plans, strategies, goals, objectives, expectations, outlooks, estimates, intentions, targets, opportunities and initiatives, including the potential effects of the coronavirus pandemic on any of the foregoing. These forward-looking statements are based on assumptions that involve risks and uncertainties and that are subject to change based on various important factors (some of which are beyond the Corporation’s control). Actual outcomes may differ materially from those expressed or implied as a result of the factors described under “Forward Looking Statements” and “Risk Factors” in the Corporation’s Annual Report on Form 10-K for the year ended December 31, 2019 (the “2019 Annual Report”) and in other filings of the Corporation with the Securities and Exchange Commission (the “SEC”). Statements about the effects of the current and near-term market and macroeconomic environment on the Corporation, including on its business, operations, financial performance and prospects, may constitute forward-looking statements, and are based on assumptions that involve risks and uncertainties and that are subject to change based on various important factors (some of which are beyond the Corporation's control), including the scope and duration of the pandemic, actions taken by governmental authorities in response to the pandemic, and the direct and indirect impact of the pandemic on the Corporation, our clients and customers and third parties Preliminary business metrics and regulatory capital ratios are subject to change, possibly materially, as the Corporation completes its Form 10-Q for the first quarter of 2020. All forward-looking statements speak only as of April 16, 2020, and the Corporation undertakes no obligation to update any forward-looking statement to reflect events or circumstances after that date or to reflect the occurrence of unanticipated events. For additional information regarding the Corporation, please refer to the Corporation's SEC filings available at www.bnymellon.com/investorrelations. Non-GAAP Measures: In this presentation we discuss some non-GAAP measures in detailing the Corporation’s performance, which exclude certain items or otherwise include components that differ from GAAP. We believe these measures are useful to the investment community in analyzing the financial results and trends of ongoing operations. We believe they facilitate comparisons with prior periods and reflect the principal basis on which our management monitors financial performance. Additional disclosures relating to non-GAAP measures are contained in the Corporation’s reports filed with the SEC, including the 2019 Annual Report, and are available at www.bnymellon.com/investorrelations. 20 First Quarter 2020 – Financial Highlights