
BSVN 8-K
Bank7 Corp. (BSVN)
8-K
2021-01-29
For: 2021-01-29
View Original
Added on
April 09, 2026
UNITED STATES
SECURITIES AND EXCHANGE COMMISSION
Washington, D.C. 20549
FORM 8-K
CURRENT REPORT
Pursuant to Section 13 or 15(d) of the
Securities Exchange Act of 1934
Date of Report (Date of earliest event reported)
January 29, 2021
Bank7 Corp.
(Exact name of registrant as specified in its charter)
|
Oklahoma
|
001-38656
|
20-0764349
|
|
(State or other jurisdiction of incorporation)
|
(Commission File Number)
|
(IRS Employer Identification No.)
|
1039 N.W. 63rd Street, Oklahoma City, Oklahoma 73116
(Address of principal executive offices) (Zip Code)
(405) 810-8600
(Registrant’s telephone number, including area code)
Not Applicable
(Former name or former address, if changed since last report)
Check the appropriate box below if the Form 8-K filing is intended to simultaneously satisfy the filing obligation of the registrant under any of the following provisions:
| ☐ |
Written communications pursuant to Rule 425 under the Securities Act (17 CFR 230.425)
|
| ☐ |
Soliciting material pursuant to Rule 14a-12 under the Exchange Act (17 CFR 240.14a-12)
|
| ☐ |
Pre-commencement communications pursuant to Rule 14d-2(b) under the Exchange Act (17 CFR 240.14d-2(b))
|
| ☐ |
Pre-commencement communications pursuant to Rule 13e-4(c) under the Exchange Act (17 CFR 240.13e-4(c))
|
Securities registered pursuant to Section 12(b) of the Act:
|
Title of each class
|
Trading
Symbol(s)
|
Name of each exchange on which
registered
|
|
Common Stock, $0.01 par value
|
BSVN
|
The NASDAQ Global Select Market
|
Indicate by check mark whether the registrant is an emerging growth company as defined in Rule 405 of the Securities Act of 1933 (17 CFR §230.405) or Rule 12b-2 of the Securities Exchange Act of 1934 (17 CFR
§240.12b-2).
Emerging growth company ☑
If an emerging growth company, indicate by check mark if the registrant has elected not to use the extended transition period for complying with any new or revised financial accounting standards provided pursuant to Section 13(a) of the Exchange
Act. ☐
| Item 2.02. |
Results of Operations and Financial Condition
|
| Item 7.01 |
Regulation FD Disclosure
|
On January 29, 2021, Bank7 Corp. (the “Company”), the holding company for Bank7, issued a press release announcing its results of operation and financial condition for the fourth quarter and full year ended December
31, 2020. A copy of the press release is attached to this Current Report on Form 8-K as Exhibit 99.1 and is incorporated herein by reference.
The Company is conducting a conference call on January 29, 2021 at 11:00 am ET to discuss its fourth quarter and full year financial results. A copy of the presentation slides to be used during the earnings call is
attached to this Current Report on Form 8-K as Exhibit 99.2 and is incorporated herein by reference.
In accordance with General Instruction B.2 of Form 8-K, the information in this Current Report on Form 8-K, including Exhibit 99.1 and Exhibit 99.2, shall not be deemed “filed” for the purposes of Section 18 of the
Securities Exchange Act of 1934, as amended (the “Exchange Act”), and shall not be incorporated by reference into any filing or other document pursuant to the Securities Act of 1933, as amended, or the Exchange Act except as shall be expressly set
forth by specific reference in such filing.
| Item 9.01 |
Financial Statements and Exhibits
|
| (d) |
Exhibits.
|
The following exhibits are filed herewith:
|
Item
|
Description
|
|
|
Press Release dated January 29, 2021
|
||
|
Fourth Quarter and Full Year 2020 Investor Presentation
|
SIGNATURES
Pursuant to the requirements of the Securities Exchange Act of 1934, the registrant has duly caused this report to be signed on its behalf by the undersigned hereunto duly authorized.
|
BANK7 CORP.
|
||
|
Date: January 29, 2021
|
By:
|
/s/ Kelly J. Harris
|
|
Kelly J. Harris
|
||
|
Senior Vice President and Chief Financial Officer
|
||
Exhibit 99.1

FOR IMMEDIATE RELEASE: Bank7 Corp. Announces 4Q and Full Year 2020 Earnings
Oklahoma City, OK, January 29, 2021 – Bank7 Corp. (NASDAQ: BSVN) ("the Company"), the parent company of Oklahoma City-based Bank7 (the "Bank"), today reported unaudited results for the fiscal quarter and year ended December 31, 2020. “We are
pleased to report continued strength in our asset quality and liquidity components, and also to report a record level of PPE for our Company. Strong PPE enabled us to make meaningful increases to our ALLL, repurchase shares at a discount to book
value, and increase our cash dividend, all while maintaining higher levels of capital compared to the industry mean. We benefit from the strong economy in our region, and feel positive about our future; nonetheless, there is still much uncertainty
and business activity is somewhat muted, therefore we will continue to use caution moving forward,” said Thomas L. Travis, President and CEO of the Company.
Three months ended December 31, 2020 compared to three months ended December 31, 2019:
| - |
Pre-tax, pre-provision earnings of $8.4 million, an increase of 31.60%
|
| - |
Interest income on loans, including loan fee income, totaled $13.2 million, an increase of 7.18%
|
| - |
Cost of funds of 0.51%, a decrease of 59.53%
|
| - |
Efficiency ratio of 35.13%, compared to 41.74%
|
For the year ended December 31, 2020 compared to the year ended December 31, 2019:
| - |
Pre-tax, pre-provision earnings of $31.2 million, an increase of 16.25%, excluding the one-time, non-cash executive stock transaction expense in Q3 2019.
|
| - |
Interest income on loans, including loan fee income, totaled $52.4 million, an increase of 8.82%
|
| - |
Cost of funds of 0.73%, a decrease of 46.71%
|
| - |
Total assets of $1.0 billion, an increase of 17.35%
|
| - |
Total loans of $824.1 million, an increase of 18.23%
|
| - |
Total deposits of $905.5 million, an increase of 19.54%
|
Both the Bank’s and the Company’s capital levels continue to be significantly above the minimum levels required to be designated as “well-capitalized” for regulatory purposes. On December 31, 2020, the Bank’s Tier 1 leverage ratio, Tier 1 risk
based capital ratio, and total risk-based capital ratios were 10.78%, 13.51%, and 14.75% respectively. On December 31, 2020, on a consolidated basis, the Company’s Tier 1 leverage ratio, Tier 1 risk based capital ratio, and total risk-based capital
ratios were 10.77%, 13.50%, and 14.73% respectively. Designation as a well-capitalized institution under regulations does not constitute a recommendation or endorsement by bank regulators.
Pre-tax, pre-provision earnings is defined as income before taxes and provision for loan losses. We believe the most directly comparable GAAP financial measure is income before taxes. Disclosure of this measure enables
you to compare our operations to those of other banking companies before consideration of taxes and provision expense. We calculate our tax-adjusted net income, return on average assets, and return on average equity, and per share amounts by using a
combined effective tax rate for federal and state income taxes of 25.6% and 45.4% in 2020 and 2019, respectively. We acknowledge that our non-GAAP financial measures have a number of limitations. As such, you should not view these disclosures as a
substitute for results determined in accordance with GAAP, and they are not necessarily comparable to non-GAAP financial measures that other banking companies use. Other banking companies may use names similar to those we use for non-GAAP financial
measures we disclose, but may calculate them differently. You should understand how we and other companies each calculate their non-GAAP financial measures when making comparisons. The following reconciliation table provides a more detailed
analysis of these non-GAAP financial measures:
|
Three months ended
December 31,
|
For the Year ended
December 31,
|
|||||||||||||||
|
(Dollars in thousands, except per share data)
|
2020
|
2019
|
2020
|
2019
|
||||||||||||
|
Loan interest income (excluding loan fees)
|
||||||||||||||||
|
Total loan interest income, including loan fee income
|
$
|
13,182
|
$
|
12,299
|
$
|
52,450
|
$
|
48,200
|
||||||||
|
Loan fee income
|
(1,066
|
)
|
(944
|
)
|
(5,035
|
)
|
(4,443
|
)
|
||||||||
|
Loan interest income excluding loan fee income
|
$
|
12,116
|
$
|
11,355
|
$
|
47,415
|
$
|
43,757
|
||||||||
|
Average total loans
|
$
|
871,163
|
$
|
692,286
|
$
|
823,228
|
$
|
636,274
|
||||||||
|
Yield on loans (including loan fee income)
|
6.02
|
%
|
7.05
|
%
|
6.37
|
%
|
7.58
|
%
|
||||||||
|
Yield on loans (excluding loan fee income)
|
5.53
|
%
|
6.51
|
%
|
5.76
|
%
|
6.88
|
%
|
||||||||
|
Pre-tax, pre-provision net earnings
|
||||||||||||||||
|
Net income before income taxes
|
$
|
6,317
|
$
|
6,358
|
$
|
25,884
|
$
|
15,069
|
||||||||
|
Plus: Provision for loan losses
|
2,050
|
|
-
|
5,350
|
|
-
|
||||||||||
|
Pre-tax, pre-provision net earnings
|
$
|
8,367
|
$
|
6,358
|
$
|
31,234
|
$
|
15,069
|
||||||||
|
Adjusted provision for income tax
|
||||||||||||||||
|
Net income before income taxes
|
$
|
6,317
|
$
|
6,358
|
$
|
25,884
|
$
|
15,069
|
||||||||
|
Total effective adjusted tax rate
|
25.0
|
%
|
29.6
|
%
|
25.6
|
%
|
45.4
|
%
|
||||||||
|
Adjusted provision for income taxes
|
$
|
1,578
|
$
|
1,879
|
$
|
6,618
|
$
|
6,844
|
||||||||
|
Tax-adjusted net income
|
||||||||||||||||
|
Net income before income taxes
|
$
|
6,317
|
$
|
6,358
|
$
|
25,884
|
$
|
15,069
|
||||||||
|
Adjusted provision for income taxes
|
1,578
|
1,879
|
6,618
|
6,844
|
||||||||||||
|
Tax-adjusted net income
|
$
|
4,739
|
$
|
4,479
|
$
|
19,266
|
$
|
8,225
|
||||||||
|
Pro Forma Pre-tax, pre-provision net earnings
|
||||||||||||||||
|
Net income before income taxes
|
$
|
6,317
|
$
|
6,358
|
$
|
25,884
|
$
|
15,069
|
||||||||
|
Plus: Provision loan losses
|
2,050
|
|
-
|
5,350
|
|
-
|
||||||||||
|
Plus: Stock Transfer Compensation Expense
|
-
|
-
|
-
|
11,797
|
||||||||||||
|
Pro Forma Pre-tax, pre-provision net earnings
|
$
|
8,367
|
$
|
6,358
|
$
|
31,234
|
$
|
26,866
|
||||||||
|
Tax-adjusted ratios and per share data
|
||||||||||||||||
|
Tax-adjusted net income (numerator)
|
$
|
4,739
|
$
|
4,479
|
$
|
19,266
|
$
|
8,225
|
||||||||
|
Average assets (denominator)
|
$
|
982,024
|
$
|
845,510
|
$
|
948,957
|
$
|
798,528
|
||||||||
|
Tax-adjusted return on average assets
|
1.92
|
%
|
2.10
|
%
|
2.03
|
%
|
1.03
|
%
|
||||||||
|
Average shareholders' equity (denominator)
|
$
|
105,283
|
$
|
102,691
|
$
|
102,359
|
$
|
97,430
|
||||||||
|
Tax-adjusted return on average shareholders' equity
|
17.91
|
%
|
17.31
|
%
|
18.82
|
%
|
8.44
|
%
|
||||||||
|
Average tangible common equity (denominator)
|
$
|
103,675
|
$
|
100,872
|
$
|
100,675
|
$
|
95,537
|
||||||||
|
Tax-adjusted return on average tangible common equity
|
18.18
|
%
|
17.62
|
%
|
19.14
|
%
|
8.61
|
%
|
||||||||
|
Weighted average common shares outstanding basic (denominator)
|
9,066,737
|
10,057,506
|
9,378,769
|
10,145,032
|
||||||||||||
|
Tax-adjusted net income per common share--basic
|
$
|
0.52
|
$
|
0.45
|
$
|
2.05
|
$
|
0.81
|
||||||||
|
Weighted average common shares outstanding diluted (denominator)
|
9,068,161
|
10,059,208
|
9,379,154
|
10,147,311
|
||||||||||||
|
Tax-adjusted net income per common share--diluted
|
$
|
0.52
|
$
|
0.45
|
$
|
2.05
|
$
|
0.81
|
||||||||
|
Tangible assets
|
||||||||||||||||
|
Total assets
|
$
|
1,016,669
|
$
|
866,392
|
||||||||||||
|
Less: Goodwill and intangibles
|
(1,583
|
)
|
(1,789
|
)
|
||||||||||||
|
Tangible assets
|
$
|
1,015,086
|
$
|
864,603
|
||||||||||||
|
Tangible shareholders' equity
|
||||||||||||||||
|
Total shareholders' equity
|
$
|
107,319
|
$
|
100,126
|
||||||||||||
|
Less: Goodwill and intangibles
|
(1,583
|
)
|
(1,789
|
)
|
||||||||||||
|
Tangible shareholders' equity
|
$
|
105,736
|
$
|
98,337
|
||||||||||||
|
Tangible shareholders' equity
|
||||||||||||||||
|
Tangible shareholders' equity (numerator)
|
$
|
105,736
|
$
|
98,337
|
||||||||||||
|
Tangible assets (denominator)
|
$
|
1,015,086
|
$
|
864,603
|
||||||||||||
|
Tangible common equity to tangible assets
|
10.42
|
%
|
11.37
|
%
|
||||||||||||
|
End of period common shares outstanding
|
9,044,765
|
10,057,506
|
||||||||||||||
|
Book value per share
|
$
|
11.87
|
$
|
9.96
|
||||||||||||
|
Tangible book value per share
|
$
|
11.69
|
$
|
9.78
|
||||||||||||
|
Total shareholders' equity to total assets
|
10.56
|
%
|
11.56
|
%
|
||||||||||||
|
Net Interest Margin Excluding Loan Fee Income
|
||||||||||||||||||||||||
|
For the Three Months Ended December 31,
|
||||||||||||||||||||||||
|
2020
|
2019
|
|||||||||||||||||||||||
|
Average
Balance
|
Interest
Income/
Expense
|
Average
Yield/
Rate
|
Average
Balance
|
Interest
Income/
Expense
|
Average
Yield/
Rate
|
|||||||||||||||||||
|
(Dollars in thousands)
|
||||||||||||||||||||||||
|
Interest-earning assets:
|
||||||||||||||||||||||||
|
Short-term investments(1)
|
$
|
102,544
|
$
|
127
|
0.49
|
%
|
$
|
143,604
|
$
|
674
|
1.86
|
%
|
||||||||||||
|
Investment securities(2)
|
1,165
|
15
|
5.12
|
1,073
|
23
|
8.50
|
||||||||||||||||||
|
Loans held for sale
|
198
|
—
|
0.00
|
289
|
—
|
0.00
|
||||||||||||||||||
|
Total loans(3)
|
871,163
|
12,116
|
5.53
|
692,286
|
11,355
|
6.51
|
||||||||||||||||||
|
Total interest-earning assets
|
975,070
|
12,258
|
5.00
|
837,252
|
12,052
|
5.71
|
||||||||||||||||||
|
Noninterest-earning assets
|
6,954
|
8,258
|
||||||||||||||||||||||
|
Total assets
|
$
|
982,024
|
$
|
845,510
|
||||||||||||||||||||
|
Funding sources:
|
||||||||||||||||||||||||
|
Interest-bearing liabilities:
|
||||||||||||||||||||||||
|
Deposits:
|
||||||||||||||||||||||||
|
Transaction accounts
|
$
|
409,174
|
470
|
0.46
|
%
|
$
|
314,106
|
1,133
|
1.43
|
%
|
||||||||||||||
|
Time deposits
|
203,842
|
655
|
1.28
|
213,716
|
1,205
|
2.24
|
||||||||||||||||||
|
Total interest-bearing deposits
|
613,016
|
1,125
|
0.73
|
527,822
|
2,338
|
1.76
|
||||||||||||||||||
|
Other borrowings
|
—
|
—
|
0.00
|
—
|
—
|
0.00
|
||||||||||||||||||
|
Total interest-bearing liabilities
|
613,016
|
1,125
|
0.73
|
527,822
|
2,338
|
1.76
|
||||||||||||||||||
|
Noninterest-bearing liabilities:
|
||||||||||||||||||||||||
|
Noninterest-bearing deposits
|
258,599
|
210,986
|
||||||||||||||||||||||
|
Other noninterest-bearing liabilities
|
5,126
|
4,011
|
||||||||||||||||||||||
|
Total noninterest-bearing liabilities
|
263,725
|
214,997
|
||||||||||||||||||||||
|
Shareholders’ equity
|
105,283
|
102,691
|
||||||||||||||||||||||
|
Total liabilities and shareholders’ equity
|
$
|
982,024
|
$
|
845,510
|
||||||||||||||||||||
|
Net interest income excluding loan fee income
|
$
|
11,133
|
$
|
9,714
|
||||||||||||||||||||
|
Net interest spread excluding loan fee income(4)
|
4.27
|
%
|
3.95
|
%
|
||||||||||||||||||||
|
Net interest margin excluding loan fee income
|
4.54
|
%
|
4.60
|
%
|
||||||||||||||||||||
|
Net Interest Margin With Loan Fee Income
|
||||||||||||||||||||||||
|
For the Three Months Ended December 31,
|
||||||||||||||||||||||||
|
2020
|
2019
|
|||||||||||||||||||||||
|
Average
Balance
|
Interest
Income/
Expense
|
Average
Yield/
Rate
|
Average
Balance
|
Interest
Income/
Expense
|
Average
Yield/
Rate
|
|||||||||||||||||||
|
(Dollars in thousands)
|
||||||||||||||||||||||||
|
Interest-earning assets:
|
||||||||||||||||||||||||
|
Short-term investments(1)
|
$
|
102,544
|
|
$
|
127
|
0.49
|
%
|
$
|
143,604
|
$
|
674
|
1.80
|
%
|
|||||||||||
|
Investment securities(2)
|
1,165
|
15
|
5.12
|
1,073
|
23
|
8.50
|
||||||||||||||||||
|
Loans held for sale
|
198
|
—
|
0.00
|
289
|
—
|
0.00
|
||||||||||||||||||
|
Total loans(3)
|
871,163
|
13,182
|
6.02
|
692,286
|
12,299
|
7.05
|
||||||||||||||||||
|
Total interest-earning assets
|
975,070
|
13,324
|
5.44
|
837,252
|
12,996
|
6.16
|
||||||||||||||||||
|
Noninterest-earning assets
|
6,954
|
8,258
|
||||||||||||||||||||||
|
Total assets
|
$
|
982,024
|
$
|
845,510
|
||||||||||||||||||||
|
Funding sources:
|
||||||||||||||||||||||||
|
Interest-bearing liabilities:
|
||||||||||||||||||||||||
|
Deposits:
|
||||||||||||||||||||||||
|
Transaction accounts
|
$
|
409,174
|
470
|
0.46
|
%
|
$
|
314,106
|
1,133
|
1.43
|
%
|
||||||||||||||
|
Time deposits
|
203,842
|
655
|
1.28
|
213,716
|
1,205
|
2.24
|
||||||||||||||||||
|
Total interest-bearing deposits
|
613,016
|
1,125
|
0.73
|
527,822
|
2,338
|
1.76
|
||||||||||||||||||
|
Other borrowings
|
—
|
—
|
0.00
|
—
|
—
|
0.00
|
||||||||||||||||||
|
Total interest-bearing liabilities
|
613,016
|
1,125
|
0.73
|
527,822
|
2,338
|
1.76
|
||||||||||||||||||
|
Noninterest-bearing liabilities:
|
||||||||||||||||||||||||
|
Noninterest-bearing deposits
|
258,599
|
210,986
|
||||||||||||||||||||||
|
Other noninterest-bearing liabilities
|
5,126
|
4,011
|
||||||||||||||||||||||
|
Total noninterest-bearing liabilities
|
263,725
|
214,997
|
||||||||||||||||||||||
|
Shareholders’ equity
|
105,283
|
102,691
|
||||||||||||||||||||||
|
Total liabilities and shareholders’ equity
|
$
|
982,024
|
$
|
845,510
|
||||||||||||||||||||
|
Net interest income including loan fee income
|
|
$
|
12,199
|
$
|
10,658
|
|||||||||||||||||||
|
Net interest spread including loan fee income(4)
|
4.71
|
%
|
4.40
|
%
|
||||||||||||||||||||
|
Net interest margin including loan fee income
|
4.98
|
%
|
5.05
|
%
|
||||||||||||||||||||
| (1) |
Includes income and average balances for fed funds sold, interest-earning deposits in banks and other miscellaneous interest-earning assets.
|
| (2) |
Includes income and average balances for FHLB and FRB stock.
|
| (3) |
Non-accrual loans are included in loans.
|
| (4) |
Net interest spread is the average yield on interest-earning assets minus the average rate on interest-bearing liabilities.
|
|
Net Interest Margin Excluding Loan Fee Income
|
||||||||||||||||||||||||
|
For the Year Ended December 31,
|
||||||||||||||||||||||||
|
2020
|
2019
|
|||||||||||||||||||||||
|
Average
Balance
|
Interest
Income/
Expense
|
Average
Yield/
Rate
|
Average
Balance
|
Interest
Income/
Expense
|
Average
Yield/
Rate
|
|||||||||||||||||||
|
(Dollars in thousands)
|
||||||||||||||||||||||||
|
Interest-earning assets:
|
||||||||||||||||||||||||
|
Short-term investments(1)
|
$
|
116,295
|
$
|
828
|
0.71
|
% |
$
|
151,434
|
$
|
3,459
|
2.28
|
%
|
||||||||||||
|
Investment securities(2)
|
1,123
|
36
|
3.21
|
1,065
|
50
|
4.69
|
||||||||||||||||||
|
Loans held for sale
|
244
|
—
|
0.00
|
236
|
—
|
0.00
|
||||||||||||||||||
|
Total loans(3)
|
823,228
|
47,415
|
5.76
|
636,274
|
43,757
|
6.88
|
||||||||||||||||||
|
Total interest-earning assets
|
940,890
|
48,279
|
5.13
|
789,009
|
47,266
|
5.99
|
||||||||||||||||||
|
Noninterest-earning assets
|
8,067
|
9,519
|
||||||||||||||||||||||
|
Total assets
|
$
|
948,957
|
$
|
798,528
|
||||||||||||||||||||
|
Funding sources:
|
||||||||||||||||||||||||
|
Interest-bearing liabilities:
|
||||||||||||||||||||||||
|
Deposits:
|
||||||||||||||||||||||||
|
Transaction accounts
|
$
|
377,519
|
2,729
|
0.72
|
% |
$
|
295,576
|
5,057
|
1.71
|
%
|
||||||||||||||
|
Time deposits
|
207,442
|
3,424
|
1.65
|
208,375
|
4,459
|
2.14
|
||||||||||||||||||
|
Total interest-bearing deposits
|
584,961
|
6,153
|
1.05
|
503,951
|
9,516
|
1.89
|
||||||||||||||||||
|
Other borrowings
|
—
|
—
|
0.00
|
—
|
—
|
0.00
|
||||||||||||||||||
|
Total interest-bearing liabilities
|
584,961
|
6,153
|
1.05
|
503,951
|
9,516
|
1.89
|
||||||||||||||||||
|
Noninterest-bearing liabilities:
|
||||||||||||||||||||||||
|
Noninterest-bearing deposits
|
256,431
|
192,562
|
||||||||||||||||||||||
|
Other noninterest-bearing liabilities
|
5,206
|
4,585
|
||||||||||||||||||||||
|
Total noninterest-bearing liabilities
|
261,637
|
197,147
|
||||||||||||||||||||||
|
Shareholders’ equity
|
102,359
|
97,430
|
||||||||||||||||||||||
|
Total liabilities and shareholders’ equity
|
$
|
948,957
|
$
|
798,528
|
||||||||||||||||||||
|
Net interest income excluding loan fee income
|
$
|
42,126
|
$
|
37,750
|
||||||||||||||||||||
|
Net interest spread excluding loan fee income(4)
|
4.08
|
% |
4.10
|
%
|
||||||||||||||||||||
|
Net interest margin excluding loan fee income
|
4.48
|
% |
4.78
|
%
|
||||||||||||||||||||
|
Net Interest Margin With Loan Fee Income
|
||||||||||||||||||||||||
|
For the Year Ended December 31,
|
||||||||||||||||||||||||
|
2020
|
2019
|
|||||||||||||||||||||||
|
Average
Balance
|
Interest
Income/
Expense
|
Average
Yield/
Rate
|
Average
Balance
|
Interest
Income/
Expense
|
Average
Yield/
Rate
|
|||||||||||||||||||
|
(Dollars in thousands)
|
||||||||||||||||||||||||
|
Interest-earning assets:
|
||||||||||||||||||||||||
|
Short-term investments(1)
|
$
|
116,295
|
$
|
828
|
0.71
|
%
|
$
|
151,434
|
$
|
3,459
|
2.28
|
%
|
||||||||||||
|
Investment securities(2)
|
1,123
|
36
|
3.21
|
1,065
|
50
|
4.69
|
||||||||||||||||||
|
Loans held for sale
|
244
|
—
|
0.00
|
236
|
—
|
0.00
|
||||||||||||||||||
|
Total loans(3)
|
823,228
|
52,450
|
6.37
|
636,274
|
48,200
|
7.58
|
||||||||||||||||||
|
Total interest-earning assets
|
940,890
|
53,314
|
5.67
|
789,009
|
51,709
|
6.55
|
||||||||||||||||||
|
Noninterest-earning assets
|
8,067
|
9,519
|
||||||||||||||||||||||
|
Total assets
|
$
|
948,957
|
$
|
798,528
|
||||||||||||||||||||
|
Funding sources:
|
||||||||||||||||||||||||
|
Interest-bearing liabilities:
|
||||||||||||||||||||||||
|
Deposits:
|
||||||||||||||||||||||||
|
Transaction accounts
|
$
|
377,519
|
2,729
|
0.72
|
%
|
$
|
295,576
|
5,057
|
1.71
|
%
|
||||||||||||||
|
Time deposits
|
207,442
|
3,424
|
1.65
|
208,375
|
4,459
|
2.14
|
||||||||||||||||||
|
Total interest-bearing deposits
|
584,961
|
6,153
|
1.05
|
503,951
|
9,516
|
1.89
|
||||||||||||||||||
|
Other borrowings
|
—
|
—
|
0.00
|
—
|
—
|
0.00
|
||||||||||||||||||
|
Total interest-bearing liabilities
|
584,961
|
6,153
|
1.05
|
503,951
|
9,516
|
1.89
|
||||||||||||||||||
|
Noninterest-bearing liabilities:
|
||||||||||||||||||||||||
|
Noninterest-bearing deposits
|
256,431
|
192,562
|
||||||||||||||||||||||
|
Other noninterest-bearing liabilities
|
5,206
|
4,585
|
||||||||||||||||||||||
|
Total noninterest-bearing liabilities
|
261,637
|
197,147
|
||||||||||||||||||||||
|
Shareholders’ equity
|
102,359
|
97,430
|
||||||||||||||||||||||
|
Total liabilities and shareholders’ equity
|
$
|
948,957
|
$
|
798,528
|
||||||||||||||||||||
|
Net interest income including loan fee income
|
$
|
47,161
|
$
|
42,193
|
||||||||||||||||||||
|
Net interest spread including loan fee income(4)
|
4.61
|
%
|
4.67
|
%
|
||||||||||||||||||||
|
Net interest margin including loan fee income
|
5.01
|
%
|
5.35
|
%
|
||||||||||||||||||||
Bank7 Corp.
Consolidated Balance Sheets
|
Dollars in thousands, except per share data
|
Unaudited as of
|
|||||||||||
|
Assets
|
2020
|
December 31,
|
||||||||||
|
December 31
|
September 30
|
2019
|
||||||||||
|
Cash and due from banks
|
$
|
153,901
|
$
|
60,718
|
$
|
117,128
|
||||||
|
Interest-bearing time deposits in other banks
|
16,412
|
23,384
|
30,147
|
|||||||||
|
Loans, net
|
826,974
|
869,448
|
699,458
|
|||||||||
|
Loans held for sale
|
324
|
315
|
1,031
|
|||||||||
|
Premises and equipment, net
|
9,151
|
9,387
|
9,624
|
|||||||||
|
Nonmarketable equity securities
|
1,172
|
1,165
|
1,100
|
|||||||||
|
Goodwill and intangibles
|
1,583
|
1,634
|
1,789
|
|||||||||
|
Interest receivable and other assets
|
7,152
|
7,303
|
6,115
|
|||||||||
|
Total assets
|
$
|
1,016,669
|
$
|
973,354
|
$
|
866,392
|
||||||
|
Liabilities and Shareholders’ Equity
|
||||||||||||
|
Deposits
|
||||||||||||
|
Noninterest-bearing
|
$
|
246,569
|
$
|
272,008
|
$
|
219,221
|
||||||
|
Interest-bearing
|
658,945
|
591,661
|
538,262
|
|||||||||
|
Total deposits
|
905,514
|
863,669
|
757,483
|
|||||||||
|
Income taxes payable
|
9
|
565
|
357
|
|||||||||
|
Interest payable and other liabilities
|
3,827
|
3,890
|
8,426
|
|||||||||
|
Total liabilities
|
909,350
|
868,124
|
766,266
|
|||||||||
|
Common stock
|
90
|
92
|
101
|
|||||||||
|
Additional paid-in capital
|
93,162
|
92,960
|
92,391
|
|||||||||
|
Retained earnings
|
14,067
|
12,178
|
7,634
|
|||||||||
|
Total shareholders’ equity
|
107,319
|
105,230
|
100,126
|
|||||||||
|
Total liabilities and shareholders’ equity
|
$
|
1,016,669
|
$
|
973,354
|
$
|
866,392
|
||||||
Bank7 Corp.
Consolidated Statements of Income
|
Unaudited as of
|
||||||||||||||||||||
|
Quarter Ended
|
Year Ended
|
|||||||||||||||||||
|
2020
|
2019
|
2020
|
2019
|
|||||||||||||||||
|
Dollars in thousands, except per share data
|
December 31
|
September 30
|
December 31
|
December 31
|
December 31
|
|||||||||||||||
|
Interest Income
|
||||||||||||||||||||
|
Loans, including fees
|
$
|
13,182
|
$
|
12,777
|
$
|
12,299
|
$
|
52,450
|
$
|
48,200
|
||||||||||
|
Interest-bearing time deposits in other banks
|
107
|
123
|
295
|
526
|
1,709
|
|||||||||||||||
|
Interest-bearing deposits in other banks
|
35
|
26
|
402
|
338
|
1,800
|
|||||||||||||||
|
Total interest income
|
13,324
|
12,926
|
12,996
|
53,314
|
51,709
|
|||||||||||||||
|
Interest Expense
|
||||||||||||||||||||
|
Deposits
|
1,125
|
1,325
|
2,338
|
6,153
|
9,516
|
|||||||||||||||
|
Total interest expense
|
1,125
|
1,325
|
2,338
|
6,153
|
9,516
|
|||||||||||||||
|
Net Interest Income
|
12,199
|
11,601
|
10,658
|
47,161
|
42,193
|
|||||||||||||||
|
Provision for Loan Losses
|
2,050
|
1,250
|
-
|
5,350
|
-
|
|||||||||||||||
|
Net Interest Income After Provision for Loan Losses
|
10,149
|
10,351
|
10,658
|
41,811
|
42,193
|
|||||||||||||||
|
Noninterest Income
|
||||||||||||||||||||
|
Secondary market income
|
41
|
57
|
18
|
175
|
164
|
|||||||||||||||
|
Service charges on deposit accounts
|
124
|
104
|
113
|
442
|
392
|
|||||||||||||||
|
Other
|
535
|
173
|
126
|
1,048
|
752
|
|||||||||||||||
|
Total noninterest income
|
700
|
334
|
257
|
1,665
|
1,308
|
|||||||||||||||
|
Noninterest Expense
|
||||||||||||||||||||
|
Salaries and employee benefits
|
2,554
|
2,505
|
2,473
|
10,130
|
21,265
|
|||||||||||||||
|
Furniture and equipment
|
210
|
224
|
223
|
868
|
829
|
|||||||||||||||
|
Occupancy
|
540
|
543
|
520
|
1,957
|
1,677
|
|||||||||||||||
|
Data and item processing
|
270
|
276
|
264
|
1,091
|
1,078
|
|||||||||||||||
|
Accounting, marketing and legal fees
|
198
|
135
|
250
|
536
|
757
|
|||||||||||||||
|
Regulatory assessments
|
225
|
164
|
32
|
506
|
126
|
|||||||||||||||
|
Advertising and public relations
|
40
|
62
|
239
|
400
|
588
|
|||||||||||||||
|
Travel, lodging and entertainment
|
95
|
50
|
81
|
241
|
368
|
|||||||||||||||
|
Other
|
400
|
625
|
475
|
1,863
|
1,744
|
|||||||||||||||
|
Total noninterest expense
|
4,532
|
4,584
|
4,557
|
17,592
|
28,432
|
|||||||||||||||
|
Income Before Taxes
|
6,317
|
6,101
|
6,358
|
25,884
|
15,069
|
|||||||||||||||
|
Income tax expense
|
1,578
|
1,661
|
1,879
|
6,618
|
6,844
|
|||||||||||||||
|
Net Income
|
$
|
4,739
|
$
|
4,440
|
$
|
4,479
|
$
|
19,266
|
$
|
8,225
|
||||||||||
|
Earnings per common share - basic
|
$
|
0.52
|
$
|
0.48
|
$
|
0.45
|
$
|
2.05
|
$
|
0.81
|
||||||||||
|
Diluted earnings per common share
|
0.52
|
0.48
|
0.45
|
2.05
|
0.81
|
|||||||||||||||
|
Weighted average common shares outstanding - basic
|
9,066,737
|
9,228,128
|
10,057,506
|
9,378,769
|
10,145,032
|
|||||||||||||||
|
Weighted average common shares outstanding - diluted
|
9,068,161
|
9,228,128
|
10,059,208
|
9,379,154
|
10,147,311
|
|||||||||||||||
About Bank7 Corp.
We are Bank7 Corp., a bank holding company headquartered in Oklahoma City, Oklahoma. Through our wholly-owned subsidiary, Bank7, we operate nine locations in Oklahoma, the Dallas/Fort Worth, Texas metropolitan area and
Kansas. We are focused on serving business owners and entrepreneurs by delivering fast, consistent and well-designed loan and deposit products to meet their financing needs. We intend to grow organically by selectively opening additional branches in
our target markets as well as pursue strategic acquisitions.
Conference Call
Bank7 Corp. has scheduled a conference call to discuss its first quarter results, which will be broadcast live over the Internet, on Friday, January 29, 2021 at 11:00 a.m. Eastern Time. To participate in the call, dial 1-888-348-6421, or access it
live over the Internet at https://www.webcaster4.com/Webcast/Page/2179/39520. For those not able to participate in the live call, an archive of the webcast will be available at https://www.webcaster4.com/Webcast/Page/2179/39520 shortly after the call for 1 year.
Cautionary Statements Regarding Forward-Looking Information
This communication contains a number of forward-looking statements. These forward-looking statements reflect Bank7 Corp.’s current views with respect to, among other things, future events and Bank7 Corp.’s financial performance. Any statements
about Bank7 Corp.’s expectations, beliefs, plans, predictions, forecasts, objectives, assumptions or future events or performance are not historical facts and may be forward-looking. These statements are often, but not always, made through the use of
words or phrases such as “anticipate,” “believes,” “can,” “could,” “may,” “predicts,” “potential,” “should,” “will,” “estimate,” “plans,” “projects,” “continuing,” “ongoing,” “expects,” “intends” and similar words or phrases. Any or all of the
forward-looking statements in (or conveyed orally regarding) this presentation may turn out to be inaccurate. The inclusion of or reference to forward-looking information in this presentation should not be regarded as a representation by Bank7 Corp.
or any other person that the future plans, estimates or expectations contemplated by Bank7 Corp. will be achieved.
These forward-looking statements are subject to significant uncertainties because they are based upon: the amount and timing of future changes in interest rates, market behavior, and other economic conditions; future laws, regulations, and
accounting principles; changes in regulatory standards and examination policies, and a variety of other matters. These other matters include, among other things, the impact of COVID-19 on the United States economy and our operations, the direct and
indirect effect of economic conditions on interest rates, credit quality, loan demand, liquidity, and monetary and supervisory policies of banking regulators. Bank7 Corp. has based these forward-looking statements largely on its current expectations
and projections about future events and financial trends that Bank7 Corp. believes may affect its financial condition, results of operations, business strategy and financial needs. Bank7 Corp.’s actual results could differ materially from those
anticipated in such forward-looking statements as a result of risks, uncertainties and assumptions that are difficult to predict. If one or more events related to these or other risks or uncertainties materialize, or if Bank7 Corp.’s underlying
assumptions prove to be incorrect, actual results may differ materially from what Bank7 Corp. anticipates. You are cautioned not to place undue reliance on forward-looking statements. Further, any forward-looking statement speaks only as of the date
on which it is made and Bank7 Corp. undertakes no obligation to update or revise any forward-looking statement to reflect events or circumstances after the date on which the statement is made or to reflect the occurrence of unanticipated events,
except as may be required by law. All forward-looking statements herein are qualified by these cautionary statements.
About Non-GAAP Financial Measures
This communication includes certain non-GAAP financial measures, including tax-adjusted net income, tax-adjusted earnings per share, tax-adjusted return on average assets and tax-adjusted return on average shareholders’ equity. These non-GAAP
financial measures and any other non-GAAP financial measures that we discuss in this presentation should not be considered in isolation, and should be considered as additions to, and not substitutes for or superior to, measures of financial
performance prepared in accordance with GAAP. There are a number of limitations related to the use of these non-GAAP financial measures versus their nearest GAAP equivalents. For example, other companies may calculate non-GAAP financial measures
differently or may use other measures to evaluate their performance, all of which could reduce the usefulness of Bank7 Corp.’s non-GAAP financial measures as tools for comparison. See the table above in this communication for a reconciliation of the
non-GAAP financial measures used in (or conveyed orally during) this communication to their most directly comparable GAAP financial measures.
Contact:
Thomas Travis
President & CEO
(405) 810-8600
Exhibit 99.2
BSVN 2020EARNINGS RELEASEJanuary 29, 2021
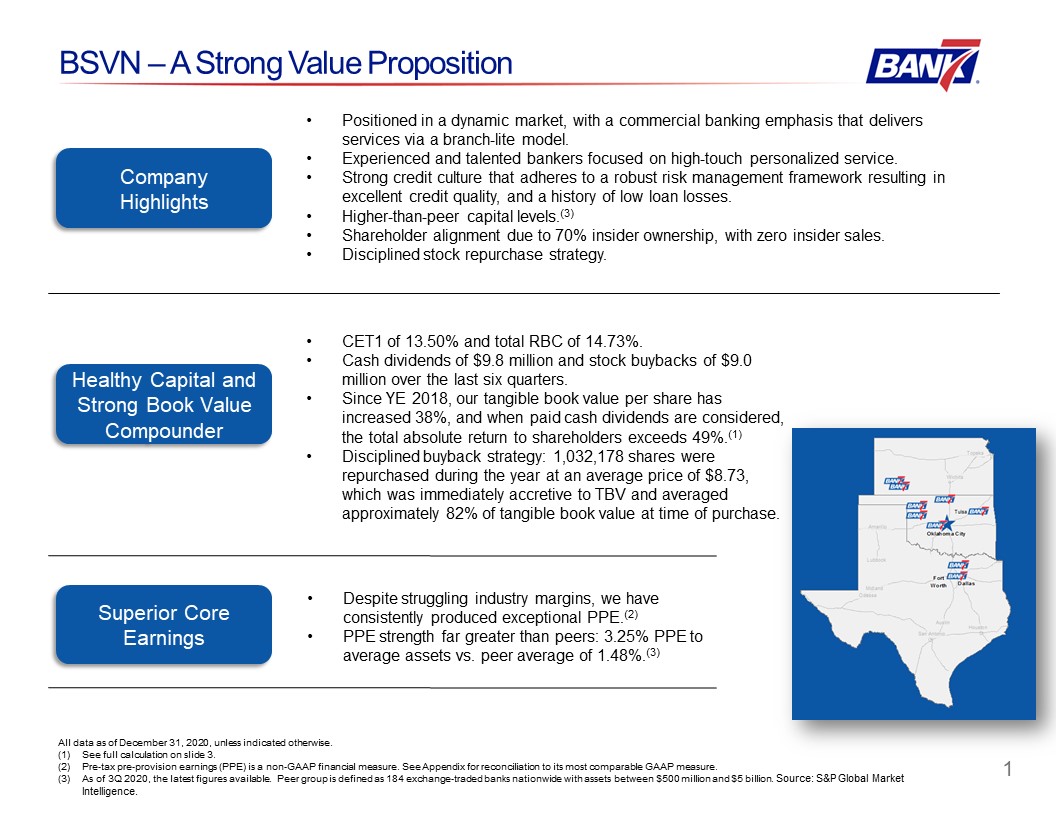
1 BSVN – A Strong Value Proposition Company Highlights Positioned in a dynamic market, with a
commercial banking emphasis that delivers services via a branch-lite model.Experienced and talented bankers focused on high-touch personalized service.Strong credit culture that adheres to a robust risk management framework resulting in
excellent credit quality, and a history of low loan losses.Higher-than-peer capital levels.(3)Shareholder alignment due to 70% insider ownership, with zero insider sales.Disciplined stock repurchase strategy. Healthy Capital and Strong Book
Value Compounder CET1 of 13.50% and total RBC of 14.73%.Cash dividends of $9.8 million and stock buybacks of $9.0 million over the last six quarters.Since YE 2018, our tangible book value per share has increased 38%, and when paid cash
dividends are considered, the total absolute return to shareholders exceeds 49%.(1)Disciplined buyback strategy: 1,032,178 shares were repurchased during the year at an average price of $8.73, which was immediately accretive to TBV and
averaged approximately 82% of tangible book value at time of purchase. Superior Core Earnings Despite struggling industry margins, we have consistently produced exceptional PPE.(2)PPE strength far greater than peers: 3.25% PPE to average
assets vs. peer average of 1.48%.(3) All data as of December 31, 2020, unless indicated otherwise.See full calculation on slide 3.Pre-tax pre-provision earnings (PPE) is a non-GAAP financial measure. See Appendix for reconciliation to its
most comparable GAAP measure.As of 3Q 2020, the latest figures available. Peer group is defined as 184 exchange-traded banks nationwide with assets between $500 million and $5 billion. Source: S&P Global Market Intelligence.
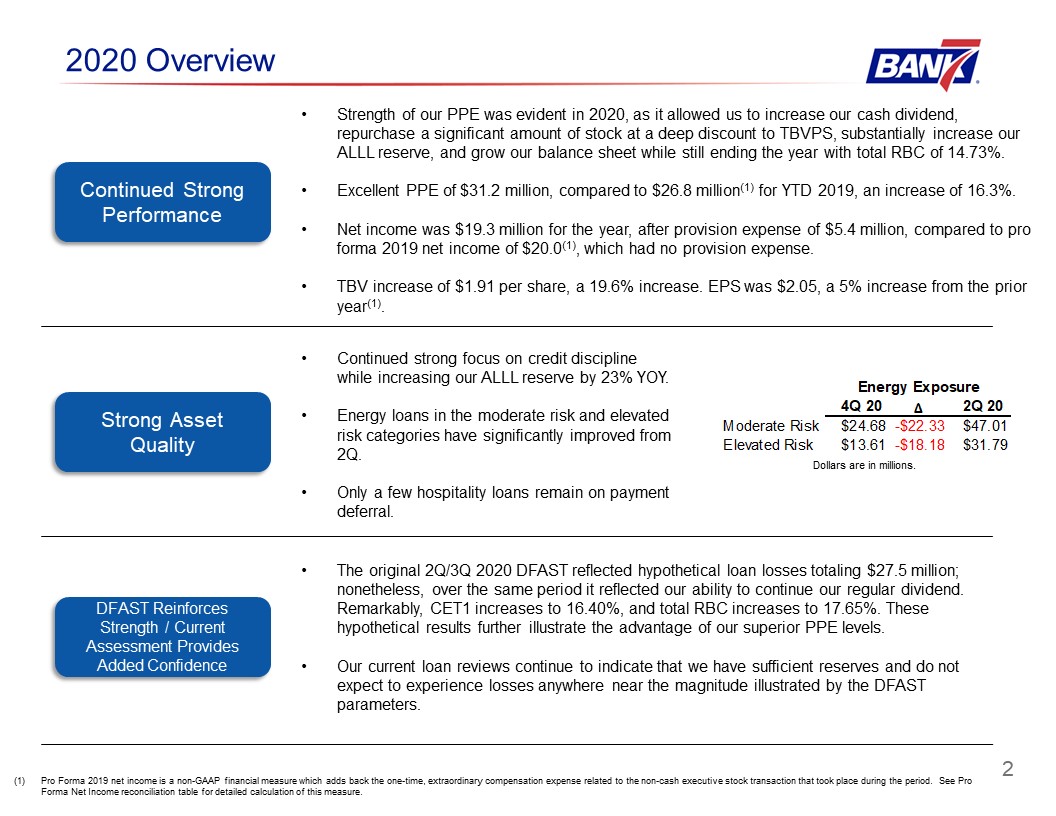
2 2020 Overview Strong Asset Quality Continued Strong Performance Strength of our PPE was evident
in 2020, as it allowed us to increase our cash dividend, repurchase a significant amount of stock at a deep discount to TBVPS, substantially increase our ALLL reserve, and grow our balance sheet while still ending the year with total RBC of
14.73%.Excellent PPE of $31.2 million, compared to $26.8 million(1) for YTD 2019, an increase of 16.3%. Net income was $19.3 million for the year, after provision expense of $5.4 million, compared to pro forma 2019 net income of $20.0(1),
which had no provision expense. TBV increase of $1.91 per share, a 19.6% increase. EPS was $2.05, a 5% increase from the prior year(1). DFAST Reinforces Strength / Current Assessment Provides Added Confidence The original 2Q/3Q 2020 DFAST
reflected hypothetical loan losses totaling $27.5 million; nonetheless, over the same period it reflected our ability to continue our regular dividend. Remarkably, CET1 increases to 16.40%, and total RBC increases to 17.65%. These
hypothetical results further illustrate the advantage of our superior PPE levels.Our current loan reviews continue to indicate that we have sufficient reserves and do not expect to experience losses anywhere near the magnitude illustrated by
the DFAST parameters. Continued strong focus on credit discipline while increasing our ALLL reserve by 23% YOY.Energy loans in the moderate risk and elevated risk categories have significantly improved from 2Q.Only a few hospitality loans
remain on payment deferral. Dollars are in millions. Pro Forma 2019 net income is a non-GAAP financial measure which adds back the one-time, extraordinary compensation expense related to the non-cash executive stock transaction that took
place during the period. See Pro Forma Net Income reconciliation table for detailed calculation of this measure.
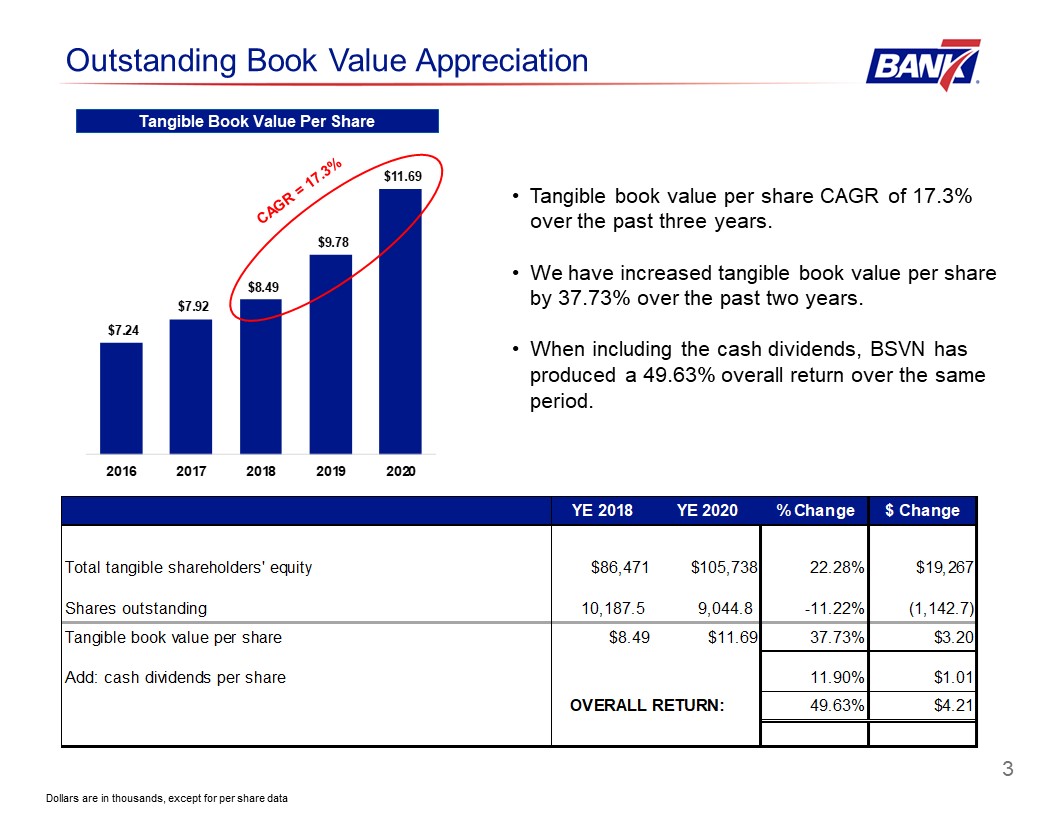
3 Outstanding Book Value Appreciation Tangible Book Value Per Share Tangible book value per share
CAGR of 17.3% over the past three years.We have increased tangible book value per share by 37.73% over the past two years.When including the cash dividends, BSVN has produced a 49.63% overall return over the same period. Dollars are in
thousands, except for per share data CAGR = 17.3%
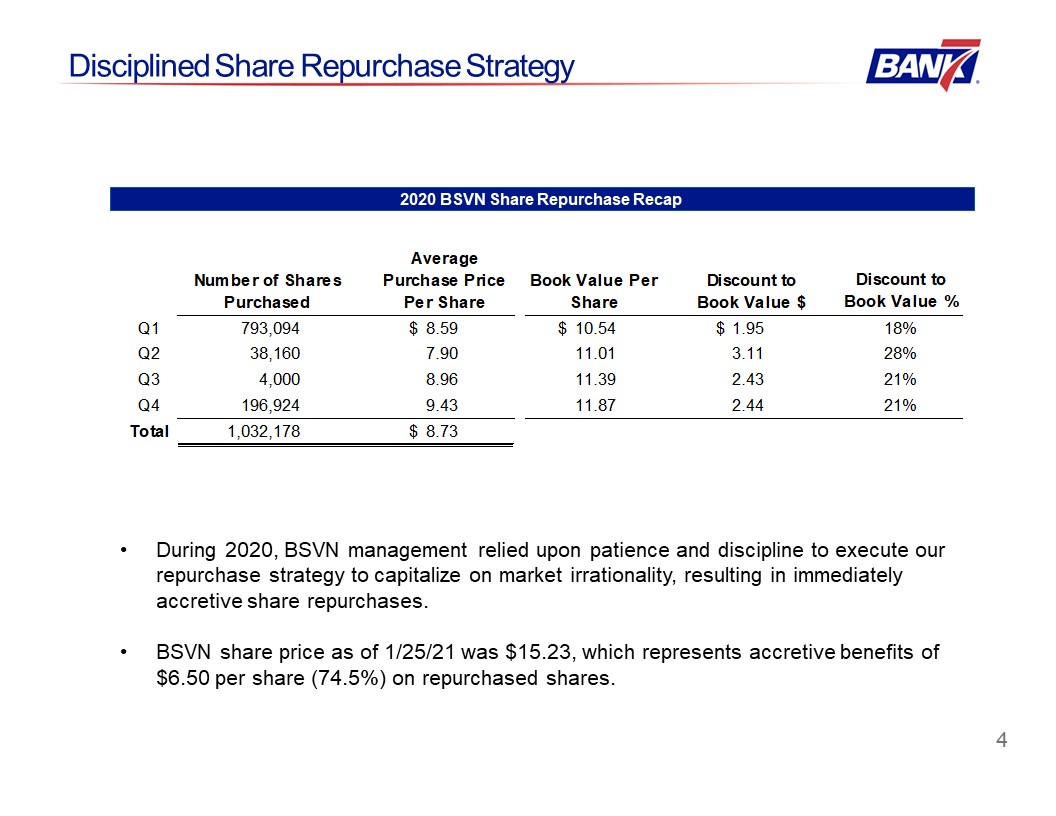
Disciplined Share Repurchase Strategy 4 Pro Forma During 2020, BSVN management relied upon
patience and discipline to execute our repurchase strategy to capitalize on market irrationality, resulting in immediately accretive share repurchases. BSVN share price as of 1/25/21 was $15.23, which represents accretive benefits of
$6.50 per share (74.5%) on repurchased shares. 2020 BSVN Share Repurchase Recap
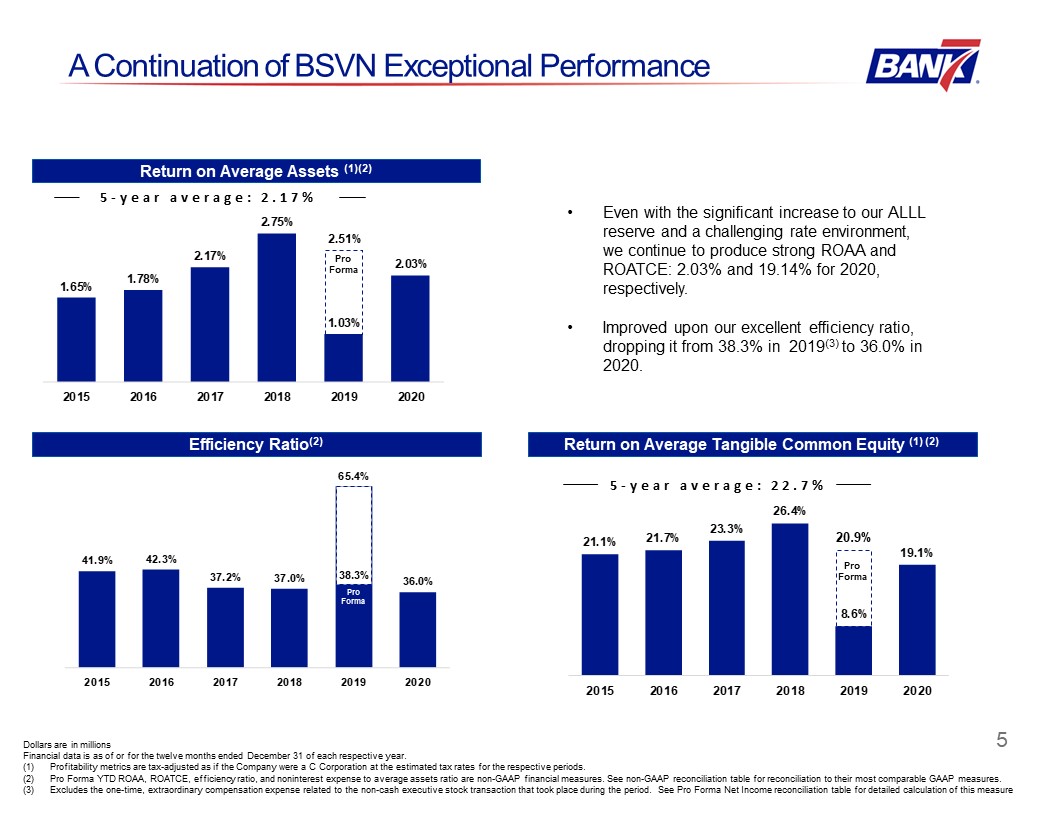
A Continuation of BSVN Exceptional Performance Return on Average Assets (1)(2) Return on Average
Tangible Common Equity (1) (2) Dollars are in millionsFinancial data is as of or for the twelve months ended December 31 of each respective year.Profitability metrics are tax-adjusted as if the Company were a C Corporation at the estimated
tax rates for the respective periods. Pro Forma YTD ROAA, ROATCE, efficiency ratio, and noninterest expense to average assets ratio are non-GAAP financial measures. See non-GAAP reconciliation table for reconciliation to their most comparable
GAAP measures.Excludes the one-time, extraordinary compensation expense related to the non-cash executive stock transaction that took place during the period. See Pro Forma Net Income reconciliation table for detailed calculation of this
measure Efficiency Ratio(2) Even with the significant increase to our ALLL reserve and a challenging rate environment, we continue to produce strong ROAA and ROATCE: 2.03% and 19.14% for 2020, respectively. Improved upon our excellent
efficiency ratio, dropping it from 38.3% in 2019(3) to 36.0% in 2020. 5 5-year average: 2.17% 5-year average: 22.7% Pro Forma Pro Forma Pro Forma 38.3% 2.51% 20.9%
Dollars are in millions. Financial data is as of or for the twelve months ended December 31 of
each respective year.Profitability metrics are tax-adjusted as if the Company were a C Corporation at the estimated tax rates for the respective periods. Combined federal and state effective tax rates for the year ended December 31,
2019 and 2020 were 25.5% (pro forma) and 25.6% respectively. Pro Forma 2019 net income is a non-GAAP financial measure which adds back the one-time, extraordinary compensation expense related to the non-cash executive stock transaction
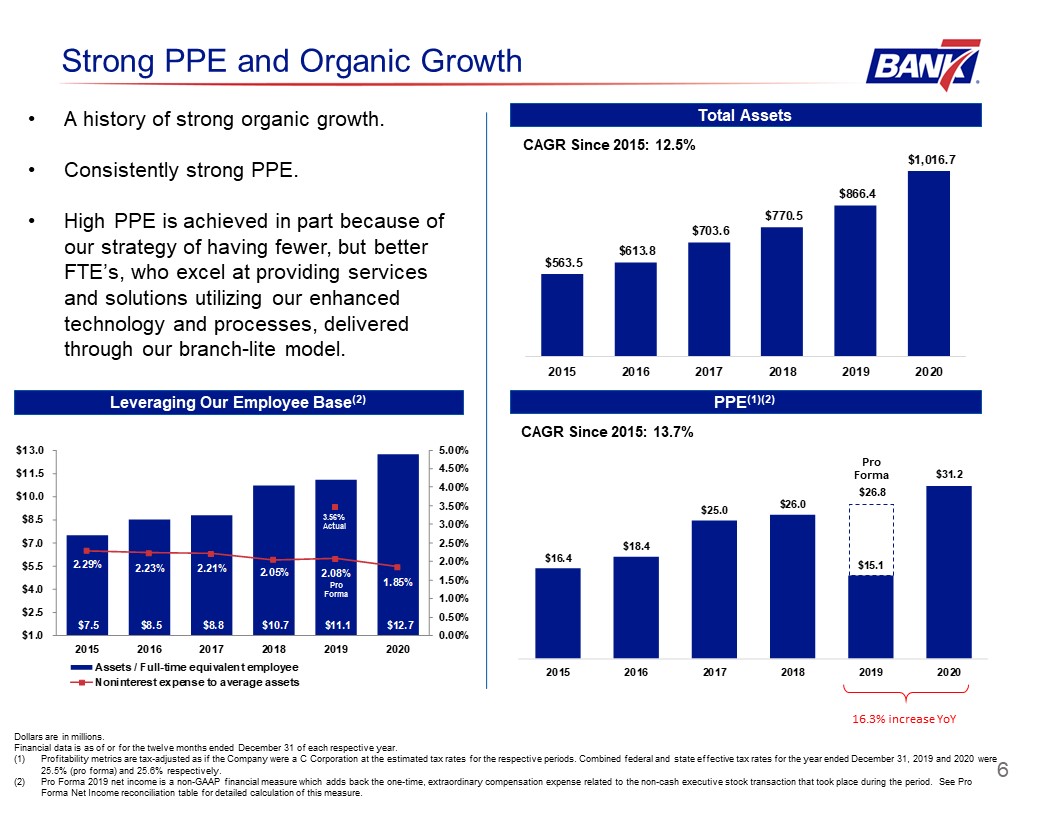
that took place during the period. See Pro Forma Net Income reconciliation table for detailed calculation of this measure. 16.3% increase YoY Strong PPE and Organic Growth PPE(1)(2) Total Assets 6 $26.8 Pro Forma A history of
strong organic growth.Consistently strong PPE.High PPE is achieved in part because of our strategy of having fewer, but better FTE’s, who excel at providing services and solutions utilizing our enhanced technology and processes,
delivered through our branch-lite model. Leveraging Our Employee Base(2) 3.56%Actual Pro Forma CAGR Since 2015: 12.5% CAGR Since 2015: 13.7%
Dollars are in millions. Financial data is as of or for the twelve months ended December 31 of
each respective year.Profitability metrics are tax-adjusted as if the Company were a C Corporation at the estimated tax rates for the respective periods. Combined federal and state effective tax rates for the year ended December 31, 2019 and
2020 were 25.5% (pro forma) and 25.6% respectively. Pro Forma 2019 net income is a non-GAAP financial measure which adds back
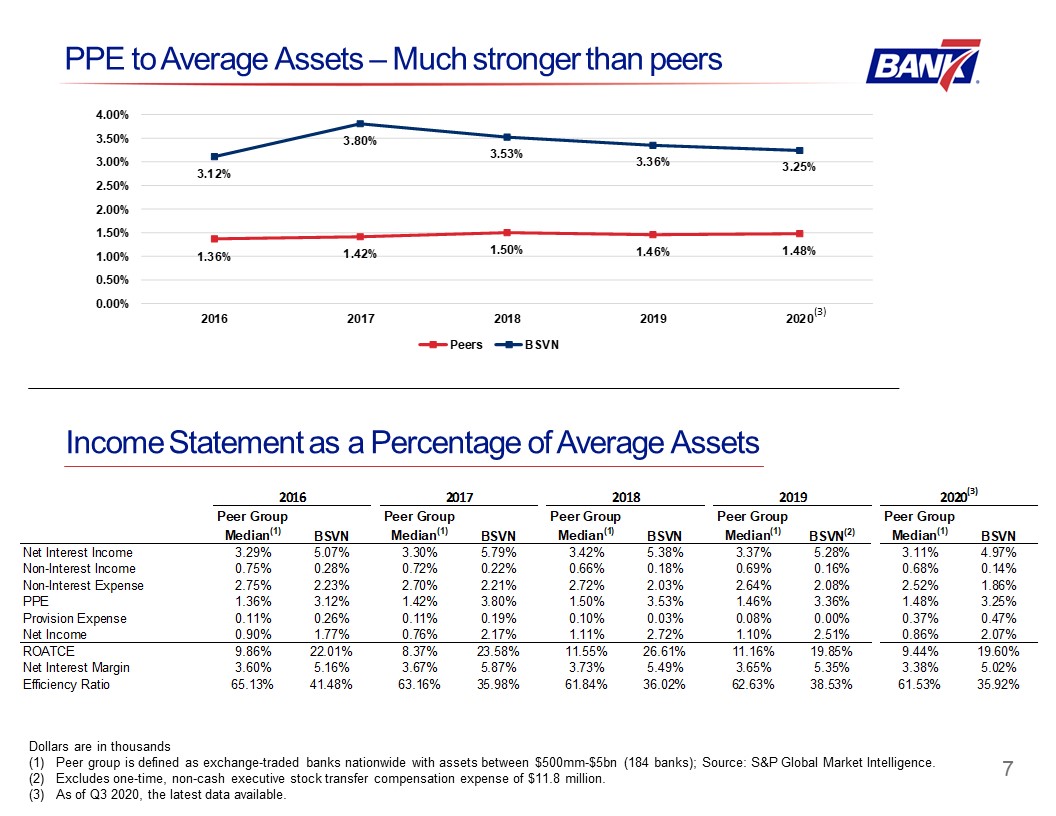
7 Income Statement as a Percentage of Average Assets Dollars are in thousandsPeer group is defined as
exchange-traded banks nationwide with assets between $500mm-$5bn (184 banks); Source: S&P Global Market Intelligence.Excludes one-time, non-cash executive stock transfer compensation expense of $11.8 million.As of Q3 2020, the latest data
available. PPE to Average Assets – Much stronger than peers (3)
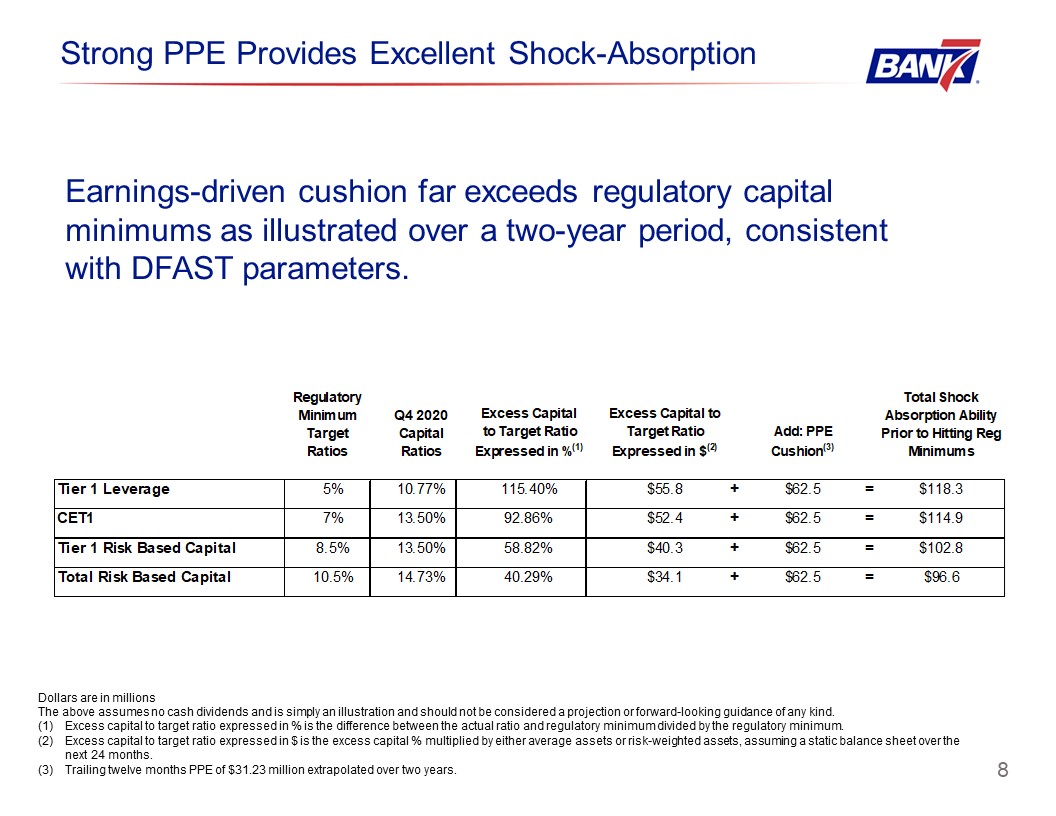
8 Earnings-driven cushion far exceeds regulatory capital minimums as illustrated over a two-year
period, consistent with DFAST parameters. Dollars are in millionsThe above assumes no cash dividends and is simply an illustration and should not be considered a projection or forward-looking guidance of any kind. Excess capital to target
ratio expressed in % is the difference between the actual ratio and regulatory minimum divided by the regulatory minimum.Excess capital to target ratio expressed in $ is the excess capital % multiplied by either average assets or
risk-weighted assets, assuming a static balance sheet over the next 24 months. Trailing twelve months PPE of $31.23 million extrapolated over two years. Strong PPE Provides Excellent Shock-Absorption
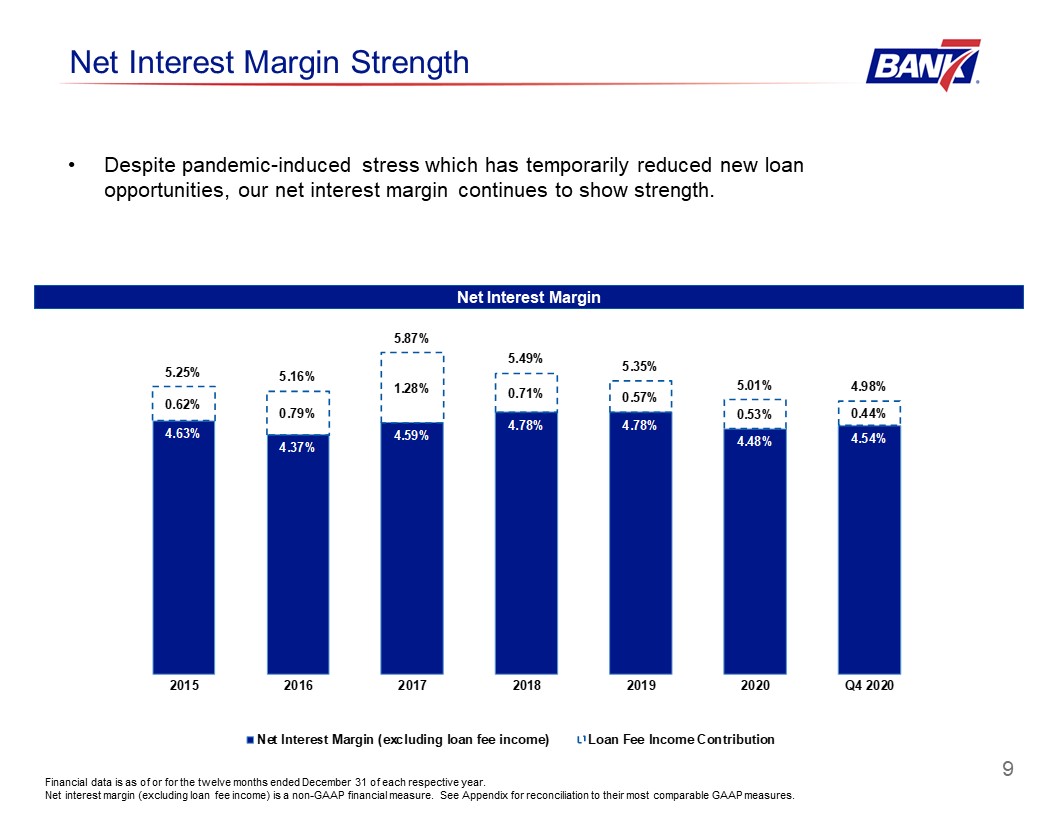
Net Interest Margin Strength Financial data is as of or for the twelve months ended December 31 of
each respective year.Net interest margin (excluding loan fee income) is a non-GAAP financial measure. See Appendix for reconciliation to their most comparable GAAP measures. Net Interest Margin Despite pandemic-induced stress which has
temporarily reduced new loan opportunities, our net interest margin continues to show strength. 9
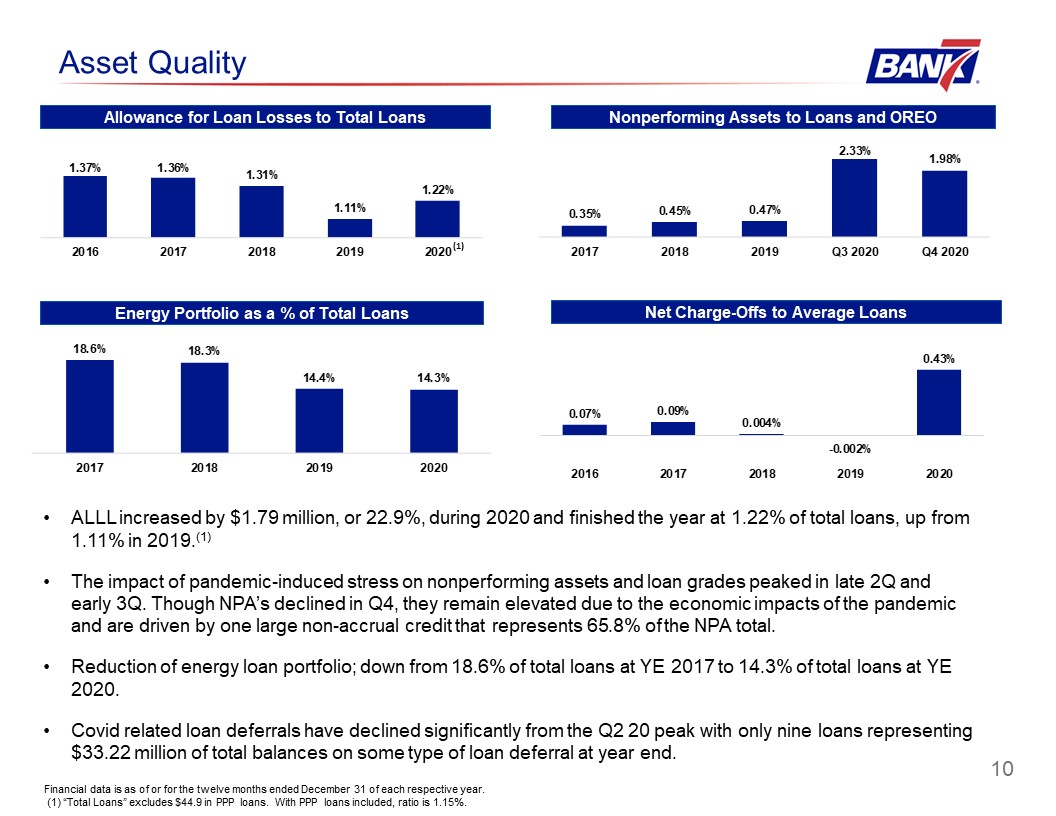
10 Allowance for Loan Losses to Total Loans Nonperforming Assets to Loans and OREO Asset
Quality Net Charge-Offs to Average Loans Financial data is as of or for the twelve months ended December 31 of each respective year.. (1) “Total Loans” excludes $44.9 in PPP loans. With PPP loans included, ratio is 1.15%. ALLL increased
by $1.79 million, or 22.9%, during 2020 and finished the year at 1.22% of total loans, up from 1.11% in 2019.(1)The impact of pandemic-induced stress on nonperforming assets and loan grades peaked in late 2Q and early 3Q. Though NPA’s
declined in Q4, they remain elevated due to the economic impacts of the pandemic and are driven by one large non-accrual credit that represents 65.8% of the NPA total. Reduction of energy loan portfolio; down from 18.6% of total loans at YE
2017 to 14.3% of total loans at YE 2020.Covid related loan deferrals have declined significantly from the Q2 20 peak with only nine loans representing $33.22 million of total balances on some type of loan deferral at year end. (1) Energy
Portfolio as a % of Total Loans
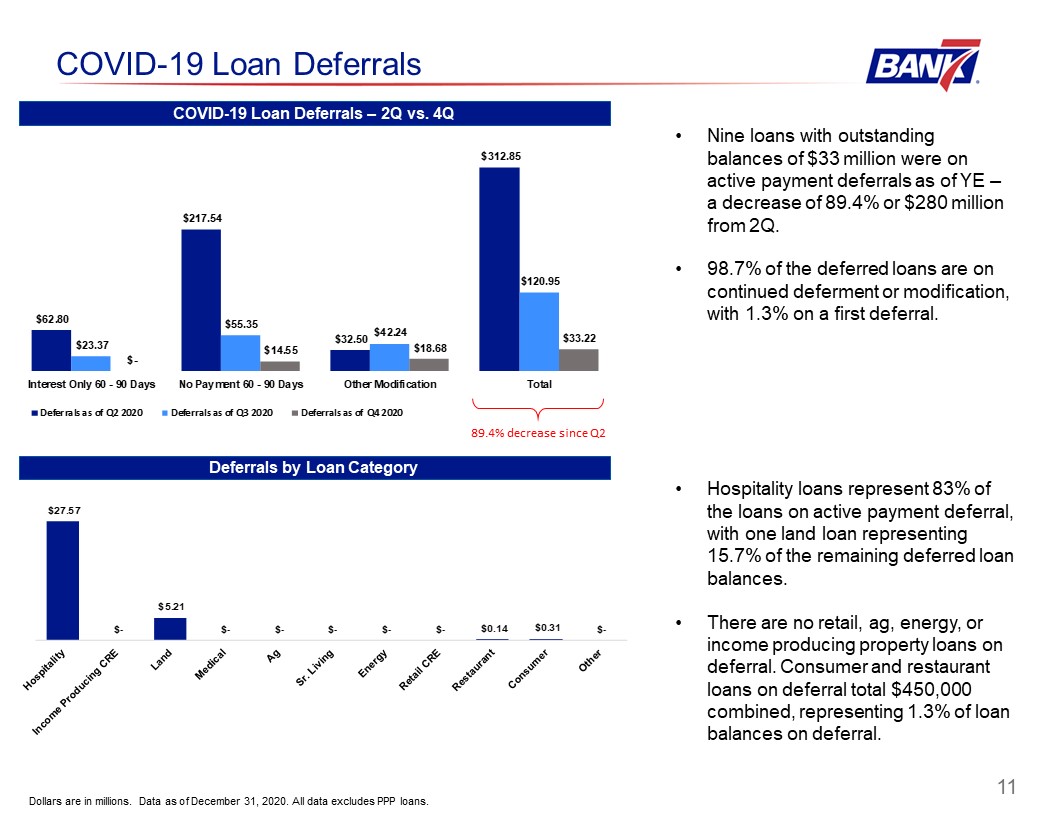
COVID-19 Loan Deferrals Dollars are in millions. Data as of December 31, 2020. All data excludes PPP
loans. COVID-19 Loan Deferrals – 2Q vs. 4Q 11 Nine loans with outstanding balances of $33 million were on active payment deferrals as of YE – a decrease of 89.4% or $280 million from 2Q. 98.7% of the deferred loans are on continued
deferment or modification, with 1.3% on a first deferral. Hospitality loans represent 83% of the loans on active payment deferral, with one land loan representing 15.7% of the remaining deferred loan balances. There are no retail, ag, energy,
or income producing property loans on deferral. Consumer and restaurant loans on deferral total $450,000 combined, representing 1.3% of loan balances on deferral. Deferrals by Loan Category 89.4% decrease since Q2
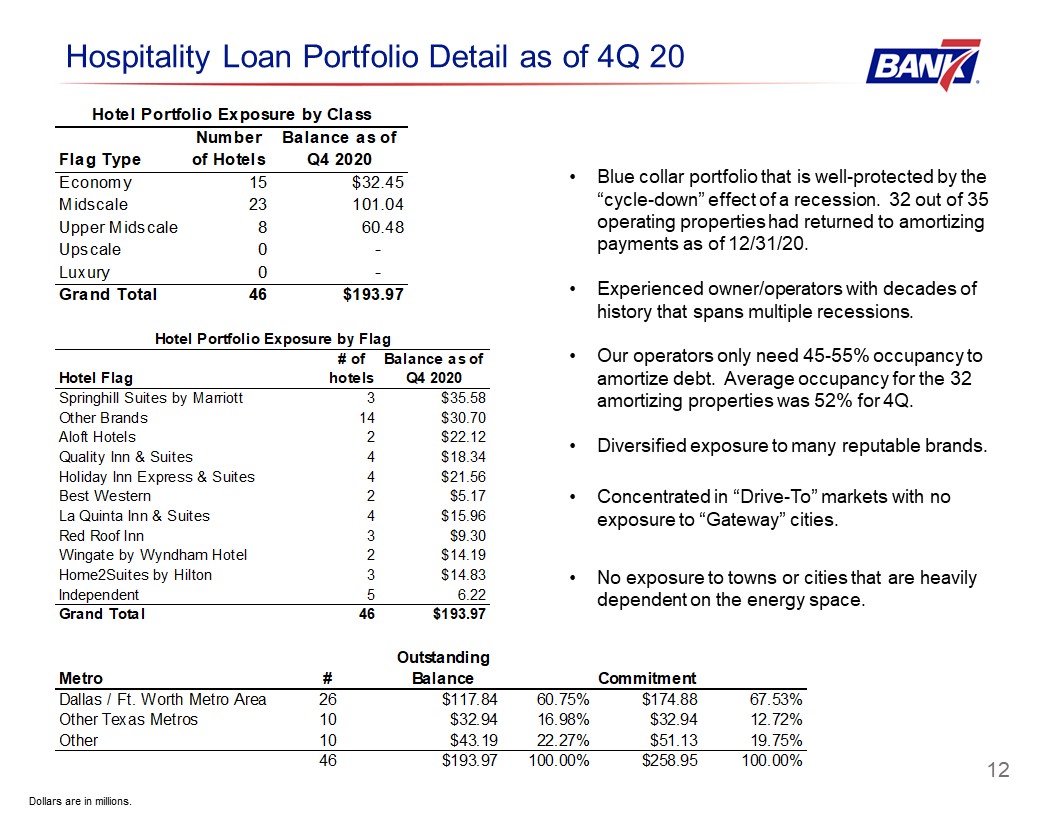
Hospitality Loan Portfolio Detail as of 4Q 20 12 Blue collar portfolio that is well-protected by the
“cycle-down” effect of a recession. 32 out of 35 operating properties had returned to amortizing payments as of 12/31/20. Experienced owner/operators with decades of history that spans multiple recessions. Our operators only need 45-55%
occupancy to amortize debt. Average occupancy for the 32 amortizing properties was 52% for 4Q. Diversified exposure to many reputable brands.Concentrated in “Drive-To” markets with no exposure to “Gateway” cities.No exposure to towns or
cities that are heavily dependent on the energy space. Dollars are in millions.
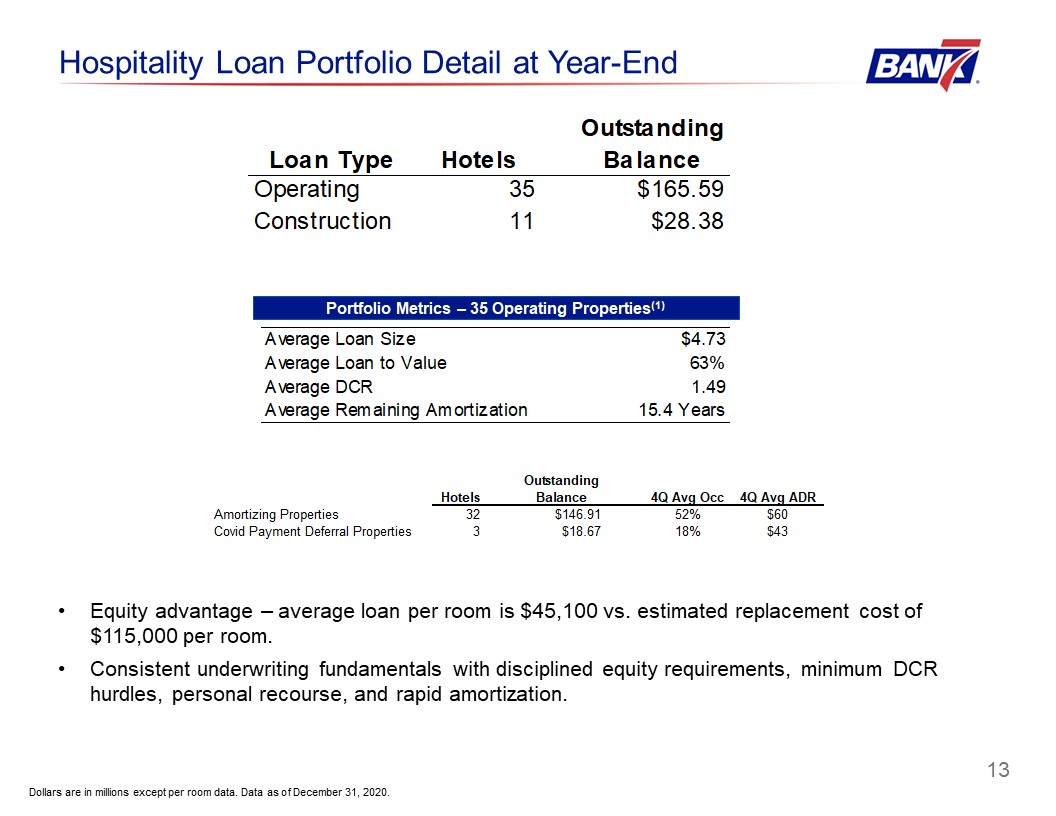
13 Hospitality Loan Portfolio Detail at Year-End Equity advantage – average loan per room is $45,100
vs. estimated replacement cost of $115,000 per room.Consistent underwriting fundamentals with disciplined equity requirements, minimum DCR hurdles, personal recourse, and rapid amortization. Portfolio Metrics – 35 Operating
Properties(1) Dollars are in millions except per room data. Data as of December 31, 2020.
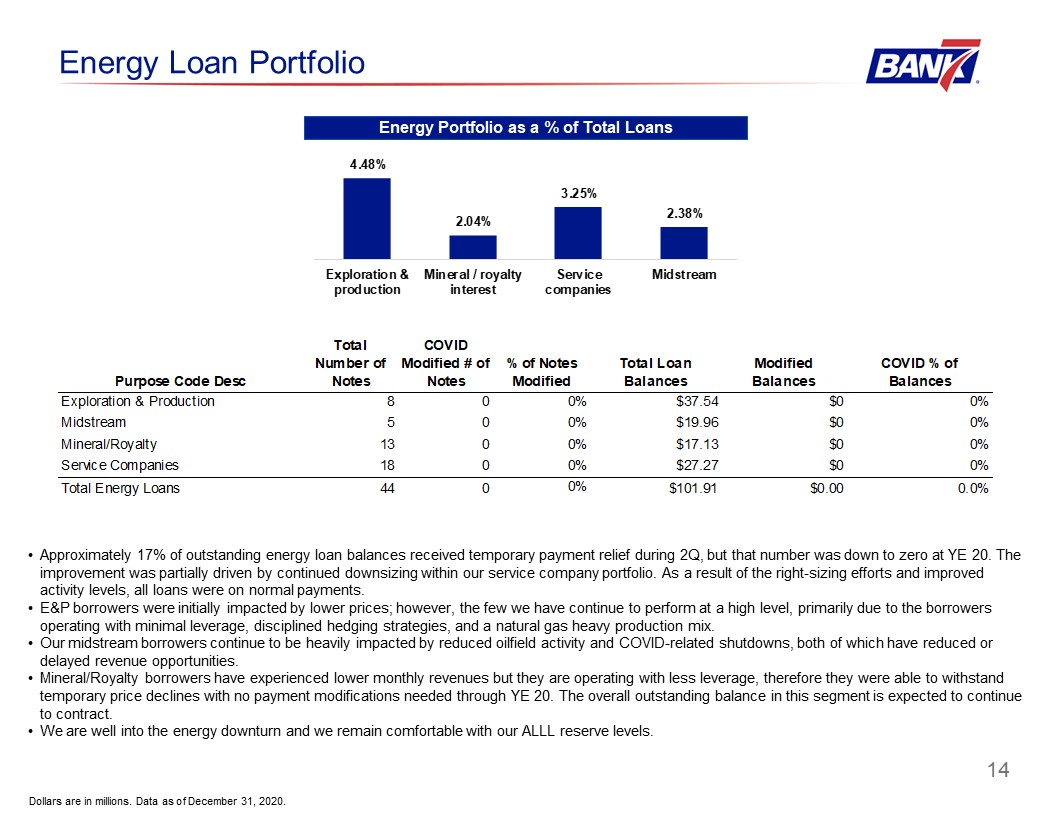
14 Dollars are in millions. Data as of December 31, 2020. Energy Loan Portfolio Energy Portfolio as
a % of Total Loans Approximately 17% of outstanding energy loan balances received temporary payment relief during 2Q, but that number was down to zero at YE 20. The improvement was partially driven by continued downsizing within our service
company portfolio. As a result of the right-sizing efforts and improved activity levels, all loans were on normal payments.E&P borrowers were initially impacted by lower prices; however, the few we have continue to perform at a high
level, primarily due to the borrowers operating with minimal leverage, disciplined hedging strategies, and a natural gas heavy production mix. Our midstream borrowers continue to be heavily impacted by reduced oilfield activity and
COVID-related shutdowns, both of which have reduced or delayed revenue opportunities. Mineral/Royalty borrowers have experienced lower monthly revenues but they are operating with less leverage, therefore they were able to withstand temporary
price declines with no payment modifications needed through YE 20. The overall outstanding balance in this segment is expected to continue to contract.We are well into the energy downturn and we remain comfortable with our ALLL reserve
levels.
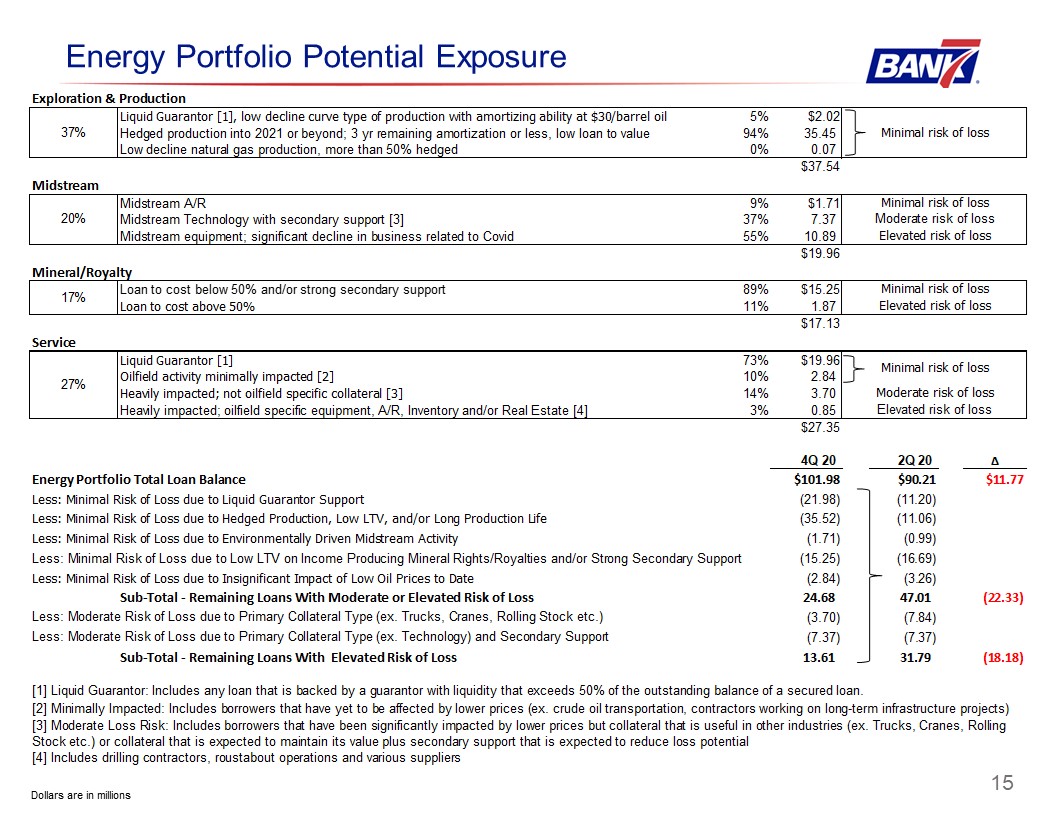
Dollars are in millions Energy Portfolio Potential Exposure 15
Appendix 16
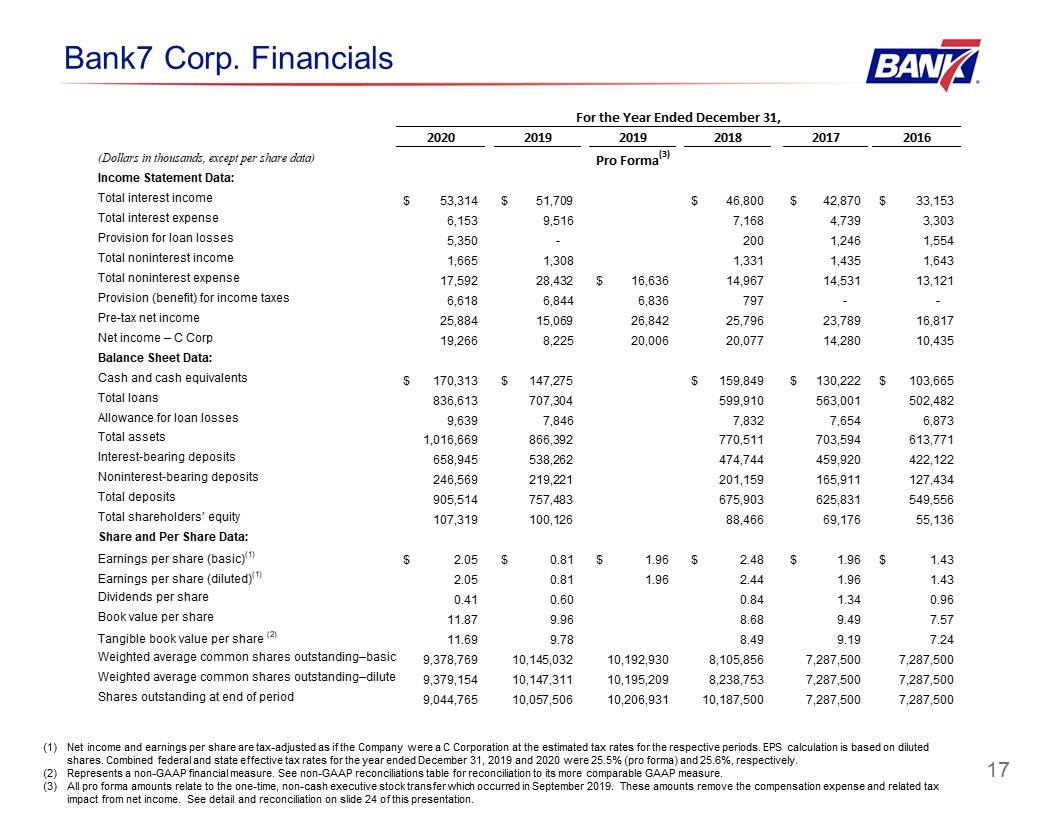
17 Bank7 Corp. Financials Net income and earnings per share are tax-adjusted as if the Company were a
C Corporation at the estimated tax rates for the respective periods. EPS calculation is based on diluted shares. Combined federal and state effective tax rates for the year ended December 31, 2019 and 2020 were 25.5% (pro forma) and 25.6%,
respectively. Represents a non-GAAP financial measure. See non-GAAP reconciliations table for reconciliation to its more comparable GAAP measure. All pro forma amounts relate to the one-time, non-cash executive stock transfer which occurred
in September 2019. These amounts remove the compensation expense and related tax impact from net income. See detail and reconciliation on slide 24 of this presentation.
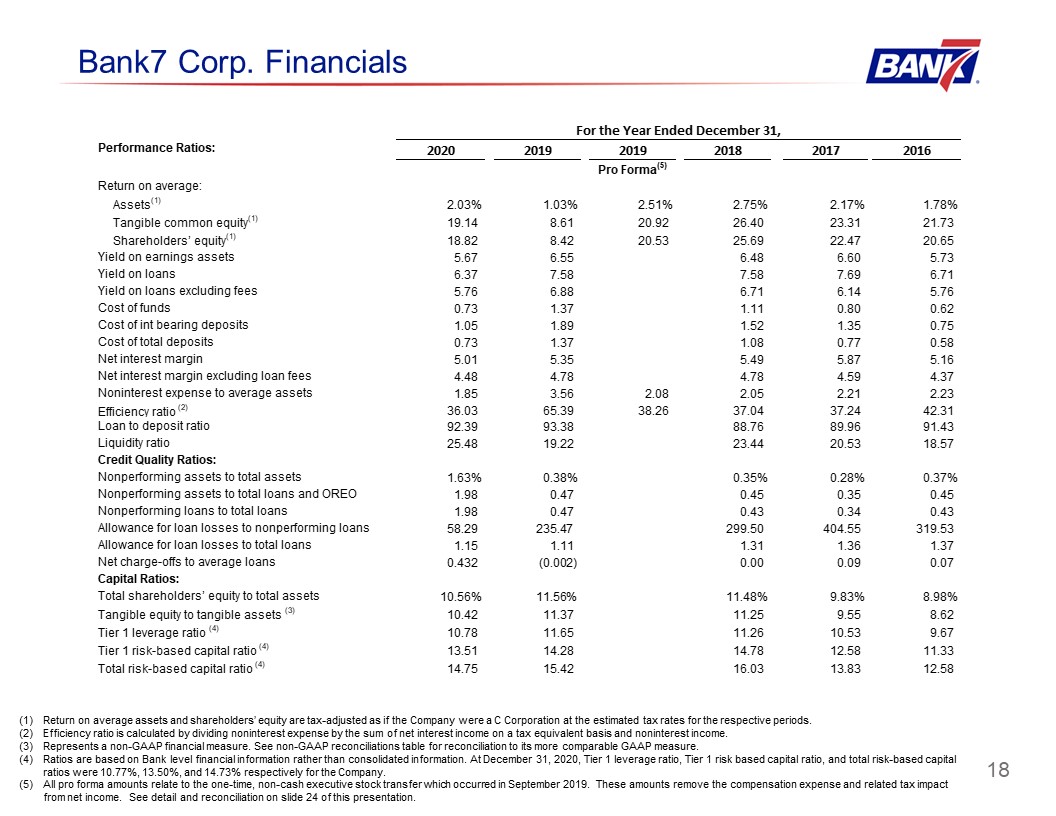
18 Bank7 Corp. Financials Return on average assets and shareholders’ equity are tax-adjusted as if
the Company were a C Corporation at the estimated tax rates for the respective periods.Efficiency ratio is calculated by dividing noninterest expense by the sum of net interest income on a tax equivalent basis and noninterest income.
Represents a non-GAAP financial measure. See non-GAAP reconciliations table for reconciliation to its more comparable GAAP measure. Ratios are based on Bank level financial information rather than consolidated information. At December 31,
2020, Tier 1 leverage ratio, Tier 1 risk based capital ratio, and total risk-based capital ratios were 10.77%, 13.50%, and 14.73% respectively for the Company.All pro forma amounts relate to the one-time, non-cash executive stock transfer
which occurred in September 2019. These amounts remove the compensation expense and related tax impact from net income. See detail and reconciliation on slide 24 of this presentation.
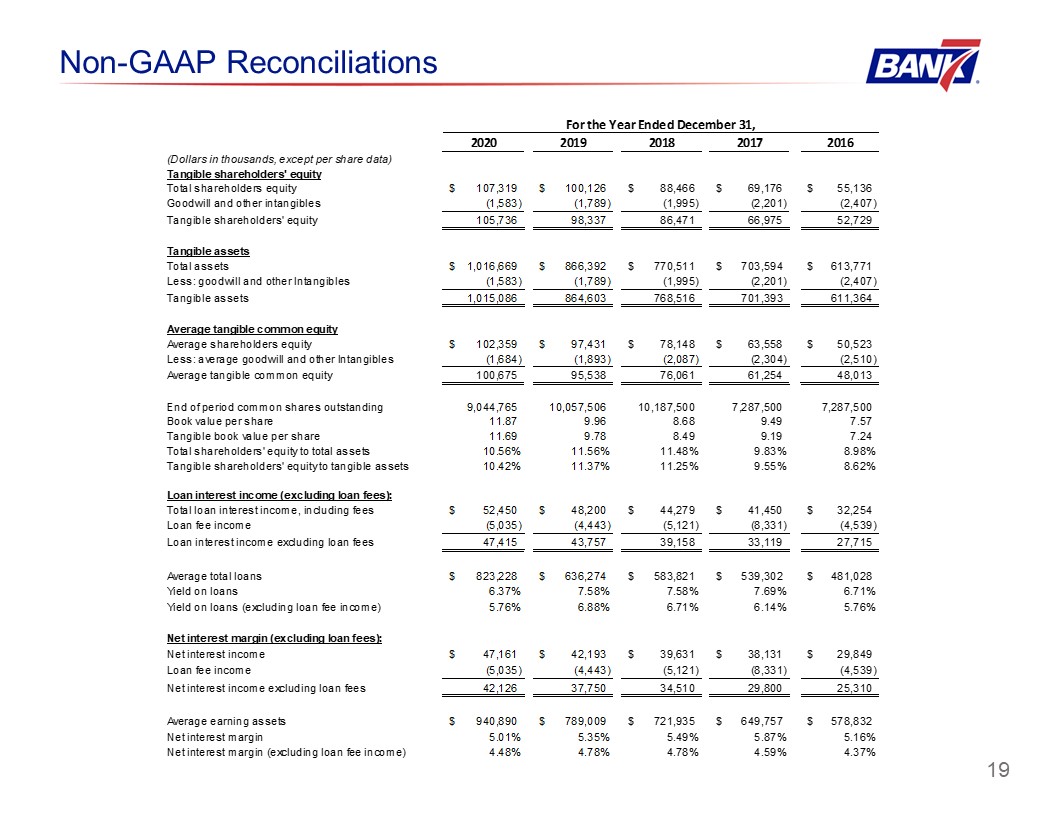
19 Non-GAAP Reconciliations
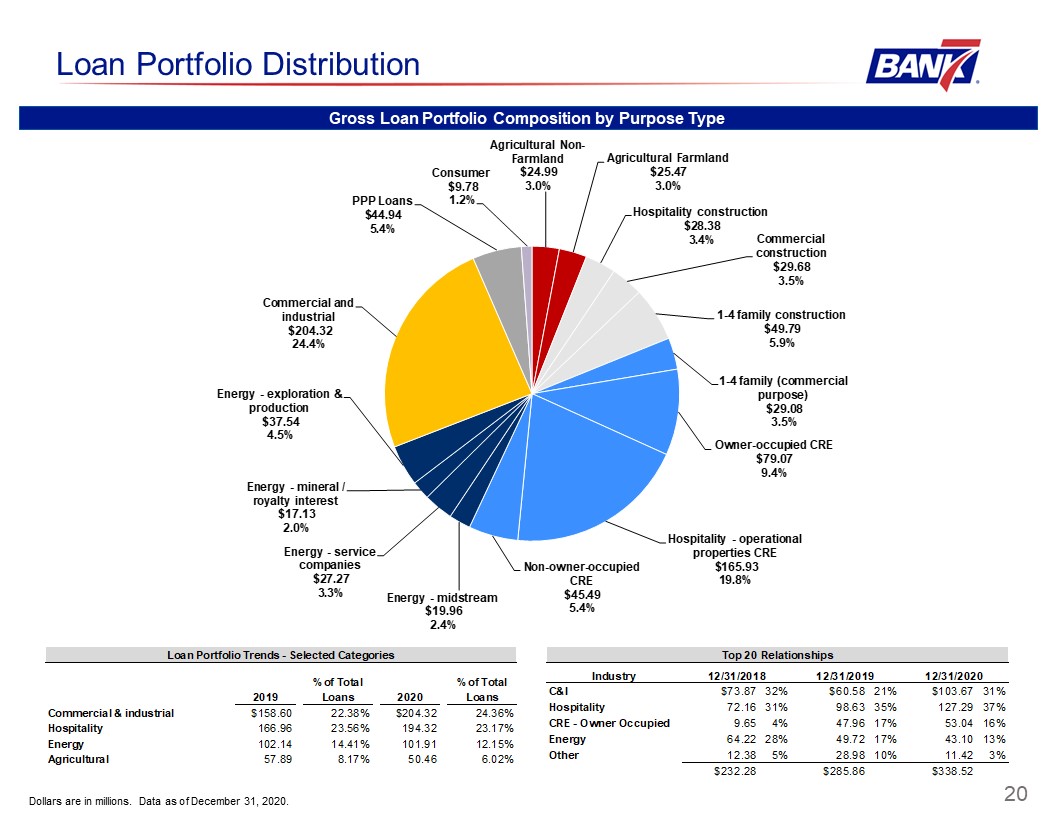
Loan Portfolio Distribution Dollars are in millions. Data as of December 31, 2020. Gross Loan
Portfolio Composition by Purpose Type 20
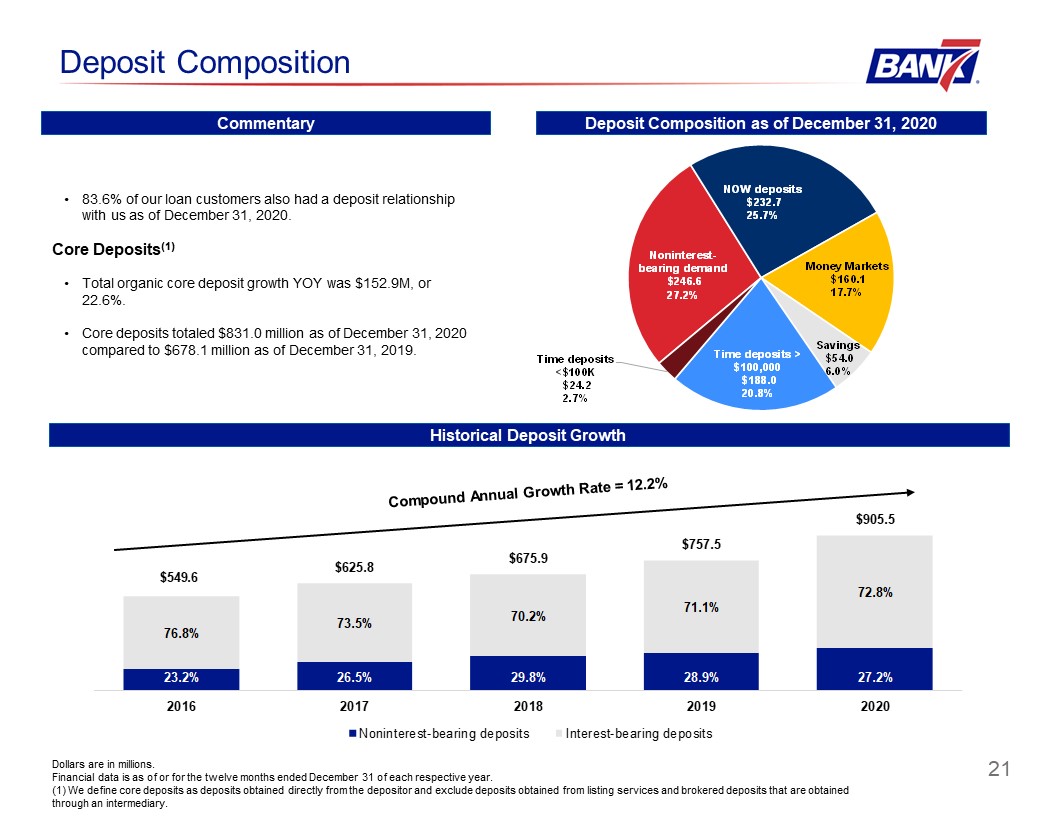
Deposit Composition Historical Deposit Growth Compound Annual Growth Rate = 12.2% Deposit
Composition as of December 31, 2020 83.6% of our loan customers also had a deposit relationship with us as of December 31, 2020.Core Deposits(1)Total organic core deposit growth YOY was $152.9M, or 22.6%. Core deposits totaled $831.0
million as of December 31, 2020 compared to $678.1 million as of December 31, 2019. Dollars are in millions.Financial data is as of or for the twelve months ended December 31 of each respective year.(1) We define core deposits as deposits
obtained directly from the depositor and exclude deposits obtained from listing services and brokered deposits that are obtained through an intermediary. 28.4% Commentary 21
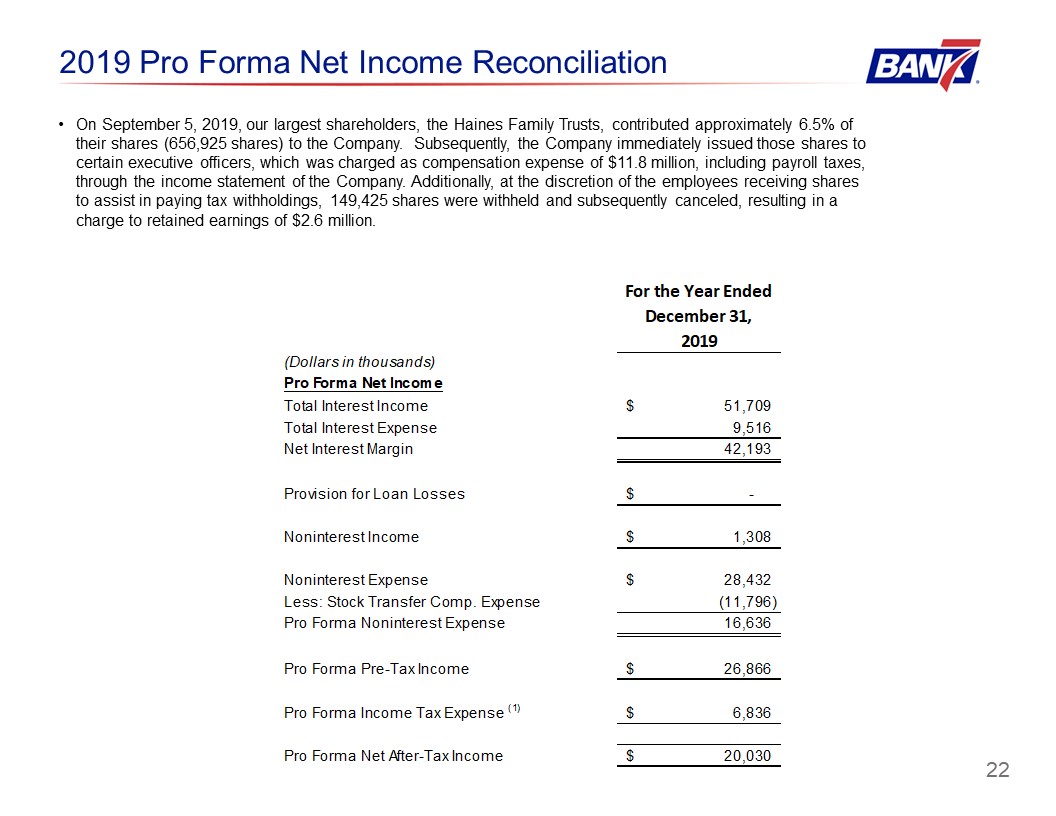
22 2019 Pro Forma Net Income Reconciliation On September 5, 2019, our largest shareholders, the
Haines Family Trusts, contributed approximately 6.5% of their shares (656,925 shares) to the Company. Subsequently, the Company immediately issued those shares to certain executive officers, which was charged as compensation expense of $11.8
million, including payroll taxes, through the income statement of the Company. Additionally, at the discretion of the employees receiving shares to assist in paying tax withholdings, 149,425 shares were withheld and subsequently canceled,
resulting in a charge to retained earnings of $2.6 million.
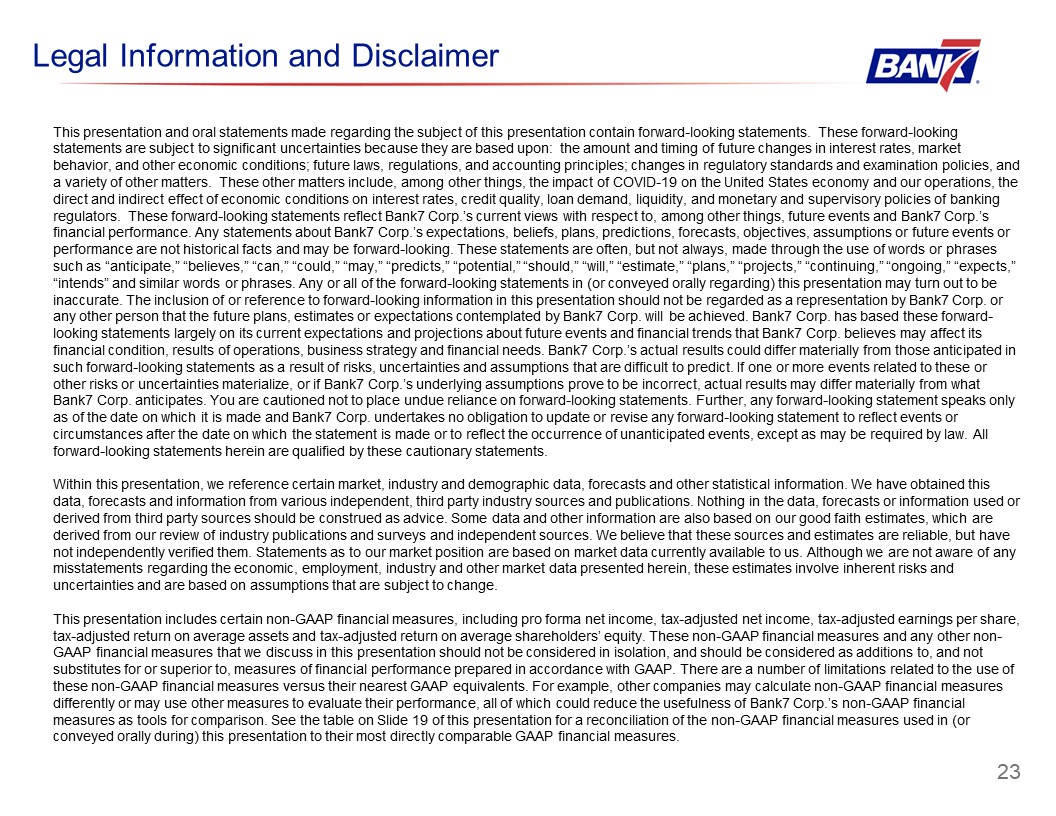
23 Legal Information and Disclaimer This presentation and oral statements made regarding the subject
of this presentation contain forward-looking statements. These forward-looking statements are subject to significant uncertainties because they are based upon: the amount and timing of future changes in interest rates, market behavior, and
other economic conditions; future laws, regulations, and accounting principles; changes in regulatory standards and examination policies, and a variety of other matters. These other matters include, among other things, the impact of COVID-19
on the United States economy and our operations, the direct and indirect effect of economic conditions on interest rates, credit quality, loan demand, liquidity, and monetary and supervisory policies of banking regulators. These
forward-looking statements reflect Bank7 Corp.’s current views with respect to, among other things, future events and Bank7 Corp.’s financial performance. Any statements about Bank7 Corp.’s expectations, beliefs, plans, predictions,
forecasts, objectives, assumptions or future events or performance are not historical facts and may be forward-looking. These statements are often, but not always, made through the use of words or phrases such as “anticipate,” “believes,”
“can,” “could,” “may,” “predicts,” “potential,” “should,” “will,” “estimate,” “plans,” “projects,” “continuing,” “ongoing,” “expects,” “intends” and similar words or phrases. Any or all of the forward-looking statements in (or conveyed orally
regarding) this presentation may turn out to be inaccurate. The inclusion of or reference to forward-looking information in this presentation should not be regarded as a representation by Bank7 Corp. or any other person that the future plans,
estimates or expectations contemplated by Bank7 Corp. will be achieved. Bank7 Corp. has based these forward-looking statements largely on its current expectations and projections about future events and financial trends that Bank7 Corp.
believes may affect its financial condition, results of operations, business strategy and financial needs. Bank7 Corp.’s actual results could differ materially from those anticipated in such forward-looking statements as a result of risks,
uncertainties and assumptions that are difficult to predict. If one or more events related to these or other risks or uncertainties materialize, or if Bank7 Corp.’s underlying assumptions prove to be incorrect, actual results may differ
materially from what Bank7 Corp. anticipates. You are cautioned not to place undue reliance on forward-looking statements. Further, any forward-looking statement speaks only as of the date on which it is made and Bank7 Corp. undertakes no
obligation to update or revise any forward-looking statement to reflect events or circumstances after the date on which the statement is made or to reflect the occurrence of unanticipated events, except as may be required by law. All
forward-looking statements herein are qualified by these cautionary statements. Within this presentation, we reference certain market, industry and demographic data, forecasts and other statistical information. We have obtained this data,
forecasts and information from various independent, third party industry sources and publications. Nothing in the data, forecasts or information used or derived from third party sources should be construed as advice. Some data and other
information are also based on our good faith estimates, which are derived from our review of industry publications and surveys and independent sources. We believe that these sources and estimates are reliable, but have not independently
verified them. Statements as to our market position are based on market data currently available to us. Although we are not aware of any misstatements regarding the economic, employment, industry and other market data presented herein, these
estimates involve inherent risks and uncertainties and are based on assumptions that are subject to change. This presentation includes certain non-GAAP financial measures, including pro forma net income, tax-adjusted net income, tax-adjusted
earnings per share, tax-adjusted return on average assets and tax-adjusted return on average shareholders’ equity. These non-GAAP financial measures and any other non-GAAP financial measures that we discuss in this presentation should not be
considered in isolation, and should be considered as additions to, and not substitutes for or superior to, measures of financial performance prepared in accordance with GAAP. There are a number of limitations related to the use of these
non-GAAP financial measures versus their nearest GAAP equivalents. For example, other companies may calculate non-GAAP financial measures differently or may use other measures to evaluate their performance, all of which could reduce the
usefulness of Bank7 Corp.’s non-GAAP financial measures as tools for comparison. See the table on Slide 19 of this presentation for a reconciliation of the non-GAAP financial measures used in (or conveyed orally during) this presentation to
their most directly comparable GAAP financial measures.