
CHH 8-K
Choice Hotels International Inc /De (CHH)
8-K
2025-02-20
For: 2025-02-20
View Original
Added on
April 06, 2026
UNITED STATES
SECURITIES AND EXCHANGE COMMISSION
WASHINGTON, D.C. 20549
_____________________________________________________
FORM 8-K
_____________________________________________________
CURRENT REPORT
PURSUANT TO SECTION 13 OR 15 (d)
OF THE SECURITIES EXCHANGE ACT OF 1934
Date of Report (Date of earliest event reported): February 20, 2025
_____________________________________________________
CHOICE HOTELS INTERNATIONAL, INC.
(Exact name of registrant as specified in its charter)
_____________________________________________________
| (State or other jurisdiction of incorporation) | (Commission File Number) | (IRS Employer Identification Number) | ||||||
| (Address of principal executive offices) | (Zip Code) | |||||||
Registrant’s telephone number, including area code (301 ) 592-5000
_____________________________________________________
Check the appropriate box below if the Form 8-K filing is intended to simultaneously satisfy the filing obligation of the registrant under any of the following provisions (see General Instruction A.2. below):
| Written communications pursuant to Rule 425 under the Securities Act (17 CFR 230.425) | |||||
| Soliciting material pursuant to Rule 14a-12 under the Exchange Act (17 CFR 240.14a-12) | |||||
| Pre-commencement communications pursuant to Rule 14d-2(b) under the Exchange Act (17 CFR 240.14d-2(b)) | |||||
| Pre-commencement communications pursuant to Rule 13e-4(c) under the Exchange Act (17 CFR 240.13e-4(c)) | |||||
Securities registered pursuant to Section 12(b) of the Act:
| Title of Each Class | Ticker Symbol(s) | Name of Each Exchange on Which Registered | ||||||||||||
| Indicate by check mark whether the registrant is an emerging growth company as defined in Rule 405 of the Securities Act of 1933 (§230.405 of this chapter) or Rule 12b-2 of the Securities Exchange Act of 1934 (§240.12b-2 of this chapter). | |||||
| Emerging growth company | |||||
If an emerging growth company, indicate by check mark if the registrant has elected not to use the extended transition period for complying with any new or revised financial accounting standards provided pursuant to Section 13(a) of the Exchange Act. ☐ | |||||
| Item 2.02. | Results of Operations and Financial Condition. | ||||
On February 20, 2025 , Choice Hotels International, Inc. issued a press release announcing earnings for the quarter and year ended December 31, 2024. A copy of the release is furnished herewith as Exhibit 99.1.
| Item 7.01. | Regulation FD Disclosure. | ||||
On February 20, 2025 , Choice Hotels International, Inc. (“Choice”) posted on its website (www.choicehotels.com) an investor presentation related to fourth quarter and full-year 2024 results. A copy of the investor presentation is attached hereto as Exhibit 99.2.
The investor presentation is being furnished under Item 7.01 and shall not be deemed “filed” for purposes of Section 18 of the Securities Exchange Act of 1934, as amended, or otherwise subject to the liability of such section.
| Item 9.01. | Financial Statements and Exhibits. | ||||
(d) Exhibits
Exhibit 104—Cover Page Interactive Data File (embedded within the Inline XBRL document)
SIGNATURES
Pursuant to the requirements of the Securities Exchange Act of 1934, the registrant has duly caused this report to be signed on its behalf by the undersigned hereunto duly authorized.
| Date: | /s/ Scott E. Oaksmith | |||||||||||||||||||
| Scott E. Oaksmith | ||||||||||||||||||||
| Chief Financial Officer | ||||||||||||||||||||

CHOICE HOTELS INTERNATIONAL REPORTS FOURTH QUARTER AND
FULL-YEAR 2024 RESULTS
Exceeds Top End of Earnings Guidance
Grows Global Net Rooms System Size by 3.3%, Including 4.3% Growth for More Revenue-Intense Domestic Portfolio
NORTH BETHESDA, Md., February 20, 2025 – Choice Hotels International, Inc. (NYSE: CHH), a leading global lodging franchisor, today reported its fourth quarter and full-year 2024 results.
Highlights include:
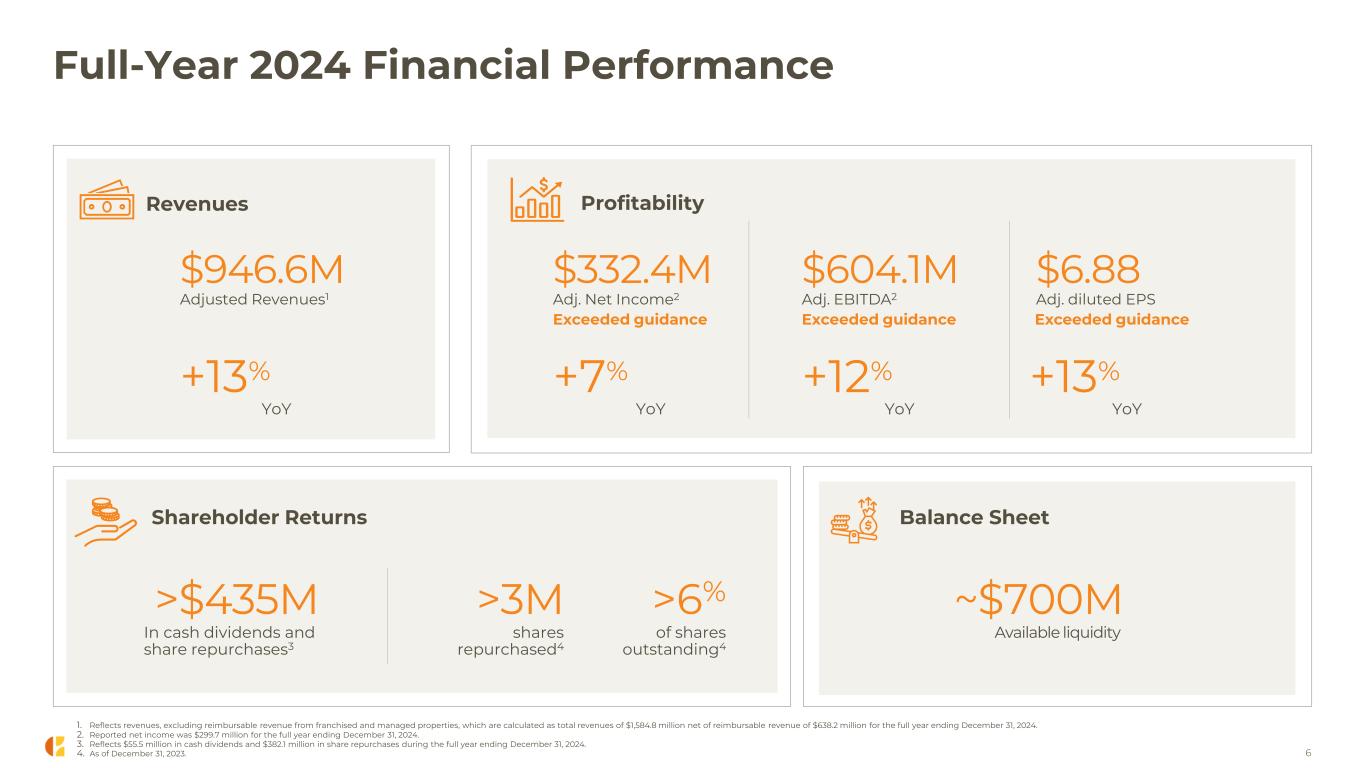
•Net income increased 16% to $299.7 million for full-year 2024, representing diluted earnings per share (EPS) of $6.20, a 22% increase compared to 2023, both of which exceeded the top end of the company’s full-year 2024 guidance.
•Adjusted earnings before interest, taxes, depreciation, and amortization (EBITDA) for full-year 2024 increased 12% to a company record of $604.1 million and exceeded the top end of the company’s full-year 2024 guidance.
•Adjusted diluted EPS increased 13% to $6.88 for full-year 2024, compared to 2023, exceeding the top end of the company’s full-year 2024 guidance.
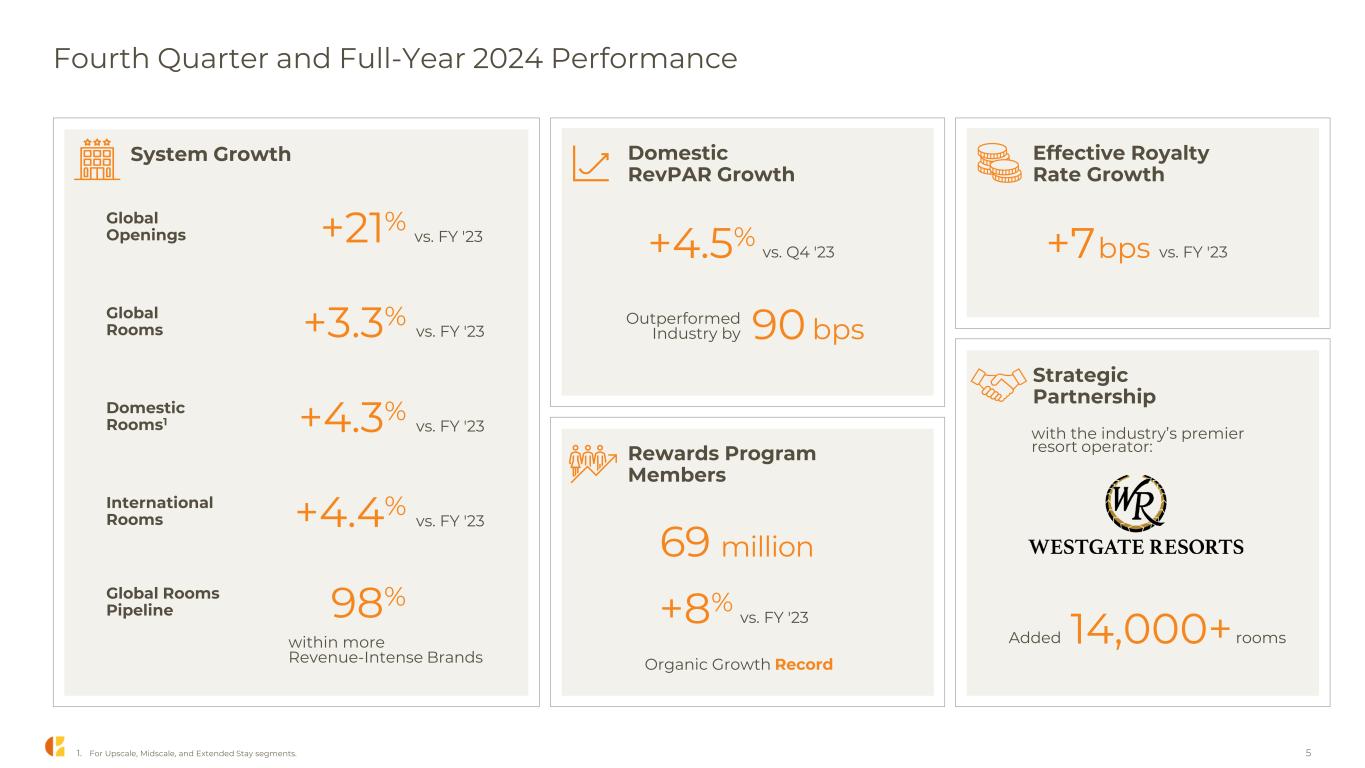
•Increased net global rooms system size by 3.3%, including 4.3% growth for domestic upscale, extended stay, and midscale rooms portfolio, compared to December 31, 2023.
•Opened 407 hotels globally, a 21% increase for full-year 2024, compared to 2023, which included opening the 515th extended-stay hotel domestically in the fourth quarter.
•Entered into a strategic partnership with Westgate Resorts, the industry’s premier resort operator, which added 21 hotels and 14,471 rooms to our domestic portfolio in fourth quarter 2024, expanding Choice Privileges rewards program members’ access to over 180,000 upscale, upper-upscale, and luxury rooms worldwide.
•Increased domestic revenue per available room (RevPAR) by 4.5% for the three-month period ended December 31, 2024, compared to the same period of 2023, outperforming the industry and the respective chain scales in which the company competes by 90 basis points and 30 basis points, respectively.
•Repurchased 3.1 million shares of common stock for $382.1 million during full-year 2024, representing 6% of the company’s market capitalization at the beginning of 2024.
•Full-year 2025 net income is expected to range between $288 to $300 million; full-year 2025 adjusted EBITDA is expected to range between $625 and $640 million.
“Choice Hotels generated another year of strong results in 2024, exceeding the top end of our earnings guidance and delivering a 4.3% year-over-year net increase in our more revenue-intense domestic rooms portfolio, a testament to the success of our growth strategy,” said Patrick Pacious, President and Chief Executive Officer. “In 2024, we also successfully relaunched four brands, substantially expanded our partnerships business, significantly increased our international footprint, achieved record organic rewards program growth, and unlocked new value through additional ancillary revenue opportunities. As we enter 2025, we will continue to realize the earnings growth from our past investments, meaningfully expand the scale of our business, and accelerate our growth in the coming years.”
Financial Performance
($ in millions, except per share amounts) | Three months ended December 31 | Twelve months ended December 31 | |||||||||||||||
2024 | 2023 | 2024 | 2023 | ||||||||||||||
Total Revenues | $390 | $358 | $1,585 | $1,544 | |||||||||||||
Revenues Excluding Reimbursable Revenue from Franchised and Managed Properties1 | $229 | $213 | $947 | $835 | |||||||||||||
Net Income | $76 | $29 | $300 | $259 | |||||||||||||
Adjusted Net Income | $74 | $72 | $332 | $312 | |||||||||||||
Diluted Earnings per Share | $1.59 | $0.58 | $6.20 | $5.07 | |||||||||||||
Adjusted Diluted Earnings per Share | $1.55 | $1.44 | $6.88 | $6.11 | |||||||||||||
Adjusted EBITDA | $140 | $125 | $604 | $540 | |||||||||||||
•Platform and procurement services fees increased 5% to $17.7 million for fourth quarter 2024, compared to the same period of 2023.
•Domestic average daily rate (ADR) grew by 3.1% and occupancy levels increased by 80 basis points for fourth quarter 2024, compared to the same period of 2023. The domestic extended stay segment achieved RevPAR growth of 5.9% for the fourth quarter, compared to the same period of 2023.
•The domestic effective royalty rate increased 7 basis points to 5.06% and 6 basis points to 5.09% for full-year and fourth quarter 2024, respectively, compared to the same periods of 2023.
1 Calculated as total revenues net of reimbursable revenues. Reimbursable revenues were $161 million, $146 million, $638 million and $709 million for fourth quarter 2024, fourth quarter 2023, full-year 2024 and full-year 2023, respectively.
System Size and Development
Rooms | |||||||||||
December 31, 2024 | December 31, 2023 | Change | |||||||||
Domestic | 511,739 | 496,965 | 3.0% | ||||||||
Domestic Upscale, Extended Stay and Midscale | 449,263 | 430,851 | 4.3% | ||||||||
International | 142,071 | 136,021 | 4.4% | ||||||||
Global | 653,810 | 632,986 | 3.3% | ||||||||
•Domestic net rooms portfolio grew by 3.0% from year-end 2023. Domestic net unit growth accelerated from September 30, 2024 and domestic upscale, extended stay, and midscale units grew by 1.5% from year-end 2023.
•Domestic extended stay net rooms portfolio grew by 9.8% from year-end 2023, and its pipeline reached nearly 43,000 rooms. Global upscale net rooms portfolio grew by 43.9% from year-end 2023, and its pipeline reached nearly 25,000 rooms.
•International net rooms portfolio grew by 4.4% from year-end 2023, highlighted by a 58% increase in international hotel openings in fourth quarter 2024.
•Global pipeline as of December 31, 2024, was over 97,000 rooms, of which nearly 83,000 rooms were domestic.
Balance Sheet and Liquidity
As of December 31, 2024, the company had a total available liquidity of $699.5 million, including available borrowing capacity and cash and equivalents. The company’s net debt leverage ratio was 2.9 times as of December 31, 2024.
During full-year 2024, the company generated cash flows from operating activities of $319.4 million, an 8% increase compared to 2023.
Shareholder Returns
During full-year 2024, the company paid cash dividends totaling $55.5 million and repurchased 3.1 million shares of common stock for $382.1 million under its stock repurchase program and through repurchases from employees in connection with tax withholding and option exercises relating to awards under the company’s equity incentive plans.
As of December 31, 2024, the company had 3.8 million shares of common stock remaining under the current share repurchase authorization.
Outlook
The outlook information below includes forward-looking non-GAAP financial measures, which management uses in forecasting performance. The adjusted numbers in the company’s outlook below exclude the net surplus or deficit generated from reimbursable revenue from franchised and managed properties, additional repurchases of company stock, and other items:
Full-Year 2025 | |||||
Net Income | $288 – $300 million | ||||
Adjusted Net Income | $333 – $345 million | ||||
Adjusted EBITDA | $625 – $640 million | ||||
Diluted EPS | $6.04 – $6.29 | ||||
Adjusted Diluted EPS | $6.98 – $7.24 | ||||
Effective Income Tax Rate | 25% | ||||
Full-Year 2025 vs. Full-Year 2024 | |||||
Domestic RevPAR Growth | 1% to 2% | ||||
Domestic Effective Royalty Rate Growth | Mid-single digits | ||||
Global Net System Rooms Growth | Approximately 1% | ||||
Webcast and Conference Call
Choice Hotels International will conduct a live webcast to discuss the company’s fourth quarter and full-year 2024 earnings results on February 20, 2025, at 8:30 a.m. on the company’s investor relations website, www.investor.choicehotels.com, accessible via the Events and Presentations tab.
A conference call will also be available. Participants may listen to the call by dialing (800) 549-8228 domestically or (646) 564-2877 internationally using conference ID 13131.
A replay and transcript of the event will be available on the company’s investor relations website within 24 hours at www.investor.choicehotels.com/events-and-presentations.
About Choice Hotels®
Choice Hotels International, Inc. (NYSE: CHH) is one of the largest lodging franchisors in the world, with over 7,500 hotels, representing over 650,000 rooms, in 46 countries and territories as of December 31, 2024. A diverse portfolio of 22 brands that range from full-service upper upscale properties to midscale, extended stay, and economy enables Choice® to meet travelers’ needs in more places and for more occasions while driving more value for franchise owners and shareholders. The award-winning Choice Privileges® rewards program and co-brand credit card options provide members with a fast and easy way to earn reward nights and personalized perks. For more information, visit www.choicehotels.com.
Forward-Looking Statements
Information set forth herein includes “forward-looking statements.” Certain, but not necessarily all, of such forward-looking statements can be identified by the use of forward-looking terminology, such as “expect,” “estimate,” “believe,” “anticipate,” “should,” “will,” “forecast,” “plan,” “project,” “assume,” or similar words of futurity. All statements other than historical facts are forward-looking statements. These forward-looking statements are based on management’s current beliefs, assumptions, and expectations regarding future events, which in turn are based on information currently available to management. Such statements may relate to projections of Choice’s revenue, expenses, EBITDA, adjusted EBITDA, earnings, debt levels, ability to repay outstanding indebtedness, payment of dividends, repurchases of common stock and other financial and operational measures, including occupancy and open hotels, RevPAR, and Choice’s liquidity, among other matters. We caution you not to place undue reliance on any such forward-looking statements. Forward-looking statements do
not guarantee future performance and involve known and unknown risks, uncertainties, and other factors.
Several factors could cause actual results, performance or achievements of the company to differ materially from those expressed in or contemplated by the forward-looking statements. Such risks include, but are not limited to, changes to general, domestic and foreign economic conditions, including access to liquidity and capital; changes in consumer demand and confidence, including consumer discretionary spending and the demand for travel, transient and group business; the timing and amount of future dividends and share repurchases; future domestic or global outbreaks of epidemics, pandemics or contagious diseases or fear of such outbreaks, and the related impact on the global hospitality industry, particularly but not exclusively the U.S. travel market; changes in law and regulation applicable to the travel, lodging or franchising industries, including with respect to the status of the company’s relationship with employees of our franchisees; foreign currency fluctuations; impairments or declines in the value of the company’s assets; operating risks common in the travel, lodging or franchising industries; changes to the desirability of our brands as viewed by hotel operators and customers; changes to the terms or termination of our contracts with franchisees and our relationships with our franchisees; our ability to keep pace with improvements in technology utilized for marketing and reservation systems and other operating systems; our ability to grow our franchise system; exposure to risks related to our hotel development, financing, franchise agreement acquisition costs and ownership activities; exposures to risks associated with our investments in new businesses; fluctuations in the supply and demand for hotel rooms; our ability to realize anticipated benefits from acquired businesses; impairments or losses relating to acquired businesses; the level of acceptance of alternative growth strategies we may implement; the impact of inflation; cyber security and data breach risks; climate change and sustainability related concerns; ownership and financing activities; hotel closures or financial difficulties of our franchisees; operating risks associated with our international operations; labor shortages; the outcome of litigation; and our ability to effectively manage our indebtedness and secure our indebtedness. These and other risk factors are discussed in detail in the company’s filings with the U.S. Securities and Exchange Commission, including our Annual Report on Form 10-K. We undertake no obligation to publicly update or revise any forward-looking statement, whether as a result of new information, future events or otherwise, except as required by law.
Non-GAAP Financial Measurements and Other Definitions
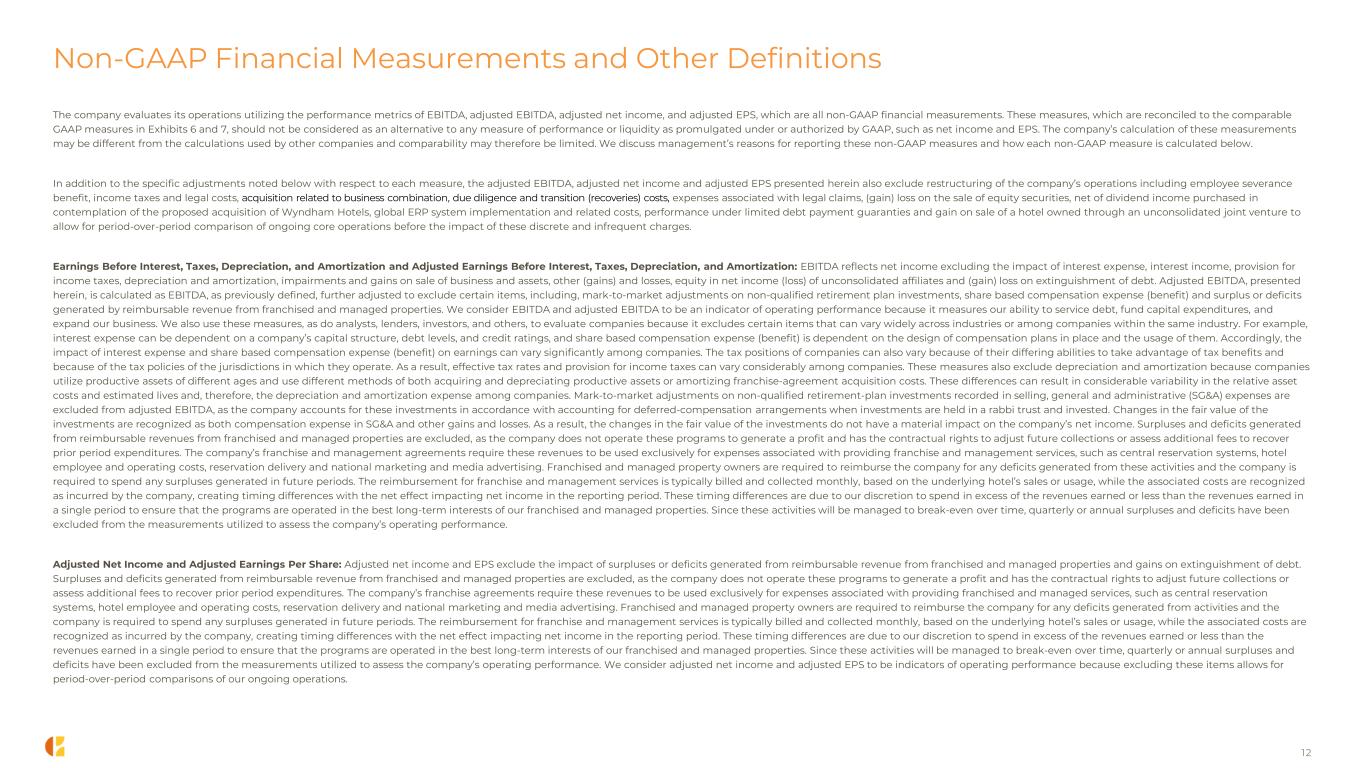
The company evaluates its operations utilizing the performance metrics of EBITDA, adjusted EBITDA, adjusted net income, and adjusted EPS, which are all non-GAAP financial measurements. These measures, which are reconciled to the comparable GAAP measures in Exhibits 6 and 7, should not be considered as an alternative to any measure of performance or liquidity as promulgated under or authorized by GAAP, such as net income and EPS. The company’s calculation of these measurements may be different from the calculations used by other companies and comparability may therefore be limited. We discuss management’s reasons for reporting these non-GAAP measures and how each non-GAAP measure is calculated below.
In addition to the specific adjustments noted below with respect to each measure, the adjusted EBITDA, adjusted net income and adjusted EPS presented herein also exclude restructuring of the company’s operations including employee severance benefit, income taxes and legal costs, acquisition related to business combination, due diligence and transition (recoveries) costs, expenses associated with legal claims, (gain) loss on the sale of equity securities, net of dividend income purchased in contemplation of the proposed acquisition of Wyndham Hotels, global ERP system implementation and related costs, performance under limited debt payment guaranties and
gain on sale of a hotel owned through an unconsolidated joint venture to allow for period-over-period comparison of ongoing core operations before the impact of these discrete and infrequent charges.
Earnings Before Interest, Taxes, Depreciation, and Amortization and Adjusted Earnings Before Interest, Taxes, Depreciation, and Amortization: EBITDA reflects net income excluding the impact of interest expense, interest income, provision for income taxes, depreciation and amortization, impairments and gains on sale of business and assets, other (gains) and losses, equity in net income (loss) of unconsolidated affiliates and (gain) loss on extinguishment of debt. Adjusted EBITDA, presented herein, is calculated as EBITDA, as previously defined, further adjusted to exclude certain items, including, mark-to-market adjustments on non-qualified retirement plan investments, share based compensation expense (benefit) and surplus or deficits generated by reimbursable revenue from franchised and managed properties. We consider EBITDA and adjusted EBITDA to be an indicator of operating performance because it measures our ability to service debt, fund capital expenditures, and expand our business. We also use these measures, as do analysts, lenders, investors, and others, to evaluate companies because it excludes certain items that can vary widely across industries or among companies within the same industry. For example, interest expense can be dependent on a company’s capital structure, debt levels, and credit ratings, and share based compensation expense (benefit) is dependent on the design of compensation plans in place and the usage of them. Accordingly, the impact of interest expense and share based compensation expense (benefit) on earnings can vary significantly among companies. The tax positions of companies can also vary because of their differing abilities to take advantage of tax benefits and because of the tax policies of the jurisdictions in which they operate. As a result, effective tax rates and provision for income taxes can vary considerably among companies. These measures also exclude depreciation and amortization because companies utilize productive assets of different ages and use different methods of both acquiring and depreciating productive assets or amortizing franchise-agreement acquisition costs. These differences can result in considerable variability in the relative asset costs and estimated lives and, therefore, the depreciation and amortization expense among companies. Mark-to-market adjustments on non-qualified retirement-plan investments recorded in selling, general and administrative (SG&A) expenses are excluded from adjusted EBITDA, as the company accounts for these investments in accordance with accounting for deferred-compensation arrangements when investments are held in a rabbi trust and invested. Changes in the fair value of the investments are recognized as both compensation expense in SG&A and other gains and losses. As a result, the changes in the fair value of the investments do not have a material impact on the company’s net income. Surpluses and deficits generated from reimbursable revenues from franchised and managed properties are excluded, as the company does not operate these programs to generate a profit and has the contractual rights to adjust future collections or assess additional fees to recover prior period expenditures. The company’s franchise and management agreements require these revenues to be used exclusively for expenses associated with providing franchise and management services, such as central reservation systems, hotel employee and operating costs, reservation delivery and national marketing and media advertising. Franchised and managed property owners are required to reimburse the company for any deficits generated from these activities and the company is required to spend any surpluses generated in future periods. The reimbursement for franchise and management services is typically billed and collected monthly, based on the underlying hotel’s sales or usage, while the associated costs are recognized as incurred by the company, creating timing differences with the net effect impacting net income in the reporting period. These timing differences are due to our discretion to spend in excess of the revenues earned or less than the revenues earned in a single period to ensure that the programs are operated in the best long-term interests of our franchised and managed properties. Since these activities will be managed to break-even over time, quarterly or annual surpluses and deficits have been excluded from the measurements utilized to assess the company’s operating performance.
Adjusted Net Income and Adjusted Earnings Per Share: Adjusted net income and EPS exclude the impact of surpluses or deficits generated from reimbursable revenue from franchised and managed properties and gains on extinguishment of debt. Surpluses and deficits generated from reimbursable revenue from franchised and managed properties are excluded, as the company does not operate these programs to generate a profit and has the contractual rights to adjust future collections or assess additional fees to recover prior period expenditures. The company’s franchise agreements require these revenues to be used exclusively for expenses associated with providing franchised and managed services, such as central reservation systems, hotel employee and operating costs, reservation delivery and national marketing and media advertising. Franchised and managed property owners are required to reimburse the company for any deficits generated from activities and the company is required to spend any surpluses generated in future periods. The reimbursement for franchise and management services is typically billed and collected monthly, based on the underlying hotel’s sales or usage, while the associated costs are recognized as incurred by the company, creating timing differences with the net effect impacting net income in the reporting period. These timing differences are due to our discretion to spend in excess of the revenues earned or less than the revenues earned in a single period to ensure that the programs are operated in the best long-term interests of our franchised and managed properties. Since these activities will be managed to break-even over time, quarterly or annual surpluses and deficits have been excluded from the measurements utilized to assess the company’s operating performance. We consider adjusted net income and adjusted EPS to be indicators of operating performance because excluding these items allows for period-over-period comparisons of our ongoing operations.
Occupancy: Occupancy represents the total number of room nights sold divided by the total number of room nights available at a hotel for a given period. Occupancy measures the utilization of the hotels’ available capacity. Management uses occupancy to gauge demand at a specific hotel or group of hotels in a given period. The company calculates occupancy based on information as reported by its franchisees. To accurately reflect occupancy, the company may revise its prior years’ operating statistics for the most current information provided.
Average Daily Rate (ADR): ADR represents hotel room revenue divided by the total number of room nights sold for a given period. ADR measures the average room price attained by a hotel and ADR trends provide useful information concerning the pricing environment and the nature of the customer base of a hotel or group of hotels. ADR is a commonly used performance measure in the industry, and management uses ADR to assess pricing levels that the company is able to generate. The company calculates ADR based on information as reported by its franchisees. To accurately reflect ADR, the company may revise its prior years’ operating statistics for the most current information provided.
Revenue Per Available Room (RevPAR): RevPAR is calculated by dividing hotel room revenue by the total number of room nights available to guests for a given period. Management considers RevPAR to be a meaningful indicator of hotel performance and therefore company royalty and system revenues as it provides a metric correlated to the two key drivers of operations at a hotel: occupancy and ADR. The company calculates RevPAR based on information as reported by its franchisees. To accurately reflect RevPAR, the company may revise its prior years’ operating statistics for the most current information provided. RevPAR is also a useful indicator in measuring performance over comparable periods.
Pipeline: Pipeline is defined as hotels awaiting conversion, under construction or approved for development, and master development agreements committing owners to future franchise development.
Contacts
Allie Summers, Senior Director, Investor Relations
© 2025 Choice Hotels International, Inc. All rights reserved.
| Exhibit 1 | ||||||||||||||||||||||||||
| Choice Hotels International, Inc. | ||||||||||||||||||||||||||
| Condensed Consolidated Statements of Income | ||||||||||||||||||||||||||
| (Unaudited) | ||||||||||||||||||||||||||
| (In thousands, except per share amounts) | Three Months Ended December 31, | Year Ended December 31, | ||||||||||||||||||||||||
| 2024 | 2023 | 2024 | 2023 | |||||||||||||||||||||||
| REVENUES | ||||||||||||||||||||||||||
| Royalty, licensing and management fees | $ | 120,138 | $ | 116,909 | $ | 514,569 | $ | 513,412 | ||||||||||||||||||
| Initial franchise fees | 6,473 | 6,547 | 25,606 | 27,787 | ||||||||||||||||||||||
| Platform and procurement services | 17,692 | 16,928 | 75,752 | 75,114 | ||||||||||||||||||||||
| Owned hotels | 28,114 | 23,566 | 113,459 | 97,641 | ||||||||||||||||||||||
| Other | 16,552 | 12,840 | 61,803 | 46,051 | ||||||||||||||||||||||
| Other revenues from franchised & managed properties | 200,801 | 181,606 | 793,650 | 784,160 | ||||||||||||||||||||||
| Total revenues | 389,770 | 358,396 | 1,584,839 | 1,544,165 | ||||||||||||||||||||||
| OPERATING EXPENSES | ||||||||||||||||||||||||||
| Selling, general and administrative | 57,181 | 64,694 | 219,878 | 216,081 | ||||||||||||||||||||||
| Business combination, diligence and transition (recoveries) costs | (490) | 25,165 | 17,233 | 55,778 | ||||||||||||||||||||||
| Depreciation and amortization | 10,659 | 10,191 | 43,282 | 39,659 | ||||||||||||||||||||||
| Owned hotels | 20,778 | 17,550 | 83,148 | 71,474 | ||||||||||||||||||||||
| Other expenses from franchised & managed properties | 182,423 | 199,314 | 757,525 | 782,409 | ||||||||||||||||||||||
| Total operating expenses | 270,551 | 316,914 | 1,121,066 | 1,165,401 | ||||||||||||||||||||||
| Impairment of long-lived assets | — | (3,736) | — | (3,736) | ||||||||||||||||||||||
| Operating income | 119,219 | 37,746 | 463,773 | 375,028 | ||||||||||||||||||||||
| OTHER INCOME AND EXPENSES, NET | ||||||||||||||||||||||||||
| Interest expense | 21,067 | 17,258 | 87,131 | 63,780 | ||||||||||||||||||||||
| Interest income | (2,089) | (1,928) | (8,646) | (7,764) | ||||||||||||||||||||||
| (Gain) loss on extinguishment of debt | — | (4,416) | 331 | (4,416) | ||||||||||||||||||||||
| Other loss (gain) | 1,774 | (7,897) | 1,641 | (10,649) | ||||||||||||||||||||||
| Equity in net gain of affiliates | (3,241) | (956) | (12,329) | (2,879) | ||||||||||||||||||||||
| Total other income and expenses, net | 17,511 | 2,061 | 68,128 | 38,072 | ||||||||||||||||||||||
| Income before income taxes | 101,708 | 35,685 | 395,645 | 336,956 | ||||||||||||||||||||||
| Income tax expense | 25,904 | 6,732 | 95,980 | 78,449 | ||||||||||||||||||||||
| Net income | $ | 75,804 | $ | 28,953 | $ | 299,665 | $ | 258,507 | ||||||||||||||||||
| Basic earnings per share | $ | 1.62 | $ | 0.58 | $ | 6.26 | $ | 5.11 | ||||||||||||||||||
| Diluted earnings per share | $ | 1.59 | $ | 0.58 | $ | 6.20 | $ | 5.07 | ||||||||||||||||||
| Exhibit 2 | ||||||||||||||||||||
| Choice Hotels International, Inc. | ||||||||||||||||||||
| Condensed Consolidated Balance Sheets | ||||||||||||||||||||
| (Unaudited) | ||||||||||||||||||||
| (In thousands) | December 31, | December 31, | ||||||||||||||||||
| 2024 | 2023 | |||||||||||||||||||
| ASSETS | ||||||||||||||||||||
| Cash and cash equivalents | $ | 40,177 | $ | 26,754 | ||||||||||||||||
| Accounts receivable, net | 176,672 | 195,896 | ||||||||||||||||||
| Other current assets | 122,237 | 73,880 | ||||||||||||||||||
| Total current assets | 339,086 | 296,530 | ||||||||||||||||||
| Property and equipment, net | 604,345 | 493,478 | ||||||||||||||||||
| Operating lease right-of-use assets | 83,451 | 85,101 | ||||||||||||||||||
| Goodwill | 220,187 | 220,187 | ||||||||||||||||||
| Intangible assets, net | 884,013 | 811,075 | ||||||||||||||||||
| Notes receivable, net of allowances | 32,682 | 78,900 | ||||||||||||||||||
| Investments in equity securities, at fair value | — | 116,374 | ||||||||||||||||||
| Investments in affiliates | 117,016 | 70,579 | ||||||||||||||||||
| Investments, employee benefit plans, at fair value | 47,603 | 39,751 | ||||||||||||||||||
| Other assets | 202,144 | 182,824 | ||||||||||||||||||
| Total assets | $ | 2,530,527 | $ | 2,394,799 | ||||||||||||||||
| LIABILITIES AND SHAREHOLDERS’ (DEFICIT) EQUITY | ||||||||||||||||||||
| Accounts payable | $ | 134,865 | $ | 131,284 | ||||||||||||||||
| Accrued expenses and other current liabilities | 136,729 | 109,248 | ||||||||||||||||||
| Deferred revenue | 102,114 | 108,316 | ||||||||||||||||||
| Liability for guest loyalty program | 89,013 | 94,574 | ||||||||||||||||||
| Current portion of long-term debt | — | 499,268 | ||||||||||||||||||
| Total current liabilities | 462,721 | 942,690 | ||||||||||||||||||
| Long-term debt | 1,768,526 | 1,068,751 | ||||||||||||||||||
| Deferred revenue | 132,259 | 133,501 | ||||||||||||||||||
| Deferred compensation & retirement plan obligations | 53,316 | 45,657 | ||||||||||||||||||
| Liability for guest loyalty program | 40,607 | 43,266 | ||||||||||||||||||
| Operating lease liabilities | 113,255 | 109,483 | ||||||||||||||||||
| Other liabilities | 5,114 | 15,853 | ||||||||||||||||||
| Total liabilities | 2,575,798 | 2,359,201 | ||||||||||||||||||
| Total shareholders’ (deficit) equity | (45,271) | 35,598 | ||||||||||||||||||
| Total liabilities and shareholders’ (deficit) equity | $ | 2,530,527 | $ | 2,394,799 | ||||||||||||||||
| Exhibit 3 | |||||||||||
| Choice Hotels International, Inc. | |||||||||||
| Condensed Consolidated Statements of Cash Flows | |||||||||||
| (Unaudited) | |||||||||||
| (In thousands) | Year Ended December 31, | ||||||||||
| 2024 | 2023 | ||||||||||
| CASH FLOWS FROM OPERATING ACTIVITIES | |||||||||||
| Net income | $ | 299,665 | $ | 258,507 | |||||||
| Adjustments to reconcile net income to net cash provided by operating activities: | |||||||||||
| Depreciation and amortization | 43,282 | 39,659 | |||||||||
| Depreciation and amortization - other expenses from franchised and managed properties | 27,578 | 36,076 | |||||||||
| Franchise agreement acquisition cost amortization | 28,702 | 20,024 | |||||||||
| Loss (gain) on extinguishment of debt | 331 | (4,416) | |||||||||
| Impairment of long-lived assets | — | 3,736 | |||||||||
| Non-cash share-based compensation and other charges | 43,250 | 46,809 | |||||||||
| Non-cash interest, investments, and affiliate income, net | (7,282) | (8,747) | |||||||||
| Deferred income taxes | (19,028) | (1,336) | |||||||||
| Equity in net gain of affiliates, less distributions received | (2,327) | (1,570) | |||||||||
| Franchise agreement acquisition costs, net of reimbursements | (112,164) | (98,316) | |||||||||
| Change in working capital and other | 17,396 | 6,128 | |||||||||
| Net cash provided by operating activities | 319,403 | 296,554 | |||||||||
| CASH FLOWS FROM INVESTING ACTIVITIES | |||||||||||
| Investments in other property and equipment | (39,102) | (47,717) | |||||||||
| Investments in owned hotel properties | (106,750) | (68,560) | |||||||||
| Contributions to investments in affiliates | (52,768) | (38,930) | |||||||||
| Issuances of notes receivable | (37,994) | (4,323) | |||||||||
| Purchases of equity securities | — | (112,420) | |||||||||
| Distributions from sales of affiliates | 15,850 | 868 | |||||||||
| Collections of notes receivable | 32,100 | 10,852 | |||||||||
| Proceeds from sales of equity securities | 108,149 | — | |||||||||
| Other items, net | (4,056) | (5,396) | |||||||||
| Net cash used in investing activities | (84,571) | (265,626) | |||||||||
| CASH FLOWS FROM FINANCING ACTIVITIES | |||||||||||
| Net borrowings (repayments) pursuant to revolving credit facilities | 111,500 | (131,500) | |||||||||
| Proceeds from the issuance of long-term debt | 593,574 | 500,000 | |||||||||
| Repayment of long-term debt | (500,000) | — | |||||||||
| Debt issuance costs | (8,069) | (1,553) | |||||||||
| Purchases of treasury stock | (380,743) | (362,772) | |||||||||
| Dividends paid | (55,497) | (56,457) | |||||||||
| Proceeds from the exercise of stock options | 17,525 | 6,345 | |||||||||
| Net cash used in financing activities | (221,710) | (45,937) | |||||||||
| Net change in cash and cash equivalents | 13,122 | (15,009) | |||||||||
| Effect of foreign exchange rate changes on cash and cash equivalents | 301 | 197 | |||||||||
| Cash and cash equivalents, beginning of period | 26,754 | 41,566 | |||||||||
| Cash and cash equivalents, end of period | $ | 40,177 | $ | 26,754 | |||||||
| Exhibit 4 | |||||||||||||||||||||||||||||||||||||||||||||||||||||||||||
| CHOICE HOTELS INTERNATIONAL, INC. | |||||||||||||||||||||||||||||||||||||||||||||||||||||||||||
| SUPPLEMENTAL OPERATING INFORMATION | |||||||||||||||||||||||||||||||||||||||||||||||||||||||||||
| DOMESTIC HOTEL SYSTEM | |||||||||||||||||||||||||||||||||||||||||||||||||||||||||||
| (UNAUDITED) | |||||||||||||||||||||||||||||||||||||||||||||||||||||||||||
| For the Three Months Ended December 31, 2024 | For the Three Months Ended December 31, 2023 | Change | |||||||||||||||||||||||||||||||||||||||||||||||||||||||||
| Average Daily | Average Daily | Average Daily | |||||||||||||||||||||||||||||||||||||||||||||||||||||||||
| Rate | Occupancy | RevPAR | Rate | Occupancy | RevPAR | Rate | Occupancy | RevPAR | |||||||||||||||||||||||||||||||||||||||||||||||||||
Upscale & Above (1) | $ | 146.34 | 53.4 | % | $ | 78.21 | $ | 146.56 | 52.0 | % | $ | 76.21 | (0.2) | % | 140 | bps | 2.6 | % | |||||||||||||||||||||||||||||||||||||||||
Midscale & Upper Midscale (2) | 98.09 | 52.8 | % | 51.78 | 95.21 | 52.3 | % | 49.78 | 3.0 | % | 50 | bps | 4.0 | % | |||||||||||||||||||||||||||||||||||||||||||||
Extended Stay (3) | 65.02 | 68.6 | % | 44.62 | 61.20 | 68.9 | % | 42.15 | 6.2 | % | (30) | bps | 5.9 | % | |||||||||||||||||||||||||||||||||||||||||||||
Economy (4) | 73.42 | 45.6 | % | 33.45 | 68.51 | 44.8 | % | 30.70 | 7.2 | % | 80 | bps | 9.0 | % | |||||||||||||||||||||||||||||||||||||||||||||
| Total | $ | 94.32 | 53.6 | % | $ | 50.51 | $ | 91.49 | 52.8 | % | $ | 48.33 | 3.1 | % | 80 | bps | 4.5 | % | |||||||||||||||||||||||||||||||||||||||||
| For the Year Ended December 31, 2024 | For the Year Ended December 31, 2023 | Change | |||||||||||||||||||||||||||||||||||||||||||||||||||||||||
| Average Daily | Average Daily | Average Daily | |||||||||||||||||||||||||||||||||||||||||||||||||||||||||
| Rate | Occupancy | RevPAR | Rate | Occupancy | RevPAR | Rate | Occupancy | RevPAR | |||||||||||||||||||||||||||||||||||||||||||||||||||
Upscale & Above (1) | $ | 151.91 | 57.7 | % | $ | 87.67 | $ | 151.19 | 56.6 | % | $ | 85.65 | 0.5 | % | 110 | bps | 2.4 | % | |||||||||||||||||||||||||||||||||||||||||
Midscale & Upper Midscale (2) | 100.95 | 55.9 | % | 56.45 | 101.12 | 56.8 | % | 57.43 | (0.2) | % | (90) | bps | (1.7) | % | |||||||||||||||||||||||||||||||||||||||||||||
Extended Stay (3) | 64.13 | 71.2 | % | 45.66 | 63.50 | 72.3 | % | 45.88 | 1.0 | % | (110) | bps | (0.5) | % | |||||||||||||||||||||||||||||||||||||||||||||
Economy (4) | 72.18 | 47.1 | % | 34.00 | 71.66 | 47.9 | % | 34.36 | 0.7 | % | (80) | bps | (1.0) | % | |||||||||||||||||||||||||||||||||||||||||||||
| Total | $ | 96.67 | 56.4 | % | $ | 54.54 | $ | 96.92 | 56.9 | % | $ | 55.19 | (0.3) | % | (50) | bps | (1.2) | % | |||||||||||||||||||||||||||||||||||||||||
| Effective Royalty Rate | |||||||||||||||||||||||||||||||||||||||||||||||||||||||||||
| For the Three Months Ended | For the Year Ended | ||||||||||||||||||||||||||||||||||||||||||||||||||||||||||
| December 31, 2024 | December 31, 2023 | December 31, 2024 | December 31, 2023 | ||||||||||||||||||||||||||||||||||||||||||||||||||||||||
| System-wide | 5.09 | % | 5.03 | % | 5.06 | % | 4.99 | % | |||||||||||||||||||||||||||||||||||||||||||||||||||
(1) Includes Ascend Hotel Collection, Cambria, Park Plaza, Radisson, Radisson Blu, Radisson Individuals, and Radisson RED brands. | |||||||||||||||||||||||||||||||||||||||||||||||||||||||||||
(2) Includes Clarion, Comfort Inn, Comfort Suites, Country Inn & Suites, Park Inn, Quality Inn, and Sleep Inn brands. | |||||||||||||||||||||||||||||||||||||||||||||||||||||||||||
(3) Includes Everhome Suites, Mainstay Suites, Suburban Studios, and WoodSpring Suites brands. | |||||||||||||||||||||||||||||||||||||||||||||||||||||||||||
(4) Includes Econo Lodge and Rodeway brands. | |||||||||||||||||||||||||||||||||||||||||||||||||||||||||||
| Exhibit 5 | ||||||||||||||||||||||||||||||||||||||||||||||||||
| CHOICE HOTELS INTERNATIONAL, INC. | ||||||||||||||||||||||||||||||||||||||||||||||||||
| SUPPLEMENTAL HOTEL AND ROOM SUPPLY DATA | ||||||||||||||||||||||||||||||||||||||||||||||||||
| (UNAUDITED) | ||||||||||||||||||||||||||||||||||||||||||||||||||
| December 31, 2024 | December 31, 2023 | Variance | ||||||||||||||||||||||||||||||||||||||||||||||||
| Hotels | Rooms | Hotels | Rooms | Hotels | % | Rooms | % | |||||||||||||||||||||||||||||||||||||||||||
| Ascend Hotel Collection | 233 | 38,589 | 209 | 23,484 | 24 | 11.5 | % | 15,105 | 64.3 | % | ||||||||||||||||||||||||||||||||||||||||
| Cambria Hotels | 76 | 10,344 | 74 | 10,239 | 2 | 2.7 | % | 105 | 1.0 | % | ||||||||||||||||||||||||||||||||||||||||
Radisson (1) | 57 | 13,390 | 64 | 15,206 | (7) | (10.9) | % | (1,816) | (11.9) | % | ||||||||||||||||||||||||||||||||||||||||
Comfort (2) | 1,674 | 131,495 | 1,675 | 131,637 | (1) | (0.1) | % | (142) | (0.1) | % | ||||||||||||||||||||||||||||||||||||||||
| Quality | 1,627 | 118,725 | 1,620 | 119,153 | 7 | 0.4 | % | (428) | (0.4) | % | ||||||||||||||||||||||||||||||||||||||||
| Country | 422 | 33,771 | 428 | 34,122 | (6) | (1.4) | % | (351) | (1.0) | % | ||||||||||||||||||||||||||||||||||||||||
| Sleep | 415 | 29,118 | 432 | 30,411 | (17) | (3.9) | % | (1,293) | (4.3) | % | ||||||||||||||||||||||||||||||||||||||||
Clarion (3) | 193 | 19,944 | 186 | 19,813 | 7 | 3.8 | % | 131 | 0.7 | % | ||||||||||||||||||||||||||||||||||||||||
| Park Inn | 27 | 2,926 | 4 | 363 | 23 | 575.0 | % | 2,563 | 706.1 | % | ||||||||||||||||||||||||||||||||||||||||
| WoodSpring | 256 | 30,846 | 235 | 28,350 | 21 | 8.9 | % | 2,496 | 8.8 | % | ||||||||||||||||||||||||||||||||||||||||
| MainStay | 141 | 10,157 | 127 | 8,863 | 14 | 11.0 | % | 1,294 | 14.6 | % | ||||||||||||||||||||||||||||||||||||||||
| Suburban | 111 | 9,159 | 105 | 9,112 | 6 | 5.7 | % | 47 | 0.5 | % | ||||||||||||||||||||||||||||||||||||||||
| Everhome | 7 | 799 | 1 | 98 | 6 | 600.0 | % | 701 | 715.3 | % | ||||||||||||||||||||||||||||||||||||||||
| Econo Lodge | 642 | 37,528 | 675 | 39,805 | (33) | (4.9) | % | (2,277) | (5.7) | % | ||||||||||||||||||||||||||||||||||||||||
| Rodeway | 447 | 24,948 | 470 | 26,309 | (23) | (4.9) | % | (1,361) | (5.2) | % | ||||||||||||||||||||||||||||||||||||||||
| Domestic Franchises | 6,328 | 511,739 | 6,305 | 496,965 | 23 | 0.4 | % | 14,774 | 3.0 | % | ||||||||||||||||||||||||||||||||||||||||
| International Franchises | 1,258 | 142,071 | 1,222 | 136,021 | 36 | 2.9 | % | 6,050 | 4.4 | % | ||||||||||||||||||||||||||||||||||||||||
| Total Franchises | 7,586 | 653,810 | 7,527 | 632,986 | 59 | 0.8 | % | 20,824 | 3.3 | % | ||||||||||||||||||||||||||||||||||||||||
(1) Includes Radisson, Radisson Blu, Radisson Individuals and Radisson RED brands. | ||||||||||||||||||||||||||||||||||||||||||||||||||
(2) Includes Comfort family of brand extensions, including Comfort Inn and Comfort Suites. | ||||||||||||||||||||||||||||||||||||||||||||||||||
| (3) Includes Clarion family of brand extensions, including Clarion and Clarion Pointe. | ||||||||||||||||||||||||||||||||||||||||||||||||||
| Exhibit 6 | |||||||||||||||||||||||||||||
| CHOICE HOTELS INTERNATIONAL, INC. | |||||||||||||||||||||||||||||
| SUPPLEMENTAL NON-GAAP FINANCIAL INFORMATION | |||||||||||||||||||||||||||||
| (UNAUDITED) | |||||||||||||||||||||||||||||
| EARNINGS BEFORE INTEREST, TAXES, DEPRECIATION AND AMORTIZATION ("EBITDA") AND ADJUSTED EBITDA | |||||||||||||||||||||||||||||
| (dollar amounts in thousands) | Three Months Ended December 31, | Year Ended December 31, | |||||||||||||||||||||||||||
| 2024 | 2023 | 2024 | 2023 | ||||||||||||||||||||||||||
| Net income | $ | 75,804 | $ | 28,953 | $ | 299,665 | $ | 258,507 | |||||||||||||||||||||
| Income tax expense | 25,904 | 6,732 | 95,980 | 78,449 | |||||||||||||||||||||||||
| Interest expense | 21,067 | 17,258 | 87,131 | 63,780 | |||||||||||||||||||||||||
| Interest income | (2,089) | (1,928) | (8,646) | (7,764) | |||||||||||||||||||||||||
| (Gain) loss on extinguishment of debt | — | (4,416) | 331 | (4,416) | |||||||||||||||||||||||||
| Other loss (gain) | 1,774 | (7,897) | 1,641 | (10,649) | |||||||||||||||||||||||||
| Equity in net gain of affiliates | (3,241) | (956) | (12,329) | (2,879) | |||||||||||||||||||||||||
| Depreciation and amortization | 10,659 | 10,191 | 43,282 | 39,659 | |||||||||||||||||||||||||
| Depreciation and amortization - reimbursables | 2,749 | 1,074 | 8,671 | 8,541 | |||||||||||||||||||||||||
| Impairment of long-lived assets | — | 3,736 | — | 3,736 | |||||||||||||||||||||||||
| EBITDA | $ | 132,627 | $ | 52,747 | $ | 515,726 | $ | 426,964 | |||||||||||||||||||||
| Share-based compensation | 5,634 | 4,572 | 21,118 | 21,075 | |||||||||||||||||||||||||
| Mark to market adjustments on non-qualified retirement plan investments | 224 | 3,374 | 7,409 | 6,329 | |||||||||||||||||||||||||
| Franchise agreement acquisition cost amortization and charges | 3,361 | 6,307 | 14,953 | 14,675 | |||||||||||||||||||||||||
| Net reimbursable (surplus) deficit from franchised and managed properties | (6,629) | 29,155 | 18,152 | 8,538 | |||||||||||||||||||||||||
| Global ERP system implementation and related costs | 791 | — | 1,377 | — | |||||||||||||||||||||||||
| Business combination, diligence and transition (recoveries) costs | (490) | 25,165 | 17,233 | 55,778 | |||||||||||||||||||||||||
| Operational restructuring charges | 4,895 | 3,703 | 5,683 | 5,547 | |||||||||||||||||||||||||
| Limited payment guaranty charge | — | — | — | 1,551 | |||||||||||||||||||||||||
| Expenses associated with legal claims | — | — | 2,430 | — | |||||||||||||||||||||||||
| Adjusted EBITDA | $ | 140,413 | $ | 125,023 | $ | 604,081 | $ | 540,457 | |||||||||||||||||||||
| ADJUSTED NET INCOME AND ADJUSTED DILUTED EARNINGS PER SHARE (EPS) | |||||||||||||||||||||||||||||
| (dollar amounts in thousands, except per share amounts) | Three Months Ended December 31, | Year Ended December 31, | |||||||||||||||||||||||||||
| 2024 | 2023 | 2024 | 2023 | ||||||||||||||||||||||||||
| Net income | $ | 75,804 | $ | 28,953 | $ | 299,665 | $ | 258,507 | |||||||||||||||||||||
| (Gain) loss on extinguishment of debt | — | (3,356) | 250 | (3,356) | |||||||||||||||||||||||||
| Impairment of long-lived assets | — | 2,839 | — | 2,839 | |||||||||||||||||||||||||
| (Gain) Loss on investments in equity securities, net of dividend income | — | (3,005) | 5,076 | (3,005) | |||||||||||||||||||||||||
| Franchise agreement acquisition cost (recoveries) charges | (940) | 2,346 | (940) | 2,346 | |||||||||||||||||||||||||
| Net reimbursable (surplus) deficit from franchised and managed properties | (5,101) | 21,954 | 13,559 | 6,429 | |||||||||||||||||||||||||
| Global ERP system implementation and related costs | 598 | — | 1,041 | — | |||||||||||||||||||||||||
| Business combination, diligence and transition (recoveries) costs | (370) | 19,288 | 13,028 | 42,391 | |||||||||||||||||||||||||
| Operational restructuring charges | 3,700 | 2,814 | 4,296 | 4,216 | |||||||||||||||||||||||||
| Limited payment guaranty charge | — | — | — | 1,174 | |||||||||||||||||||||||||
| Expenses associated with legal claims | — | — | 1,830 | — | |||||||||||||||||||||||||
| Gain on sale of an affiliate | — | — | (5,446) | — | |||||||||||||||||||||||||
| Adjusted Net Income | $ | 73,691 | $ | 71,833 | $ | 332,359 | $ | 311,541 | |||||||||||||||||||||
| Diluted Earnings Per Share | $ | 1.59 | $ | 0.58 | $ | 6.20 | $ | 5.07 | |||||||||||||||||||||
| (Gain) loss on extinguishment of debt | — | (0.07) | 0.01 | (0.07) | |||||||||||||||||||||||||
| Impairment of long-lived assets | — | 0.06 | — | 0.06 | |||||||||||||||||||||||||
| (Gain) Loss on investments in equity securities, net of dividend income | — | (0.06) | 0.11 | (0.06) | |||||||||||||||||||||||||
| Franchise agreement acquisition cost recoveries (charges) | (0.02) | 0.05 | (0.02) | 0.05 | |||||||||||||||||||||||||
| Net reimbursable (surplus) deficit from franchised and managed properties | (0.10) | 0.43 | 0.27 | 0.13 | |||||||||||||||||||||||||
| Global ERP system implementation and related costs | 0.01 | — | 0.02 | — | |||||||||||||||||||||||||
| Business combination, diligence and transition (recoveries) costs | (0.01) | 0.39 | 0.27 | 0.83 | |||||||||||||||||||||||||
| Operational restructuring charges | 0.08 | 0.06 | 0.09 | 0.08 | |||||||||||||||||||||||||
| Limited payment guaranty charge | — | — | — | 0.02 | |||||||||||||||||||||||||
| Expenses associated with legal claims | — | — | 0.04 | — | |||||||||||||||||||||||||
| Gain on sale of an affiliate | — | — | (0.11) | — | |||||||||||||||||||||||||
| Adjusted Diluted Earnings Per Share (EPS) | $ | 1.55 | $ | 1.44 | $ | 6.88 | $ | 6.11 | |||||||||||||||||||||
| Exhibit 7 | |||||||||||||||||
| CHOICE HOTELS INTERNATIONAL, INC. | |||||||||||||||||
| SUPPLEMENTAL INFORMATION - 2025 OUTLOOK | |||||||||||||||||
| (UNAUDITED) | |||||||||||||||||
| Guidance represents the company's range of estimated outcomes for the full year ended December 31, 2025 | |||||||||||||||||
| EBITDA & ADJUSTED EBITDA | |||||||||||||||||
| (in thousands) | Full Year | Full Year | |||||||||||||||
| Lower Range | Upper Range | ||||||||||||||||
| Net income | $ | 288,000 | $ | 300,000 | |||||||||||||
| Income tax expense | 96,000 | 100,000 | |||||||||||||||
| Interest expense | 88,200 | 87,200 | |||||||||||||||
| Interest income | (7,200) | (7,200) | |||||||||||||||
| Other loss | 500 | 500 | |||||||||||||||
| Equity in net gain of affiliates | (2,900) | (2,900) | |||||||||||||||
| Depreciation and amortization | 57,000 | 57,000 | |||||||||||||||
| EBITDA | $ | 519,600 | $ | 534,600 | |||||||||||||
| Share-based compensation | 22,400 | 22,400 | |||||||||||||||
| Franchise agreement acquisition costs amortization and charges | 23,200 | 23,200 | |||||||||||||||
| Net reimbursable deficit from franchised and managed properties | 50,000 | 50,000 | |||||||||||||||
| Global ERP system implementation and related costs | 6,100 | 6,100 | |||||||||||||||
| Operational restructuring charges | 3,700 | 3,700 | |||||||||||||||
| Adjusted EBITDA | $ | 625,000 | $ | 640,000 | |||||||||||||
| ADJUSTED NET INCOME & DILUTED EARNINGS PER SHARE (EPS) | |||||||||||||||||
| (in thousands, except per share amounts) | Full Year | Full Year | |||||||||||||||
| Lower Range | Upper Range | ||||||||||||||||
| Net income | $ | 288,000 | $ | 300,000 | |||||||||||||
| Net reimbursable deficit from franchised and managed properties | 37,800 | 37,800 | |||||||||||||||
| Global ERP system implementation and related costs | 4,500 | 4,500 | |||||||||||||||
| Operational restructuring charges | 2,700 | 2,700 | |||||||||||||||
| Adjusted Net Income | $ | 333,000 | $ | 345,000 | |||||||||||||
| Diluted Earnings Per Share | $ | 6.04 | $ | 6.29 | |||||||||||||
| Net reimbursable deficit from franchised and managed properties | 0.80 | 0.80 | |||||||||||||||
| Global ERP system implementation and related costs | 0.09 | 0.09 | |||||||||||||||
| Operational restructuring charges | 0.05 | 0.06 | |||||||||||||||
| Adjusted Diluted Earnings Per Share (EPS) | $ | 6.98 | $ | 7.24 | |||||||||||||

1 FEBRUARY 20, 2025 FOURTH QUARTER AND FULL-YEAR 2024 EARNINGS RESULTS PRESENTATION Cambria Hotels, Nashville Midtown, TN
Forward-looking Statements Information set forth herein includes “forward-looking statements.” Certain, but not necessarily all, of such forward-looking statements can be identified by the use of forward- looking terminology, such as “expect,” “estimate,” “believe,” “anticipate,” “should,” “will,” “forecast,” “plan,” “project,” “assume,” or similar words of futurity. All statements other than historical facts are forward-looking statements. These forward-looking statements are based on management’s current beliefs, assumptions, and expectations regarding future events, which in turn are based on information currently available to management. Such statements may relate to projections of Choice’s revenue, expenses, EBITDA, adjusted EBITDA, earnings, debt levels, ability to repay outstanding indebtedness, payment of dividends, repurchases of common stock and other financial and operational measures, including occupancy and open hotels, RevPAR, and Choice’s liquidity, among other matters. We caution you not to place undue reliance on any such forward-looking statements. Forward-looking statements do not guarantee future performance and involve known and unknown risks, uncertainties, and other factors. Several factors could cause actual results, performance or achievements of the company to differ materially from those expressed in or contemplated by the forward-looking statements. Such risks include, but are not limited to, changes to general, domestic and foreign economic conditions, including access to liquidity and capital; changes in consumer demand and confidence, including consumer discretionary spending and the demand for travel, transient and group business; the timing and amount of future dividends and share repurchases; future domestic or global outbreaks of epidemics, pandemics or contagious diseases or fear of such outbreaks, and the related impact on the global hospitality industry, particularly but not exclusively the U.S. travel market; changes in law and regulation applicable to the travel, lodging or franchising industries, including with respect to the status of the company’s relationship with employees of our franchisees; foreign currency fluctuations; impairments or declines in the value of the company’s assets; operating risks common in the travel, lodging or franchising industries; changes to the desirability of our brands as viewed by hotel operators and customers; changes to the terms or termination of our contracts with franchisees and our relationships with our franchisees; our ability to keep pace with improvements in technology utilized for marketing and reservations systems and other operating systems; our ability to grow our franchise system; exposure to risks related to our hotel development, financing and ownership activities; exposures to risks associated with our investments in new businesses; fluctuations in the supply and demand for hotel rooms; our ability to realize anticipated benefits from acquired businesses; impairments or losses relating to acquired businesses; the level of acceptance of alternative growth strategies we may implement; the impact of inflation; cyber security and data breach risks; climate change and sustainability related concerns; ownership and financing activities; hotel closures or financial difficulties of our franchisees; operating risks associated with our international operations; labor shortages; the outcome of litigation; and our ability to effectively manage our indebtedness and secure our indebtedness. These and other risk factors are discussed in detail in the company’s filings with the U.S. Securities and Exchange Commission, including our Annual Report on Form 10-K. We undertake no obligation to publicly update or revise any forward-looking statement, whether as a result of new information, future events or otherwise, except as required by law. 2

Table of Contents 1. Fourth Quarter and Full-Year 2024 Results 2. Outlook 3. Appendix 3 Hotel Faranda Rias Altas, Ascend Hotel Collection, Oleiros, Spain
1 Fourth Quarter and Full-Year 2024 Results 4WoodSpring Suites Lobby
Strategic Partnership Rewards Program Members Effective Royalty Rate Growth Domestic RevPAR Growth System Growth 1. For Upscale, Midscale, and Extended Stay segments. +4.4%International Rooms Fourth Quarter and Full-Year 2024 Performance 5 +3.3%Global Rooms vs. FY '23 +4.3% 69 million vs. FY '23 vs. FY '23 Global Openings +21% vs. FY '23 Global Rooms Pipeline 98% with the industry’s premier resort operator: Domestic Rooms1 within more Revenue-Intense Brands vs. FY '23bps+7vs. Q4 '23+4.5% Outperformed Industry by bps90 vs. FY '23+8% rooms14,000+Added Organic Growth Record
Full-Year 2024 Financial Performance Revenues Profitability $6.88 Adj. diluted EPS $604.1M Adj. EBITDA2 +12% YoY +13% YoY Balance SheetShareholder Returns ~$700M>$435M $946.6M Adjusted Revenues1 >6%>3M In cash dividends and share repurchases3 shares repurchased4 of shares outstanding4 Available liquidity 6 1. Reflects revenues, excluding reimbursable revenue from franchised and managed properties, which are calculated as total revenues of $1,584.8 million net of reimbursable revenue of $638.2 million for the full year ending December 31, 2024. 2. Reported net income was $299.7 million for the full year ending December 31, 2024. 3. Reflects $55.5 million in cash dividends and $382.1 million in share repurchases during the full year ending December 31, 2024. 4. As of December 31, 2023. +13% YoY Exceeded guidance Exceeded guidance $332.4M Adj. Net Income2 +7% YoY Exceeded guidance
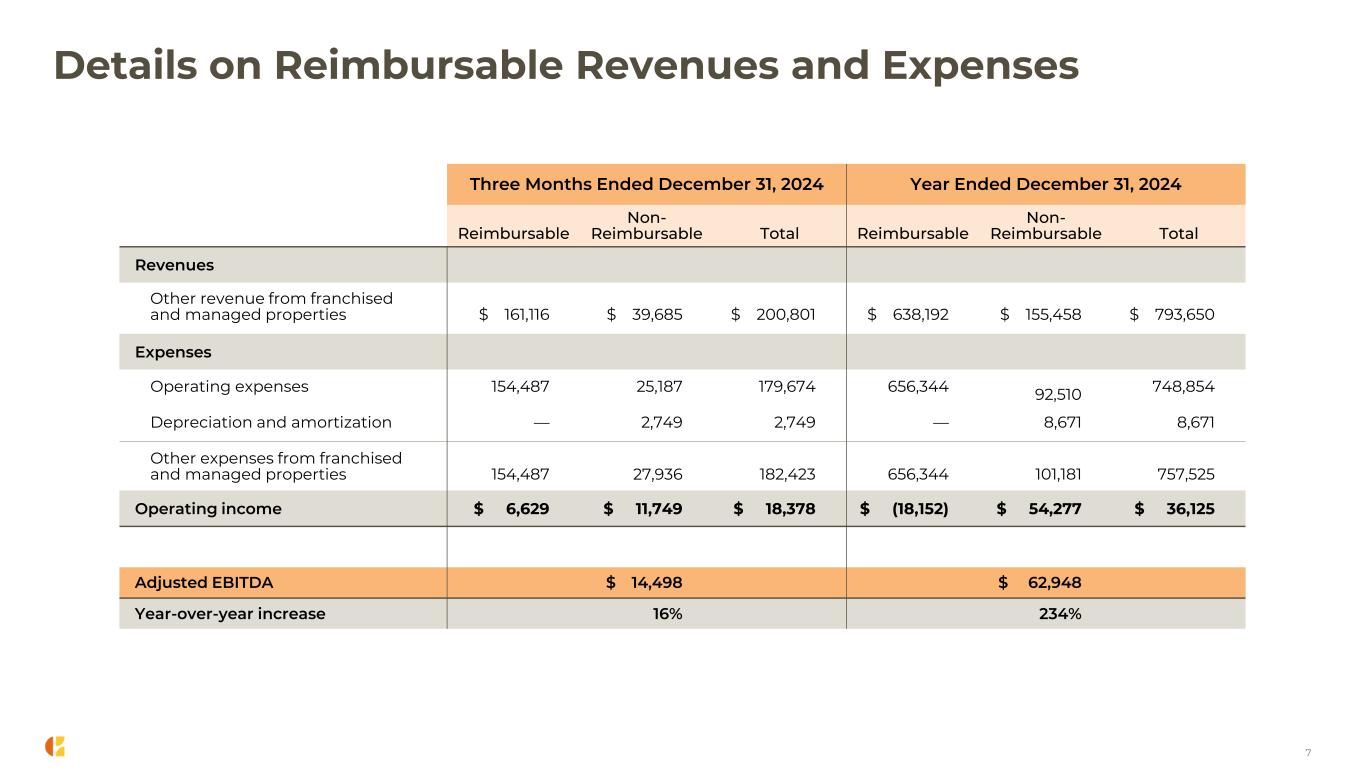
Three Months Ended December 31, 2024 Year Ended December 31, 2024 Reimbursable Non- Reimbursable Total Reimbursable Non- Reimbursable Total Revenues Other revenue from franchised and managed properties $ 161,116 $ 39,685 $ 200,801 $ 638,192 $ 155,458 $ 793,650 Expenses Operating expenses 154,487 25,187 179,674 656,344 92,510 748,854 Depreciation and amortization — 2,749 2,749 — 8,671 8,671 Other expenses from franchised and managed properties 154,487 27,936 182,423 656,344 101,181 757,525 Operating income $ 6,629 $ 11,749 $ 18,378 $ (18,152) $ 54,277 $ 36,125 Adjusted EBITDA $ 14,498 $ 62,948 Year-over-year increase 16% 234% Details on Reimbursable Revenues and Expenses 7
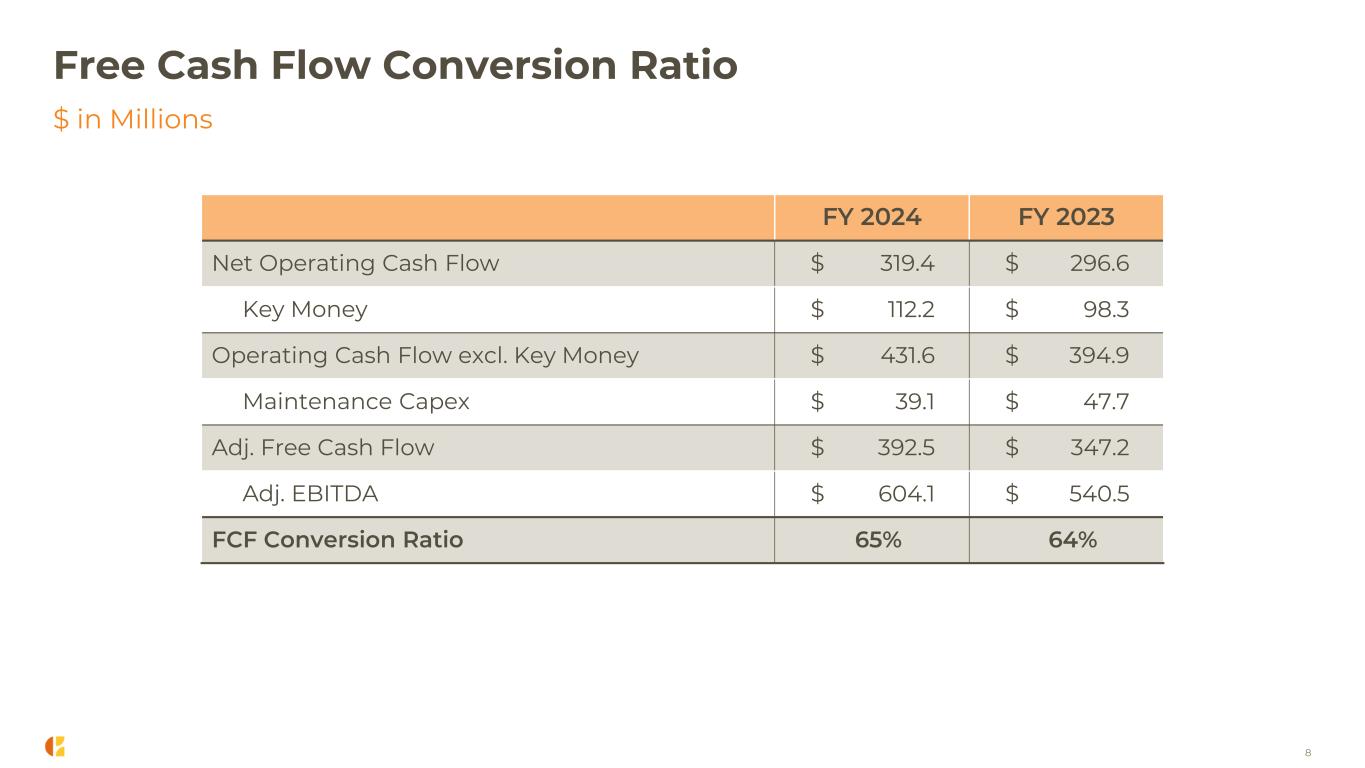
8 $ in Millions Free Cash Flow Conversion Ratio FY 2024 FY 2023 Net Operating Cash Flow $ 319.4 $ 296.6 Key Money $ 112.2 $ 98.3 Operating Cash Flow excl. Key Money $ 431.6 $ 394.9 Maintenance Capex $ 39.1 $ 47.7 Adj. Free Cash Flow $ 392.5 $ 347.2 Adj. EBITDA $ 604.1 $ 540.5 FCF Conversion Ratio 65% 64%

9 3 Outlook Everhome Suites Lobby
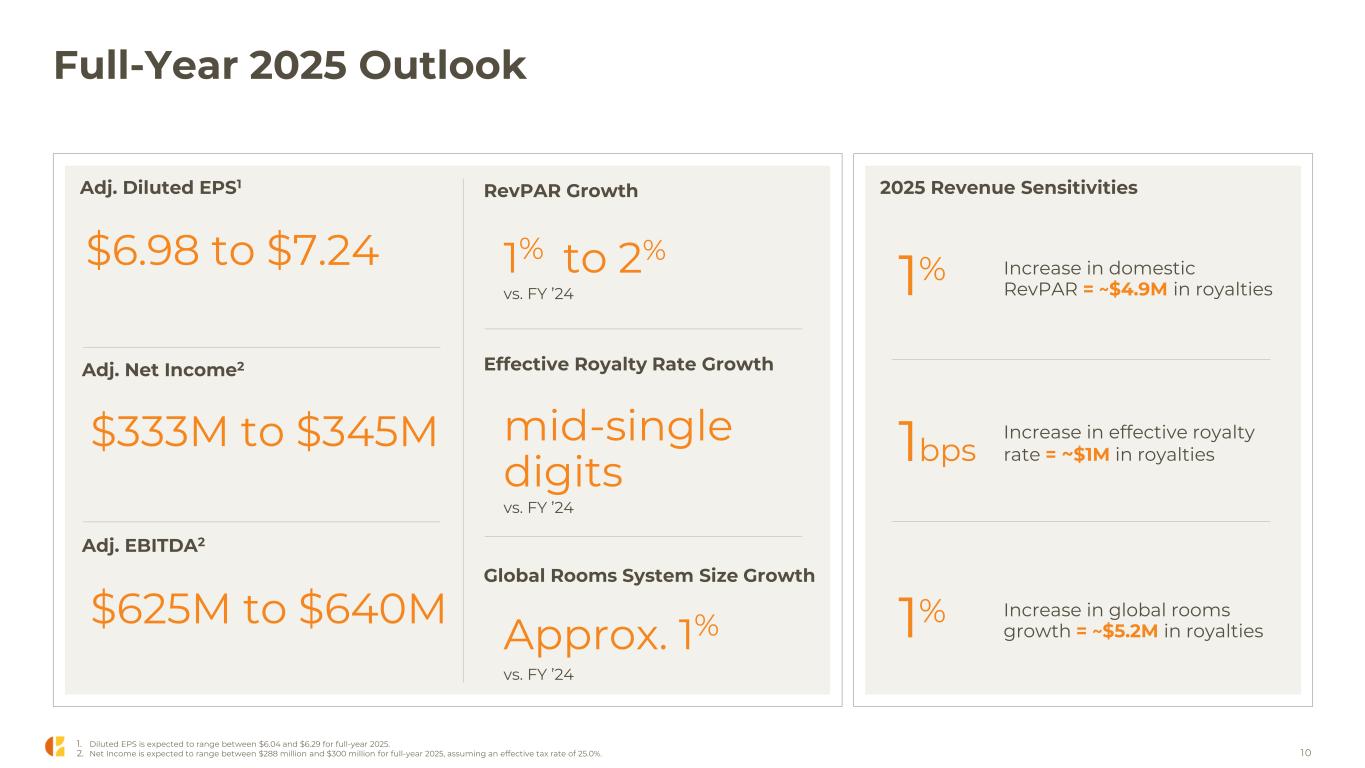
2025 Revenue SensitivitiesAdj. Diluted EPS1 Full-Year 2025 Outlook 1% 1bps 1% Increase in domestic RevPAR = ~$4.9M in royalties Increase in effective royalty rate = ~$1M in royalties Increase in global rooms growth = ~$5.2M in royalties 1% to 2% vs. FY ’24 mid-single digits vs. FY ’24 Approx. 1% vs. FY ’24 $625M to $640M Adj. EBITDA2 RevPAR Growth 1. Diluted EPS is expected to range between $6.04 and $6.29 for full-year 2025. 2. Net Income is expected to range between $288 million and $300 million for full-year 2025, assuming an effective tax rate of 25.0%. Effective Royalty Rate Growth Global Rooms System Size Growth $6.98 to $7.24 10 Adj. Net Income2 $333M to $345M

4 Appendix 11 Cambria Hotel Boston Sommerville, MA
Non-GAAP Financial Measurements and Other Definitions The company evaluates its operations utilizing the performance metrics of EBITDA, adjusted EBITDA, adjusted net income, and adjusted EPS, which are all non-GAAP financial measurements. These measures, which are reconciled to the comparable GAAP measures in Exhibits 6 and 7, should not be considered as an alternative to any measure of performance or liquidity as promulgated under or authorized by GAAP, such as net income and EPS. The company’s calculation of these measurements may be different from the calculations used by other companies and comparability may therefore be limited. We discuss management’s reasons for reporting these non-GAAP measures and how each non-GAAP measure is calculated below. In addition to the specific adjustments noted below with respect to each measure, the adjusted EBITDA, adjusted net income and adjusted EPS presented herein also exclude restructuring of the company’s operations including employee severance benefit, income taxes and legal costs, acquisition related to business combination, due diligence and transition (recoveries) costs, expenses associated with legal claims, (gain) loss on the sale of equity securities, net of dividend income purchased in contemplation of the proposed acquisition of Wyndham Hotels, global ERP system implementation and related costs, performance under limited debt payment guaranties and gain on sale of a hotel owned through an unconsolidated joint venture to allow for period-over-period comparison of ongoing core operations before the impact of these discrete and infrequent charges. Earnings Before Interest, Taxes, Depreciation, and Amortization and Adjusted Earnings Before Interest, Taxes, Depreciation, and Amortization: EBITDA reflects net income excluding the impact of interest expense, interest income, provision for income taxes, depreciation and amortization, impairments and gains on sale of business and assets, other (gains) and losses, equity in net income (loss) of unconsolidated affiliates and (gain) loss on extinguishment of debt. Adjusted EBITDA, presented herein, is calculated as EBITDA, as previously defined, further adjusted to exclude certain items, including, mark-to-market adjustments on non-qualified retirement plan investments, share based compensation expense (benefit) and surplus or deficits generated by reimbursable revenue from franchised and managed properties. We consider EBITDA and adjusted EBITDA to be an indicator of operating performance because it measures our ability to service debt, fund capital expenditures, and expand our business. We also use these measures, as do analysts, lenders, investors, and others, to evaluate companies because it excludes certain items that can vary widely across industries or among companies within the same industry. For example, interest expense can be dependent on a company’s capital structure, debt levels, and credit ratings, and share based compensation expense (benefit) is dependent on the design of compensation plans in place and the usage of them. Accordingly, the impact of interest expense and share based compensation expense (benefit) on earnings can vary significantly among companies. The tax positions of companies can also vary because of their differing abilities to take advantage of tax benefits and because of the tax policies of the jurisdictions in which they operate. As a result, effective tax rates and provision for income taxes can vary considerably among companies. These measures also exclude depreciation and amortization because companies utilize productive assets of different ages and use different methods of both acquiring and depreciating productive assets or amortizing franchise-agreement acquisition costs. These differences can result in considerable variability in the relative asset costs and estimated lives and, therefore, the depreciation and amortization expense among companies. Mark-to-market adjustments on non-qualified retirement-plan investments recorded in selling, general and administrative (SG&A) expenses are excluded from adjusted EBITDA, as the company accounts for these investments in accordance with accounting for deferred-compensation arrangements when investments are held in a rabbi trust and invested. Changes in the fair value of the investments are recognized as both compensation expense in SG&A and other gains and losses. As a result, the changes in the fair value of the investments do not have a material impact on the company’s net income. Surpluses and deficits generated from reimbursable revenues from franchised and managed properties are excluded, as the company does not operate these programs to generate a profit and has the contractual rights to adjust future collections or assess additional fees to recover prior period expenditures. The company’s franchise and management agreements require these revenues to be used exclusively for expenses associated with providing franchise and management services, such as central reservation systems, hotel employee and operating costs, reservation delivery and national marketing and media advertising. Franchised and managed property owners are required to reimburse the company for any deficits generated from these activities and the company is required to spend any surpluses generated in future periods. The reimbursement for franchise and management services is typically billed and collected monthly, based on the underlying hotel’s sales or usage, while the associated costs are recognized as incurred by the company, creating timing differences with the net effect impacting net income in the reporting period. These timing differences are due to our discretion to spend in excess of the revenues earned or less than the revenues earned in a single period to ensure that the programs are operated in the best long-term interests of our franchised and managed properties. Since these activities will be managed to break-even over time, quarterly or annual surpluses and deficits have been excluded from the measurements utilized to assess the company’s operating performance. Adjusted Net Income and Adjusted Earnings Per Share: Adjusted net income and EPS exclude the impact of surpluses or deficits generated from reimbursable revenue from franchised and managed properties and gains on extinguishment of debt. Surpluses and deficits generated from reimbursable revenue from franchised and managed properties are excluded, as the company does not operate these programs to generate a profit and has the contractual rights to adjust future collections or assess additional fees to recover prior period expenditures. The company’s franchise agreements require these revenues to be used exclusively for expenses associated with providing franchised and managed services, such as central reservation systems, hotel employee and operating costs, reservation delivery and national marketing and media advertising. Franchised and managed property owners are required to reimburse the company for any deficits generated from activities and the company is required to spend any surpluses generated in future periods. The reimbursement for franchise and management services is typically billed and collected monthly, based on the underlying hotel’s sales or usage, while the associated costs are recognized as incurred by the company, creating timing differences with the net effect impacting net income in the reporting period. These timing differences are due to our discretion to spend in excess of the revenues earned or less than the revenues earned in a single period to ensure that the programs are operated in the best long-term interests of our franchised and managed properties. Since these activities will be managed to break-even over time, quarterly or annual surpluses and deficits have been excluded from the measurements utilized to assess the company’s operating performance. We consider adjusted net income and adjusted EPS to be indicators of operating performance because excluding these items allows for period-over-period comparisons of our ongoing operations. 12
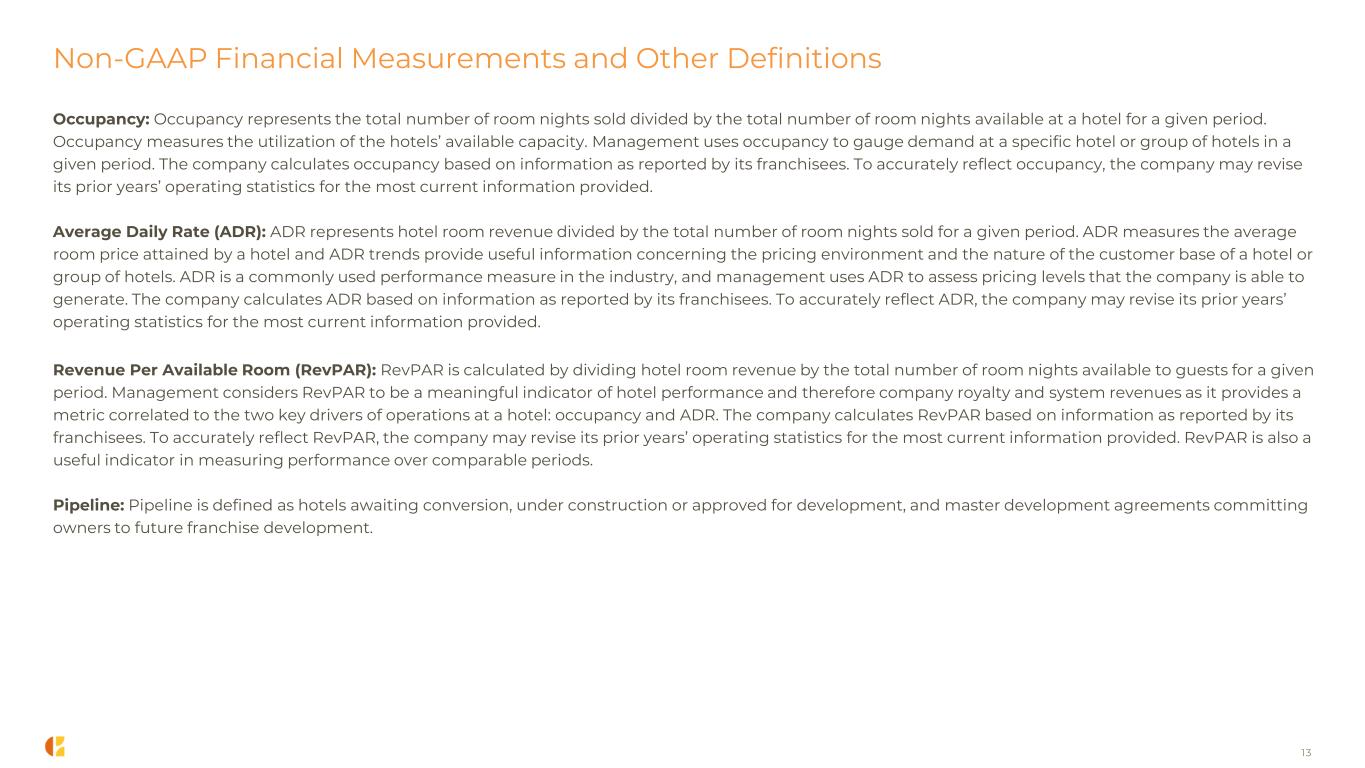
Non-GAAP Financial Measurements and Other Definitions Occupancy: Occupancy represents the total number of room nights sold divided by the total number of room nights available at a hotel for a given period. Occupancy measures the utilization of the hotels’ available capacity. Management uses occupancy to gauge demand at a specific hotel or group of hotels in a given period. The company calculates occupancy based on information as reported by its franchisees. To accurately reflect occupancy, the company may revise its prior years’ operating statistics for the most current information provided. Average Daily Rate (ADR): ADR represents hotel room revenue divided by the total number of room nights sold for a given period. ADR measures the average room price attained by a hotel and ADR trends provide useful information concerning the pricing environment and the nature of the customer base of a hotel or group of hotels. ADR is a commonly used performance measure in the industry, and management uses ADR to assess pricing levels that the company is able to generate. The company calculates ADR based on information as reported by its franchisees. To accurately reflect ADR, the company may revise its prior years’ operating statistics for the most current information provided. Revenue Per Available Room (RevPAR): RevPAR is calculated by dividing hotel room revenue by the total number of room nights available to guests for a given period. Management considers RevPAR to be a meaningful indicator of hotel performance and therefore company royalty and system revenues as it provides a metric correlated to the two key drivers of operations at a hotel: occupancy and ADR. The company calculates RevPAR based on information as reported by its franchisees. To accurately reflect RevPAR, the company may revise its prior years’ operating statistics for the most current information provided. RevPAR is also a useful indicator in measuring performance over comparable periods. Pipeline: Pipeline is defined as hotels awaiting conversion, under construction or approved for development, and master development agreements committing owners to future franchise development. 13
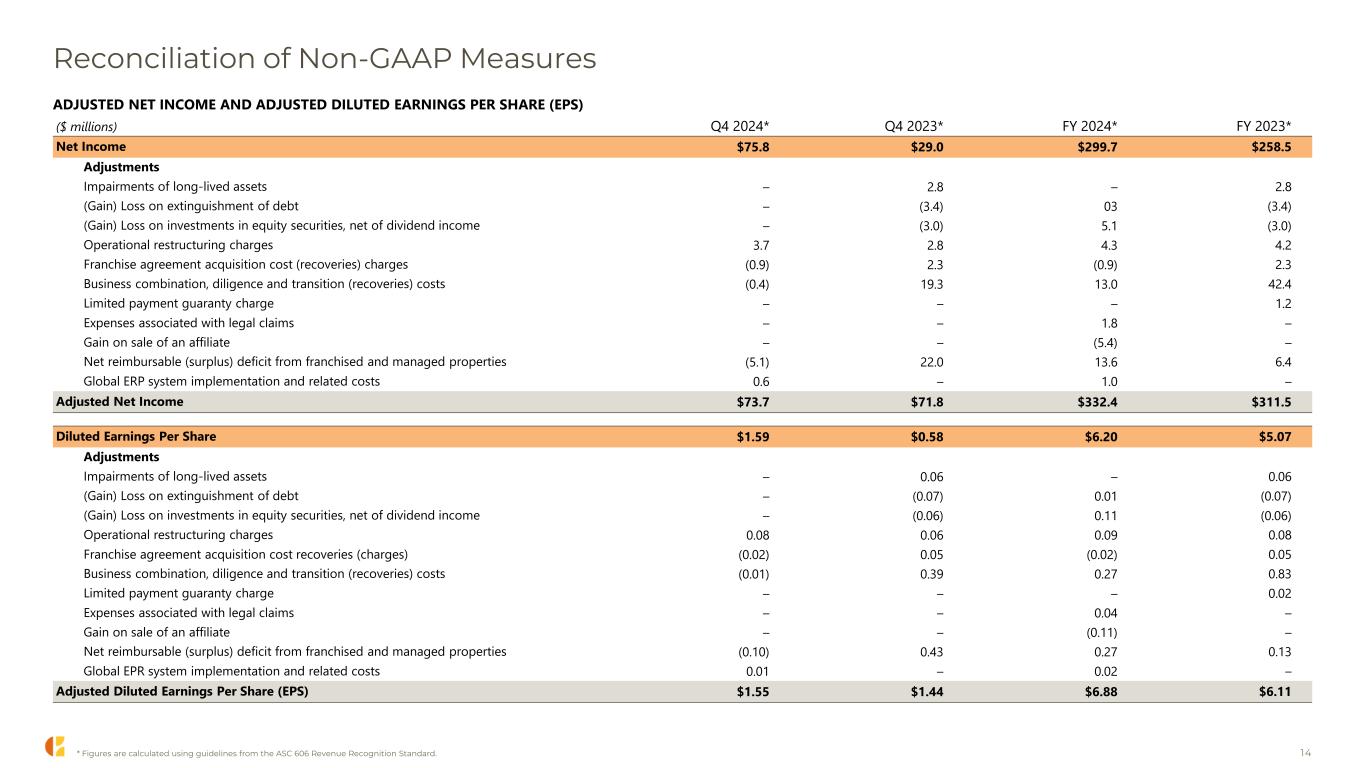
Reconciliation of Non-GAAP Measures 14 ADJUSTED NET INCOME AND ADJUSTED DILUTED EARNINGS PER SHARE (EPS) ($ millions) Q4 2024* Q4 2023* FY 2024* FY 2023* Net Income $75.8 $29.0 $299.7 $258.5 Adjustments Impairments of long-lived assets – 2.8 – 2.8 (Gain) Loss on extinguishment of debt – (3.4) 03 (3.4) (Gain) Loss on investments in equity securities, net of dividend income – (3.0) 5.1 (3.0) Operational restructuring charges 3.7 2.8 4.3 4.2 Franchise agreement acquisition cost (recoveries) charges (0.9) 2.3 (0.9) 2.3 Business combination, diligence and transition (recoveries) costs (0.4) 19.3 13.0 42.4 Limited payment guaranty charge – – – 1.2 Expenses associated with legal claims – – 1.8 – Gain on sale of an affiliate – – (5.4) – Net reimbursable (surplus) deficit from franchised and managed properties (5.1) 22.0 13.6 6.4 Global ERP system implementation and related costs 0.6 – 1.0 – Adjusted Net Income $73.7 $71.8 $332.4 $311.5 Diluted Earnings Per Share $1.59 $0.58 $6.20 $5.07 Adjustments Impairments of long-lived assets – 0.06 – 0.06 (Gain) Loss on extinguishment of debt – (0.07) 0.01 (0.07) (Gain) Loss on investments in equity securities, net of dividend income – (0.06) 0.11 (0.06) Operational restructuring charges 0.08 0.06 0.09 0.08 Franchise agreement acquisition cost recoveries (charges) (0.02) 0.05 (0.02) 0.05 Business combination, diligence and transition (recoveries) costs (0.01) 0.39 0.27 0.83 Limited payment guaranty charge – – – 0.02 Expenses associated with legal claims – – 0.04 – Gain on sale of an affiliate – – (0.11) – Net reimbursable (surplus) deficit from franchised and managed properties (0.10) 0.43 0.27 0.13 Global EPR system implementation and related costs 0.01 – 0.02 – Adjusted Diluted Earnings Per Share (EPS) $1.55 $1.44 $6.88 $6.11 * Figures are calculated using guidelines from the ASC 606 Revenue Recognition Standard.
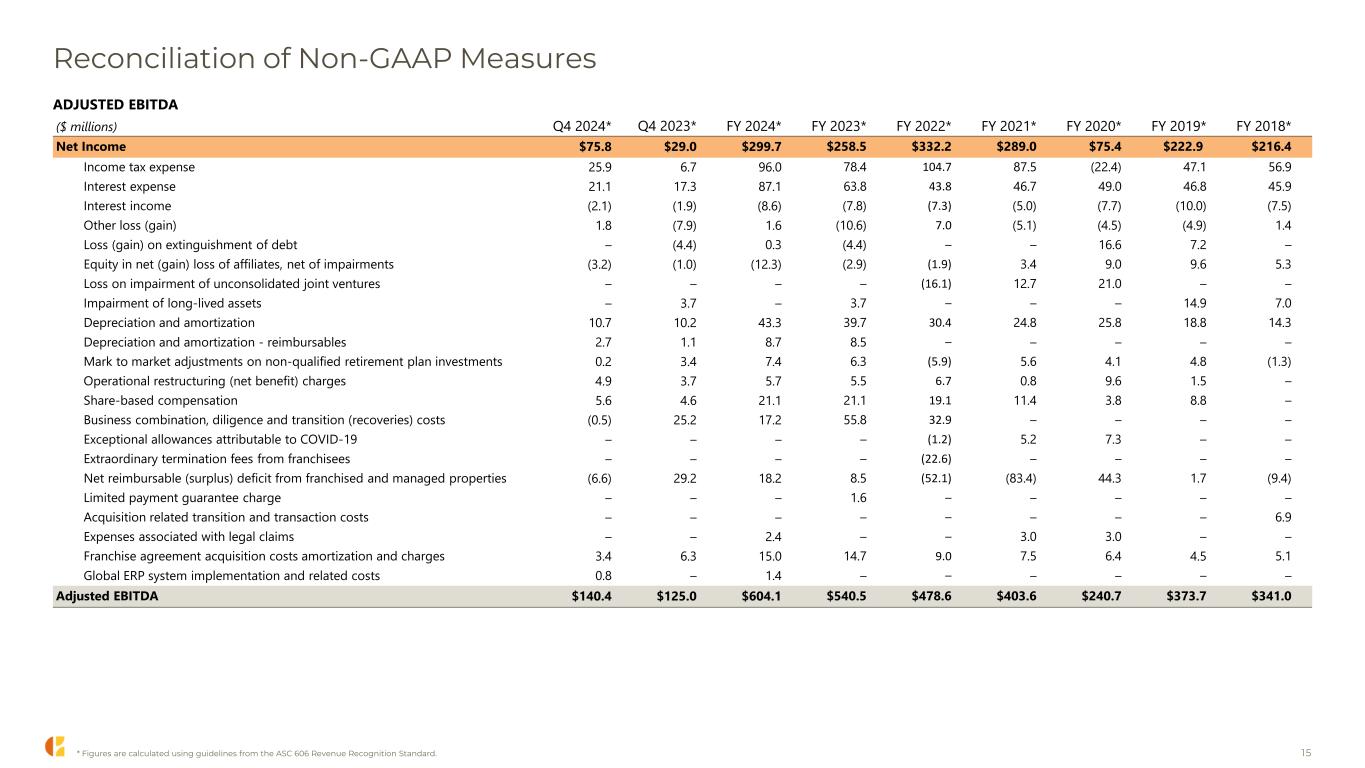
Reconciliation of Non-GAAP Measures 15 ADJUSTED EBITDA ($ millions) Q4 2024* Q4 2023* FY 2024* FY 2023* FY 2022* FY 2021* FY 2020* FY 2019* FY 2018* Net Income $75.8 $29.0 $299.7 $258.5 $332.2 $289.0 $75.4 $222.9 $216.4 Income tax expense 25.9 6.7 96.0 78.4 104.7 87.5 (22.4) 47.1 56.9 Interest expense 21.1 17.3 87.1 63.8 43.8 46.7 49.0 46.8 45.9 Interest income (2.1) (1.9) (8.6) (7.8) (7.3) (5.0) (7.7) (10.0) (7.5) Other loss (gain) 1.8 (7.9) 1.6 (10.6) 7.0 (5.1) (4.5) (4.9) 1.4 Loss (gain) on extinguishment of debt – (4.4) 0.3 (4.4) – – 16.6 7.2 – Equity in net (gain) loss of affiliates, net of impairments (3.2) (1.0) (12.3) (2.9) (1.9) 3.4 9.0 9.6 5.3 Loss on impairment of unconsolidated joint ventures – – – – (16.1) 12.7 21.0 – – Impairment of long-lived assets – 3.7 – 3.7 – – – 14.9 7.0 Depreciation and amortization 10.7 10.2 43.3 39.7 30.4 24.8 25.8 18.8 14.3 Depreciation and amortization - reimbursables 2.7 1.1 8.7 8.5 – – – – – Mark to market adjustments on non-qualified retirement plan investments 0.2 3.4 7.4 6.3 (5.9) 5.6 4.1 4.8 (1.3) Operational restructuring (net benefit) charges 4.9 3.7 5.7 5.5 6.7 0.8 9.6 1.5 – Share-based compensation 5.6 4.6 21.1 21.1 19.1 11.4 3.8 8.8 – Business combination, diligence and transition (recoveries) costs (0.5) 25.2 17.2 55.8 32.9 – – – – Exceptional allowances attributable to COVID-19 – – – – (1.2) 5.2 7.3 – – Extraordinary termination fees from franchisees – – – – (22.6) – – – – Net reimbursable (surplus) deficit from franchised and managed properties (6.6) 29.2 18.2 8.5 (52.1) (83.4) 44.3 1.7 (9.4) Limited payment guarantee charge – – – 1.6 – – – – – Acquisition related transition and transaction costs – – – – – – – – 6.9 Expenses associated with legal claims – – 2.4 – – 3.0 3.0 – – Franchise agreement acquisition costs amortization and charges 3.4 6.3 15.0 14.7 9.0 7.5 6.4 4.5 5.1 Global ERP system implementation and related costs 0.8 – 1.4 – – – – – – Adjusted EBITDA $140.4 $125.0 $604.1 $540.5 $478.6 $403.6 $240.7 $373.7 $341.0 * Figures are calculated using guidelines from the ASC 606 Revenue Recognition Standard.
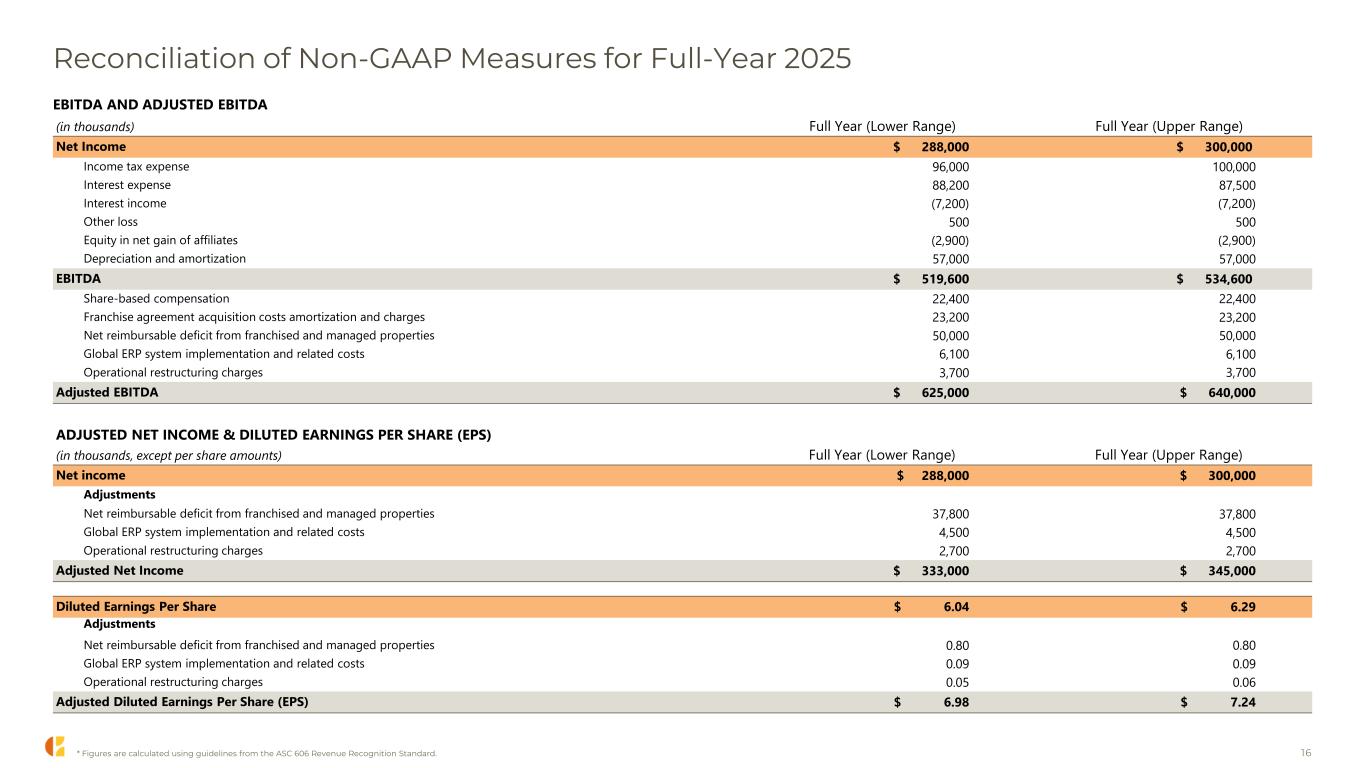
Reconciliation of Non-GAAP Measures for Full-Year 2025 EBITDA AND ADJUSTED EBITDA (in thousands) Full Year (Lower Range) Full Year (Upper Range) Net Income $ 288,000 $ 300,000 Income tax expense 96,000 100,000 Interest expense 88,200 87,500 Interest income (7,200) (7,200) Other loss 500 500 Equity in net gain of affiliates (2,900) (2,900) Depreciation and amortization 57,000 57,000 EBITDA $ 519,600 $ 534,600 Share-based compensation 22,400 22,400 Franchise agreement acquisition costs amortization and charges 23,200 23,200 Net reimbursable deficit from franchised and managed properties 50,000 50,000 Global ERP system implementation and related costs 6,100 6,100 Operational restructuring charges 3,700 3,700 Adjusted EBITDA $ 625,000 $ 640,000 ADJUSTED NET INCOME & DILUTED EARNINGS PER SHARE (EPS) (in thousands, except per share amounts) Full Year (Lower Range) Full Year (Upper Range) Net income $ 288,000 $ 300,000 Adjustments Net reimbursable deficit from franchised and managed properties 37,800 37,800 Global ERP system implementation and related costs 4,500 4,500 Operational restructuring charges 2,700 2,700 Adjusted Net Income $ 333,000 $ 345,000 Diluted Earnings Per Share $ 6.04 $ 6.29 Adjustments Net reimbursable deficit from franchised and managed properties 0.80 0.80 Global ERP system implementation and related costs 0.09 0.09 Operational restructuring charges 0.05 0.06 Adjusted Diluted Earnings Per Share (EPS) $ 6.98 $ 7.24 16* Figures are calculated using guidelines from the ASC 606 Revenue Recognition Standard.