
CIEN 8-K
Ciena Corp (CIEN)
8-K
2026-09-03
For: 2026-09-03
View Original
Added on
September 03, 2026
UNITED STATES
SECURITIES AND EXCHANGE COMMISSION
Washington, DC 20549
FORM 8-K
CURRENT REPORT
Pursuant to Section 13 or 15(d) of the Securities Exchange Act of 1934
Date of report (Date of earliest event reported): September 3, 2026
(Exact name of registrant as specified in its charter)
Commission File Number: 001-36250
(State or other jurisdiction of incorporation)
(Address of principal executive offices)
(IRS Employer Identification No.)
(Zip Code)
Registrant's telephone number, including area code: (410 ) 694-5700
Not Applicable
(Former name or former address, if changed since last report)
Check the appropriate box below if the Form 8-K filing is intended to simultaneously satisfy the filing obligation of the registrant under any of the following provisions (see General Instruction A.2. below): | |||||||||||
Written communications pursuant to Rule 425 under the Securities Act (17 CFR 230.425) | |||||||||||
Soliciting material pursuant to Rule 14a-12 under the Exchange Act (17 CFR 240.14a-12) | |||||||||||
Pre-commencement communications pursuant to Rule 14d-2(b) under the Exchange Act (17 CFR 240.14d-2(b)) | |||||||||||
| Pre-commencement communications pursuant to Rule 13e-4(c) under the Exchange Act (17 CFR 240.13e-4(c)) | |||||||||||
| Securities registered pursuant to Section 12(b) of the Act: | ||||||||
Title of each class | Trading Symbol(s) | Name of each exchange on which registered | ||||||
Indicate by check mark whether the registrant is an emerging growth company as defined in Rule 405 of the Securities Act of 1933 (§230.405 of this chapter) or Rule 12b-2 of the Securities Exchange Act of 1934 (§240.12b-2 of this chapter).
Emerging growth company ☐
If an emerging growth company, indicate by check mark if the registrant has elected not to use the extended transition period for complying with any new or revised financial accounting standards provided pursuant to Section 13(a) of the Exchange Act. ☐
Item 2.02 Results of Operations and Financial Condition.
On September 3, 2026, Ciena Corporation ("Ciena") issued a press release announcing its financial results for its fiscal third quarter ended August 1, 2026. The text of the press release is furnished as Exhibit 99.1 to this Current Report on Form 8-K (this "Report"). As discussed in the press release, Ciena will be hosting an investor call to discuss its results of operations for its fiscal third quarter ended August 1, 2026.
In conjunction with the issuance of this press release, Ciena posted to the quarterly results page of the "Investors" section of www.ciena.com an accompanying investor presentation. The investor presentation is furnished as Exhibit 99.2 to this Report.
The information in Exhibits 99.1 and 99.2, as well as Item 2.02 of this Report, shall not be deemed “filed” for purposes of Section 18 of the Securities Exchange Act of 1934, as amended, or otherwise subject to the liabilities of that section, and shall not be incorporated by reference into any registration statement pursuant to the Securities Act of 1933, as amended. Investors are encouraged to review the “Investors” page of our website at www.ciena.com because, as with the other disclosure channels that we use, from time to time we may post material information exclusively on that site.
Item 9.01 Financial Statements and Exhibits.
Exhibit Number | Description of Document | ||||||||||
99.1 | |||||||||||
99.2 | |||||||||||
104 | Cover Page Interactive Data File (embedded within the Inline XBRL document). | ||||||||||
SIGNATURES
Pursuant to the requirements of the Securities Exchange Act of 1934, the registrant has duly caused this report to be signed on its behalf by the undersigned thereunto duly authorized. | ||
Ciena Corporation | ||||||||
Date: September 3, 2026 | By: | /s/ Sheela Kosaraju | ||||||
Sheela Kosaraju | ||||||||
| Executive Vice President and Chief Legal Officer | ||||||||
FOR IMMEDIATE RELEASE
Ciena Reports Fiscal Third Quarter 2026 Financial Results
Summary
•Fiscal third quarter 2026 revenue was $1.67 billion, up 37% year-over-year
•Fiscal third quarter 2026 adjusted Earnings Per Share (EPS) was $2.11, an increase of 215% compared to fiscal third quarter 2025
•Providing revenue guidance for fiscal fourth quarter 2026 of $1.75 billion plus or minus $50 million
•Raising revenue guidance for fiscal year 2026 to $6.42 billion plus or minus $50 million, a 35% increase year-over-year at the midpoint
FULTON, Md. - September 3, 2026 - Ciena® Corporation (NYSE: CIEN) today announced financial results for its fiscal third quarter ended August 1, 2026.
"Today’s outstanding financial performance demonstrates Ciena’s leadership in providing industry-leading, high-speed connectivity solutions as AI continues to drive compounding waves of network investment,” said Gary Smith, president and CEO, Ciena. “As the only pure-play optical systems and interconnects provider, Ciena’s unmatched combination of incumbency, technology innovation, and deep expertise gives us a powerful competitive edge."
"Our record fiscal third quarter results reflect Ciena’s ability to deliver increasingly profitable growth while positioning for future opportunities,” said Marc Graff, Ciena’s Chief Financial Officer. “Our expanding supply capacity, strengthening business fundamentals, and increasing operating leverage set the stage to continue to accelerate earnings and deliver long-term value for customers and shareholders.”
Performance Summary for Fiscal Third Quarter Ended August 1, 2026
Revenue:
•$1.67 billion in the fiscal third quarter 2026, compared to $1.22 billion in the fiscal third quarter 2025
Net Income per diluted share:
•$1.83 GAAP and $2.11 adjusted (non-GAAP) for the fiscal third quarter 2026, compared to $0.35 and $0.67 for fiscal third quarter 2025, respectively
The tables below (in millions, except percentage data) provide comparisons of certain quarterly results. Appendices A and B set forth reconciliations between the GAAP and adjusted (non-GAAP) measures contained in this release.
1
| GAAP Results (unaudited) | Non-GAAP Results (unaudited) | |||||||||||||||||||||||||||||||||||||
| Quarter Ended | Period | Quarter Ended | Period | |||||||||||||||||||||||||||||||||||
| August 1, | August 2, | Change | August 1, | August 2, | Change | |||||||||||||||||||||||||||||||||
| 2026 | 2025 | Y-T-Y* | 2026 | 2025 | Y-T-Y* | |||||||||||||||||||||||||||||||||
| Revenue | $ | 1,671.1 | $ | 1,219.4 | 37.0 | % | $ | 1,671.1 | $ | 1,219.4 | 37.0 | % | ||||||||||||||||||||||||||
| Gross margin | 45.4 | % | 41.3 | % | 4.1 | % | 46.4 | % | 41.9 | % | 4.5 | % | ||||||||||||||||||||||||||
| Operating expense | $ | 458.1 | $ | 429.5 | 6.6 | % | $ | 400.0 | $ | 380.2 | 5.2 | % | ||||||||||||||||||||||||||
| Operating margin | 18.0 | % | 6.1 | % | 11.9 | % | 22.5 | % | 10.7 | % | 11.8 | % | ||||||||||||||||||||||||||
| EBITDA | $ | 349.9 | $ | 109.2 | 220.4 | % | $ | 411.1 | $ | 158.0 | 160.2 | % | ||||||||||||||||||||||||||
* Denotes % change, or in the case of margin, absolute change
Business Outlook
Ciena expects fiscal fourth quarter 2026 to include:
•Revenue of $1.75B billion plus or minus $50 million
•Adjusted (non-GAAP) gross margin in the range of 45% plus or minus 50 bps
•Adjusted (non-GAAP) operating expense in the range of $415 million plus or minus $10 million
•Adjusted (non-GAAP) operating margin in the range of 20% plus or minus 50 bps
Statements relating to business outlook are forward-looking in nature and actual results may differ materially. These statements should be read in the context of the "Key assumptions underlying our outlook" in our accompanying Earnings Presentation and each of the "Forward-Looking Statements" and "Reconciliation of Adjusted (Non- GAAP) Measurements" found in the Notes to Investors below.
Financial Highlights for the Fiscal Third Quarter 2026
•Two customers represented 10%-plus of revenue for a total of 41.7% of revenue.
•Average days' sales outstanding (DSOs) were 76.
•Inventory turns were 3.5.
•Repurchased approximately 0.4 million shares of common stock for an aggregate price of $171.7 million under the $1 billion share repurchase program.
2
Financial Performance by Segment
| Revenue by Segment (unaudited) | ||||||||||||||||||||||||||
| Quarter Ended | ||||||||||||||||||||||||||
| August 1, 2026 | August 2, 2025 | |||||||||||||||||||||||||
| Revenue | %** | Revenue | %** | |||||||||||||||||||||||
| Networking Platforms | ||||||||||||||||||||||||||
| Optical Networking | $ | 1,191.3 | 71.3 | $ | 815.5 | 66.9 | ||||||||||||||||||||
| Routing and Switching | 164.4 | 9.8 | 125.9 | 10.3 | ||||||||||||||||||||||
| Total Networking Platforms | 1,355.7 | 81.1 | 941.4 | 77.2 | ||||||||||||||||||||||
| Platform Software and Services | 98.6 | 5.9 | 90.0 | 7.4 | ||||||||||||||||||||||
| Blue Planet Automation Software and Services | 23.2 | 1.4 | 27.8 | 2.3 | ||||||||||||||||||||||
| Global Services | ||||||||||||||||||||||||||
| Maintenance, Support, and Learning | 89.8 | 5.4 | 80.7 | 6.6 | ||||||||||||||||||||||
| Implementation | 87.9 | 5.3 | 65.9 | 5.4 | ||||||||||||||||||||||
| Advisory and Enablement | 15.9 | 0.9 | 13.6 | 1.1 | ||||||||||||||||||||||
| Total Global Services | 193.6 | 11.6 | 160.2 | 13.1 | ||||||||||||||||||||||
| Total | $ | 1,671.1 | 100.0 | $ | 1,219.4 | 100.0 | ||||||||||||||||||||
** Denotes % of total revenue
Supplemental Materials and Live Web Broadcast of Unaudited Fiscal Third Quarter 2026 Results
Today, Thursday, September 3, 2026, in conjunction with this announcement, Ciena has posted to the Quarterly Results page of the Investor Relations section of its website certain related supporting materials for its unaudited fiscal third quarter 2026 results.
Ciena's management will also host a discussion today with investors and financial analysts that will include the Company's outlook. The live audio web broadcast beginning at 8:30 a.m. Eastern will be accessible via www.ciena.com. An archived replay of the live broadcast will be available shortly following its conclusion on the Investor Relations page of Ciena's website.
3
Notes to Investors
Forward-Looking Statements. You are encouraged to review the Investors section of our website, where we routinely post press releases, Securities and Exchange Commission ("SEC") filings, recent news, financial results, supplemental financial information, and other announcements. From time to time we exclusively post material information to this website along with other disclosure channels that we use. This press release contains certain forward-looking statements that involve risks and uncertainties. These statements are based on current expectations, forecasts, assumptions and other information available to the Company as of the date hereof. Forward-looking statements include statements regarding Ciena's expectations, beliefs, intentions or strategies regarding the future and can be identified by forward-looking words such as "anticipate," "believe," "could," "estimate," "expect," "intend," "may," "should," "will," and "would" or similar words. Forward-looking statements in this release include the "Business Outlook" section of this press release and "Today’s outstanding financial performance demonstrates Ciena’s leadership in providing industry-leading, high-speed connectivity solutions as AI continues to drive compounding waves of network investment. As the only pure-play optical systems and interconnects provider, Ciena’s unmatched combination of incumbency, technology innovation, and deep expertise gives us a powerful competitive edge. Our record fiscal third quarter results reflect Ciena’s ability to deliver increasingly profitable growth while positioning for future opportunities. Our expanding supply capacity, strengthening business fundamentals, and increasing operating leverage set the stage to continue to accelerate earnings and deliver long-term value for customers and shareholders.”
Ciena's actual results, performance or events may differ materially from these forward-looking statements made or implied due to a number of risks and uncertainties relating to Ciena's business, including: the effect of broader economic and market conditions on our business and that of our customers, including their spending; the development and use of artificial intelligence and its impact on overall networking technology spending; our ability to execute our business and growth strategies; supply chain constraints or disruptions including increased costs and lead times; the introduction of new technologies by us or our competitors; the timing and size of customer orders, their delivery dates and our ability to fulfill and recognize revenue relating to such sales; the level of competitive pressure we encounter; the product, customer and geographic mix of sales within the period; changes in foreign currency exchange rates; factors beyond our control such as natural disasters, climate change, acts of war or terrorism, geopolitical tensions or events, and public health emergencies, epidemics, or pandemics; changes in tax or trade regulations, including the imposition of tariffs, duties or efforts to withdraw from or materially modify international trade agreements; cyberattacks, data breaches or other security incidents involving our enterprise network environment or our products; regulatory changes, litigation involving our intellectual property or government investigations; and the other risk factors disclosed in Ciena’s periodic reports filed with the Securities and Exchange Commission (SEC) including its Annual Report on Form 10-K filed with the SEC on December 12, 2025 and included in its Quarterly Report on Form 10-Q for the third quarter of fiscal 2026 to be filed with the SEC. Ciena assumes no obligation to update any forward-looking information included in this press release.
4
Non-GAAP Presentation of Quarterly and Annual Results. This release includes non-GAAP measures of Ciena's gross profit, operating expense, income from operations, earnings before interest, tax, depreciation and amortization (EBITDA), Adjusted EBITDA, and measures of net income and net income per share. In evaluating the operating performance of Ciena's business, management excludes certain charges and credits that are required by GAAP. These items share one or more of the following characteristics: they are unusual and Ciena does not expect them to recur in the ordinary course of its business; they do not involve the expenditure of cash; they are unrelated to the ongoing operation of the business in the ordinary course; or their magnitude and timing is largely outside of Ciena's control. Management believes that the non-GAAP measures below provide management and investors useful information and meaningful insight to the operating performance of the business. The presentation of these non-GAAP financial measures should be considered in addition to Ciena's GAAP results and these measures are not intended to be a substitute for the financial information prepared and presented in accordance with GAAP. Ciena's non-GAAP measures and the related adjustments may differ from non-GAAP measures used by other companies and should only be used to evaluate Ciena's results of operations in conjunction with our corresponding GAAP results. To the extent not previously disclosed in a prior Ciena financial results press release, Appendices A and B to this press release set forth a complete GAAP to non-GAAP reconciliation of the non-GAAP measures contained in this release.
With respect to Ciena’s expectations under “Business Outlook” above, Ciena is not able to provide a quantitative reconciliation of the adjusted (non-GAAP) gross margin, adjusted (non-GAAP) operating expense, and adjusted (non-GAAP) operating margin guidance measures to the corresponding gross margin, operating expense, and operating margin GAAP measures without unreasonable efforts. Ciena cannot provide meaningful estimates of the non-recurring charges and credits excluded from these non-GAAP measures due to the forward-looking nature of these estimates and their inherent variability and uncertainty. For the same reasons, Ciena is unable to address the probable significance of the unavailable information.
About Ciena. Ciena is the global leader in high-speed connectivity. We build the world’s most advanced networks to support exponential growth in bandwidth demand. By harnessing the power of our networking systems, interconnects, automation software, and services, Ciena revolutionizes data transmission and network management. With unparalleled expertise and innovation, we empower our customers, partners, and communities to thrive in the AI era. For updates on Ciena, follow us on LinkedIn, X, the Ciena Insights blog, or visit www.ciena.com.
5
CIENA CORPORATION
CONDENSED CONSOLIDATED STATEMENTS OF OPERATIONS
(in thousands, except per share data)
(unaudited)
| Quarter Ended | Nine Months Ended | ||||||||||||||||||||||
| August 1, | August 2, | August 1, | August 2, | ||||||||||||||||||||
| 2026 | 2025 | 2026 | 2025 | ||||||||||||||||||||
| Revenue: | |||||||||||||||||||||||
| Products | $ | 1,390,274 | $ | 976,801 | $ | 3,881,632 | $ | 2,730,167 | |||||||||||||||
| Services | 280,855 | 242,584 | 787,278 | 687,356 | |||||||||||||||||||
| Total revenue | 1,671,129 | 1,219,385 | 4,668,910 | 3,417,523 | |||||||||||||||||||
| Cost of goods sold: | |||||||||||||||||||||||
| Products | 768,661 | 580,028 | 2,171,342 | 1,620,816 | |||||||||||||||||||
| Services | 143,203 | 136,278 | 421,229 | 368,969 | |||||||||||||||||||
| Total cost of goods sold | 911,864 | 716,306 | 2,592,571 | 1,989,785 | |||||||||||||||||||
| Gross profit | 759,265 | 503,079 | 2,076,339 | 1,427,738 | |||||||||||||||||||
| Operating expenses: | |||||||||||||||||||||||
| Research and development | 236,673 | 211,898 | 696,036 | 619,429 | |||||||||||||||||||
| Selling and marketing | 153,969 | 148,724 | 452,875 | 424,911 | |||||||||||||||||||
| General and administrative | 62,844 | 60,596 | 183,308 | 171,450 | |||||||||||||||||||
| Significant asset impairments and restructuring costs | 887 | 1,770 | 3,190 | 5,262 | |||||||||||||||||||
| Amortization of intangible assets | 3,713 | 6,556 | 12,162 | 19,646 | |||||||||||||||||||
| Acquisition and integration costs | — | — | 306 | — | |||||||||||||||||||
| Total operating expenses | 458,086 | 429,544 | 1,347,877 | 1,240,698 | |||||||||||||||||||
| Income from operations | 301,179 | 73,535 | 728,462 | 187,040 | |||||||||||||||||||
| Interest and other income, net | 22,388 | 15,090 | 49,456 | 34,539 | |||||||||||||||||||
| Interest expense | (5,803) | (22,806) | (47,979) | (67,421) | |||||||||||||||||||
| Loss on extinguishment and modification of debt | (7,143) | — | (7,143) | (729) | |||||||||||||||||||
| Income before income taxes | 310,621 | 65,819 | 722,796 | 153,429 | |||||||||||||||||||
| Provision for income taxes | 44,203 | 15,511 | 87,875 | 49,580 | |||||||||||||||||||
| Net income | $ | 266,418 | $ | 50,308 | $ | 634,921 | $ | 103,849 | |||||||||||||||
| Net Income per Common Share | |||||||||||||||||||||||
| Basic net income per common share | $ | 1.88 | $ | 0.35 | $ | 4.46 | $ | 0.73 | |||||||||||||||
| Diluted net income per potential common share | $ | 1.83 | $ | 0.35 | $ | 4.34 | $ | 0.72 | |||||||||||||||
| Weighted average basic common shares outstanding | 142,061 | 141,846 | 142,229 | 142,437 | |||||||||||||||||||
Weighted average dilutive potential common shares outstanding1 | 145,967 | 144,499 | 146,227 | 145,158 | |||||||||||||||||||
1 Weighted average dilutive potential common shares outstanding used in calculating GAAP diluted net income per potential common share includes the following number of shares underlying certain stock option and stock unit awards: (i) 3.9 million and 4.0 million for the third quarter and first nine months ended fiscal 2026, respectively; and (ii) 2.7 million for both the third quarter and first nine months ended fiscal 2025.
6
`CIENA CORPORATION
CONDENSED CONSOLIDATED BALANCE SHEETS
(in thousands, except share data)
(unaudited)
| August 1, | November 1, | ||||||||||
| 2026 | 2025 | ||||||||||
| ASSETS | |||||||||||
| Current assets: | |||||||||||
| Cash and cash equivalents | $ | 2,445,708 | $ | 1,091,952 | |||||||
| Short-term investments | 184,293 | 216,148 | |||||||||
| Accounts receivable, net | 1,233,610 | 975,856 | |||||||||
| Inventories, net | 871,987 | 826,235 | |||||||||
| Prepaid expenses and other | 527,014 | 455,316 | |||||||||
| Total current assets | 5,262,612 | 3,565,507 | |||||||||
| Long-term investments | 213,553 | 57,142 | |||||||||
| Equipment, building, furniture and fixtures, net | 491,656 | 386,779 | |||||||||
| Operating lease right-of-use assets | 45,667 | 38,613 | |||||||||
| Goodwill | 513,340 | 521,204 | |||||||||
| Other intangible assets, net | 188,824 | 224,210 | |||||||||
| Deferred tax asset, net | 1,092,726 | 884,889 | |||||||||
| Other long-term assets | 188,862 | 186,323 | |||||||||
| Total assets | $ | 7,997,240 | $ | 5,864,667 | |||||||
| LIABILITIES AND STOCKHOLDERS’ EQUITY | |||||||||||
| Current liabilities: | |||||||||||
| Accounts payable | $ | 654,070 | $ | 542,841 | |||||||
| Accrued liabilities and other short-term obligations | 508,149 | 531,081 | |||||||||
| Deferred revenue | 211,453 | 208,936 | |||||||||
| Operating lease liabilities | 12,261 | 13,956 | |||||||||
| Current portion of long-term debt | — | 11,580 | |||||||||
| Total current liabilities | 1,385,933 | 1,308,394 | |||||||||
| Long-term deferred revenue | 99,828 | 94,850 | |||||||||
| Other long-term obligations | 186,265 | 175,426 | |||||||||
| Long-term operating lease liabilities | 38,633 | 32,516 | |||||||||
| Long-term debt, net | 3,229,843 | 1,524,158 | |||||||||
| Total liabilities | 4,940,502 | 3,135,344 | |||||||||
| Stockholders’ equity: | |||||||||||
Preferred stock – par value $0.01; 20,000,000 shares authorized; zero shares issued and outstanding | — | — | |||||||||
Common stock – par value $0.01; 290,000,000 shares authorized; 141,897,511 and 141,016,300 shares issued and outstanding | 1,419 | 1,410 | |||||||||
| Additional paid-in capital | 5,655,535 | 5,953,057 | |||||||||
| Accumulated other comprehensive loss | (65,028) | (55,035) | |||||||||
| Accumulated deficit | (2,535,188) | (3,170,109) | |||||||||
| Total stockholders’ equity | 3,056,738 | 2,729,323 | |||||||||
| Total liabilities and stockholders’ equity | $ | 7,997,240 | $ | 5,864,667 | |||||||
7
CIENA CORPORATION
CONDENSED CONSOLIDATED STATEMENTS OF CASH FLOWS
(in thousands)
(unaudited)
| Nine Months Ended | |||||||||||
| August 1, | August 2, | ||||||||||
| 2026 | 2025 | ||||||||||
| Cash flows provided by operating activities: | |||||||||||
| Net income | $ | 634,921 | $ | 103,849 | |||||||
| Adjustments to reconcile net income to net cash provided by operating activities: | |||||||||||
| Loss on extinguishment of debt | 7,143 | 159 | |||||||||
| Depreciation of equipment, building, furniture and fixtures, and amortization of leasehold improvements | 102,347 | 76,637 | |||||||||
| Share-based compensation expense | 163,178 | 135,696 | |||||||||
| Amortization of intangible assets | 35,386 | 26,343 | |||||||||
| Deferred taxes | 49,266 | (21,709) | |||||||||
| Provision for inventory excess and obsolescence | 72,428 | 34,185 | |||||||||
| Provision for warranty | 30,050 | 16,302 | |||||||||
| Other | (724) | (1,997) | |||||||||
| Changes in assets and liabilities: | |||||||||||
| Accounts receivable | (251,531) | (116,887) | |||||||||
| Inventories | (118,334) | (73,493) | |||||||||
| Prepaid expenses and other | (111,567) | 137,440 | |||||||||
| Operating lease right-of-use assets | 7,956 | 8,759 | |||||||||
| Accounts payable, accruals and other obligations | 66,956 | 83,354 | |||||||||
| Deferred revenue | 6,764 | 38,246 | |||||||||
| Short and long-term operating lease liabilities | (10,633) | (11,868) | |||||||||
| Net cash provided by operating activities | 683,606 | 435,016 | |||||||||
| Cash flows used in investing activities: | |||||||||||
| Payments for equipment, furniture, and fixtures | (194,893) | (95,373) | |||||||||
| Purchases of investments | (325,629) | (191,335) | |||||||||
| Proceeds from sales and maturities of investments | 203,097 | 261,611 | |||||||||
| Settlement of foreign currency forward contracts, net | 2,259 | (2,635) | |||||||||
| Net cash used in investing activities | (315,166) | (27,732) | |||||||||
| Cash flows provided by (used in) financing activities: | |||||||||||
| Proceeds for modification of debt, net | — | 19,175 | |||||||||
| Cash paid for extinguishment of debt | (1,140,930) | (19,175) | |||||||||
| Payment of long term debt | (5,790) | (8,685) | |||||||||
| Payment for convertible bond hedge | (988,425) | — | |||||||||
| Proceeds from sale of warrants | 873,425 | — | |||||||||
| Proceeds from issuance of convertible notes | 2,875,000 | — | |||||||||
| Payment of debt issuance costs | (43,622) | (12) | |||||||||
| Payment of finance lease obligations | (3,572) | (3,244) | |||||||||
| Shares repurchased for tax withholdings on vesting of stock unit awards | (278,338) | (60,043) | |||||||||
| Repurchases of common stock - repurchase program, net | (337,914) | (250,035) | |||||||||
| Proceeds from issuance of common stock | 38,025 | 35,874 | |||||||||
| Net cash provided by (used in) financing activities | 987,859 | (286,145) | |||||||||
| Effect of exchange rate changes on cash, cash equivalents and restricted cash | (2,554) | 60 | |||||||||
| Net increase in cash, cash equivalents and restricted cash | 1,353,745 | 121,199 | |||||||||
| Cash, cash equivalents and restricted cash at beginning of period | 1,092,197 | 935,026 | |||||||||
| Cash, cash equivalents and restricted cash at end of period | $ | 2,445,942 | $ | 1,056,225 | |||||||
| Supplemental disclosure of cash flow information | |||||||||||
| Cash paid during the period for interest, net | $ | 58,712 | $ | 68,243 | |||||||
| Cash paid during the period for income taxes, net | $ | 84,583 | $ | 84,898 | |||||||
| Operating lease payments | $ | 12,383 | $ | 13,246 | |||||||
| Non-cash investing and financing activities | |||||||||||
| Purchase of equipment in accounts payable | $ | 24,987 | $ | 14,819 | |||||||
| Repurchase of common stock in accrued liabilities from repurchase program, net | $ | — | $ | 2,231 | |||||||
| Operating right-of-use assets subject to lease liability | $ | 16,144 | $ | 21,850 | |||||||
8
| APPENDIX A - Reconciliation of Adjusted (Non- GAAP) Measurements | ||||||||||||||
| (in thousands, except per share data) (unaudited) | ||||||||||||||
| Quarter Ended | ||||||||||||||
| August 1, | August 2, | |||||||||||||
| 2026 | 2025 | |||||||||||||
| Gross Profit Reconciliation (GAAP/non-GAAP) | ||||||||||||||
| GAAP gross profit | $ | 759,265 | $ | 503,079 | ||||||||||
| Share-based compensation-products | 2,175 | 2,027 | ||||||||||||
| Share-based compensation-services | 4,666 | 3,942 | ||||||||||||
| Amortization of intangible assets | 9,652 | 2,232 | ||||||||||||
| Total adjustments related to gross profit | 16,493 | 8,201 | ||||||||||||
| Adjusted (non-GAAP) gross profit | $ | 775,758 | $ | 511,280 | ||||||||||
| Adjusted (non-GAAP) gross profit percentage | 46.4 | % | 41.9 | % | ||||||||||
| Operating Expense Reconciliation (GAAP/non-GAAP) | ||||||||||||||
| GAAP operating expense | $ | 458,086 | $ | 429,544 | ||||||||||
| Share-based compensation-research and development | 20,173 | 16,749 | ||||||||||||
| Share-based compensation-sales and marketing | 16,623 | 13,277 | ||||||||||||
| Share-based compensation-general and administrative | 14,241 | 11,008 | ||||||||||||
| Significant asset impairments and restructuring costs | 887 | 1,770 | ||||||||||||
| Amortization of intangible assets | 3,713 | 6,556 | ||||||||||||
| Holdback arrangement | 2,419 | — | ||||||||||||
| Total adjustments related to operating expense | 58,056 | 49,360 | ||||||||||||
| Adjusted (non-GAAP) operating expense | $ | 400,030 | $ | 380,184 | ||||||||||
| Income from Operations Reconciliation (GAAP/non-GAAP) | ||||||||||||||
| GAAP income from operations | $ | 301,179 | $ | 73,535 | ||||||||||
| Total adjustments related to gross profit | 16,493 | 8,201 | ||||||||||||
| Total adjustments related to operating expense | 58,056 | 49,360 | ||||||||||||
| Total adjustments related to income from operations | 74,549 | 57,561 | ||||||||||||
| Adjusted (non-GAAP) income from operations | $ | 375,728 | $ | 131,096 | ||||||||||
| Adjusted (non-GAAP) operating margin percentage | 22.5 | % | 10.7 | % | ||||||||||
| Net Income Reconciliation (GAAP/non-GAAP) | ||||||||||||||
| GAAP net income | $ | 266,418 | $ | 50,308 | ||||||||||
| Exclude GAAP provision for income taxes | 44,203 | 15,511 | ||||||||||||
| Income before income taxes | 310,621 | 65,819 | ||||||||||||
| Total adjustments related to income from operations | 74,549 | 57,561 | ||||||||||||
| Loss on extinguishment of debt | 7,143 | — | ||||||||||||
| Gain on early termination of interest rate swaps | (7,720) | — | ||||||||||||
| Adjusted income before income taxes | 384,593 | 123,380 | ||||||||||||
| Non-GAAP tax provision on adjusted income before income taxes | 76,919 | 27,144 | ||||||||||||
| Adjusted (non-GAAP) net income | $ | 307,674 | $ | 96,236 | ||||||||||
| Weighted average basic common shares outstanding | 142,061 | 141,846 | ||||||||||||
Weighted average dilutive potential common shares outstanding 1 | 145,967 | 144,499 | ||||||||||||
| Net Income per Common Share | ||||||||||||||
| GAAP diluted net income per potential common share | $ | 1.83 | $ | 0.35 | ||||||||||
| Adjusted (non-GAAP) diluted net income per potential common share | $ | 2.11 | $ | 0.67 | ||||||||||
1 Weighted average dilutive potential common shares outstanding used in calculating Adjusted (non-GAAP) diluted net income per potential common share includes the following number of shares underlying certain stock option and stock unit awards: (i) 3.9 million for the third quarter ended fiscal 2026; and (ii) 2.7 million for the third quarter ended fiscal 2025.
9
| APPENDIX B - Calculation of EBITDA and Adjusted EBITDA | ||||||||||||||
| (in thousands) (unaudited) | ||||||||||||||
| Quarter Ended | ||||||||||||||
| August 1, | August 2, | |||||||||||||
| 2026 | 2025 | |||||||||||||
| Earnings Before Interest, Tax, Depreciation and Amortization (EBITDA) | ||||||||||||||
| Net income (GAAP) | $ | 266,418 | $ | 50,308 | ||||||||||
| Add: Interest expense | 5,803 | 22,806 | ||||||||||||
| Less: Interest and other income, net | 22,388 | 15,090 | ||||||||||||
| Add: Loss on extinguishment of debt | 7,143 | — | ||||||||||||
| Add: Provision for income taxes | 44,203 | 15,511 | ||||||||||||
| Add: Depreciation of equipment, building, furniture and fixtures, and amortization of leasehold improvements | 35,326 | 26,866 | ||||||||||||
| Add: Amortization of intangible assets | 13,365 | 8,788 | ||||||||||||
| EBITDA | $ | 349,870 | $ | 109,189 | ||||||||||
| Add: Share-based compensation expense | 57,878 | 47,003 | ||||||||||||
| Add: Significant asset impairments and restructuring costs | 887 | 1,770 | ||||||||||||
| Add: Holdback arrangement | 2,419 | — | ||||||||||||
| Adjusted EBITDA | $ | 411,054 | $ | 157,962 | ||||||||||
* * *
The adjusted (non-GAAP) measures above and their reconciliation to Ciena's GAAP results for the periods presented reflect adjustments relating to the following items:
•Share-based compensation - a non-cash expense incurred in accordance with share-based compensation accounting guidance.
•Significant asset impairments and restructuring costs - non-recurring costs primarily reflecting expenses associated with actions Ciena has taken to restructure our business, including reductions in force, facility optimization, and the redesign of business processes.
•Amortization of intangible assets - a non-cash expense arising from the acquisition of intangible assets, principally developed technologies and customer-related intangibles, that Ciena is required to amortize over an expected useful life.
•Holdback arrangement - reflects a one-time holdback of a portion of the merger consideration otherwise payable at closing to certain key employee shareholders of Nubis Communications, Inc. who became employees of Ciena, which is treated as contingent compensation for GAAP reporting purposes. These transaction-related amounts are not part of Ciena's standard compensation and benefits.
•Loss on extinguishment of debt - reflects extinguishment expenses related to repayment of Ciena's term loan in connection with Ciena's convertible notes offering during the third quarter of fiscal 2026.
•Gain on early termination of swaps - reflects the market value at settlement of Ciena's interest rate swaps designated as cash flow hedges which were terminated in parallel with the repayment of our refinanced 2030 term loan during the third quarter of fiscal 2026.
•Non-GAAP tax provision - consists of current and deferred income tax expense commensurate with the level of adjusted income before income taxes and utilizes a current, blended U.S. and foreign statutory annual tax rate of 20% for the third quarter of fiscal 2026 and 22% for the third quarter of fiscal 2025. This rate may be subject to change in the future, including as a result of changes in tax policy or tax strategy.
10
© Ciena Corporation 2026. All rights reserved. Proprietary Information. Ciena Corporation Fiscal Q3 2026 Earnings Presentation Period ended August 1, 2026 September 3, 2026
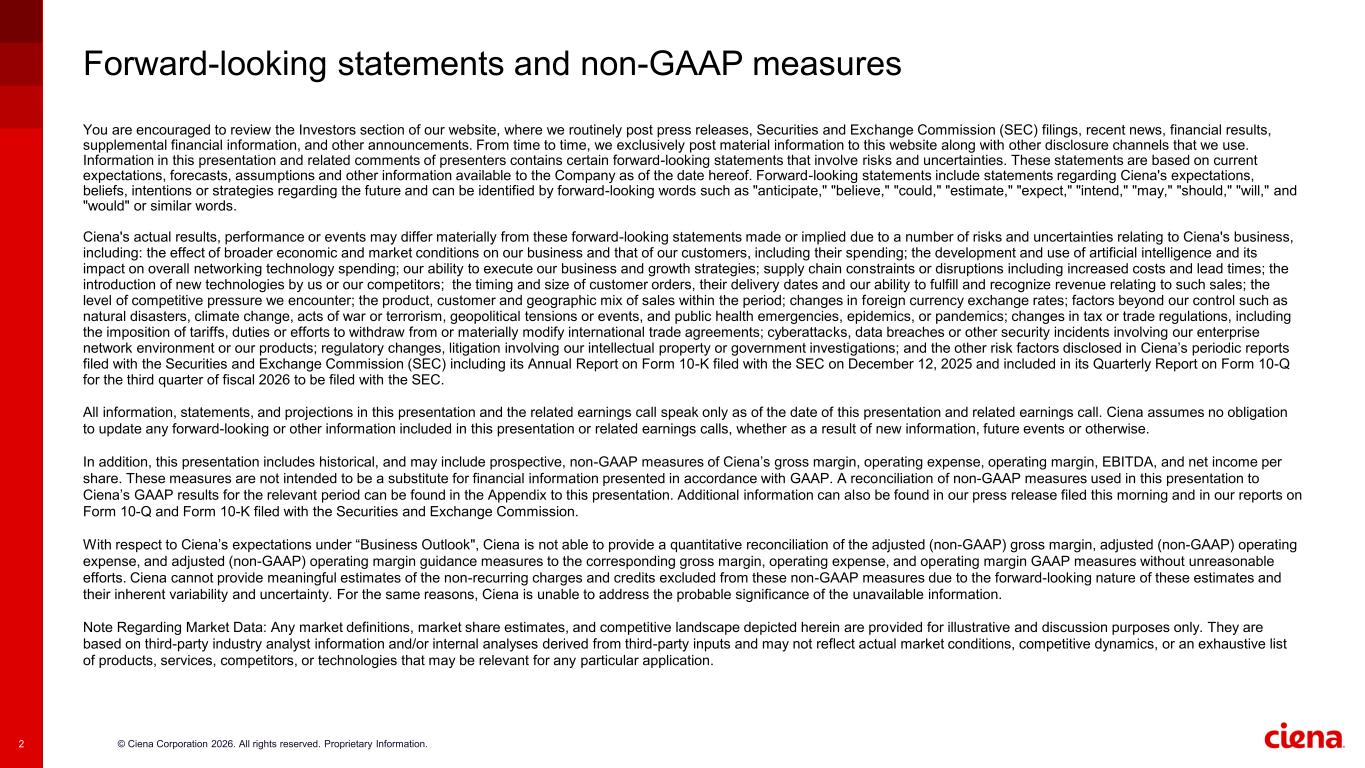
© Ciena Corporation 2026. All rights reserved. Proprietary Information.2 Forward-looking statements and non-GAAP measures You are encouraged to review the Investors section of our website, where we routinely post press releases, Securities and Exchange Commission (SEC) filings, recent news, financial results, supplemental financial information, and other announcements. From time to time, we exclusively post material information to this website along with other disclosure channels that we use. Information in this presentation and related comments of presenters contains certain forward-looking statements that involve risks and uncertainties. These statements are based on current expectations, forecasts, assumptions and other information available to the Company as of the date hereof. Forward-looking statements include statements regarding Ciena's expectations, beliefs, intentions or strategies regarding the future and can be identified by forward-looking words such as "anticipate," "believe," "could," "estimate," "expect," "intend," "may," "should," "will," and "would" or similar words. Ciena's actual results, performance or events may differ materially from these forward-looking statements made or implied due to a number of risks and uncertainties relating to Ciena's business, including: the effect of broader economic and market conditions on our business and that of our customers, including their spending; the development and use of artificial intelligence and its impact on overall networking technology spending; our ability to execute our business and growth strategies; supply chain constraints or disruptions including increased costs and lead times; the introduction of new technologies by us or our competitors; the timing and size of customer orders, their delivery dates and our ability to fulfill and recognize revenue relating to such sales; the level of competitive pressure we encounter; the product, customer and geographic mix of sales within the period; changes in foreign currency exchange rates; factors beyond our control such as natural disasters, climate change, acts of war or terrorism, geopolitical tensions or events, and public health emergencies, epidemics, or pandemics; changes in tax or trade regulations, including the imposition of tariffs, duties or efforts to withdraw from or materially modify international trade agreements; cyberattacks, data breaches or other security incidents involving our enterprise network environment or our products; regulatory changes, litigation involving our intellectual property or government investigations; and the other risk factors disclosed in Ciena’s periodic reports filed with the Securities and Exchange Commission (SEC) including its Annual Report on Form 10-K filed with the SEC on December 12, 2025 and included in its Quarterly Report on Form 10-Q for the third quarter of fiscal 2026 to be filed with the SEC. All information, statements, and projections in this presentation and the related earnings call speak only as of the date of this presentation and related earnings call. Ciena assumes no obligation to update any forward-looking or other information included in this presentation or related earnings calls, whether as a result of new information, future events or otherwise. In addition, this presentation includes historical, and may include prospective, non-GAAP measures of Ciena’s gross margin, operating expense, operating margin, EBITDA, and net income per share. These measures are not intended to be a substitute for financial information presented in accordance with GAAP. A reconciliation of non-GAAP measures used in this presentation to Ciena’s GAAP results for the relevant period can be found in the Appendix to this presentation. Additional information can also be found in our press release filed this morning and in our reports on Form 10-Q and Form 10-K filed with the Securities and Exchange Commission. With respect to Ciena’s expectations under “Business Outlook", Ciena is not able to provide a quantitative reconciliation of the adjusted (non-GAAP) gross margin, adjusted (non-GAAP) operating expense, and adjusted (non-GAAP) operating margin guidance measures to the corresponding gross margin, operating expense, and operating margin GAAP measures without unreasonable efforts. Ciena cannot provide meaningful estimates of the non-recurring charges and credits excluded from these non-GAAP measures due to the forward-looking nature of these estimates and their inherent variability and uncertainty. For the same reasons, Ciena is unable to address the probable significance of the unavailable information. Note Regarding Market Data: Any market definitions, market share estimates, and competitive landscape depicted herein are provided for illustrative and discussion purposes only. They are based on third-party industry analyst information and/or internal analyses derived from third-party inputs and may not reflect actual market conditions, competitive dynamics, or an exhaustive list of products, services, competitors, or technologies that may be relevant for any particular application.
© Ciena Corporation 2026. All rights reserved. Proprietary Information.3 Table of Contents 1. Introduction to Ciena 2. Fiscal Q3 2026 financial performance 3. Fiscal Q4 2026 outlook and full-year 2027 preliminary outlook 4. Appendix
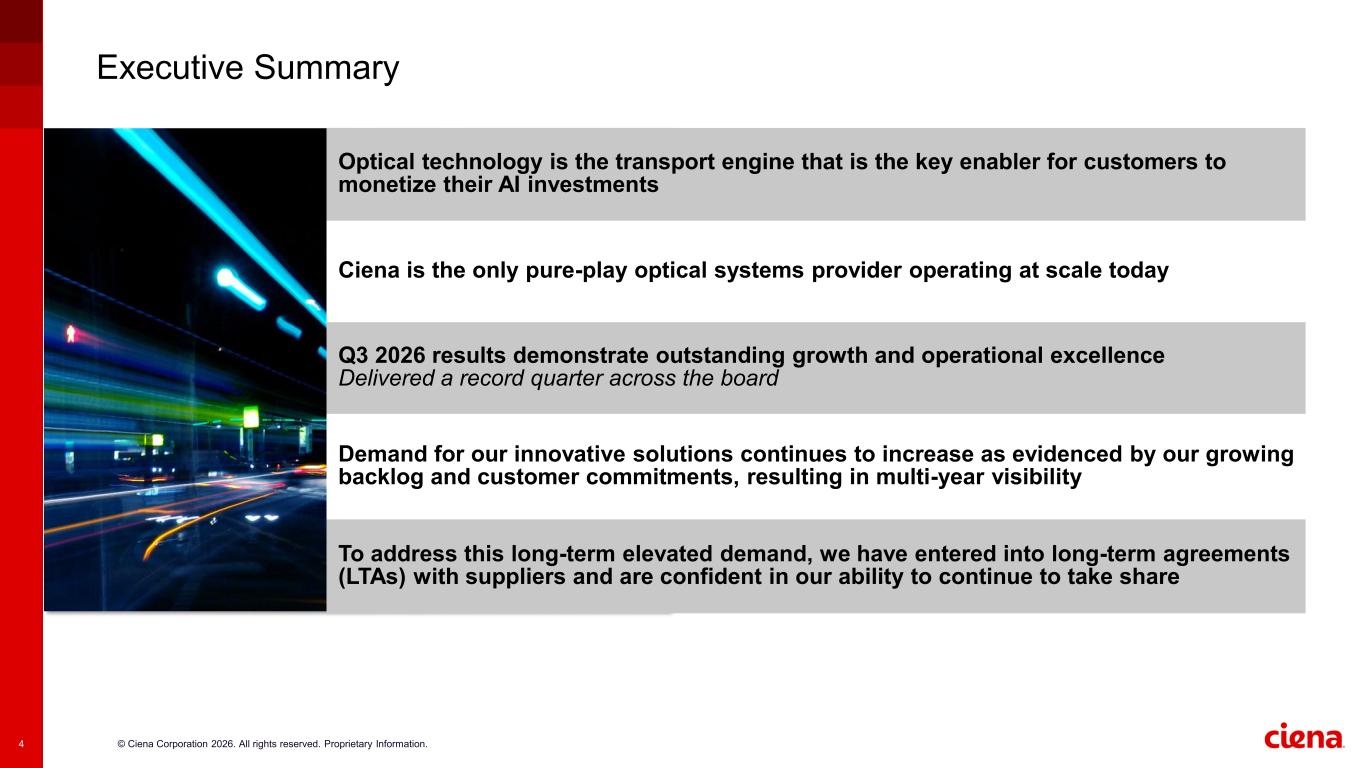
© Ciena Corporation 2026. All rights reserved. Proprietary Information.4 Executive Summary Optical technology is the transport engine that is the key enabler for customers to monetize their AI investments Ciena is the only pure-play optical systems provider operating at scale today Q3 2026 results demonstrate outstanding growth and operational excellence Delivered a record quarter across the board Demand for our innovative solutions continues to increase as evidenced by our growing backlog and customer commitments, resulting in multi-year visibility To address this long-term elevated demand, we have entered into long-term agreements (LTAs) with suppliers and are confident in our ability to continue to take share

© Ciena Corporation 2026. All rights reserved. Proprietary Information. Introduction to Ciena
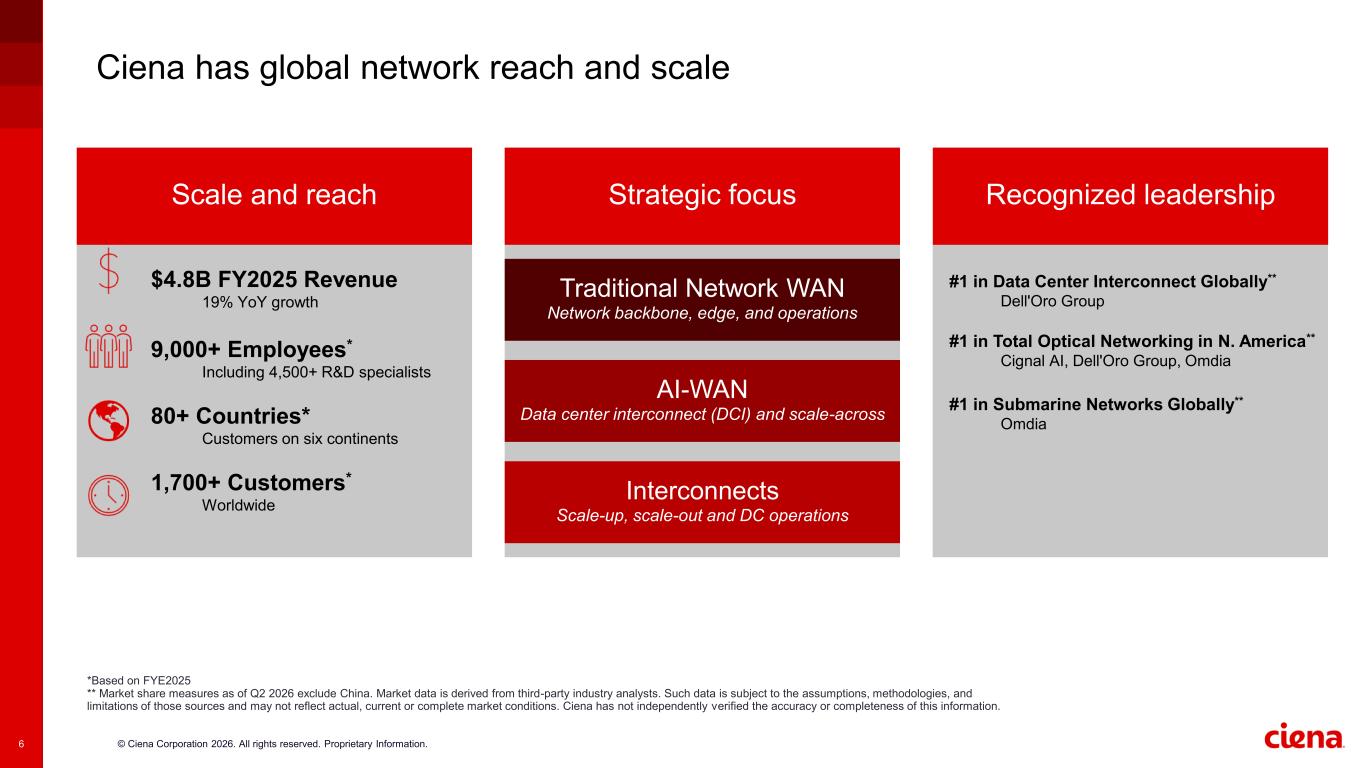
© Ciena Corporation 2026. All rights reserved. Proprietary Information.6 Ciena has global network reach and scale *Based on FYE2025 ** Market share measures as of Q2 2026 exclude China. Market data is derived from third-party industry analysts. Such data is subject to the assumptions, methodologies, and limitations of those sources and may not reflect actual, current or complete market conditions. Ciena has not independently verified the accuracy or completeness of this information. Scale and reach Recognized leadershipStrategic focus $4.8B FY2025 Revenue 19% YoY growth 9,000+ Employees* Including 4,500+ R&D specialists 80+ Countries* Customers on six continents 1,700+ Customers* Worldwide #1 in Data Center Interconnect Globally** Dell'Oro Group #1 in Total Optical Networking in N. America** Cignal AI, Dell'Oro Group, Omdia #1 in Submarine Networks Globally** Omdia Traditional Network WAN Network backbone, edge, and operations AI-WAN Data center interconnect (DCI) and scale-across Interconnects Scale-up, scale-out and DC operations
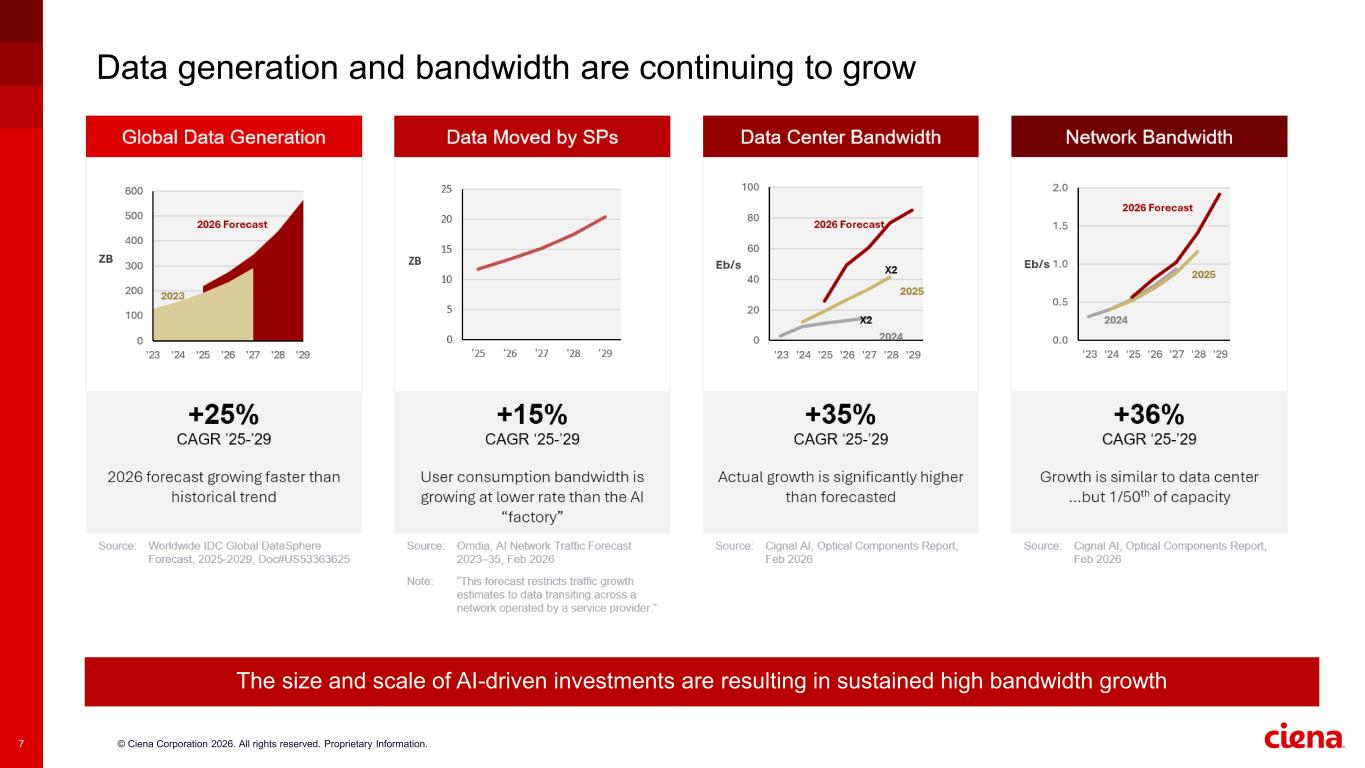
© Ciena Corporation 2026. All rights reserved. Proprietary Information.7 Data generation and bandwidth are continuing to grow The size and scale of AI-driven investments are resulting in sustained high bandwidth growth
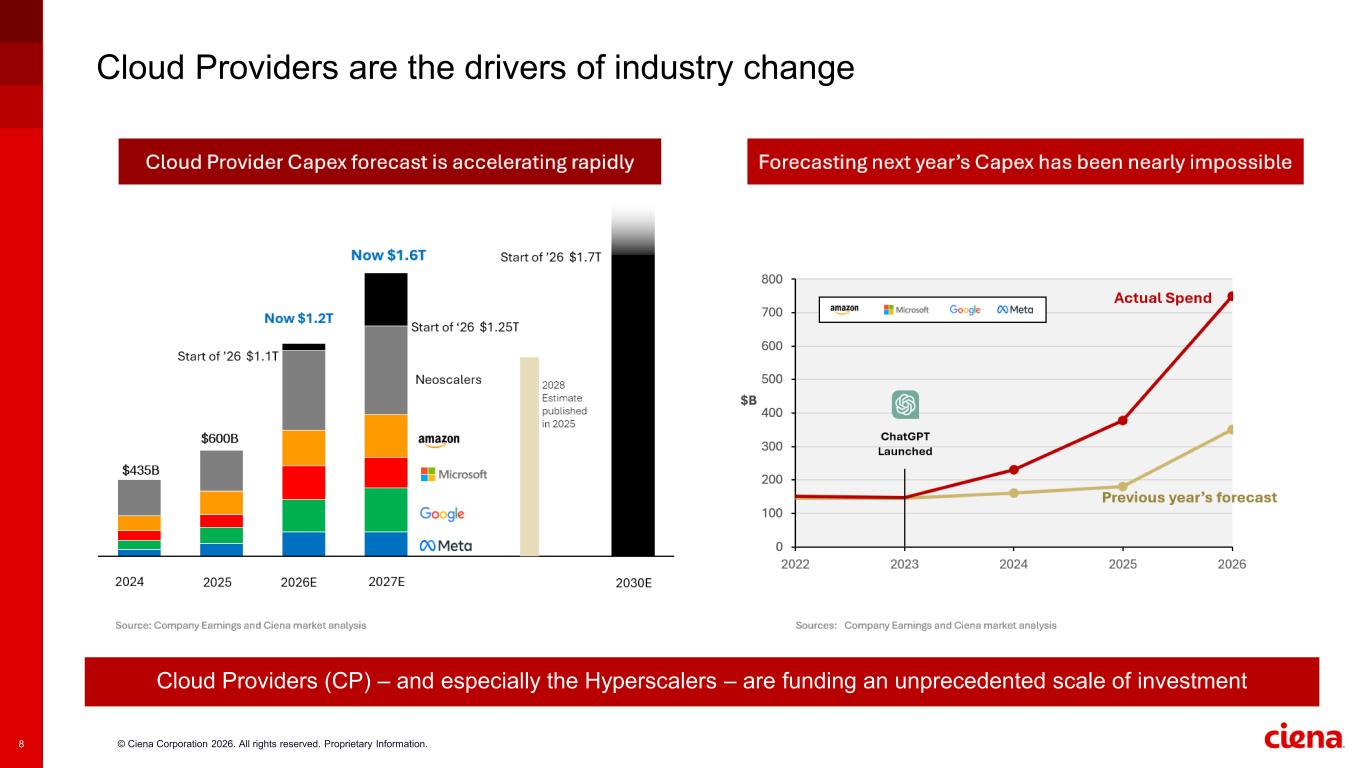
© Ciena Corporation 2026. All rights reserved. Proprietary Information.8 Cloud Providers are the drivers of industry change Cloud Providers (CP) – and especially the Hyperscalers – are funding an unprecedented scale of investment

© Ciena Corporation 2026. All rights reserved. Proprietary Information. Q3 FY 2026 results
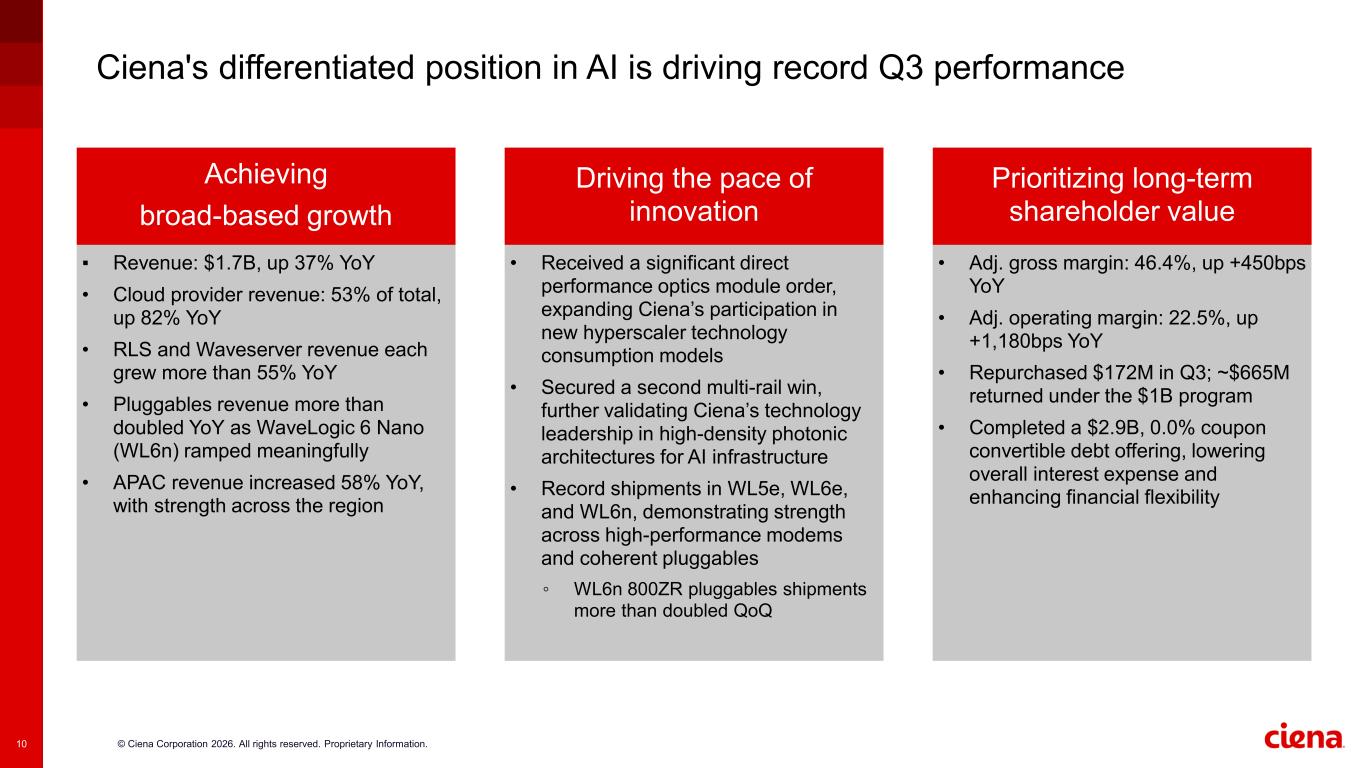
© Ciena Corporation 2026. All rights reserved. Proprietary Information.10 Ciena's differentiated position in AI is driving record Q3 performance ▪ Revenue: $1.7B, up 37% YoY • Cloud provider revenue: 53% of total, up 82% YoY • RLS and Waveserver revenue each grew more than 55% YoY • Pluggables revenue more than doubled YoY as WaveLogic 6 Nano (WL6n) ramped meaningfully • APAC revenue increased 58% YoY, with strength across the region • Received a significant direct performance optics module order, expanding Ciena’s participation in new hyperscaler technology consumption models • Secured a second multi-rail win, further validating Ciena’s technology leadership in high-density photonic architectures for AI infrastructure • Record shipments in WL5e, WL6e, and WL6n, demonstrating strength across high-performance modems and coherent pluggables ◦ WL6n 800ZR pluggables shipments more than doubled QoQ • Adj. gross margin: 46.4%, up +450bps YoY • Adj. operating margin: 22.5%, up +1,180bps YoY • Repurchased $172M in Q3; ~$665M returned under the $1B program • Completed a $2.9B, 0.0% coupon convertible debt offering, lowering overall interest expense and enhancing financial flexibility Achieving broad-based growth Prioritizing long-term shareholder value Driving the pace of innovation
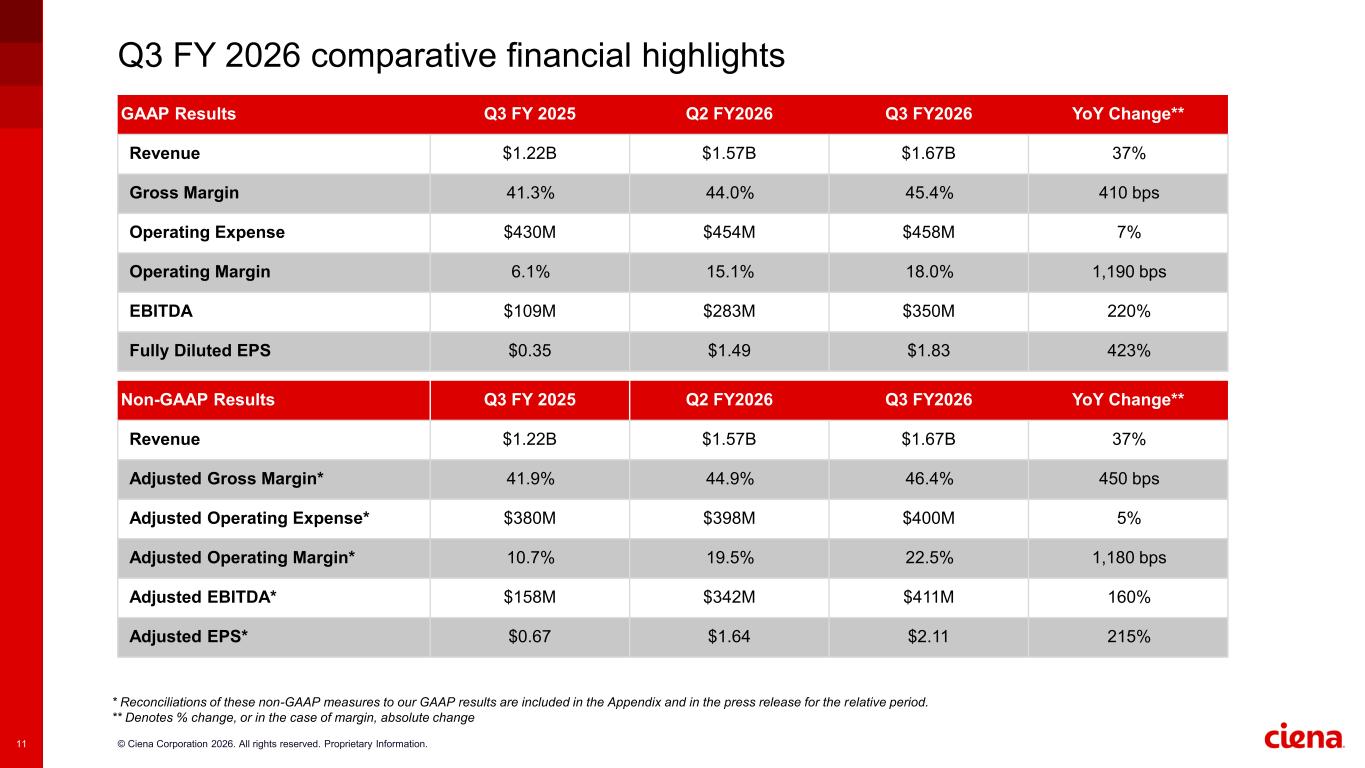
© Ciena Corporation 2026. All rights reserved. Proprietary Information.11 Q3 FY 2026 comparative financial highlights * Reconciliations of these non-GAAP measures to our GAAP results are included in the Appendix and in the press release for the relative period. ** Denotes % change, or in the case of margin, absolute change GAAP Results Q3 FY 2025 Q2 FY2026 Q3 FY2026 YoY Change** Revenue $1.22B $1.57B $1.67B 37% Gross Margin 41.3% 44.0% 45.4% 410 bps Operating Expense $430M $454M $458M 7% Operating Margin 6.1% 15.1% 18.0% 1,190 bps EBITDA $109M $283M $350M 220% Fully Diluted EPS $0.35 $1.49 $1.83 423% Non-GAAP Results Q3 FY 2025 Q2 FY2026 Q3 FY2026 YoY Change** Revenue $1.22B $1.57B $1.67B 37% Adjusted Gross Margin* 41.9% 44.9% 46.4% 450 bps Adjusted Operating Expense* $380M $398M $400M 5% Adjusted Operating Margin* 10.7% 19.5% 22.5% 1,180 bps Adjusted EBITDA* $158M $342M $411M 160% Adjusted EPS* $0.67 $1.64 $2.11 215%
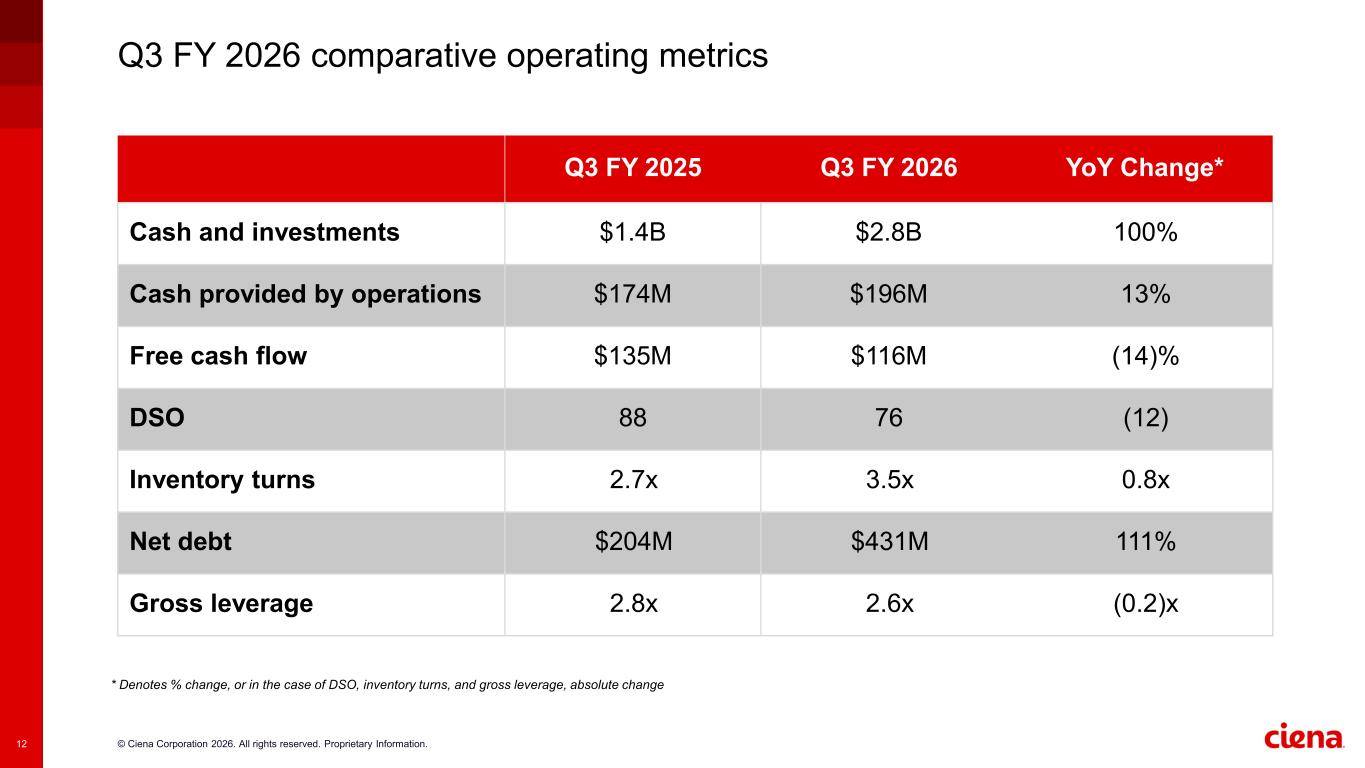
© Ciena Corporation 2026. All rights reserved. Proprietary Information.12 Q3 FY 2026 comparative operating metrics Q3 FY 2025 Q3 FY 2026 YoY Change* Cash and investments $1.4B $2.8B 100% Cash provided by operations $174M $196M 13% Free cash flow $135M $116M (14)% DSO 88 76 (12) Inventory turns 2.7x 3.5x 0.8x Net debt $204M $431M 111% Gross leverage 2.8x 2.6x (0.2)x * Denotes % change, or in the case of DSO, inventory turns, and gross leverage, absolute change

© Ciena Corporation 2026. All rights reserved. Proprietary Information. Business outlook
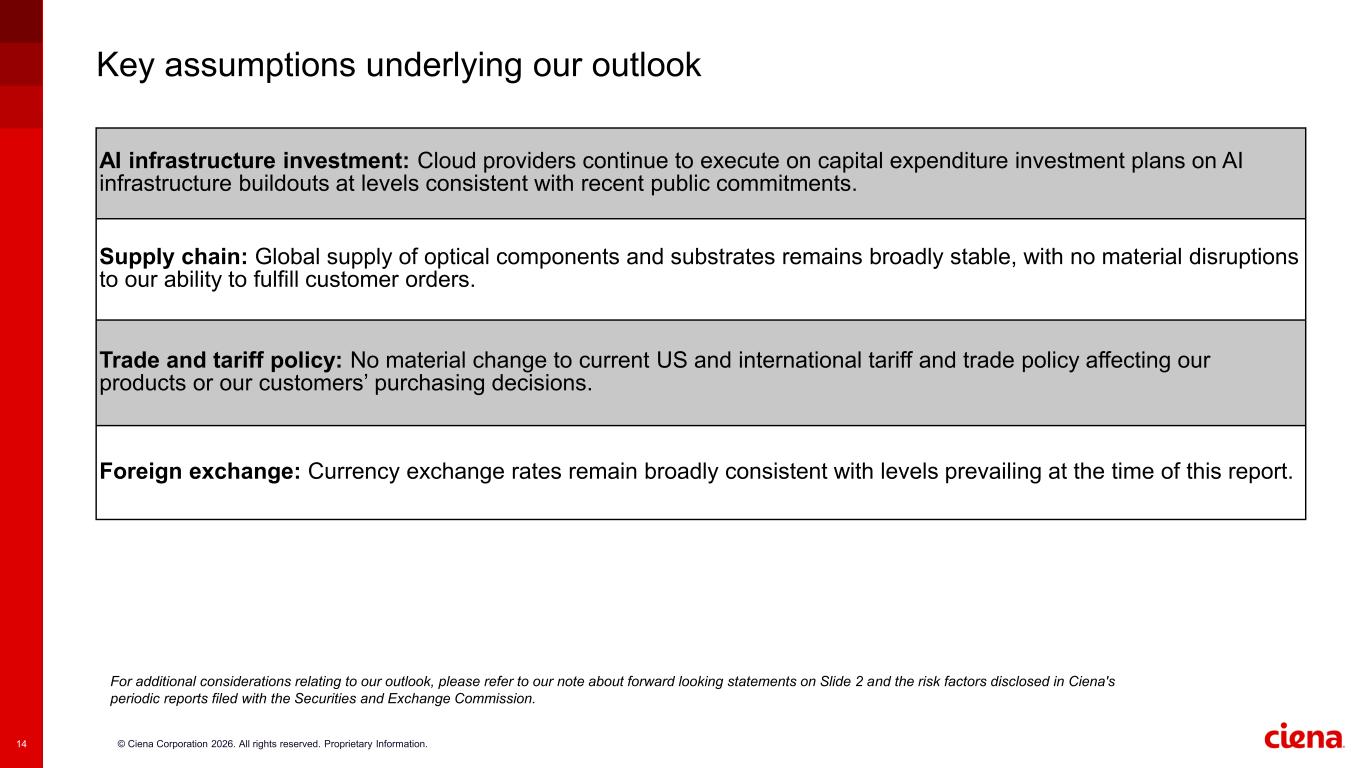
© Ciena Corporation 2026. All rights reserved. Proprietary Information.14 Key assumptions underlying our outlook AI infrastructure investment: Cloud providers continue to execute on capital expenditure investment plans on AI infrastructure buildouts at levels consistent with recent public commitments. Supply chain: Global supply of optical components and substrates remains broadly stable, with no material disruptions to our ability to fulfill customer orders. Trade and tariff policy: No material change to current US and international tariff and trade policy affecting our products or our customers’ purchasing decisions. Foreign exchange: Currency exchange rates remain broadly consistent with levels prevailing at the time of this report. For additional considerations relating to our outlook, please refer to our note about forward looking statements on Slide 2 and the risk factors disclosed in Ciena's periodic reports filed with the Securities and Exchange Commission.
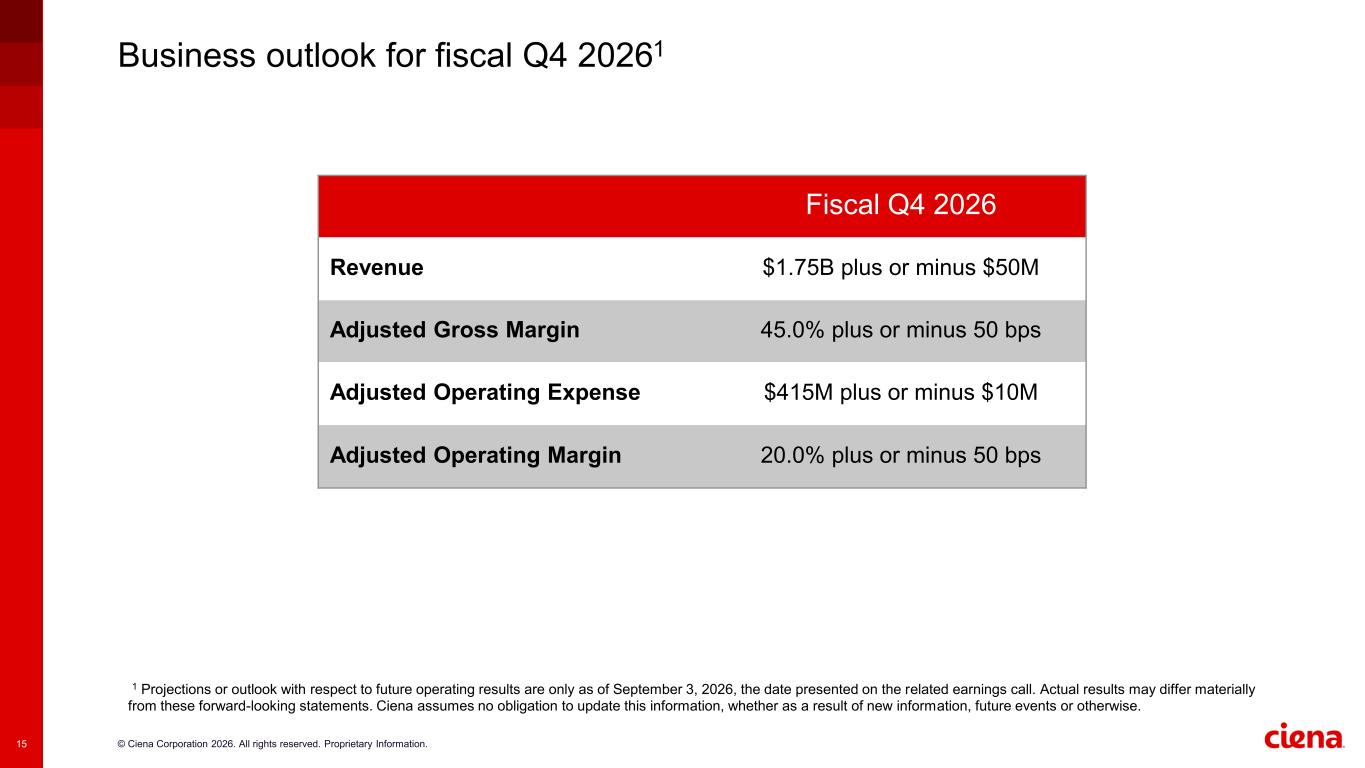
© Ciena Corporation 2026. All rights reserved. Proprietary Information.15 Business outlook for fiscal Q4 20261 1 Projections or outlook with respect to future operating results are only as of September 3, 2026, the date presented on the related earnings call. Actual results may differ materially from these forward-looking statements. Ciena assumes no obligation to update this information, whether as a result of new information, future events or otherwise. Fiscal Q4 2026 Revenue $1.75B plus or minus $50M Adjusted Gross Margin 45.0% plus or minus 50 bps Adjusted Operating Expense $415M plus or minus $10M Adjusted Operating Margin 20.0% plus or minus 50 bps
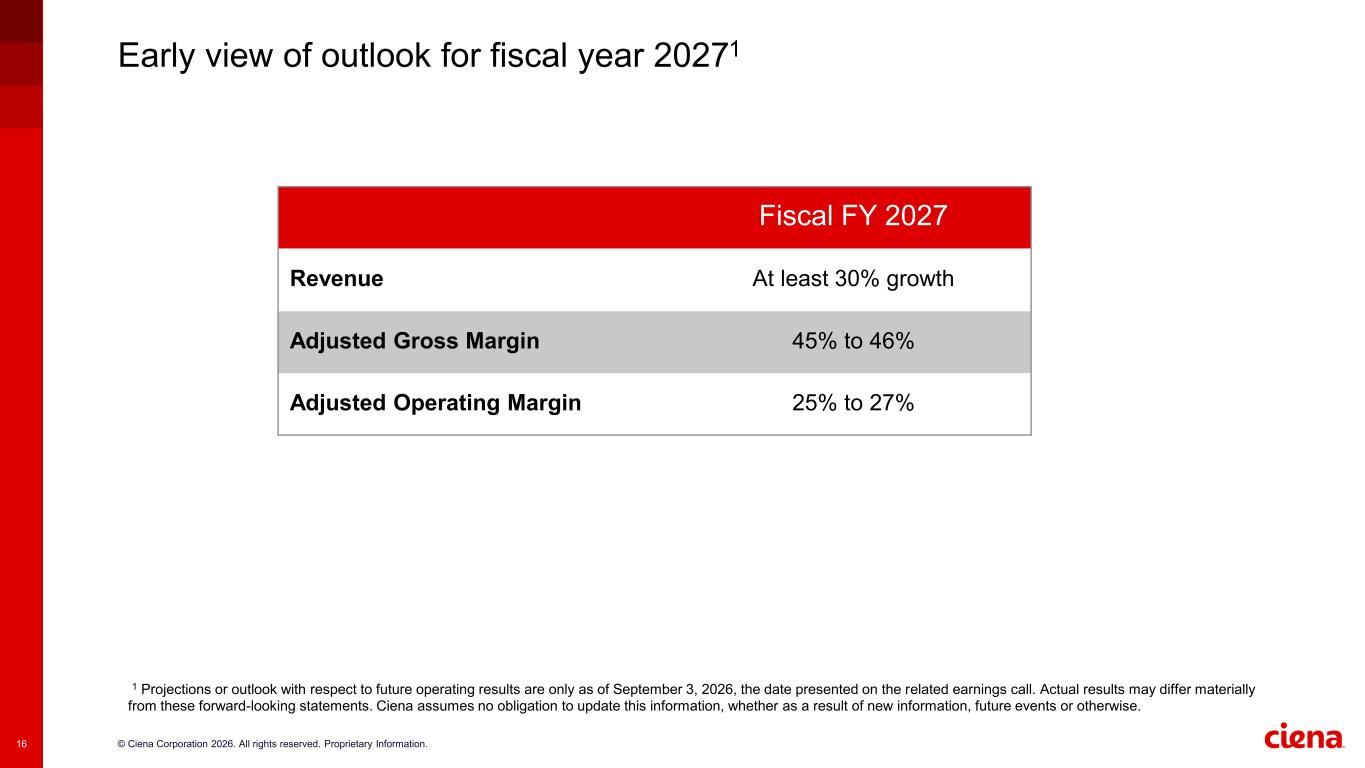
© Ciena Corporation 2026. All rights reserved. Proprietary Information.16 Early view of outlook for fiscal year 20271 1 Projections or outlook with respect to future operating results are only as of September 3, 2026, the date presented on the related earnings call. Actual results may differ materially from these forward-looking statements. Ciena assumes no obligation to update this information, whether as a result of new information, future events or otherwise. Fiscal FY 2027 Revenue At least 30% growth Adjusted Gross Margin 45% to 46% Adjusted Operating Margin 25% to 27%

© Ciena Corporation 2026. All rights reserved. Proprietary Information. Q3 FY 2026 appendix
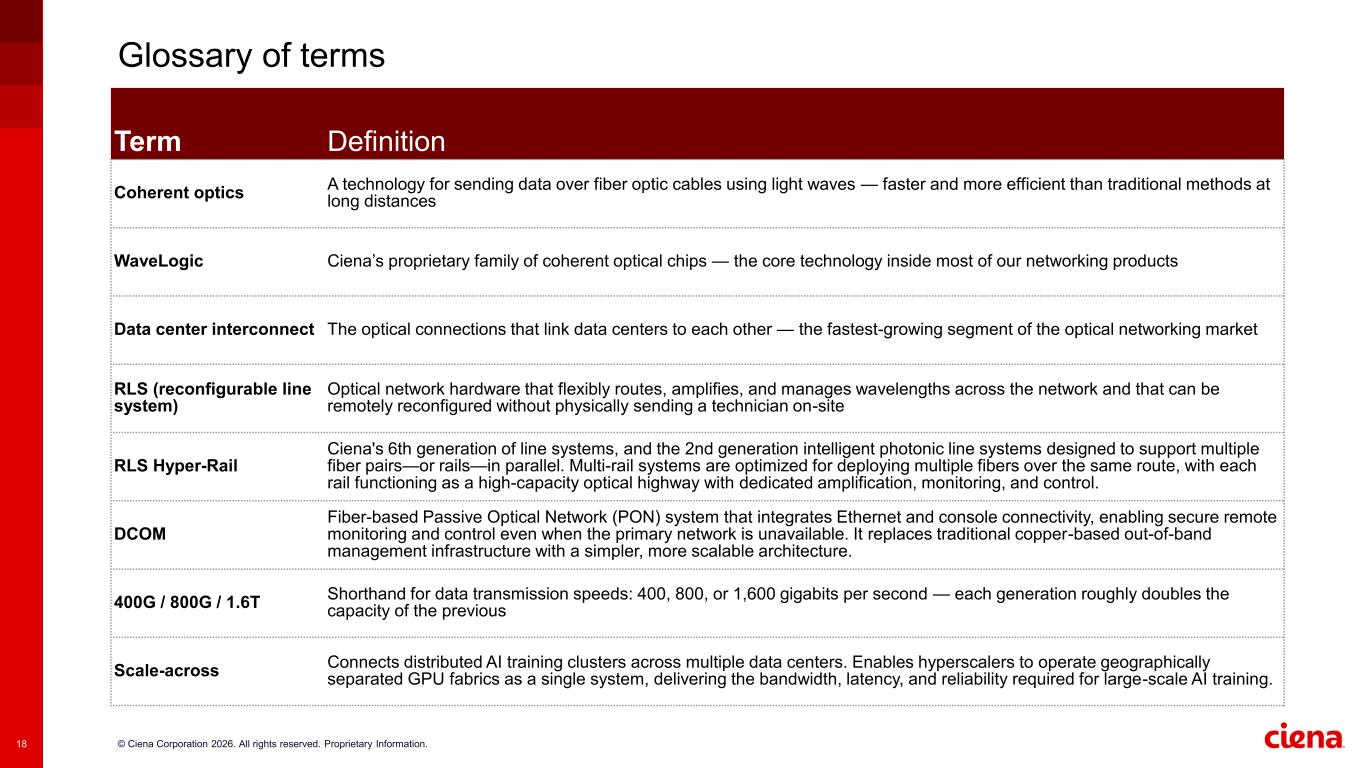
© Ciena Corporation 2026. All rights reserved. Proprietary Information.18 Glossary of terms Term Definition Coherent optics A technology for sending data over fiber optic cables using light waves — faster and more efficient than traditional methods at long distances WaveLogic Ciena’s proprietary family of coherent optical chips — the core technology inside most of our networking products Data center interconnect The optical connections that link data centers to each other — the fastest-growing segment of the optical networking market RLS (reconfigurable line system) Optical network hardware that flexibly routes, amplifies, and manages wavelengths across the network and that can be remotely reconfigured without physically sending a technician on-site RLS Hyper-Rail Ciena's 6th generation of line systems, and the 2nd generation intelligent photonic line systems designed to support multiple fiber pairs—or rails—in parallel. Multi-rail systems are optimized for deploying multiple fibers over the same route, with each rail functioning as a high-capacity optical highway with dedicated amplification, monitoring, and control. DCOM Fiber-based Passive Optical Network (PON) system that integrates Ethernet and console connectivity, enabling secure remote monitoring and control even when the primary network is unavailable. It replaces traditional copper-based out-of-band management infrastructure with a simpler, more scalable architecture. 400G / 800G / 1.6T Shorthand for data transmission speeds: 400, 800, or 1,600 gigabits per second — each generation roughly doubles the capacity of the previous Scale-across Connects distributed AI training clusters across multiple data centers. Enables hyperscalers to operate geographically separated GPU fabrics as a single system, delivering the bandwidth, latency, and reliability required for large-scale AI training.
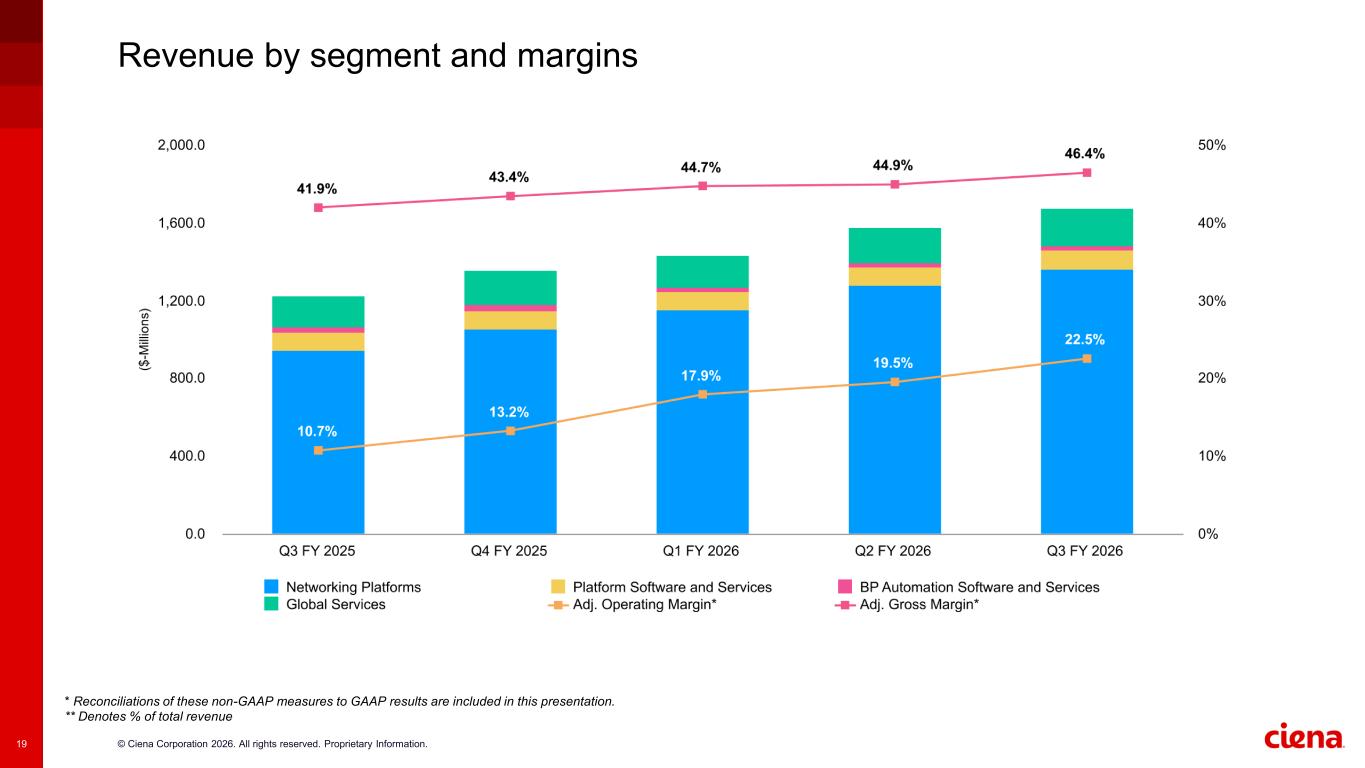
© Ciena Corporation 2026. All rights reserved. Proprietary Information.19 Revenue by segment and margins * Reconciliations of these non-GAAP measures to GAAP results are included in this presentation. ** Denotes % of total revenue
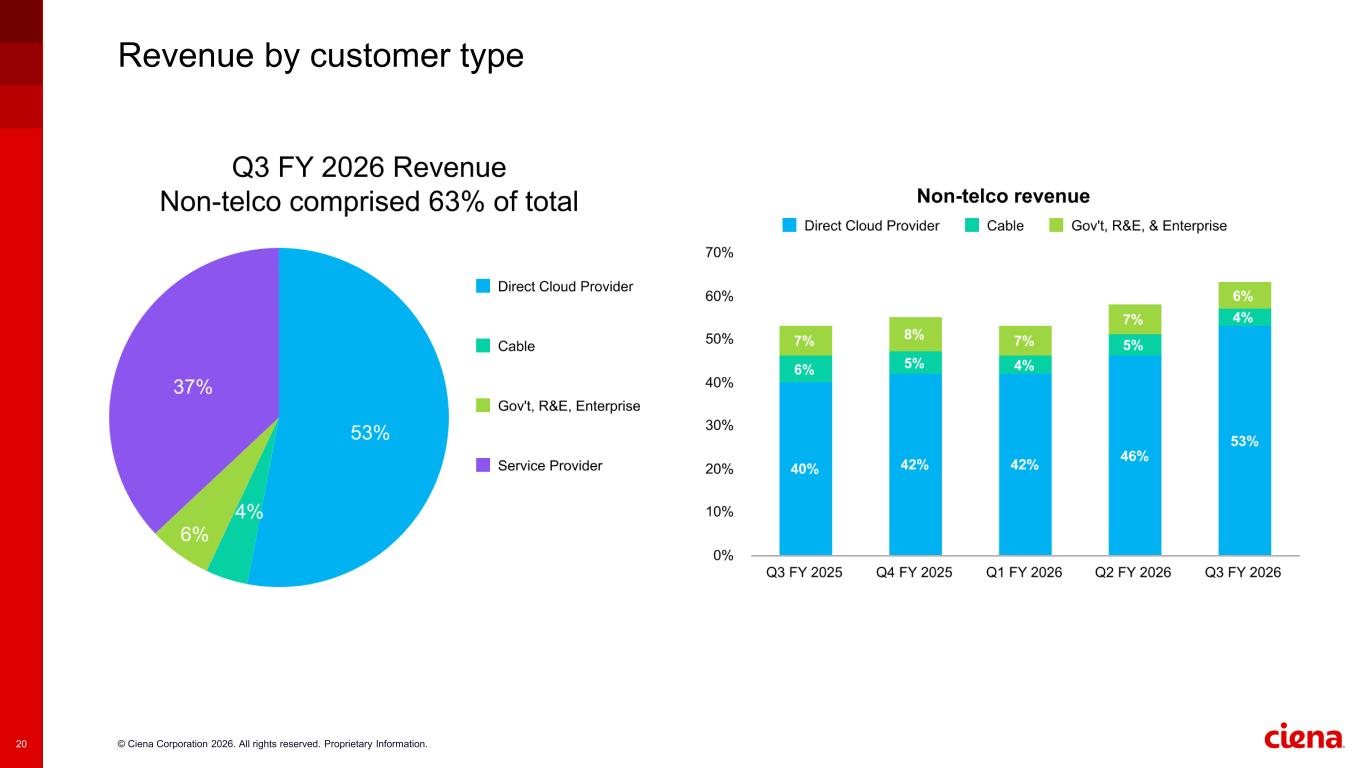
© Ciena Corporation 2026. All rights reserved. Proprietary Information.20 Revenue by customer type
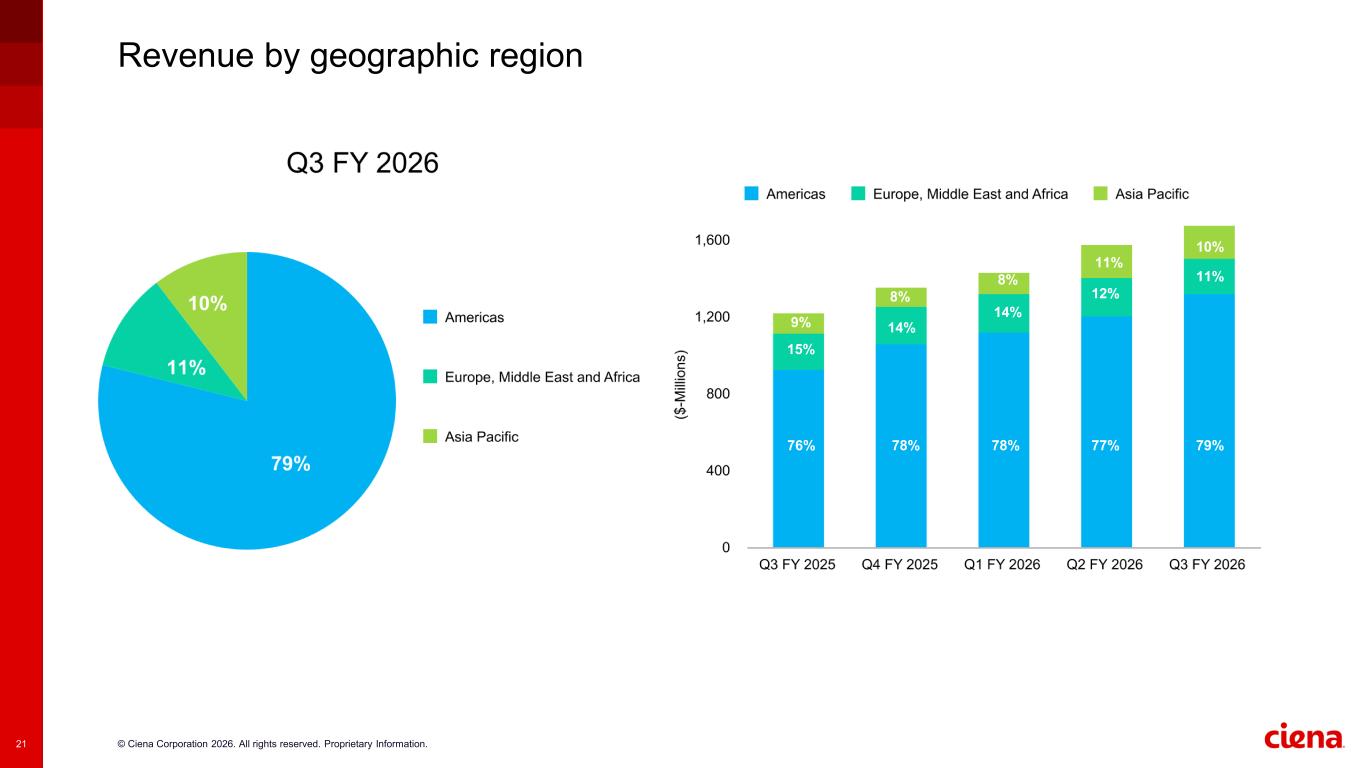
© Ciena Corporation 2026. All rights reserved. Proprietary Information.21 Revenue by geographic region 9% 8% 11% 15% 14% 12% 76% 78% 78% 77% 14% 8% 10% 11% 79%
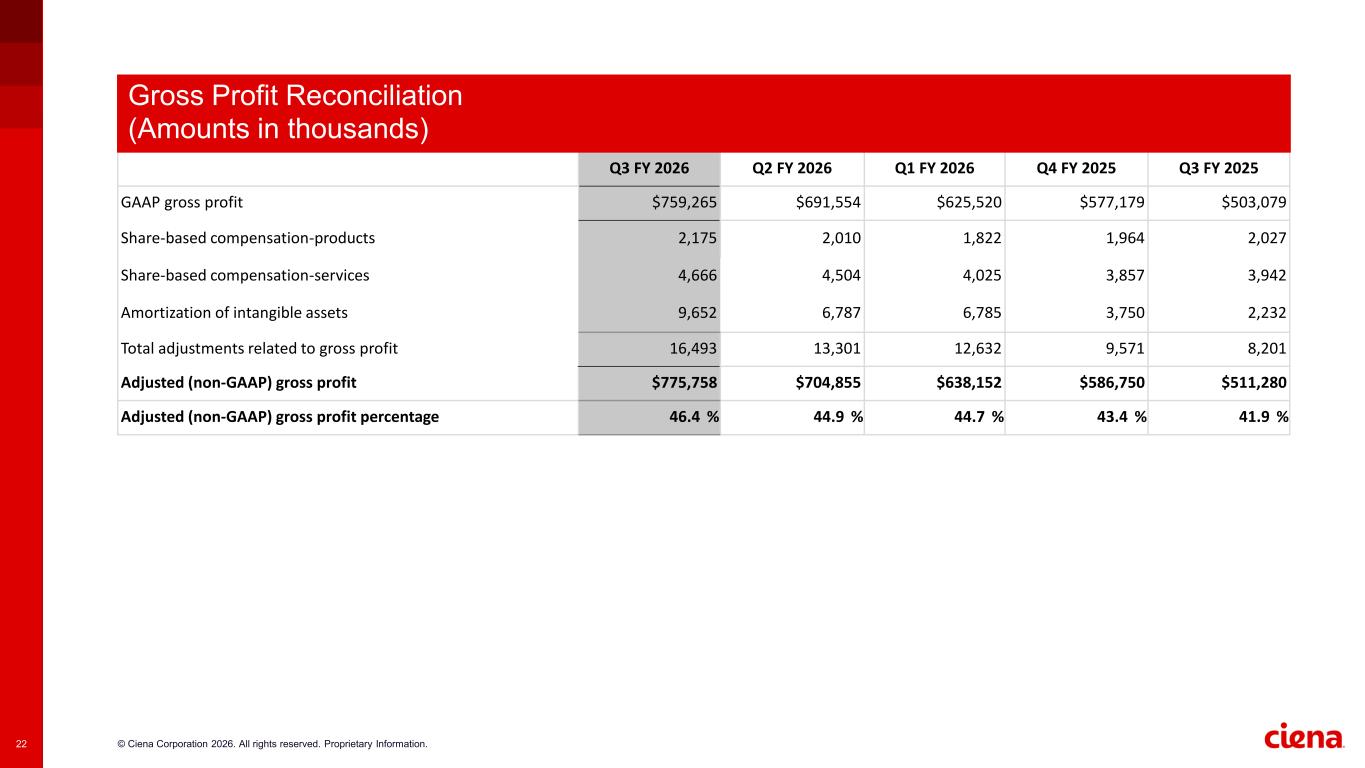
© Ciena Corporation 2026. All rights reserved. Proprietary Information.22 Q3 FY 2026 Q2 FY 2026 Q1 FY 2026 Q4 FY 2025 Q3 FY 2025 GAAP gross profit $759,265 $691,554 $625,520 $577,179 $503,079 Share-based compensation-products 2,175 2,010 1,822 1,964 2,027 Share-based compensation-services 4,666 4,504 4,025 3,857 3,942 Amortization of intangible assets 9,652 6,787 6,785 3,750 2,232 Total adjustments related to gross profit 16,493 13,301 12,632 9,571 8,201 Adjusted (non-GAAP) gross profit $775,758 $704,855 $638,152 $586,750 $511,280 Adjusted (non-GAAP) gross profit percentage 46.4 % 44.9 % 44.7 % 43.4 % 41.9 % Gross Profit Reconciliation (Amounts in thousands)
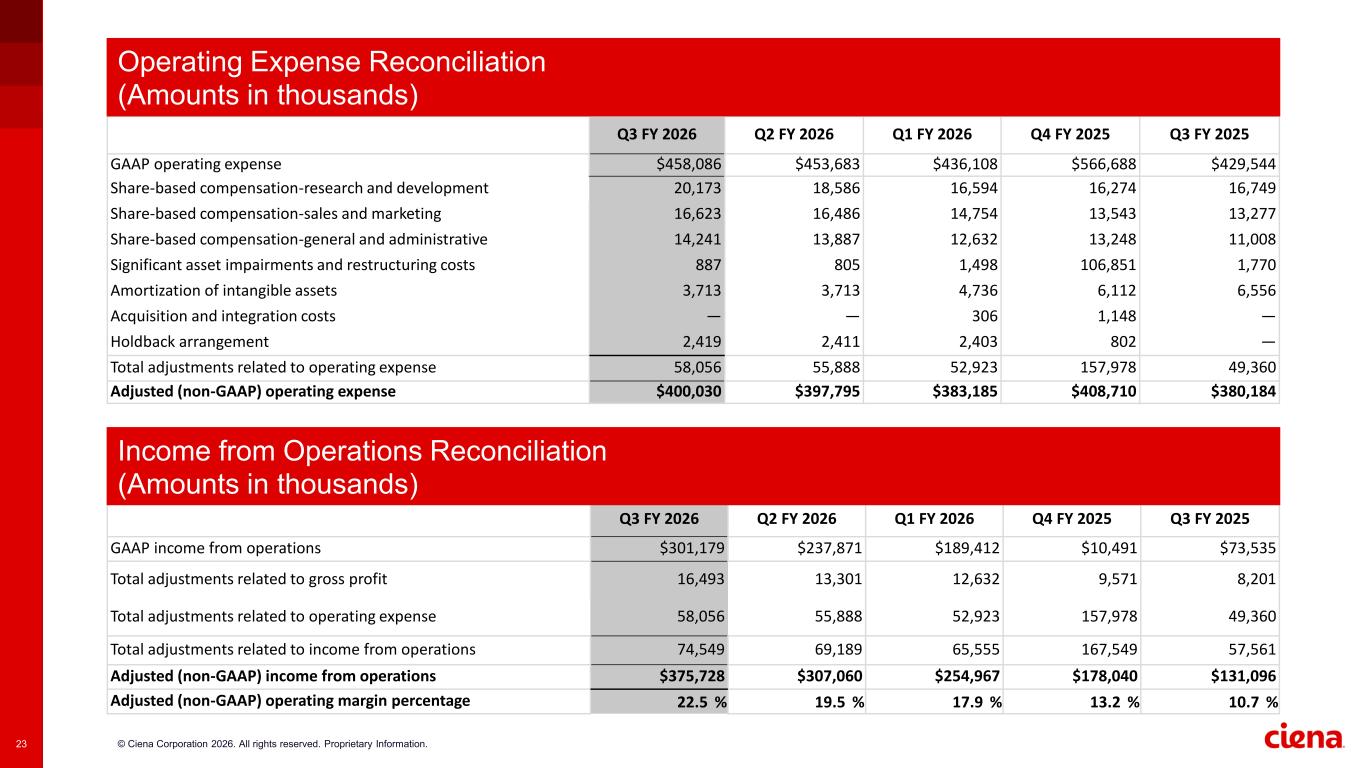
© Ciena Corporation 2026. All rights reserved. Proprietary Information.23 Q3 FY 2026 Q2 FY 2026 Q1 FY 2026 Q4 FY 2025 Q3 FY 2025 GAAP operating expense $458,086 $453,683 $436,108 $566,688 $429,544 Share-based compensation-research and development 20,173 18,586 16,594 16,274 16,749 Share-based compensation-sales and marketing 16,623 16,486 14,754 13,543 13,277 Share-based compensation-general and administrative 14,241 13,887 12,632 13,248 11,008 Significant asset impairments and restructuring costs 887 805 1,498 106,851 1,770 Amortization of intangible assets 3,713 3,713 4,736 6,112 6,556 Acquisition and integration costs — — 306 1,148 — Holdback arrangement 2,419 2,411 2,403 802 — Total adjustments related to operating expense 58,056 55,888 52,923 157,978 49,360 Adjusted (non-GAAP) operating expense $400,030 $397,795 $383,185 $408,710 $380,184 Q3 FY 2026 Q2 FY 2026 Q1 FY 2026 Q4 FY 2025 Q3 FY 2025 GAAP income from operations $301,179 $237,871 $189,412 $10,491 $73,535 Total adjustments related to gross profit 16,493 13,301 12,632 9,571 8,201 Total adjustments related to operating expense 58,056 55,888 52,923 157,978 49,360 Total adjustments related to income from operations 74,549 69,189 65,555 167,549 57,561 Adjusted (non-GAAP) income from operations $375,728 $307,060 $254,967 $178,040 $131,096 Adjusted (non-GAAP) operating margin percentage 22.5 % 19.5 % 17.9 % 13.2 % 10.7 % Operating Expense Reconciliation (Amounts in thousands) Income from Operations Reconciliation (Amounts in thousands)
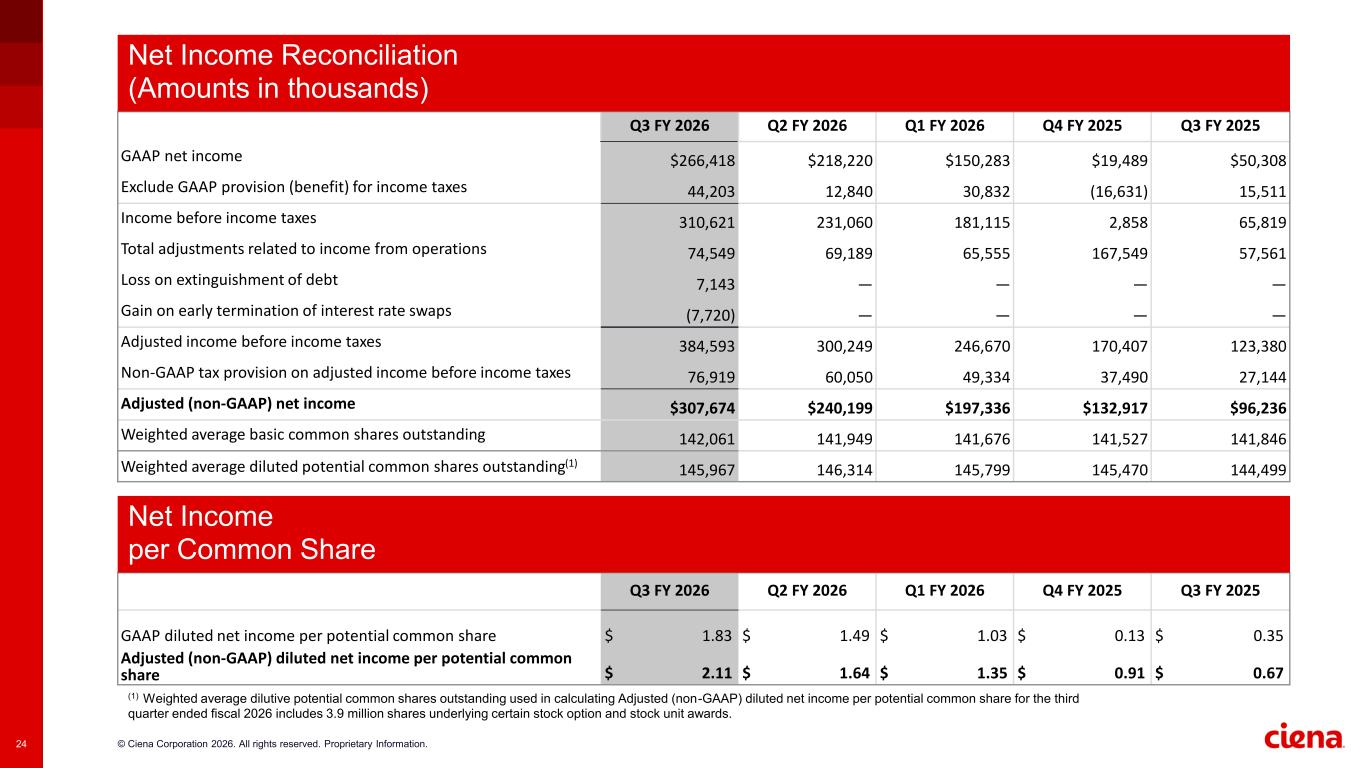
© Ciena Corporation 2026. All rights reserved. Proprietary Information.24 Q3 FY 2026 Q2 FY 2026 Q1 FY 2026 Q4 FY 2025 Q3 FY 2025 GAAP net income $266,418 $218,220 $150,283 $19,489 $50,308 Exclude GAAP provision (benefit) for income taxes 44,203 12,840 30,832 (16,631) 15,511 Income before income taxes 310,621 231,060 181,115 2,858 65,819 Total adjustments related to income from operations 74,549 69,189 65,555 167,549 57,561 Loss on extinguishment of debt 7,143 — — — — Gain on early termination of interest rate swaps (7,720) — — — — Adjusted income before income taxes 384,593 300,249 246,670 170,407 123,380 Non-GAAP tax provision on adjusted income before income taxes 76,919 60,050 49,334 37,490 27,144 Adjusted (non-GAAP) net income $307,674 $240,199 $197,336 $132,917 $96,236 Weighted average basic common shares outstanding 142,061 141,949 141,676 141,527 141,846 Weighted average diluted potential common shares outstanding(1) 145,967 146,314 145,799 145,470 144,499 Q3 FY 2026 Q2 FY 2026 Q1 FY 2026 Q4 FY 2025 Q3 FY 2025 GAAP diluted net income per potential common share $ 1.83 $ 1.49 $ 1.03 $ 0.13 $ 0.35 Adjusted (non-GAAP) diluted net income per potential common share $ 2.11 $ 1.64 $ 1.35 $ 0.91 $ 0.67 (1) Weighted average dilutive potential common shares outstanding used in calculating Adjusted (non-GAAP) diluted net income per potential common share for the third quarter ended fiscal 2026 includes 3.9 million shares underlying certain stock option and stock unit awards. Net Income Reconciliation (Amounts in thousands) Net Income per Common Share
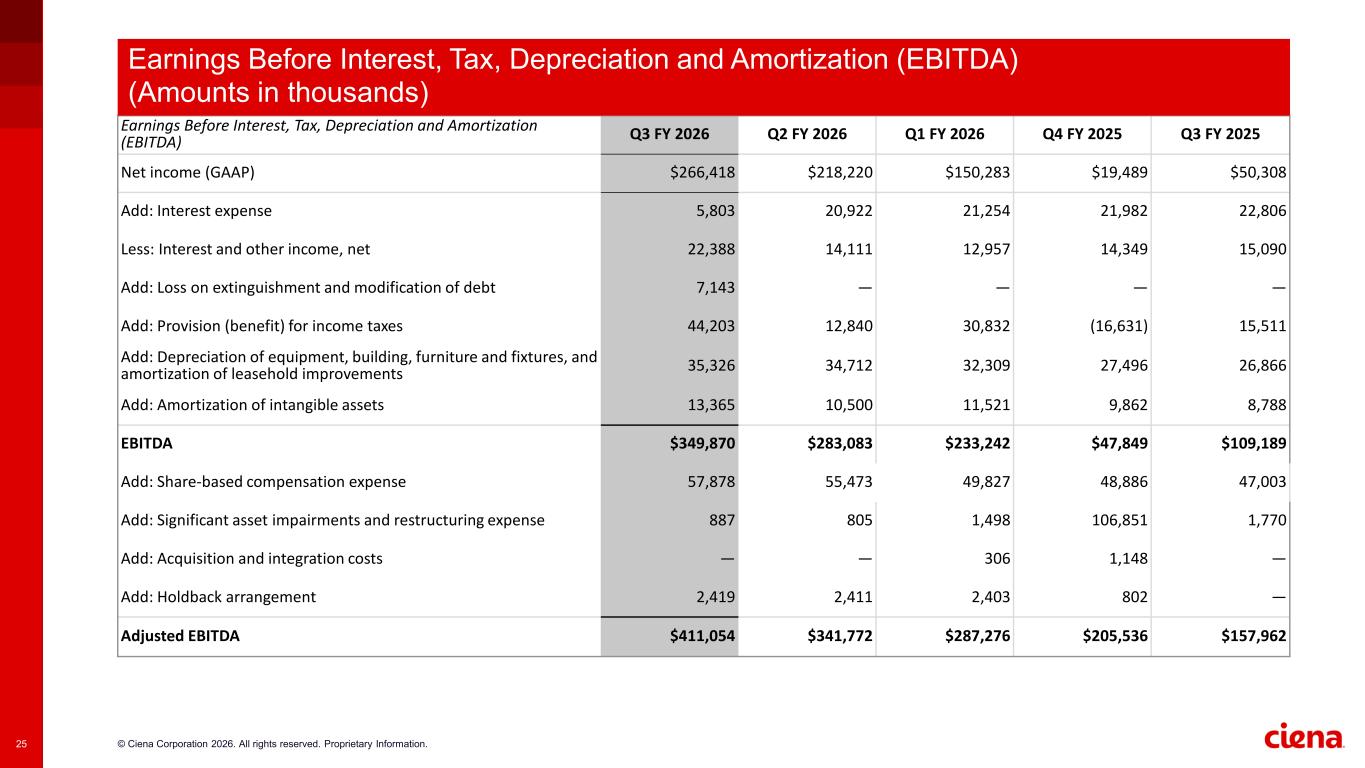
© Ciena Corporation 2026. All rights reserved. Proprietary Information.25 Earnings Before Interest, Tax, Depreciation and Amortization (EBITDA) Q3 FY 2026 Q2 FY 2026 Q1 FY 2026 Q4 FY 2025 Q3 FY 2025 Net income (GAAP) $266,418 $218,220 $150,283 $19,489 $50,308 Add: Interest expense 5,803 20,922 21,254 21,982 22,806 Less: Interest and other income, net 22,388 14,111 12,957 14,349 15,090 Add: Loss on extinguishment and modification of debt 7,143 — — — — Add: Provision (benefit) for income taxes 44,203 12,840 30,832 (16,631) 15,511 Add: Depreciation of equipment, building, furniture and fixtures, and amortization of leasehold improvements 35,326 34,712 32,309 27,496 26,866 Add: Amortization of intangible assets 13,365 10,500 11,521 9,862 8,788 EBITDA $349,870 $283,083 $233,242 $47,849 $109,189 Add: Share-based compensation expense 57,878 55,473 49,827 48,886 47,003 Add: Significant asset impairments and restructuring expense 887 805 1,498 106,851 1,770 Add: Acquisition and integration costs — — 306 1,148 — Add: Holdback arrangement 2,419 2,411 2,403 802 — Adjusted EBITDA $411,054 $341,772 $287,276 $205,536 $157,962 Earnings Before Interest, Tax, Depreciation and Amortization (EBITDA) (Amounts in thousands)