
CMCO 8-K
Columbus Mckinnon Corp (CMCO)
8-K
2020-07-30
For: 2020-07-30
View Original
Added on
April 08, 2026
SECURITIES AND EXCHANGE COMMISSION
Washington, D.C. 20549
FORM 8-K
CURRENT REPORT
Pursuant to Section 13 or 15(d) of
the Securities Exchange Act of 1934
Date of Report (Date of earliest event reported): July 30, 2020
(Exact name of registrant as specified in its charter)
(State or other jurisdiction of incorporation)
| (Commission File Number) | (IRS Employer Identification No.) | |||||||
| (Address of principal executive offices) | (Zip Code) | ||||||||||
Registrant's telephone number including area code: (716 ) 689-5400
_________________________________________________
(Former name or former address, if changed since last report)
Securities registered pursuant to Section 12(b) of the Act:
| Title of each class | Trading Symbol(s) | Name of each exchange on which registered | ||||||
Check the appropriate box below if the Form 8-K filing is intended to simultaneously satisfy the filing obligation of the registrant under any of the following provisions:
| Written communications pursuant to Rule 425 under the Securities Act (17 CFR 230.425) | |||||
| Soliciting material pursuant to Rule 14a-12 under the Exchange Act (17 CFR 240.14a-12) | |||||
| Pre-commencement communications pursuant to Rule 14d-2(b) under the Exchange Act (17 CFR 240.14d-2(b)) | |||||
| Pre-commencement communications pursuant to Rule 13e-4(c) under the Exchange Act (17 CFR 240.13e-4(c)) | |||||
| Emerging Growth Company | |||||
| ☐ | If an Emerging Growth Company, indicate by check mark if the registrant has elected not to use the extended transition period for complying with any new or revised financial accounting standards provided pursuant to Section 13(a) of the Exchange Act. | ||||
| Item 2.02 | RESULTS OF OPERATIONS AND FINANCIAL CONDITION | ||||
On July 30, 2020, the registrant issued a press release announcing its financial results for the first quarter, which ended June 30, 2020. The press release is annexed as Exhibit 99.1 to this Current Report on Form 8-K. The slides used during the earnings call are annexed as Exhibit 99.2 to this Current Report on Form 8-K.
The information contained in this Form 8-K and the Exhibit annexed hereto shall not be deemed “filed” for purposes of Section 18 of the Securities Exchange Act of 1934, as amended, nor shall it be deemed incorporated by reference into any filing under the Securities Act of 1933, as amended, except as shall be expressly set forth in such filing.
| Item 9.01 | FINANCIAL STATEMENTS AND EXHIBITS. | ||||
(d) Exhibits.
| EXHIBIT NUMBER | DESCRIPTION | |||||||
| Press Release dated July 30, 2020 | ||||||||
| Earnings call slides dated July 30, 2020 | ||||||||
| 104 | Cover Page Interactive Data File (the cover page XBRL tags are embedded within the Inline XBRL document) | |||||||
SIGNATURES
Pursuant to the requirements of the Securities Exchange Act of 1934, the registrant has duly caused this report to be signed on its behalf by the undersigned thereunto duly authorized.
| COLUMBUS McKINNON CORPORATION | |||||
| By: | /s/ Gregory P. Rustowicz | ||||
| Name: | Gregory P. Rustowicz | ||||
| Title: | Vice President and Chief | ||||
| Financial Officer (Principal Financial Officer) | |||||
Dated: July 30, 2020
EXHIBIT 99.1
News Release
205 Crosspoint Parkway
Buffalo, NY 14068
Immediate Release
Columbus McKinnon Reports Financial Results for First Quarter Fiscal Year 2021
BUFFALO, NY, July 30, 2020 - Columbus McKinnon Corporation (Nasdaq: CMCO), a leading designer, manufacturer and marketer of motion control products, technologies and services for material handling, today announced financial results for its fiscal year 2021 first quarter, which ended June 30, 2020.
First Quarter Highlights (compared with prior-year period)
•Achieved positive operating income and cash generation despite 35% decline in revenue
•Delivered $1.8 million in operating income in quarter even as end markets were severely challenged due to COVID-19 pandemic; Adjusted operating income* was $5.0 million
•Generated $9.5 million in cash from operations and $8.4 million in free cash flow*
•Significant liquidity and low net debt leverage position Columbus McKinnon for Phase III of strategy as markets improve
David Wilson, President and CEO of Columbus McKinnon, commented, “I have been pleased with the performance of our leadership team and the effectiveness of the Blueprint for Growth strategy during these extraordinary times resulting from the global pandemic. The rapid actions taken to preserve liquidity, protect the enterprise and continue to make select investments in growth enabled respectable financial results despite the dramatic drop in demand. Even as volume measurably declined, we achieved gross margin of 32% given strategic pricing initiatives, footprint consolidations and overhead cost reductions. We were encouraged to see markets improve monthly from the trough in April through June and now into July, as order activity has increased.”
He added, “In this challenging environment, there are factors that we can control. We will continue to drive cost performance and improve our competitive positioning by advancing Phases II and III of the Blueprint for Growth strategy. We are prioritizing our efforts on a select set of initiatives to deliver organic growth and strategic development while advancing our 80/20 Process and operational excellence plans. In fact, even with the downturn in the first quarter, we realized $1.9 million in contribution to operating income from the 80/20 Process.”
*Adjusted operating income and free cash flow are non-GAAP measures. See accompanying discussion and reconciliation tables in this release regarding adjusted operating income. Free cash flow is defined as cash from operations minus capital expenditures.
Columbus McKinnon Reports Financial Results for First Quarter Fiscal Year 2021
Page 2 of 12
July 30, 2020
First Quarter Fiscal 2021 Sales
| ($ in millions) | Q1 FY 21 | Q1 FY 20 | Change | % Change | |||||||||||||||||||
| Net sales | $ | 139.1 | $ | 212.7 | $ | (73.6) | (34.6) | % | |||||||||||||||
| U.S. sales | $ | 74.7 | $ | 116.7 | $ | (42.0) | (36.0) | % | |||||||||||||||
| % of total | 54 | % | 55 | % | |||||||||||||||||||
| Non-U.S. sales | $ | 64.4 | $ | 96.0 | $ | (31.6) | (32.9) | % | |||||||||||||||
| % of total | 46 | % | 45 | % | |||||||||||||||||||
The decline in sales for the quarter was the result of lower volume due to the global economic impact of the COVID-19 pandemic which more than offset a 1.1% price improvement. U.S. sales volume declines more than offset a 1.2% price improvement. Sales outside the U.S. were down on volume and a $2.0 million, or 2.0%, negative impact from foreign currency translation, which offset a 1.1% price improvement.
First Quarter Fiscal 2021 Operating Results
($ in millions) | Q1 FY 21 | Q1 FY 20 | Change | % Change | |||||||||||||||||||
| Gross profit | $ | 44.8 | $ | 75.6 | $ | (30.8) | (40.8) | % | |||||||||||||||
| Gross margin | 32.2 | % | 35.5 | % | (330) bps | ||||||||||||||||||
| Income from operations | $ | 1.8 | $ | 27.0 | $ | (25.3) | (93.4) | % | |||||||||||||||
| Operating margin | 1.3 | % | 12.7 | % | (1,140) bps | ||||||||||||||||||
| Net income (loss) | $ | (3.0) | $ | 18.6 | $ | (21.5) | NM | ||||||||||||||||
| Diluted EPS | $ | (0.12) | $ | 0.78 | $ | (0.90) | NM | ||||||||||||||||
| Adjusted EBITDA * | $ | 12.1 | $ | 35.5 | $ | (23.4) | (65.9) | % | |||||||||||||||
| Adjusted EBITDA margin | 8.7 | % | 16.7 | % | (800) bps | ||||||||||||||||||
*A non-GAAP measure, Adjusted EBITDA is defined as adjusted operating income plus depreciation and amortization. Please see the attached tables for a reconciliation of adjusted EBITDA to GAAP net income (loss).
Adjusted for the impacts of factory closures and business realignment costs, income from operations was $5.0 million, or 3.6% of sales. Decremental adjusted operating income leverage was just 31%, improved over historic decremental leverage during dramatic recessionary environments. (See the reconciliation of GAAP income from operations to adjusted income from operations on page 10 of this release.) Net loss for the quarter was $3.0 million which included a $2.7 million non-cash pension settlement charge related to the termination of a U.S. pension plan.
Adjusted EBITDA margin was 8.7% for the quarter reflecting the benefits of the Company’s self-help improvement efforts in austere market conditions. (See the reconciliation of GAAP net income to adjusted EBITDA on page 12 of this release.)
Second Quarter Fiscal 2021 Outlook
Mr. Wilson concluded, “We are executing efficiently as we ramp up to meet improving demand, notably in the U.S. and Europe, our largest geographic markets. While order rates have been growing, we are carefully monitoring our customer landscape and will take additional actions if necessary to achieve our objectives.”
Currently, Columbus McKinnon expects second quarter fiscal 2021 revenue to improve sequentially to a range of approximately $150 million to $160 million at current exchange rates and to continue to generate positive operating income and free cash flow.
Columbus McKinnon Reports Financial Results for First Quarter Fiscal Year 2021
Page 3 of 12
July 30, 2020
Teleconference/webcast
Columbus McKinnon will host a conference call and live webcast Thursday, July 30, 2020 at 10:00 AM Eastern Time, at which management will review the Company’s financial results and strategy. The review will be accompanied by a slide presentation, which will be available on Columbus McKinnon’s website at investors.columbusmckinnon.com. A question and answer session will follow the formal discussion.
The conference call can be accessed by dialing 201-493-6780. The listen-only audio webcast can be monitored at https://investors.columbusmckinnon.com. To listen to the archived call, dial 412-317-6671 and enter the passcode 13705871. The telephonic replay will be available from 1:00 PM Eastern Time on the day of the call through Thursday, August 6, 2020. Alternatively, an archived webcast of the call can be found on the Company’s website. In addition, a transcript of the call will be posted to the website once available.
About Columbus McKinnon
Columbus McKinnon is a leading worldwide designer, manufacturer and marketer of motion control products, technologies, systems and services that efficiently and ergonomically move, lift, position and secure materials. Key products include hoists, actuators, rigging tools, light rail work stations and digital power and motion control systems. The Company is focused on commercial and industrial applications that require the safety and quality provided by its superior design and engineering know-how. Comprehensive information on Columbus McKinnon is available at www.columbusmckinnon.com.
Safe Harbor Statement
This news release contains “forward-looking statements” within the meaning of the Private Securities Litigation Reform Act of 1995. Such statements include, but are not limited to, statements concerning future sales and earnings, involve known and unknown risks, uncertainties and other factors that could cause the actual results of the Company to differ materially from the results expressed or implied by such statements, including the impact of Covid-19 and the Company’s efforts to reduce costs, maintain liquidity and generate cash in the current pandemic, the effectiveness of the Company’s 80/20 Process to simplify operations, the ability of the Company’s Operational Excellence initiatives to drive profitability, the Company’s ability to grow market share, the ability to achieve revenue expectations, global economic and business conditions, conditions affecting the industries served by the Company and its subsidiaries, conditions affecting the Company's customers and suppliers, competitor responses to the Company's products and services, the overall market acceptance of such products and services, the ability to expand into new markets and geographic regions, and other factors disclosed in the Company's periodic reports filed with the Securities and Exchange Commission. The Company assumes no obligation to update the forward-looking information contained in this release.
Contacts:
| Gregory P. Rustowicz | Investor Relations: | ||||
| Vice President - Finance and Chief Financial Officer | Deborah K. Pawlowski | ||||
| Columbus McKinnon Corporation | Kei Advisors LLC | ||||
| 716-689-5442 | 716-843-3908 | ||||
| [email protected] | [email protected] | ||||
Financial tables follow.
Columbus McKinnon Reports Financial Results for First Quarter Fiscal Year 2021
Page 4 of 12
July 30, 2020
COLUMBUS McKINNON CORPORATION
Condensed Consolidated Income Statements - UNAUDITED
(In thousands, except per share and percentage data)
| Three Months Ended | ||||||||||||||||||||
| June 30, 2020 | June 30, 2019 | Change | ||||||||||||||||||
| Net sales | $ | 139,070 | $ | 212,712 | (34.6) | % | ||||||||||||||
| Cost of products sold | 94,273 | 137,100 | (31.2) | % | ||||||||||||||||
| Gross profit | 44,797 | 75,612 | (40.8) | % | ||||||||||||||||
| Gross profit margin | 32.2 | % | 35.5 | % | ||||||||||||||||
| Selling expenses | 18,695 | 22,755 | (17.8) | % | ||||||||||||||||
| % of net sales | 13.4 | % | 10.7 | % | ||||||||||||||||
| General and administrative expenses | 18,429 | 19,600 | (6.0) | % | ||||||||||||||||
| % of net sales | 13.3 | % | 9.2 | % | ||||||||||||||||
| Research and development expenses | 2,769 | 2,792 | (0.8) | % | ||||||||||||||||
| % of net sales | 2.0 | % | 1.3 | % | ||||||||||||||||
| Loss on sales of businesses | — | 169 | NM | |||||||||||||||||
| Amortization of intangibles | 3,115 | 3,253 | (4.2) | % | ||||||||||||||||
| Income from operations | 1,789 | 27,043 | (93.4) | % | ||||||||||||||||
| Operating margin | 1.3 | % | 12.7 | % | ||||||||||||||||
| Interest and debt expense | 3,188 | 3,852 | (17.2) | % | ||||||||||||||||
| Investment (income) loss | (577) | (302) | 91.1 | % | ||||||||||||||||
| Foreign currency exchange (gain) loss | 84 | (410) | NM | |||||||||||||||||
| Other (income) expense, net | 3,026 | 162 | 1,767.9 | % | ||||||||||||||||
| Income (loss) before income tax expense (benefit) | (3,932) | 23,741 | NM | |||||||||||||||||
| Income tax expense (benefit) | (963) | 5,162 | NM | |||||||||||||||||
| Net income (loss) | $ | (2,969) | $ | 18,579 | NM | |||||||||||||||
| Average basic shares outstanding | 23,802 | 23,431 | 1.6 | % | ||||||||||||||||
| Basic income (loss) per share | $ | (0.12) | $ | 0.79 | NM | |||||||||||||||
| Average diluted shares outstanding | 23,802 | 23,777 | 0.1 | % | ||||||||||||||||
| Diluted income (loss) per share | $ | (0.12) | $ | 0.78 | NM | |||||||||||||||
Columbus McKinnon Reports Financial Results for First Quarter Fiscal Year 2021
Page 5 of 12
July 30, 2020
COLUMBUS McKINNON CORPORATION
Condensed Consolidated Balance Sheets
(In thousands)
| June 30, 2020 | March 31, 2020 | |||||||||||||
| (unaudited) | ||||||||||||||
| ASSETS | ||||||||||||||
| Current assets: | ||||||||||||||
| Cash and cash equivalents | $ | 152,236 | $ | 114,450 | ||||||||||
| Trade accounts receivable | 96,464 | 123,743 | ||||||||||||
| Inventories | 124,572 | 127,373 | ||||||||||||
| Prepaid expenses and other | 19,662 | 17,180 | ||||||||||||
| Total current assets | 392,934 | 382,746 | ||||||||||||
| Property, plant, and equipment, net | 76,662 | 79,473 | ||||||||||||
| Goodwill | 322,914 | 319,679 | ||||||||||||
| Other intangibles, net | 217,109 | 217,962 | ||||||||||||
| Marketable securities | 7,510 | 7,322 | ||||||||||||
| Deferred taxes on income | 26,044 | 26,281 | ||||||||||||
| Other assets | 59,416 | 59,809 | ||||||||||||
| Total assets | $ | 1,102,589 | $ | 1,093,272 | ||||||||||
| LIABILITIES AND SHAREHOLDERS’ EQUITY | ||||||||||||||
| Current liabilities: | ||||||||||||||
| Trade accounts payable | $ | 38,940 | $ | 57,289 | ||||||||||
| Accrued liabilities | 91,896 | 93,585 | ||||||||||||
| Current portion of long-term debt | 29,450 | 4,450 | ||||||||||||
| Total current liabilities | 160,286 | 155,324 | ||||||||||||
| Term loan and revolving credit facility | 246,268 | 246,856 | ||||||||||||
| Other non-current liabilities | 229,433 | 227,507 | ||||||||||||
| Total liabilities | 635,987 | 629,687 | ||||||||||||
| Shareholders’ equity: | ||||||||||||||
| Common stock | 239 | 238 | ||||||||||||
| Additional paid-in capital | 288,583 | 287,256 | ||||||||||||
| Retained earnings | 287,472 | 290,441 | ||||||||||||
| Accumulated other comprehensive loss | (109,692) | (114,350) | ||||||||||||
| Total shareholders’ equity | 466,602 | 463,585 | ||||||||||||
| Total liabilities and shareholders’ equity | $ | 1,102,589 | $ | 1,093,272 | ||||||||||
Columbus McKinnon Reports Financial Results for First Quarter Fiscal Year 2021
Page 6 of 12
July 30, 2020
COLUMBUS McKINNON CORPORATION
Condensed Consolidated Statements of Cash Flows - UNAUDITED
(In thousands)
| Three Months Ended | ||||||||||||||
| June 30, 2020 | June 30, 2019 | |||||||||||||
| Operating activities: | ||||||||||||||
| Net income (loss) | $ | (2,969) | $ | 18,579 | ||||||||||
| Adjustments to reconcile net income (loss) to net cash provided by (used for) operating activities: | ||||||||||||||
| Depreciation and amortization | 7,081 | 7,403 | ||||||||||||
| Deferred income taxes and related valuation allowance | (1,500) | 415 | ||||||||||||
| Net loss (gain) on sale of real estate, investments, and other | (494) | (268) | ||||||||||||
| Stock based compensation | 2,071 | 1,556 | ||||||||||||
| Amortization of deferred financing costs | 665 | 665 | ||||||||||||
| Loss on sales of businesses | — | 169 | ||||||||||||
| Non-cash pension settlement expense | 2,722 | — | ||||||||||||
| Non-cash lease expense | 1,876 | 1,952 | ||||||||||||
| Changes in operating assets and liabilities, net of effects of business acquisitions and divestitures: | ||||||||||||||
| Trade accounts receivable | 27,955 | (5,827) | ||||||||||||
| Inventories | 3,924 | (3,879) | ||||||||||||
| Prepaid expenses and other | (2,766) | (1,755) | ||||||||||||
| Other assets | (39) | 107 | ||||||||||||
| Trade accounts payable | (18,248) | (6,800) | ||||||||||||
| Accrued liabilities | (7,926) | (6,322) | ||||||||||||
| Non-current liabilities | (2,836) | (8,155) | ||||||||||||
| Net cash provided by (used for) operating activities | 9,516 | (2,160) | ||||||||||||
| Investing activities: | ||||||||||||||
| Proceeds from sales of marketable securities | 1,034 | 636 | ||||||||||||
| Purchases of marketable securities | (880) | (1,039) | ||||||||||||
| Capital expenditures | (1,088) | (1,854) | ||||||||||||
| Proceeds from pending sale of building | 6,363 | — | ||||||||||||
| Proceeds from sale of equipment | — | 51 | ||||||||||||
| Net (payments) proceeds from sales of businesses | — | (214) | ||||||||||||
| Net cash provided by (used for) investing activities | 5,429 | (2,420) | ||||||||||||
| Financing activities: | ||||||||||||||
| Proceeds from issuance of common stock | 185 | 980 | ||||||||||||
| Borrowings (repayments) under line-of-credit agreements | 25,000 | — | ||||||||||||
| Repayment of debt | (1,112) | (10,000) | ||||||||||||
| Payment of dividends | (1,427) | (1,404) | ||||||||||||
| Other | (927) | (518) | ||||||||||||
| Net cash provided by (used for) financing activities | 21,719 | (10,942) | ||||||||||||
| Effect of exchange rate changes on cash | 1,122 | 145 | ||||||||||||
| Net change in cash and cash equivalents | 37,786 | (15,377) | ||||||||||||
| Cash, cash equivalents, and restricted cash at beginning of year | 114,700 | 71,343 | ||||||||||||
| Cash, cash equivalents, and restricted cash at end of period | $ | 152,486 | $ | 55,966 | ||||||||||
Columbus McKinnon Reports Financial Results for First Quarter Fiscal Year 2021
Page 7 of 12
July 30, 2020
COLUMBUS McKINNON CORPORATION
Q1 FY 2021 Sales Bridge
| Quarter | ||||||||||||||
| ($ in millions) | $ Change | % Change | ||||||||||||
| Fiscal 2020 Sales | $ | 212.7 | ||||||||||||
| Volume | (74.0) | (34.8) | % | |||||||||||
| Pricing | 2.4 | 1.1 | % | |||||||||||
| Foreign currency translation | (2.0) | (0.9) | % | |||||||||||
| Total change | $ | (73.6) | (34.6) | % | ||||||||||
| Fiscal 2021 Sales | $ | 139.1 | ||||||||||||
COLUMBUS McKINNON CORPORATION
Q1 FY 2021 Gross Profit Bridge
| ($ in millions) | Quarter | ||||
| Fiscal 2020 Gross Profit | $ | 75.6 | |||
| Pricing, net of material cost inflation | 2.4 | ||||
| Tariffs | 0.7 | ||||
| Insurance settlement | (0.3) | ||||
| Business realignment costs | (0.3) | ||||
| Foreign currency translation | (0.6) | ||||
| Factory closures | (1.4) | ||||
| Productivity, net of other cost changes | (4.3) | ||||
| Sales volume and mix | (27.0) | ||||
| Total change adjusted for divestitures | $ | (30.8) | |||
| Fiscal 2021 Gross Profit | $ | 44.8 | |||
Columbus McKinnon Reports Financial Results for First Quarter Fiscal Year 2021
Page 8 of 12
July 30, 2020
COLUMBUS McKINNON CORPORATION
Additional Data - UNAUDITED
| June 30, 2020 | March 31, 2020 | June 30, 2019 | |||||||||||||||||||||||||||
| ($ in millions) | |||||||||||||||||||||||||||||
| Backlog | $ | 130.7 | $ | 131.0 | $ | 148.2 | |||||||||||||||||||||||
| Long-term backlog | |||||||||||||||||||||||||||||
| Expected to ship beyond 3 months | $ | 52.8 | $ | 49.1 | $ | 53.9 | |||||||||||||||||||||||
| Long-term backlog as % of total backlog | 40.4 | % | 37.5 | % | 36.4 | % | |||||||||||||||||||||||
| Trade accounts receivable | |||||||||||||||||||||||||||||
| Days sales outstanding | 63.1 | days | 59.4 | days | 58.0 | days | |||||||||||||||||||||||
| Inventory turns per year | |||||||||||||||||||||||||||||
| (based on cost of products sold) | 3.0 | turns | 3.9 | turns | 3.6 | turns | |||||||||||||||||||||||
| Days' inventory | 120.6 | days | 94.3 | days | 100.6 | days | |||||||||||||||||||||||
| Trade accounts payable | |||||||||||||||||||||||||||||
| Days payables outstanding | 37.6 | days | 42.3 | days | 26.7 | days | |||||||||||||||||||||||
| Working capital as a % of sales (1) | 14.9 | % | 14.5 | % | 19.3 | % | |||||||||||||||||||||||
| Debt to total capitalization percentage | 37.1 | % | 35.2 | % | 39.1 | % | |||||||||||||||||||||||
| Debt, net of cash, to net total capitalization | 20.9 | % | 22.8 | % | 34.2 | % | |||||||||||||||||||||||
(1) June 30, 2019 figure excludes the Tire Shredder business, which was divested on December 28, 2018, and Crane Equipment & Service, Inc. (CES) and Stahlhammer Bommern GmbH (STB), each of which were divested on February 28, 2019.
| U.S. Shipping Days by Quarter | ||||||||||||||||||||||||||||||||
| Q1 | Q2 | Q3 | Q4 | Total | ||||||||||||||||||||||||||||
| FY 21 | 63 | 64 | 61 | 63 | 251 | |||||||||||||||||||||||||||
| FY 20 | 63 | 63 | 61 | 64 | 251 | |||||||||||||||||||||||||||
Columbus McKinnon Reports Financial Results for First Quarter Fiscal Year 2021
Page 9 of 12
July 30, 2020
COLUMBUS McKINNON CORPORATION
Reconciliation of GAAP Gross Profit to
Non-GAAP Adjusted Gross Profit and Adjusted Gross Margin
($ in thousands, except per share data)
| Three Months Ended June 30, | |||||||||||
| 2020 | 2019 | ||||||||||
| Gross profit | $ | 44,797 | $ | 75,612 | |||||||
| Add back (deduct): | |||||||||||
| Factory closures | 1,928 | 506 | |||||||||
| Business realignment costs | 329 | — | |||||||||
| Insurance settlement | — | (290) | |||||||||
| Non-GAAP adjusted gross profit | $ | 47,054 | $ | 75,828 | |||||||
| Sales | $ | 139,070 | $ | 212,712 | |||||||
| Adjusted gross margin | 33.8 | % | 35.6 | % | |||||||
Adjusted gross profit is defined as gross profit as reported, adjusted for certain items. Adjusted gross profit is not a measure determined in accordance with generally accepted accounting principles in the United States, commonly known as GAAP, and may not be comparable with the measures as used by other companies. Nevertheless, Columbus McKinnon believes that providing non-GAAP information, such as adjusted gross profit, is important for investors and other readers of the Company’s financial statements and assists in understanding the comparison of the current quarter’s and current year's gross profit to the historical periods' gross profit, as well as facilitates a more meaningful comparison of the Company’s gross profit to that of other companies.
Columbus McKinnon Reports Financial Results for First Quarter Fiscal Year 2021
Page 10 of 12
July 30, 2020
COLUMBUS McKINNON CORPORATION
Reconciliation of GAAP Income from Operations to
Non-GAAP Adjusted Income from Operations and Adjusted Operating Margin
($ in thousands, except per share data)
| Three Months Ended June 30, | |||||||||||
| 2020 | 2019 | ||||||||||
| Income from operations | $ | 1,789 | $ | 27,043 | |||||||
| Add back (deduct): | |||||||||||
| Factory closures | 2,256 | 1,027 | |||||||||
| Business realignment costs | 821 | — | |||||||||
| Insurance recovery legal costs | 141 | 139 | |||||||||
| Loss on sales of businesses | — | 169 | |||||||||
| Insurance settlement | — | (290) | |||||||||
| Non-GAAP adjusted income from operations | $ | 5,007 | $ | 28,088 | |||||||
| Sales | $ | 139,070 | $ | 212,712 | |||||||
| Adjusted operating margin | 3.6 | % | 13.2 | % | |||||||
Adjusted income from operations is defined as income from operations as reported, adjusted for certain items. Adjusted income from operations is not a measure determined in accordance with generally accepted accounting principles in the United States, commonly known as GAAP, and may not be comparable with the measures as used by other companies. Nevertheless, Columbus McKinnon believes that providing non-GAAP information, such as adjusted income from operations, is important for investors and other readers of the Company’s financial statements and assists in understanding the comparison of the current quarter’s and current year's income from operations to the historical periods' income from operations, as well as facilitates a more meaningful comparison of the Company’s income from operations to that of other companies.
Columbus McKinnon Reports Financial Results for First Quarter Fiscal Year 2021
Page 11 of 12
July 30, 2020
COLUMBUS McKINNON CORPORATION
Reconciliation of GAAP Net Income and Diluted Earnings per Share to
Non-GAAP Adjusted Net Income and Diluted Earnings per Share
($ in thousands, except per share data)
| Three Months Ended June 30, | |||||||||||
| 2020 | 2019 | ||||||||||
| Net income (loss) | $ | (2,969) | $ | 18,579 | |||||||
| Add back (deduct): | |||||||||||
| Non-cash pension settlement expense | 2,722 | — | |||||||||
| Factory closures | 2,256 | 1,027 | |||||||||
| Business realignment costs | 821 | — | |||||||||
| Insurance recovery legal costs | 141 | 139 | |||||||||
| Loss on sales of businesses | — | 169 | |||||||||
| Insurance settlement | — | (290) | |||||||||
| Normalize tax rate to 22% (1) | (1,405) | (291) | |||||||||
| Non-GAAP adjusted net income | $ | 1,566 | $ | 19,333 | |||||||
| Average diluted shares outstanding | 23,922 | 23,777 | |||||||||
| Diluted income per share - GAAP | $ | (0.12) | $ | 0.78 | |||||||
| Diluted income per share - Non-GAAP | $ | 0.07 | $ | 0.81 | |||||||
(1) Applies a normalized tax rate of 22% to GAAP pre-tax income and non-GAAP adjustments above, which are each pre-tax.
Adjusted net income and diluted EPS are defined as net income and diluted EPS as reported, adjusted for certain items and at a normalized tax rate. Adjusted net income and diluted EPS are not measures determined in accordance with generally accepted accounting principles in the United States, commonly known as GAAP, and may not be comparable to the measures as used by other companies. Nevertheless, Columbus McKinnon believes that providing non-GAAP information, such as adjusted net income and diluted EPS, is important for investors and other readers of the Company’s financial statements and assists in understanding the comparison of the current quarter’s and current year's net income and diluted EPS to the historical periods' net income and diluted EPS, as well as facilitates a more meaningful comparison of the Company’s net income and diluted EPS to that of other companies.
Columbus McKinnon Reports Financial Results for First Quarter Fiscal Year 2021
Page 12 of 12
July 30, 2020
COLUMBUS McKINNON CORPORATION
Reconciliation of GAAP Net Income to Non-GAAP Adjusted EBITDA
($ in thousands)
| Three Months Ended June 30, | |||||||||||
| 2020 | 2019 | ||||||||||
| Net income (loss) | $ | (2,969) | $ | 18,579 | |||||||
| Add back (deduct): | |||||||||||
| Income tax expense (benefit) | (963) | 5,162 | |||||||||
| Interest and debt expense | 3,188 | 3,852 | |||||||||
| Investment (income) loss | (577) | (302) | |||||||||
| Foreign currency exchange (gain) loss | 84 | (410) | |||||||||
| Other (income) expense, net | 3,026 | 162 | |||||||||
| Depreciation and amortization expense | 7,081 | 7,403 | |||||||||
| Factory closures | 2,256 | 1,027 | |||||||||
| Business realignment costs | 821 | — | |||||||||
| Insurance recovery legal costs | 141 | 139 | |||||||||
| Loss on sales of businesses | — | 169 | |||||||||
| Insurance settlement | — | (290) | |||||||||
| Non-GAAP adjusted EBITDA | $ | 12,088 | $ | 35,491 | |||||||
| Sales | $ | 139,070 | $ | 212,712 | |||||||
| Adjusted EBITDA margin | 8.7 | % | 16.7 | % | |||||||
Adjusted EBITDA is defined as net income before interest expense, income taxes, depreciation, amortization, and other adjustments. Adjusted EBITDA is not a measure determined in accordance with generally accepted accounting principles in the United States, commonly known as GAAP, and may not be comparable with the measures as used by other companies. Nevertheless, Columbus McKinnon believes that providing non-GAAP information, such as adjusted EBITDA, is important for investors and other readers of the Company’s financial statements.

July 30, Q1 FISCAL YEAR 2021 2020 FINANCIAL RESULTS CONFERENCE CALL David J. Wilson President and Chief Executive Officer Gregory P. Rustowicz Vice President – Finance & Chief Financial Officer PARTNERS IN MOTION CONTROL
SAFE HARBOR STATEMENT These slides, and the accompanying oral discussion, contain “forward-looking statements” within the meaning of the Private Securities Litigation Reform Act of 1995. Such statements include, but are not limited to, statements concerning future sales and earnings, involve known and unknown risks, uncertainties and other factors that could cause the actual results of the Company to differ materially from the results expressed or implied by such statements, including the impact of Covid-19 and the Company’s efforts to reduce costs, maintain liquidity and generate cash in the current pandemic, the effectiveness of the Company’s 80/20 Process to simplify operations, the ability of the Company’s Operational Excellence initiatives to drive profitability, the Company’s ability to grow market share, the ability to achieve revenue expectations, global economic and business conditions, conditions affecting the industries served by the Company and its subsidiaries, conditions affecting the Company's customers and suppliers, competitor responses to the Company's products and services, the overall market acceptance of such products and services, the ability to expand into new markets and geographic regions, and other factors disclosed in the Company's periodic reports filed with the Securities and Exchange Commission. The Company assumes no obligation to update the forward- looking information contained in this release. Non-GAAP Financial Measures This presentation will discuss some non-GAAP (“adjusted”) financial measures which we believe are useful in evaluating our performance. You should not consider the presentation of this additional information in isolation or as a substitute for results compared in accordance with GAAP. The non- GAAP (“adjusted”) measures are notated and we have provided reconciliations of comparable GAAP to non-GAAP measures in tables found in the Supplemental Information portion of this presentation. © 2020 Columbus McKinnon Corporation 2
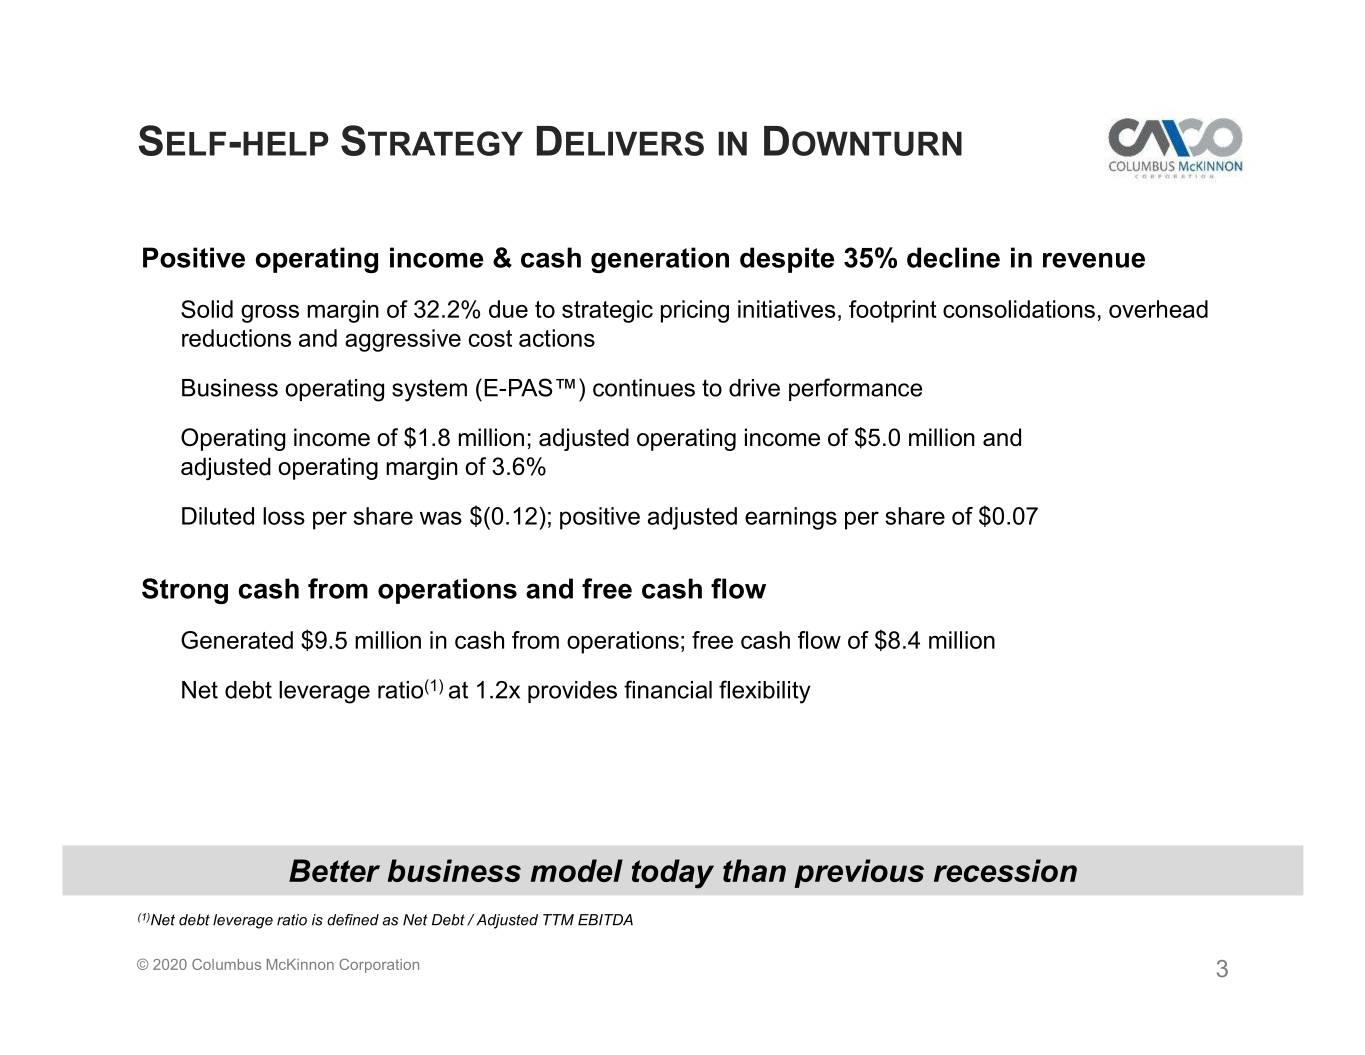
SELF-HELP STRATEGY DELIVERS IN DOWNTURN Positive operating income & cash generation despite 35% decline in revenue Solid gross margin of 32.2% due to strategic pricing initiatives, footprint consolidations, overhead reductions and aggressive cost actions Business operating system (E-PAS™) continues to drive performance Operating income of $1.8 million; adjusted operating income of $5.0 million and adjusted operating margin of 3.6% Diluted loss per share was $(0.12); positive adjusted earnings per share of $0.07 Strong cash from operations and free cash flow Generated $9.5 million in cash from operations; free cash flow of $8.4 million Net debt leverage ratio(1) at 1.2x provides financial flexibility Better business model today than previous recession (1)Net debt leverage ratio is defined as Net Debt / Adjusted TTM EBITDA © 2020 Columbus McKinnon Corporation 3
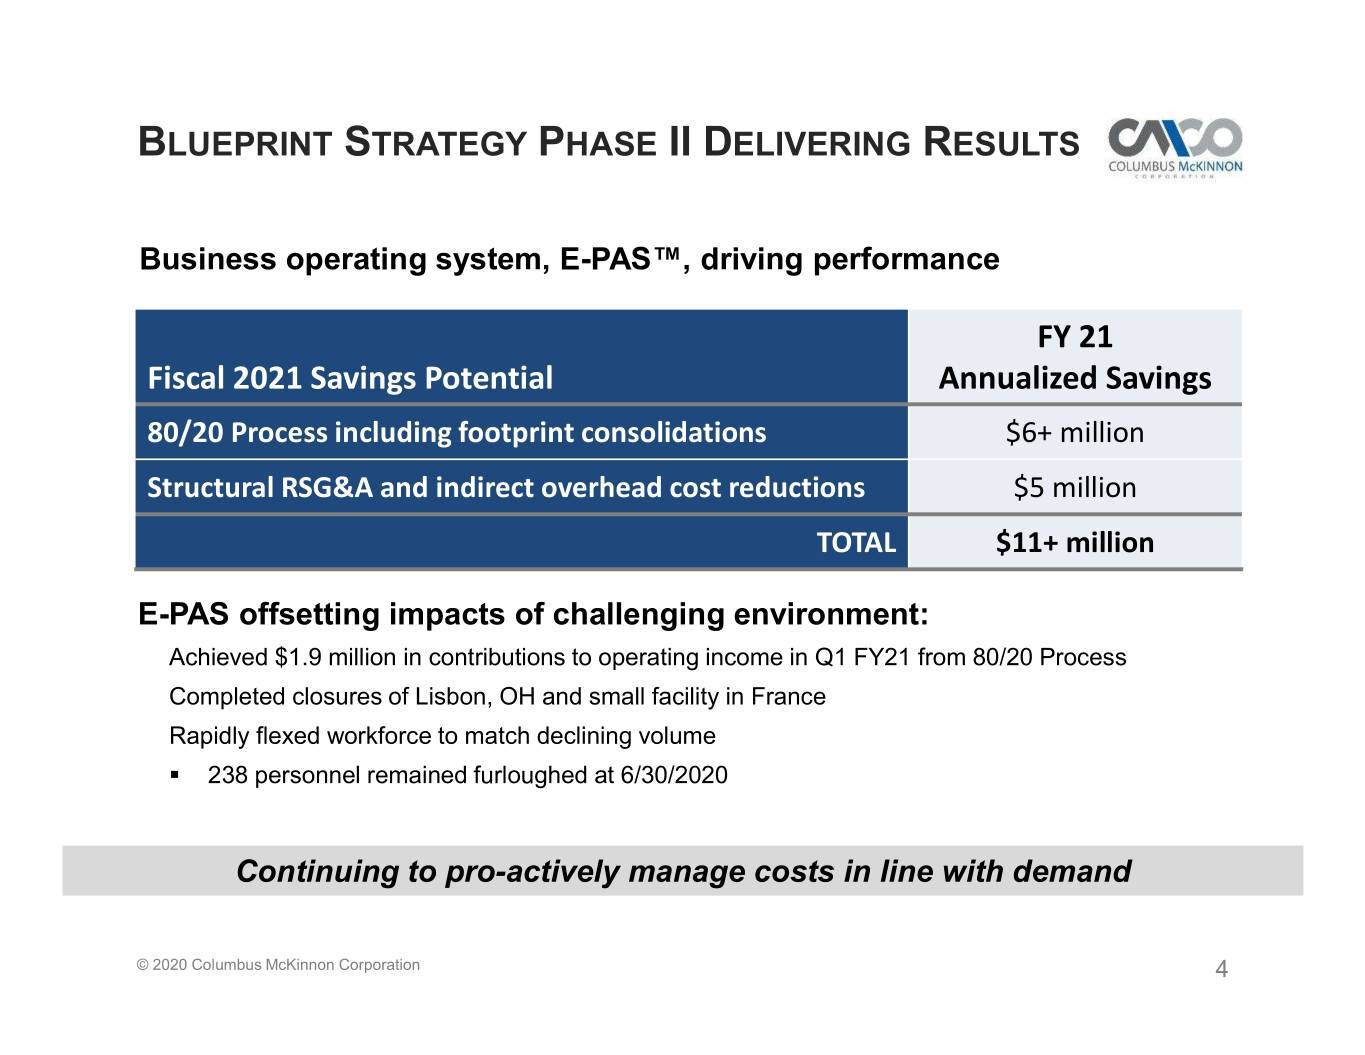
BLUEPRINT STRATEGY PHASE II DELIVERING RESULTS Business operating system, E-PAS™, driving performance FY 21 Fiscal 2021 Savings Potential Annualized Savings 80/20 Process including footprint consolidations $6+ million Structural RSG&A and indirect overhead cost reductions $5 million TOTAL $11+ million E-PAS offsetting impacts of challenging environment: Achieved $1.9 million in contributions to operating income in Q1 FY21 from 80/20 Process Completed closures of Lisbon, OH and small facility in France Rapidly flexed workforce to match declining volume . 238 personnel remained furloughed at 6/30/2020 Continuing to pro-actively manage costs in line with demand © 2020 Columbus McKinnon Corporation 4
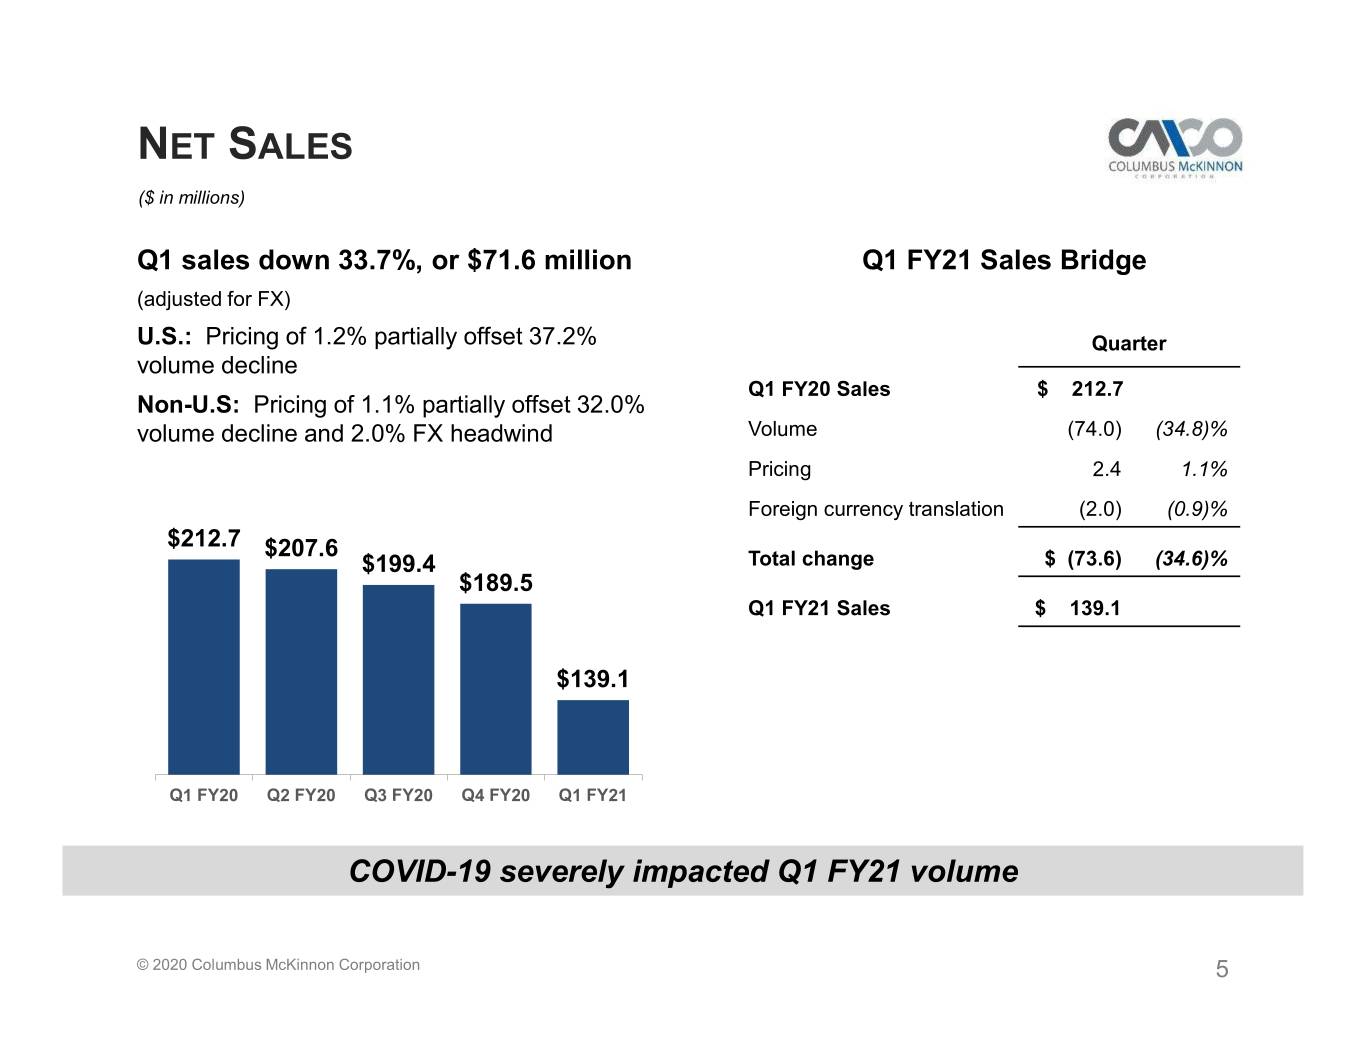
NET SALES ($ in millions) Q1 sales down 33.7%, or $71.6 million Q1 FY21 Sales Bridge (adjusted for FX) U.S.: Pricing of 1.2% partially offset 37.2% Quarter volume decline Q1 FY20 Sales $ 212.7 Non-U.S: Pricing of 1.1% partially offset 32.0% volume decline and 2.0% FX headwind Volume (74.0) (34.8)% Pricing 2.4 1.1% Foreign currency translation (2.0) (0.9)% $212.7 $207.6 $199.4 Total change $ (73.6) (34.6)% $189.5 Q1 FY21 Sales $ 139.1 $139.1 Q1 FY20 Q2 FY20 Q3 FY20 Q4 FY20 Q1 FY21 COVID-19 severely impacted Q1 FY21 volume © 2020 Columbus McKinnon Corporation 5
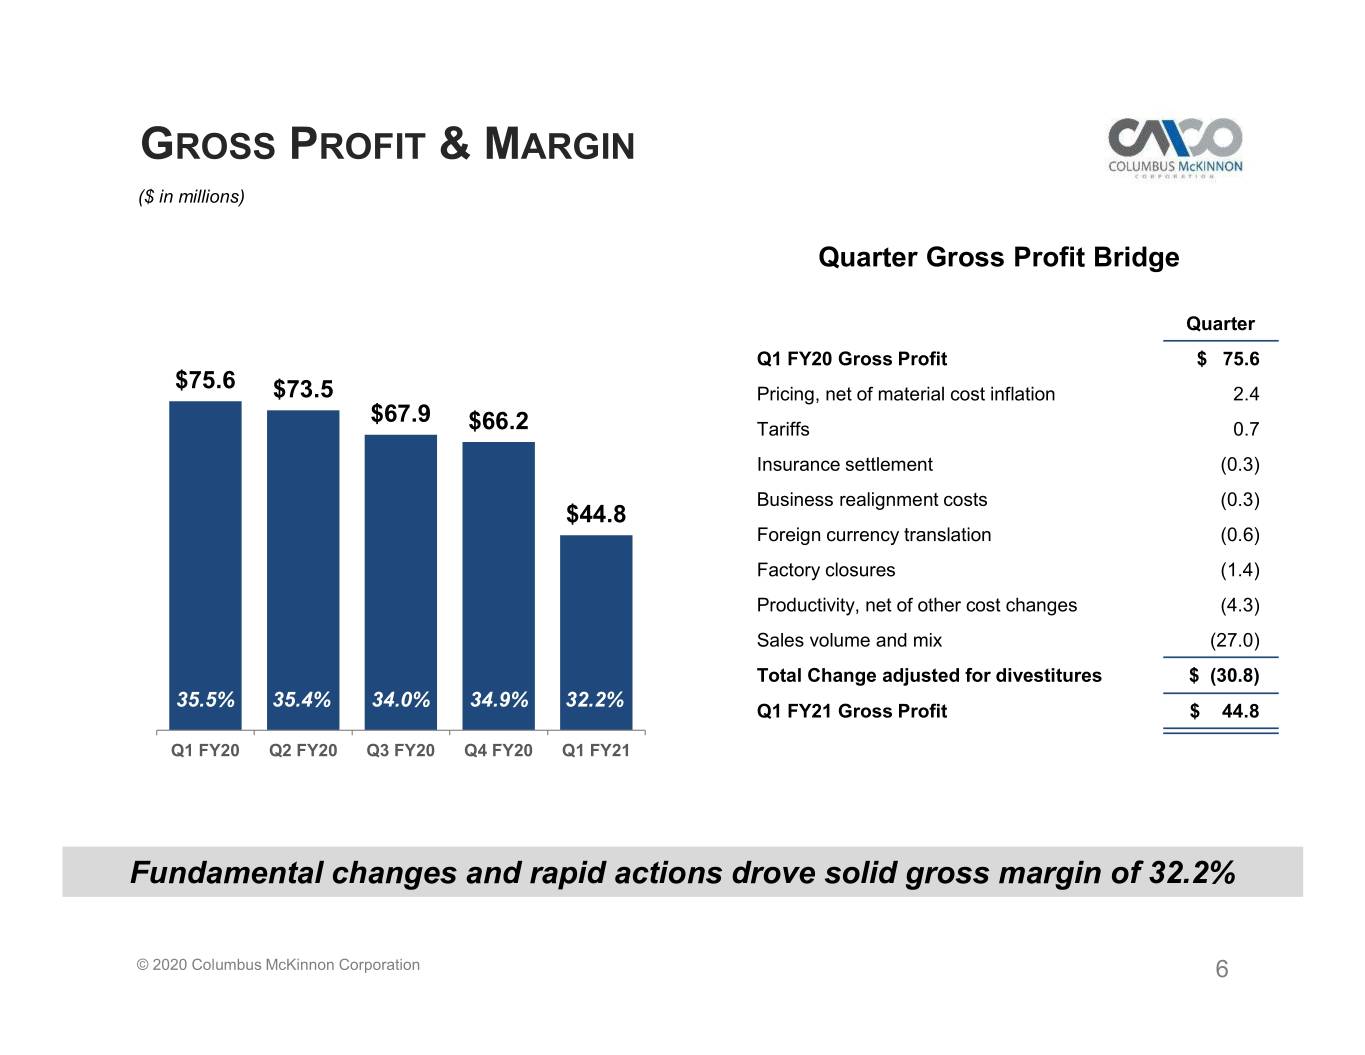
GROSS PROFIT & MARGIN ($ in millions) Quarter Gross Profit Bridge Quarter Q1 FY20 Gross Profit $ 75.6 $75.6 $73.5 Pricing, net of material cost inflation 2.4 $67.9 $66.2 Tariffs 0.7 Insurance settlement (0.3) Business realignment costs (0.3) $44.8 Foreign currency translation (0.6) Factory closures (1.4) Productivity, net of other cost changes (4.3) Sales volume and mix (27.0) Total Change adjusted for divestitures $ (30.8) 35.5%35.4% 34.0% 34.9% 32.2% Q1 FY21 Gross Profit $ 44.8 Q1 FY20 Q2 FY20 Q3 FY20 Q4 FY20 Q1 FY21 Fundamental changes and rapid actions drove solid gross margin of 32.2% © 2020 Columbus McKinnon Corporation 6
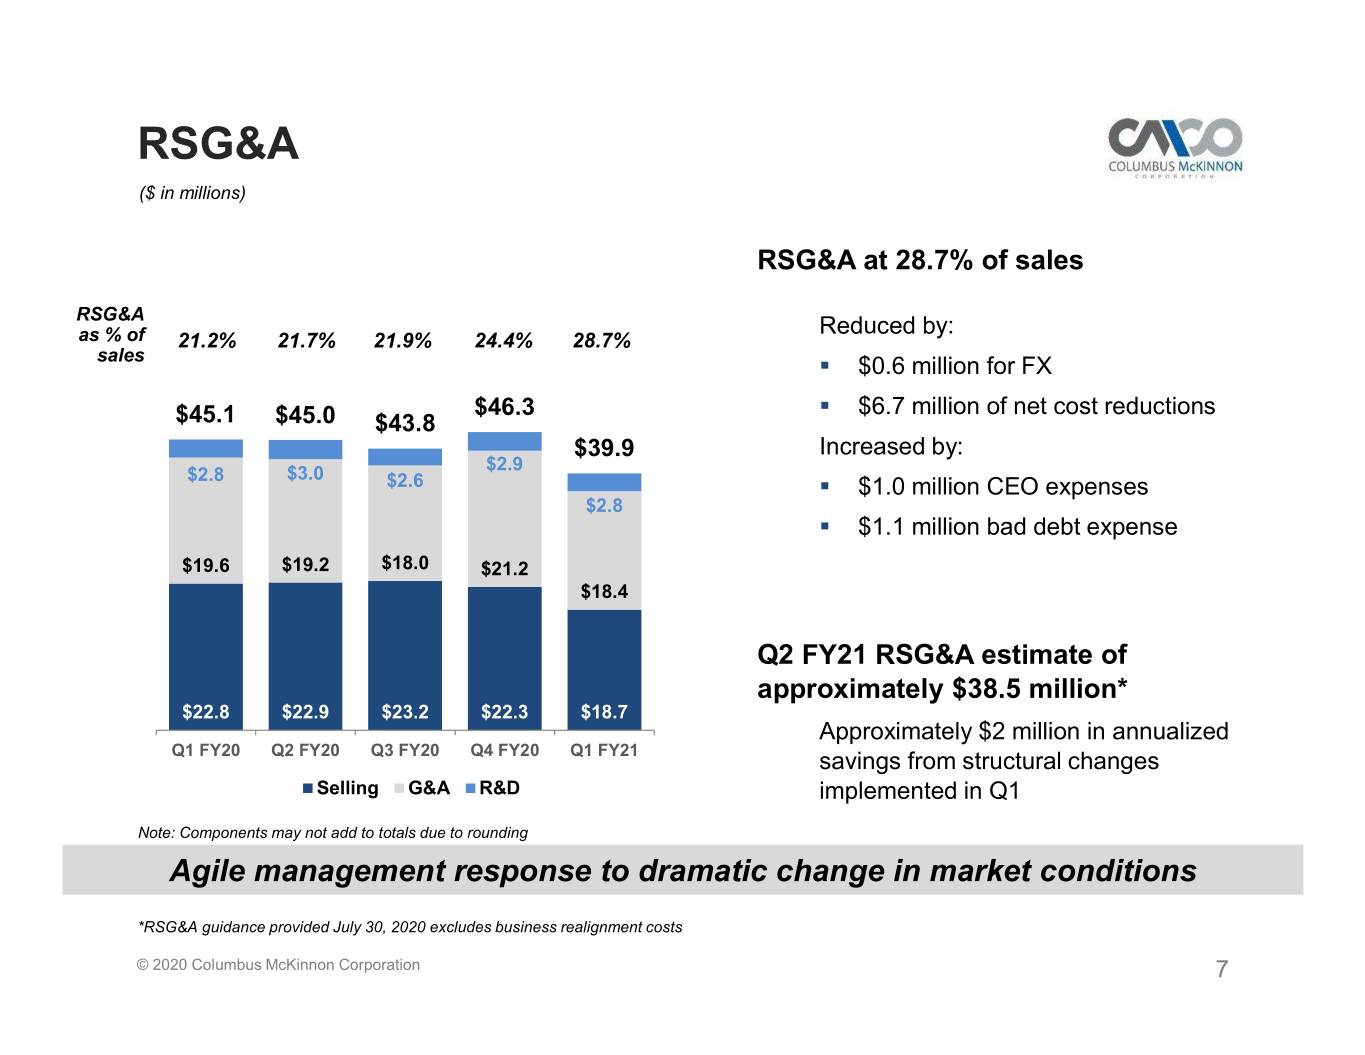
RSG&A ($ in millions) RSG&A at 28.7% of sales RSG&A Reduced by: as % of 21.2% 21.7% 21.9% 24.4% 28.7% sales . $0.6 million for FX $46.3 . $6.7 million of net cost reductions $45.1 $45.0 $43.8 $39.9 Increased by: $2.9 $2.8 $3.0 $2.6 . $1.0 million CEO expenses $2.8 . $1.1 million bad debt expense $19.6 $19.2 $18.0 $21.2 $18.4 Q2 FY21 RSG&A estimate of approximately $38.5 million* $22.8 $22.9 $23.2 $22.3 $18.7 Approximately $2 million in annualized Q1 FY20 Q2 FY20 Q3 FY20 Q4 FY20 Q1 FY21 savings from structural changes Selling G&A R&D implemented in Q1 Note: Components may not add to totals due to rounding Agile management response to dramatic change in market conditions *RSG&A guidance provided July 30, 2020 excludes business realignment costs © 2020 Columbus McKinnon Corporation 7
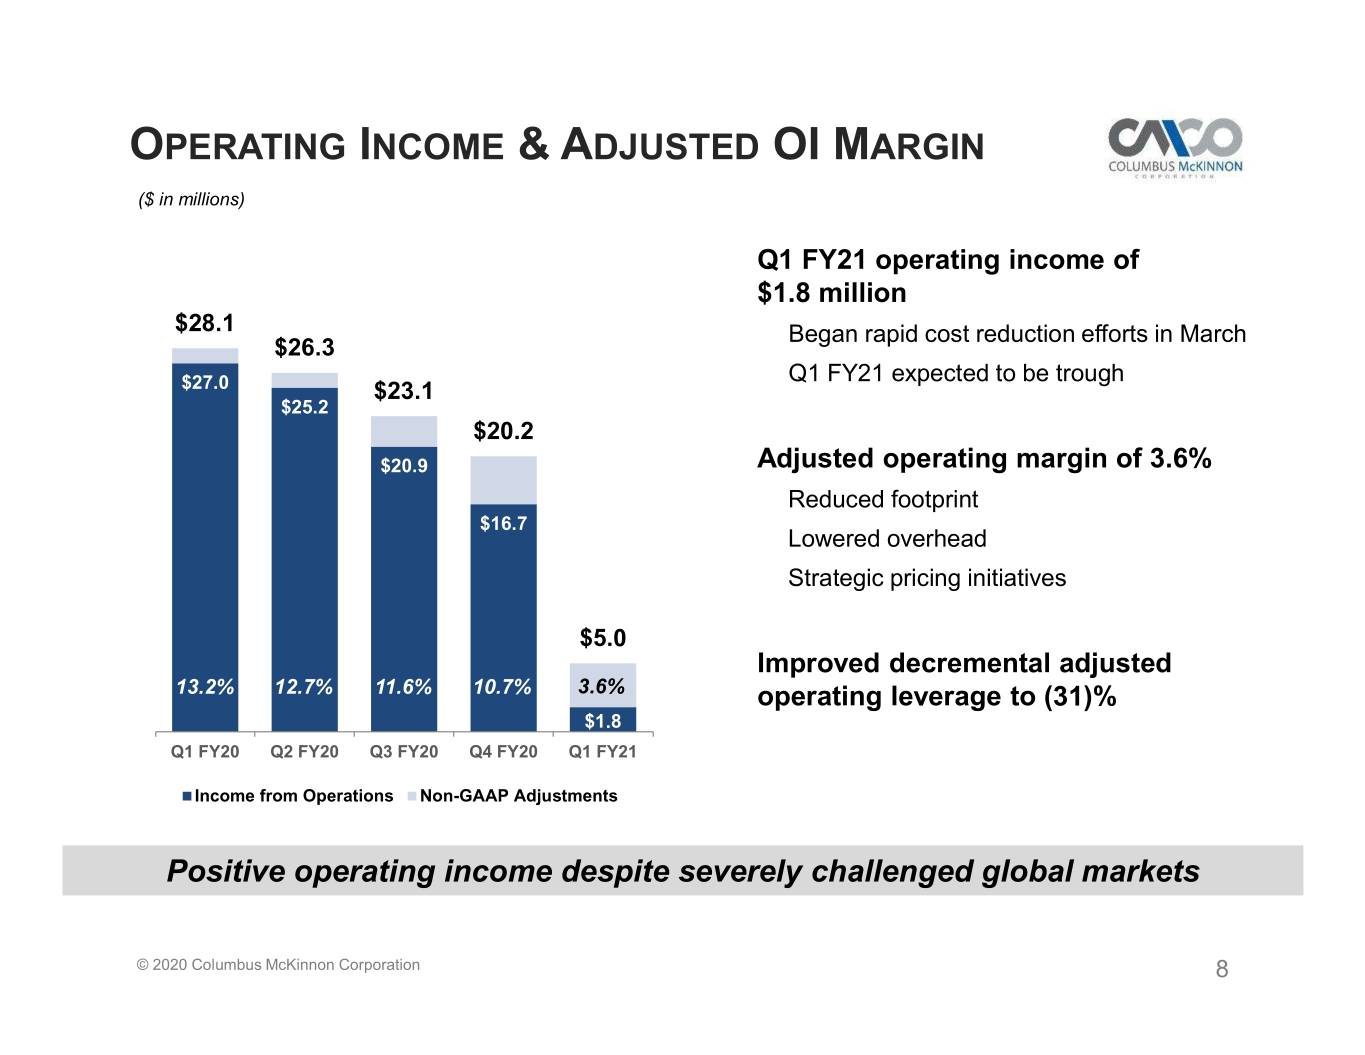
OPERATING INCOME & ADJUSTED OI MARGIN ($ in millions) Q1 FY21 operating income of $1.8 million $28.1 Began rapid cost reduction efforts in March $26.3 Q1 FY21 expected to be trough $27.0 $23.1 $25.2 $20.2 $20.9 Adjusted operating margin of 3.6% Reduced footprint $16.7 Lowered overhead Strategic pricing initiatives $5.0 Improved decremental adjusted 13.2% 12.7% 11.6% 10.7% 3.6% operating leverage to (31)% $1.8 Q1 FY20 Q2 FY20 Q3 FY20 Q4 FY20 Q1 FY21 Income from Operations Non-GAAP Adjustments Positive operating income despite severely challenged global markets © 2020 Columbus McKinnon Corporation 8
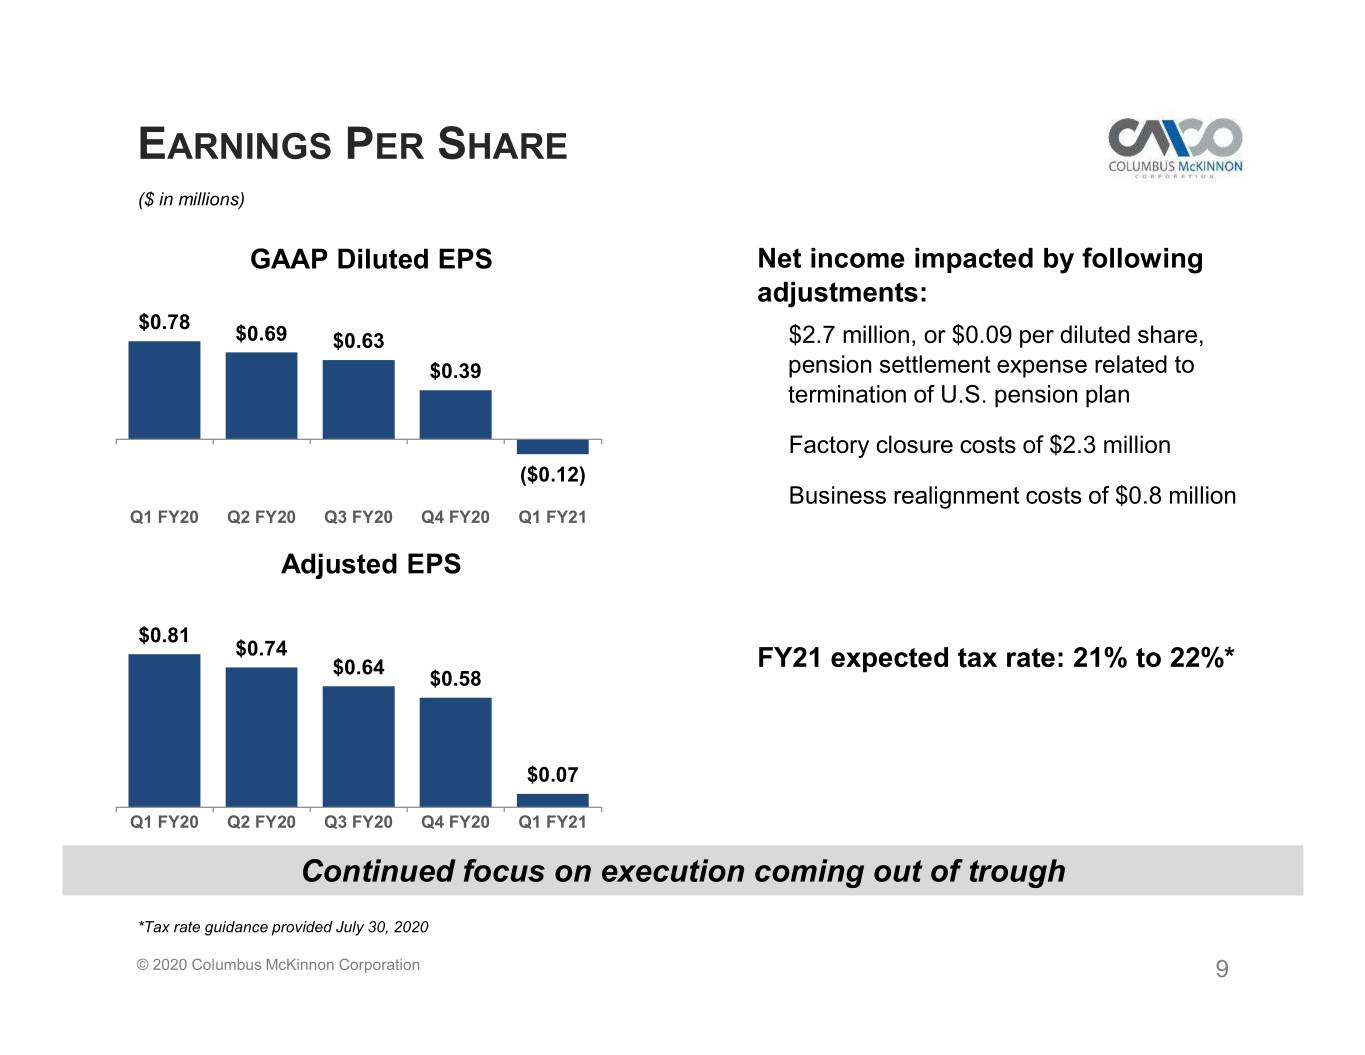
EARNINGS PER SHARE ($ in millions) GAAP Diluted EPS Net income impacted by following adjustments: $0.78$0.83 $0.69 $0.63 $2.7 million, or $0.09 per diluted share, $0.39 pension settlement expense related to termination of U.S. pension plan Factory closure costs of $2.3 million ($0.12) Business realignment costs of $0.8 million Q1 FY20 Q2 FY20 Q3 FY20 Q4 FY20 Q1 FY21 Adjusted EPS $0.81 $0.74 $0.64 FY21 expected tax rate: 21% to 22%* $0.58 $0.07 Q1 FY20 Q2 FY20 Q3 FY20 Q4 FY20 Q1 FY21 Continued focus on execution coming out of trough *Tax rate guidance provided July 30, 2020 © 2020 Columbus McKinnon Corporation 9
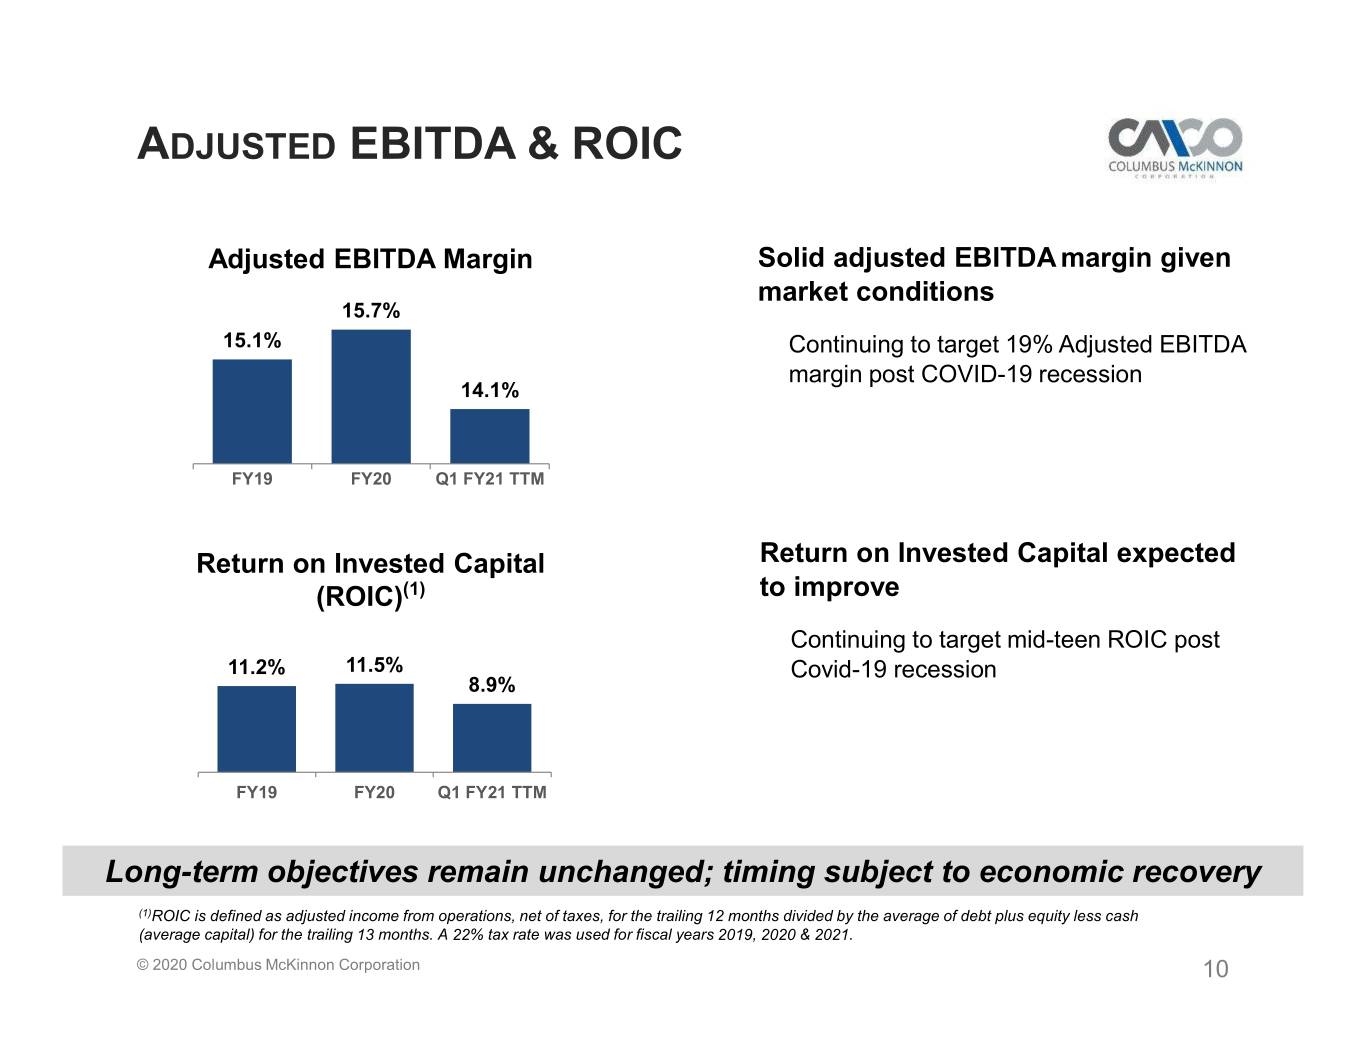
ADJUSTED EBITDA & ROIC Adjusted EBITDA Margin Solid adjusted EBITDA margin given market conditions 15.7% 15.1% Continuing to target 19% Adjusted EBITDA margin post COVID-19 recession 14.1% FY19 FY20 Q1 FY21 TTM Return on Invested Capital Return on Invested Capital expected (ROIC)(1) to improve Continuing to target mid-teen ROIC post 11.2% 11.5% Covid-19 recession 8.9% FY19 FY20 Q1 FY21 TTM Long-term objectives remain unchanged; timing subject to economic recovery (1)ROIC is defined as adjusted income from operations, net of taxes, for the trailing 12 months divided by the average of debt plus equity less cash (average capital) for the trailing 13 months. A 22% tax rate was used for fiscal years 2019, 2020 & 2021. © 2020 Columbus McKinnon Corporation 10
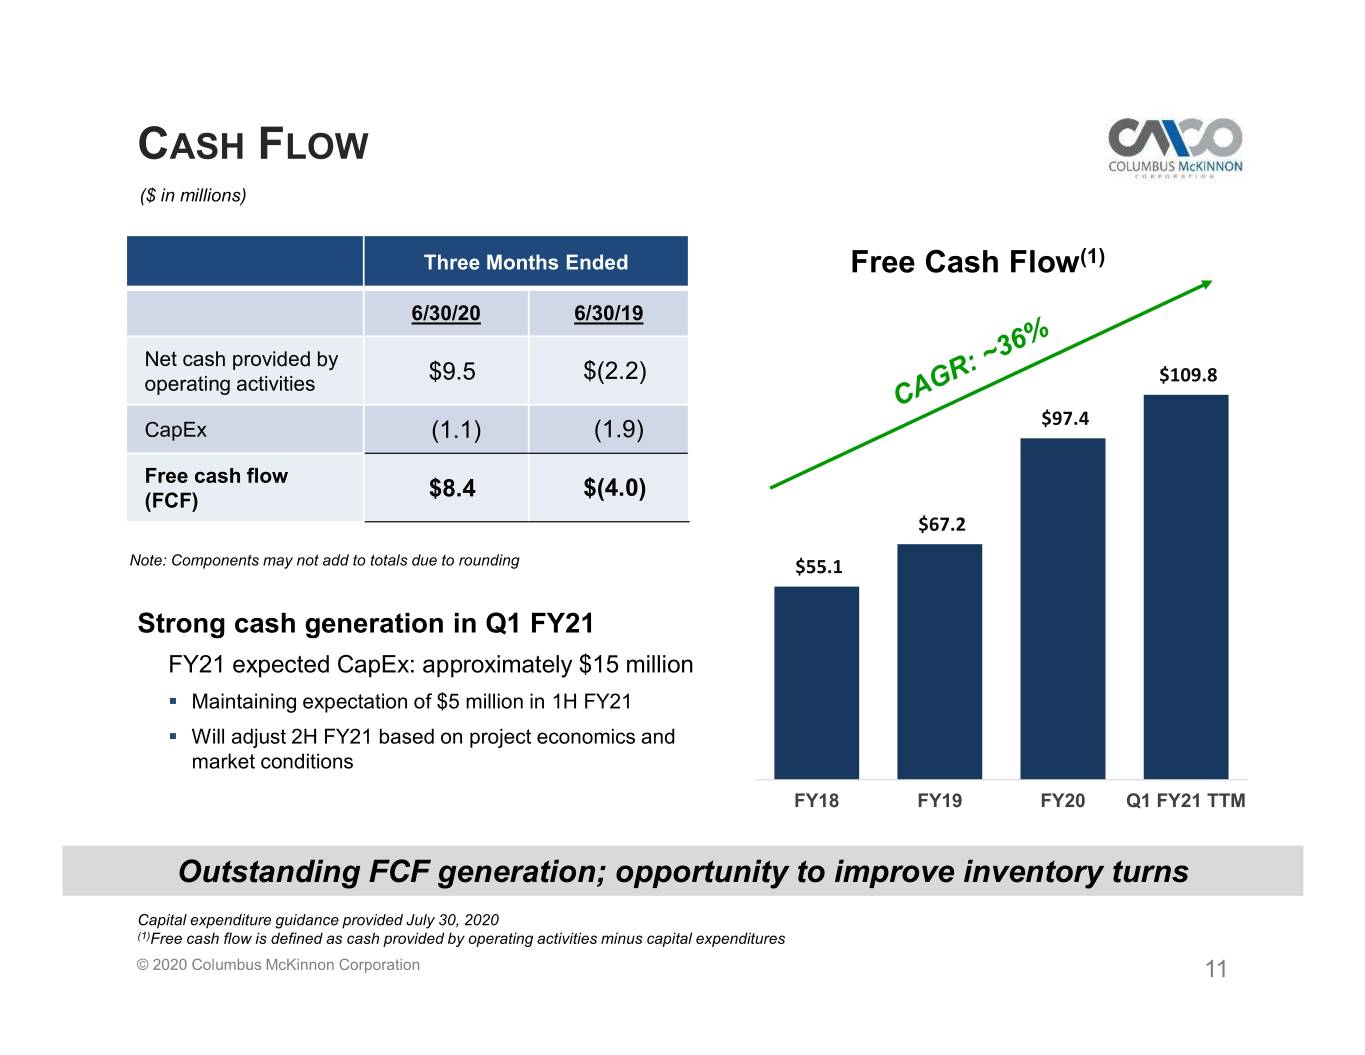
CASH FLOW ($ in millions) Three Months Ended Free Cash Flow(1) 6/30/20 6/30/19 Net cash provided by $9.5 $(2.2) operating activities $109.8 $97.4 CapEx (1.1) (1.9) Free cash flow $8.4 $(4.0) (FCF) $67.2 Note: Components may not add to totals due to rounding $55.1 Strong cash generation in Q1 FY21 FY21 expected CapEx: approximately $15 million . Maintaining expectation of $5 million in 1H FY21 . Will adjust 2H FY21 based on project economics and market conditions FY18 FY19 FY20 Q1 FY21 TTM Outstanding FCF generation; opportunity to improve inventory turns Capital expenditure guidance provided July 30, 2020 (1)Free cash flow is defined as cash provided by operating activities minus capital expenditures © 2020 Columbus McKinnon Corporation 11
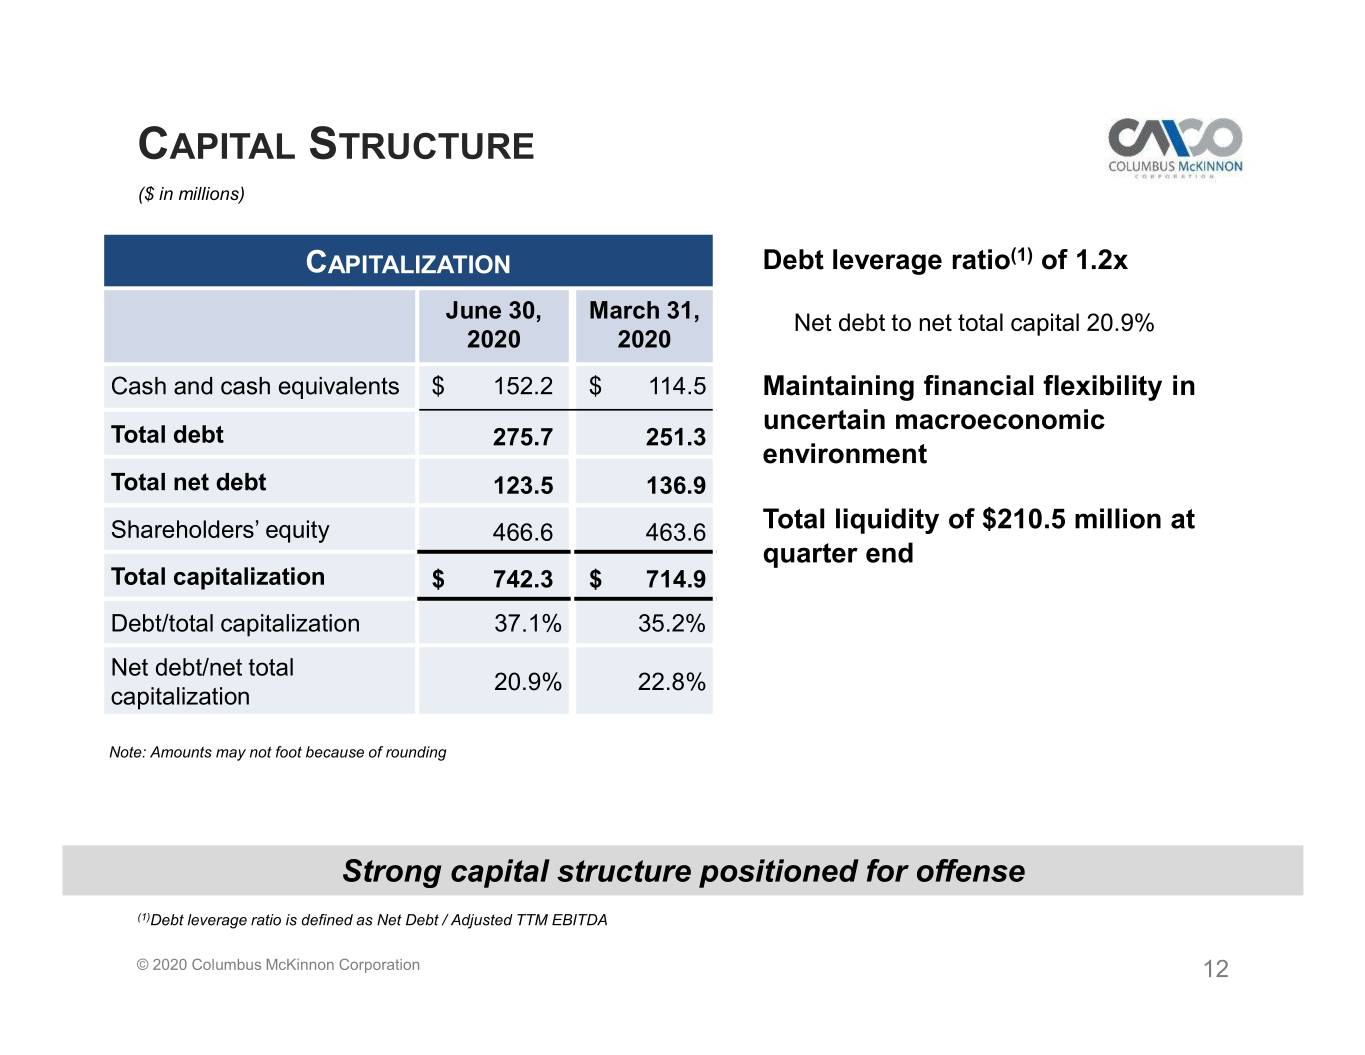
CAPITAL STRUCTURE ($ in millions) CAPITALIZATION Debt leverage ratio(1) of 1.2x June 30, March 31, Net debt to net total capital 20.9% 2020 2020 Cash and cash equivalents $ 152.2 $ 114.5 Maintaining financial flexibility in uncertain macroeconomic Total debt 275.7 251.3 environment Total net debt 123.5 136.9 Shareholders’ equity 466.6 463.6 Total liquidity of $210.5 million at quarter end Total capitalization $ 742.3 $ 714.9 Debt/total capitalization 37.1% 35.2% Net debt/net total 20.9% 22.8% capitalization Note: Amounts may not foot because of rounding Strong capital structure positioned for offense (1)Debt leverage ratio is defined as Net Debt / Adjusted TTM EBITDA © 2020 Columbus McKinnon Corporation 12
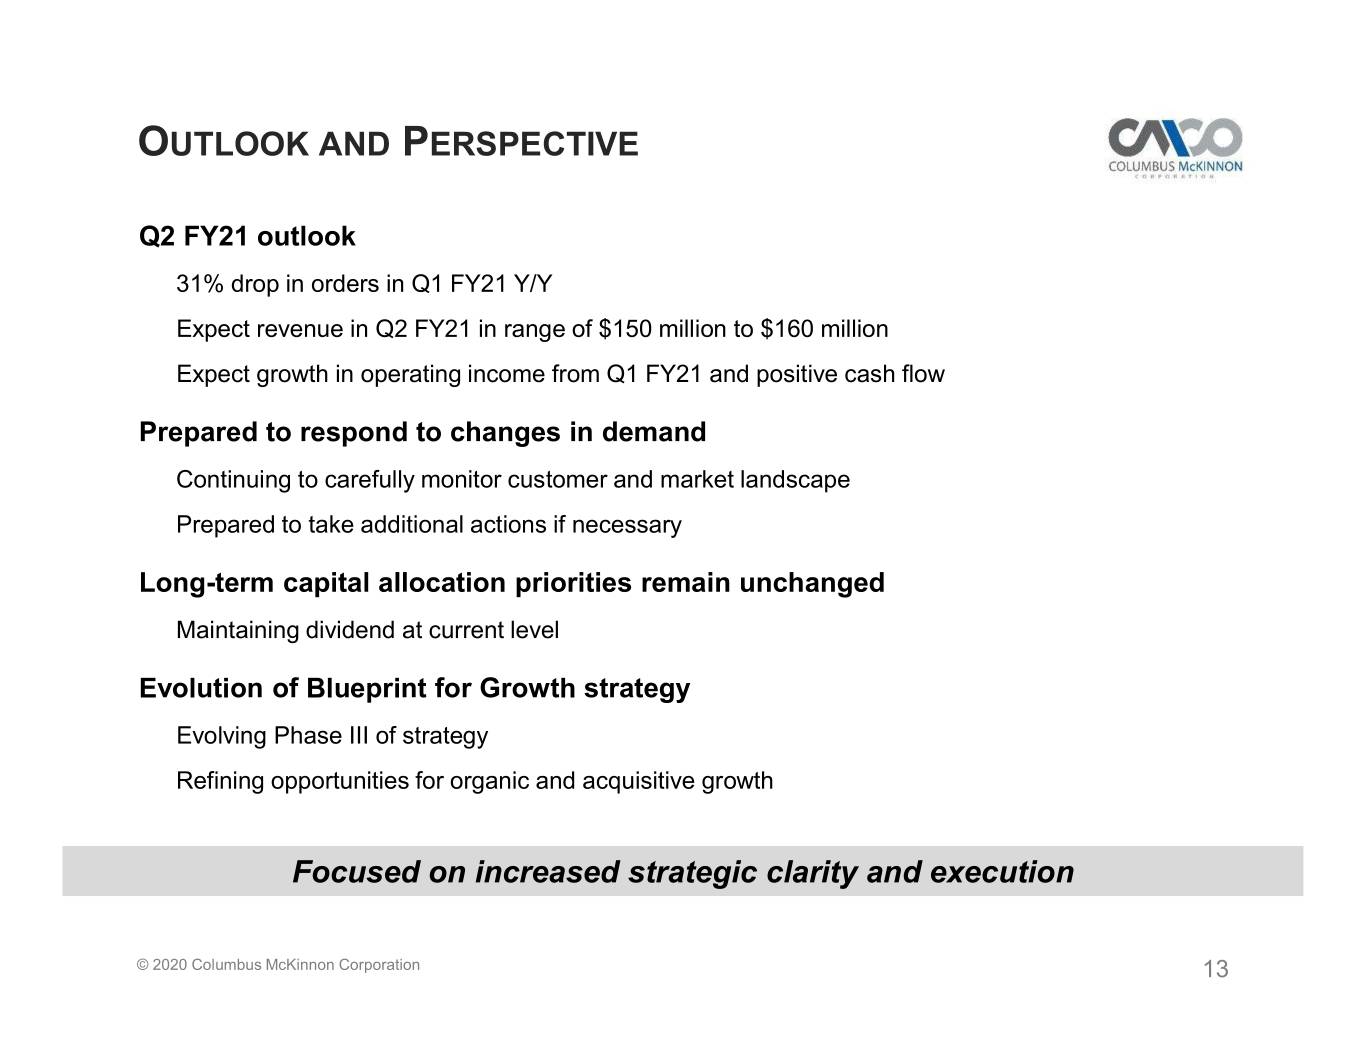
OUTLOOK AND PERSPECTIVE Q2 FY21 outlook 31% drop in orders in Q1 FY21 Y/Y Expect revenue in Q2 FY21 in range of $150 million to $160 million Expect growth in operating income from Q1 FY21 and positive cash flow Prepared to respond to changes in demand Continuing to carefully monitor customer and market landscape Prepared to take additional actions if necessary Long-term capital allocation priorities remain unchanged Maintaining dividend at current level Evolution of Blueprint for Growth strategy Evolving Phase III of strategy Refining opportunities for organic and acquisitive growth Focused on increased strategic clarity and execution © 2020 Columbus McKinnon Corporation 13
Supplemental Information © 2020 Columbus McKinnon Corporation 14
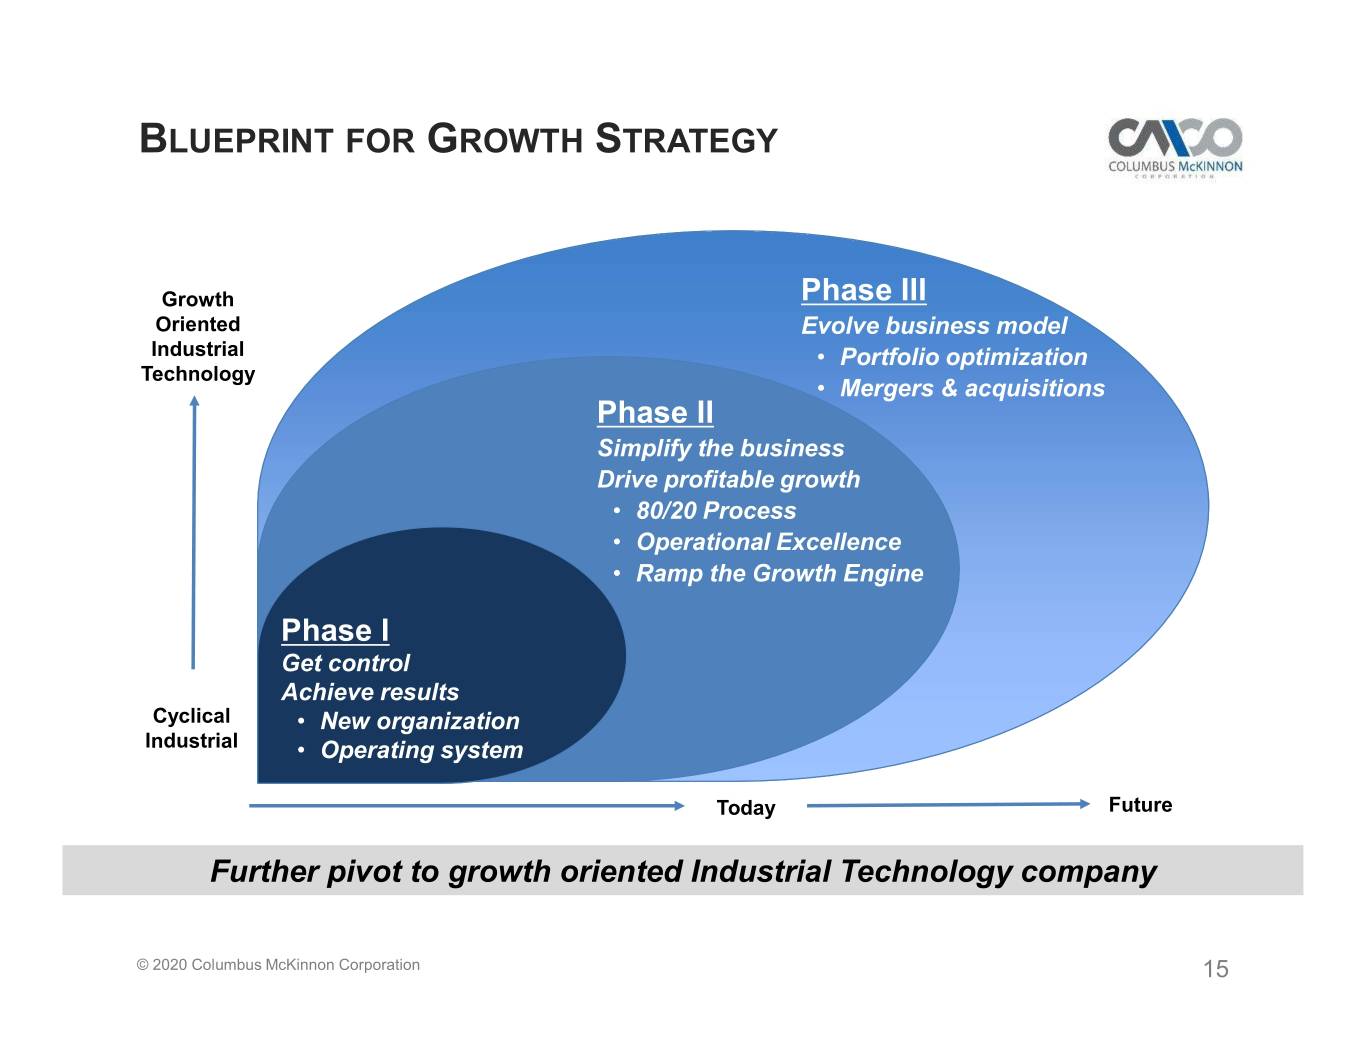
BLUEPRINT FOR GROWTH STRATEGY Growth Phase III Oriented Evolve business model Industrial • Portfolio optimization Technology • Mergers & acquisitions Phase II Simplify the business Drive profitable growth • 80/20 Process • Operational Excellence • Ramp the Growth Engine Phase I Get control Achieve results Cyclical • New organization Industrial • Operating system Today Future Further pivot to growth oriented Industrial Technology company © 2020 Columbus McKinnon Corporation 15
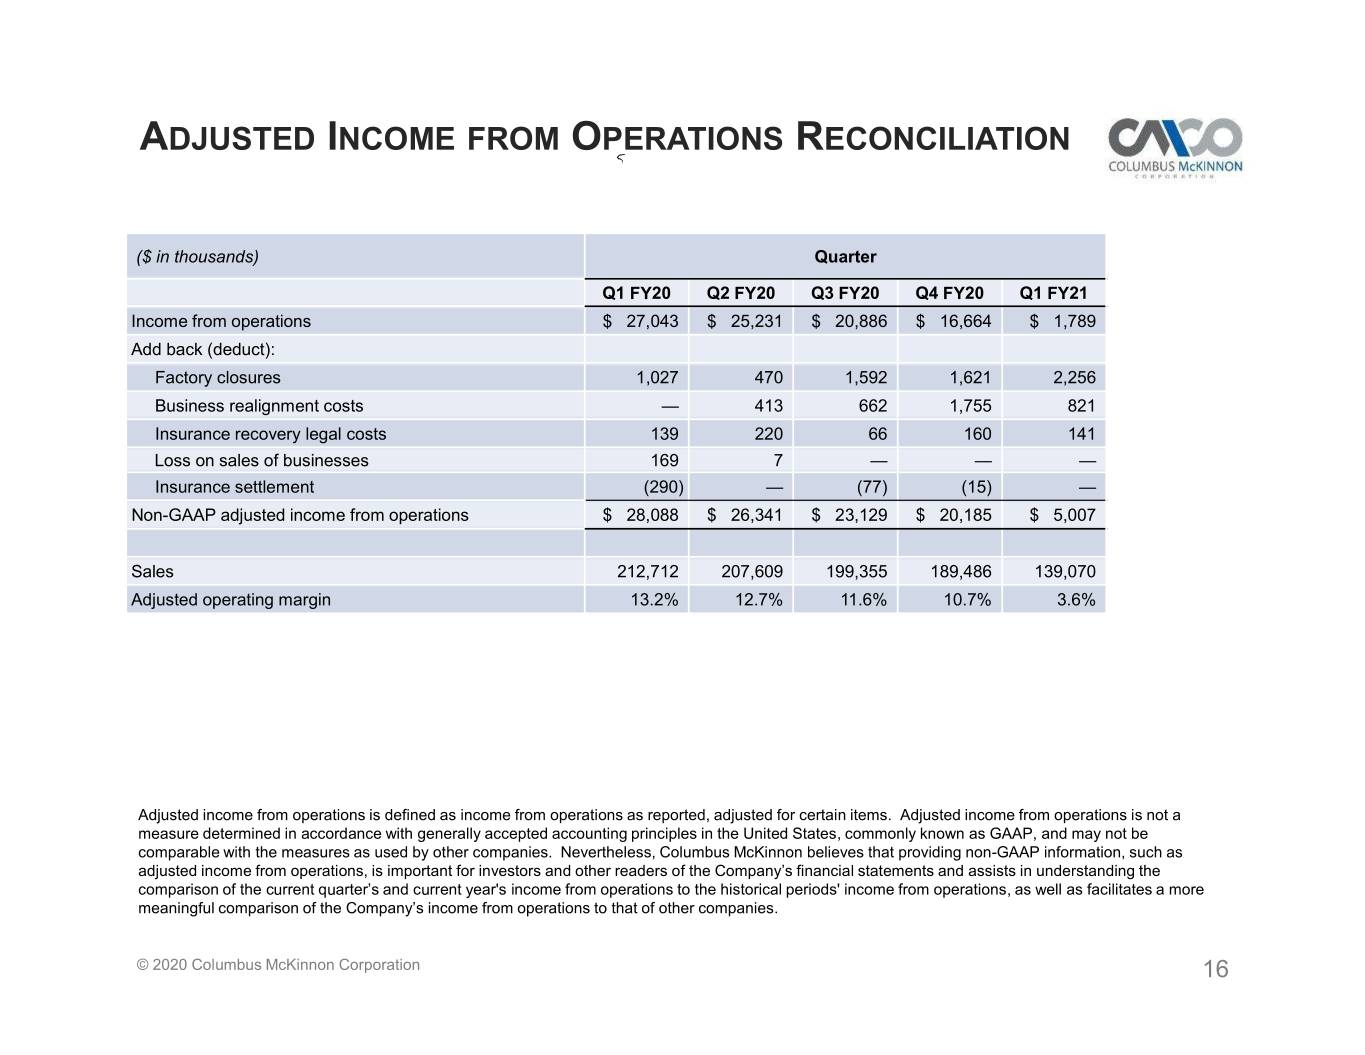
ADJUSTED INCOME FROM OPERATIONS RECONCILIATION ($ in thousands) Quarter Q1 FY20 Q2 FY20 Q3 FY20 Q4 FY20 Q1 FY21 Income from operations $ 27,043 $ 25,231 $ 20,886 $ 16,664 $ 1,789 Add back (deduct): Factory closures 1,027 470 1,592 1,621 2,256 Business realignment costs — 413 662 1,755 821 Insurance recovery legal costs 139 220 66 160 141 Loss on sales of businesses 169 7 — — — Insurance settlement (290) — (77) (15) — Non-GAAP adjusted income from operations $ 28,088 $ 26,341 $ 23,129 $ 20,185 $ 5,007 Sales 212,712 207,609 199,355 189,486 139,070 Adjusted operating margin 13.2% 12.7% 11.6% 10.7% 3.6% Adjusted income from operations is defined as income from operations as reported, adjusted for certain items. Adjusted income from operations is not a measure determined in accordance with generally accepted accounting principles in the United States, commonly known as GAAP, and may not be comparable with the measures as used by other companies. Nevertheless, Columbus McKinnon believes that providing non-GAAP information, such as adjusted income from operations, is important for investors and other readers of the Company’s financial statements and assists in understanding the comparison of the current quarter’s and current year's income from operations to the historical periods' income from operations, as well as facilitates a more meaningful comparison of the Company’s income from operations to that of other companies. © 2020 Columbus McKinnon Corporation 16
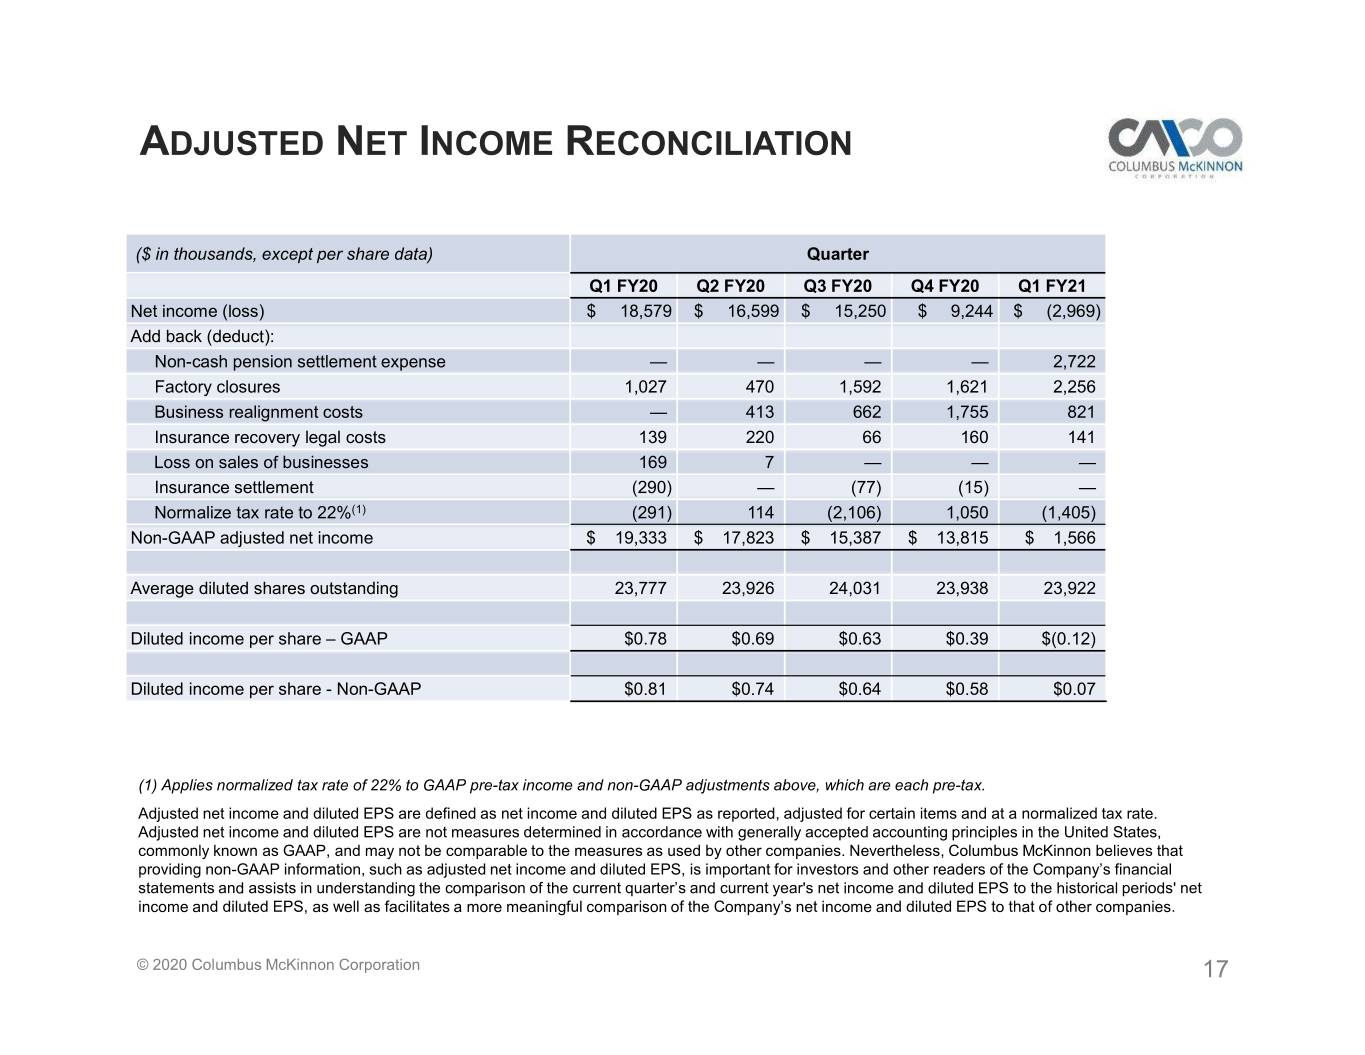
ADJUSTED NET INCOME RECONCILIATION ($ in thousands, except per share data) Quarter Q1 FY20 Q2 FY20 Q3 FY20 Q4 FY20 Q1 FY21 Net income (loss) $ 18,579 $ 16,599 $ 15,250 $ 9,244 $ (2,969) Add back (deduct): Non-cash pension settlement expense — — — — 2,722 Factory closures 1,027 470 1,592 1,621 2,256 Business realignment costs — 413 662 1,755 821 Insurance recovery legal costs 139 220 66 160 141 Loss on sales of businesses 169 7 — — — Insurance settlement (290) — (77) (15) — Normalize tax rate to 22%(1) (291) 114 (2,106) 1,050 (1,405) Non-GAAP adjusted net income $ 19,333 $ 17,823 $ 15,387 $ 13,815 $ 1,566 Average diluted shares outstanding 23,777 23,926 24,031 23,938 23,922 Diluted income per share – GAAP $0.78 $0.69 $0.63 $0.39 $(0.12) Diluted income per share - Non-GAAP $0.81 $0.74 $0.64 $0.58 $0.07 (1) Applies normalized tax rate of 22% to GAAP pre-tax income and non-GAAP adjustments above, which are each pre-tax. Adjusted net income and diluted EPS are defined as net income and diluted EPS as reported, adjusted for certain items and at a normalized tax rate. Adjusted net income and diluted EPS are not measures determined in accordance with generally accepted accounting principles in the United States, commonly known as GAAP, and may not be comparable to the measures as used by other companies. Nevertheless, Columbus McKinnon believes that providing non-GAAP information, such as adjusted net income and diluted EPS, is important for investors and other readers of the Company’s financial statements and assists in understanding the comparison of the current quarter’s and current year's net income and diluted EPS to the historical periods' net income and diluted EPS, as well as facilitates a more meaningful comparison of the Company’s net income and diluted EPS to that of other companies. © 2020 Columbus McKinnon Corporation 17
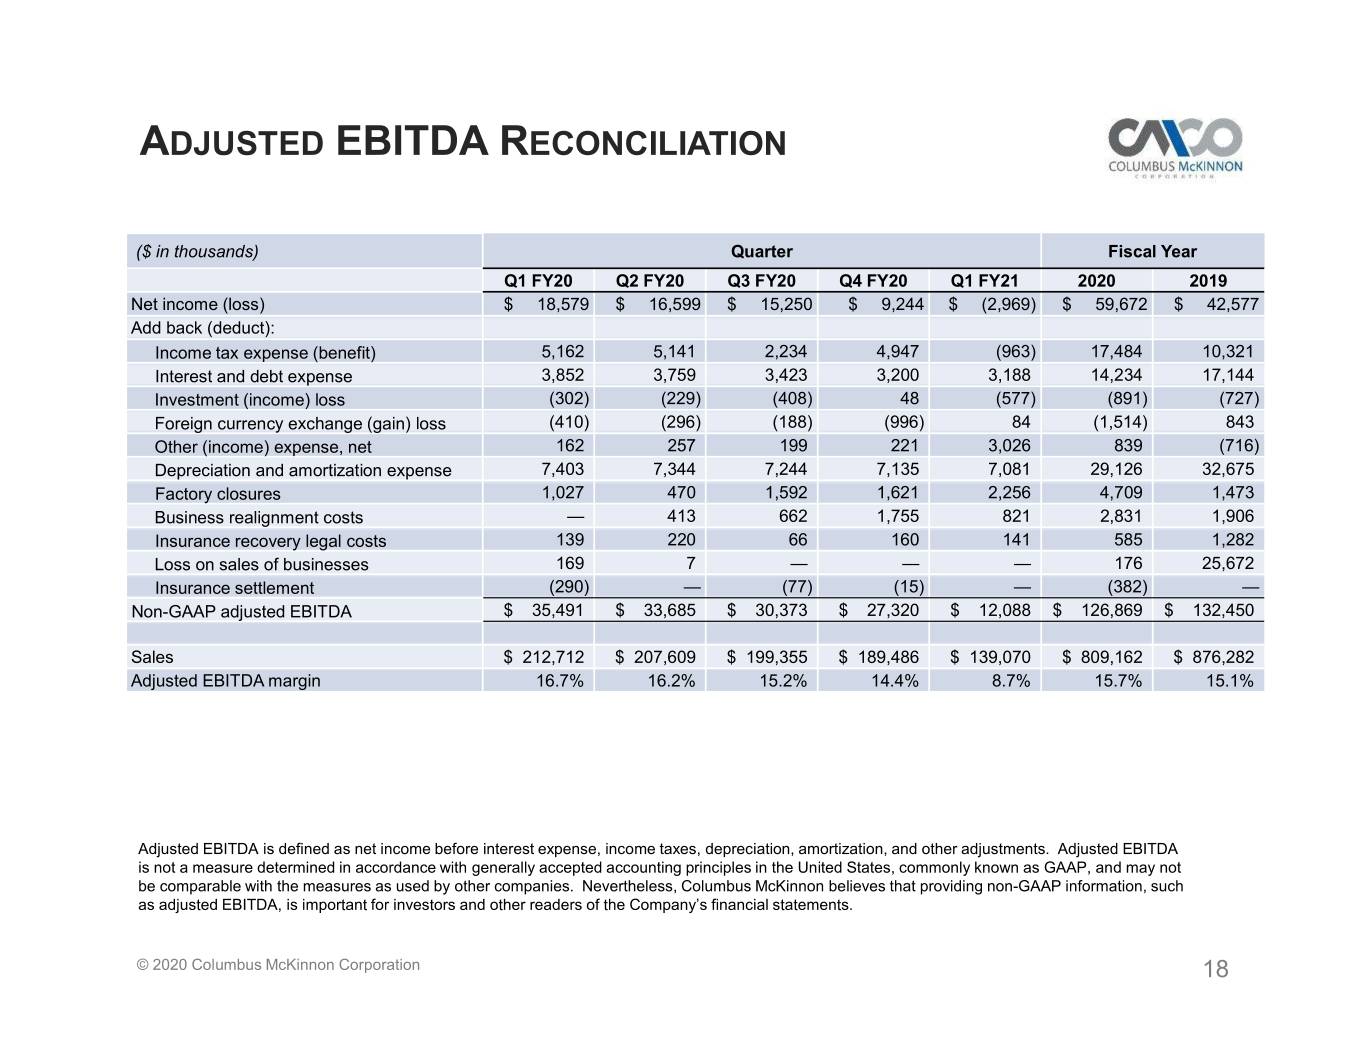
ADJUSTED EBITDA RECONCILIATION ($ in thousands) Quarter Fiscal Year Q1 FY20 Q2 FY20 Q3 FY20 Q4 FY20 Q1 FY21 2020 2019 Net income (loss) $ 18,579 $ 16,599 $ 15,250 $ 9,244 $ (2,969) $ 59,672 $ 42,577 Add back (deduct): Income tax expense (benefit) 5,162 5,141 2,234 4,947 (963) 17,484 10,321 Interest and debt expense 3,852 3,759 3,423 3,200 3,188 14,234 17,144 Investment (income) loss (302) (229) (408) 48 (577) (891) (727) Foreign currency exchange (gain) loss (410) (296) (188) (996) 84 (1,514) 843 Other (income) expense, net 162 257 199 221 3,026 839 (716) Depreciation and amortization expense 7,403 7,344 7,244 7,135 7,081 29,126 32,675 Factory closures 1,027 470 1,592 1,621 2,256 4,709 1,473 Business realignment costs — 413 662 1,755 821 2,831 1,906 Insurance recovery legal costs 139 220 66 160 141 585 1,282 Loss on sales of businesses 169 7 — — — 176 25,672 Insurance settlement (290) — (77) (15) — (382) — Non-GAAP adjusted EBITDA $ 35,491 $ 33,685 $ 30,373 $ 27,320 $ 12,088 $ 126,869 $ 132,450 Sales $ 212,712 $ 207,609 $ 199,355 $ 189,486 $ 139,070 $ 809,162 $ 876,282 Adjusted EBITDA margin 16.7% 16.2% 15.2% 14.4% 8.7% 15.7% 15.1% Adjusted EBITDA is defined as net income before interest expense, income taxes, depreciation, amortization, and other adjustments. Adjusted EBITDA is not a measure determined in accordance with generally accepted accounting principles in the United States, commonly known as GAAP, and may not be comparable with the measures as used by other companies. Nevertheless, Columbus McKinnon believes that providing non-GAAP information, such as adjusted EBITDA, is important for investors and other readers of the Company’s financial statements. © 2020 Columbus McKinnon Corporation 18
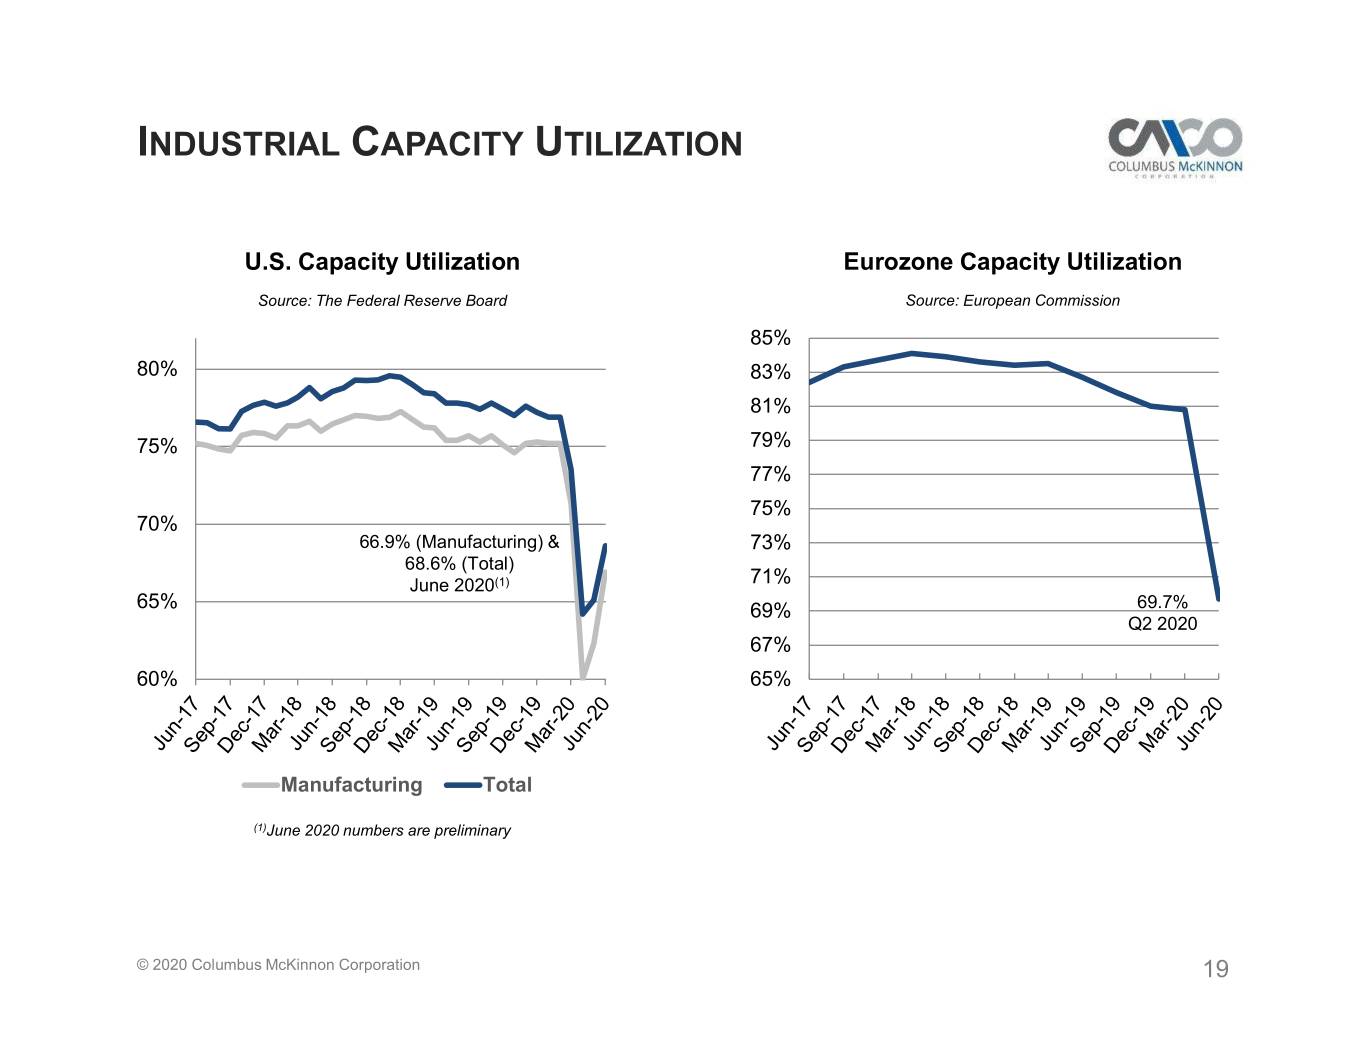
INDUSTRIAL CAPACITY UTILIZATION U.S. Capacity Utilization Eurozone Capacity Utilization Source: The Federal Reserve Board Source: European Commission 85% 80% 83% 81% 75% 79% 77% 75% 70% 66.9% (Manufacturing) & 73% 68.6% (Total) June 2020(1) 71% 65% 69% 69.7% Q2 2020 67% 60% 65% Manufacturing Total (1)June 2020 numbers are preliminary © 2020 Columbus McKinnon Corporation 19
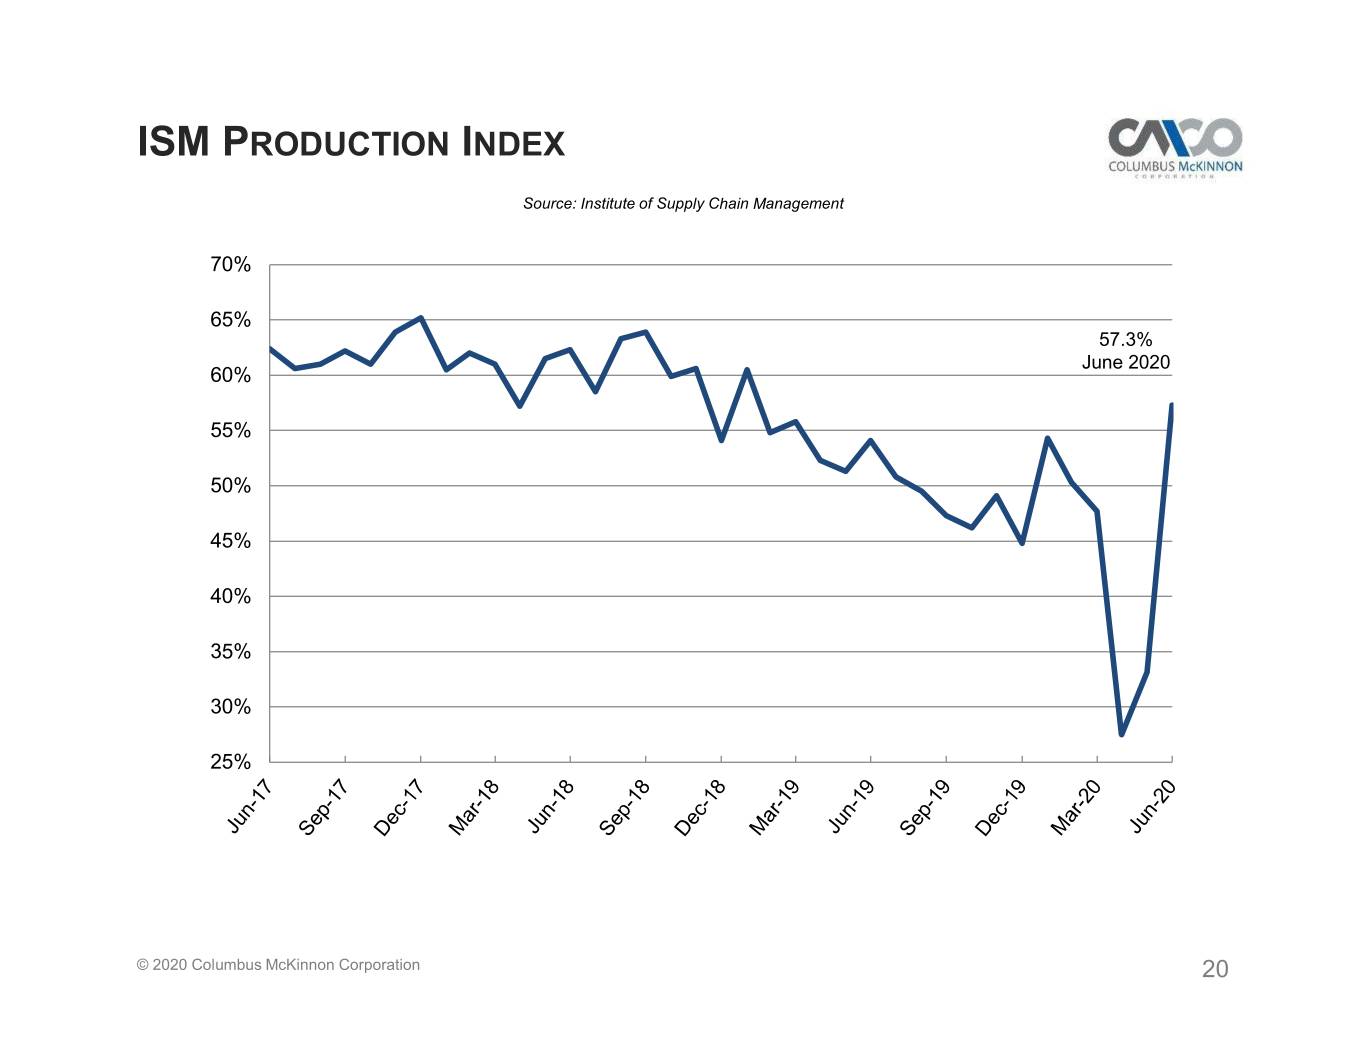
ISM PRODUCTION INDEX Source: Institute of Supply Chain Management 70% 65% 57.3% June 2020 60% 55% 50% 45% 40% 35% 30% 25% © 2020 Columbus McKinnon Corporation 20

CONFERENCE CALL PLAYBACK INFO Replay Number: 412-317-6671 passcode: 13705871 Telephone replay available through August 6, 2020 Webcast / PowerPoint / Replay available at investors.columbusmckinnon.com Transcript, when available, at investors.columbusmckinnon.com © 2020 Columbus McKinnon Corporation 21
July 30, Q1 FISCAL YEAR 2021 2020 FINANCIAL RESULTS CONFERENCE CALL PARTNERS IN MOTION CONTROL