
CON 8-K
Concentra Group Holdings Parent, Inc. (CON)
8-K
2025-11-06
For: 2025-11-05
View Original
Added on
April 07, 2026
UNITED STATES
SECURITIES AND EXCHANGE COMMISSION
Washington, D.C. 20549
_______________
FORM 8-K
_______________
CURRENT REPORT
Pursuant to Section 13 OR 15(d) of The Securities Exchange Act of 1934
Date of Report (Date of Earliest Event Reported): November 5, 2025
_______________
(Exact Name of Registrant as Specified in Its Charter)
_______________
(Commission File Number)
(State or Other Jurisdiction of Incorporation) | (I.R.S. Employer Identification No.) | ||||
(Address of principal executive offices) (Zip code)
(972 ) 364-8000
(Registrant’s telephone number, including area code)
Check the appropriate box below if the Form 8-K filing is intended to simultaneously satisfy the filing obligation of the registrant under any of the following provisions:
| Written communications pursuant to Rule 425 under the Securities Act (17 CFR 230.425) | |||||
| Soliciting material pursuant to Rule 14a-12 under the Exchange Act (17 CFR 240.14a-12) | |||||
| Pre-commencement communications pursuant to Rule 14d-2(b) under the Exchange Act (17 CFR 240.14d-2(b)) | |||||
| Pre-commencement communications pursuant to Rule 13e-4(c) under the Exchange Act (17 CFR 240.13e-4(c)) | |||||
Securities registered pursuant to Section 12(b) of the Act:
| Title of each class | Trading Symbol(s) | Name of each exchange on which registered | ||||||||||||
Indicate by check mark whether the registrant is an emerging growth company as defined in Rule 405 of the Securities Act of 1933 (§230.405 of this chapter) or Rule 12b-2 of the Securities Exchange Act of 1934 (§240.12b-2 of this chapter):
Emerging growth company ☐
If an emerging growth company, indicate by check mark if the registrant has elected not to use the extended transition period for complying with any new or revised financial accounting standards provided pursuant to Section 13(a) of the Exchange Act. ☐
Item 2.02 Results of Operations and Financial Condition.
On November 6, 2025, Concentra Group Holdings Parent, Inc. (the “Company”) issued a press release announcing its financial results for its third quarter ended September 30, 2025. A copy of the press release and financial schedules are attached as Exhibit 99.1 to this report and incorporated herein by reference.
The information in this report (including Exhibit 99.1) is being furnished pursuant to Item 2.02 and shall not be deemed to be “filed” for purposes of Section 18 of the Securities Exchange Act of 1934, as amended (the “Exchange Act”), or otherwise subject to the liabilities of that section, nor shall it be deemed to be incorporated by reference in any filing under the Securities Act of 1933, as amended, or the Exchange Act.
Item 7.01 Regulation FD Disclosure.
Attached as Exhibit 99.2 and furnished for purposes of Regulation FD is a presentation published by the Company on November 6, 2025 in connection with its press release announcing its financial results for its third quarter ended September 30, 2025.
The information in this Current Report on Form 8-K (including Exhibit 99.2) is being furnished solely to satisfy the requirements of Regulation FD and shall not be deemed to be “filed” for purposes of Section 18 of the Securities Exchange Act of 1934, as amended (the “Exchange Act”), or otherwise subject to the liabilities of that section, nor shall it be deemed to be incorporated by reference in any filing under the Securities Act of 1933, as amended, or the Exchange Act.
Item 8.01 Other Events.
Dividend Declaration
On November 5, 2025, the Company’s Board of Directors declared a cash dividend of $0.0625 per share. The dividend will be payable on or about December 9, 2025 to stockholders of record as of the close of business on December 2, 2025.
Share Repurchase Program
On November 5, 2025, the Board of Directors authorized a share repurchase program to repurchase up to $100 million of the Company's outstanding common stock. The share repurchase authorization will expire on December 31, 2027, unless extended or terminated by the Board of Directors. Stock repurchases under this program may be made in the open market or through privately negotiated transactions, and at times and in such amounts as the Board of Directors deems appropriate. Concentra will fund this program with cash on hand.
Item 9.01 Financial Statements and Exhibits.
(d) Exhibits.
| Exhibit Number | Description | ||||
| 99.1 | |||||
| 99.2 | |||||
| 104 | Cover Page Interactive Data File (embedded within the Inline XBRL document). | ||||
SIGNATURE
Pursuant to the requirements of the Securities Exchange Act of 1934, the registrant has duly caused this report to be signed on its behalf by the undersigned hereunto duly authorized.
| CONCENTRA GROUP HOLDINGS PARENT, INC. | |||||||||||
Date: November 6, 2025 | By: | /s/ Timothy Ryan | |||||||||
| Timothy Ryan | |||||||||||
| Executive Vice President and Chief Legal Counsel | |||||||||||
| NEWS RELEASE | |||||
FOR IMMEDIATE RELEASE | |||||
Concentra Group Holdings Parent, Inc. Announces Results
For Its Third Quarter Ended September 30, 2025, Cash Dividend, and Raised FY 2025 Guidance
ADDISON, TEXAS — November 6, 2025 — Concentra Group Holdings Parent, Inc. (“Concentra,” the “Company,” “we,” “us,” or “our”) (NYSE: CON), the nation’s largest provider of occupational health services, today announced results for its third quarter ended September 30, 2025, the declaration of a cash dividend, and raised guidance for full year 2025.
“2025 has continued to be an excellent year for Concentra,” said Keith Newton, Chief Executive Officer of Concentra. “Building on our business growth in the first half of the year, our strong third quarter results delivered year-over-year increases in revenue, net income, and Adjusted EBITDA driven by visit and rate growth, as well as executing on our inorganic strategy. Our stellar results are a direct reflection of the commitment and effort of our outstanding colleagues.”
Matt DiCanio, Concentra’s President and Chief Financial Officer, added, “We continue to execute on our key strategic initiatives, accelerating technology investments to modernize and enhance our systems and capabilities and making substantial progress towards our full separation from Select Medical Corporation. Through our continued focus on operational discipline and clinical excellence, as well as our core M&A and de novo strategy, we are well-positioned to deliver an exceptional experience and unmatched outcomes to our patients, customers, and partners.”
Third Quarter 2025 Highlights
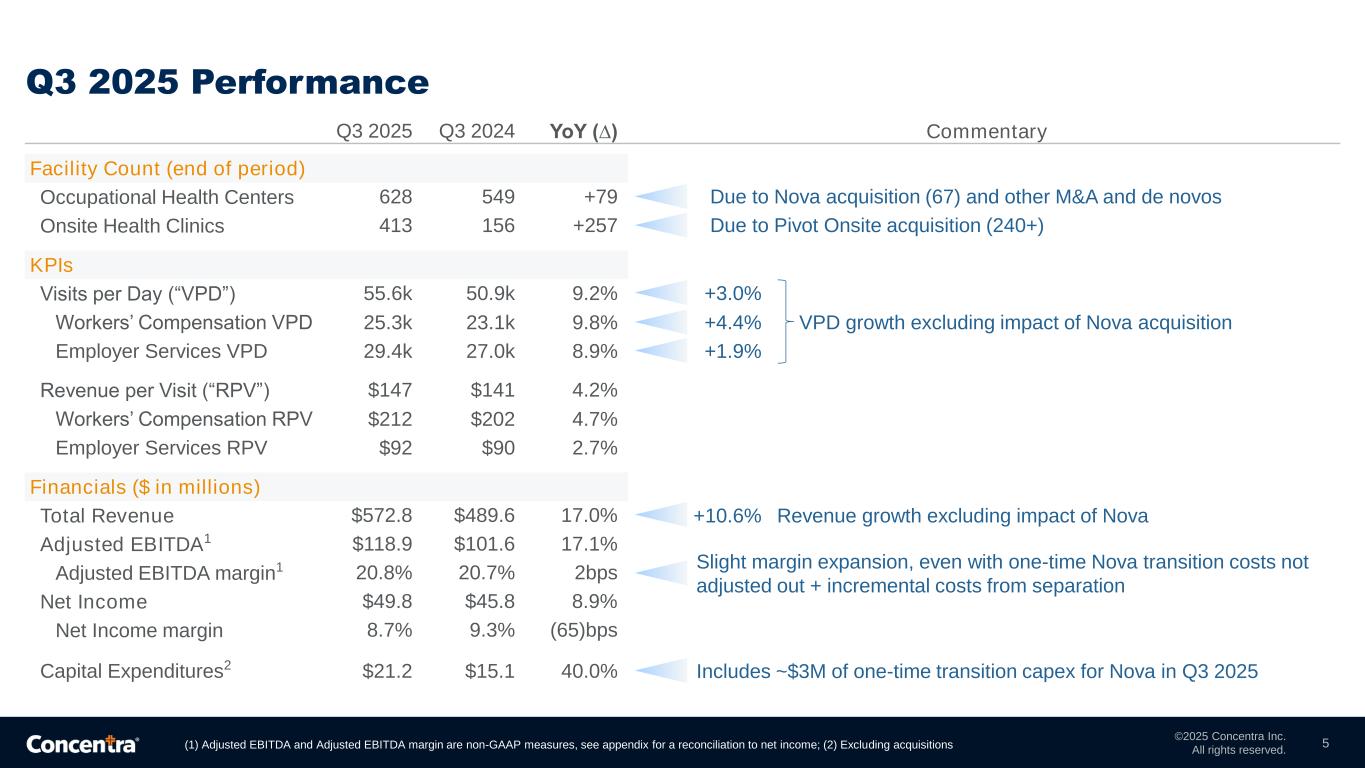
•Revenue of $572.8 million, an increase of 17.0% from $489.6 million in Q3 2024
•Net income of $49.8 million, an increase of 8.9% from $45.8 million in Q3 2024
•Net income attributable to the Company of $48.3 million, and Adjusted Net Income Attributable to the Company of $49.9 million
•Earnings per share of $0.38 and Adjusted Earnings per Share of $0.39
•Adjusted EBITDA of $118.9 million, an increase of 17.1% from $101.6 million in Q3 2024
•Repayments on the revolving facility totaled $50.0 million
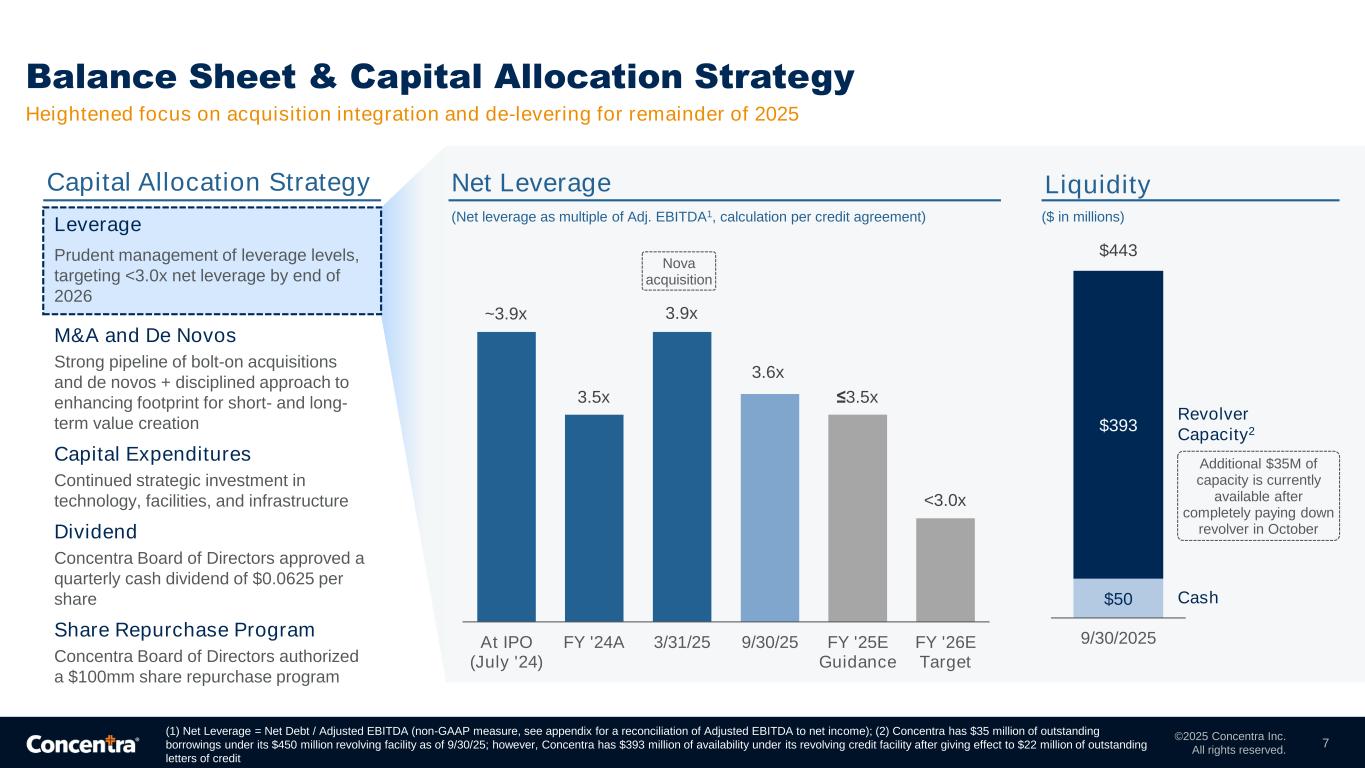
•Cash balance of $49.9 million and net leverage reduced to 3.6x at the end of Q3 2025
•Patient visits of 3,557,697, or 55,589 visits per day, an increase in visits per day of 9.2% from Q3 2024
•Revenue per visit of $147.31, an increase of 4.2% from $141.42 in Q3 2024
•Total occupational health centers of 628, compared to 549 at the end of Q3 2024
•Total onsite health clinics of 413, compared to 156 at the end of Q3 2024
Third Quarter 2025 Financial Overview
For the third quarter ended September 30, 2025, revenue increased 17.0% to $572.8 million, compared to $489.6 million for the same quarter, prior year. Income from operations increased 9.6% to $94.5 million for the third quarter ended September 30, 2025, compared to $86.2 million for the same quarter, prior year. Net income was $49.8 million, earnings per share was $0.38, and Adjusted Earnings per Share was $0.39 for the third quarter ended September 30, 2025, compared to net income of $45.8 million, earnings per share of $0.37 and Adjusted Earnings per Share of $0.37, for the same quarter, prior year. Adjusted EBITDA increased 17.1% to $118.9 million for the third quarter ended September 30, 2025, compared to $101.6 million for the same quarter, prior year. The definition of Adjusted EBITDA and a reconciliation of net income to Adjusted EBITDA are presented in table X of this release. The definition of Adjusted Earnings per Share and a reconciliation of net income attributable to the
1
Company and earnings per share on a fully diluted basis to Adjusted Net Income Attributable to the Company and Adjusted Earnings per Share on a fully diluted basis are presented in table XI of this release.
Year to Date September 30, 2025 Financial Overview
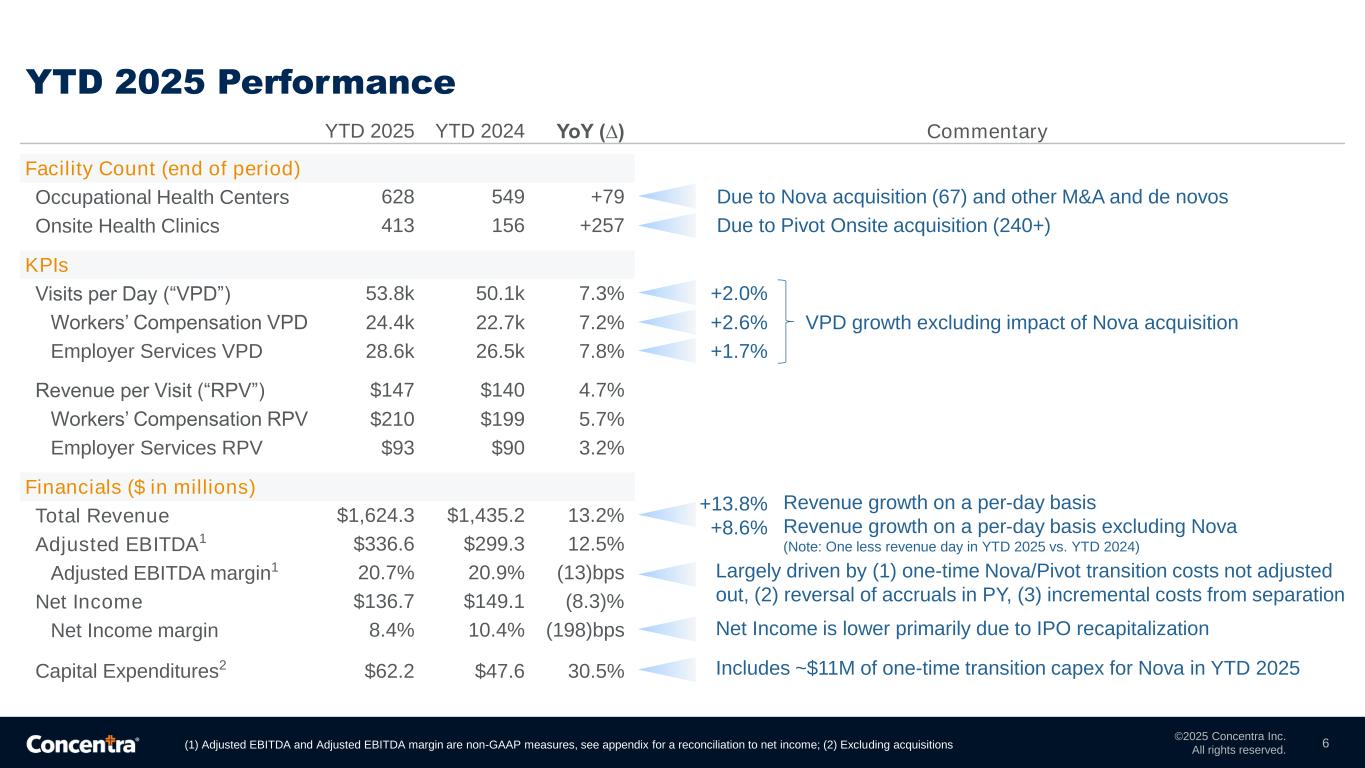
For the nine months ended September 30, 2025, revenue increased 13.2% to $1,624.3 million, compared to $1,435.2 million for the same period, prior year. Income from operations increased 7.6% to $264.3 million for the nine months ended September 30, 2025, compared to $245.7 million for the same period, prior year. Net income was $136.7 million, earnings per share was $1.03 and Adjusted Earnings per Share was $1.09 for the nine months ended September 30, 2025, compared to net income of $149.1 million, earnings per share of $1.32, and Adjusted Earnings per Share of $1.33 for the same period, prior year. Net income decreased due to a higher interest expense from the IPO recapitalization. Adjusted EBITDA increased 12.5% to $336.6 million for the nine months ended September 30, 2025, compared to $299.3 million for the same period, prior year.
Balance Sheet
As of September 30, 2025, our balance sheet reflected cash of $49.9 million, total debt of $1,612.4 million and total assets of $2,843.9 million. Concentra’s net leverage ratio as of September 30, 2025 is 3.6x, which was in compliance with the financial covenant under our credit agreement. The Company is targeting a net leverage ratio of 3.5x or below by the end of 2025 and less than 3.0x by the end of 2026.
Cash Flow
Cash flows provided by operating activities in the third quarter ended September 30, 2025 totaled $60.6 million compared to $65.9 million for the same quarter, prior year. The decrease in year over year cash flow from operations is driven primarily by a $25.0 million increase in interest payments offset by an $11.7 million decrease in taxes paid. During the third quarter ended September 30, 2025, cash flow from investing activity resulted in cash used of $20.5 million, including capital expenditures of $21.2 million, with $3.3 million of one-time capital expenditures associated with our Nova integration and rebranding. Cash flow from operations less cash flow from investing activity resulted in cash provided of $40.2 million for the quarter. Cash flow from financing activity used $64.1 million for the quarter, driven by $54.4 million in debt repayments and $8.0 million in dividend payments, and resulted in a decrease in cash of $23.9 million.
Dividend
On November 5, 2025, the Board of Directors declared a cash dividend of $0.0625 per share. The dividend will be payable on or about December 9, 2025, to stockholders of record as of the close of business on December 2, 2025.
There is no assurance that future dividends will be declared. The declaration and payment of dividends in the future are at the discretion of the Board of Directors after taking into account various factors, including, but not limited to, the Company’s financial condition, operating results, available cash and current and anticipated cash needs, the terms of indebtedness, and other factors the Board of Directors may deem to be relevant.
Share Repurchase Program
On November 5, 2025, the Board of Directors authorized a share repurchase program to repurchase up to $100 million of the Company’s outstanding common stock. The share repurchase authorization will expire on December 31, 2027, unless extended or terminated by the Board of Directors. Stock repurchases under this program may be made in the open market or through privately negotiated transactions, and at times and in such amounts as the Board of Directors deems appropriate. Concentra will fund this program with cash on hand. Concentra currently does not expect the use of this share repurchase program to impact our net leverage targets for 2025 and 2026.
2
2025 Business Outlook
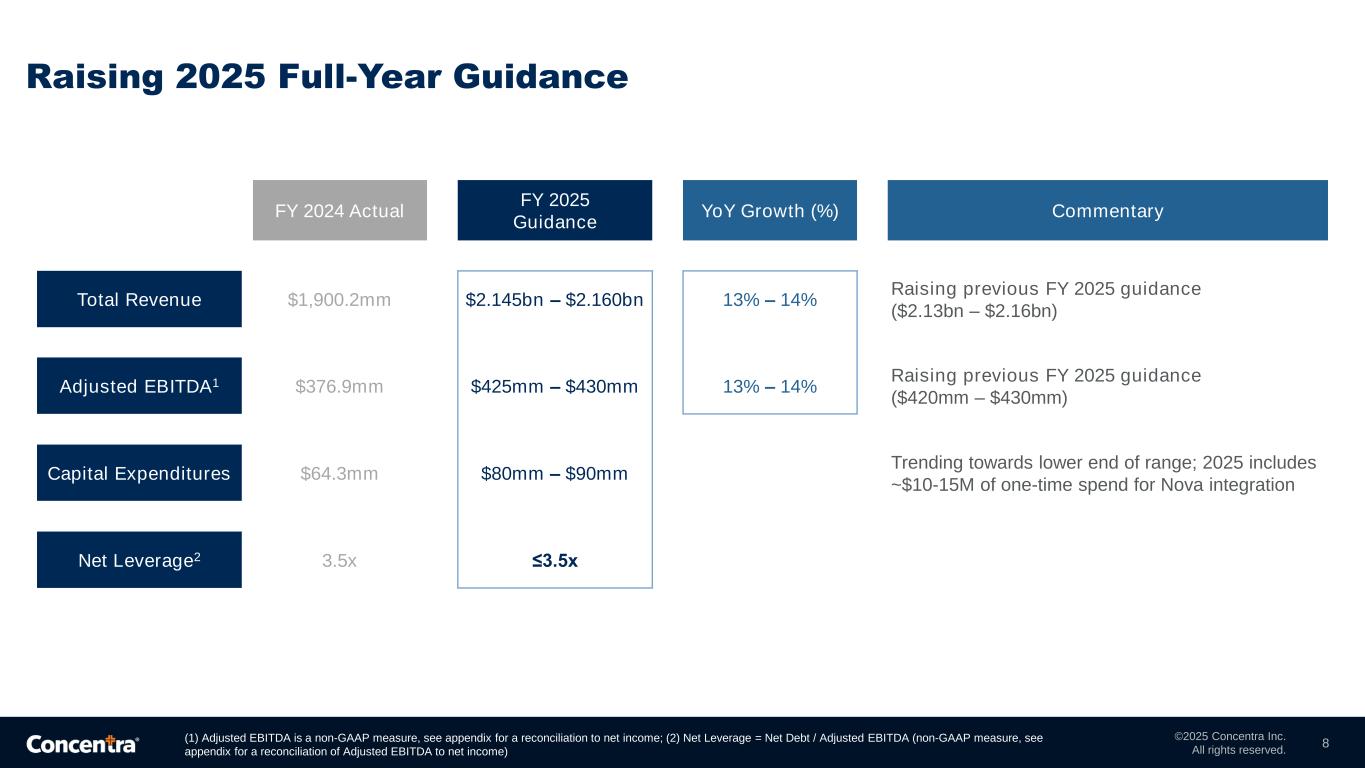
Concentra raised its financial guidance for 2025. We now expect to deliver the following results:
•Revenue in the range of $2.145 billion to $2.160 billion
•Adjusted EBITDA in the range of $425 million to $430 million
•Capital expenditures in the range of $80 million to $90 million (trending towards lower end of range)
•Net leverage ratio of 3.5x or below
A reconciliation of full year 2025 Adjusted EBITDA expectations to net income is presented in table XII of this release.
Company Overview
Concentra is the largest provider of occupational health services in the United States by number of locations, with the mission of improving the health of America’s workforce, one patient at a time. Our approximately 13,000 colleagues and affiliated physicians and clinicians support the delivery of an extensive suite of services, including occupational and consumer health services and other direct-to-employer care. We support the care of over 50,000 patients each day on average across 47 states and the District of Columbia at our 628 occupational health centers, 413 onsite health clinics at employer worksites, and Concentra Telemed as of September 30, 2025.
Conference Call
Concentra will host a conference call regarding its third quarter financial results and business outlook on Friday November 7, 2025, at 9 a.m. Eastern Time. The conference call will be a live webcast and can be accessed via this Earnings Call Webcast Link or via Concentra’s website at https://ir.concentra.com. A replay of the webcast will be available shortly after the call at the same locations.
Participants may join the audio-only version of the webcast or participate in the question-and-answer session by calling:
Toll Free: 888-506-0062
International: 973-528-0011
Participant Access: All dial-in participants should ask to join the Concentra call.
3
* * * * *
Certain statements contained herein that are not descriptions of historical facts are “forward-looking” statements (as such term is defined in the Private Securities Litigation Reform Act of 1995), including statements related to Concentra’s 2025 and long-term business outlook. Because such statements include risks and uncertainties, actual results may differ materially from those expressed or implied by such forward-looking statements due to factors including the following:
•The frequency of work-related injuries and illnesses;
•The adverse changes to our relationships with employer customers, third-party payors, workers’ compensation provider networks or employer services networks;
•Changes to regulations, new interpretations of existing regulations, or violations of regulations;
•State fee schedule changes undertaken by state workers’ compensation boards or commissions and other third-party payors;
•Our ability to realize reimbursement increases at rates sufficient to keep pace with the inflation of our costs;
•Labor shortages, increased employee turnover or costs, and union activity could significantly increase our operating costs;
•Our ability to compete effectively with other occupational health centers, onsite health clinics at employer worksites, and healthcare providers;
•A security breach of our, or our third-party vendors’, information technology systems which may cause a violation of HIPAA and subject us to potential legal and reputational harm;
•Negative publicity which can result in increased governmental and regulatory scrutiny and possibly adverse regulatory changes;
•Significant legal actions could subject us to substantial uninsured liabilities;
•Litigation and other legal and regulatory proceedings in the course of our business that could adversely affect our business and financial statements;
•Insurance coverage may not be sufficient to cover losses we may incur;
•Acquisitions may use significant resources, may be unsuccessful, and could expose us to unforeseen liabilities;
•Our exposure to additional risk due to our reliance on third parties in many aspects of our business;
•Compliance with applicable laws regarding the corporate practice of medicine and therapy and fee-splitting;
•Our facilities are subject to extensive federal and state laws and regulations relating to the privacy of individually identifiable information;
•Compliance with applicable data interoperability and information blocking rule;
•Facility licensure requirements in some states are costly and time-consuming, limiting or delaying our operations;
•Our ability to adequately protect and enforce our intellectual property and other proprietary rights;
•Adverse economic conditions in the U.S. or globally;
•Any negative impact on the global economy and capital markets resulting from other geopolitical tensions;
•The impact of impairment of our goodwill and other intangible assets;
•Our ability to maintain satisfactory credit ratings;
4
•The effects of the Separation on our business;
•Our ability to achieve the expected benefits of and successfully execute the Separation and related transactions;
•Restrictions on our business, potential tax and indemnification liabilities and substantial charges in connection with the Separation and related transactions;
•The negative impact of public threats such as a global pandemic or widespread outbreak of an infectious disease similar to the COVID-19 pandemic;
•The loss of key members of our management team;
•Our ability to attract and retain talented, highly skilled employees and a diverse workforce, and on the succession of our senior management;
•Climate change, or legal, regulatory or market measures to address climate change;
•Increasing scrutiny and rapidly evolving expectations from stakeholders regarding ESG matters;
•Changes in tax laws or exposures to additional tax liabilities; and
•Changes to United States tariff and import/export regulations and the impact on global economic conditions may have a negative effect on our business, financial condition and results of operations.
Except as required by applicable law, including the securities laws of the United States and the rules and regulations of the SEC, we are under no obligation to publicly update or revise any forward-looking statements, whether as a result of any new information, future events, or otherwise. You should not place undue reliance on our forward-looking statements. Although we believe that the expectations reflected in forward-looking statements are reasonable, we cannot guarantee future results or performance.
Investor inquiries:
Bill Chapman
Vice President, Strategy & Investor Relations
972-725-6488
SOURCE: Concentra Group Holdings Parent, Inc.
5
I. Condensed Consolidated Statements of Operations
For the Third Quarter Ended September 30, 2025 and 2024
(In thousands, except per share amounts, unaudited)
| Three Months Ended September 30, | ||||||||||||||||||||
| 2025 | 2024 | % Change | ||||||||||||||||||
| Revenue | $ | 572,800 | $ | 489,638 | 17.0 | % | ||||||||||||||
| Costs and expenses: | ||||||||||||||||||||
| Cost of services, exclusive of depreciation and amortization | 405,535 | 351,103 | 15.5 | |||||||||||||||||
General and administrative, exclusive of depreciation and amortization(1) | 52,884 | 37,088 | 42.6 | |||||||||||||||||
| Depreciation and amortization | 19,909 | 15,213 | 30.9 | |||||||||||||||||
Total costs and expenses | 478,328 | 403,404 | 18.6 | |||||||||||||||||
| Income from operations | 94,472 | 86,234 | 9.6 | |||||||||||||||||
| Other income and expense: | ||||||||||||||||||||
Interest expense | (28,683) | (21,369) | 34.2 | |||||||||||||||||
| Interest expense on related party debt | — | (2,691) | N/M | |||||||||||||||||
| Income before income taxes | 65,789 | 62,174 | 5.8 | |||||||||||||||||
| Income tax expense | 15,967 | 16,415 | (2.7) | |||||||||||||||||
| Net income | 49,822 | 45,759 | 8.9 | |||||||||||||||||
Less: net income attributable to non-controlling interests | 1,563 | 1,421 | 10.0 | |||||||||||||||||
Net income attributable to the Company | $ | 48,259 | $ | 44,338 | 8.8 | % | ||||||||||||||
Basic and diluted earnings per common share:(2) | $ | 0.38 | $ | 0.37 | ||||||||||||||||
_______________________________________________________________________________
(1) Includes transition services agreement fees of $2.7 million for the three months ended September 30, 2025, and shared service fees from Select Medical Corporation (“Select”) and transition services agreement fees of $3.8 million for the three months ended September 30, 2024.
(2) Refer to table III for calculation of earnings per common share.
N/M Not meaningful
6
II. Condensed Consolidated Statements of Operations
For the Nine Months Ended September 30, 2025 and 2024
(In thousands, except per share amounts, unaudited)
| Nine Months Ended September 30, | ||||||||||||||||||||
| 2025 | 2024 | % Change | ||||||||||||||||||
| Revenue | $ | 1,624,337 | $ | 1,435,151 | 13.2 | % | ||||||||||||||
| Costs and expenses: | ||||||||||||||||||||
| Cost of services, exclusive of depreciation and amortization | 1,151,970 | 1,027,366 | 12.1 | |||||||||||||||||
General and administrative, exclusive of depreciation and amortization(1) | 152,528 | 110,825 | 37.6 | |||||||||||||||||
| Depreciation and amortization | 55,526 | 51,568 | 7.7 | |||||||||||||||||
| Total costs and expenses | 1,360,024 | 1,189,759 | 14.3 | |||||||||||||||||
| Other operating income | 20 | 284 | (93.0) | |||||||||||||||||
| Income from operations | 264,333 | 245,676 | 7.6 | |||||||||||||||||
| Other income and expense: | ||||||||||||||||||||
| Loss on early retirement of debt | (875) | — | N/M | |||||||||||||||||
| Equity in losses of unconsolidated subsidiaries | — | (3,676) | N/M | |||||||||||||||||
Interest expense | (82,424) | (21,275) | 287.4 | |||||||||||||||||
| Interest expense on related party debt | — | (21,980) | N/M | |||||||||||||||||
| Income before income taxes | 181,034 | 198,745 | (8.9) | |||||||||||||||||
| Income tax expense | 44,376 | 49,648 | (10.6) | |||||||||||||||||
| Net income | 136,658 | 149,097 | (8.3) | |||||||||||||||||
| Less: net income attributable to non-controlling interests | 4,928 | 4,066 | 21.2 | |||||||||||||||||
| Net income attributable to the Company | $ | 131,730 | $ | 145,031 | (9.2) | % | ||||||||||||||
Basic and diluted earnings per common share(2) | $ | 1.03 | $ | 1.32 | ||||||||||||||||
(1) Includes transition services agreement fees of $9.9 million for the nine months ended September 30, 2025, and shared service fees from Select and transition services agreement fees of $11.5 million for the nine months ended September 30, 2024.
(2) Refer to table III for calculation of earnings per common share.
N/M Not meaningful
7
III. Earnings per Share
For the Three and Nine Months Ended September 30, 2025 and 2024
(In thousands, except per share amounts, unaudited)
As of September 30, 2025, the Company’s capital structure consists of common stock and unvested restricted stock. To calculate earnings per share (“EPS”) for the three and nine months ended September 30, 2025, the Company applied the two-class method because its unvested restricted shares were participating securities.
As of September 30, 2024, the Company’s capital structure consists of common stock. There were no participating shares or securities outstanding during the three and nine months ended September 30, 2024.
The following table sets forth the net income attributable to the Company, its shares, and its participating shares:
| Three Months Ended September 30, | Nine Months Ended September 30, | |||||||||||||||||||||||||
| 2025 | 2024 | 2025 | 2024 | |||||||||||||||||||||||
| Net income | $ | 49,822 | $ | 45,759 | $ | 136,658 | $ | 149,097 | ||||||||||||||||||
| Less: net income attributable to non-controlling interests | 1,563 | 1,421 | 4,928 | 4,066 | ||||||||||||||||||||||
| Net income attributable to the Company | 48,259 | 44,338 | 131,730 | 145,031 | ||||||||||||||||||||||
Less: distributed and undistributed net income attributable to participating securities | 573 | — | 1,558 | — | ||||||||||||||||||||||
Distributed and undistributed net income attributable to common shares | $ | 47,686 | $ | 44,338 | $ | 130,172 | $ | 145,031 | ||||||||||||||||||
The following table sets forth the computation of EPS. The Company applied the two-class method for the three and nine months ended September 30, 2025.
Three Months Ended September 30, 2025 | Three Months Ended September 30, 2024 | |||||||||||||||||||||||||||||||||||||
| Net Income Attributable to the Company | Shares(1) | Basic and Diluted EPS | Net Income Attributable to the Company | Shares(1) | Basic and Diluted EPS | |||||||||||||||||||||||||||||||||
| Common shares | $ | 47,686 | 126,647 | $ | 0.38 | $ | 44,338 | 120,765 | $ | 0.37 | ||||||||||||||||||||||||||||
| Participating securities | 573 | 1,523 | $ | 0.38 | — | — | $ | — | ||||||||||||||||||||||||||||||
| Total Company | $ | 48,259 | 128,170 | $ | 0.38 | $ | 44,338 | 120,765 | $ | 0.37 | ||||||||||||||||||||||||||||
Nine Months Ended September 30, 2025 | Nine Months Ended September 30, 2024 | |||||||||||||||||||||||||||||||||||||
| Net Income Attributable to the Company | Shares(1) | Basic and Diluted EPS | Net Income Attributable to the Company | Shares(1) | Basic and Diluted EPS | |||||||||||||||||||||||||||||||||
| Common shares | $ | 130,172 | 126,647 | $ | 1.03 | $ | 145,031 | 109,691 | $ | 1.32 | ||||||||||||||||||||||||||||
| Participating securities | 1,558 | 1,516 | $ | 1.03 | — | — | $ | — | ||||||||||||||||||||||||||||||
| Total Company | $ | 131,730 | 128,163 | $ | 1.03 | $ | 145,031 | 109,691 | $ | 1.32 | ||||||||||||||||||||||||||||
(1) Represents the weighted average shares outstanding during the period.
8
IV. Condensed Consolidated Balance Sheets
(In thousands, unaudited)
| September 30, 2025 | December 31, 2024 | |||||||||||||
ASSETS | ||||||||||||||
Current assets: | ||||||||||||||
Cash | $ | 49,941 | $ | 183,255 | ||||||||||
Accounts receivable | 278,973 | 217,719 | ||||||||||||
| Prepaid income taxes | 4,325 | 1,544 | ||||||||||||
Other current assets | 42,200 | 34,689 | ||||||||||||
Total current assets | 375,439 | 437,207 | ||||||||||||
Operating lease right-of-use assets | 484,109 | 435,595 | ||||||||||||
Property and equipment, net | 227,339 | 197,930 | ||||||||||||
Goodwill | 1,482,885 | 1,234,707 | ||||||||||||
Other Identifiable intangible assets, net | 250,061 | 204,725 | ||||||||||||
Other assets | 24,097 | 11,000 | ||||||||||||
Total assets | $ | 2,843,930 | $ | 2,521,164 | ||||||||||
LIABILITIES AND EQUITY | ||||||||||||||
Current liabilities: | ||||||||||||||
| Current operating lease liabilities | $ | 83,826 | $ | 75,442 | ||||||||||
| Current portion of long-term debt and notes payable | 11,917 | 10,093 | ||||||||||||
| Accounts payable | 32,790 | 19,752 | ||||||||||||
Accrued and other liabilities | 184,117 | 201,899 | ||||||||||||
Total current liabilities | 312,650 | 307,186 | ||||||||||||
Non-current operating lease liabilities | 441,867 | 396,914 | ||||||||||||
Long-term debt, net of current portion | 1,600,468 | 1,468,917 | ||||||||||||
Non-current deferred tax liability | 36,998 | 25,380 | ||||||||||||
Other non-current liabilities | 41,814 | 24,043 | ||||||||||||
Total liabilities | 2,433,797 | 2,222,440 | ||||||||||||
Redeemable non-controlling interests | 19,471 | 18,013 | ||||||||||||
| Stockholders’ equity: | ||||||||||||||
Common stock, $0.01 par value, 700,000,000 shares authorized, 128,170,202 and 128,125,952 shares issued and outstanding at September 30, 2025 and December 31, 2024, respectively | 1,282 | 1,281 | ||||||||||||
| Capital in excess of par | 267,720 | 260,837 | ||||||||||||
| Retained earnings | 120,075 | 13,553 | ||||||||||||
| Accumulated other comprehensive loss | (3,589) | — | ||||||||||||
| Total stockholders’ equity | 385,488 | 275,671 | ||||||||||||
| Non-controlling interests | 5,174 | 5,040 | ||||||||||||
| Total equity | 390,662 | 280,711 | ||||||||||||
| Total liabilities and equity | $ | 2,843,930 | $ | 2,521,164 | ||||||||||
9
V. Condensed Consolidated Statements of Cash Flows
For the Three Months Ended September 30, 2025 and 2024
(In thousands, unaudited)
| Three Months Ended September 30, | ||||||||||||||
| 2025 | 2024 | |||||||||||||
| Operating activities | ||||||||||||||
| Net income | $ | 49,822 | $ | 45,759 | ||||||||||
| Adjustments to reconcile net income to net cash provided by operating activities: | ||||||||||||||
| Depreciation and amortization | 19,909 | 15,213 | ||||||||||||
Gain on sale of assets | (742) | (1) | ||||||||||||
| Stock compensation expense | 2,330 | 168 | ||||||||||||
| Amortization of debt discount and issuance costs | 994 | 750 | ||||||||||||
| Deferred income taxes | 11,370 | 459 | ||||||||||||
| Other | 35 | 11 | ||||||||||||
| Changes in operating assets and liabilities, net of effects of business combinations: | ||||||||||||||
| Accounts receivable | (7,597) | (3,250) | ||||||||||||
| Other current assets | 2,076 | 11,276 | ||||||||||||
| Other assets | 2,217 | 7,366 | ||||||||||||
| Accounts payable and accrued liabilities | (19,787) | (11,843) | ||||||||||||
| Net cash provided by operating activities | 60,627 | 65,908 | ||||||||||||
| Investing activities | ||||||||||||||
| Business combinations, net of cash acquired | — | (1,821) | ||||||||||||
| Purchases of property and equipment | (21,209) | (15,145) | ||||||||||||
| Proceeds from sale of assets | 741 | 2 | ||||||||||||
| Net cash used in investing activities | (20,468) | (16,964) | ||||||||||||
| Financing activities | ||||||||||||||
| Payments on revolving facilities | (50,000) | — | ||||||||||||
| Payments on related party revolving promissory note | — | (420,000) | ||||||||||||
| Proceeds from term loans, net of issuance costs | — | 836,697 | ||||||||||||
| Payments on term loans | (2,375) | — | ||||||||||||
| Proceeds from 6.875% senior notes, net of issuance costs | — | 637,337 | ||||||||||||
| Borrowings of other debt | — | 1,604 | ||||||||||||
| Principal payments on other debt | (2,042) | (3,510) | ||||||||||||
| Dividends paid to common stockholders | (8,011) | — | ||||||||||||
Distributions to non-controlling interests | (1,662) | (1,583) | ||||||||||||
| Proceeds from Initial Public Offering | — | 511,198 | ||||||||||||
Dividend to Select | — | (1,535,683) | ||||||||||||
Contributions from Select | — | 11,149 | ||||||||||||
Net cash (used in) provided by financing activities | (64,090) | 37,209 | ||||||||||||
Net (decrease) increase in cash | (23,931) | 86,153 | ||||||||||||
Cash at beginning of period | 73,872 | 50,669 | ||||||||||||
Cash at end of period | $ | 49,941 | $ | 136,822 | ||||||||||
| Supplemental information | ||||||||||||||
| Cash paid for interest | $ | 39,703 | $ | 14,709 | ||||||||||
| Cash paid for taxes | $ | 3,624 | $ | 15,328 | ||||||||||
10
VI. Condensed Consolidated Statements of Cash Flows
For the Nine Months Ended September 30, 2025 and 2024
(In thousands, unaudited)
| Nine Months Ended September 30, | ||||||||||||||
| 2025 | 2024 | |||||||||||||
| Operating activities | ||||||||||||||
| Net income | $ | 136,658 | $ | 149,097 | ||||||||||
| Adjustments to reconcile net income to net cash provided by operating activities: | ||||||||||||||
| Depreciation and amortization | 55,526 | 51,568 | ||||||||||||
| Equity in losses of unconsolidated subsidiaries | — | 3,676 | ||||||||||||
| Loss on extinguishment of debt | 51 | — | ||||||||||||
(Gain) loss on sale of assets | (742) | 41 | ||||||||||||
| Stock compensation expense | 6,884 | 500 | ||||||||||||
| Amortization of debt discount and issuance costs | 2,965 | 750 | ||||||||||||
| Deferred income taxes | 9,165 | (1,159) | ||||||||||||
| Other | 1,142 | 70 | ||||||||||||
| Changes in operating assets and liabilities, net of effects of business combinations: | ||||||||||||||
| Accounts receivable | (33,848) | (16,079) | ||||||||||||
| Other current assets | (5,705) | 12,500 | ||||||||||||
| Other assets | 4,520 | 3,149 | ||||||||||||
| Accounts payable and accrued liabilities | (15,911) | (23,150) | ||||||||||||
| Net cash provided by operating activities | 160,705 | 180,963 | ||||||||||||
| Investing activities | ||||||||||||||
| Business combinations, net of cash acquired | (333,300) | (6,965) | ||||||||||||
| Purchases of property and equipment | (62,167) | (47,639) | ||||||||||||
| Proceeds from sale of assets | 742 | 25 | ||||||||||||
| Net cash used in investing activities | (394,725) | (54,579) | ||||||||||||
| Financing activities | ||||||||||||||
| Borrowings on revolving facilities | 85,000 | — | ||||||||||||
| Payments on revolving facilities | (50,000) | — | ||||||||||||
| Borrowings from related party revolving promissory note | — | 10,000 | ||||||||||||
| Payments on related party revolving promissory note | — | (480,000) | ||||||||||||
| Proceeds from term loans, net of issuance costs | 948,848 | 836,697 | ||||||||||||
| Payments on term loans | (852,625) | — | ||||||||||||
| Proceeds from 6.875% senior notes, net of issuance costs | — | 637,337 | ||||||||||||
| Borrowings of other debt | 6,575 | 8,222 | ||||||||||||
| Principal payments on other debt | (8,547) | (7,888) | ||||||||||||
| Dividends paid to common stockholders | (24,032) | — | ||||||||||||
Distributions to non-controlling interests | (4,513) | (4,226) | ||||||||||||
| Proceeds from Initial Public Offering | — | 511,198 | ||||||||||||
Dividend to Select | — | (1,535,683) | ||||||||||||
Contributions from Select | — | 3,407 | ||||||||||||
| Net cash provided by (used in) financing activities | 100,706 | (20,936) | ||||||||||||
| Net (decrease) increase in cash | (133,314) | 105,448 | ||||||||||||
| Cash at beginning of period | 183,255 | 31,374 | ||||||||||||
| Cash at end of period | $ | 49,941 | $ | 136,822 | ||||||||||
| Supplemental information | ||||||||||||||
| Cash paid for interest | $ | 94,135 | $ | 34,221 | ||||||||||
| Cash paid for taxes | $ | 39,192 | $ | 49,337 | ||||||||||
11
VII. Disaggregated Revenue
For the Three and Nine Months Ended September 30, 2025 and 2024
(In thousands, unaudited)
The following table disaggregates the Company’s revenue for the three and nine months ended September 30, 2025 and 2024:
| Three Months Ended September 30, | Nine Months Ended September 30, | ||||||||||||||||||||||
| 2025 | 2024 | 2025 | 2024 | ||||||||||||||||||||
| Occupational health centers: | |||||||||||||||||||||||
| Workers' compensation | $ | 343,454 | $ | 298,681 | $ | 977,752 | $ | 866,952 | |||||||||||||||
| Employer services | 173,230 | 154,809 | 507,688 | 458,849 | |||||||||||||||||||
| Consumer health | 7,395 | 7,332 | 23,183 | 23,327 | |||||||||||||||||||
| Other occupational health center revenue | 1,953 | 2,239 | 6,469 | 6,245 | |||||||||||||||||||
| Total occupational health center revenue | 526,032 | 463,061 | 1,515,092 | 1,355,373 | |||||||||||||||||||
| Onsite health clinics | 34,897 | 15,593 | 74,016 | 46,989 | |||||||||||||||||||
| Other | 11,871 | 10,984 | 35,229 | 32,789 | |||||||||||||||||||
| Total revenue | $ | 572,800 | $ | 489,638 | $ | 1,624,337 | $ | 1,435,151 | |||||||||||||||
12
VIII. Key Statistics
For the Third Quarter Ended September 30, 2025 and 2024
(unaudited)
| Three Months Ended September 30, | ||||||||||||||||||||
| 2025 | 2024 | |||||||||||||||||||
| Facility Count | ||||||||||||||||||||
| Number of occupational health centers—start of period | 628 | 547 | ||||||||||||||||||
| Number of occupational health centers acquired | — | 1 | ||||||||||||||||||
| Number of occupational health centers de novos | 1 | 1 | ||||||||||||||||||
| Number of occupational health centers closed/sold | (1) | — | ||||||||||||||||||
| Number of occupational health centers—end of period | 628 | 549 | ||||||||||||||||||
| Number of onsite health clinics operated—end of period | 413 | 156 | ||||||||||||||||||
| The following table sets forth operating statistics for our occupational health centers operating segment for the periods presented: | ||||||||||||||||||||
| Three Months Ended September 30, | ||||||||||||||||||||
| Number of patient visits | 2025 | 2024 | % Change | |||||||||||||||||
Workers’ compensation | 1,621,435 | 1,476,486 | 9.8 | % | ||||||||||||||||
Employer services | 1,882,820 | 1,728,720 | 8.9 | % | ||||||||||||||||
Consumer health | 53,442 | 53,399 | 0.1 | % | ||||||||||||||||
| Total | 3,557,697 | 3,258,605 | 9.2 | % | ||||||||||||||||
| Visits per day volume | ||||||||||||||||||||
Workers’ compensation | 25,335 | 23,070 | 9.8 | % | ||||||||||||||||
Employer services | 29,419 | 27,011 | 8.9 | % | ||||||||||||||||
Consumer health | 835 | 834 | 0.1 | % | ||||||||||||||||
| Total | 55,589 | 50,916 | (3) | 9.2 | % | |||||||||||||||
Revenue per visit(1) | ||||||||||||||||||||
Workers’ compensation | $ | 211.82 | $ | 202.29 | 4.7 | % | ||||||||||||||
Employer services | 92.01 | 89.55 | 2.7 | % | ||||||||||||||||
Consumer health | 138.38 | 137.30 | 0.8 | % | ||||||||||||||||
| Total | $ | 147.31 | $ | 141.42 | 4.2 | % | ||||||||||||||
Business Days(2) | 64 | 64 | ||||||||||||||||||
(1) Represents the average amount of revenue recognized for each patient visit. Revenue per visit is calculated as total patient revenue divided by total patient visits. Revenue per visit as reported includes only the revenue and patient visits in our occupational health centers segment and does not include our onsite health clinics or other businesses segments.
(2) Represents the number of days in which normal business operations were conducted during the periods presented.
(3) Does not total due to rounding
13
IX. Key Statistics
For the Nine Months Ended September 30, 2025 and 2024
(unaudited)
| Nine Months Ended September 30, | ||||||||||||||||||||
| 2025 | 2024 | |||||||||||||||||||
| Facility Count | ||||||||||||||||||||
| Number of occupational health centers—start of period | 552 | 544 | ||||||||||||||||||
| Number of occupational health centers acquired | 72 | 3 | ||||||||||||||||||
| Number of occupational health centers de novos | 5 | 3 | ||||||||||||||||||
| Number of occupational health centers closed/sold | (1) | (1) | ||||||||||||||||||
| Number of occupational health centers—end of period | 628 | 549 | ||||||||||||||||||
| Number of onsite health clinics operated—end of period | 413 | 156 | ||||||||||||||||||
| The following table sets forth operating statistics for our occupational health centers operating segment for the periods presented: | ||||||||||||||||||||
| Nine Months Ended September 30, | ||||||||||||||||||||
| 2025 | 2024 | % Change | ||||||||||||||||||
| Number of patient visits | ||||||||||||||||||||
| Workers’ compensation | 4,656,296 | 4,364,824 | 6.7 | % | ||||||||||||||||
| Employer services | 5,456,615 | 5,090,410 | 7.2 | % | ||||||||||||||||
| Consumer health | 169,474 | 173,281 | (2.2) | % | ||||||||||||||||
| Total | 10,282,385 | 9,628,515 | 6.8 | % | ||||||||||||||||
| Visits per day volume | ||||||||||||||||||||
| Workers’ compensation | 24,379 | 22,733 | 7.2 | % | ||||||||||||||||
| Employer services | 28,569 | 26,513 | 7.8 | % | ||||||||||||||||
| Consumer health | 887 | 903 | (1.8) | % | ||||||||||||||||
| Total | 53,834 | (3) | 50,149 | 7.3 | % | |||||||||||||||
Revenue per visit(1) | ||||||||||||||||||||
| Workers’ compensation | $ | 209.98 | $ | 198.62 | 5.7 | % | ||||||||||||||
| Employer services | 93.04 | 90.14 | 3.2 | % | ||||||||||||||||
| Consumer health | 136.80 | 134.62 | 1.6 | % | ||||||||||||||||
| Total | $ | 146.72 | $ | 140.12 | 4.7 | % | ||||||||||||||
Business days(2) | 191 | 192 | ||||||||||||||||||
_____________________________________
(1) Represents the average amount of revenue recognized for each patient visit. Revenue per visit is calculated as total patient revenue divided by total patient visits. Revenue per visit as reported includes only the revenue and patient visits in our occupational health centers segment and does not include our onsite health clinics or other businesses segments.
(2) Represents the number of days in which normal business operations were conducted during the periods presented.
(3) Does not total due to rounding.
14
X. Net Income to Adjusted EBITDA Reconciliation
For the Three and Nine Months Ended September 30, 2025 and 2024
(In thousands, unaudited)
Adjusted EBITDA and Adjusted EBITDA Margin are non-GAAP measures that we believe provide useful insight into the underlying performance of our business by excluding items that may obscure trends in our core operating results. These metrics are not intended to be substitutes for U.S. GAAP measures such as net income and may differ from similarly titled metrics supported by other companies. We use these non-GAAP measures internally for budgeting, forecasting, and evaluating performance. Investors should consider these measures in addition to, and not as a replacement for, U.S. GAAP results reported in our financial statements.
Adjusted EBITDA is a supplemental measure that we believe offers a clearer view of business performance by excluding items that do not reflect the core operations of the Company. We define adjusted EBITDA as net income before interest, income taxes, depreciation and amortization, stock-based compensation expense, acquisition related costs, gains or losses on early retirement of debt, separation transaction costs, gains or losses on the sale of businesses, and equity in earnings or losses from unconsolidated subsidiaries. Adjusted EBITDA Margin is calculated by dividing Adjusted EBITDA by total revenue. This margin helps assess the efficiency of our operations on a normalized basis.
The following table reconciles net income to Adjusted EBITDA and net income margin to Adjusted EBITDA margin and should be referenced when we discuss Adjusted EBITDA and Adjusted EBITDA margin.
| Three Months Ended September 30, | Nine Months Ended September 30, | ||||||||||||||||||||||||||||||||||||||||||||||
| 2025 | 2024 | 2025 | 2024 | ||||||||||||||||||||||||||||||||||||||||||||
| Amount | % of Revenue | Amount | % of Revenue | Amount | % of Revenue | Amount | % of Revenue | ||||||||||||||||||||||||||||||||||||||||
| Reconciliation of Adjusted EBITDA: | |||||||||||||||||||||||||||||||||||||||||||||||
| Net income | $ | 49,822 | 8.7 | % | $ | 45,759 | 9.3 | % | $ | 136,658 | 8.4 | % | $ | 149,097 | 10.4 | % | |||||||||||||||||||||||||||||||
| Add (Subtract): | |||||||||||||||||||||||||||||||||||||||||||||||
| Income tax expense | 15,967 | 2.8 | 16,415 | 3.4 | 44,376 | 2.7 | 49,648 | 3.5 | |||||||||||||||||||||||||||||||||||||||
Interest expense | 28,683 | 5.0 | 21,369 | 4.4 | 82,424 | 5.1 | 21,275 | 1.5 | |||||||||||||||||||||||||||||||||||||||
| Interest expense on related party debt | — | — | 2,691 | 0.5 | — | — | 21,980 | 1.5 | |||||||||||||||||||||||||||||||||||||||
| Equity in losses of unconsolidated subsidiaries | — | — | — | — | — | — | 3,676 | 0.3 | |||||||||||||||||||||||||||||||||||||||
| Loss on early retirement of debt | — | — | — | — | 875 | 0.1 | — | — | |||||||||||||||||||||||||||||||||||||||
| Stock compensation expense | 2,330 | 0.4 | 168 | 0.0 | 6,884 | 0.4 | 500 | 0.0 | |||||||||||||||||||||||||||||||||||||||
| Depreciation and amortization | 19,909 | 3.5 | 15,213 | 3.1 | 55,526 | 3.4 | 51,568 | 3.6 | |||||||||||||||||||||||||||||||||||||||
Separation transaction costs(1) | 1,025 | 0.2 | (44) | 0.0 | 2,700 | 0.2 | 1,569 | 0.1 | |||||||||||||||||||||||||||||||||||||||
| Nova and Pivot Onsite Innovations acquisition costs | 1,181 | 0.2 | — | — | 7,151 | 0.4 | — | — | |||||||||||||||||||||||||||||||||||||||
| Adjusted EBITDA | $ | 118,917 | 20.8 | % | $ | 101,571 | 20.7 | % | $ | 336,594 | 20.7 | % | $ | 299,313 | 20.9 | % | |||||||||||||||||||||||||||||||
_____________________________________
(1) Separation transaction costs represent non-recurring incremental consulting, legal, audit-related fees, system implementation, and software disposal costs incurred in connection with the Company’s separation into a new, publicly traded company and are included within general and administrative expenses on the condensed consolidated statements of operations.
15
XI. Reconciliation of Earnings per Share to Adjusted Earnings per Share
For the Three and Nine Months Ended September 30, 2025 and 2024
(In thousands, except per share amounts, unaudited)
Adjusted Net Income Attributable to the Company and Adjusted Earnings per Share are used by management to provide useful insight into the underlying performance of our business. Adjusted Net Income Attributable to the Company and Adjusted Earnings per Share are not measures of financial performance under U.S. GAAP and are not intended to be substitutes for U.S. GAAP measures such as net income or earnings per share. These metrics may differ from similarly titled metrics supported by other companies. Concentra believes that the presentation of Adjusted Net Income Attributable to the Company and Adjusted Earnings per Share are important to investors because they are reflective of the financial performance of Concentra’s ongoing operations and provide better comparability of its results of operations between periods. Investors should consider these measures in addition to, and not as a replacement for, U.S. GAAP results reported in our financial statements.
We define Adjusted Net Income Attributable to the Company as net income attributable to the Company, excluding gain (loss) on early retirement of debt, separation transaction costs, acquisition costs, gain (loss) on sale of businesses, and other non-recurring costs not directly tied to operating performance, all on an after tax basis. We define Adjusted Earnings per Share as the Adjusted Net Income Attributable to the Company divided by the diluted weighted average shares outstanding.
The following table reconciles net income attributable to the Company and earnings per share on a fully diluted basis to Adjusted Net Income Attributable to the Company and Adjusted Earnings per Share on a fully diluted basis.
| Three Months Ended September 30, | Nine Months Ended September 30, | ||||||||||||||||||||||||||||||||||||||||||||||
| 2025 | Per Share(4) | 2024 | Per Share | 2025 | Per Share(4) | 2024 | Per Share | ||||||||||||||||||||||||||||||||||||||||
Reconciliation of Adjusted Net Income Attributable to the Company:(1) | |||||||||||||||||||||||||||||||||||||||||||||||
| Net income attributable to the Company | $ | 48,259 | $ | 0.38 | $ | 44,338 | $ | 0.37 | $ | 131,730 | $ | 1.03 | $ | 145,031 | $ | 1.32 | |||||||||||||||||||||||||||||||
Adjustments: | |||||||||||||||||||||||||||||||||||||||||||||||
| Loss on early retirement of debt | — | — | — | — | 875 | 0.01 | — | — | |||||||||||||||||||||||||||||||||||||||
Separation transaction costs(2) | 1,025 | 0.01 | (44) | 0.00 | 2,700 | 0.02 | 1,569 | 0.01 | |||||||||||||||||||||||||||||||||||||||
| Nova and Pivot Onsite Innovations acquisition costs | 1,181 | 0.01 | — | — | 7,151 | 0.06 | — | — | |||||||||||||||||||||||||||||||||||||||
Total additions (subtractions), net | $ | 2,206 | $ | 0.02 | $ | (44) | $ | 0.00 | $ | 10,726 | $ | 0.08 | $ | 1,569 | $ | 0.01 | |||||||||||||||||||||||||||||||
Less: tax effect of adjustments(3) | (536) | 0.00 | 12 | 0.00 | (2,628) | (0.02) | (392) | 0.00 | |||||||||||||||||||||||||||||||||||||||
| Adjusted Net Income Attributable to the Company | $ | 49,929 | $ | 0.39 | $ | 44,306 | $ | 0.37 | $ | 139,828 | $ | 1.09 | $ | 146,208 | $ | 1.33 | |||||||||||||||||||||||||||||||
Weighted average shares outstanding - diluted | 128,170 | 120,765 | 128,163 | 109,691 | |||||||||||||||||||||||||||||||||||||||||||
(1) Beginning in the second quarter of 2025, we updated the schedule for all periods presented to include Net Income Attributable to the Company. Management believes this measure will provide an improved insight into the performance of our business.
(2) Separation transaction costs represent non-recurring incremental consulting, legal, audit-related fees, system implementation, and software disposal costs incurred in connection with the Company’s separation into a new, publicly traded company and are included within general and administrative expenses on the condensed consolidated statements of operations.
(3) Tax impact is calculated using the annual effective tax rate, excluding discrete costs and benefits.
(4) Does not total due to rounding.
16
XII. 2025 Net Income to Adjusted EBITDA Reconciliation
Business Outlook for the Year Ending December 31, 2025
(In millions, unaudited)
The following is a reconciliation of full year 2025 Adjusted EBITDA expectations as computed at the low and high points of the range to the closest comparable U.S. GAAP financial measure. Refer to tables X for discussion of Concentra's use of Adjusted EBITDA in evaluating financial performance and for the definition of Adjusted EBITDA. Each item presented in the below table is an estimation of full year 2025 expectations.
Range | |||||||||||
Low | High | ||||||||||
Net income attributable to the Company | $ | 156 | $ | 161 | |||||||
Net income attributable to non-controlling interests | 7 | 7 | |||||||||
| Net income | $ | 163 | $ | 168 | |||||||
| Loss on early retirement of debt | 1 | 1 | |||||||||
| Income tax expense | 53 | 55 | |||||||||
| Interest expense | 110 | 109 | |||||||||
Income from operations | 327 | 333 | |||||||||
| Stock compensation expense | 10 | 10 | |||||||||
| Depreciation and amortization | 76 | 75 | |||||||||
Separation transaction costs | 5 | 5 | |||||||||
Nova and Pivot Onsite Innovations acquisition costs | 7 | 7 | |||||||||
| Adjusted EBITDA | $ | 425 | $ | 430 | |||||||
Adjusted Net Income Attributable to the Company(1) | $ | 166 | $ | 171 | |||||||
_____________________________________
(1) Represents net income attributable to the Company plus the net of tax adjustments for loss on early retirement of debt, separation transaction costs, and Nova and Onsite Innovations, LLC (“Pivot Onsite Innovations”) acquisition costs.
17
©2025 Concentra Inc. All rights reserved. 3rd Quarter 2025 Results November 6, 2025
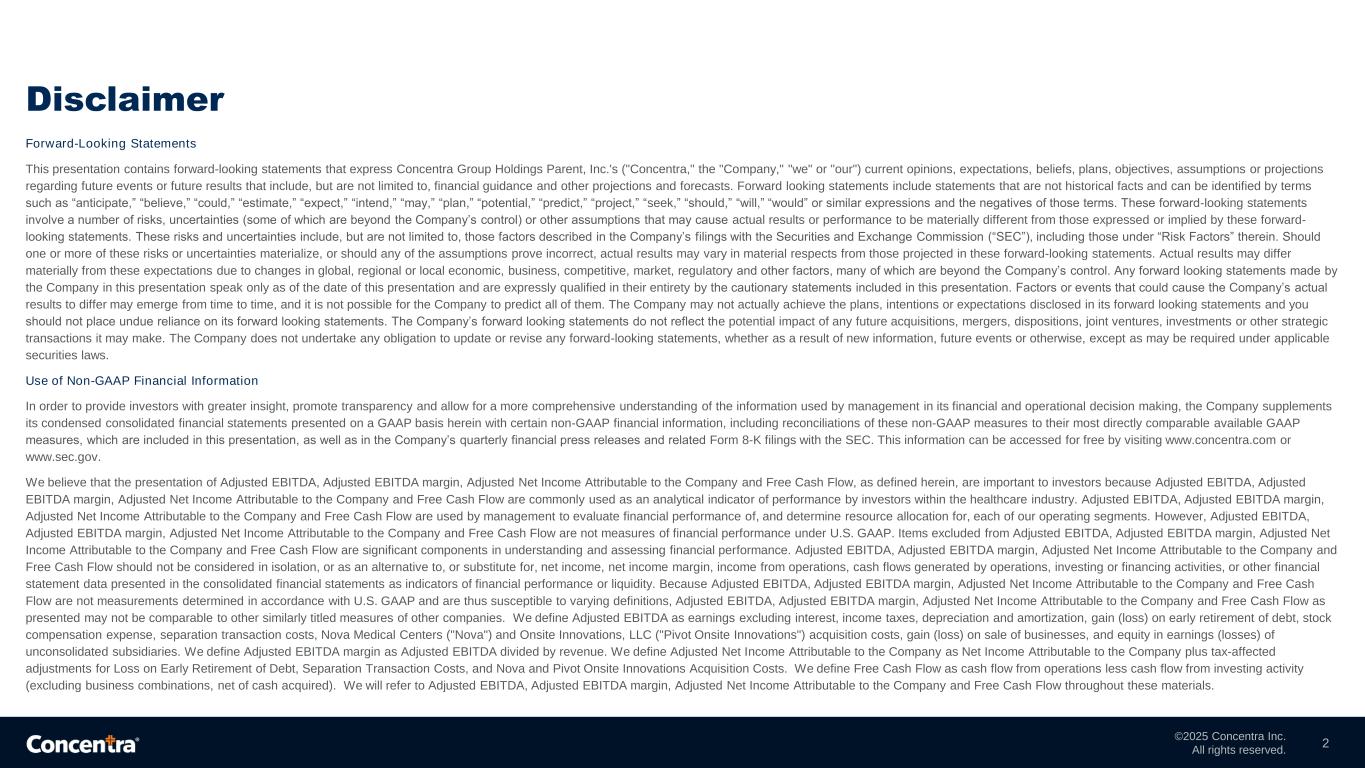
©2025 Concentra Inc. All rights reserved. Forward-Looking Statements This presentation contains forward-looking statements that express Concentra Group Holdings Parent, Inc.'s ("Concentra," the "Company," "we" or "our") current opinions, expectations, beliefs, plans, objectives, assumptions or projections regarding future events or future results that include, but are not limited to, financial guidance and other projections and forecasts. Forward looking statements include statements that are not historical facts and can be identified by terms such as “anticipate,” “believe,” “could,” “estimate,” “expect,” “intend,” “may,” “plan,” “potential,” “predict,” “project,” “seek,” “should,” “will,” “would” or similar expressions and the negatives of those terms. These forward-looking statements involve a number of risks, uncertainties (some of which are beyond the Company’s control) or other assumptions that may cause actual results or performance to be materially different from those expressed or implied by these forward- looking statements. These risks and uncertainties include, but are not limited to, those factors described in the Company’s filings with the Securities and Exchange Commission (“SEC”), including those under “Risk Factors” therein. Should one or more of these risks or uncertainties materialize, or should any of the assumptions prove incorrect, actual results may vary in material respects from those projected in these forward-looking statements. Actual results may differ materially from these expectations due to changes in global, regional or local economic, business, competitive, market, regulatory and other factors, many of which are beyond the Company’s control. Any forward looking statements made by the Company in this presentation speak only as of the date of this presentation and are expressly qualified in their entirety by the cautionary statements included in this presentation. Factors or events that could cause the Company’s actual results to differ may emerge from time to time, and it is not possible for the Company to predict all of them. The Company may not actually achieve the plans, intentions or expectations disclosed in its forward looking statements and you should not place undue reliance on its forward looking statements. The Company’s forward looking statements do not reflect the potential impact of any future acquisitions, mergers, dispositions, joint ventures, investments or other strategic transactions it may make. The Company does not undertake any obligation to update or revise any forward-looking statements, whether as a result of new information, future events or otherwise, except as may be required under applicable securities laws. Use of Non-GAAP Financial Information In order to provide investors with greater insight, promote transparency and allow for a more comprehensive understanding of the information used by management in its financial and operational decision making, the Company supplements its condensed consolidated financial statements presented on a GAAP basis herein with certain non-GAAP financial information, including reconciliations of these non-GAAP measures to their most directly comparable available GAAP measures, which are included in this presentation, as well as in the Company’s quarterly financial press releases and related Form 8-K filings with the SEC. This information can be accessed for free by visiting www.concentra.com or www.sec.gov. We believe that the presentation of Adjusted EBITDA, Adjusted EBITDA margin, Adjusted Net Income Attributable to the Company and Free Cash Flow, as defined herein, are important to investors because Adjusted EBITDA, Adjusted EBITDA margin, Adjusted Net Income Attributable to the Company and Free Cash Flow are commonly used as an analytical indicator of performance by investors within the healthcare industry. Adjusted EBITDA, Adjusted EBITDA margin, Adjusted Net Income Attributable to the Company and Free Cash Flow are used by management to evaluate financial performance of, and determine resource allocation for, each of our operating segments. However, Adjusted EBITDA, Adjusted EBITDA margin, Adjusted Net Income Attributable to the Company and Free Cash Flow are not measures of financial performance under U.S. GAAP. Items excluded from Adjusted EBITDA, Adjusted EBITDA margin, Adjusted Net Income Attributable to the Company and Free Cash Flow are significant components in understanding and assessing financial performance. Adjusted EBITDA, Adjusted EBITDA margin, Adjusted Net Income Attributable to the Company and Free Cash Flow should not be considered in isolation, or as an alternative to, or substitute for, net income, net income margin, income from operations, cash flows generated by operations, investing or financing activities, or other financial statement data presented in the consolidated financial statements as indicators of financial performance or liquidity. Because Adjusted EBITDA, Adjusted EBITDA margin, Adjusted Net Income Attributable to the Company and Free Cash Flow are not measurements determined in accordance with U.S. GAAP and are thus susceptible to varying definitions, Adjusted EBITDA, Adjusted EBITDA margin, Adjusted Net Income Attributable to the Company and Free Cash Flow as presented may not be comparable to other similarly titled measures of other companies. We define Adjusted EBITDA as earnings excluding interest, income taxes, depreciation and amortization, gain (loss) on early retirement of debt, stock compensation expense, separation transaction costs, Nova Medical Centers ("Nova") and Onsite Innovations, LLC ("Pivot Onsite Innovations") acquisition costs, gain (loss) on sale of businesses, and equity in earnings (losses) of unconsolidated subsidiaries. We define Adjusted EBITDA margin as Adjusted EBITDA divided by revenue. We define Adjusted Net Income Attributable to the Company as Net Income Attributable to the Company plus tax-affected adjustments for Loss on Early Retirement of Debt, Separation Transaction Costs, and Nova and Pivot Onsite Innovations Acquisition Costs. We define Free Cash Flow as cash flow from operations less cash flow from investing activity (excluding business combinations, net of cash acquired). We will refer to Adjusted EBITDA, Adjusted EBITDA margin, Adjusted Net Income Attributable to the Company and Free Cash Flow throughout these materials. Disclaimer 2

©2025 Concentra Inc. All rights reserved. Concentra At-a-Glance 3 Concentra is the largest provider of occupational health services in the United States by number of locations1, with a mission of improving the health of America’s workforce, one patient at a time KEY STATISTICS 413 Onsite health clinics1 ~13k Total colleagues & affiliated clinicians1,3 $2.1bn TTM Revenue2 19.8% TTM Adj. EBITDA margin2,4 47 States with service offerings1 ~200k Employer customers2 >52,000 Avg. # of patients cared for each business day2 ROBUST FINANCIALS* $414mm TTM Adj. EBITDA2,4 <1% Revenue from government payor reimbursement2 $176mm TTM free cash flow2,5 628 Occupational health centers1 <3% Revenue from largest employer customer2 (1) As of September 30, 2025; (2) As of TTM September 30, 2025; (3) The term "colleagues and affiliated clinicians" includes both our directly employed colleagues who provide administrative and management support to the affiliated professional medical group entities and the physicians and clinicians that are employed by the affiliated professional medical groups; (4) Adjusted EBITDA and Adjusted EBITDA margin are non-GAAP measures, see appendix for a reconciliation to net income; (5) Free cash flow is a non-GAAP measure, see appendix for a reconciliation *Does not include annualized impact of recent acquisitions (Nova, Pivot Onsite Innovations, PHC) or de novos
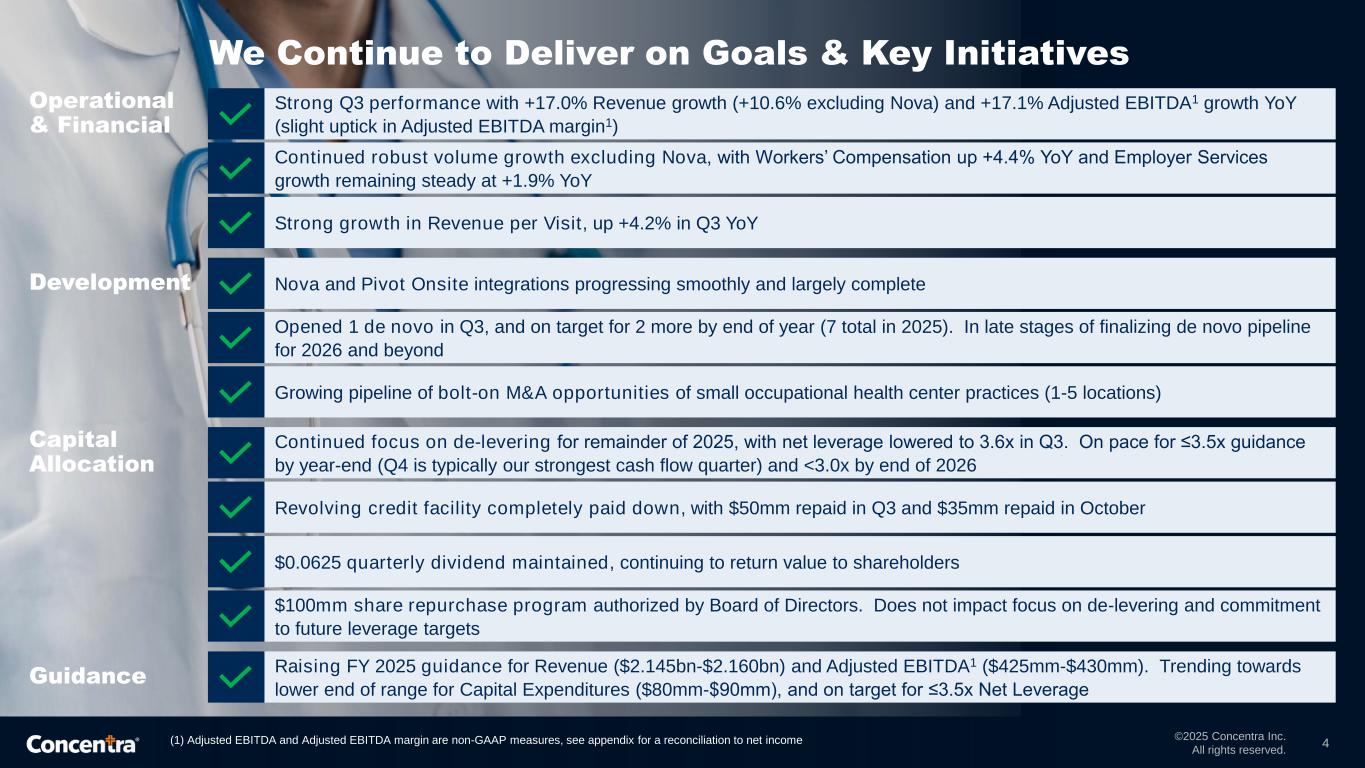
©2025 Concentra Inc. All rights reserved. We Continue to Deliver on Goals & Key Initiatives 4 Opened 1 de novo in Q3, and on target for 2 more by end of year (7 total in 2025). In late stages of finalizing de novo pipeline for 2026 and beyond Development Nova and Pivot Onsite integrations progressing smoothly and largely complete Growing pipeline of bolt-on M&A opportunities of small occupational health center practices (1-5 locations) Raising FY 2025 guidance for Revenue ($2.145bn-$2.160bn) and Adjusted EBITDA1 ($425mm-$430mm). Trending towards lower end of range for Capital Expenditures ($80mm-$90mm), and on target for ≤3.5x Net Leverage Guidance Operational & Financial Strong Q3 performance with +17.0% Revenue growth (+10.6% excluding Nova) and +17.1% Adjusted EBITDA1 growth YoY (slight uptick in Adjusted EBITDA margin1) Continued robust volume growth excluding Nova, with Workers’ Compensation up +4.4% YoY and Employer Services growth remaining steady at +1.9% YoY Strong growth in Revenue per Visit, up +4.2% in Q3 YoY Capital Allocation Continued focus on de-levering for remainder of 2025, with net leverage lowered to 3.6x in Q3. On pace for ≤3.5x guidance by year-end (Q4 is typically our strongest cash flow quarter) and <3.0x by end of 2026 Revolving credit facility completely paid down, with $50mm repaid in Q3 and $35mm repaid in October $0.0625 quarterly dividend maintained, continuing to return value to shareholders $100mm share repurchase program authorized by Board of Directors. Does not impact focus on de-levering and commitment to future leverage targets (1) Adjusted EBITDA and Adjusted EBITDA margin are non-GAAP measures, see appendix for a reconciliation to net income
©2025 Concentra Inc. All rights reserved. 5 Q3 2025 Performance (1) Adjusted EBITDA and Adjusted EBITDA margin are non-GAAP measures, see appendix for a reconciliation to net income; (2) Excluding acquisitions Q3 2025 Q3 2024 YoY (∆) Commentary Facility Count (end of period) Occupational Health Centers 628 549 +79 Due to Nova acquisition (67) and other M&A and de novos Onsite Health Clinics 413 156 +257 Due to Pivot Onsite acquisition (240+) KPIs Visits per Day (“VPD”) 55.6k 50.9k 9.2% +3.0% Workers’ Compensation VPD 25.3k 23.1k 9.8% +4.4% VPD growth excluding impact of Nova acquisition Employer Services VPD 29.4k 27.0k 8.9% +1.9% Revenue per Visit (“RPV”) $147 $141 4.2% Workers’ Compensation RPV $212 $202 4.7% Employer Services RPV $92 $90 2.7% Financials ($ in millions) +10.6% Revenue growth excluding impact of NovaTotal Revenue $572.8 $489.6 17.0% Adjusted EBITDA1 $118.9 $101.6 17.1% Adjusted EBITDA margin1 20.8% 20.7% 2bps Net Income $49.8 $45.8 8.9% Net Income margin 8.7% 9.3% (65)bps Capital Expenditures2 $21.2 $15.1 40.0% Slight margin expansion, even with one-time Nova transition costs not adjusted out + incremental costs from separation Includes ~$3M of one-time transition capex for Nova in Q3 2025
©2025 Concentra Inc. All rights reserved. 6 YTD 2025 Performance (1) Adjusted EBITDA and Adjusted EBITDA margin are non-GAAP measures, see appendix for a reconciliation to net income; (2) Excluding acquisitions YTD 2025 YTD 2024 YoY (∆) Commentary Facility Count (end of period) Occupational Health Centers 628 549 +79 Due to Nova acquisition (67) and other M&A and de novos Onsite Health Clinics 413 156 +257 Due to Pivot Onsite acquisition (240+) KPIs Visits per Day (“VPD”) 53.8k 50.1k 7.3% +2.0% Workers’ Compensation VPD 24.4k 22.7k 7.2% +2.6% VPD growth excluding impact of Nova acquisition Employer Services VPD 28.6k 26.5k 7.8% +1.7% Revenue per Visit (“RPV”) $147 $140 4.7% Workers’ Compensation RPV $210 $199 5.7% Employer Services RPV $93 $90 3.2% Financials ($ in millions) +13.8% +8.6% Revenue growth on a per-day basis Revenue growth on a per-day basis excluding Nova (Note: One less revenue day in YTD 2025 vs. YTD 2024) Total Revenue $1,624.3 $1,435.2 13.2% Adjusted EBITDA1 $336.6 $299.3 12.5% Adjusted EBITDA margin1 20.7% 20.9% (13)bps Largely driven by (1) one-time Nova/Pivot transition costs not adjusted out, (2) reversal of accruals in PY, (3) incremental costs from separation Net Income is lower primarily due to IPO recapitalization Includes ~$11M of one-time transition capex for Nova in YTD 2025 Net Income $136.7 $149.1 (8.3)% Net Income margin 8.4% 10.4% (198)bps Capital Expenditures2 $62.2 $47.6 30.5%
©2025 Concentra Inc. All rights reserved. Balance Sheet & Capital Allocation Strategy 7 Leverage Prudent management of leverage levels, targeting <3.0x net leverage by end of 2026 M&A and De Novos Strong pipeline of bolt-on acquisitions and de novos + disciplined approach to enhancing footprint for short- and long- term value creation Capital Expenditures Continued strategic investment in technology, facilities, and infrastructure Dividend Concentra Board of Directors approved a quarterly cash dividend of $0.0625 per share Share Repurchase Program Concentra Board of Directors authorized a $100mm share repurchase program Net Leverage Liquidity $50 $393 $443 9/30/2025 Cash Revolver Capacity2 ($ in millions) (1) Net Leverage = Net Debt / Adjusted EBITDA (non-GAAP measure, see appendix for a reconciliation of Adjusted EBITDA to net income); (2) Concentra has $35 million of outstanding borrowings under its $450 million revolving facility as of 9/30/25; however, Concentra has $393 million of availability under its revolving credit facility after giving effect to $22 million of outstanding letters of credit Capital Allocation Strategy (Net leverage as multiple of Adj. EBITDA1, calculation per credit agreement) Heightened focus on acquisition integration and de-levering for remainder of 2025 ~3.9x 3.5x 3.9x 3.6x ≤3.5x <3.0x At IPO (July '24) FY '24A 3/31/25 9/30/25 FY '25E Guidance FY '26E Target Nova acquisition Additional $35M of capacity is currently available after completely paying down revolver in October
©2025 Concentra Inc. All rights reserved. Raising 2025 Full-Year Guidance 8(1) Adjusted EBITDA is a non-GAAP measure, see appendix for a reconciliation to net income; (2) Net Leverage = Net Debt / Adjusted EBITDA (non-GAAP measure, see appendix for a reconciliation of Adjusted EBITDA to net income) FY 2024 Actual FY 2025 Guidance YoY Growth (%) Commentary Total Revenue $1,900.2mm $2.145bn – $2.160bn 13% – 14% Raising previous FY 2025 guidance ($2.13bn – $2.16bn) Adjusted EBITDA1 $376.9mm $425mm – $430mm 13% – 14% Raising previous FY 2025 guidance ($420mm – $430mm) Capital Expenditures $64.3mm $80mm – $90mm Trending towards lower end of range; 2025 includes ~$10-15M of one-time spend for Nova integration Net Leverage2 3.5x ≤3.5x
©2025 Concentra Inc. All rights reserved. Appendix
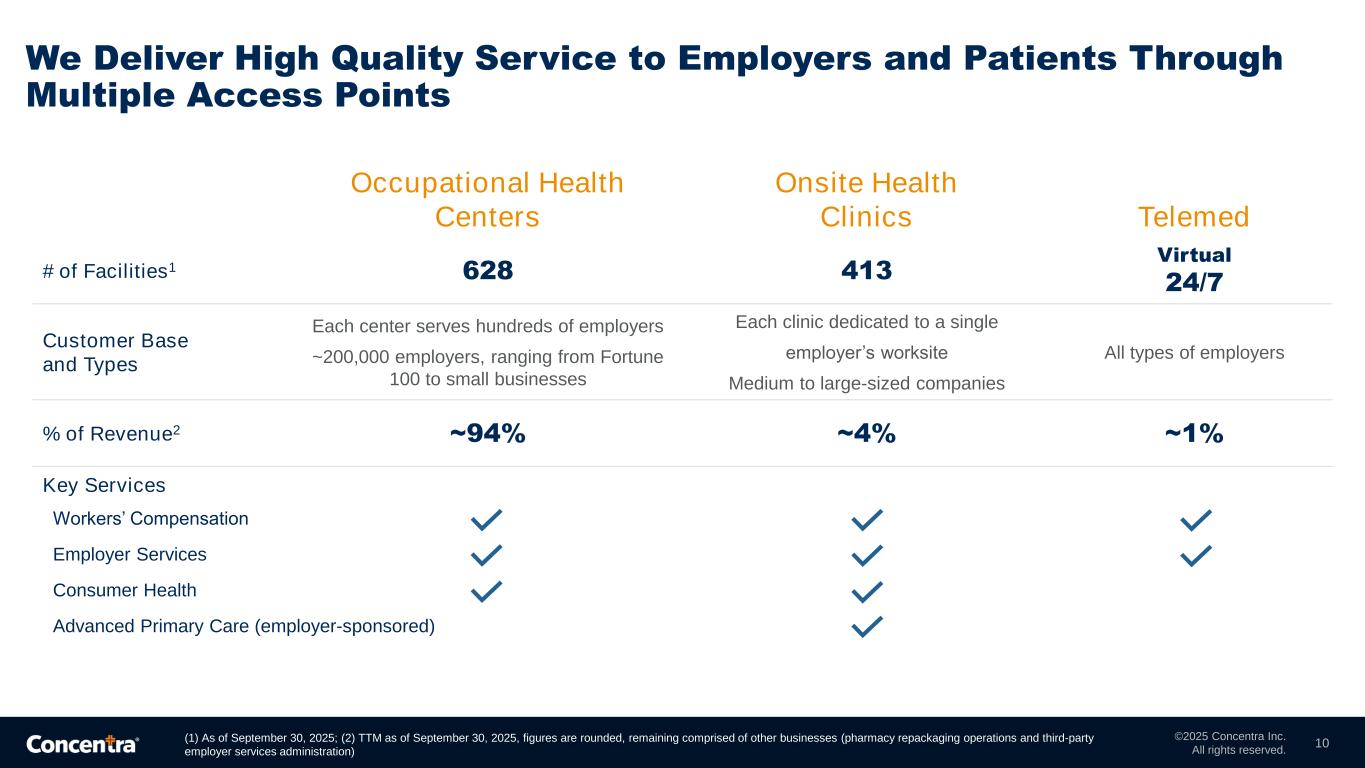
©2025 Concentra Inc. All rights reserved. 10 We Deliver High Quality Service to Employers and Patients Through Multiple Access Points Occupational Health Centers Onsite Health Clinics Telemed # of Facilities1 628 413 Virtual 24/7 Customer Base and Types Each center serves hundreds of employers ~200,000 employers, ranging from Fortune 100 to small businesses Each clinic dedicated to a single employer’s worksite Medium to large-sized companies All types of employers % of Revenue2 ~94% ~4% ~1% Key Services Workers’ Compensation Employer Services Consumer Health Advanced Primary Care (employer-sponsored) (1) As of September 30, 2025; (2) TTM as of September 30, 2025, figures are rounded, remaining comprised of other businesses (pharmacy repackaging operations and third-party employer services administration)
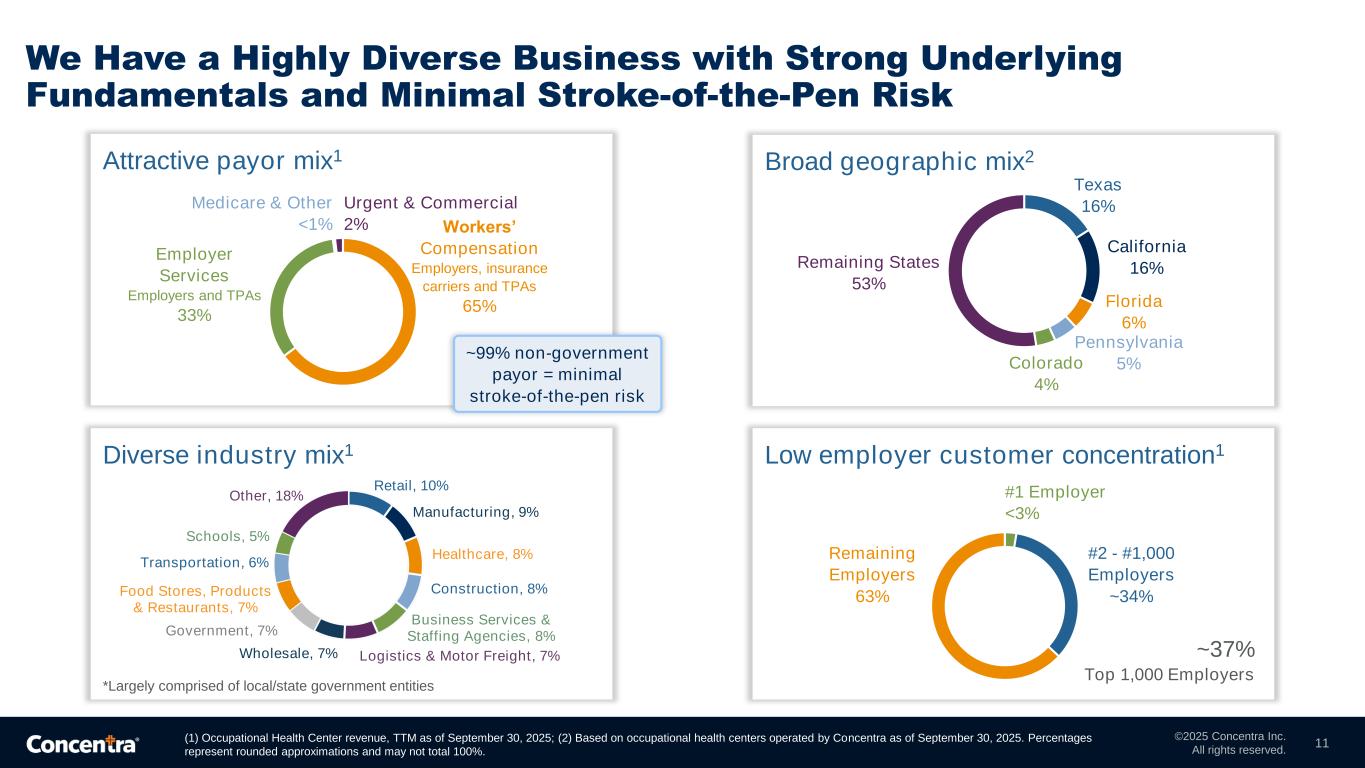
©2025 Concentra Inc. All rights reserved. 11 We Have a Highly Diverse Business with Strong Underlying Fundamentals and Minimal Stroke-of-the-Pen Risk (1) Occupational Health Center revenue, TTM as of September 30, 2025; (2) Based on occupational health centers operated by Concentra as of September 30, 2025. Percentages represent rounded approximations and may not total 100%. Broad geographic mix2 Remaining States 53% Texas 16% California 16% Florida 6% Pennsylvania 5%Colorado 4% Attractive payor mix1 Employer Services Employers and TPAs 33% Medicare & Other <1% Workers’ Compensation Employers, insurance carriers and TPAs 65% Urgent & Commercial 2% Diverse industry mix1 Retail, 10% Manufacturing, 9% Healthcare, 8% Construction, 8% Business Services & Staffing Agencies, 8% Logistics & Motor Freight, 7%Wholesale, 7% Government, 7% Food Stores, Products & Restaurants, 7% Transportation, 6% Schools, 5% Other, 18% Low employer customer concentration1 ~37% Top 1,000 Employers Remaining Employers 63% #2 - #1,000 Employers ~34% #1 Employer <3% *Largely comprised of local/state government entities ~99% non-government payor = minimal stroke-of-the-pen risk
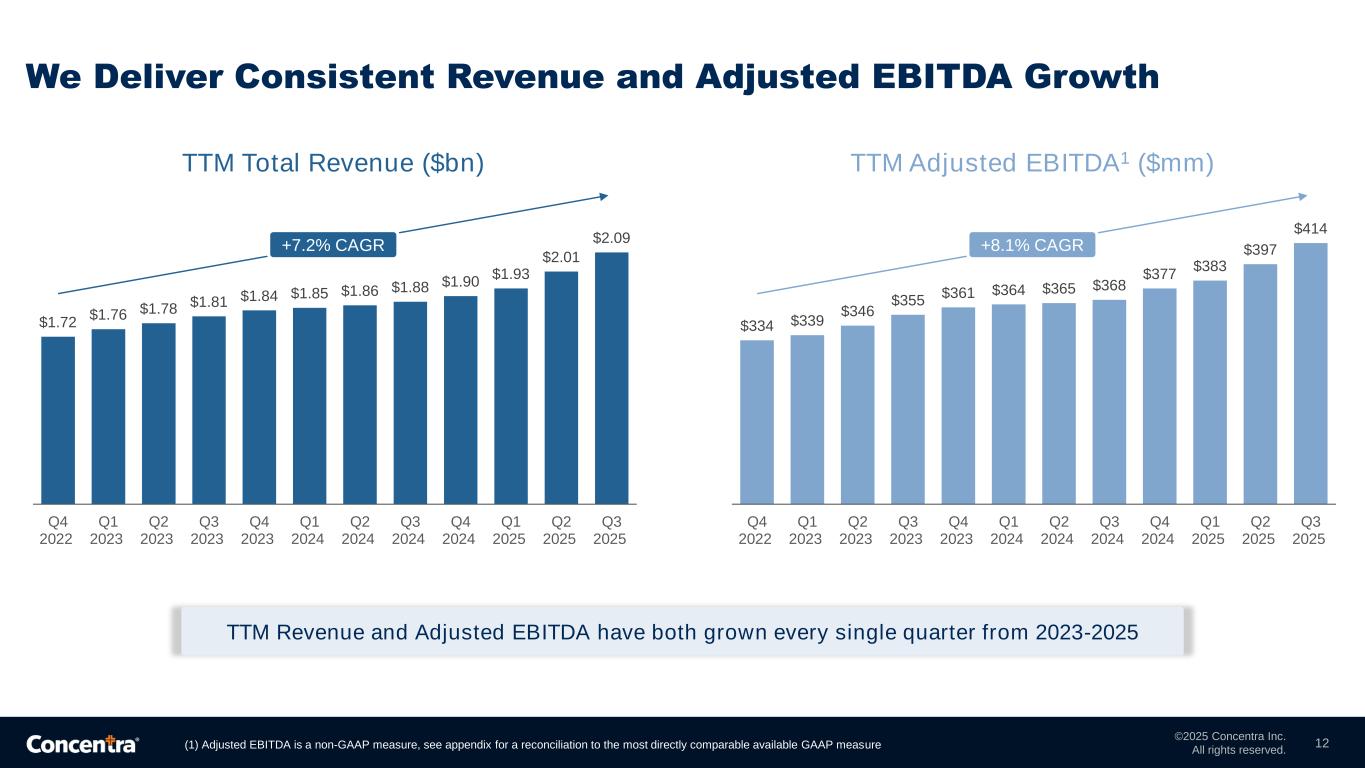
©2025 Concentra Inc. All rights reserved. 12 We Deliver Consistent Revenue and Adjusted EBITDA Growth $1.72 $1.76 $1.78 $1.81 $1.84 $1.85 $1.86 $1.88 $1.90 $1.93 $2.01 $2.09 Q4 2022 Q1 2023 Q2 2023 Q3 2023 Q4 2023 Q1 2024 Q2 2024 Q3 2024 Q4 2024 Q1 2025 Q2 2025 Q3 2025 $334 $339 $346 $355 $361 $364 $365 $368 $377 $383 $397 $414 Q4 2022 Q1 2023 Q2 2023 Q3 2023 Q4 2023 Q1 2024 Q2 2024 Q3 2024 Q4 2024 Q1 2025 Q2 2025 Q3 2025 TTM Revenue and Adjusted EBITDA have both grown every single quarter from 2023-2025 TTM Total Revenue ($bn) TTM Adjusted EBITDA1 ($mm) (1) Adjusted EBITDA is a non-GAAP measure, see appendix for a reconciliation to the most directly comparable available GAAP measure +7.2% CAGR +8.1% CAGR
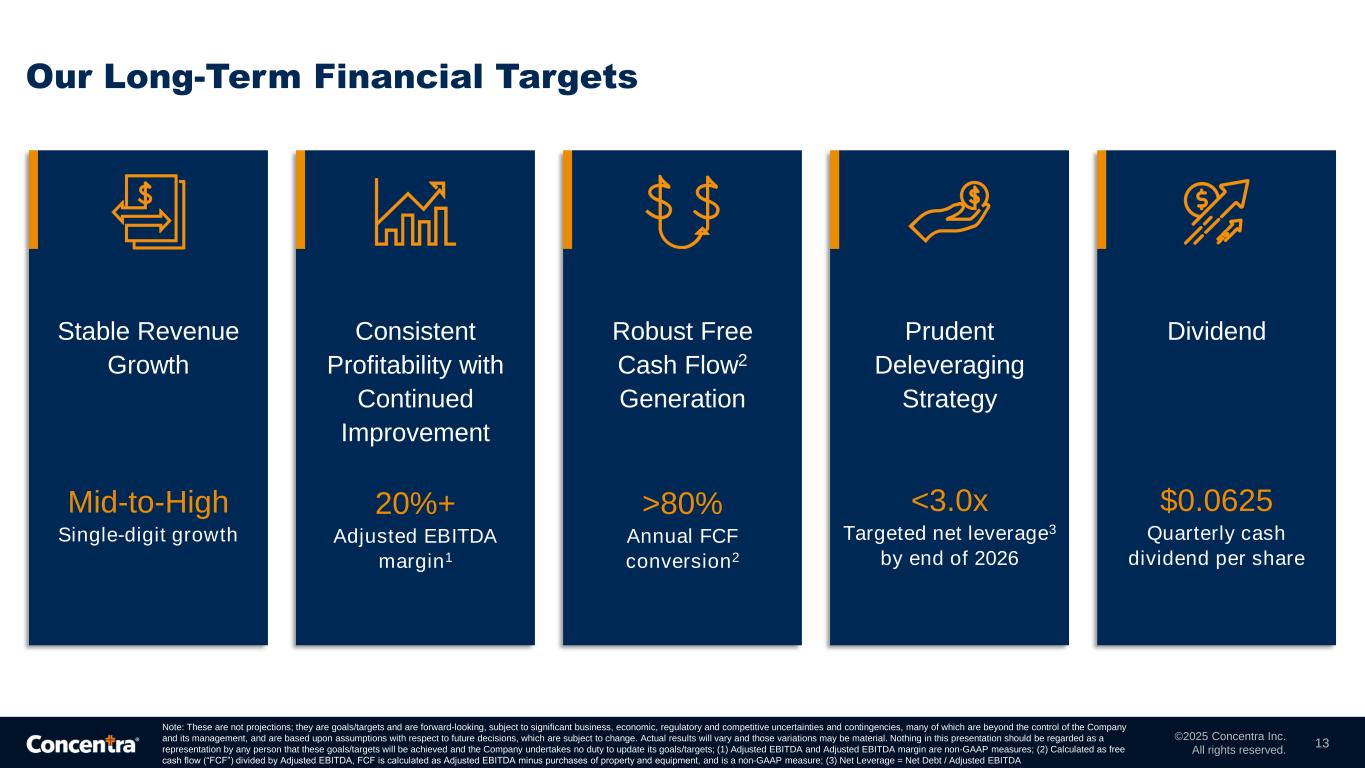
©2025 Concentra Inc. All rights reserved. 13 Our Long-Term Financial Targets Consistent Profitability with Continued Improvement 20%+ Adjusted EBITDA margin1 Robust Free Cash Flow2 Generation >80% Annual FCF conversion2 Prudent Deleveraging Strategy <3.0x Targeted net leverage3 by end of 2026 Stable Revenue Growth Mid-to-High Single-digit growth Dividend $0.0625 Quarterly cash dividend per share Note: These are not projections; they are goals/targets and are forward-looking, subject to significant business, economic, regulatory and competitive uncertainties and contingencies, many of which are beyond the control of the Company and its management, and are based upon assumptions with respect to future decisions, which are subject to change. Actual results will vary and those variations may be material. Nothing in this presentation should be regarded as a representation by any person that these goals/targets will be achieved and the Company undertakes no duty to update its goals/targets; (1) Adjusted EBITDA and Adjusted EBITDA margin are non-GAAP measures; (2) Calculated as free cash flow (“FCF”) divided by Adjusted EBITDA, FCF is calculated as Adjusted EBITDA minus purchases of property and equipment, and is a non-GAAP measure; (3) Net Leverage = Net Debt / Adjusted EBITDA
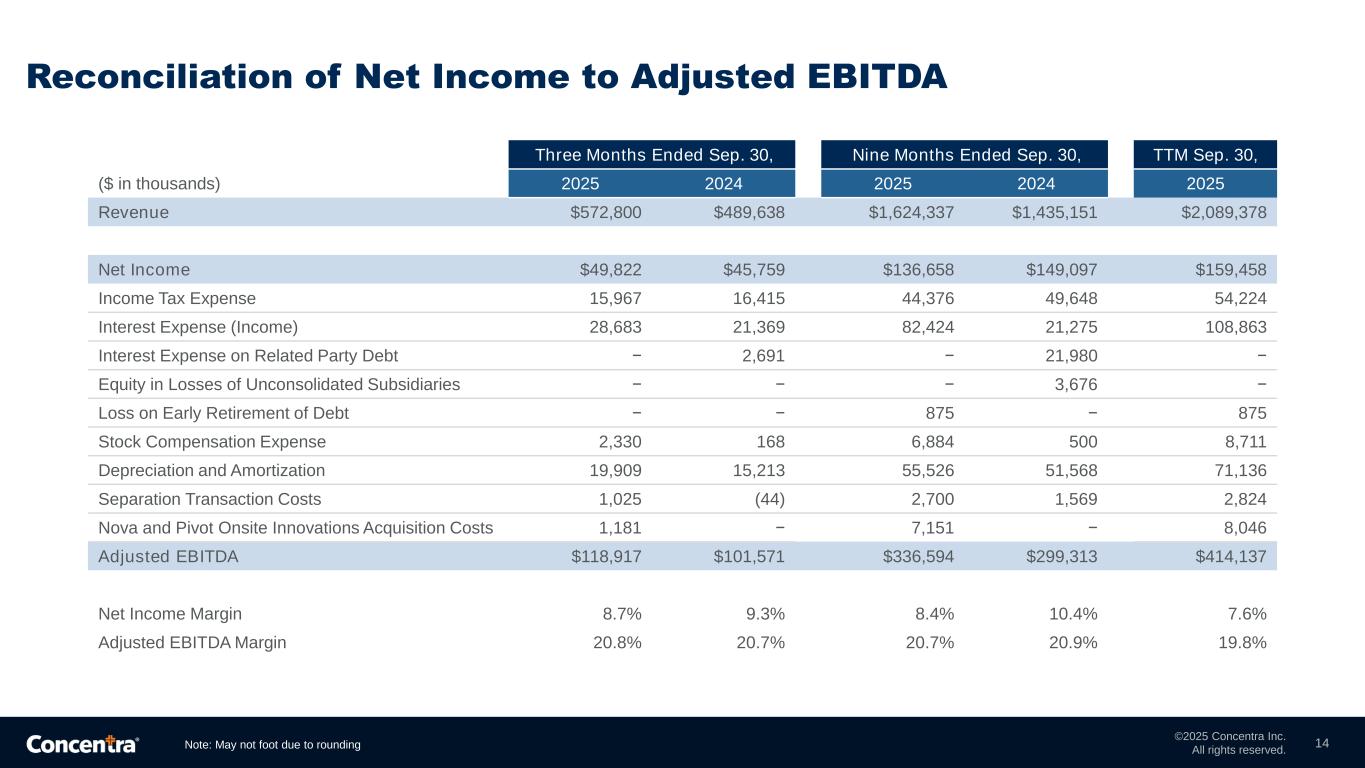
©2025 Concentra Inc. All rights reserved. Reconciliation of Net Income to Adjusted EBITDA 14 Three Months Ended Sep. 30, Nine Months Ended Sep. 30, TTM Sep. 30, ($ in thousands) 2025 2024 2025 2024 2025 Revenue $572,800 $489,638 $1,624,337 $1,435,151 $2,089,378 Net Income $49,822 $45,759 $136,658 $149,097 $159,458 Income Tax Expense 15,967 16,415 44,376 49,648 54,224 Interest Expense (Income) 28,683 21,369 82,424 21,275 108,863 Interest Expense on Related Party Debt − 2,691 − 21,980 − Equity in Losses of Unconsolidated Subsidiaries − − − 3,676 − Loss on Early Retirement of Debt − − 875 − 875 Stock Compensation Expense 2,330 168 6,884 500 8,711 Depreciation and Amortization 19,909 15,213 55,526 51,568 71,136 Separation Transaction Costs 1,025 (44) 2,700 1,569 2,824 Nova and Pivot Onsite Innovations Acquisition Costs 1,181 − 7,151 − 8,046 Adjusted EBITDA $118,917 $101,571 $336,594 $299,313 $414,137 Net Income Margin 8.7% 9.3% 8.4% 10.4% 7.6% Adjusted EBITDA Margin 20.8% 20.7% 20.7% 20.9% 19.8% Note: May not foot due to rounding
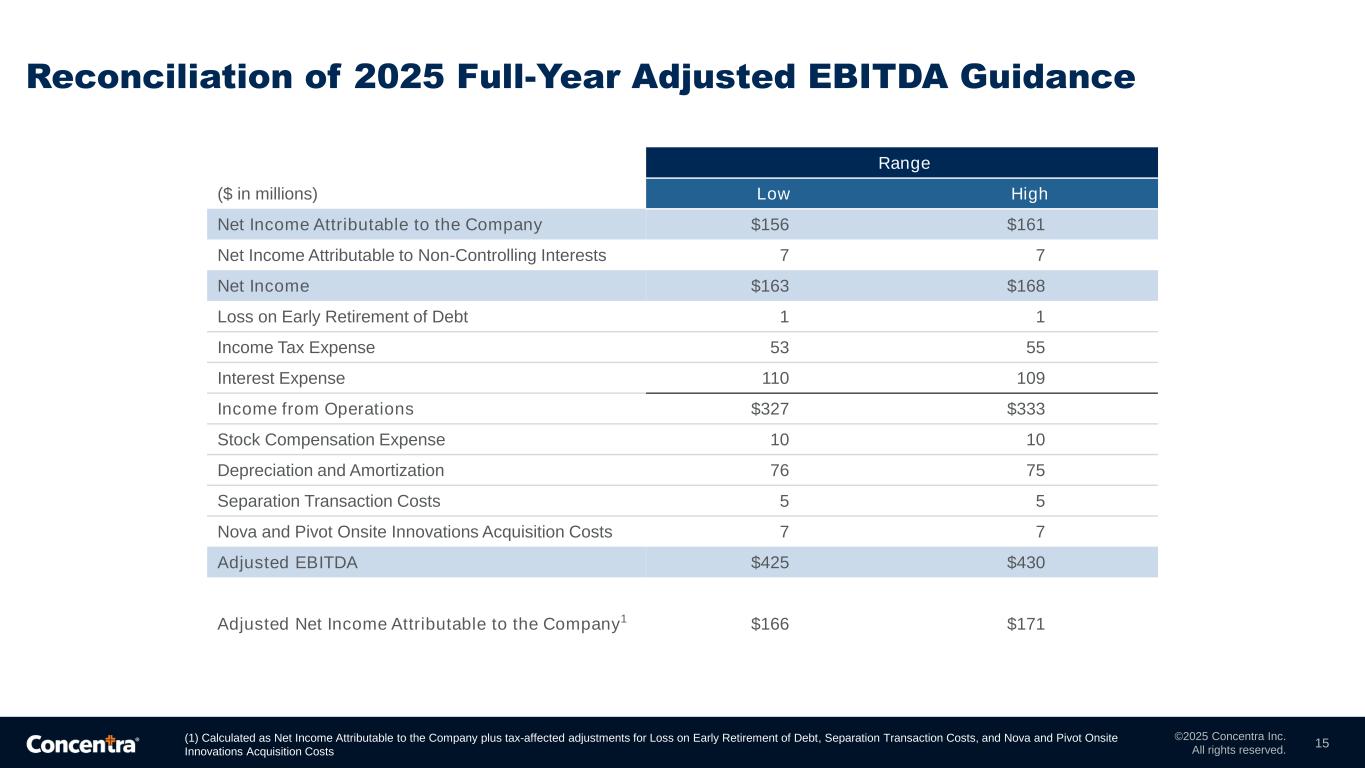
©2025 Concentra Inc. All rights reserved. Reconciliation of 2025 Full-Year Adjusted EBITDA Guidance 15 Range ($ in millions) Low High Net Income Attributable to the Company $156 $161 Net Income Attributable to Non-Controlling Interests 7 7 Net Income $163 $168 Loss on Early Retirement of Debt 1 1 Income Tax Expense 53 55 Interest Expense 110 109 Income from Operations $327 $333 Stock Compensation Expense 10 10 Depreciation and Amortization 76 75 Separation Transaction Costs 5 5 Nova and Pivot Onsite Innovations Acquisition Costs 7 7 Adjusted EBITDA $425 $430 Adjusted Net Income Attributable to the Company1 $166 $171 (1) Calculated as Net Income Attributable to the Company plus tax-affected adjustments for Loss on Early Retirement of Debt, Separation Transaction Costs, and Nova and Pivot Onsite Innovations Acquisition Costs
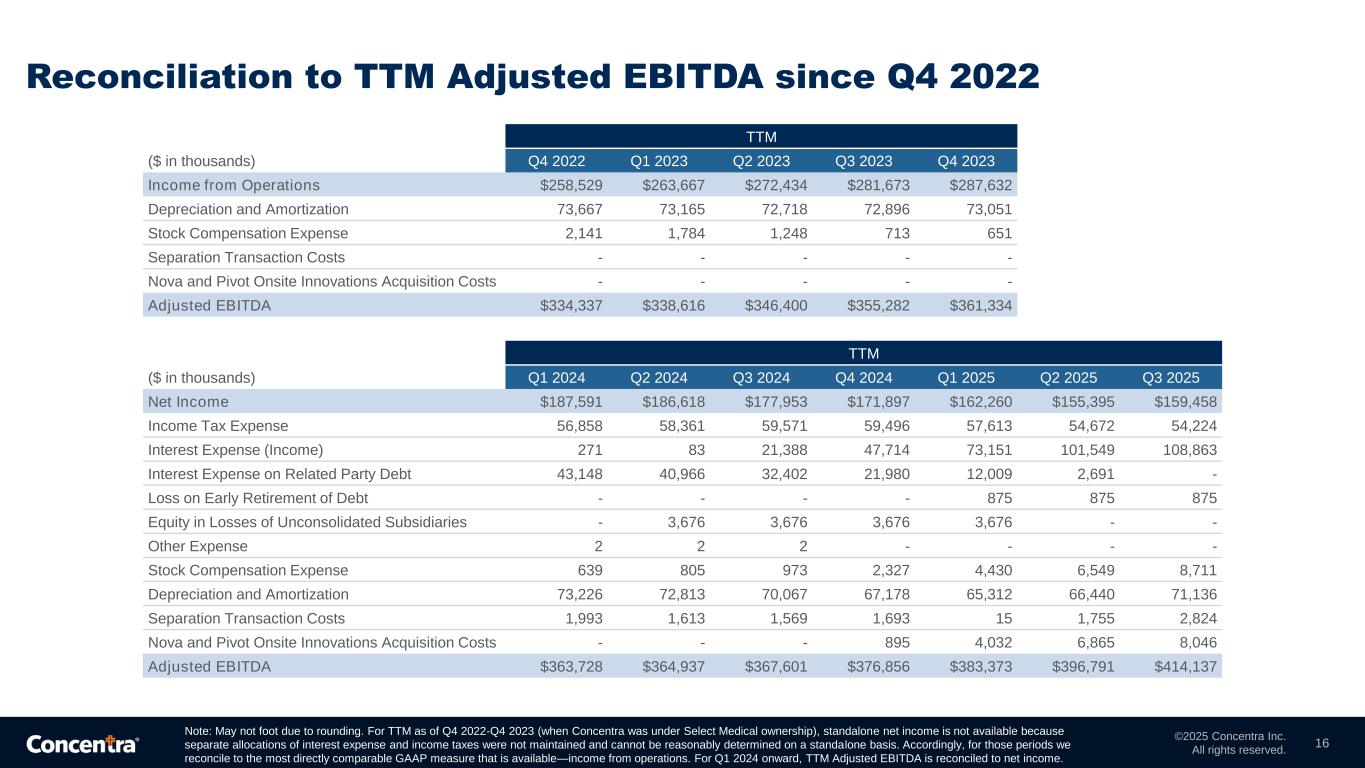
©2025 Concentra Inc. All rights reserved. Reconciliation to TTM Adjusted EBITDA since Q4 2022 16 Note: May not foot due to rounding. For TTM as of Q4 2022-Q4 2023 (when Concentra was under Select Medical ownership), standalone net income is not available because separate allocations of interest expense and income taxes were not maintained and cannot be reasonably determined on a standalone basis. Accordingly, for those periods we reconcile to the most directly comparable GAAP measure that is available—income from operations. For Q1 2024 onward, TTM Adjusted EBITDA is reconciled to net income. TTM ($ in thousands) Q4 2022 Q1 2023 Q2 2023 Q3 2023 Q4 2023 Income from Operations $258,529 $263,667 $272,434 $281,673 $287,632 Depreciation and Amortization 73,667 73,165 72,718 72,896 73,051 Stock Compensation Expense 2,141 1,784 1,248 713 651 Separation Transaction Costs - - - - - Nova and Pivot Onsite Innovations Acquisition Costs - - - - - Adjusted EBITDA $334,337 $338,616 $346,400 $355,282 $361,334 TTM ($ in thousands) Q1 2024 Q2 2024 Q3 2024 Q4 2024 Q1 2025 Q2 2025 Q3 2025 Net Income $187,591 $186,618 $177,953 $171,897 $162,260 $155,395 $159,458 Income Tax Expense 56,858 58,361 59,571 59,496 57,613 54,672 54,224 Interest Expense (Income) 271 83 21,388 47,714 73,151 101,549 108,863 Interest Expense on Related Party Debt 43,148 40,966 32,402 21,980 12,009 2,691 - Loss on Early Retirement of Debt - - - - 875 875 875 Equity in Losses of Unconsolidated Subsidiaries - 3,676 3,676 3,676 3,676 - - Other Expense 2 2 2 - - - - Stock Compensation Expense 639 805 973 2,327 4,430 6,549 8,711 Depreciation and Amortization 73,226 72,813 70,067 67,178 65,312 66,440 71,136 Separation Transaction Costs 1,993 1,613 1,569 1,693 15 1,755 2,824 Nova and Pivot Onsite Innovations Acquisition Costs - - - 895 4,032 6,865 8,046 Adjusted EBITDA $363,728 $364,937 $367,601 $376,856 $383,373 $396,791 $414,137
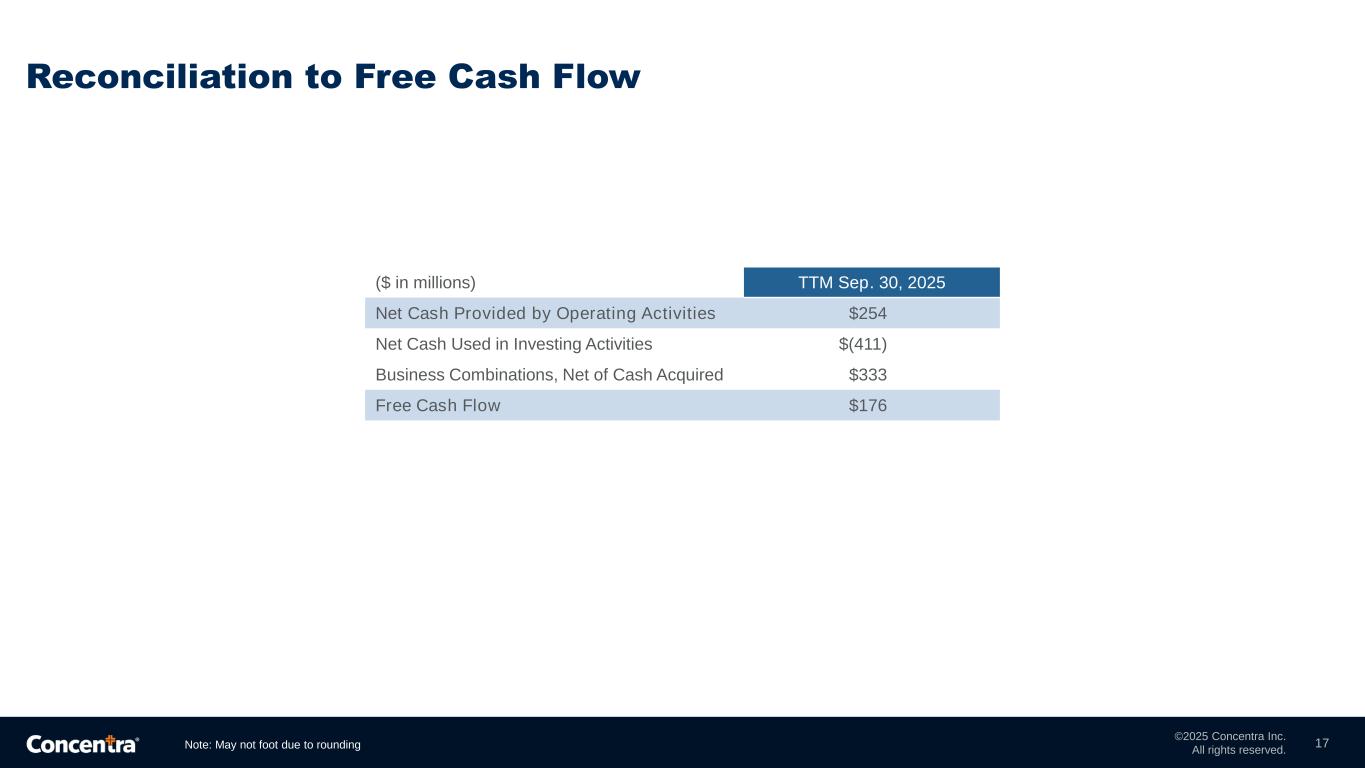
©2025 Concentra Inc. All rights reserved. Reconciliation to Free Cash Flow 17Note: May not foot due to rounding ($ in millions) TTM Sep. 30, 2025 Net Cash Provided by Operating Activities $254 Net Cash Used in Investing Activities $(411) Business Combinations, Net of Cash Acquired $333 Free Cash Flow $176

Improving the health of America’s workforce, one patient at a time.