CORZ 8-K
Core Scientific, Inc./tx (CORZ)
8-K
2025-05-07
For: 2025-05-07
View Original
Added on
April 09, 2026
UNITED STATES
SECURITIES AND EXCHANGE COMMISSION
Washington, D.C. 20549
FORM 8-K
CURRENT REPORT
Pursuant to Section 13 or 15(d)
of the Securities Exchange Act of 1934
Date of Report (Date of earliest event reported): May 7, 2025
Core Scientific, Inc.
(Exact name of registrant as specified in its charter)
| (State or other jurisdiction of incorporation) | (Commission File Number) | (IRS Employer Identification No.) | ||||||||||||
838 Walker Road, Suite 21-2105 Dover, Delaware | ||||||||
| (Address of principal executive offices) | (Zip Code) | |||||||
Registrant’s telephone number, including area code: (512 ) 402-5233
(Former Name or Former Address, if Changed Since Last Report)
Check the appropriate box below if the Form 8-K filing is intended to simultaneously satisfy the filing obligations of the registrant under any of the following provisions:
| Written communications pursuant to Rule 425 under the Securities Act (17 CFR 230.425) | |||||
| Soliciting material pursuant to Rule 14a-12 under the Exchange Act (17 CFR 240.14a-12) | |||||
| Pre-commencement communications pursuant to Rule 14d-2(b) under the Exchange Act (17 CFR 240.14d-2(b)) | |||||
| Pre-commencement communications pursuant to Rule 13e-4(c) under the Exchange Act (17 CFR 240.13e-4(c)) | |||||
Securities registered pursuant to Section 12(b) of the Act:
| Title of each class | Trading Symbol(s) | Name of each exchange on which registered | ||||||
Indicate by check mark whether the registrant is an emerging growth company as defined in Rule 405 of the Securities Act of 1933 (§230.405 of this chapter) or Rule 12b-2 of the Securities Exchange Act of 1934 (§240.12b-2 of this chapter).
Emerging growth company ☐
If an emerging growth company, indicate by check mark if the registrant has elected not to use the extended transition period for complying with any new or revised financial accounting standards provided pursuant to Section 13(a) of the Exchange Act. ☐
Item 2.02 Results of Operations and Financial Condition
On May 7, 2025, the Company issued a press release announcing its financial results for the first fiscal quarter ended March 31, 2025. A copy of the press release is furnished hereto as Exhibit 99.1 and is incorporated herein by reference.
On May 7, 2025, the Company also released a corporate presentation reporting such results. A copy of the presentation is furnished hereto as Exhibit 99.2 and is incorporated herein by reference.
Item 7.01 Regulation FD Disclosure
The information contained in Item 2.02 is incorporated herein by reference.
The information in Items 2.02 and 7.01 of this Current Report on Form 8-K, including Exhibit 99.1 and Exhibit 99.2, is furnished and shall not be deemed “filed” for purposes of Section 18 of the Securities Exchange Act of 1934, as amended, nor shall it be deemed incorporated by reference in any filing made by the Company under the Securities Act of 1933, as amended, whether made before or after the date hereof, regardless of any general incorporation language in such filing.
Item 9.01 Financial Statement and Exhibits
(d) Exhibits:
| Exhibit No. | Description | |||||||
| 99.1 | ||||||||
| 99.2 | ||||||||
| 104 | Cover Page Interactive Data File (embedded within the Inline XBRL document). | |||||||
SIGNATURES
Pursuant to the requirements of the Securities Exchange Act of 1934, the Registrant has duly caused this report to be signed on its behalf by the undersigned hereunto duly authorized.
| Core Scientific, Inc. | ||||||||
Dated: May 7, 2024 | ||||||||
| By: | /s/ Todd M. DuChene | |||||||
| Name: | Todd M. DuChene | |||||||
| Title: | Chief Legal Officer and Chief Administrative Officer | |||||||
 | Exhibit 99.1 | ||||||||||
Core Scientific Announces Fiscal First Quarter 2025 Results
First Quarter 2025 Highlights
•On track to deliver 250MW of billable capacity to CoreWeave by the end of this year and anticipate entering 2026 with annualized colocation revenue of approximately $360 million.
•First tranche of 8MW of billable capacity at Denton to be delivered to CoreWeave by the end of this month and an additional approximately 40MW by the end of this quarter.
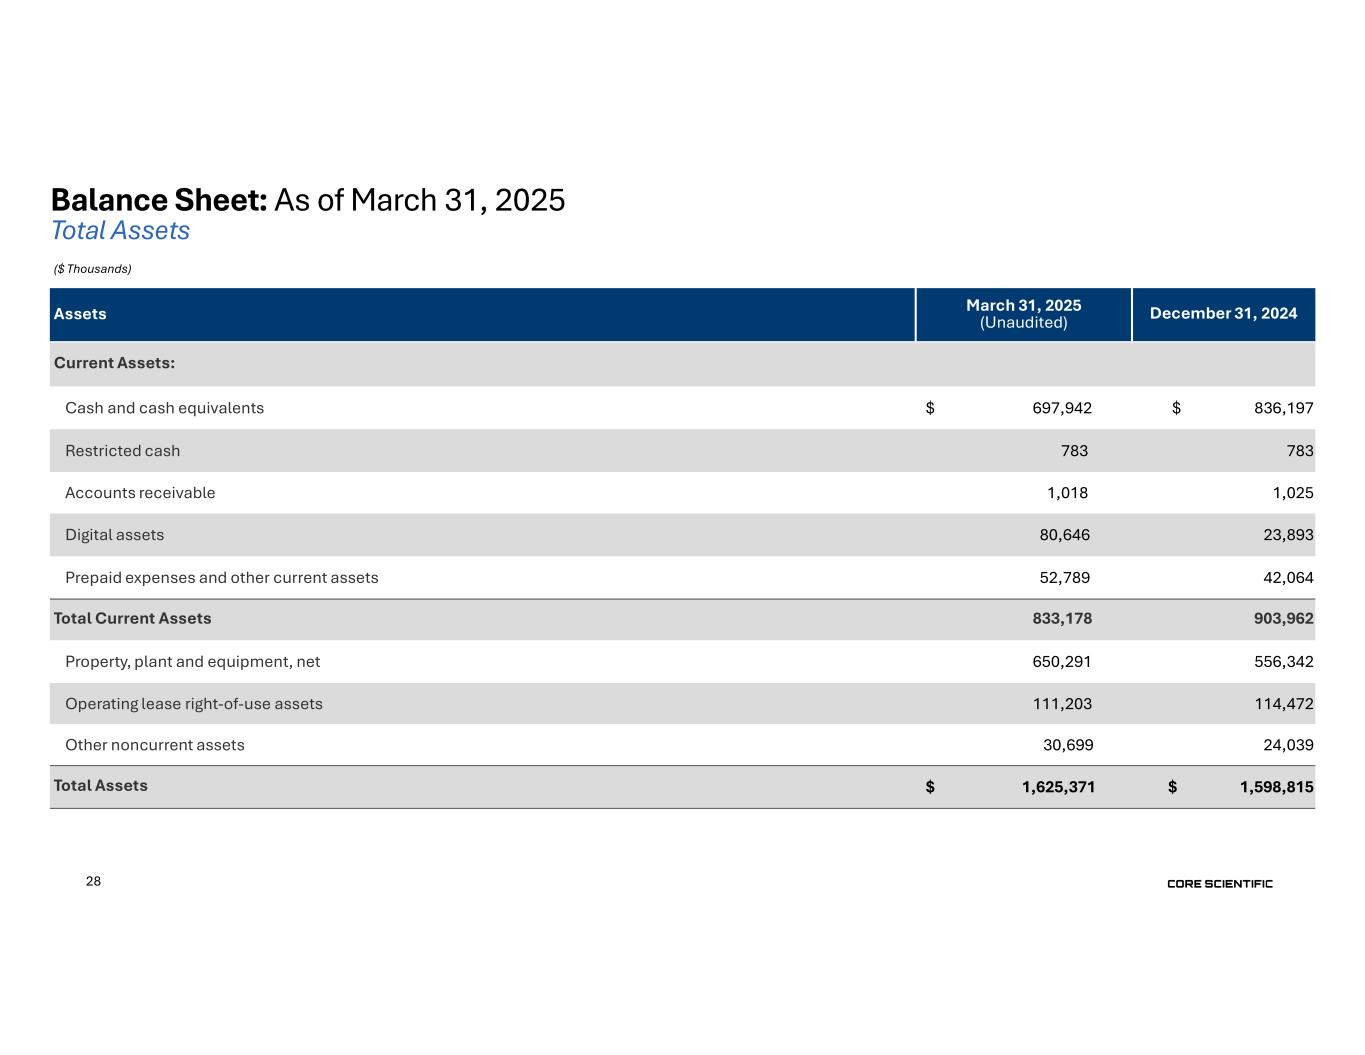
•Ended the quarter with a strong liquidity position, including $778.6 million in cash and cash equivalents and digital assets, maintaining financial flexibility to execute on strategic organic and inorganic growth opportunities.
AUSTIN, Texas, May 7, 2025 - Core Scientific, Inc. (NASDAQ: CORZ), a leader in digital infrastructure for high-density colocation services and digital asset mining, today announced financial results for the fiscal first quarter of 2025. Net income was $580.7 million, as compared to $210.7 million for the same period in 2024. Total revenue was $79.5 million, as compared to $179.3 million for the same period last year. Operating loss was $42.6 million, as compared to Operating income of $55.2 million for the same period in 2024. Adjusted EBITDA was $(6.1) million, as compared to $88.0 million for the same period in the prior year. First quarter net income of $580.7 million resulted primarily from a net $621.5 million non-cash mark-to-market adjustment in the value of our tranche 1 and tranche 2 warrants and other contingent value rights required as a result of the significant quarter-over-quarter decrease in our share price.
“This quarter marks an inflection point for Core Scientific. In a matter of months, we have transformed vision into execution, delivering infrastructure at scale and positioning ourselves at the center of one of the most important shifts in modern computing. The pace of demand for high-performance data infrastructure is accelerating, and our ability to move with speed and precision is setting us apart. We are not just expanding capacity; we are shaping the foundation for the next era of data center infrastructure,” said Adam Sullivan, Core Scientific’s Chief Executive Officer.
Fiscal First Quarter 2025 Financial Results (Compared to Fiscal First Quarter 2024)
Total revenue for the fiscal first quarter of 2025 was $79.5 million, consisting of $67.2 million in Digital asset self-mining revenue, $3.8 million in Digital asset hosted mining revenue and $8.6 million in Colocation (formerly “HPC hosting”) revenue.
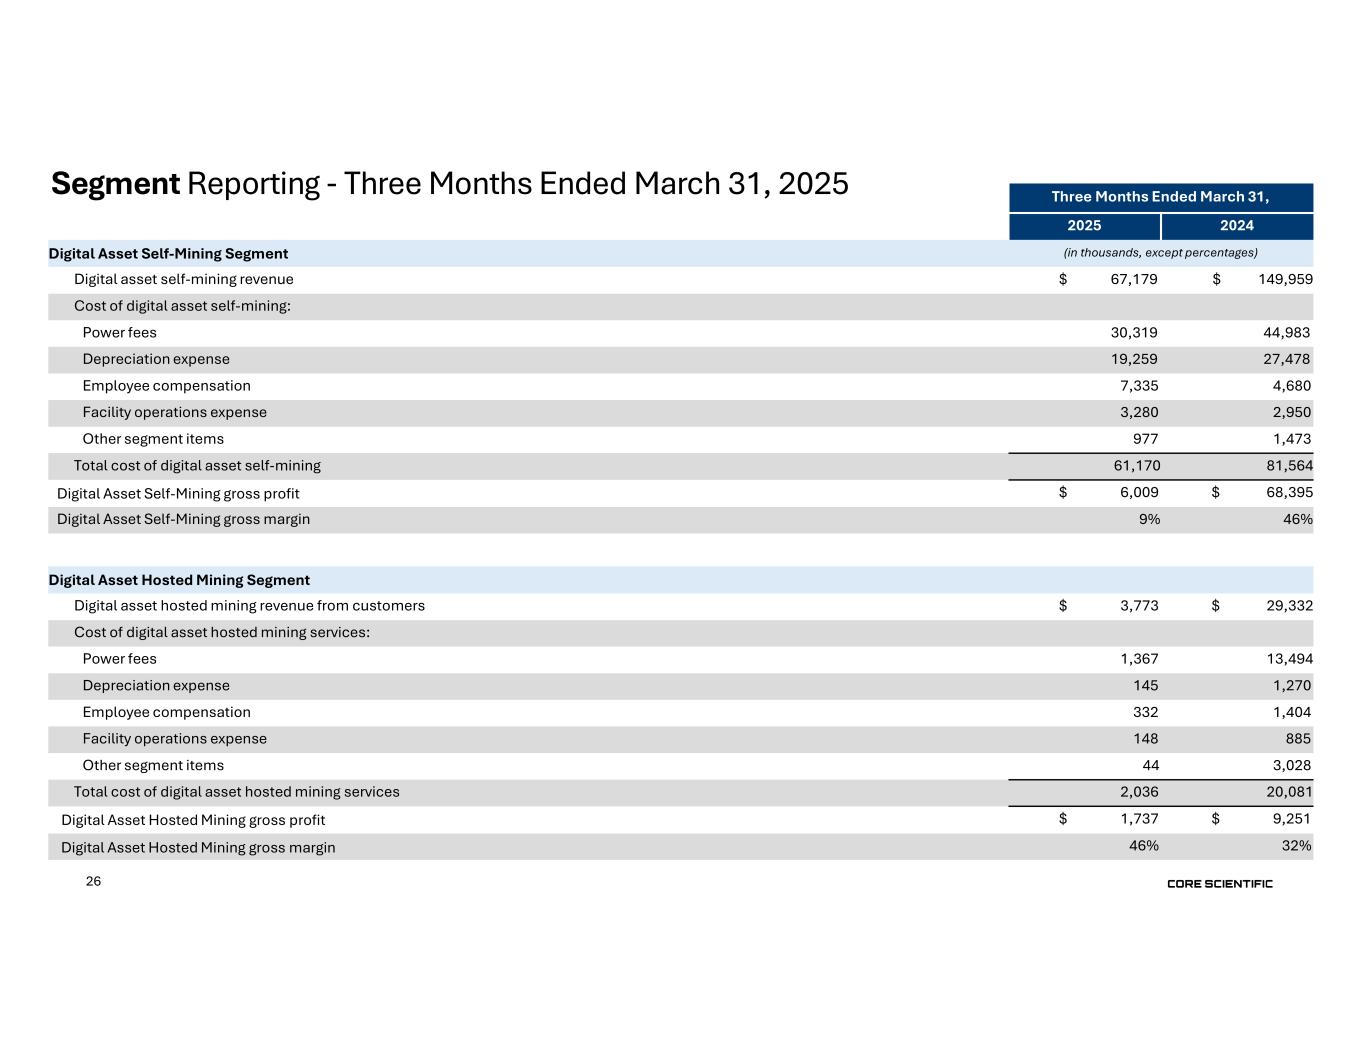
Digital asset self-mining gross profit for the fiscal first quarter of 2025 was $6.0 million (9% gross margin), compared to $68.4 million (46% gross margin) for the same period in the prior year, a decrease of $62.4 million. The decrease in Digital asset self-mining gross profit was primarily driven by a $82.8 million decrease in self-mining revenue, the result of a 75% decrease in bitcoin mined due to the halving and the operational shift to Colocation, partially offset by a 74% increase in the average price of bitcoin and a 33% decrease in power costs due to lower rates and usage.
Digital asset hosted mining gross profit for the fiscal first quarter of 2025 was $1.7 million (46% gross margin), as compared to $9.3 million (32% gross margin) for the same period in the prior year. The decrease in Digital asset hosted mining gross profit was primarily due to a $25.6 million decrease in hosted mining revenue driven
-more-
Core Scientific, Inc. Fiscal First Quarter 2025 Earnings Release - 2 | ||||||||
by our operational shift to Colocation, partially offset by a 90% decrease in power costs due to lower usage driven by our operational shift to Colocation and lower rates.
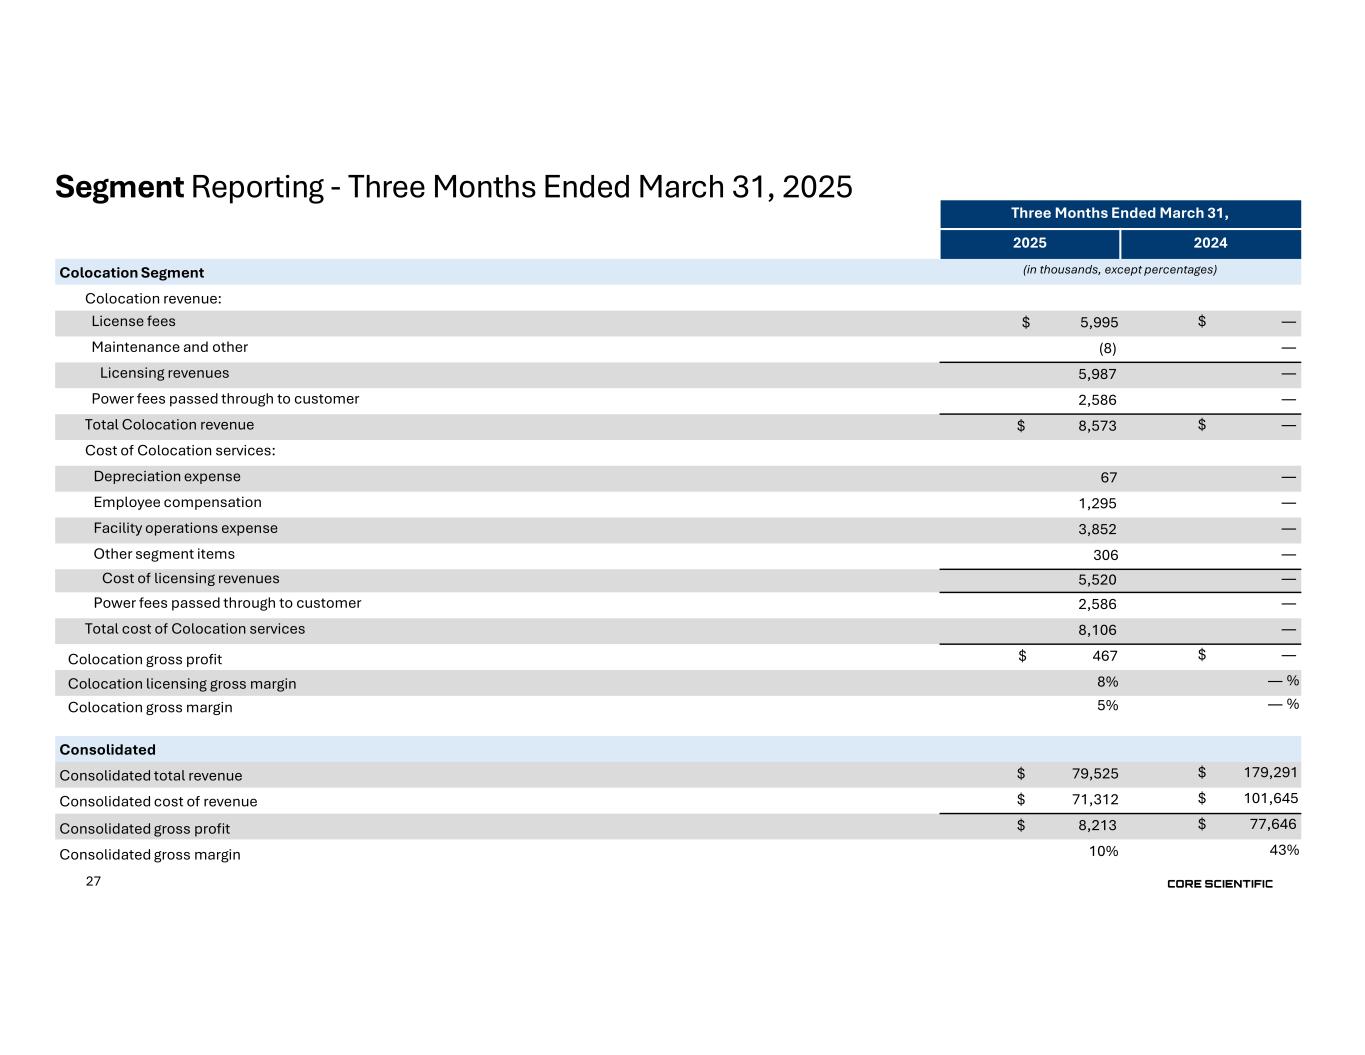
Colocation gross profit for the fiscal first quarter of 2025 was $0.5 million (5% gross margin). Colocation revenue includes a base license fee as well as the direct pass-through of power costs to our client, with no margin added. Colocation costs at our Austin, Texas data center consist primarily of lease expense, the direct pass-through of power costs, and direct and indirect facilities operations expenses, including personnel and benefit costs and stock-based compensation. The non-GAAP gross margin for the fiscal first quarter of 2025, which excludes the direct pass-through of power costs, was 8%.
Selling, general and administrative expenses for the fiscal first quarter of 2025 totaled $40.1 million, as compared to $16.9 million for the same period in the prior year. The increase of $23.2 million was primarily attributable to a $13.9 million increase in stock-based compensation, a $7.2 million increase in non-capitalizable Colocation site startup costs, and a $2.5 million increase in personnel and related expenses due to increased employee headcount to support our transition to Colocation operations.
Net income for the fiscal first quarter of 2025 was $580.7 million, as compared to $210.7 million for the same period in the prior year. Net income for the fiscal first quarter of 2025 increased by $370.0 million driven primarily by a net $621.5 million mark-to-market adjustment on our warrants and other contingent value rights comprising a $634.3 million decrease in the fair value of warrant liabilities, partially offset by a $12.8 million increase in fair value of contingent value rights. These mark-to-market adjustments were driven by the decrease in our stock price during the fiscal first quarter of 2025. Also contributing to the increase in net income was a $16.3 million decrease in interest expense, net due primarily by an $8.7 million decrease in interest expense due to lower interest rates compared to the same period in the prior year, and a $7.9 million increase in proceeds from money market funds. These increases to net income were partially offset by $111.4 million of Reorganization items, net, reflecting the Company’s emergence from bankruptcy during the first fiscal quarter of 2024, with no comparable activity in fiscal 2025 and a $99.8 million decrease in Total revenue, the result of a 75% decrease in bitcoin mined due to the halving and the operational shift to Colocation.
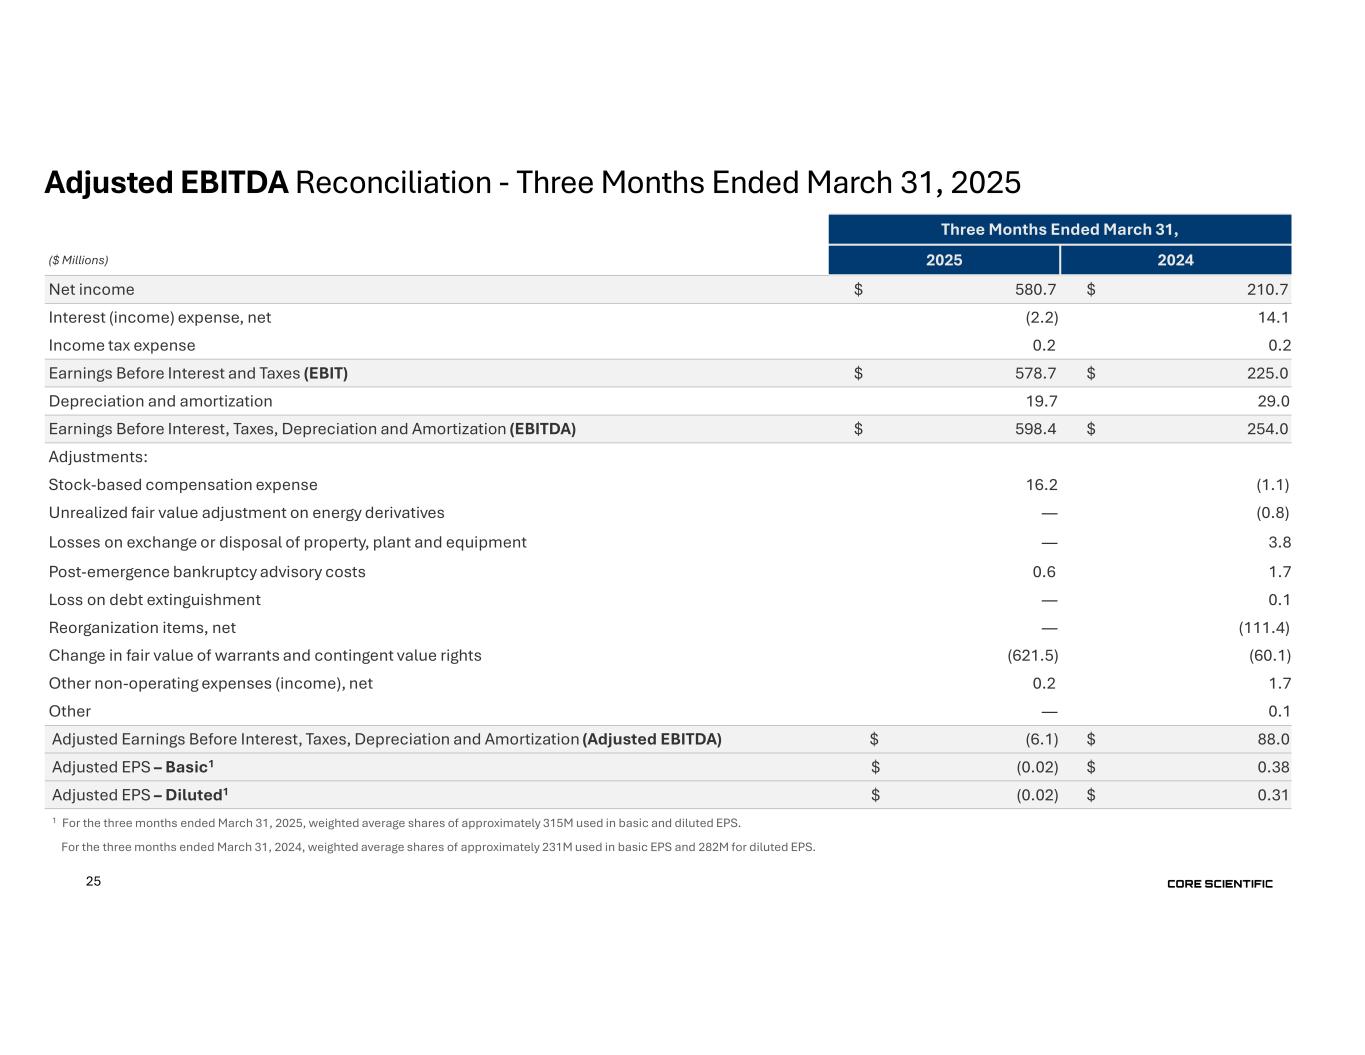
Non-GAAP Adjusted EBITDA for the fiscal first quarter 2025 was $(6.1) million, as compared to Non-GAAP Adjusted EBITDA of $88.0 million for the same period in the prior year. This $94.1 million decrease was driven by a $99.8 million decrease in total revenue, a $11.2 million decrease in the change in fair value of digital assets, and a $7.4 million increase in cash operating expenses, partially offset by a $21.4 million decrease in cash cost of revenue and a $3.0 million decrease in realized losses on energy derivatives.
-more-
Core Scientific, Inc. Fiscal First Quarter 2025 Earnings Release - 3 | ||||||||
CONFERENCE CALL AND LIVE WEBCAST
In conjunction with this release, Core Scientific, Inc. will host a conference call today, Wednesday, May 7, 2025, at 4:30 pm Eastern Time that will be webcast live. Adam Sullivan, Chief Executive Officer, Jim Nygaard, Chief Financial Officer and Jon Charbonneau,Vice President, Investor Relations, will host the call.
Investors may dial into the call by using the following telephone numbers: +1 (888) 428-7458 (U.S. toll free) or +1 (862) 298-0702 (U.S. local) five to ten minutes prior to the start time to allow for registration.
Investors with Internet access may listen to the live audio webcast via the Investor Relations page of the Core Scientific, Inc. website, http://investors.corescientific.com or by using the following link https://event.choruscall.com/mediaframe/webcast.html?webcastid=7cGzCf6F. Please allow 10 minutes prior to the call to download and install any necessary audio software. A replay of the audio webcast will be available for one year.
A supplementary investor presentation for the fiscal first quarter 2025 may be accessed at https://investors.corescientific.com/news-events/presentations.
AUDIO REPLAY
An audio replay of the event will be archived on the Investor Relations section of the Company's website at http://investors.corescientific.com and via telephone by dialing +1 (877) 660-6853 (U.S. toll free) or +1 (201) 612-7415 (U.S. local) and entering Access Code 13753188.
ABOUT CORE SCIENTIFIC
Core Scientific, Inc. (“Core Scientific” or the “Company”) is a leader in digital infrastructure for high-density colocation services and digital asset mining. We operate dedicated, purpose-built facilities for digital asset mining and are a premier provider of digital infrastructure, software solutions and services to our third-party customers. We employ our own large fleet of computers (“miners”) to earn digital assets for our own account and to provide hosting services for large digital asset mining customers and we are in the process of allocating and converting a significant portion of our ten facilities in Alabama (1), Georgia (2), Kentucky (1), North Carolina (1), North Dakota (1), Oklahoma (1) and Texas (3) to support artificial intelligence-related workloads under a series of contracts that entail the modification of certain of our data centers to deliver next generation colocation services. We derive the majority of our revenue from earning digital assets for our own account (“self-mining”). To learn more, visit www.corescientific.com.
SPECIAL NOTE REGARDING FORWARD-LOOKING STATEMENTS
This press release contains “forward-looking statements” within the meaning of the “safe harbor” provisions of the Private Securities Litigation Reform Act of 1995, including but not limited to, statements regarding projections, estimates and forecasts of revenue and other financial and performance metrics, projections of market opportunity and expectations, the Company’s ability to scale, grow its business and execute on its growth plans and hosting contracts, source energy at reasonable rates, the advantages, expected growth, and anticipated future revenue of the Company, and the Company’s ability to source and retain talent. You can identify forward-looking statements by the fact that they do not relate strictly to historical or current facts. These statements may include words such as “aim,” “estimate,” “plan,” “project,” “forecast,” “goal,” “intend,” “will,” “expect,” “anticipate,” “believe,” “seek,” “target” or other similar expressions that predict or indicate
-more-
Core Scientific, Inc. Fiscal First Quarter 2025 Earnings Release - 4 | ||||||||
future events or trends or that are not statements of historical matters. All forward-looking statements are subject to risks and uncertainties that may cause actual results to differ materially, including: our ability to earn digital assets profitably and to attract customers for our high density colocation capabilities; our ability to perform under our existing colocation agreements, our ability to maintain our competitive position in our existing operating segments, the impact of increases in total network hash rate; our ability to raise additional capital to continue our expansion efforts or other operations; our need for significant electric power and the limited availability of power resources; the potential failure in our critical systems, facilities or services we provide; the physical risks and regulatory changes relating to climate change; potential significant changes to the method of validating blockchain transactions; our vulnerability to physical security breaches, which could disrupt our operations; a potential slowdown in market and economic conditions, particularly those impacting high density computing, the blockchain industry and the blockchain hosting market; price volatility of digital assets and bitcoin in particular; potential changes in the interpretive positions of the SEC or its staff with respect to digital asset mining firms; the likelihood that U.S. federal and state legislatures and regulatory agencies will enact laws and regulations to regulate digital assets and digital asset intermediaries; changing expectations with respect to ESG policies; the effectiveness of our compliance and risk management methods; the adequacy of our sources of recovery if the digital assets held by us are lost, stolen or destroyed due to third-party digital asset services; Any such forward-looking statements represent management’s estimates and beliefs as of the date of this press release. While we may elect to update such forward-looking statements at some point in the future, we disclaim any obligation to do so, even if subsequent events cause our views to change.
Although the Company believes that in making such forward-looking statements its expectations are based upon reasonable assumptions, such statements may be influenced by factors that could cause actual outcomes and results to be materially different from those projected. The Company cannot assure you that the assumptions upon which these statements are based will prove to have been correct. Additional important factors that may affect the Company’s business, results of operations and financial position are described from time to time in the Company’s Annual Report on Form 10-K for the year ended December 31, 2024, Quarterly Reports on Form 10-Q and the Company’s other filings with the Securities and Exchange Commission. The Company does not undertake any obligation to update or revise any forward-looking statement, whether as a result of new information, future events or otherwise, except as may be required by applicable law.
-more-
Core Scientific, Inc. Fiscal First Quarter 2025 Earnings Release - 5 | ||||||||
Core Scientific, Inc.
Condensed Consolidated Balance Sheets
(in thousands, except par value)
(Unaudited)
| March 31, 2025 | December 31, 2024 | ||||||||||
| Assets | |||||||||||
| Current Assets: | |||||||||||
| Cash and cash equivalents | $ | 697,942 | $ | 836,197 | |||||||
| Restricted cash | 783 | 783 | |||||||||
| Accounts receivable | 1,018 | 1,025 | |||||||||
| Digital assets | 80,646 | 23,893 | |||||||||
| Prepaid expenses and other current assets | 52,789 | 42,064 | |||||||||
| Total Current Assets | 833,178 | 903,962 | |||||||||
| Property, plant and equipment, net | 650,291 | 556,342 | |||||||||
| Operating lease right-of-use assets | 111,203 | 114,472 | |||||||||
| Other noncurrent assets | 30,699 | 24,039 | |||||||||
| Total Assets | $ | 1,625,371 | $ | 1,598,815 | |||||||
| Liabilities and Stockholders’ Deficit | |||||||||||
| Current Liabilities: | |||||||||||
| Accounts payable | $ | 6,328 | $ | 19,265 | |||||||
Accrued expenses and other current liabilities | 95,492 | 69,230 | |||||||||
| Deferred revenue | 60,872 | 18,134 | |||||||||
| Operating lease liabilities, current portion | 9,982 | 9,974 | |||||||||
| Finance lease liabilities, current portion | 1,161 | 1,669 | |||||||||
| Notes payable, current portion | 16,214 | 16,290 | |||||||||
Contingent value rights, current portion | 5,461 | — | |||||||||
| Total Current Liabilities | 195,510 | 134,562 | |||||||||
| Operating lease liabilities, net of current portion | 94,953 | 97,843 | |||||||||
| Convertible and other notes payable, net of current portion | 1,071,843 | 1,073,990 | |||||||||
| Contingent value rights, net of current portion | 11,628 | 4,272 | |||||||||
Warrant liabilities | 421,902 | 1,097,285 | |||||||||
| Other noncurrent liabilities | 11,042 | 11,043 | |||||||||
| Total Liabilities | 1,806,878 | 2,418,995 | |||||||||
| Commitments and contingencies | |||||||||||
| Stockholders’ Deficit: | |||||||||||
| Preferred stock; $0.00001 par value; 2,000,000 shares authorized; none issued and outstanding at March 31, 2025 and December 31, 2024 | — | — | |||||||||
| Common stock; $0.00001 par value; 10,000,000 shares authorized at March 31, 2025 and December 31, 2024; 299,087 and 292,606 shares issued and outstanding at March 31, 2025 and December 31, 2024, respectively | 3 | 3 | |||||||||
| Additional paid-in capital | 2,973,015 | 2,915,035 | |||||||||
| Accumulated deficit | (3,154,525) | (3,735,218) | |||||||||
| Total Stockholders’ Deficit | (181,507) | (820,180) | |||||||||
| Total Liabilities and Stockholders’ Deficit | $ | 1,625,371 | $ | 1,598,815 | |||||||
-more-
Core Scientific, Inc. Fiscal First Quarter 2025 Earnings Release - 6 | ||||||||
Core Scientific, Inc.
Condensed Consolidated Statements of Operations
(in thousands, except per share amounts)
(Unaudited)
| Three Months Ended March 31, | |||||||||||
| 2025 | 2024 | ||||||||||
| Revenue: | |||||||||||
Digital asset self-mining revenue | $ | 67,179 | $ | 149,959 | |||||||
Digital asset hosted mining revenue from customers | 3,773 | 29,332 | |||||||||
Colocation revenue | 8,573 | — | |||||||||
Total revenue | 79,525 | 179,291 | |||||||||
| Cost of revenue: | |||||||||||
Cost of digital asset self-mining | 61,170 | 81,564 | |||||||||
Cost of digital asset hosted mining services | 2,036 | 20,081 | |||||||||
Cost of Colocation services | 8,106 | — | |||||||||
Total cost of revenue | 71,312 | 101,645 | |||||||||
Gross profit | 8,213 | 77,646 | |||||||||
Change in fair value of digital assets | 10,688 | — | |||||||||
Gain from sales of digital assets | — | (543) | |||||||||
Change in fair value of energy derivatives | — | 2,218 | |||||||||
| Losses on exchange or disposal of property, plant and equipment | 6 | 3,820 | |||||||||
Selling, general and administrative | 40,115 | 16,924 | |||||||||
Operating (loss) income | (42,596) | 55,227 | |||||||||
Non-operating expenses (income), net: | |||||||||||
Loss on debt extinguishment | — | 50 | |||||||||
Interest (income) expense, net | (2,187) | 14,087 | |||||||||
Change in fair value of warrants and contingent value rights | (621,464) | (60,114) | |||||||||
| Reorganization items, net | — | (111,439) | |||||||||
Other non-operating expense, net | 157 | 1,746 | |||||||||
Total non-operating income, net | (623,494) | (155,670) | |||||||||
Income before income taxes | 580,898 | 210,897 | |||||||||
| Income tax expense | 205 | 206 | |||||||||
Net income | $ | 580,693 | $ | 210,691 | |||||||
Net income per share | |||||||||||
Basic | $ | 1.44 | $ | 0.91 | |||||||
Diluted | $ | 1.25 | $ | 0.78 | |||||||
Weighted average shares outstanding | |||||||||||
Basic | 315,186 | 230,954 | |||||||||
Diluted | 363,314 | 282,531 | |||||||||
Certain prior year amounts have been reclassified for consistency with the current year presentation.
-more-
Core Scientific, Inc. Fiscal First Quarter 2025 Earnings Release - 7 | ||||||||
Core Scientific, Inc.
Condensed Consolidated Statements of Cash Flows
(in thousands)
Three Months Ended March 31, | |||||||||||
| 2025 | 2024 | ||||||||||
| Cash flows from Operating Activities: | |||||||||||
Net income | $ | 580,693 | $ | 210,691 | |||||||
Adjustments to reconcile net income to net cash (used in) provided by operating activities: | |||||||||||
| Depreciation and amortization | 19,731 | 28,996 | |||||||||
| Losses on exchange or disposal of property, plant and equipment | 6 | 3,820 | |||||||||
| Amortization of operating lease right-of-use assets | 2,676 | 770 | |||||||||
| Stock-based compensation | 16,185 | (1,060) | |||||||||
| Digital asset self-mining and shared hosting revenue | (67,441) | (149,959) | |||||||||
| Proceeds from sale of digital assets generated by self-mining and shared hosting revenues1 | — | 152,810 | |||||||||
| Change in fair value of digital assets | 10,688 | — | |||||||||
| Gain from sale of digital assets | — | (543) | |||||||||
| Change in fair value of energy derivatives | — | (797) | |||||||||
| Change in fair value of warrant liabilities | (634,280) | (18,390) | |||||||||
| Change in fair value of contingent value rights | 12,816 | (41,724) | |||||||||
Loss on debt extinguishment | — | 50 | |||||||||
| Amortization of debt discount | 1,732 | 660 | |||||||||
| Non-cash reorganization items | — | (143,791) | |||||||||
| Changes in operating assets and liabilities: | |||||||||||
| Accounts receivable, net | 6 | (106) | |||||||||
| Prepaid expenses and other current assets | (10,469) | (5,989) | |||||||||
| Accounts payable | (14,295) | (9,735) | |||||||||
| Accrued expenses and other | 2,712 | (10,351) | |||||||||
Deferred revenue from colocation services | 42,005 | — | |||||||||
| Deferred revenue from hosted mining services | 734 | (580) | |||||||||
| Other noncurrent assets and liabilities, net | (4,098) | 7,402 | |||||||||
Net cash (used in) provided by operating activities | (40,599) | 22,174 | |||||||||
| Cash flows from Investing Activities: | |||||||||||
| Purchases of property, plant and equipment | (88,422) | (31,894) | |||||||||
| Purchase of equity investments | (5,000) | — | |||||||||
| Investments in internally developed software | (36) | (76) | |||||||||
| Net cash used in investing activities | (93,458) | (31,970) | |||||||||
| Cash flows from Financing Activities: | |||||||||||
| Principal repayments of finance leases | (509) | (3,554) | |||||||||
| Principal payments on debt | (3,955) | (13,702) | |||||||||
| Proceeds from exercise of warrants | 266 | — | |||||||||
| Proceeds from issuance of new common stock | — | 55,000 | |||||||||
| Proceeds from draw from exit facility | — | 20,000 | |||||||||
| Restricted stock tax holding obligations | — | (3,390) | |||||||||
| Proceeds from exercise of stock options | — | 9 | |||||||||
Net cash (used in) provided by financing activities | (4,198) | 54,363 | |||||||||
Net (decrease) increase in cash, cash equivalents and restricted cash | (138,255) | 44,567 | |||||||||
| Cash, cash equivalents and restricted cash—beginning of period | 836,980 | 69,709 | |||||||||
Cash, cash equivalents and restricted cash—end of period | $ | 698,725 | $ | 114,276 | |||||||
Reconciliation of cash, cash equivalents, and restricted cash within the consolidated balance sheets to the amounts shown in the consolidated statements of cash flows above: | |||||||||||
| Cash and cash equivalents | $ | 697,942 | $ | 98,125 | |||||||
| Restricted cash | 783 | 16,151 | |||||||||
| Total cash, cash equivalents and restricted cash | $ | 698,725 | $ | 114,276 | |||||||
Certain prior year amounts have been reclassified for consistency with the current year presentation.
1 Proceeds from digital assets received as noncash revenue consideration liquidated nearly immediately after receipt as a routine operating activity.
-more-
Core Scientific, Inc. Fiscal First Quarter 2025 Earnings Release - 8 | ||||||||
Core Scientific, Inc.
Segment Results
(in thousands, except percentages)
(Unaudited)
| Three Months Ended March 31, | |||||||||||
| 2025 | 2024 | ||||||||||
| Digital Asset Self-Mining Segment | (in thousands, except percentages) | ||||||||||
Digital asset self-mining revenue | $ | 67,179 | $ | 149,959 | |||||||
| Cost of digital asset self-mining: | |||||||||||
| Power fees | 30,319 | 44,983 | |||||||||
| Depreciation expense | 19,259 | 27,478 | |||||||||
| Employee compensation | 7,335 | 4,680 | |||||||||
| Facility operations expense | 3,280 | 2,950 | |||||||||
| Other segment items | 977 | 1,473 | |||||||||
| Total cost of digital asset self-mining | 61,170 | 81,564 | |||||||||
| Digital Asset Self-Mining gross profit | $ | 6,009 | $ | 68,395 | |||||||
| Digital Asset Self-Mining gross margin | 9 | % | 46 | % | |||||||
| Digital Asset Hosted Mining Segment | |||||||||||
| Digital asset hosted mining revenue from customers | $ | 3,773 | $ | 29,332 | |||||||
| Cost of digital asset hosted mining services: | |||||||||||
| Power fees | 1,367 | 13,494 | |||||||||
| Depreciation expense | 145 | 1,270 | |||||||||
| Employee compensation | 332 | 1,404 | |||||||||
| Facility operations expense | 148 | 885 | |||||||||
| Other segment items | 44 | 3,028 | |||||||||
| Total cost of digital asset hosted mining services | 2,036 | 20,081 | |||||||||
| Digital Asset Hosted Mining gross profit | $ | 1,737 | $ | 9,251 | |||||||
| Digital Asset Hosted Mining gross margin | 46 | % | 32 | % | |||||||
| Colocation Segment | |||||||||||
| Colocation revenue: | |||||||||||
| License fees | $ | 5,995 | $ | — | |||||||
| Maintenance and other | (8) | — | |||||||||
Licensing revenue | 5,987 | — | |||||||||
| Power fees passed through to customer | 2,586 | — | |||||||||
| Total Colocation revenue | 8,573 | — | |||||||||
| Cost of Colocation services: | |||||||||||
| Depreciation expense | 67 | — | |||||||||
Employee compensation | 1,295 | — | |||||||||
| Facility operations expense | 3,852 | — | |||||||||
| Other segment items | 306 | — | |||||||||
| Cost of licensing revenue | 5,520 | — | |||||||||
Power fees passed through to customer | 2,586 | — | |||||||||
| Total cost of Colocation services | 8,106 | — | |||||||||
| Colocation gross profit | $ | 467 | $ | — | |||||||
| Colocation licensing gross margin | 8 | % | — | % | |||||||
| HPC Hosting gross margin | 5 | % | — | % | |||||||
| Consolidated | |||||||||||
| Consolidated total revenue | $ | 79,525 | $ | 179,291 | |||||||
| Consolidated cost of revenue | $ | 71,312 | — | $ | 101,645 | ||||||
| Consolidated gross profit | $ | 8,213 | $ | 77,646 | |||||||
| Consolidated gross margin | 10 | % | 43 | % | |||||||
-more-
Core Scientific, Inc. Fiscal First Quarter 2025 Earnings Release - 9 | ||||||||
Core Scientific, Inc.
Non-GAAP Financial Measures
(Unaudited)
Adjusted EBITDA is a non-GAAP financial measure defined as our net income, adjusted to eliminate the effect of (i) interest income, interest expense, and other income (expense), net; (ii) provision for income taxes; (iii) depreciation and amortization; (iv) stock-based compensation expense; (v) Reorganization items, net; (vi) unrealized fair value adjustment on energy derivatives; (vii) change in the fair value of warrant and contingent value rights, (viii) Colocation organizational startup costs which are not reflective of the ongoing costs incurred after startup, (ix) post-emergence bankruptcy advisory costs incurred related to reorganization which are not reflective of the ongoing costs incurred in post-emergence operations, and (x) certain additional non-cash items that do not reflect the performance of our ongoing business operations. For additional information, including the reconciliation of net income to Adjusted EBITDA, please refer to the table below. We believe Adjusted EBITDA is an important measure because it allows management, investors, and our Board of Directors to evaluate and compare our operating results, including our return on capital and operating efficiencies, from period-to-period by making the adjustments described above. In addition, it provides useful information to investors and others in understanding and evaluating our results of operations, as well as provides a useful measure for period-to-period comparisons of our business, as it removes the effect of net interest expense, taxes, certain non-cash items, variable charges and timing differences. Moreover, we have included Adjusted EBITDA in this earnings release because it is a key measurement used by our management internally to make operating decisions, including those related to operating expenses, evaluate performance, and perform strategic and financial planning.
The above items are excluded from our Adjusted EBITDA measure because these items are non-cash in nature or because the amount and timing of these items are not related to the current results of our core business operations which renders evaluation of our current performance, comparisons of performance between periods and comparisons of our current performance with our competitors less meaningful. However, you should be aware that when evaluating Adjusted EBITDA, we may incur future expenses similar to those excluded when calculating this measure. Our presentation of this measure should not be construed as an inference that its future results will be unaffected by unusual items. Further, this non-GAAP financial measure should not be considered in isolation from, or as a substitute for, financial information prepared in accordance with accounting principles generally accepted in the United States (“GAAP”). We compensate for these limitations by relying primarily on GAAP results and using Adjusted EBITDA on a supplemental basis. Our computation of Adjusted EBITDA may not be comparable to other similarly titled measures computed by other companies because not all companies calculate this measure in the same fashion. You should review the reconciliation of net income to Adjusted EBITDA below and not rely on any single financial measure to evaluate our business.
-more-
Core Scientific, Inc. Fiscal First Quarter 2025 Earnings Release - 10 | ||||||||
The following table reconciles the non-GAAP financial measure to the most directly comparable U.S. GAAP financial performance measure, which is net income, for the periods presented (in thousands):
| Three Months Ended March 31, | |||||||||||
| 2025 | 2024 | ||||||||||
| Adjusted EBITDA | |||||||||||
| Net income | $ | 580,693 | $ | 210,691 | |||||||
| Adjustments: | |||||||||||
| Interest (income) expense, net | (2,187) | 14,087 | |||||||||
| Income tax expense | 205 | 206 | |||||||||
| Depreciation and amortization | 19,731 | 28,996 | |||||||||
| Stock-based compensation expense | 16,185 | (1,060) | |||||||||
| Unrealized fair value adjustment on energy derivatives | — | (797) | |||||||||
| Losses on exchange or disposal of property, plant and equipment | 6 | 3,820 | |||||||||
| Loss on debt extinguishment | — | 50 | |||||||||
| Post-emergence bankruptcy advisory costs | 603 | 1,687 | |||||||||
| Reorganization items, net | — | (111,439) | |||||||||
Change in fair value of warrants and contingent value rights | (621,464) | (60,114) | |||||||||
| Other non-operating expense, net | 157 | 1,746 | |||||||||
| Other | — | 123 | |||||||||
| Adjusted EBITDA | $ | (6,071) | $ | 87,996 | |||||||
-more-
Core Scientific, Inc. Fiscal First Quarter 2025 Earnings Release - 11 | ||||||||
/////////////////////////////////////////////////////////////////////////////////////////////////////////////////////////////////////
Please follow us on:
 |  |  | ||||||||||||
https://www.linkedin.com/company/corescientific/
https://twitter.com/core_scientific
https://www.youtube.com/@Core_Scientific
CONTACTS
Investors:
Media:
-end-
First Quarter 2025 Earnings Presentation Adam Sullivan, CEO Jim Nygaard, CFO Matt Brown, COO May 7, 2025
2 FORWARD-LOOKING STATEMENTS This presentation contains “forward-looking statements” within the meaning of the “safe harbor” provisions of the Private Securities Litigation Reform Act of 1995, including but not limited to, statements regarding projections, estimates and forecasts of revenue and other financial and performance metrics, projections of market opportunity and expectations, the Company’s ability to scale, grow its business and execute on its growth plans and hosting contracts, source energy at reasonable rates, the advantages, expected growth, and anticipated future revenue of the Company, and the Company’s ability to source and retain talent. You can identify forward-looking statements by the fact that they do not relate strictly to historical or current facts. These statements may include words such as “aim,” “estimate,” “plan,” “project,” “forecast,” “goal,” “intend,” “will,” “expect,” “anticipate,” “believe,” “seek,” “target” or other similar expressions that predict or indicate future events or trends or that are not statements of historical matters. All forward-looking statements are subject to risks and uncertainties that may cause actual results to differ materially, including: our ability to earn digital assets profitably and to attract customers for our high density colocation capabilities; our ability to perform under our existing colocation agreements, our ability to maintain our competitive position in our existing operating segments, the impact of increases in total network hash rate; our ability to raise additional capital to continue our expansion efforts or other operations; our need for significant electric power and the limited availability of power resources; the potential failure in our critical systems, facilities or services we provide; the physical risks and regulatory changes relating to climate change; potential significant changes to the method of validating blockchain transactions; our vulnerability to physical security breaches, which could disrupt our operations; a potential slowdown in market and economic conditions, particularly those impacting high density computing, the blockchain industry and the blockchain hosting market; price volatility of digital assets and bitcoin in particular; potential changes in the interpretive positions of the SEC or its staff with respect to digital asset mining firms; the likelihood that U.S. federal and state legislatures and regulatory agencies will enact laws and regulations to regulate digital assets and digital asset intermediaries; changing expectations with respect to ESG policies; the effectiveness of our compliance and risk management methods; the adequacy of our sources of recovery if the digital assets held by us are lost, stolen or destroyed due to third-party digital asset services; Any such forward-looking statements represent management’s estimates and beliefs as of the date of this press release. While we may elect to update such forward-looking statements at some point in the future, we disclaim any obligation to do so, even if subsequent events cause our views to change. Although the Company believes that in making such forward-looking statements its expectations are based upon reasonable assumptions, such statements may be influenced by factors that could cause actual outcomes and results to be materially different from those projected. The Company cannot assure you that the assumptions upon which these statements are based will prove to have been correct. Additional important factors that may affect the Company’s business, results of operations and financial position are described from time to time in the Company’s Annual Report on Form 10-K for the year ended December 31, 2024, Quarterly Reports on Form 10-Q and the Company’s other filings with the Securities and Exchange Commission. The Company does not undertake any obligation to update or revise any forward-looking statement, whether as a result of new information, future events or otherwise, except as may be required by applicable law. NON-GAAP FINANCIAL MEASURES This presentation also contains non-GAAP financial measures as defined by the SEC rules, including Adjusted EBITDA and adjusted earnings (loss) per diluted share. The Company believes that these non-GAAP measures of financial results provide useful information to management and investors regarding certain financial and business trends relating to the Company's financial condition and results of operations. The Company's management uses certain of these non-GAAP measures to compare the Company's performance to that of prior periods for trend analyses and for budgeting and planning purposes. The Company urges investors not to rely on any single financial measure to evaluate its business.
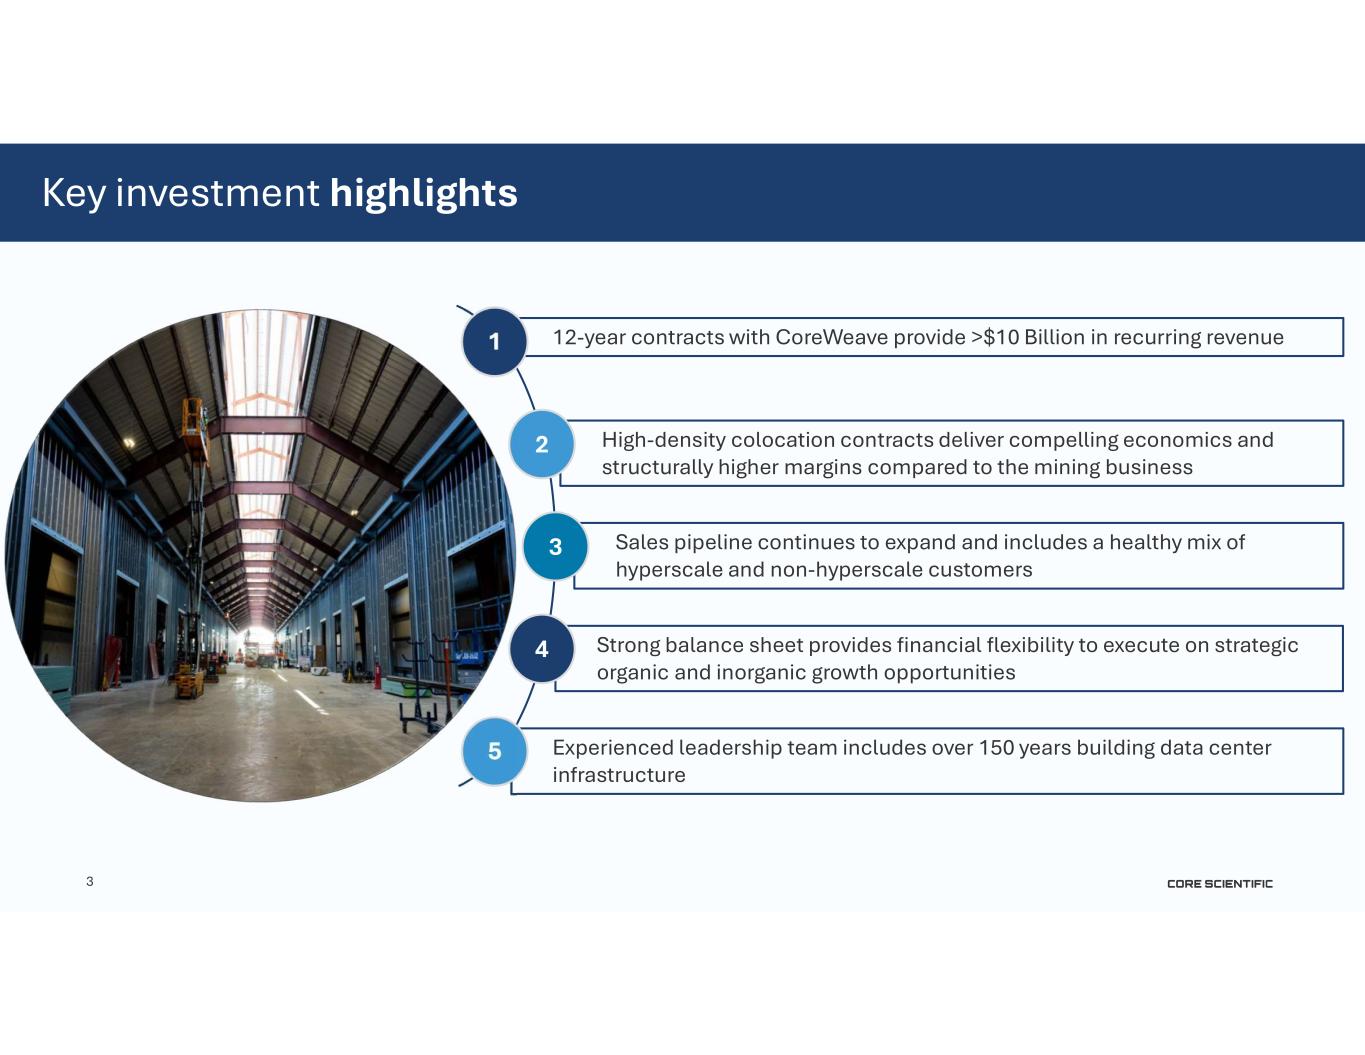
3 High-density colocation contracts deliver compelling economics and structurally higher margins compared to the mining business Sales pipeline continues to expand and includes a healthy mix of hyperscale and non-hyperscale customers Strong balance sheet provides financial flexibility to execute on strategic organic and inorganic growth opportunities Experienced leadership team includes over 150 years building data center infrastructure 12-year contracts with CoreWeave provide >$10 Billion in recurring revenue1 2 3 4 5 Key investment highlights
4 Our mission is to power the future of the accelerated compute era
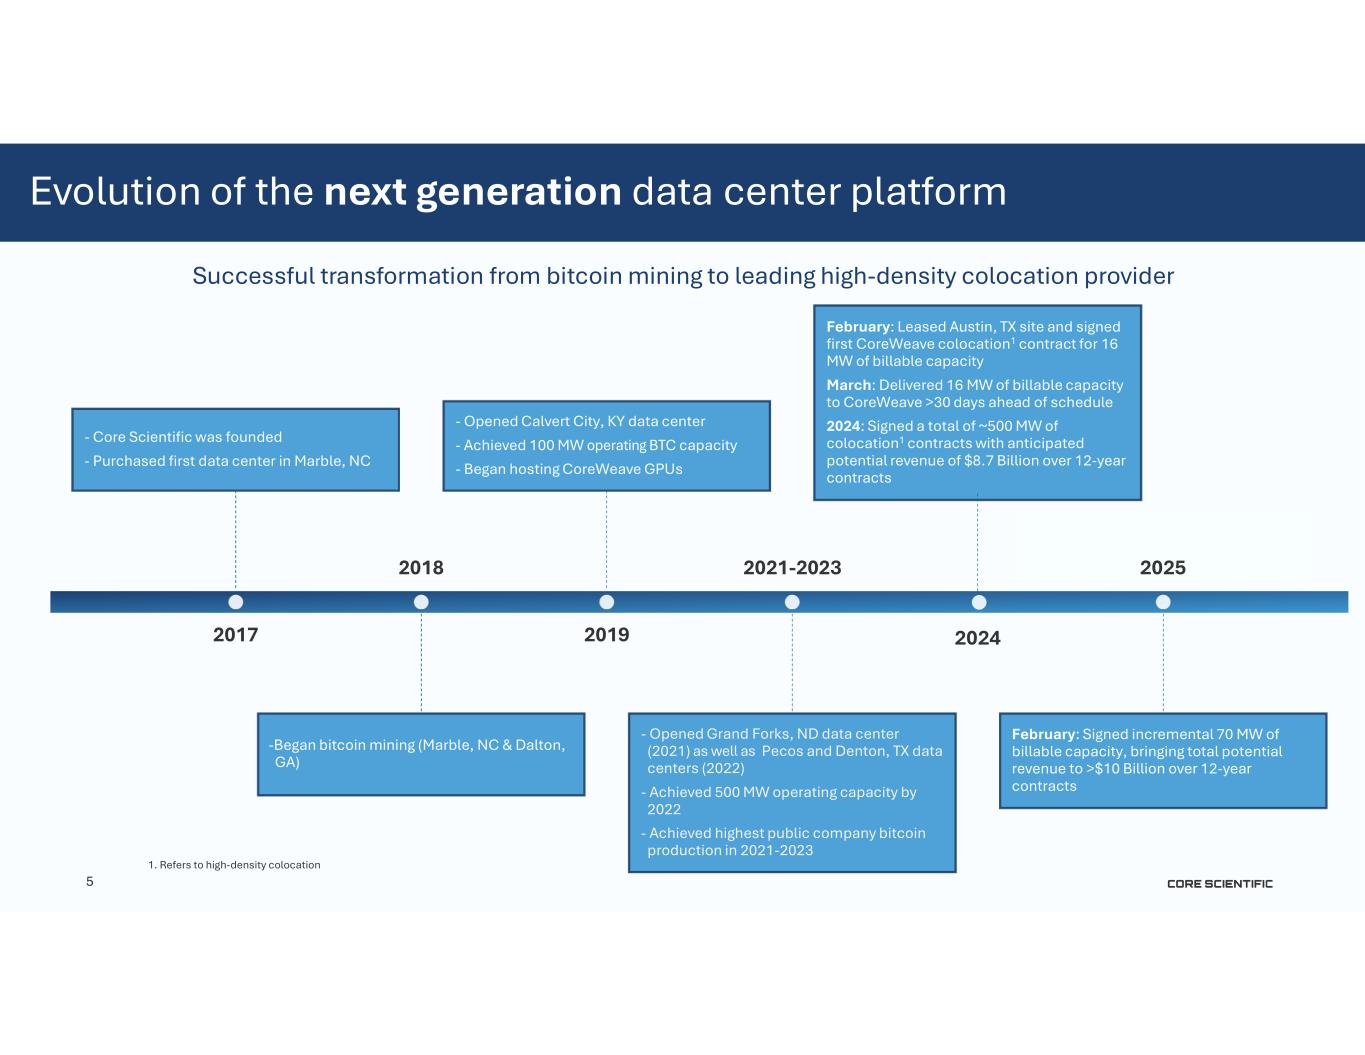
5 2017 - Core Scientific was founded - Purchased first data center in Marble, NC 2018 -Began bitcoin mining (Marble, NC & Dalton, GA) 2019 - Opened Calvert City, KY data center - Achieved 100 MW operating BTC capacity - Began hosting CoreWeave GPUs 2021-2023 - Opened Grand Forks, ND data center (2021) as well as Pecos and Denton, TX data centers (2022) - Achieved 500 MW operating capacity by 2022 - Achieved highest public company bitcoin production in 2021-2023 2024 February: Leased Austin, TX site and signed first CoreWeave colocation1 contract for 16 MW of billable capacity March: Delivered 16 MW of billable capacity to CoreWeave >30 days ahead of schedule 2024: Signed a total of ~500 MW of colocation1 contracts with anticipated potential revenue of $8.7 Billion over 12-year contracts 2025 February: Signed incremental 70 MW of billable capacity, bringing total potential revenue to >$10 Billion over 12-year contracts Evolution of the next generation data center platform Successful transformation from bitcoin mining to leading high-density colocation provider 1. Refers to high-density colocation
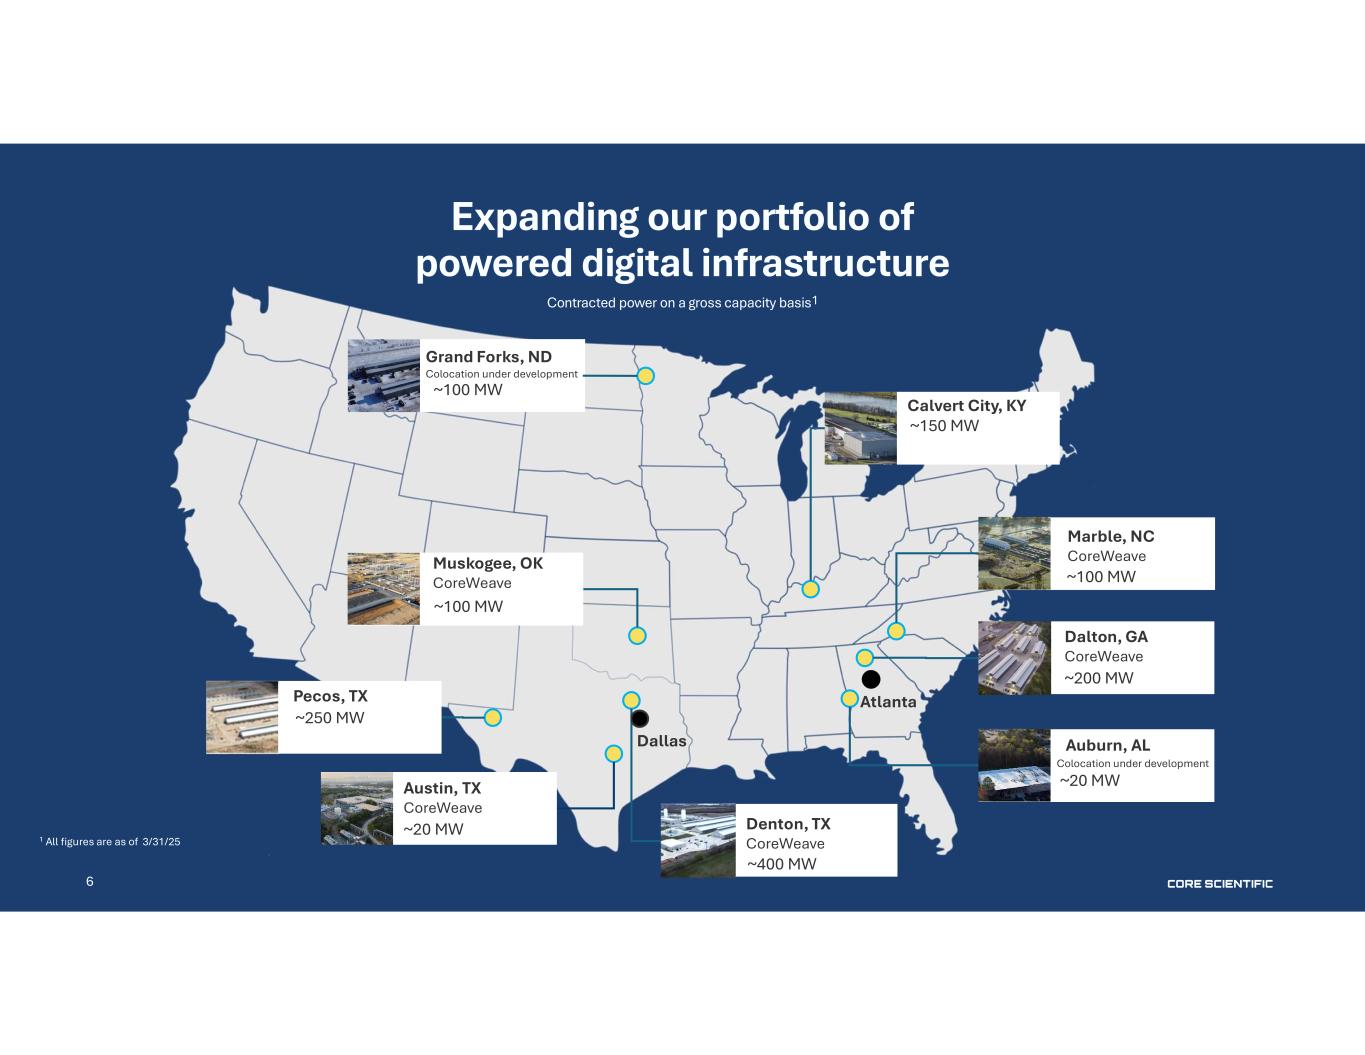
Expanding our portfolio of powered digital infrastructure Contracted power on a gross capacity basis1 Grand Forks, ND Colocation under development ~100 MW Muskogee, OK CoreWeave ~100 MW Pecos, TX ~250 MW Austin, TX CoreWeave ~20 MW Denton, TX CoreWeave ~400 MW Marble, NC CoreWeave ~100 MW Dalton, GA CoreWeave ~200 MW Auburn, AL Colocation under development ~20 MW 1 All figures are as of 3/31/25 Calvert City, KY ~150 MW Atlanta Dallas 6
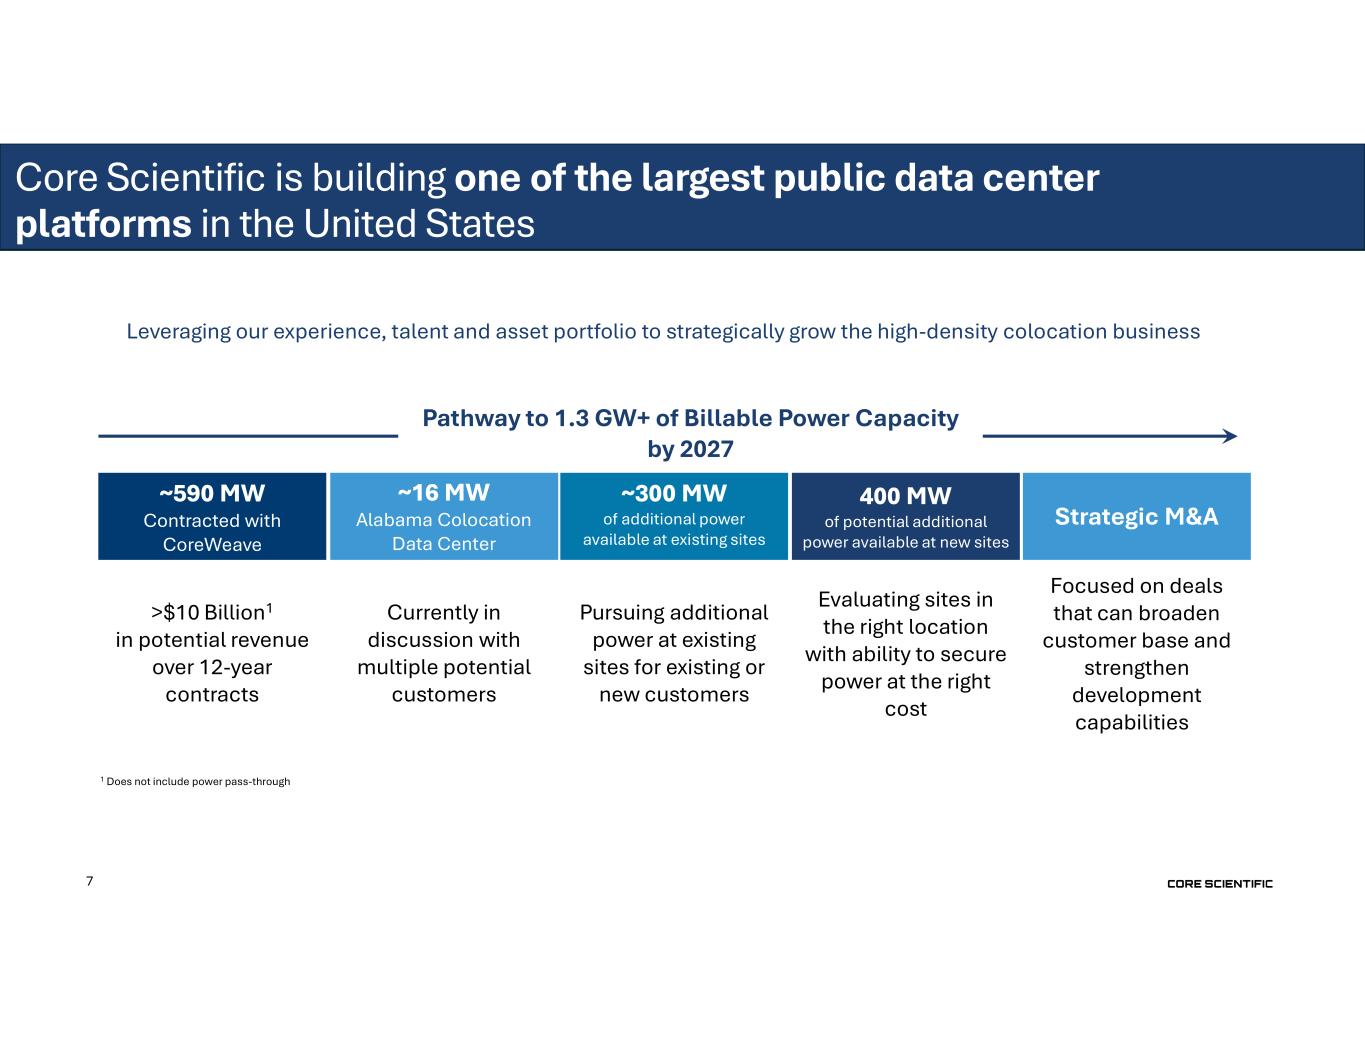
7 Leveraging our experience, talent and asset portfolio to strategically grow the high-density colocation business Focused on deals that can broaden customer base and strengthen development capabilities Evaluating sites in the right location with ability to secure power at the right cost Currently in discussion with multiple potential customers ~16 MW Alabama Colocation Data Center 400 MW of potential additional power available at new sites Strategic M&A >$10 Billion1 in potential revenue over 12-year contracts ~590 MW Contracted with CoreWeave Pursuing additional power at existing sites for existing or new customers ~300 MW of additional power available at existing sites 1 Does not include power pass-through Pathway to 1.3 GW+ of Billable Power Capacity by 2027 Core Scientific is building one of the largest public data center platforms in the United States
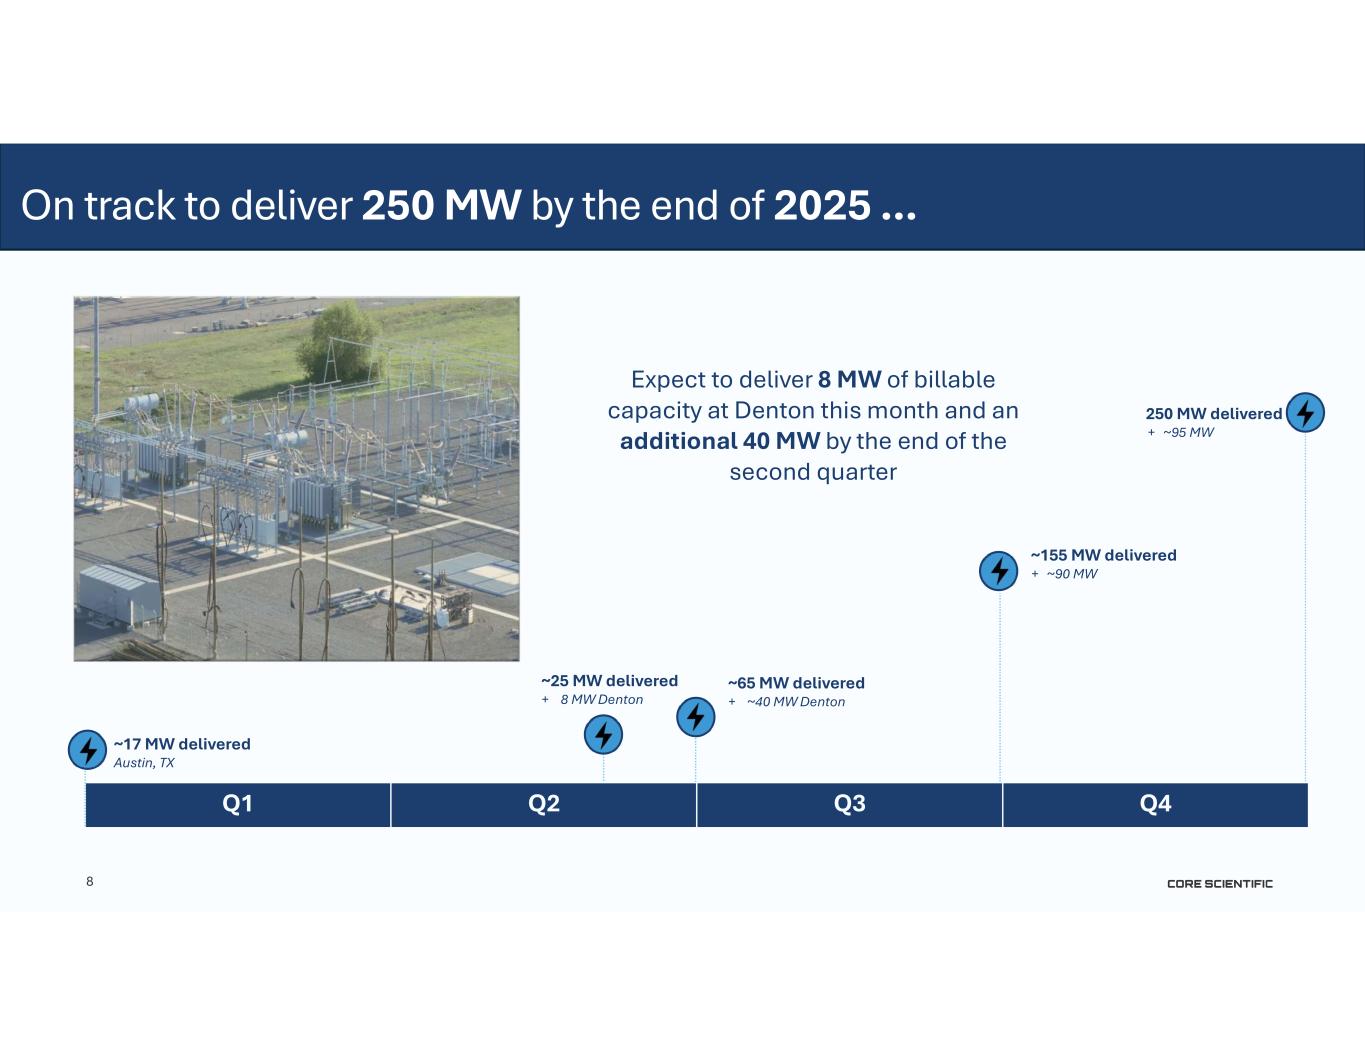
8 250 MW delivered + ~95 MW ~155 MW delivered + ~90 MW Q4Q3Q2Q1 ~17 MW delivered Austin, TX ~65 MW delivered + ~40 MW Denton ~25 MW delivered + 8 MW Denton On track to deliver 250 MW by the end of 2025 … Expect to deliver 8 MW of billable capacity at Denton this month and an additional 40 MW by the end of the second quarter
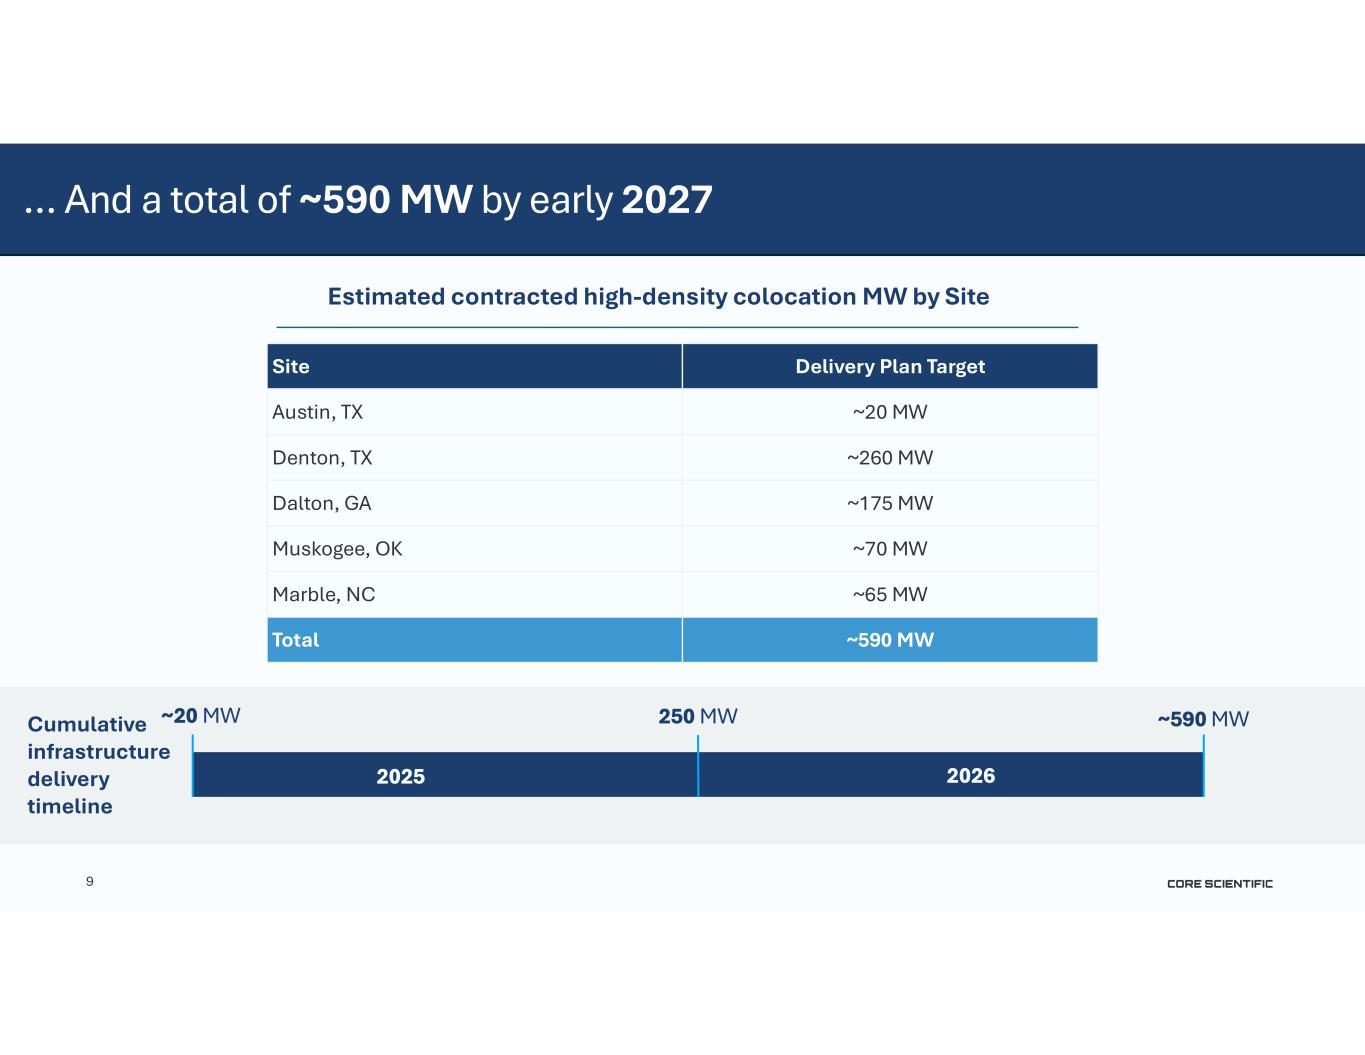
9 Estimated contracted high-density colocation MW by Site Delivery Plan TargetSite ~20 MWAustin, TX ~260 MWDenton, TX ~175 MWDalton, GA ~70 MWMuskogee, OK ~65 MWMarble, NC ~590 MWTotal Cumulative infrastructure delivery timeline … And a total of ~590 MW by early 2027 2026 250 MW ~590 MW~20 MW 2025
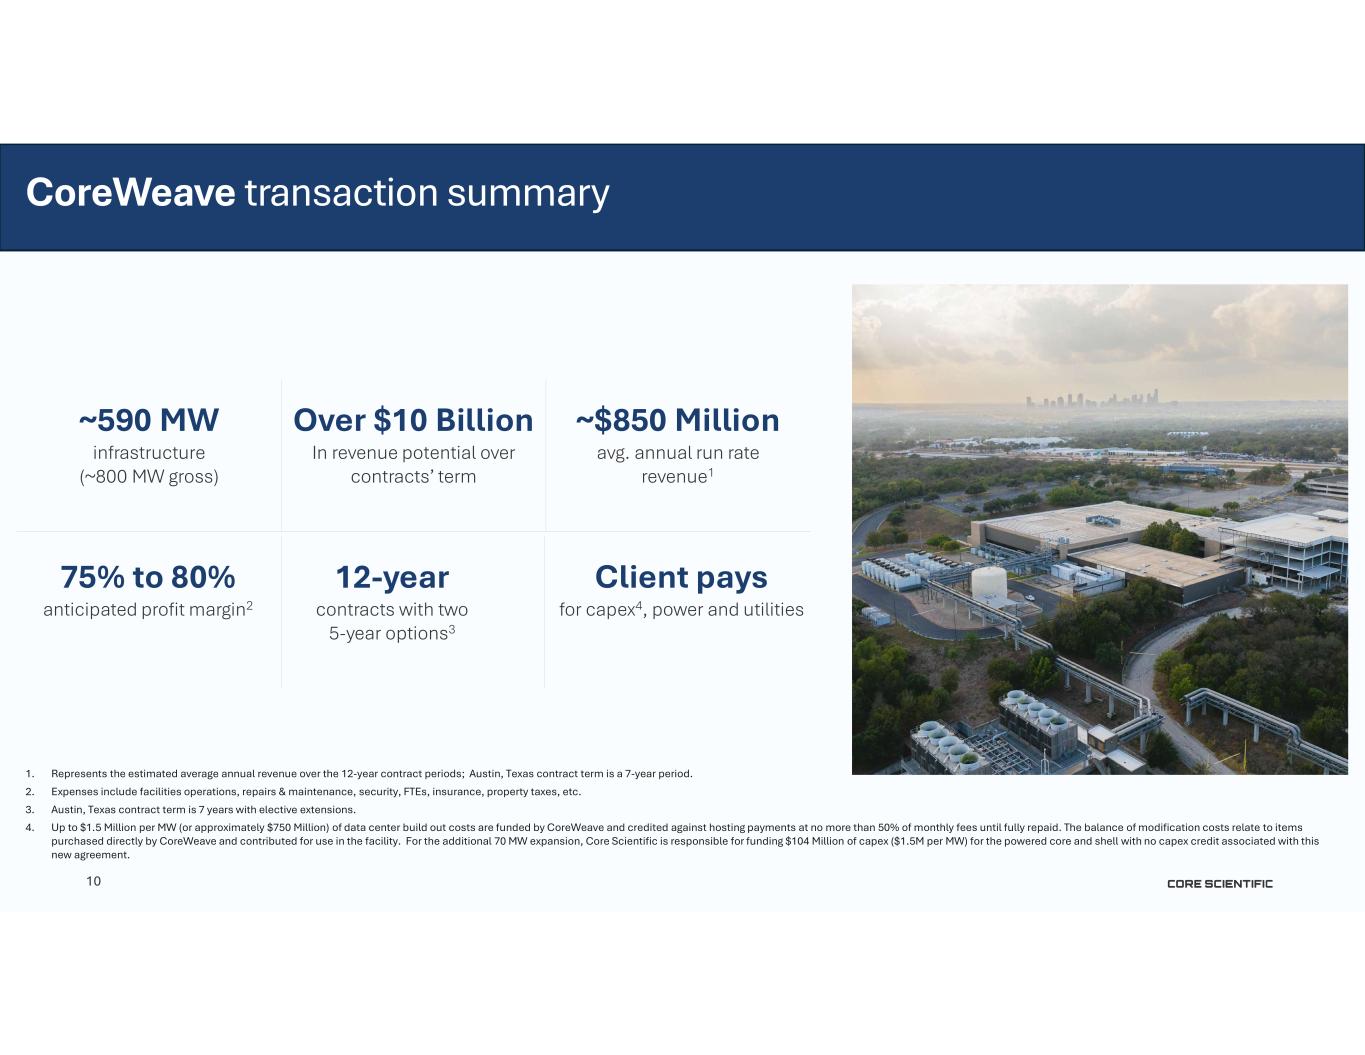
1. Represents the estimated average annual revenue over the 12-year contract periods; Austin, Texas contract term is a 7-year period. 2. Expenses include facilities operations, repairs & maintenance, security, FTEs, insurance, property taxes, etc. 3. Austin, Texas contract term is 7 years with elective extensions. 4. Up to $1.5 Million per MW (or approximately $750 Million) of data center build out costs are funded by CoreWeave and credited against hosting payments at no more than 50% of monthly fees until fully repaid. The balance of modification costs relate to items purchased directly by CoreWeave and contributed for use in the facility. For the additional 70 MW expansion, Core Scientific is responsible for funding $104 Million of capex ($1.5M per MW) for the powered core and shell with no capex credit associated with this new agreement. ~$850 Million avg. annual run rate revenue1 Over $10 Billion In revenue potential over contracts’ term ~590 MW infrastructure (~800 MW gross) Client pays for capex4, power and utilities 12-year contracts with two 5-year options3 75% to 80% anticipated profit margin2 2025 CoreWeave transaction summary 10
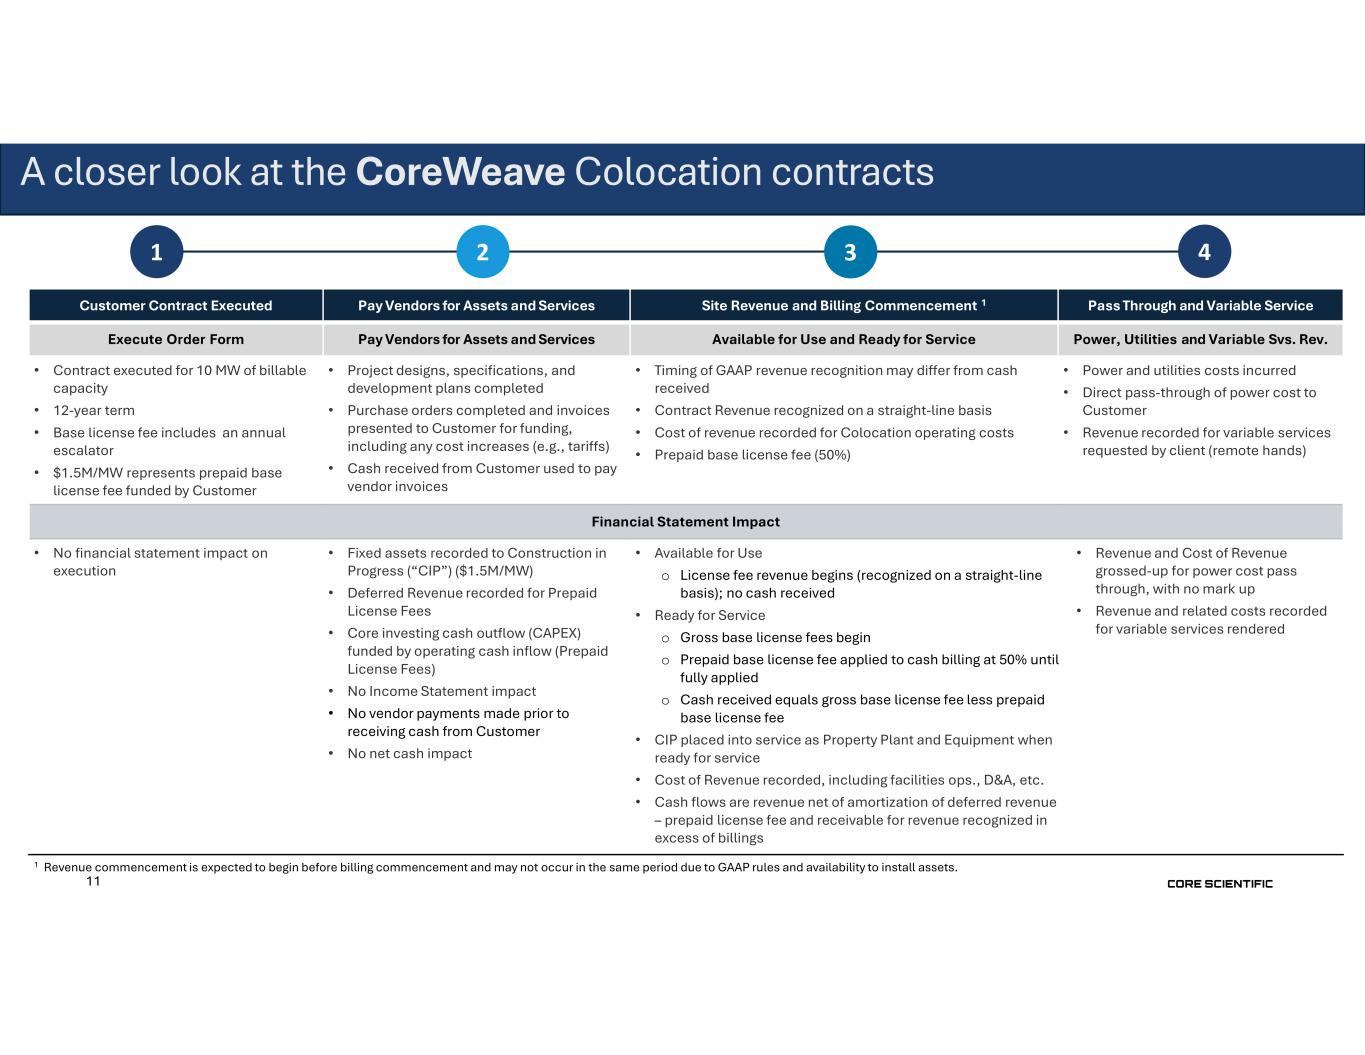
11 Pass Through and Variable ServiceSite Revenue and Billing Commencement 1Pay Vendors for Assets and ServicesCustomer Contract Executed Power, Utilities and Variable Svs. Rev.Available for Use and Ready for ServicePay Vendors for Assets and ServicesExecute Order Form • Power and utilities costs incurred • Direct pass-through of power cost to Customer • Revenue recorded for variable services requested by client (remote hands) • Timing of GAAP revenue recognition may differ from cash received • Contract Revenue recognized on a straight-line basis • Cost of revenue recorded for Colocation operating costs • Prepaid base license fee (50%) • Project designs, specifications, and development plans completed • Purchase orders completed and invoices presented to Customer for funding, including any cost increases (e.g., tariffs) • Cash received from Customer used to pay vendor invoices • Contract executed for 10 MW of billable capacity • 12-year term • Base license fee includes an annual escalator • $1.5M/MW represents prepaid base license fee funded by Customer Financial Statement Impact • Revenue and Cost of Revenue grossed-up for power cost pass through, with no mark up • Revenue and related costs recorded for variable services rendered • Available for Use o License fee revenue begins (recognized on a straight-line basis); no cash received • Ready for Service o Gross base license fees begin o Prepaid base license fee applied to cash billing at 50% until fully applied o Cash received equals gross base license fee less prepaid base license fee • CIP placed into service as Property Plant and Equipment when ready for service • Cost of Revenue recorded, including facilities ops., D&A, etc. • Cash flows are revenue net of amortization of deferred revenue – prepaid license fee and receivable for revenue recognized in excess of billings • Fixed assets recorded to Construction in Progress (“CIP”) ($1.5M/MW) • Deferred Revenue recorded for Prepaid License Fees • Core investing cash outflow (CAPEX) funded by operating cash inflow (Prepaid License Fees) • No Income Statement impact • No vendor payments made prior to receiving cash from Customer • No net cash impact • No financial statement impact on execution 1 Revenue commencement is expected to begin before billing commencement and may not occur in the same period due to GAAP rules and availability to install assets. 1 2 3 4 A closer look at the CoreWeave Colocation contracts
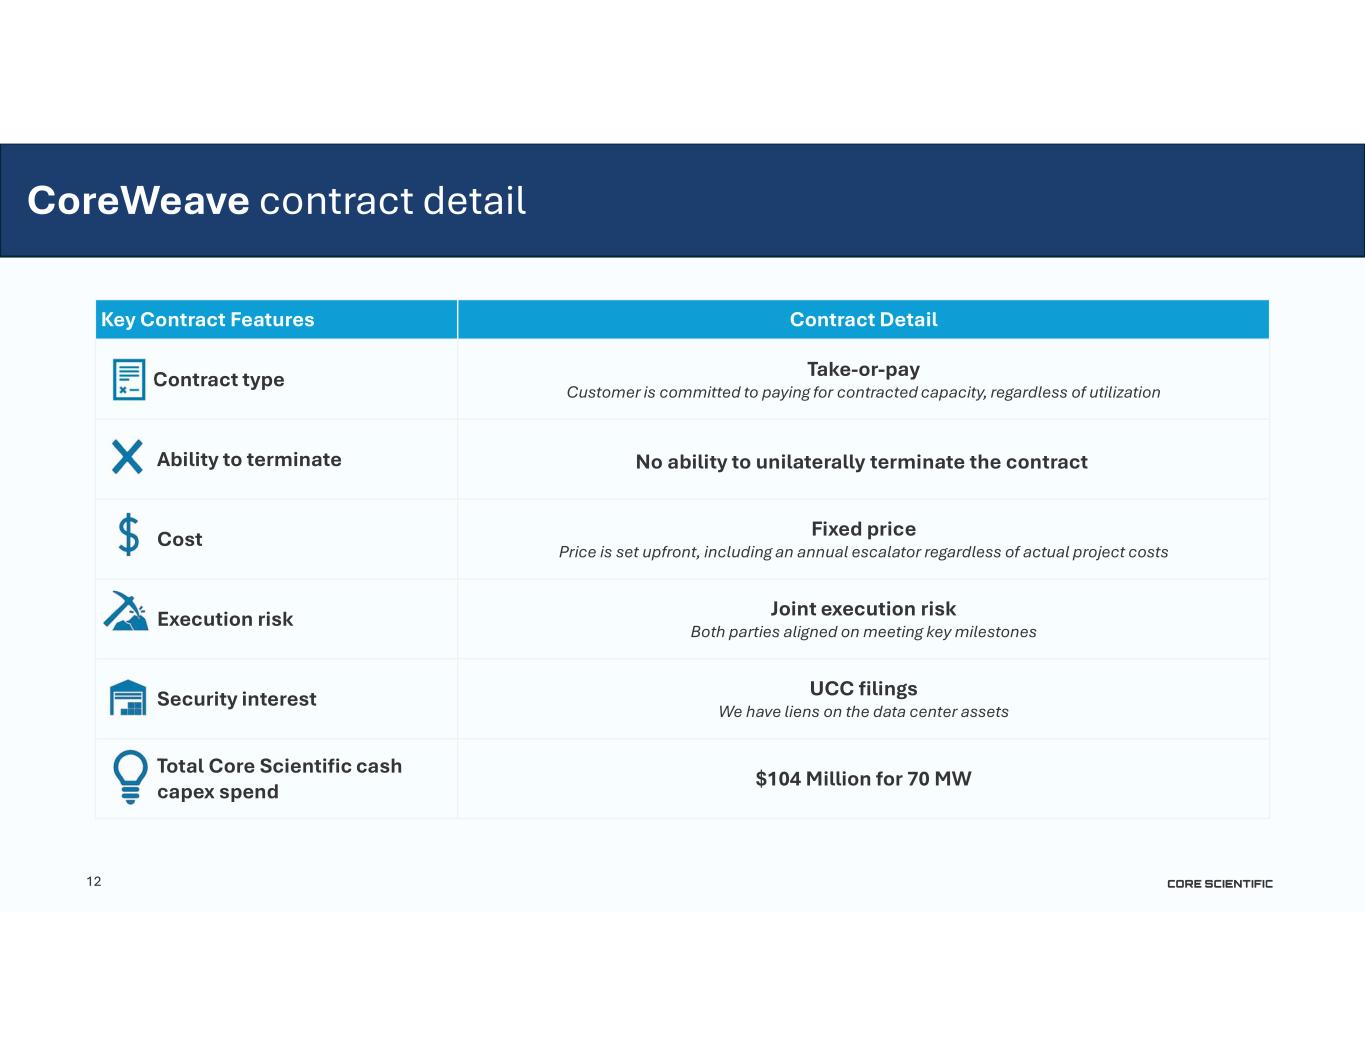
12 Contract Detail Key Contract Features Take-or-pay Customer is committed to paying for contracted capacity, regardless of utilization Contract type No ability to unilaterally terminate the contractAbility to terminate Fixed price Price is set upfront, including an annual escalator regardless of actual project costs Cost Joint execution risk Both parties aligned on meeting key milestones Execution risk UCC filings We have liens on the data center assets Security interest $104 Million for 70 MW Total Core Scientific cash capex spend CoreWeave contract detail
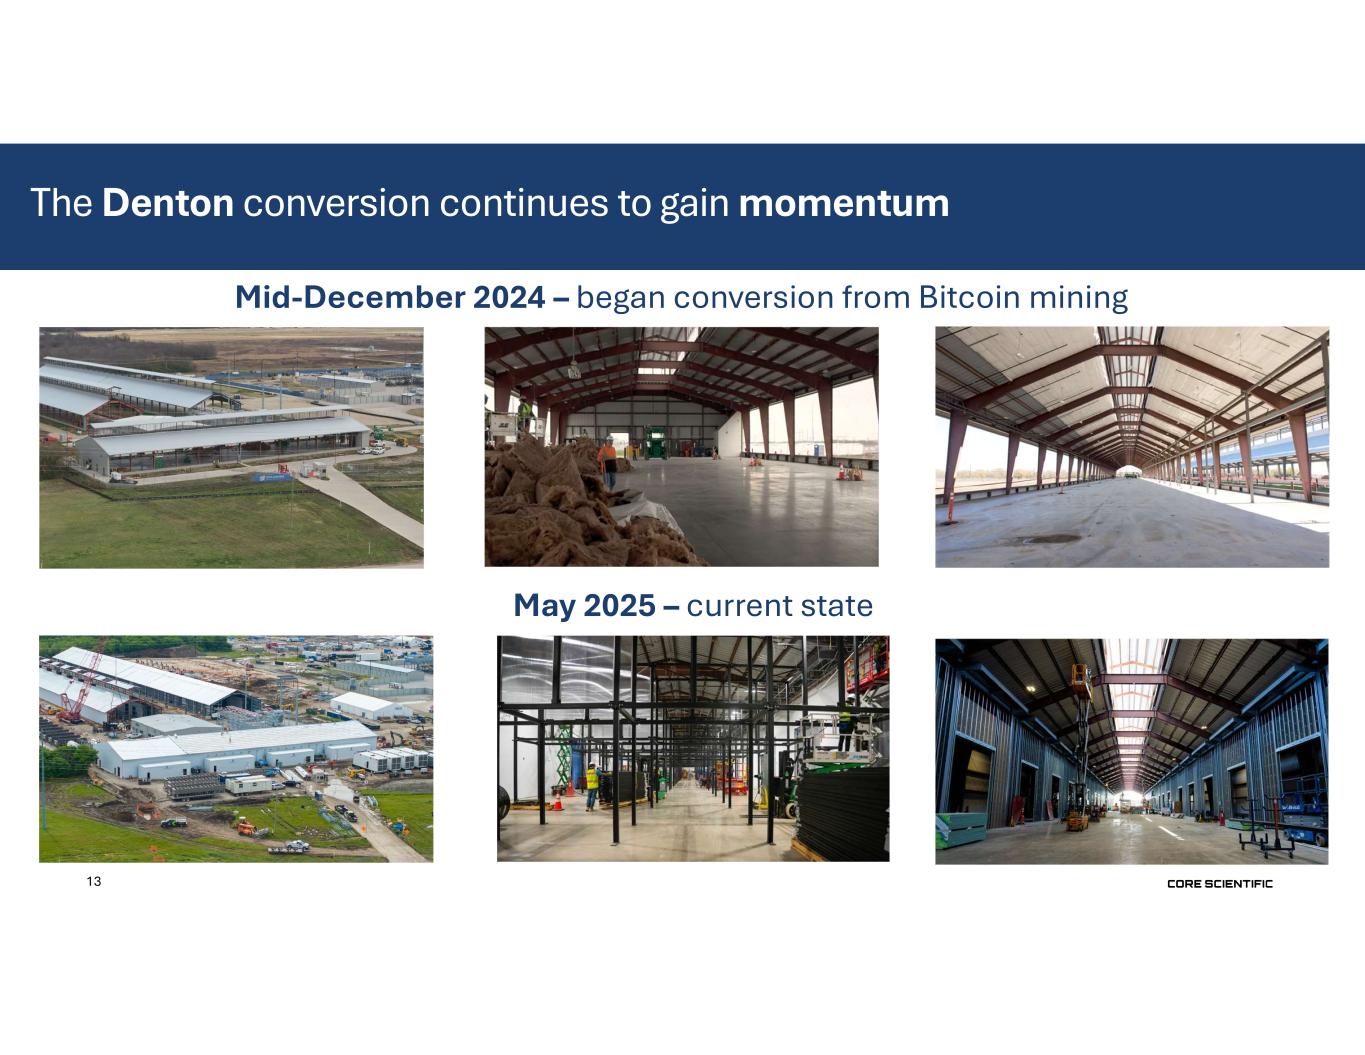
13 • Denton • Construction Progress Mid-December 2024 – began conversion from Bitcoin mining May 2025 – current state The Denton conversion continues to gain momentum
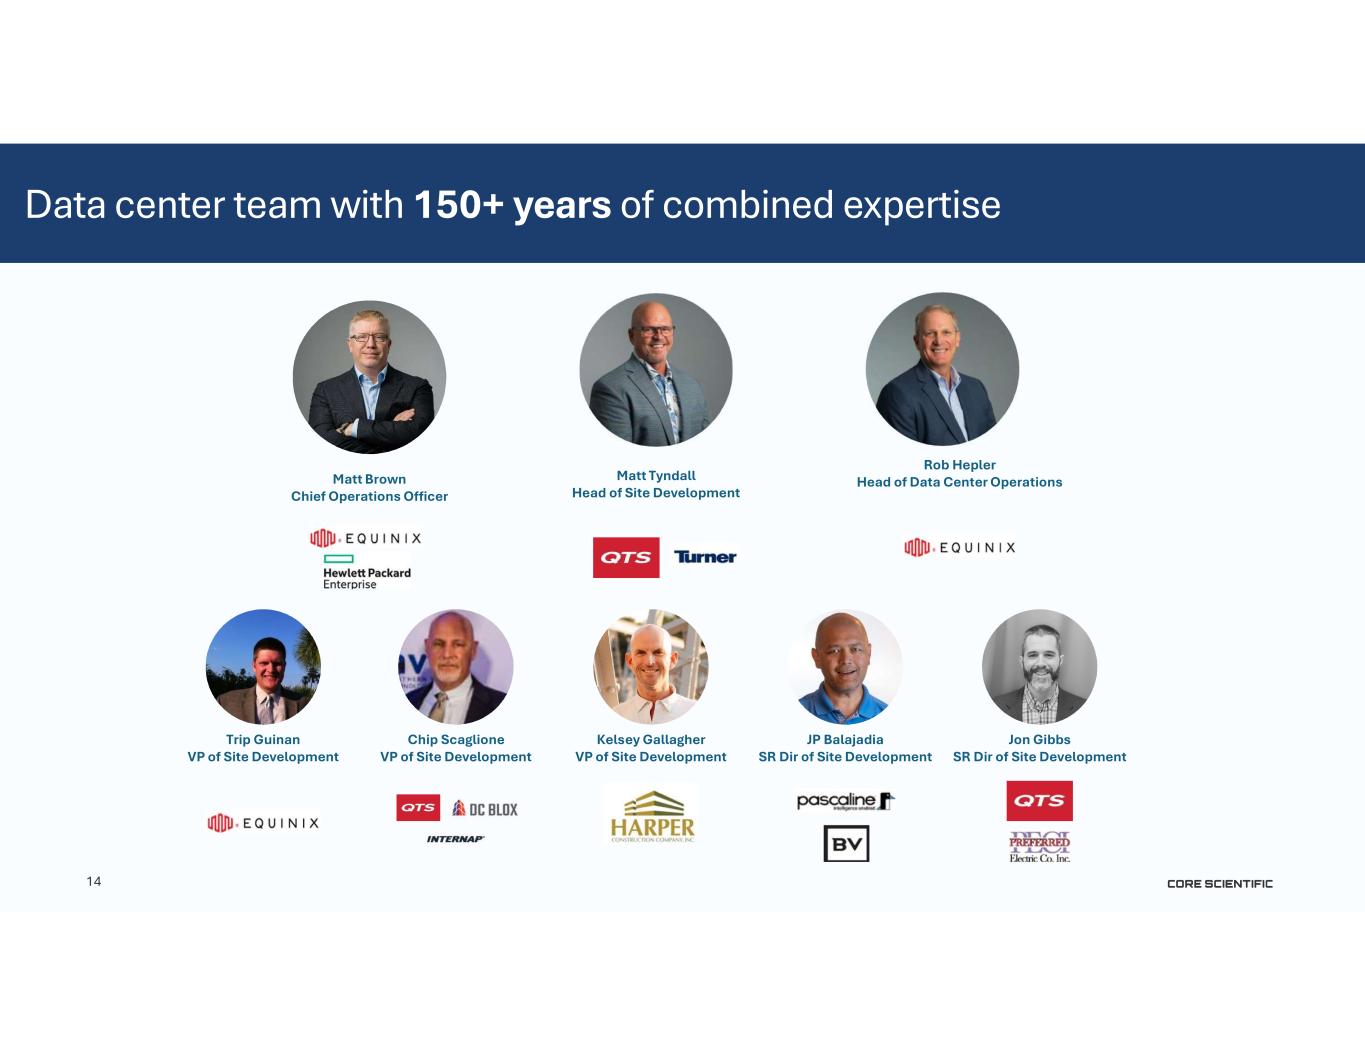
14 Matt Brown Chief Operations Officer Rob Hepler Head of Data Center OperationsMatt Tyndall Head of Site Development Trip Guinan VP of Site Development Chip Scaglione VP of Site Development Kelsey Gallagher VP of Site Development JP Balajadia SR Dir of Site Development Jon Gibbs SR Dir of Site Development Data center team with 150+ years of combined expertise
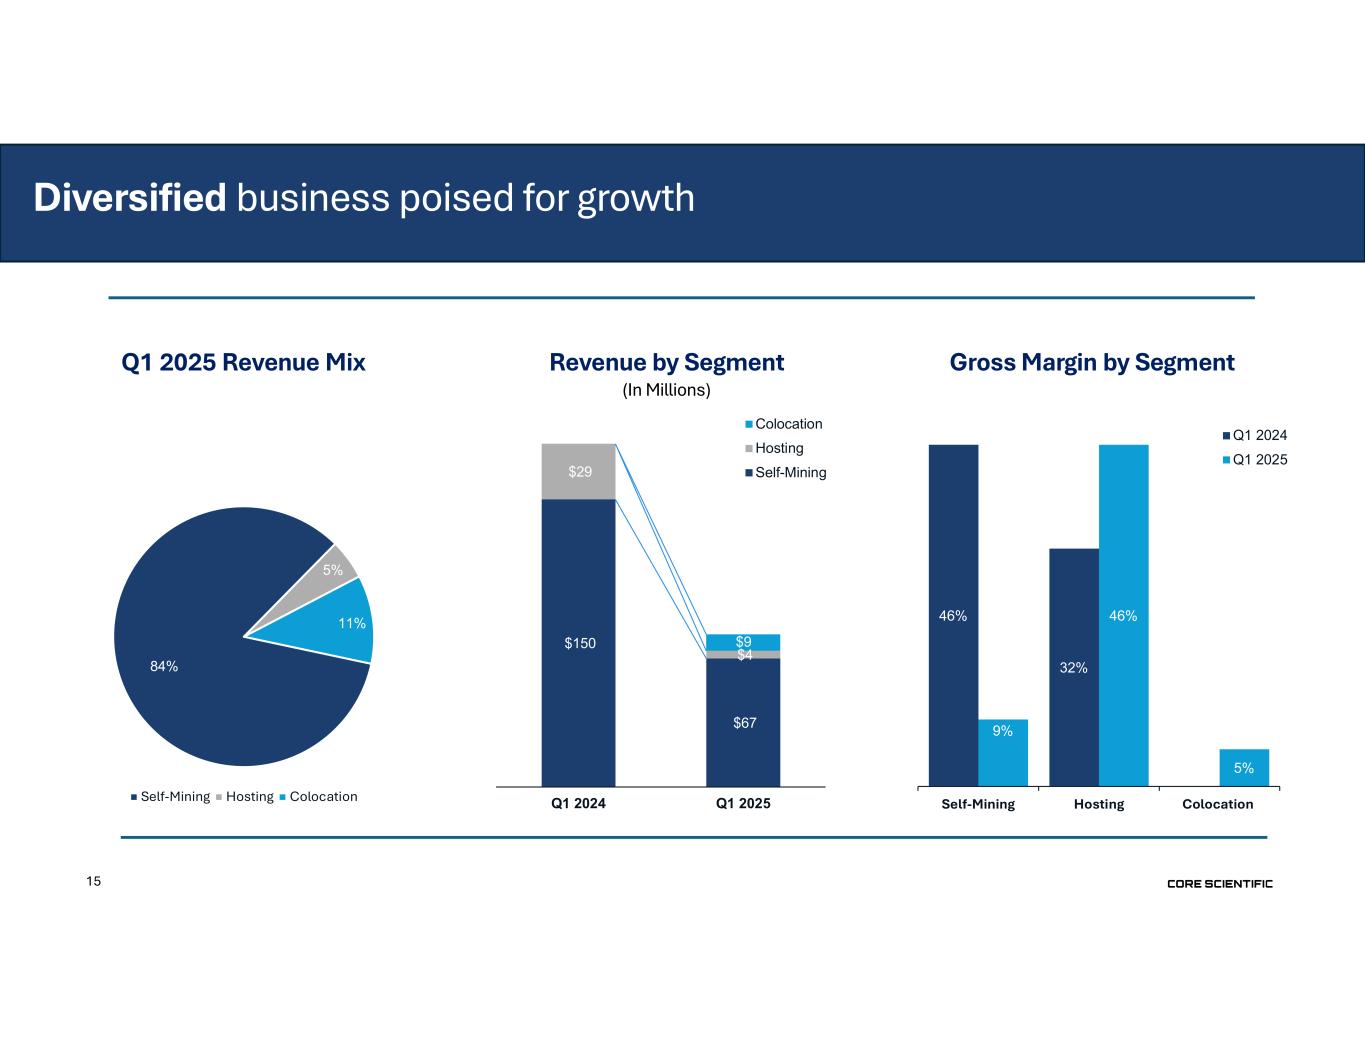
15 Q1 2025 Revenue Mix (In Millions) Revenue by Segment 84% 5% 11% Self-Mining Hosting Colocation $150 $67 $29 $4 $9 Q1 2024 Q1 2025 Colocation Hosting Self-Mining Gross Margin by Segment 46% 32% 0% 9% 46% 5% Self-Mining Hosting Colocation Q1 2024 Q1 2025 Diversified business poised for growth
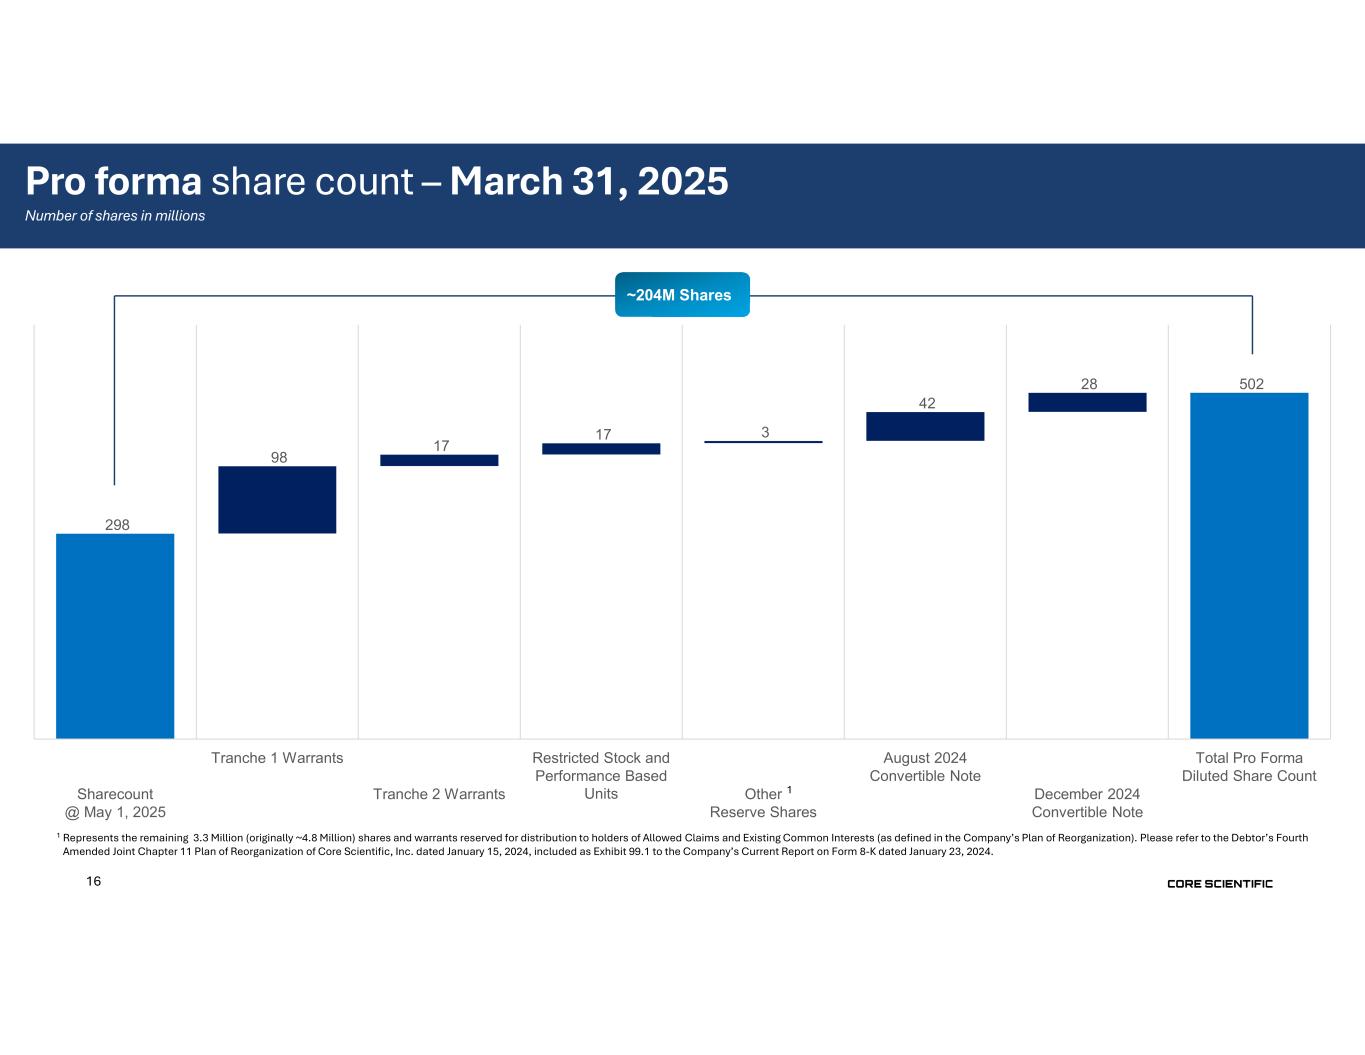
16 298 98 17 17 3 42 28 502 Sharecount @ May 1, 2025 Tranche 1 Warrants Tranche 2 Warrants Restricted Stock and Performance Based Units Other Reserve Shares August 2024 Convertible Note December 2024 Convertible Note Total Pro Forma Diluted Share Count 1 1 Represents the remaining 3.3 Million (originally ~4.8 Million) shares and warrants reserved for distribution to holders of Allowed Claims and Existing Common Interests (as defined in the Company’s Plan of Reorganization). Please refer to the Debtor’s Fourth Amended Joint Chapter 11 Plan of Reorganization of Core Scientific, Inc. dated January 15, 2024, included as Exhibit 99.1 to the Company’s Current Report on Form 8-K dated January 23, 2024. Pro forma share count – March 31, 2025 Number of shares in millions ~204M Shares
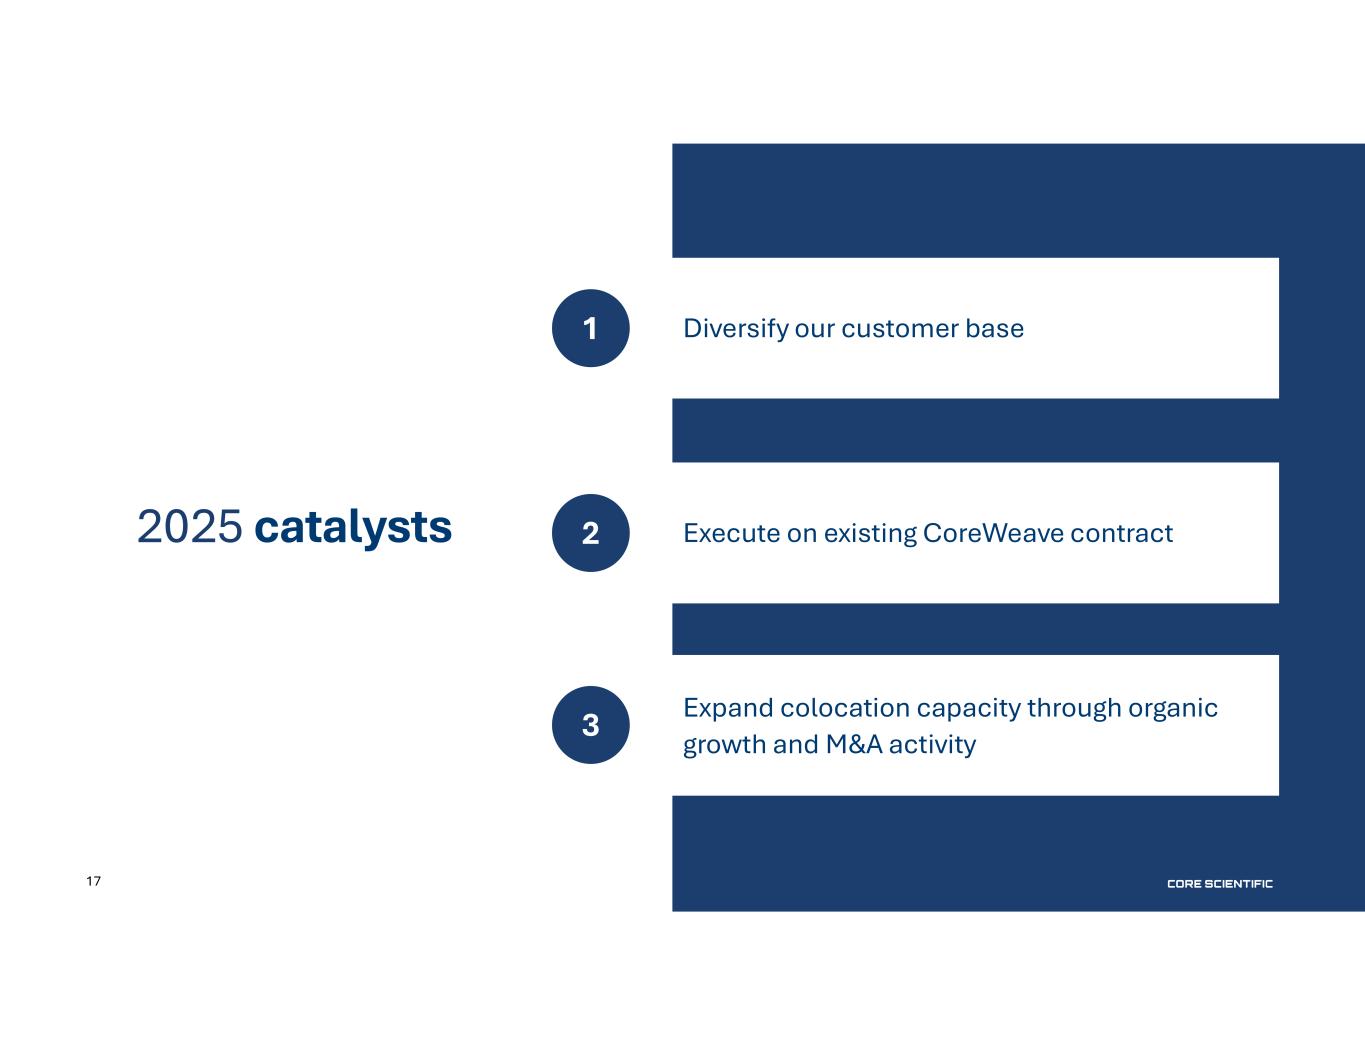
CORE SCIENTIFIC17 2025 catalysts Diversify our customer base Execute on existing CoreWeave contract Expand colocation capacity through organic growth and M&A activity 1 2 3
18 Appendix
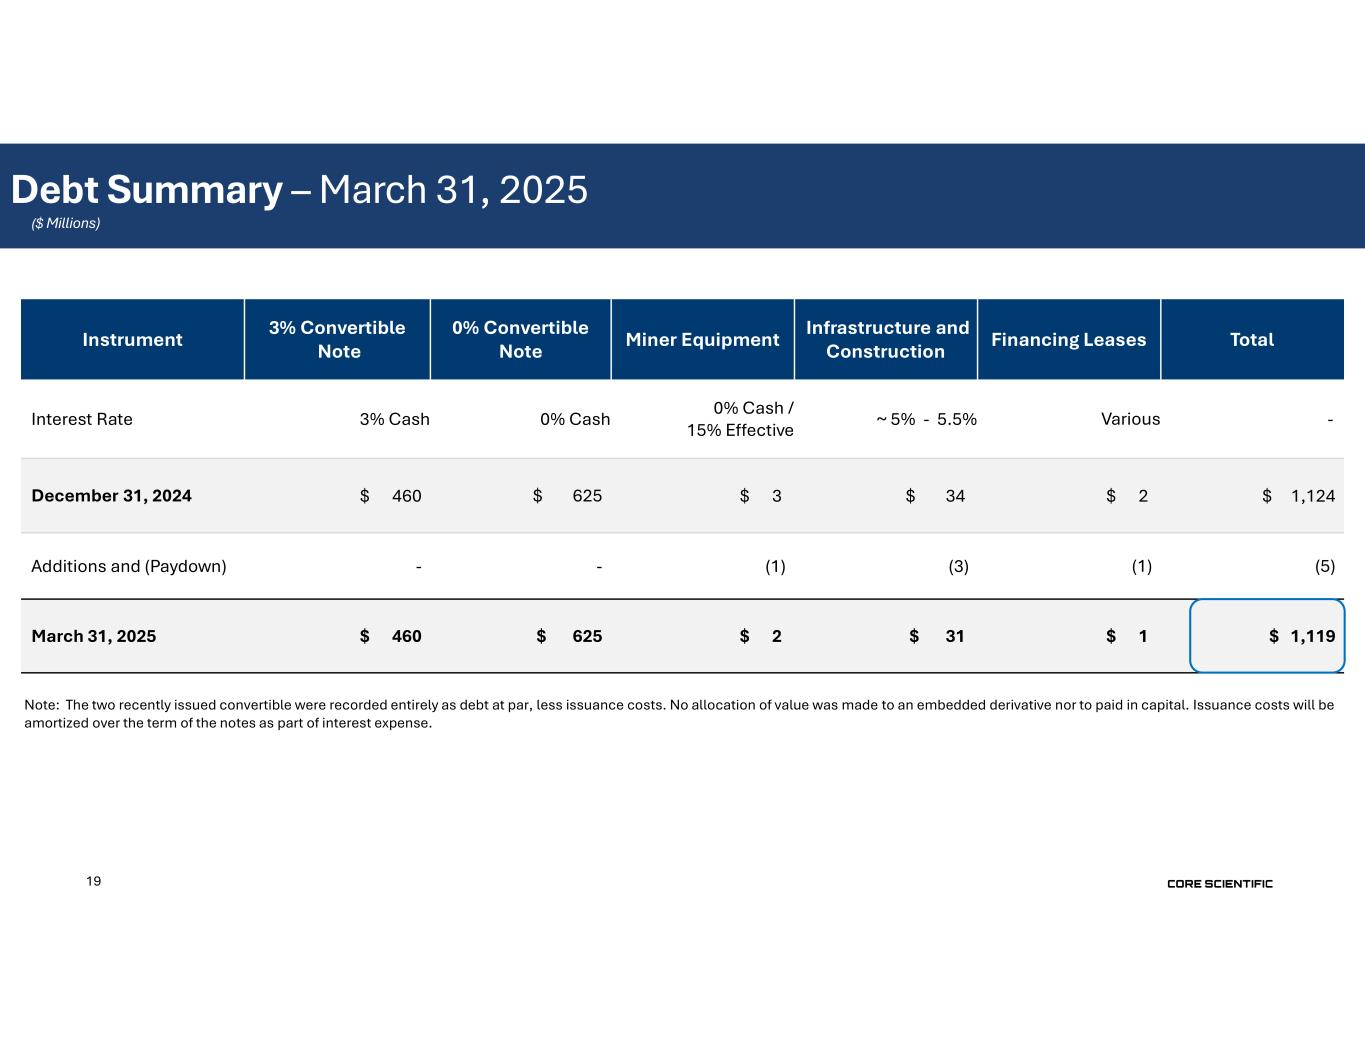
19 TotalFinancing LeasesInfrastructure and ConstructionMiner Equipment 0% Convertible Note 3% Convertible NoteInstrument -Various~ 5% - 5.5%0% Cash / 15% Effective0% Cash3% CashInterest Rate $ 1,124 $ 2$ 34$ 3$ 625 $ 460 December 31, 2024 (5) (1) (3) (1) --Additions and (Paydown) $ 1,119 $ 1$ 31$ 2$ 625 $ 460 March 31, 2025 Note: The two recently issued convertible were recorded entirely as debt at par, less issuance costs. No allocation of value was made to an embedded derivative nor to paid in capital. Issuance costs will be amortized over the term of the notes as part of interest expense. Debt Summary – March 31, 2025 ($ Millions)
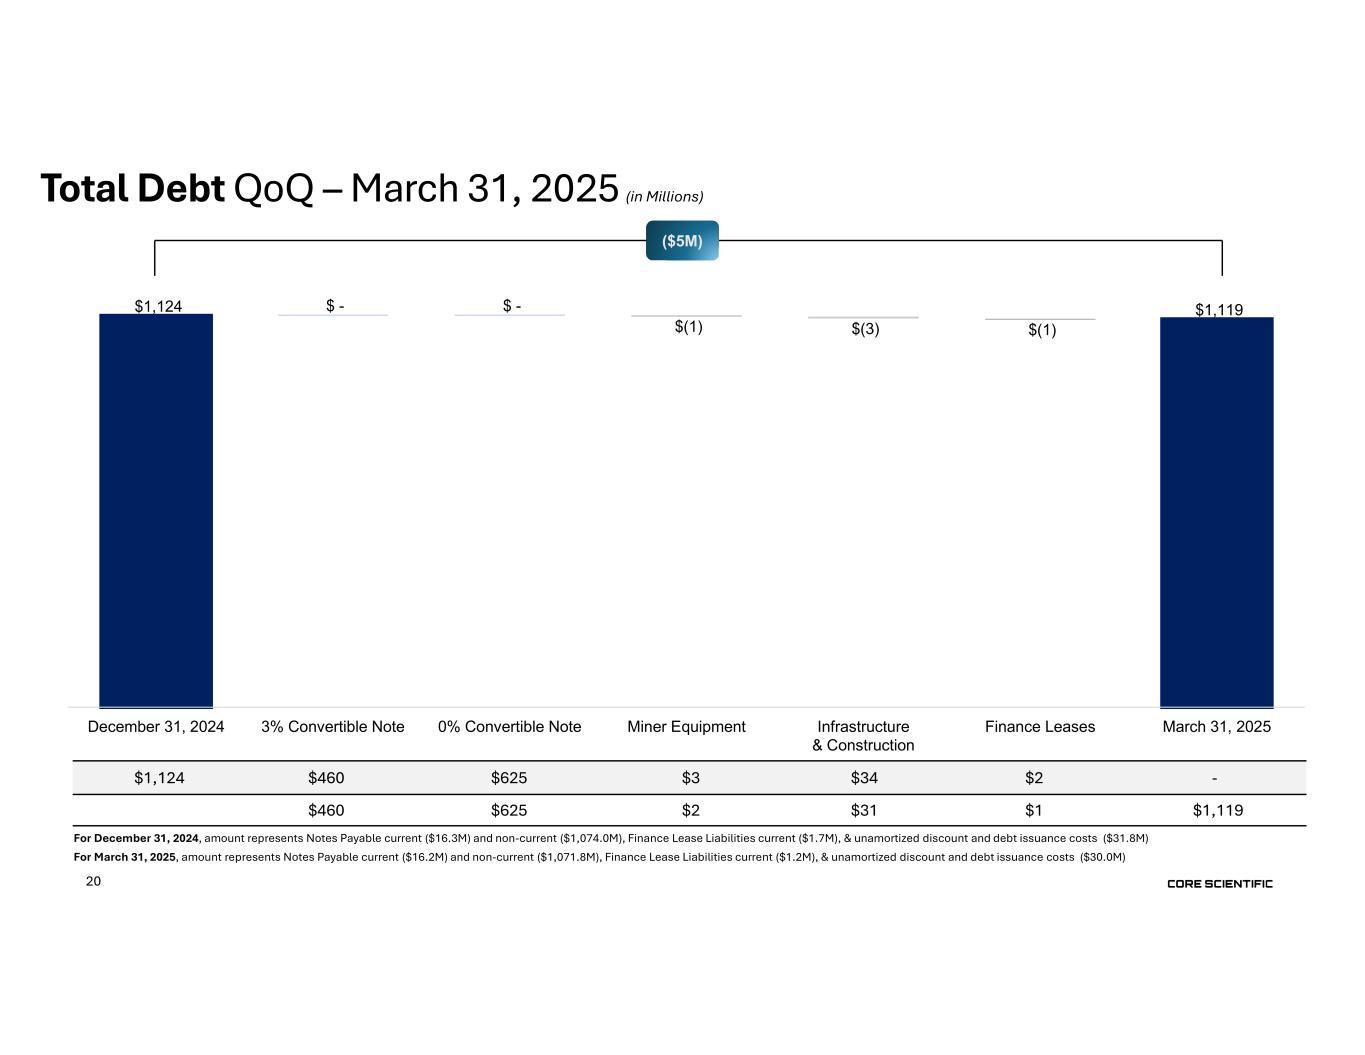
20 $1,124 $ - $ - $(1) $(3) $(1) $1,119 December 31, 2024 3% Convertible Note 0% Convertible Note Miner Equipment Infrastructure & Construction Finance Leases March 31, 2025 -$2 $34 $3$625 $460 $1,124 $1,119$1$31 $2$625 $460 For December 31, 2024, amount represents Notes Payable current ($16.3M) and non-current ($1,074.0M), Finance Lease Liabilities current ($1.7M), & unamortized discount and debt issuance costs ($31.8M) For March 31, 2025, amount represents Notes Payable current ($16.2M) and non-current ($1,071.8M), Finance Lease Liabilities current ($1.2M), & unamortized discount and debt issuance costs ($30.0M) Total Debt QoQ – March 31, 2025 (in Millions) ($5M)
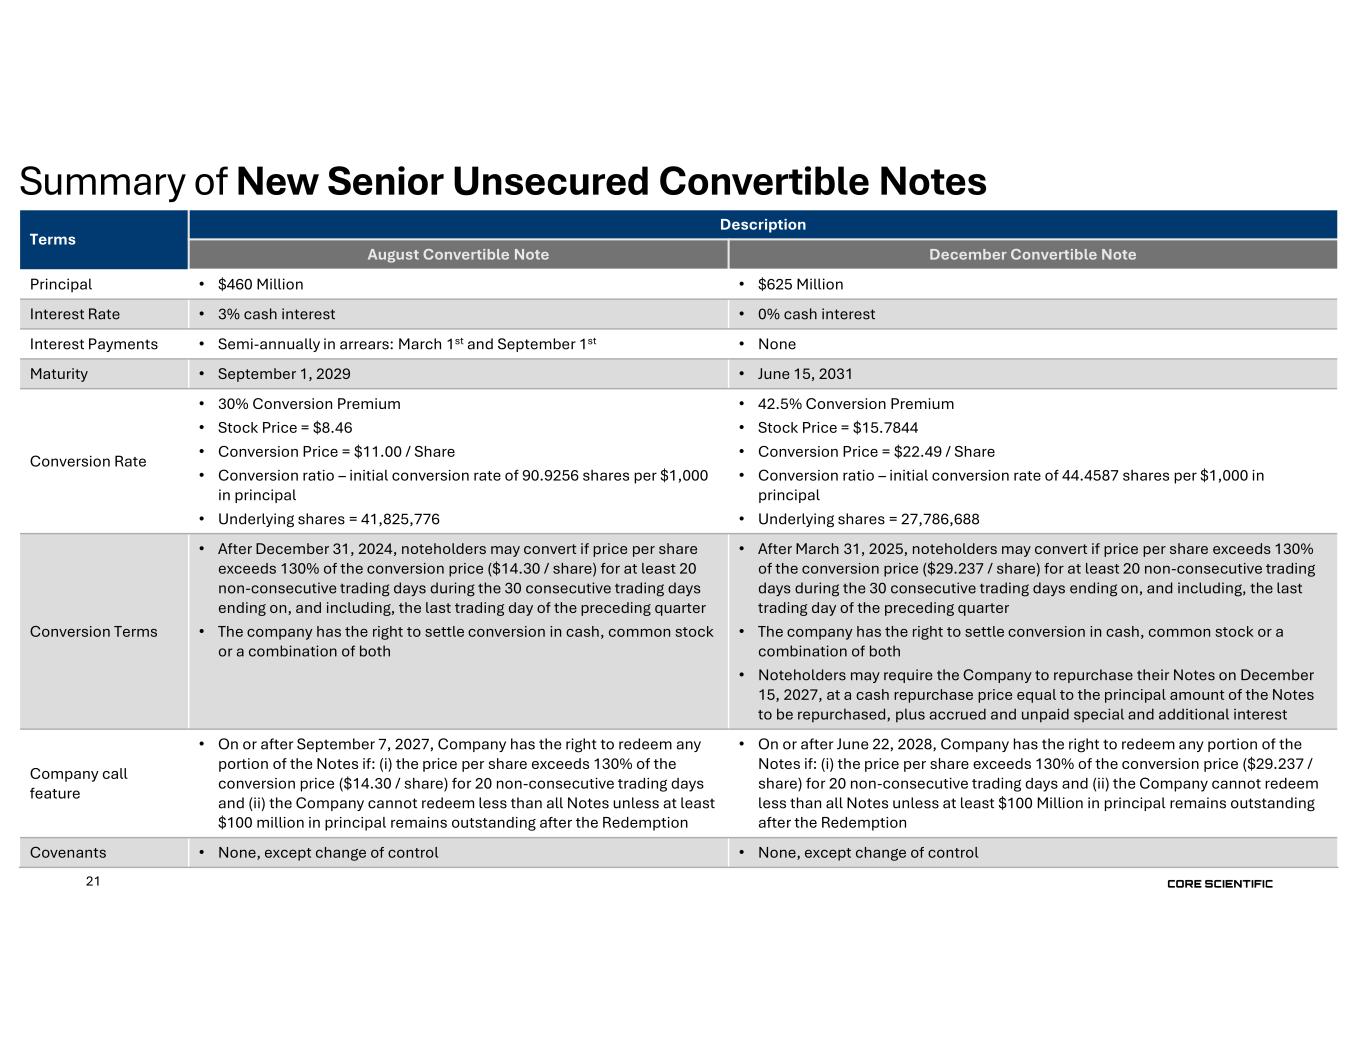
21 Summary of New Senior Unsecured Convertible Notes Description Terms December Convertible NoteAugust Convertible Note • $625 Million• $460 MillionPrincipal • 0% cash interest• 3% cash interestInterest Rate • None• Semi-annually in arrears: March 1st and September 1stInterest Payments • June 15, 2031• September 1, 2029Maturity • 42.5% Conversion Premium • Stock Price = $15.7844 • Conversion Price = $22.49 / Share • Conversion ratio – initial conversion rate of 44.4587 shares per $1,000 in principal • Underlying shares = 27,786,688 • 30% Conversion Premium • Stock Price = $8.46 • Conversion Price = $11.00 / Share • Conversion ratio – initial conversion rate of 90.9256 shares per $1,000 in principal • Underlying shares = 41,825,776 Conversion Rate • After March 31, 2025, noteholders may convert if price per share exceeds 130% of the conversion price ($29.237 / share) for at least 20 non-consecutive trading days during the 30 consecutive trading days ending on, and including, the last trading day of the preceding quarter • The company has the right to settle conversion in cash, common stock or a combination of both • Noteholders may require the Company to repurchase their Notes on December 15, 2027, at a cash repurchase price equal to the principal amount of the Notes to be repurchased, plus accrued and unpaid special and additional interest • After December 31, 2024, noteholders may convert if price per share exceeds 130% of the conversion price ($14.30 / share) for at least 20 non-consecutive trading days during the 30 consecutive trading days ending on, and including, the last trading day of the preceding quarter • The company has the right to settle conversion in cash, common stock or a combination of both Conversion Terms • On or after June 22, 2028, Company has the right to redeem any portion of the Notes if: (i) the price per share exceeds 130% of the conversion price ($29.237 / share) for 20 non-consecutive trading days and (ii) the Company cannot redeem less than all Notes unless at least $100 Million in principal remains outstanding after the Redemption • On or after September 7, 2027, Company has the right to redeem any portion of the Notes if: (i) the price per share exceeds 130% of the conversion price ($14.30 / share) for 20 non-consecutive trading days and (ii) the Company cannot redeem less than all Notes unless at least $100 million in principal remains outstanding after the Redemption Company call feature • None, except change of control• None, except change of controlCovenants
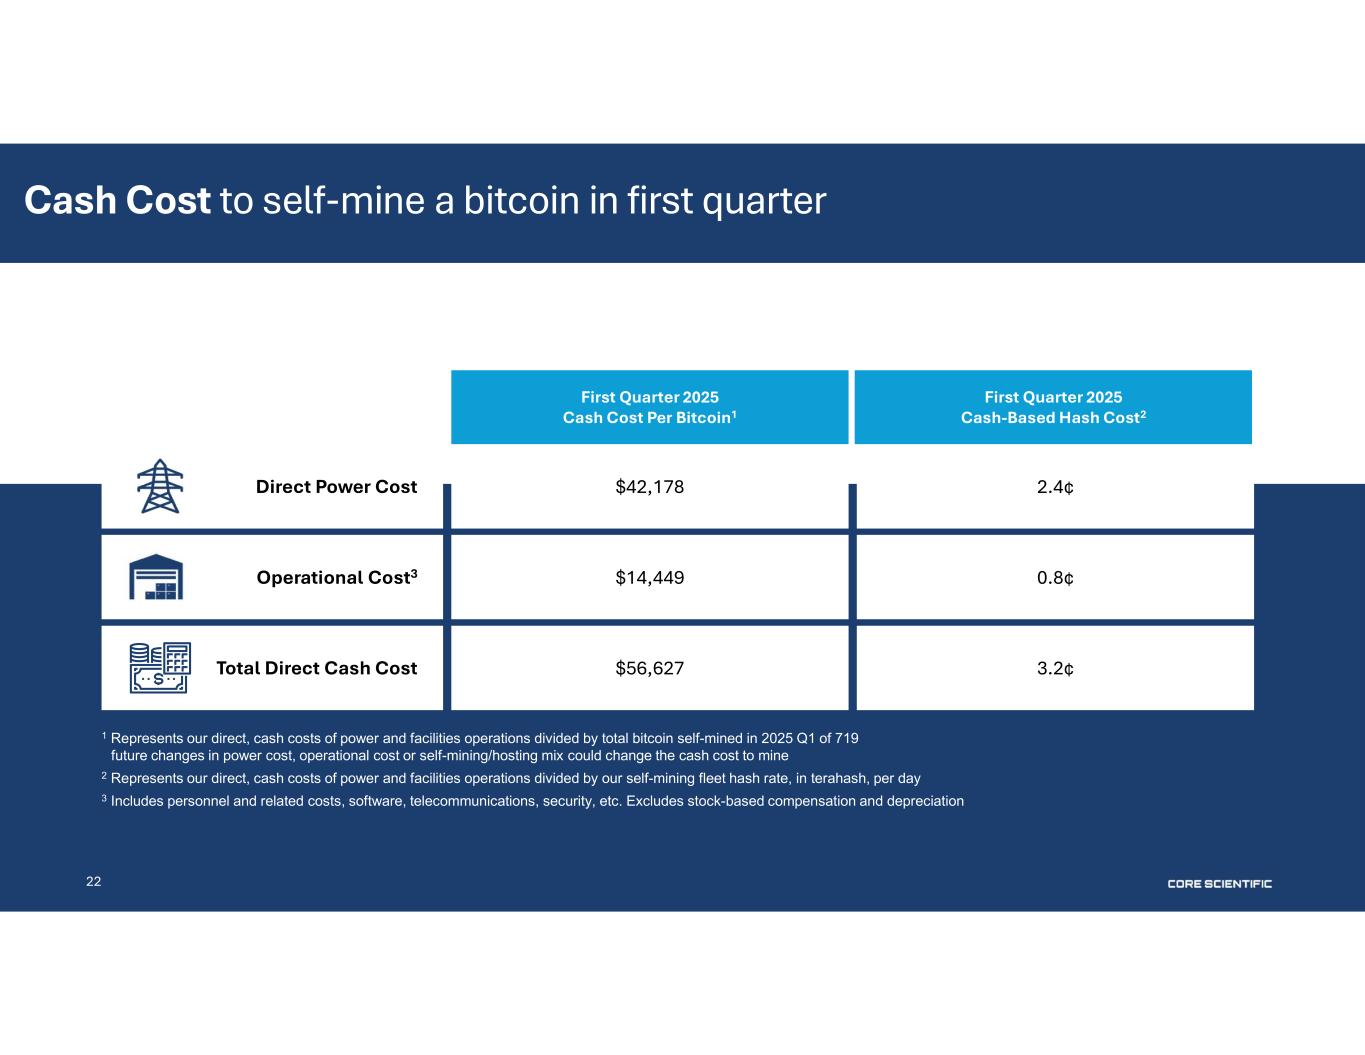
22 1 Represents our direct, cash costs of power and facilities operations divided by total bitcoin self-mined in 2025 Q1 of 719 future changes in power cost, operational cost or self-mining/hosting mix could change the cash cost to mine 2 Represents our direct, cash costs of power and facilities operations divided by our self-mining fleet hash rate, in terahash, per day 3 Includes personnel and related costs, software, telecommunications, security, etc. Excludes stock-based compensation and depreciation First Quarter 2025 Cash Cost Per Bitcoin1 $42,178 First Quarter 2025 Cash-Based Hash Cost2 2.4¢ $14,449 0.8¢ $56,627 3.2¢ Direct Power Cost Operational Cost3 Total Direct Cash Cost Cash Cost to self-mine a bitcoin in first quarter
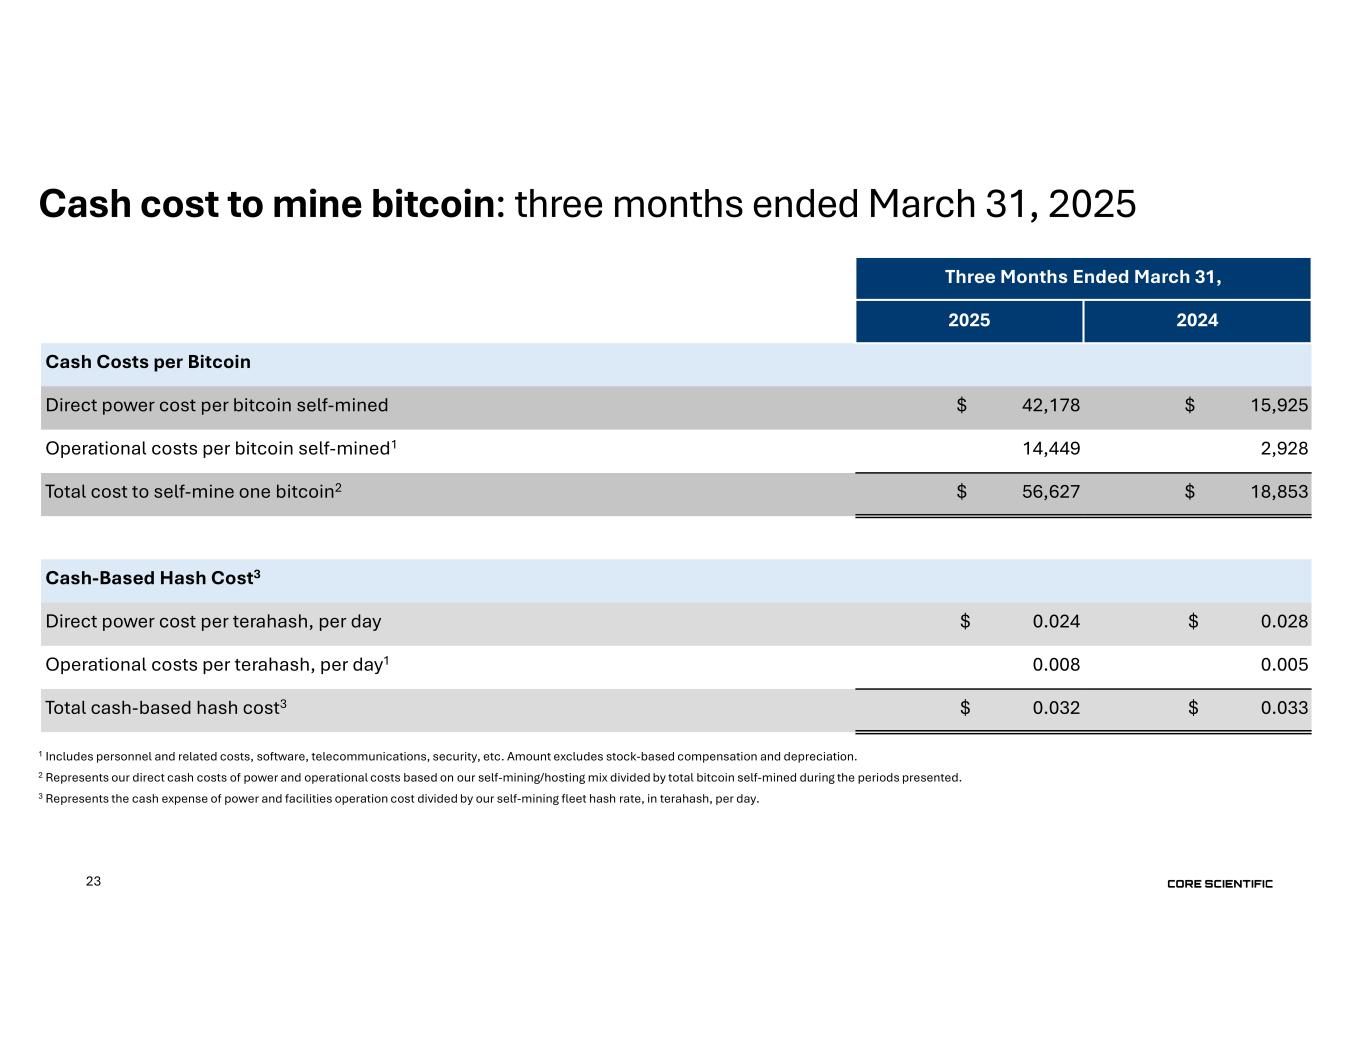
23 Three Months Ended March 31, 20242025 Cash Costs per Bitcoin $ 15,925$ 42,178Direct power cost per bitcoin self-mined 2,92814,449Operational costs per bitcoin self-mined1 $ 18,853$ 56,627Total cost to self-mine one bitcoin2 Cash-Based Hash Cost3 $ 0.028$ 0.024Direct power cost per terahash, per day 0.0050.008Operational costs per terahash, per day1 $ 0.033$ 0.032Total cash-based hash cost3 Cash cost to mine bitcoin: three months ended March 31, 2025 1 Includes personnel and related costs, software, telecommunications, security, etc. Amount excludes stock-based compensation and depreciation. 2 Represents our direct cash costs of power and operational costs based on our self-mining/hosting mix divided by total bitcoin self-mined during the periods presented. 3 Represents the cash expense of power and facilities operation cost divided by our self-mining fleet hash rate, in terahash, per day.
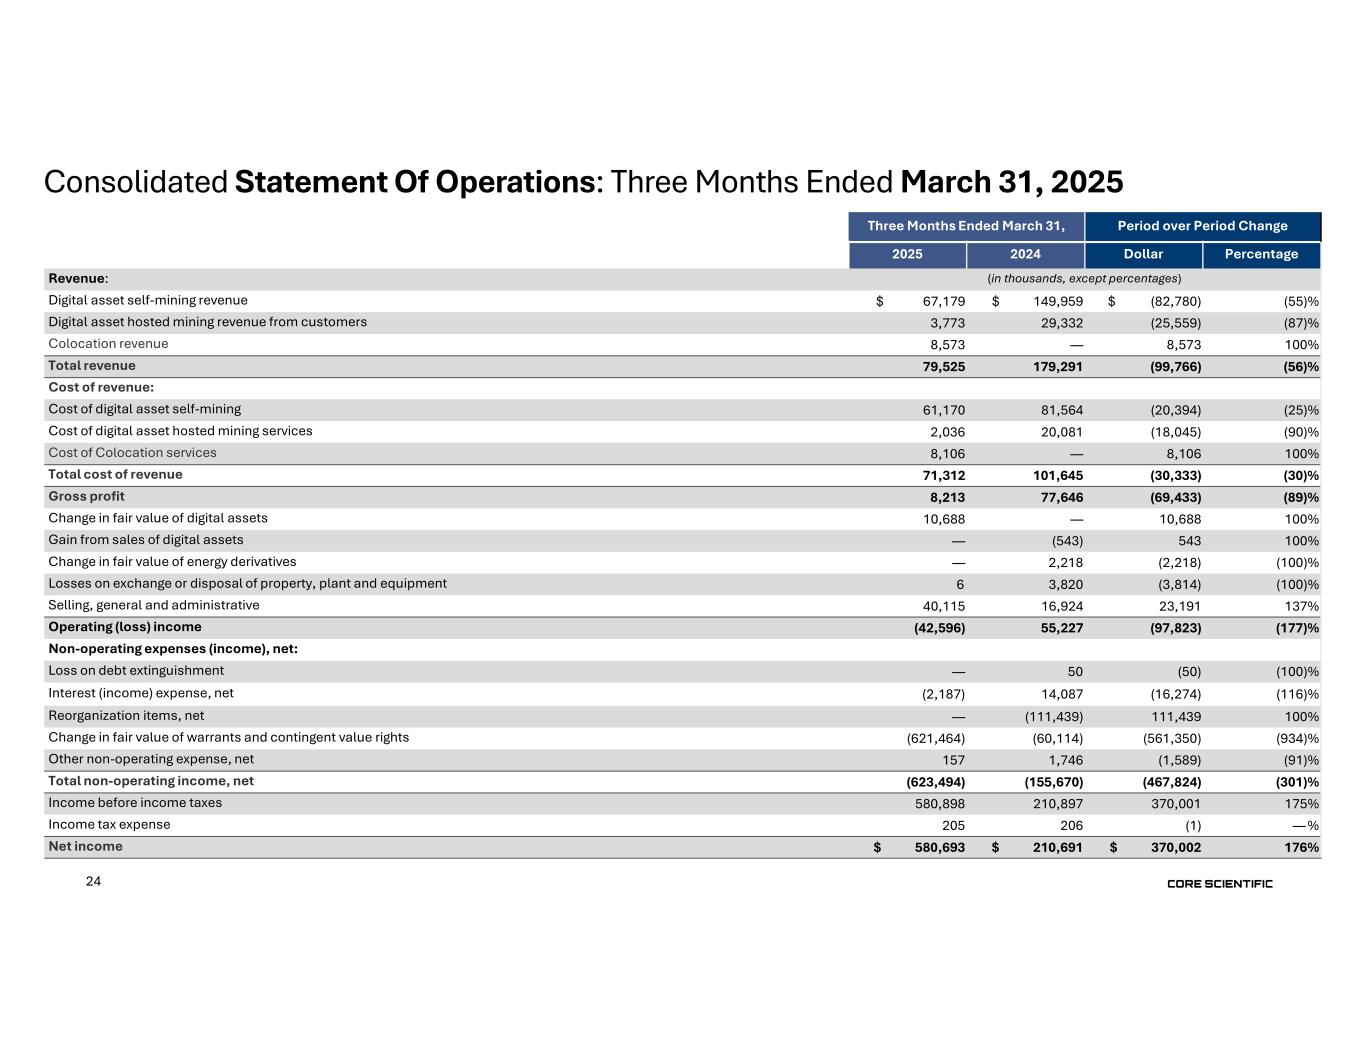
24 Period over Period ChangeThree Months Ended March 31, PercentageDollar20242025 (in thousands, except percentages)Revenue: (55)%$ (82,780)$ 149,959$ 67,179Digital asset self-mining revenue (87)%(25,559)29,3323,773Digital asset hosted mining revenue from customers 100%8,573—8,573Colocation revenue (56)%(99,766)179,29179,525Total revenue Cost of revenue: (25)%(20,394)81,56461,170Cost of digital asset self-mining (90)%(18,045)20,0812,036Cost of digital asset hosted mining services 100%8,106—8,106Cost of Colocation services (30)%(30,333)101,64571,312Total cost of revenue (89)%(69,433)77,6468,213Gross profit 100%10,688—10,688Change in fair value of digital assets 100%543(543)—Gain from sales of digital assets (100)%(2,218)2,218—Change in fair value of energy derivatives (100)%(3,814)3,8206Losses on exchange or disposal of property, plant and equipment 137%23,19116,92440,115Selling, general and administrative (177)%(97,823)55,227(42,596)Operating (loss) income Non-operating expenses (income), net: (100)%(50)50—Loss on debt extinguishment (116)%(16,274)14,087(2,187)Interest (income) expense, net 100%111,439(111,439)—Reorganization items, net (934)%(561,350)(60,114)(621,464)Change in fair value of warrants and contingent value rights (91)%(1,589)1,746157Other non-operating expense, net (301)%(467,824)(155,670)(623,494)Total non-operating income, net 175%370,001210,897580,898Income before income taxes — %(1)206205Income tax expense 176%$ 370,002$ 210,691$ 580,693Net income Consolidated Statement Of Operations: Three Months Ended March 31, 2025
25 Adjusted EBITDA Reconciliation - Three Months Ended March 31, 2025 Three Months Ended March 31, 20242025($ Millions) $ 210.7$ 580.7Net income 14.1(2.2)Interest (income) expense, net 0.20.2Income tax expense $ 225.0$ 578.7Earnings Before Interest and Taxes (EBIT) 29.019.7Depreciation and amortization $ 254.0$ 598.4Earnings Before Interest, Taxes, Depreciation and Amortization (EBITDA) Adjustments: (1.1)16.2Stock-based compensation expense (0.8)—Unrealized fair value adjustment on energy derivatives 3.8—Losses on exchange or disposal of property, plant and equipment 1.70.6Post-emergence bankruptcy advisory costs 0.1—Loss on debt extinguishment (111.4)—Reorganization items, net (60.1)(621.5)Change in fair value of warrants and contingent value rights 1.70.2Other non-operating expenses (income), net 0.1—Other $ 88.0$ (6.1) Adjusted Earnings Before Interest, Taxes, Depreciation and Amortization (Adjusted EBITDA) $ 0.38$ (0.02)Adjusted EPS – Basic1 $ 0.31$ (0.02)Adjusted EPS – Diluted1 1 For the three months ended March 31, 2025, weighted average shares of approximately 315M used in basic and diluted EPS. For the three months ended March 31, 2024, weighted average shares of approximately 231M used in basic EPS and 282M for diluted EPS.
26 Three Months Ended March 31, 20242025 (in thousands, except percentages)Digital Asset Self-Mining Segment $ 149,959$ 67,179Digital asset self-mining revenue Cost of digital asset self-mining: 44,98330,319Power fees 27,47819,259Depreciation expense 4,6807,335Employee compensation 2,9503,280Facility operations expense 1,473977Other segment items 81,56461,170Total cost of digital asset self-mining $ 68,395$ 6,009Digital Asset Self-Mining gross profit 46%9%Digital Asset Self-Mining gross margin Digital Asset Hosted Mining Segment $ 29,332$ 3,773Digital asset hosted mining revenue from customers Cost of digital asset hosted mining services: 13,4941,367Power fees 1,270145Depreciation expense 1,404332Employee compensation 885148Facility operations expense 3,02844Other segment items 20,0812,036Total cost of digital asset hosted mining services $ 9,251$ 1,737Digital Asset Hosted Mining gross profit 32%46%Digital Asset Hosted Mining gross margin Segment Reporting - Three Months Ended March 31, 2025
27 Three Months Ended March 31, 20242025 (in thousands, except percentages)Colocation Segment Colocation revenue: $ —$ 5,995License fees —(8)Maintenance and other —5,987Licensing revenues —2,586Power fees passed through to customer $ —$ 8,573Total Colocation revenue Cost of Colocation services: —67Depreciation expense —1,295Employee compensation —3,852Facility operations expense —306Other segment items —5,520Cost of licensing revenues —2,586Power fees passed through to customer —8,106Total cost of Colocation services $ —$ 467Colocation gross profit — %8%Colocation licensing gross margin — %5%Colocation gross margin Consolidated $ 179,291$ 79,525Consolidated total revenue $ 101,645$ 71,312Consolidated cost of revenue $ 77,646$ 8,213Consolidated gross profit 43%10%Consolidated gross margin Segment Reporting - Three Months Ended March 31, 2025
28 Balance Sheet: As of March 31, 2025 Total Assets ($ Thousands) December 31, 2024March 31, 2025 (Unaudited)Assets Current Assets: $ 836,197$ 697,942Cash and cash equivalents 783783Restricted cash 1,0251,018Accounts receivable 23,89380,646Digital assets 42,06452,789Prepaid expenses and other current assets 903,962833,178Total Current Assets 556,342650,291Property, plant and equipment, net 114,472111,203Operating lease right-of-use assets 24,03930,699Other noncurrent assets $ 1,598,815$ 1,625,371Total Assets
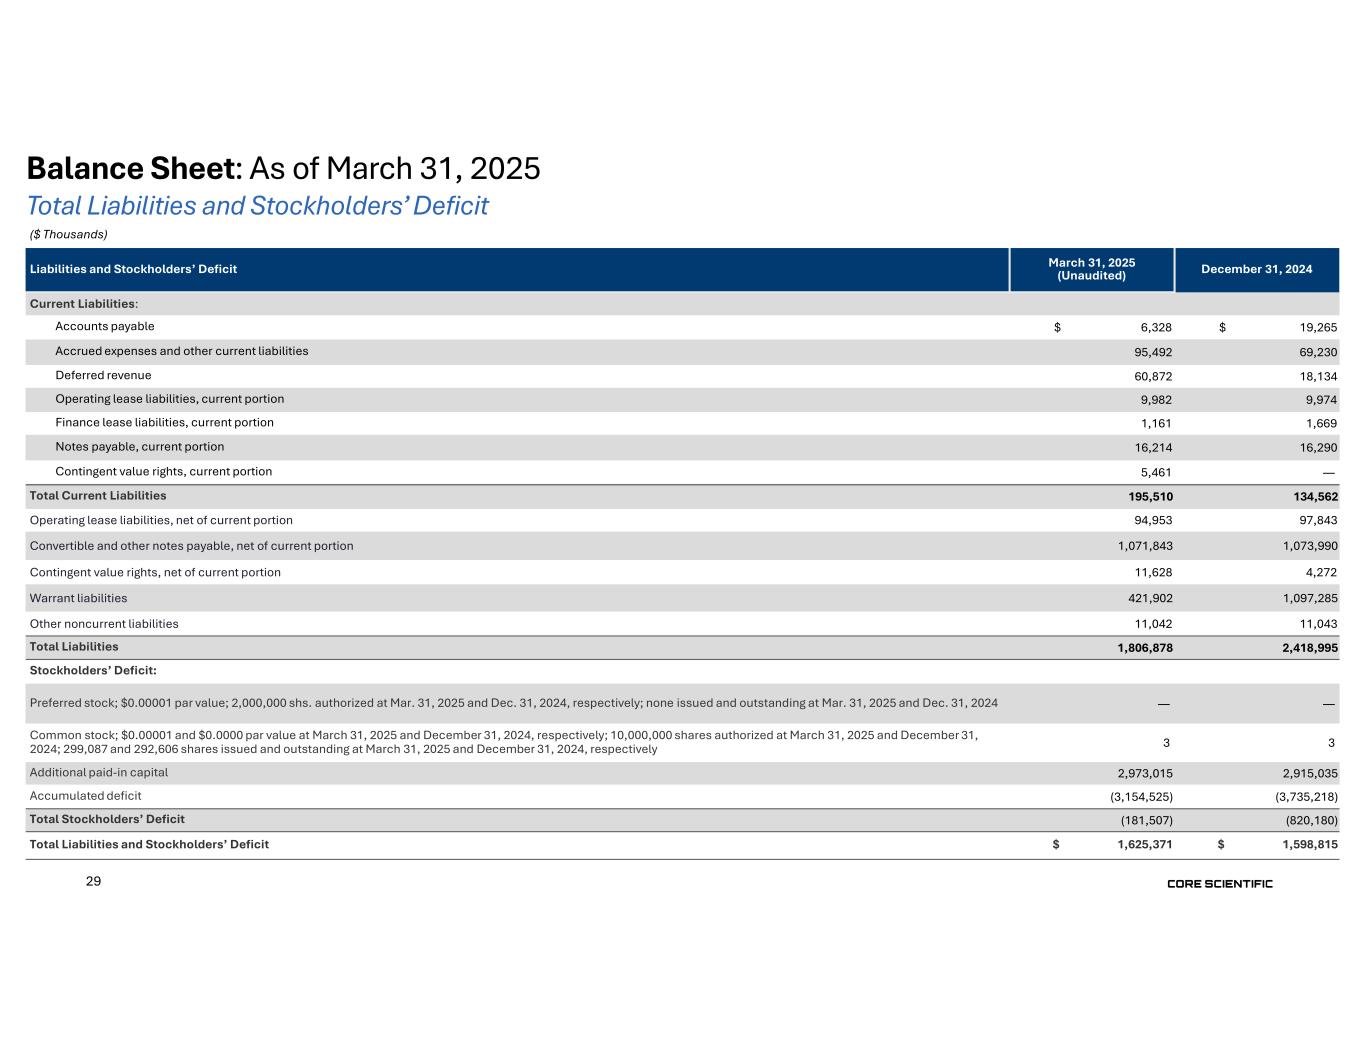
29 ($ Thousands) December 31, 2024March 31, 2025 (Unaudited)Liabilities and Stockholders’ Deficit Current Liabilities: $ 19,265$ 6,328Accounts payable 69,23095,492Accrued expenses and other current liabilities 18,13460,872Deferred revenue 9,9749,982Operating lease liabilities, current portion 1,6691,161Finance lease liabilities, current portion 16,29016,214Notes payable, current portion —5,461Contingent value rights, current portion 134,562195,510Total Current Liabilities 97,84394,953Operating lease liabilities, net of current portion 1,073,9901,071,843Convertible and other notes payable, net of current portion 4,27211,628Contingent value rights, net of current portion 1,097,285421,902Warrant liabilities 11,04311,042Other noncurrent liabilities 2,418,9951,806,878Total Liabilities Stockholders’ Deficit: ——Preferred stock; $0.00001 par value; 2,000,000 shs. authorized at Mar. 31, 2025 and Dec. 31, 2024, respectively; none issued and outstanding at Mar. 31, 2025 and Dec. 31, 2024 33Common stock; $0.00001 and $0.0000 par value at March 31, 2025 and December 31, 2024, respectively; 10,000,000 shares authorized at March 31, 2025 and December 31, 2024; 299,087 and 292,606 shares issued and outstanding at March 31, 2025 and December 31, 2024, respectively 2,915,0352,973,015Additional paid-in capital (3,735,218)(3,154,525)Accumulated deficit (820,180)(181,507)Total Stockholders’ Deficit $ 1,598,815$ 1,625,371Total Liabilities and Stockholders’ Deficit Balance Sheet: As of March 31, 2025 Total Liabilities and Stockholders’ Deficit
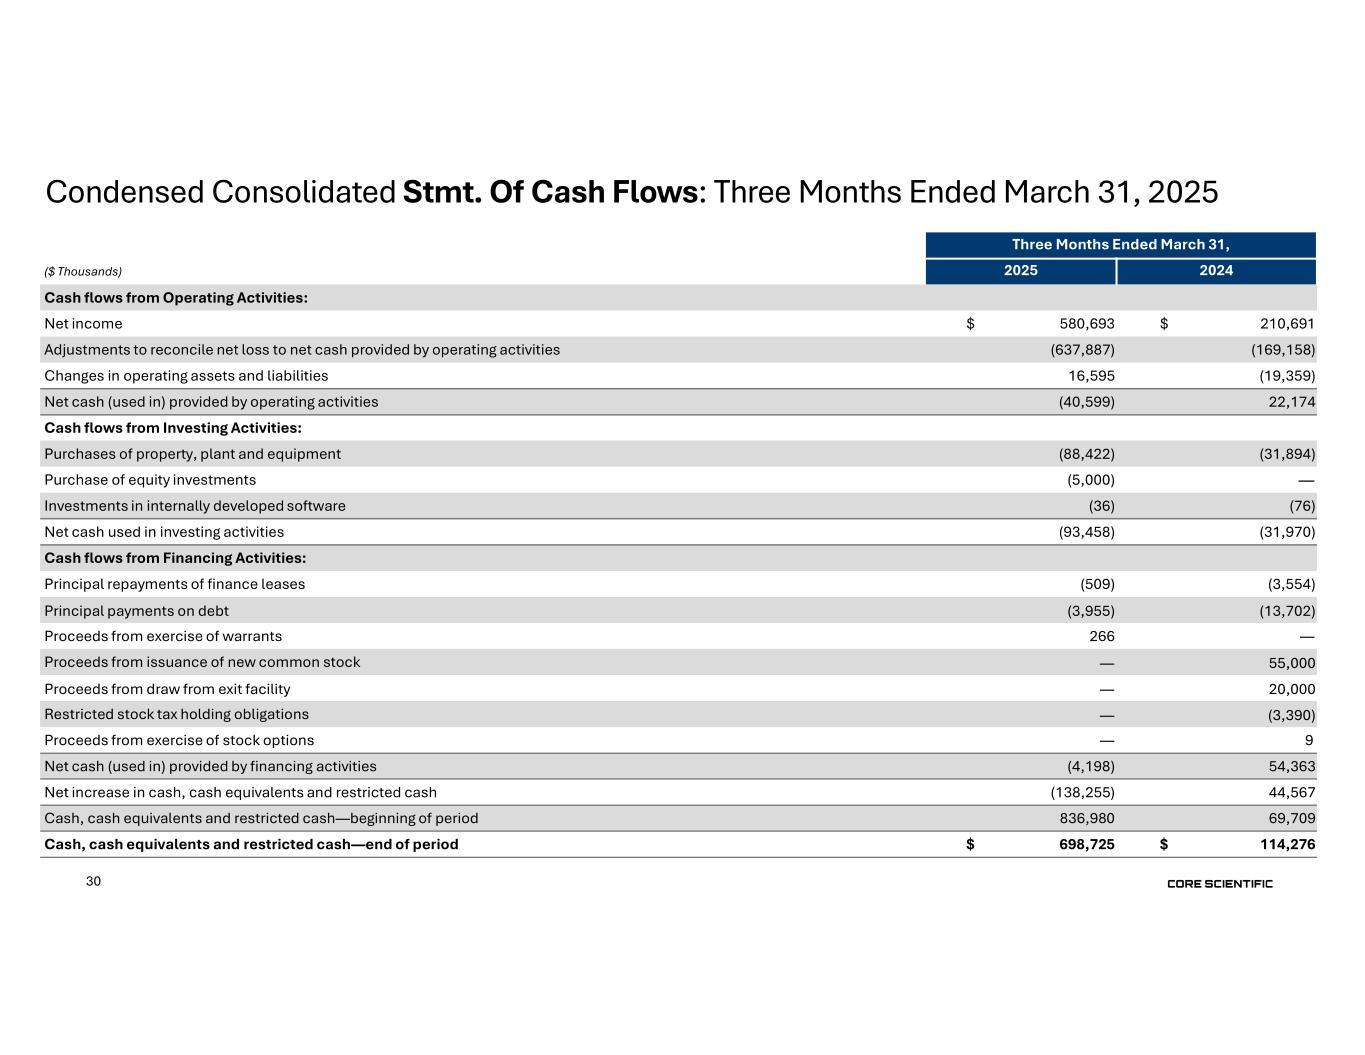
30 Three Months Ended March 31, 20242025($ Thousands) Cash flows from Operating Activities: $ 210,691$ 580,693Net income (169,158)(637,887)Adjustments to reconcile net loss to net cash provided by operating activities (19,359)16,595Changes in operating assets and liabilities 22,174(40,599)Net cash (used in) provided by operating activities Cash flows from Investing Activities: (31,894)(88,422)Purchases of property, plant and equipment —(5,000)Purchase of equity investments (76)(36)Investments in internally developed software (31,970)(93,458)Net cash used in investing activities Cash flows from Financing Activities: (3,554)(509)Principal repayments of finance leases (13,702)(3,955)Principal payments on debt —266Proceeds from exercise of warrants 55,000—Proceeds from issuance of new common stock 20,000—Proceeds from draw from exit facility (3,390)—Restricted stock tax holding obligations 9—Proceeds from exercise of stock options 54,363(4,198)Net cash (used in) provided by financing activities 44,567(138,255)Net increase in cash, cash equivalents and restricted cash 69,709836,980Cash, cash equivalents and restricted cash—beginning of period $ 114,276$ 698,725Cash, cash equivalents and restricted cash—end of period Condensed Consolidated Stmt. Of Cash Flows: Three Months Ended March 31, 2025