CORZ 8-K
Core Scientific, Inc./tx (CORZ)
8-K
2026-07-28
For: 2026-07-28
View Original
Added on
July 28, 2026
UNITED STATES
SECURITIES AND EXCHANGE COMMISSION
Washington, D.C. 20549
FORM 8-K
CURRENT REPORT
Pursuant to Section 13 or 15(d)
of the Securities Exchange Act of 1934
Date of Report (Date of earliest event reported): July 28, 2026
Core Scientific, Inc.
(Exact name of registrant as specified in its charter)
| (State or other jurisdiction of incorporation) | (Commission File Number) | (IRS Employer Identification No.) | ||||||||||||
| (Address of principal executive offices) | (Zip Code) | |||||||
Registrant’s telephone number, including area code: (512 ) 402-5233
(Former Name or Former Address, if Changed Since Last Report)
Check the appropriate box below if the Form 8-K filing is intended to simultaneously satisfy the filing obligations of the registrant under any of the following provisions:
| Written communications pursuant to Rule 425 under the Securities Act (17 CFR 230.425) | |||||
| Soliciting material pursuant to Rule 14a-12 under the Exchange Act (17 CFR 240.14a-12) | |||||
| Pre-commencement communications pursuant to Rule 14d-2(b) under the Exchange Act (17 CFR 240.14d-2(b)) | |||||
| Pre-commencement communications pursuant to Rule 13e-4(c) under the Exchange Act (17 CFR 240.13e-4(c)) | |||||
Securities registered pursuant to Section 12(b) of the Act:
| Title of each class | Trading Symbol(s) | Name of each exchange on which registered | ||||||
Indicate by check mark whether the registrant is an emerging growth company as defined in Rule 405 of the Securities Act of 1933 (§230.405 of this chapter) or Rule 12b-2 of the Securities Exchange Act of 1934 (§240.12b-2 of this chapter).
Emerging growth company ☐
If an emerging growth company, indicate by check mark if the registrant has elected not to use the extended transition period for complying with any new or revised financial accounting standards provided pursuant to Section 13(a) of the Exchange Act. ☐
Item 2.02 Results of Operations and Financial Condition
On July 28, 2026, the Company issued a press release announcing its financial results for the second fiscal quarter ended June 30, 2026. A copy of the press release is furnished hereto as Exhibit 99.1 and is incorporated herein by reference.
Item 7.01 Regulation FD Disclosure
The information contained in Item 2.02 is incorporated herein by reference.
The information in Items 2.02 and 7.01 of this Current Report on Form 8-K, including Exhibit 99.1, is furnished and shall not be deemed “filed” for purposes of Section 18 of the Securities Exchange Act of 1934, as amended, nor shall it be deemed incorporated by reference in any filing made by the Company under the Securities Act of 1933, as amended, whether made before or after the date hereof, regardless of any general incorporation language in such filing.
Item 9.01 Financial Statement and Exhibits
(d) Exhibits:
| Exhibit No. | Description | |||||||
| 99.1 | ||||||||
| 99.2 | ||||||||
| 104 | Cover Page Interactive Data File (embedded within the Inline XBRL document). | |||||||
SIGNATURES
Pursuant to the requirements of the Securities Exchange Act of 1934, the Registrant has duly caused this report to be signed on its behalf by the undersigned hereunto duly authorized.
| Core Scientific, Inc. | ||||||||
Dated: July 28, 2026 | ||||||||
| By: | /s/ Todd M. DuChene | |||||||
| Name: | Todd M. DuChene | |||||||
| Title: | Chief Legal Officer and Chief Administrative Officer | |||||||
 | |||||||||||
Core Scientific Announces Second Quarter 2026 Results
MIAMI, Florida, July 28, 2026 - Core Scientific, Inc. (NASDAQ: CORZ), a leader in digital infrastructure for high-density colocation services (“HDC”), today announced financial results for the second quarter ended June 30, 2026.
Recent Business Developments
•Announced a partnership with AMD with the potential to support up to 2.5 GW of leasable capacity, anchored by 15-year agreements for approximately 530 MW across five sites and more than $14 billion of potential base contracted revenue.
•Increased total leased customer power capacity to approximately 1.1 GW, representing more than $24 billion of potential contracted revenue.
•Billing for 437 MW of capacity as of mid-July, representing approximately $635 million in average annualized colocation GAAP revenue.
Financial Summary and Operating Metrics (in millions, except billing megawatts)
| Metric | Q2 2026 | Q1 2026 | Q2 2025 | ||||||||
| Billing MW | 395 | 225 | N/A | ||||||||
| Colocation Revenue | $ | 136.7 | $ | 77.5 | $ | 10.6 | |||||
| Total Revenue | $ | 164.2 | $ | 115.2 | $ | 78.6 | |||||
| Gross Profit | $ | 70.0 | $ | 30.1 | $ | 5.0 | |||||
Net loss(1) | $ | (1,155.3) | $ | (347.2) | $ | (936.8) | |||||
| Adjusted EBITDA | $ | 41.1 | $ | 8.9 | $ | 28.5 | |||||
Capital Expenditures (“CapEx”)(2) | $ | 797.5 | $ | 389.2 | $ | 121.3 | |||||
Liquidity(3) | $ | 1,819.4 | $ | 1,042.5 | $ | 754.1 | |||||
(1)Net loss for the quarter ended June 30, 2026 was primarily driven by the change in fair value of warrants, reflecting appreciation in the Company’s stock price during the period.
(2)CapEx includes purchases of property, plant and equipment and acquisitions of land and development rights.
(3)Liquidity is comprised of cash and cash equivalents and digital assets.
Conference Call and Earnings Presentation
In conjunction with this release, Core Scientific, Inc. will host a conference call today, Tuesday, July 28, 2026, at 8:30 am Eastern Time that will be webcast live. Adam Sullivan, Chief Executive Officer, Jim Nygaard, Chief Financial Officer, Matt Brown, Chief Operating Officer, and Jon Charbonneau, Senior Vice President, Investor Relations will host the call.
Investors with Internet access may listen to the live audio webcast via the Investor Relations page of the Core Scientific, Inc. website, http://investors.corescientific.com or by using the following link https://event.choruscall.com/mediaframe/webcast.html?webcastid=IPzPbUYf
A supplementary investor presentation for the second quarter 2026 may be accessed at https://investors.corescientific.com/news-events/presentations
-more-
Core Scientific, Inc. First Quarter 2026 Earnings Release - 2 | ||||||||
Audio Replay
An audio replay of the event will be archived on the Investor Relations section of the Company's website at http://investors.corescientific.com.
About Core Scientific
Core Scientific is a leader in designing, building and operating large scale, purpose-built data centers for high-density colocation (“HDC”) services. Core Scientific operates facilities for high-density colocation services serving artificial intelligence-related (“AI”) workloads and is a premier provider of digital infrastructure and services to its third-party customers. The majority of the Company's revenue is derived from high-density colocation services, with the remainder derived from earning digital assets for the Company's own account and from digital asset mining hosting services. The Company is in the process of repurposing its remaining mining facilities to support its high-density colocation services business as circumstances allow. Core Scientific’s facilities are located in Alabama (1), Georgia (2), Kentucky (1), North Carolina (1), North Dakota (1), Oklahoma (1) and Texas (4). To learn more, visit www.corescientific.com.
Special Note Regarding Forward-Looking Statements
This press release includes forward-looking statements within the meaning of Section 27A of the Securities Act of 1933, as amended, (the “Securities Act”) and Section 21E of the Securities Exchange Act of 1934, as amended, (the “Exchange Act”). Forward-looking statements may include words such as “aim,” “estimate,” “plan,” “project,” “forecast,” “goal,” “intend,” “will,” “expect,” “anticipate,” “believe,” “seek,” “target” or other similar expressions that predict or indicate future events or trends or that are not statements of historical matters. These forward-looking statements include, but are not limited to, statements regarding projections, estimates and forecasts of revenue, contracted revenue and other financial and performance metrics, projections of market opportunity and expectations, the Company’s ability to scale and grow its business, successfully finance and complete construction of its data centers, source sufficient electrical energy, necessary long lead infrastructure components, supplies and equipment, the expected growth of the Company, the Company’s ability to source and retain talent, and our ability to source and acquire suitable additional land and power. These statements are provided for illustrative purposes only and are based on various assumptions, whether or not identified in this press release, and on the current expectations of the Company’s management. These forward-looking statements are not intended to serve, and must not be relied on by any investor, as a guarantee, an assurance, a prediction or a definitive statement of fact or probability. Actual events and circumstances are difficult or impossible to predict and will differ from assumptions. Many actual events and circumstances are beyond the control of the Company.
These forward-looking statements are not guarantees of future performance and are subject to risks, uncertainties and assumptions, known or unknown, that could cause actual results to vary materially from those indicated or anticipated. These risks, assumptions and uncertainties include those described in Part I. Item 1A. — “Risk Factors” of the Company’s Annual Report on Form 10-K for the year ended December 31, 2025 and in the Company’s Quarterly Reports on Form 10-Q. If one or more of these risks or uncertainties materializes, or if underlying assumptions prove incorrect, actual results may vary materially from those indicated or anticipated by such forward-looking statements.
There may be additional risks that the Company could not presently know or that the Company currently believes are immaterial that could also cause actual results to differ from those contained in the forward-looking statements. In addition, forward-looking statements reflect the Company’s expectations, plans or forecasts of future events and views as of the date of this press release and should not be relied upon as representing the
-more-
Core Scientific, Inc. First Quarter 2026 Earnings Release - 3 | ||||||||
Company’s assessments as of any date subsequent to the date of this press release. The Company anticipates that subsequent events and developments will cause the Company’s assessments to change. However, while the Company may elect to update these forward-looking statements at some point in the future, the Company specifically disclaims any obligation to do so. Accordingly, you should not place undue reliance on these forward-looking statements, which speak only as of the date they are made.
-more-
Core Scientific, Inc. First Quarter 2026 Earnings Release - 4 | ||||||||
Core Scientific, Inc.
Condensed Consolidated Balance Sheets
(in thousands, except par value)
(Unaudited)
| June 30, 2026 | March 31, 2026 | December 31, 2025 | |||||||||||||||
| Assets | |||||||||||||||||
| Current Assets: | |||||||||||||||||
| Cash and cash equivalents | $ | 1,769,735 | $ | 1,005,148 | $ | 311,378 | |||||||||||
| Digital assets | 49,675 | 37,312 | 222,000 | ||||||||||||||
| Customer funding receivable and other current assets | 458,489 | 352,128 | 362,159 | ||||||||||||||
Restricted cash, current portion | 165,745 | 60,244 | — | ||||||||||||||
| Total Current Assets | 2,443,644 | 1,454,832 | 895,537 | ||||||||||||||
| Property, plant and equipment, net | 1,774,142 | 1,344,924 | 1,293,299 | ||||||||||||||
| Intangibles, net | 228,625 | 10,945 | 1,076 | ||||||||||||||
| Operating lease right-of-use assets | 114,199 | 105,986 | 108,484 | ||||||||||||||
Restricted cash, net of current portion | 615,911 | 80,593 | — | ||||||||||||||
| Other noncurrent assets | 80,972 | 72,284 | 49,248 | ||||||||||||||
| Total Assets | $ | 5,257,493 | $ | 3,069,564 | $ | 2,347,644 | |||||||||||
| Liabilities and Stockholders’ Deficit | |||||||||||||||||
| Current Liabilities: | |||||||||||||||||
| Accounts payable | $ | 112,374 | $ | 218,857 | $ | 126,106 | |||||||||||
| Accrued expenses | 509,189 | 364,479 | 511,957 | ||||||||||||||
| Deferred revenue | 287,201 | 219,555 | 127,561 | ||||||||||||||
| Notes payable, current portion | — | 993,944 | — | ||||||||||||||
Warrant liabilities, current portion | 1,811,587 | 844,752 | — | ||||||||||||||
| Other current liabilities | 17,443 | 20,196 | 15,777 | ||||||||||||||
| Total Current Liabilities | 2,737,794 | 2,661,783 | 781,401 | ||||||||||||||
| Long-term debt | 4,297,967 | 1,061,651 | 1,060,325 | ||||||||||||||
Warrant liabilities, net of current portion | 163,683 | 116,495 | 936,107 | ||||||||||||||
| Deferred revenue, net of current portion | 367,242 | 434,672 | 428,290 | ||||||||||||||
| Other noncurrent liabilities | 110,163 | 100,649 | 104,261 | ||||||||||||||
| Total Liabilities | 7,676,849 | 4,375,250 | 3,310,384 | ||||||||||||||
| Commitments and contingencies | |||||||||||||||||
| Stockholders’ Deficit: | |||||||||||||||||
Preferred stock; $0.00001 par value; 2,000,000 shares authorized; none issued and outstanding at June 30, 2026 and December 31, 2025 | — | — | — | ||||||||||||||
Common stock; $0.00001 par value; 10,000,000 shares authorized at June 30, 2026 and December 31, 2025; 319,587 and 314,231 shares issued and outstanding at June 30, 2026 and December 31, 2025, respectively | 3 | 3 | 3 | ||||||||||||||
| Additional paid-in capital | 3,229,842 | 3,188,202 | 3,183,960 | ||||||||||||||
| Accumulated deficit | (5,649,201) | (4,493,891) | (4,146,703) | ||||||||||||||
| Total Stockholders’ Deficit | (2,419,356) | (1,305,686) | (962,740) | ||||||||||||||
| Total Liabilities and Stockholders’ Deficit | $ | 5,257,493 | $ | 3,069,564 | $ | 2,347,644 | |||||||||||
Certain prior year amounts have been reclassified for consistency with the current year presentation.
-more-
Core Scientific, Inc. First Quarter 2026 Earnings Release - 5 | ||||||||
Core Scientific, Inc.
Condensed Consolidated Statements of Operations
(in thousands, except per share amounts)
(Unaudited)
| Three Months Ended | Six Months Ended | ||||||||||||||||||||||||||||
| June 30, 2026 | March 31, 2026 | June 30, 2025 | June 30, 2026 | June 30, 2025 | |||||||||||||||||||||||||
| Revenue: | |||||||||||||||||||||||||||||
| Colocation revenue | $ | 136,669 | $ | 77,539 | $ | 10,560 | $ | 214,208 | $ | 19,133 | |||||||||||||||||||
| Digital asset self-mining revenue | 21,535 | 30,105 | 62,424 | 51,640 | 129,603 | ||||||||||||||||||||||||
| Digital asset hosted mining revenue from customers | 5,997 | 7,600 | 5,644 | 13,597 | 9,417 | ||||||||||||||||||||||||
| Total revenue | 164,201 | 115,244 | 78,628 | 279,445 | 158,153 | ||||||||||||||||||||||||
| Cost of revenue: | |||||||||||||||||||||||||||||
| Cost of colocation services | 56,686 | 33,618 | 9,430 | 90,304 | 17,536 | ||||||||||||||||||||||||
| Cost of digital asset self-mining | 33,700 | 47,189 | 59,589 | 80,889 | 120,759 | ||||||||||||||||||||||||
| Cost of digital asset hosted mining services | 3,771 | 4,331 | 4,584 | 8,102 | 6,620 | ||||||||||||||||||||||||
| Total cost of revenue | 94,157 | 85,138 | 73,603 | 179,295 | 144,915 | ||||||||||||||||||||||||
Gross profit | 70,044 | 30,106 | 5,025 | 100,150 | 13,238 | ||||||||||||||||||||||||
| Change in fair value of digital assets | 9,368 | 6,558 | (29,797) | 15,926 | (19,109) | ||||||||||||||||||||||||
Loss on disposal of property, plant and equipment | 1,273 | 13,638 | 4,166 | 14,911 | 4,172 | ||||||||||||||||||||||||
| Loss on remeasurement of assets held for sale | 19,495 | — | — | 19,495 | — | ||||||||||||||||||||||||
Impairment of property, plant and equipment | — | 266,488 | — | 266,488 | — | ||||||||||||||||||||||||
| Loss on contract termination | 41,948 | — | — | 41,948 | — | ||||||||||||||||||||||||
| Colocation organizational and site startup costs | 27,039 | 8,665 | 11,655 | 35,704 | 23,322 | ||||||||||||||||||||||||
| Selling, general and administrative | 49,389 | 45,179 | 45,285 | 94,568 | 78,175 | ||||||||||||||||||||||||
Operating loss | (78,468) | (310,422) | (26,284) | (388,890) | (73,322) | ||||||||||||||||||||||||
| Non-operating expenses (income), net: | |||||||||||||||||||||||||||||
| Loss on debt extinguishment | 5,435 | — | 1,377 | 5,435 | 1,377 | ||||||||||||||||||||||||
Interest expense (income), net | 23,833 | 4,857 | (1,185) | 28,690 | (3,372) | ||||||||||||||||||||||||
| Change in fair value of warrants and contingent value rights | 1,045,515 | 30,799 | 909,958 | 1,076,314 | 288,494 | ||||||||||||||||||||||||
Other non-operating expense, net | 152 | 510 | 207 | 662 | 364 | ||||||||||||||||||||||||
Total non-operating expense, net | 1,074,935 | 36,166 | 910,357 | 1,111,101 | 286,863 | ||||||||||||||||||||||||
Loss before income taxes | (1,153,403) | (346,588) | (936,641) | (1,499,991) | (360,185) | ||||||||||||||||||||||||
| Income tax expense | 1,907 | 600 | 158 | 2,507 | 363 | ||||||||||||||||||||||||
| Net loss | $ | (1,155,310) | $ | (347,188) | $ | (936,799) | $ | (1,502,498) | $ | (360,548) | |||||||||||||||||||
Net loss per share, basic and diluted | $ | (3.32) | $ | (1.06) | $ | (0.04) | $ | (4.39) | $ | (0.23) | |||||||||||||||||||
Weighted average shares outstanding, basic and diluted | 325,329 | 322,911 | 317,985 | 324,128 | 316,593 | ||||||||||||||||||||||||
| Supplemental information - stock based compensation: | |||||||||||||||||||||||||||||
| Cost of revenue | $ | 1,283 | $ | 853 | $ | 941 | $ | 2,136 | $ | 2,323 | |||||||||||||||||||
| Colocation organizational and site startup costs | 4,302 | 4,224 | 4,638 | 8,526 | 7,590 | ||||||||||||||||||||||||
| Selling, general and administrative | 12,655 | 12,684 | 18,592 | 25,339 | 30,442 | ||||||||||||||||||||||||
| Stock-based compensation expense, net of amounts capitalized | 18,240 | 17,761 | 24,171 | 36,001 | 40,355 | ||||||||||||||||||||||||
| Capitalized stock-based compensation | 519 | 626 | 176 | 1,145 | 396 | ||||||||||||||||||||||||
| Total stock-based compensation cost | $ | 18,759 | $ | 18,387 | $ | 24,347 | $ | 37,146 | $ | 40,751 | |||||||||||||||||||
Certain prior year amounts have been reclassified for consistency with the current year presentation.
-more-
Core Scientific, Inc. First Quarter 2026 Earnings Release - 6 | ||||||||
Core Scientific, Inc.
Condensed Consolidated Statements of Cash Flows
(Unaudited, in thousands)
| Six Months Ended June 30, | |||||||||||
| 2026 | 2025 | ||||||||||
| Cash flows from Operating Activities: | |||||||||||
| Net loss | $ | (1,502,498) | $ | (360,548) | |||||||
| Adjustments to reconcile net loss to net cash provided by (used in) operating activities: | |||||||||||
| Depreciation and amortization | 32,146 | 38,487 | |||||||||
| Loss on disposal of property, plant and equipment | 14,911 | 4,172 | |||||||||
| Loss on remeasurement of assets held for sale | 19,495 | — | |||||||||
Impairment of property, plant and equipment | 266,488 | — | |||||||||
| Change in operating lease right-of-use assets | 6,400 | 5,404 | |||||||||
| Stock-based compensation | 36,001 | 40,355 | |||||||||
| Digital asset self-mining revenue | (51,640) | (129,769) | |||||||||
Proceeds from sales of digital assets generated by self-mining revenues(1) | 208,249 | — | |||||||||
| Loss (gain) on fair value of digital assets | 15,926 | (19,109) | |||||||||
| Change in fair value of warrants and contingent value rights | 1,076,314 | 288,494 | |||||||||
| Loss on debt extinguishment | 5,435 | 1,377 | |||||||||
| Changes in operating assets and liabilities: | |||||||||||
| Customer funding receivable and other current assets | (81,842) | (207,550) | |||||||||
| Accounts payable | (35,594) | 133,531 | |||||||||
| Accrued expenses | 155,200 | 70,826 | |||||||||
| Deferred revenue from colocation services | 98,409 | 131,293 | |||||||||
| Other operating assets and liabilities, net | (32,451) | (8,004) | |||||||||
Net cash provided by (used in) operating activities | 230,949 | (11,041) | |||||||||
| Cash flows from Investing Activities: | |||||||||||
| Purchases of property, plant and equipment | (954,244) | (205,259) | |||||||||
| Proceeds from sales of property and equipment | 3,927 | 1,671 | |||||||||
| Acquisitions of land and development rights | (232,500) | — | |||||||||
| Other investing activities | (74) | (5,036) | |||||||||
| Net cash used in investing activities | (1,182,891) | (208,624) | |||||||||
| Cash flows from Financing Activities: | |||||||||||
| Principal payments on debt | — | (8,613) | |||||||||
| Debt extinguishment payments | (1,000,000) | (26,862) | |||||||||
| Taxes paid related to net share settlement of equity awards | (35,310) | — | |||||||||
| Proceeds from the issuance of debt | 4,275,250 | — | |||||||||
| Debt issuance costs | (48,143) | — | |||||||||
| Other financing activities | 158 | (495) | |||||||||
Net cash provided by (used in) financing activities | 3,191,955 | (35,970) | |||||||||
Net increase (decrease) in cash, cash equivalents and restricted cash | 2,240,013 | (255,635) | |||||||||
| Cash, cash equivalents and restricted cash—beginning of period | 311,378 | 836,980 | |||||||||
| Cash, cash equivalents and restricted cash—end of period | $ | 2,551,391 | $ | 581,345 | |||||||
| Supplemental disclosure of other cash flow information: | |||||||||||
| Cash paid for interest, net of capitalized interest | $ | 12,846 | $ | 8,386 | |||||||
| Income tax payments | 652 | $ | 457 | ||||||||
| Supplemental disclosure of non-cash investing and financing activities: | |||||||||||
| Purchases of property, plant and equipment in accounts payable and accrued expense | $ | 127,520 | $ | 129,904 | |||||||
| Reclass of property, plant and equipment to Held for Sale | 33,286 | — | |||||||||
| Operating lease right-of-use assets obtained in exchange for lease obligations | 13,440 | 109 | |||||||||
| Non-cash exercise of warrants | $ | 1,458 | $ | 19,559 | |||||||
-more-
Core Scientific, Inc. First Quarter 2026 Earnings Release - 7 | ||||||||
Reconciliation of cash, cash equivalents, and restricted cash within the Condensed Consolidated Balance Sheets to the amounts shown in the Condensed Consolidated Statements of Cash Flows above: | |||||||||||
| Cash and cash equivalents | $ | 1,769,735 | $ | 581,345 | |||||||
| Restricted cash, current portion | 165,745 | — | |||||||||
| Restricted cash, net of current portion | 615,911 | $ | — | ||||||||
| Total cash, cash equivalents and restricted cash | $ | 2,551,391 | $ | 581,345 | |||||||
(1)Proceeds from digital assets received as noncash revenue consideration liquidated upon management's discretion.
Certain prior year amounts have been reclassified for consistency with the current year presentation.
-more-
Core Scientific, Inc. First Quarter 2026 Earnings Release - 8 | ||||||||
Core Scientific, Inc.
Segment Results
(in thousands, except percentages)
(Unaudited)
| Three Months Ended | Six Months Ended | ||||||||||||||||||||||||||||
| (in thousands, except percentages) | June 30, 2026 | March 31, 2026 | June 30, 2025 | June 30, 2026 | June 30, 2025 | ||||||||||||||||||||||||
| Colocation Segment | |||||||||||||||||||||||||||||
| Colocation revenue: | |||||||||||||||||||||||||||||
| License fees | $ | 98,812 | $ | 59,195 | $ | 7,010 | $ | 158,008 | $ | 13,005 | |||||||||||||||||||
| Power fees passed through to customer | 35,073 | 21,059 | 3,464 | 56,132 | 6,050 | ||||||||||||||||||||||||
| Maintenance and other | 2,784 | (2,715) | 86 | 68 | 78 | ||||||||||||||||||||||||
| Total colocation revenue | 136,669 | 77,539 | 10,560 | 214,208 | 19,133 | ||||||||||||||||||||||||
| Cost of colocation services: | |||||||||||||||||||||||||||||
| Power fees passed through to customer | 35,073 | 21,059 | 3,464 | 56,132 | 6,050 | ||||||||||||||||||||||||
| Depreciation expense | 4,621 | 2,075 | 104 | 6,696 | 171 | ||||||||||||||||||||||||
| Employee compensation | 4,801 | 2,986 | 1,148 | 7,787 | 2,442 | ||||||||||||||||||||||||
| Facility operations expense | 10,381 | 6,755 | 4,336 | 17,136 | 8,187 | ||||||||||||||||||||||||
| Other segment items | 1,810 | 743 | 378 | 2,553 | 686 | ||||||||||||||||||||||||
| Total cost of colocation services | 56,686 | 33,618 | 9,430 | 90,304 | 17,536 | ||||||||||||||||||||||||
| Colocation gross profit | $ | 79,983 | $ | 43,921 | $ | 1,130 | $ | 123,904 | $ | 1,597 | |||||||||||||||||||
| Colocation gross margin | 59 | % | 57 | % | 11 | % | 58 | % | 8 | % | |||||||||||||||||||
| Digital Asset Self-Mining Segment | |||||||||||||||||||||||||||||
| Digital asset self-mining revenue | $ | 21,535 | 30,105 | $ | 62,424 | $ | 51,640 | $ | 129,603 | ||||||||||||||||||||
| Cost of digital asset self-mining: | |||||||||||||||||||||||||||||
| Power fees | 17,861 | 27,271 | 30,720 | 45,131 | 61,039 | ||||||||||||||||||||||||
| Depreciation expense | 9,897 | 13,909 | 18,058 | 23,806 | 37,317 | ||||||||||||||||||||||||
| Employee compensation | 4,052 | 3,527 | 8,272 | 7,579 | 15,607 | ||||||||||||||||||||||||
| Facility operations expense | 1,286 | 1,972 | 2,089 | 3,258 | 5,369 | ||||||||||||||||||||||||
| Other segment items | 604 | 510 | 450 | 1,115 | 1,427 | ||||||||||||||||||||||||
| Total cost of digital asset self-mining | 33,700 | 47,189 | 59,589 | 80,889 | 120,759 | ||||||||||||||||||||||||
Digital Asset Self-Mining gross profit | $ | (12,165) | $ | (17,084) | $ | 2,835 | $ | (29,249) | $ | 8,844 | |||||||||||||||||||
| Digital Asset Self-Mining gross margin | (56) | % | (57) | % | 5 | % | (57) | % | 7 | % | |||||||||||||||||||
| Digital Asset Hosted Mining Segment | |||||||||||||||||||||||||||||
| Digital asset hosted mining revenue from customers | $ | 5,997 | 7,600 | $ | 5,644 | $ | 13,597 | $ | 9,417 | ||||||||||||||||||||
| Cost of digital asset hosted mining services: | |||||||||||||||||||||||||||||
| Power fees | 2,356 | 3,303 | 3,208 | 5,659 | 4,574 | ||||||||||||||||||||||||
| Depreciation expense | 626 | 306 | 334 | 931 | 479 | ||||||||||||||||||||||||
| Employee compensation | 542 | 427 | 779 | 969 | 1,110 | ||||||||||||||||||||||||
| Facility operations expense | 167 | 234 | 220 | 401 | 368 | ||||||||||||||||||||||||
| Other segment items | 80 | 61 | 43 | 142 | 89 | ||||||||||||||||||||||||
| Total cost of digital asset hosted mining services | 3,771 | 4,331 | 4,584 | 8,102 | 6,620 | ||||||||||||||||||||||||
| Digital Asset Hosted Mining gross profit | $ | 2,226 | $ | 3,269 | $ | 1,060 | $ | 5,495 | $ | 2,797 | |||||||||||||||||||
| Digital Asset Hosted Mining gross margin | 37 | % | 43 | % | 19 | % | 40 | % | 30 | % | |||||||||||||||||||
| Consolidated | |||||||||||||||||||||||||||||
| Consolidated total revenue | $ | 164,201 | $ | 115,244 | $ | 78,628 | $ | 279,445 | $ | 158,153 | |||||||||||||||||||
| Consolidated cost of revenue | $ | 94,157 | $ | 85,138 | $ | 73,603 | 0 | $ | 179,295 | — | $ | 144,915 | |||||||||||||||||
| Consolidated gross profit | $ | 70,044 | $ | 30,106 | $ | 5,025 | $ | 100,150 | $ | 13,238 | |||||||||||||||||||
| Consolidated gross margin | 43 | % | 26 | % | 6 | % | 36 | % | 8 | % | |||||||||||||||||||
-more-
Core Scientific, Inc. First Quarter 2026 Earnings Release - 9 | ||||||||
Core Scientific, Inc.
Non-GAAP Financial Measures
(Unaudited)
Adjusted EBITDA is a non-GAAP financial measure defined as our net loss, adjusted to eliminate the effect of (i) interest expense (income), net; (ii) provision for income taxes; (iii) depreciation and amortization; (iv) stock-based compensation expense; (v) loss on disposal and impairment of property, plant and equipment; (vi) loss on remeasurement of assets held for sale; (vii) loss on contract termination; (viii) colocation organizational startup costs primarily related to the initial ramp up of new colocation sits and the conversion of existing facilities to colocation data center operations; (ix) loss on debt extinguishment; (x) change in fair value of warrant and contingent value rights; (xi) loss on legal settlements; (xii) post-emergence bankruptcy advisory costs incurred related to reorganization and (xiii) certain additional non-cash items that do not reflect the performance of our ongoing business operations. For additional information, including the reconciliation of net loss to Adjusted EBITDA, please refer to the table below. We believe Adjusted EBITDA is an important measure because it allows management, investors, and our Board of Directors to evaluate and compare our operating results, including our return on capital and operating efficiencies, from period-to-period by making the adjustments described above. In addition, it provides useful information to investors and others in understanding and evaluating our results of operations, as well as provides a useful measure for period-to-period comparisons of our business, as it removes the effect of net interest expense, taxes, certain non-cash items, variable charges and timing differences. Moreover, we have included Adjusted EBITDA in this earnings release because it is a key measurement used by our management internally to make operating decisions, including those related to operating expenses, evaluate performance, and perform strategic and financial planning.
The above items are excluded from our Adjusted EBITDA measure because these items are non-cash in nature or because the amount and timing of these items are not related to the current results of our core business operations which renders evaluation of our current performance, comparisons of performance between periods and comparisons of our current performance with our competitors less meaningful. However, you should be aware that when evaluating Adjusted EBITDA, we may incur future expenses similar to those excluded when calculating this measure. Our presentation of this measure should not be construed as an inference that its future results will be unaffected by unusual items. Further, this non-GAAP financial measure should not be considered in isolation from, or as a substitute for, financial information prepared in accordance with accounting principles generally accepted in the United States (“GAAP”). We compensate for these limitations by relying primarily on GAAP results and using Adjusted EBITDA on a supplemental basis. Our computation of Adjusted EBITDA may not be comparable to other similarly titled measures computed by other companies because not all companies calculate this measure in the same fashion. You should review the reconciliation of net loss to Adjusted EBITDA below and not rely on any single financial measure to evaluate our business.
-more-
Core Scientific, Inc. First Quarter 2026 Earnings Release - 10 | ||||||||
The following table reconciles the non-GAAP financial measure to the most directly comparable U.S. GAAP financial performance measure, which is net loss, for the periods presented (in thousands):
| Three Months Ended | Six Months Ended | ||||||||||||||||||||||||||||
| June 30, 2026 | March 31, 2026 | June 30, 2025 | June 30, 2026 | June 30, 2025 | |||||||||||||||||||||||||
| Adjusted EBITDA | |||||||||||||||||||||||||||||
| Net loss | $ | (1,155,310) | $ | (347,188) | $ | (936,799) | $ | (1,502,498) | $ | (360,548) | |||||||||||||||||||
| Adjustments: | |||||||||||||||||||||||||||||
Interest expense (income), net | 23,833 | 4,857 | (1,185) | 28,690 | (3,372) | ||||||||||||||||||||||||
| Income tax expense | 1,907 | 600 | 158 | 2,507 | 363 | ||||||||||||||||||||||||
| Depreciation and amortization | 15,498 | 16,648 | 18,756 | 32,146 | 38,487 | ||||||||||||||||||||||||
| Stock-based compensation expense | 13,938 | 13,537 | 19,533 | 27,475 | 32,765 | ||||||||||||||||||||||||
Loss on disposal of property, plant and equipment | 1,273 | 13,638 | 4,166 | 14,911 | 4,172 | ||||||||||||||||||||||||
| Loss on remeasurement of assets held for sale | 19,495 | — | — | 19,495 | — | ||||||||||||||||||||||||
Impairment of property, plant and equipment | — | 266,488 | — | 266,488 | — | ||||||||||||||||||||||||
Colocation organizational and site startup costs(1) | 27,039 | 8,665 | 11,655 | 35,704 | 23,322 | ||||||||||||||||||||||||
| Loss on contract termination | 41,948 | — | — | 41,948 | — | ||||||||||||||||||||||||
Loss on debt extinguishment | 5,435 | — | 1,377 | 5,435 | 1,377 | ||||||||||||||||||||||||
| Change in fair value of warrants and contingent value rights | 1,045,515 | 30,799 | 909,958 | 1,076,314 | 288,494 | ||||||||||||||||||||||||
Loss on legal settlements(2) | — | 500 | — | 500 | — | ||||||||||||||||||||||||
Post-emergence bankruptcy advisory costs(3) | 397 | 317 | 695 | 714 | 1,298 | ||||||||||||||||||||||||
Other | 135 | 27 | 207 | 162 | 364 | ||||||||||||||||||||||||
| Adjusted EBITDA | $ | 41,103 | $ | 8,888 | $ | 28,521 | $ | 49,991 | $ | 26,722 | |||||||||||||||||||
(1)Included in Colocation organizational and site startup costs are costs associated to Stock-based compensation expense of $4.3 million, $4.2 million, and $4.6 million for the three months ended June 30, 2026, March 31, 2026, and June 30, 2025, respectively, and $8.5 million and $7.6 million for the six months ended June 330, 2026 and 2025, respectively. For the six months ended June 30, 2025, there was also $4.4 million in site conversion demolition costs included within this amount.
(2)Included in Other non-operating expense, net on the condensed consolidated statements of operations.
(3)Included in Selling, general and administrative on the condensed consolidated statements of operations.
-more-
Core Scientific, Inc. First Quarter 2026 Earnings Release - 11 | ||||||||
Term Library
| Term (MW) | Definition | How management uses it | ||||||
| Gross Utility Power Capacity | Total electric utility power capacity agreements associated with our data center sites under our control as of period end, including capacity that is commissioned for future use. | Used for portfolio planning and utility power allocation discussions. | ||||||
| Total Leasable Customer Power Capacity | Our estimate of the total non-redundant customer IT load that our data center sites could support in the aggregate as of period end, regardless of whether such capacity has been contracted with customers or remains available for sale. This metric is representative of the amount of power available for customer use in servicing their workloads. | Used to assess total customer usable IT load available for leasing, evaluate leased versus unleased capacity, and plan conversion/development sequencing and sales capacity. | ||||||
| Leased Customer Power Capacity | Power capacity that is committed to customers under executed customer contracts, regardless of whether service has commenced as of period end. | Used to monitor signed customer commitments and contracted backlog and to plan future deployment/commissioning requirements. | ||||||
| Unleased Customer Power Capacity | The portion of Total Leasable Customer Power Capacity not committed under customer contracts as of period end. This metric is calculated as Total Leasable Customer Power Capacity minus Leased Customer Power Capacity. | Used to monitor remaining uncommitted customer IT load and to prioritize incremental contracting and conversion/commissioning plans. | ||||||
| Billable Customer Power Capacity | Portion of Leased Customer Power Capacity for which service has commenced, and we are actively billing as of period end. | Used to monitor in-service customer power that is billing and to track deployment/commissioning pace and near-term revenue ramp. | ||||||
-more-
Core Scientific, Inc. First Quarter 2026 Earnings Release - 12 | ||||||||
/////////////////////////////////////////////////////////////////////////////////////////////////////////////////////////////////////
Please follow us on:
 |  |  | ||||||||||||
https://www.linkedin.com/company/corescientific/
https://twitter.com/core_scientific
https://www.youtube.com/@Core_Scientific
CONTACTS
Investors:
Media:
-end-

Second Quarter 2026 Earnings Call July 28, 2026 1
FORWARD-LOOKING STATEMENTS This presentation includes forward-looking statements within the meaning of Section 27A of the Securities Act of 1933, as amended, (the “Securities Act”) and Section 21E of the Securities Exchange Act of 1934, as amended, (the “Exchange Act”). Forward-looking statements may include words such as “aim,” “estimate,” “plan,” “project,” “forecast,” “goal,” “intend,” “will,” “expect,” “anticipate,” “believe,” “seek,” “target” or other similar expressions that predict or indicate future events or trends or that are not statements of historical matters. These forward-looking statements include, but are not limited to, statements regarding projections, estimates and forecasts of revenue, contracted revenue, and other financial and performance metrics, projections of market opportunity and expectations, the Company’s ability to scale and grow its business, successfully complete construction of its data centers, source sufficient electrical energy, necessary long lead infrastructure components, supplies and equipment, the expected growth of the Company, the Company’s ability to source and retain talent, and our ability to source and acquire suitable additional land and power. These statements are provided for illustrative purposes only and are based on various assumptions, whether or not identified in this presentation, and on the current expectations of the Company’s management. These forward-looking statements are not intended to serve, and must not be relied on by any investor, as a guarantee, an assurance, a prediction or a definitive statement of fact or probability. Actual events and circumstances are difficult or impossible to predict and will differ from assumptions. Many actual events and circumstances are beyond the control of the Company. These forward-looking statements are not guarantees of future performance and are subject to risks, uncertainties and assumptions, known or unknown, that could cause actual results to vary materially from those indicated or anticipated. These risks, assumptions and uncertainties include those described in Part I. Item 1A. — “Risk Factors” of the Company’s Annual Report on Form 10-K for the year ended December 31, 2025, and the Company’s Quarterly Reports on Form 10-Q. If one or more of these risks or uncertainties materializes, or if underlying assumptions prove incorrect, actual results may vary materially from those indicated or anticipated by such forward-looking statements. There may be additional risks that the Company could not presently know or that the Company currently believes are immaterial that could also cause actual results to differ from those contained in the forward-looking statements. In addition, forward-looking statements reflect the Company’s expectations, plans or forecasts of future events and views as of the date of this press release and should not be relied upon as representing the Company’s assessments as of any date subsequent to the date of this press release. The Company anticipates that subsequent events and developments will cause the Company’s assessments to change. However, while the Company may elect to update these forward-looking statements at some point in the future, the Company specifically disclaims any obligation to do so. Accordingly, you should not place undue reliance on these forward-looking statements, which speak only as of the date they are made. 2
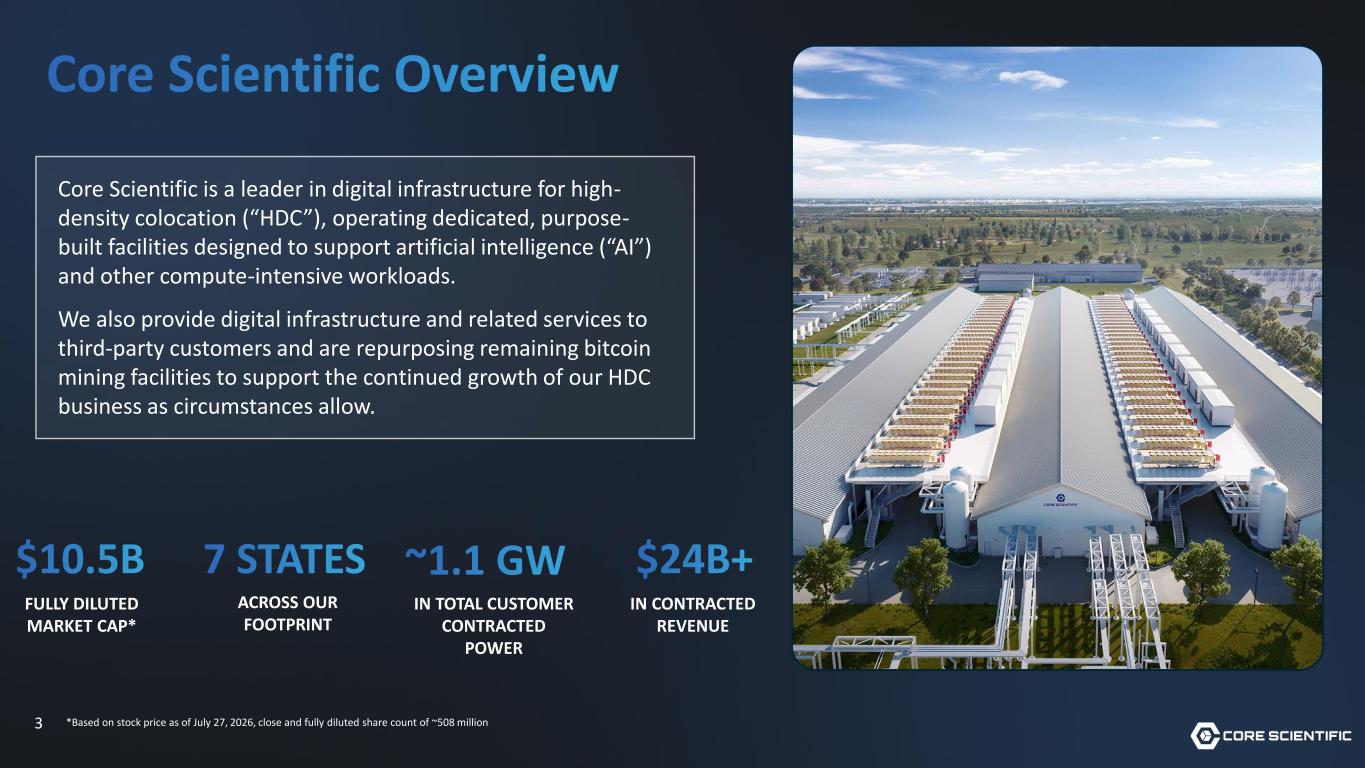
3 Core Scientific Overview Core Scientific is a leader in digital infrastructure for high- density colocation (“HDC”), operating dedicated, purpose- built facilities designed to support artificial intelligence (“AI”) and other compute-intensive workloads. We also provide digital infrastructure and related services to third-party customers and are repurposing remaining bitcoin mining facilities to support the continued growth of our HDC business as circumstances allow. FULLY DILUTED MARKET CAP* 7 STATES ~1.1 GW $24B+ IN TOTAL CUSTOMER CONTRACTED POWER IN CONTRACTED REVENUE ACROSS OUR FOOTPRINT *Based on stock price as of July 27, 2026, close and fully diluted share count of ~508 million $10.5B
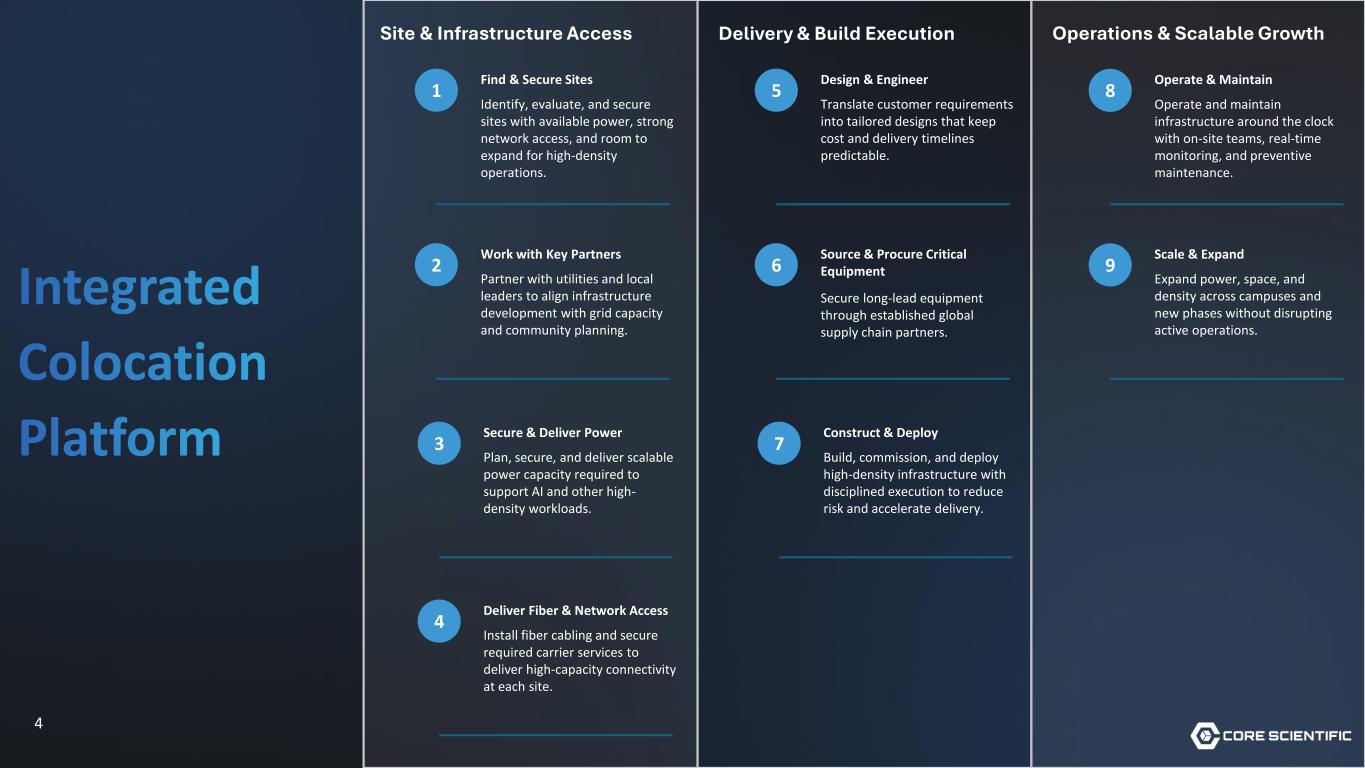
4 Integrated Colocation Platform Site & Infrastructure Access Delivery & Build Execution Operations & Scalable Growth 1 Identify, evaluate, and secure sites with available power, strong network access, and room to expand for high-density operations. Find & Secure Sites 2 Partner with utilities and local leaders to align infrastructure development with grid capacity and community planning. Work with Key Partners 3 Plan, secure, and deliver scalable power capacity required to support AI and other high- density workloads. Secure & Deliver Power 4 Install fiber cabling and secure required carrier services to deliver high-capacity connectivity at each site. Deliver Fiber & Network Access 5 Translate customer requirements into tailored designs that keep cost and delivery timelines predictable. Design & Engineer 6 Secure long-lead equipment through established global supply chain partners. Source & Procure Critical Equipment 7 Build, commission, and deploy high-density infrastructure with disciplined execution to reduce risk and accelerate delivery. Construct & Deploy 8 Operate and maintain infrastructure around the clock with on-site teams, real-time monitoring, and preventive maintenance. Operate & Maintain 9 Expand power, space, and density across campuses and new phases without disrupting active operations. Scale & Expand
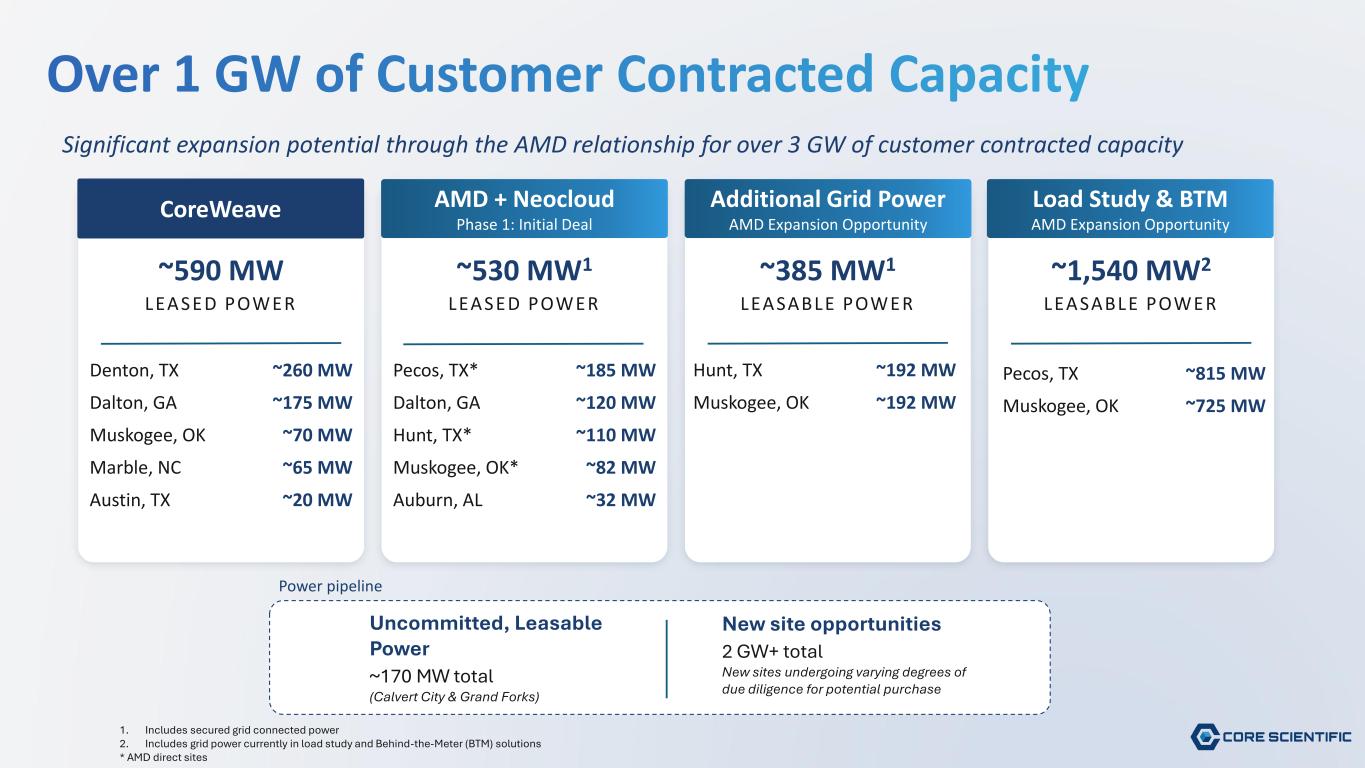
~590 MW LEASED POWER Denton, TX ~260 MW Dalton, GA ~175 MW Muskogee, OK ~70 MW Marble, NC ~65 MW Austin, TX ~20 MW ~530 MW1 LEASED POWER Pecos, TX* ~185 MW Dalton, GA ~120 MW Hunt, TX* ~110 MW Muskogee, OK* ~82 MW Auburn, AL ~32 MW ~385 MW1 LEASABLE POWER ~1,540 MW2 LEASABLE POWER 1. Includes secured grid connected power 2. Includes grid power currently in load study and Behind-the-Meter (BTM) solutions * AMD direct sites Over 1 GW of Customer Contracted Capacity CoreWeave AMD + Neocloud Phase 1: Initial Deal Additional Grid Power AMD Expansion Opportunity Load Study & BTM AMD Expansion Opportunity Significant expansion potential through the AMD relationship for over 3 GW of customer contracted capacity Uncommitted, Leasable Power ~170 MW total (Calvert City & Grand Forks) Power pipeline New site opportunities 2 GW+ total New sites undergoing varying degrees of due diligence for potential purchase Hunt, TX ~192 MW Muskogee, OK ~192 MW Pecos, TX ~815 MW Muskogee, OK ~725 MW
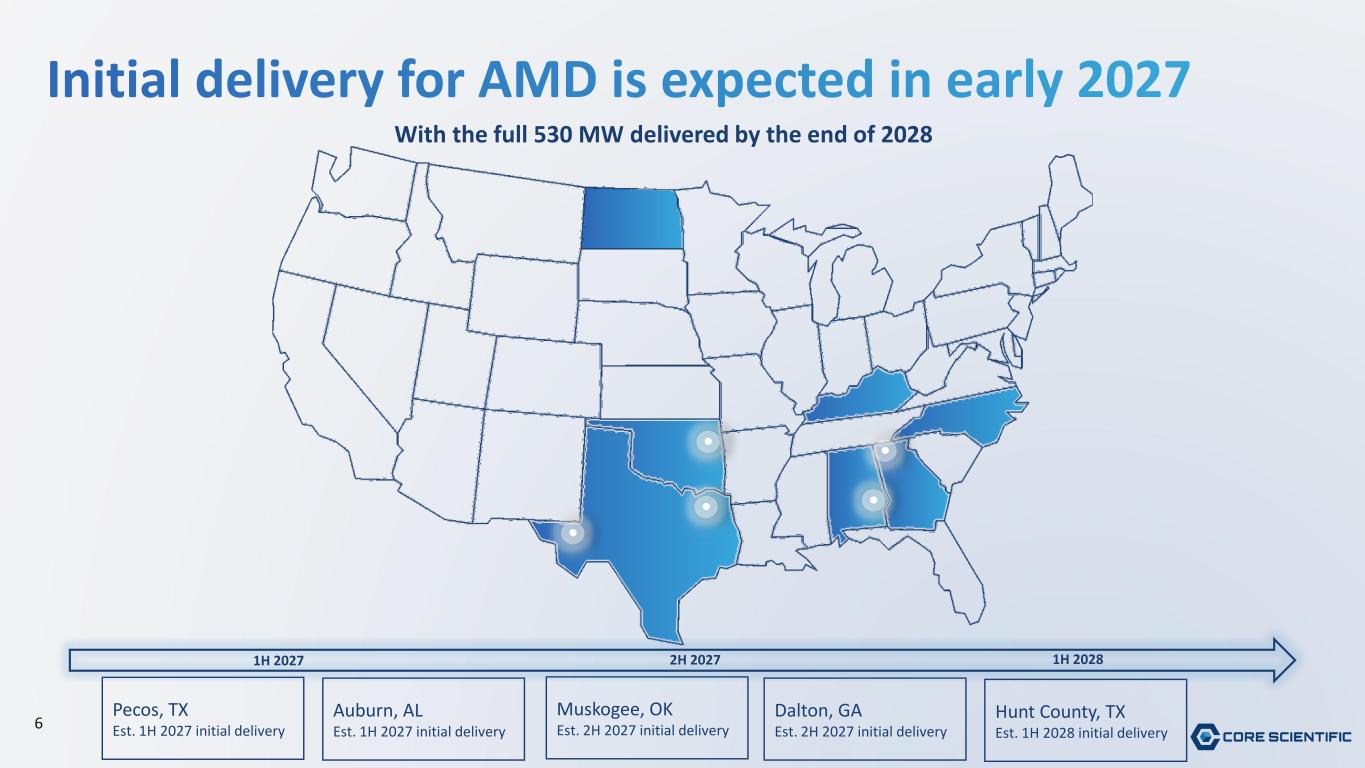
6 Initial delivery for AMD is expected in early 2027 Pecos, TX Est. 1H 2027 initial delivery Hunt County, TX Est. 1H 2028 initial delivery Dalton, GA Est. 2H 2027 initial delivery Muskogee, OK Est. 2H 2027 initial delivery Auburn, AL Est. 1H 2027 initial delivery 1H 2027 2H 2027 1H 2028 With the full 530 MW delivered by the end of 2028
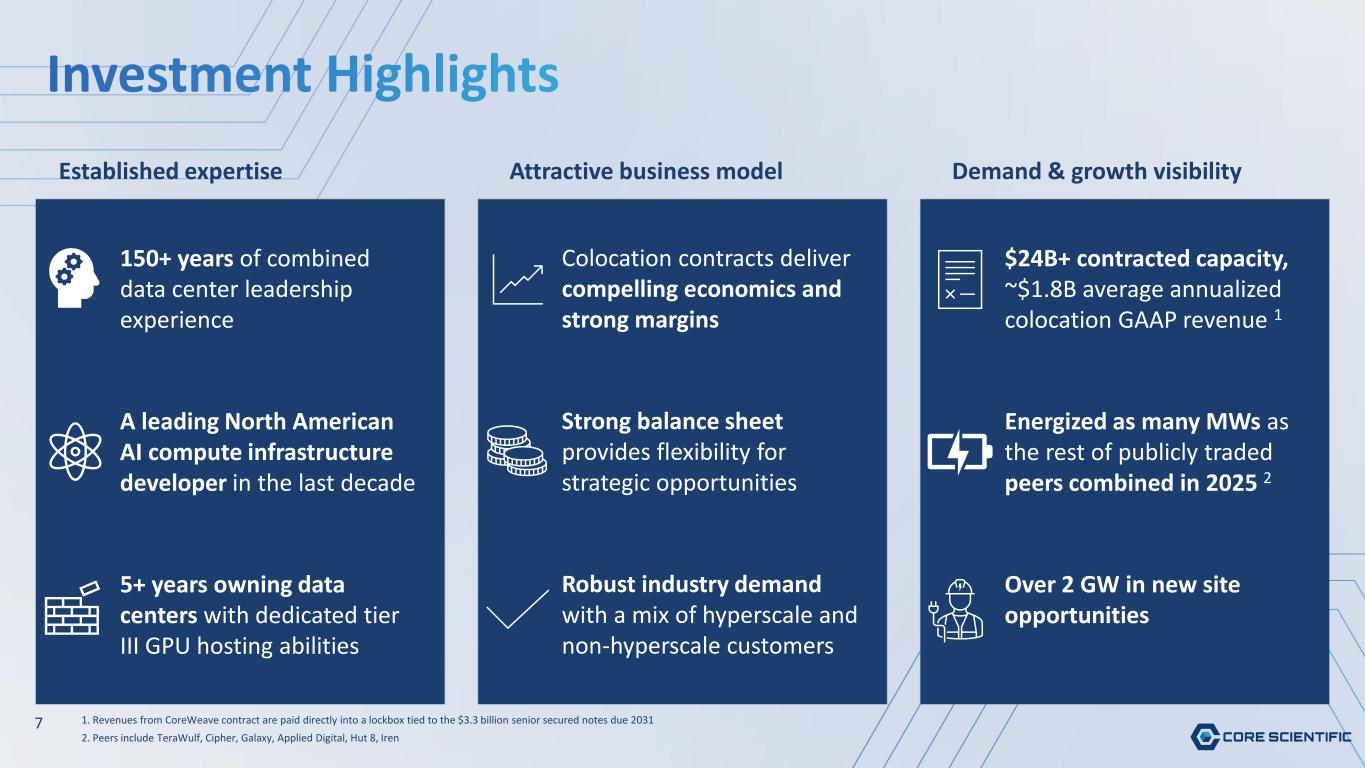
Investment Highlights Established expertise 150+ years of combined data center leadership experience Attractive business model Demand & growth visibility A leading North American AI compute infrastructure developer in the last decade 5+ years owning data centers with dedicated tier III GPU hosting abilities Colocation contracts deliver compelling economics and strong margins Strong balance sheet provides flexibility for strategic opportunities Robust industry demand with a mix of hyperscale and non-hyperscale customers $24B+ contracted capacity, ~$1.8B average annualized colocation GAAP revenue 1 Energized as many MWs as the rest of publicly traded peers combined in 2025 2 Over 2 GW in new site opportunities 7 * 1. Revenues from CoreWeave contract are paid directly into a lockbox tied to the $3.3 billion senior secured notes due 2031 2. Peers include TeraWulf, Cipher, Galaxy, Applied Digital, Hut 8, Iren
CoreWeave Relationship Overview 8
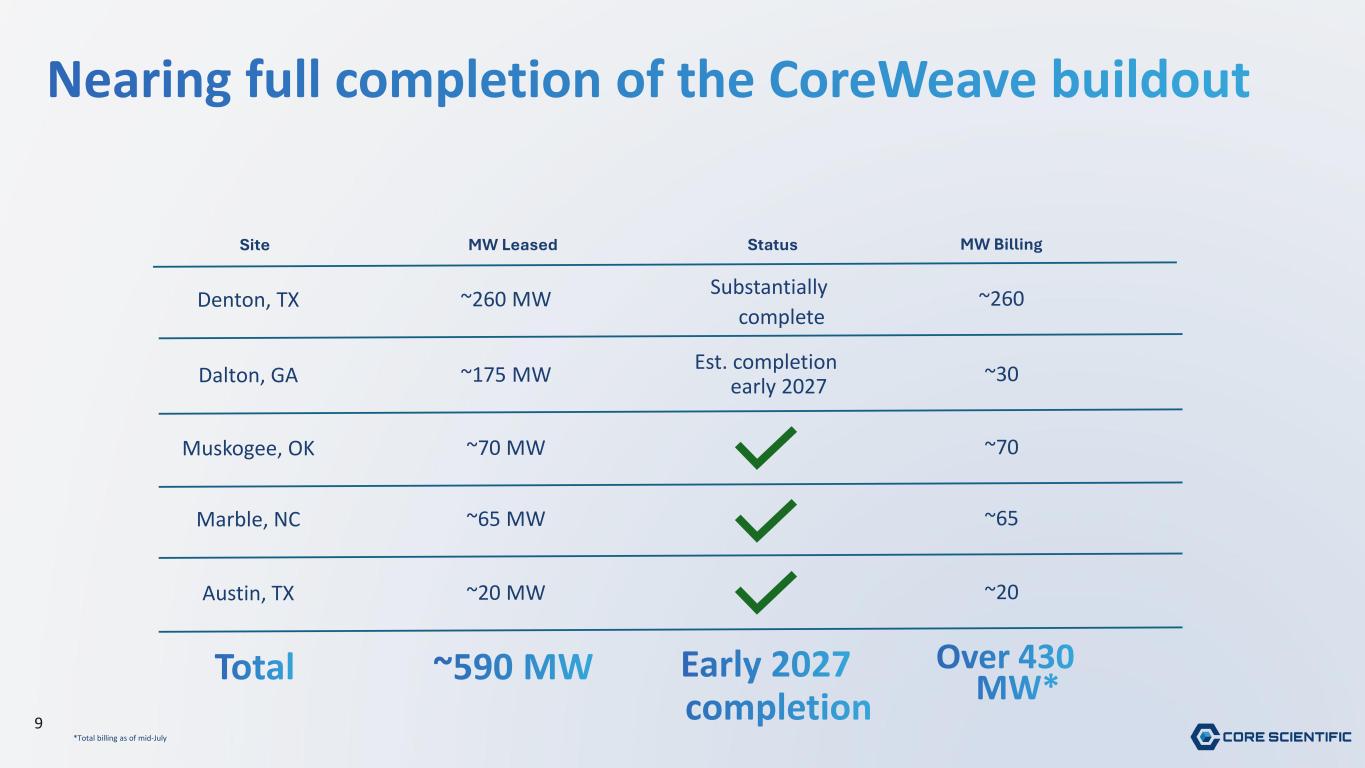
9 Nearing full completion of the CoreWeave buildout Site MW Leased Status MW Billing ~260 MW ~260Denton, TX ~175 MW Est. completion early 2027 ~30Dalton, GA ~70 MW ~70Muskogee, OK ~65 MW ~65Marble, NC ~20 MW ~20Austin, TX Total ~590 MW Early 2027 completion Over 430 MW* *Total billing as of mid-July Substantially complete
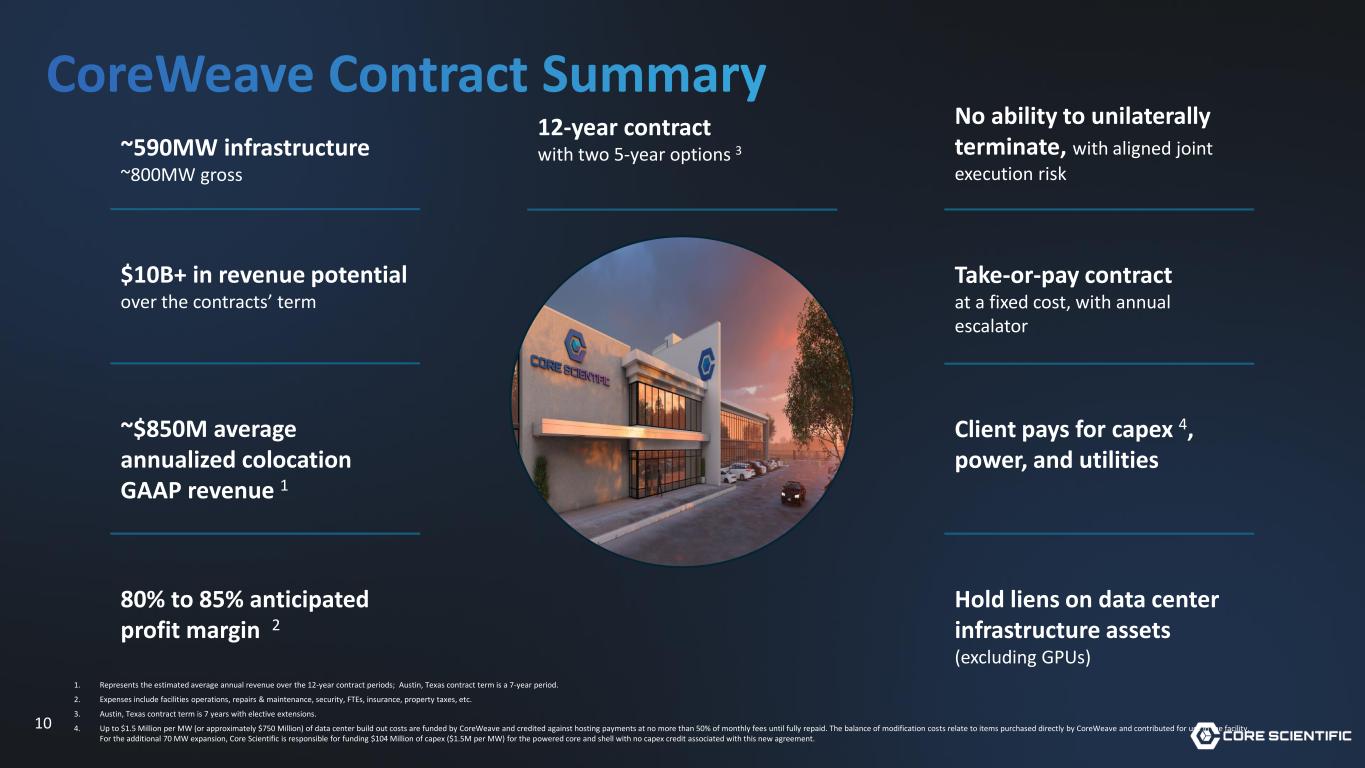
10 CoreWeave Contract Summary ~590MW infrastructure ~800MW gross $10B+ in revenue potential over the contracts’ term ~$850M average annualized colocation GAAP revenue 1 No ability to unilaterally terminate, with aligned joint execution risk Take-or-pay contract at a fixed cost, with annual escalator Client pays for capex 4, power, and utilities 1. Represents the estimated average annual revenue over the 12-year contract periods; Austin, Texas contract term is a 7-year period. 2. Expenses include facilities operations, repairs & maintenance, security, FTEs, insurance, property taxes, etc. 3. Austin, Texas contract term is 7 years with elective extensions. 4. Up to $1.5 Million per MW (or approximately $750 Million) of data center build out costs are funded by CoreWeave and credited against hosting payments at no more than 50% of monthly fees until fully repaid. The balance of modification costs relate to items purchased directly by CoreWeave and contributed for use in the facility. For the additional 70 MW expansion, Core Scientific is responsible for funding $104 Million of capex ($1.5M per MW) for the powered core and shell with no capex credit associated with this new agreement. 12-year contract with two 5-year options 3 80% to 85% anticipated profit margin 2 Hold liens on data center infrastructure assets (excluding GPUs)
11 Appendix
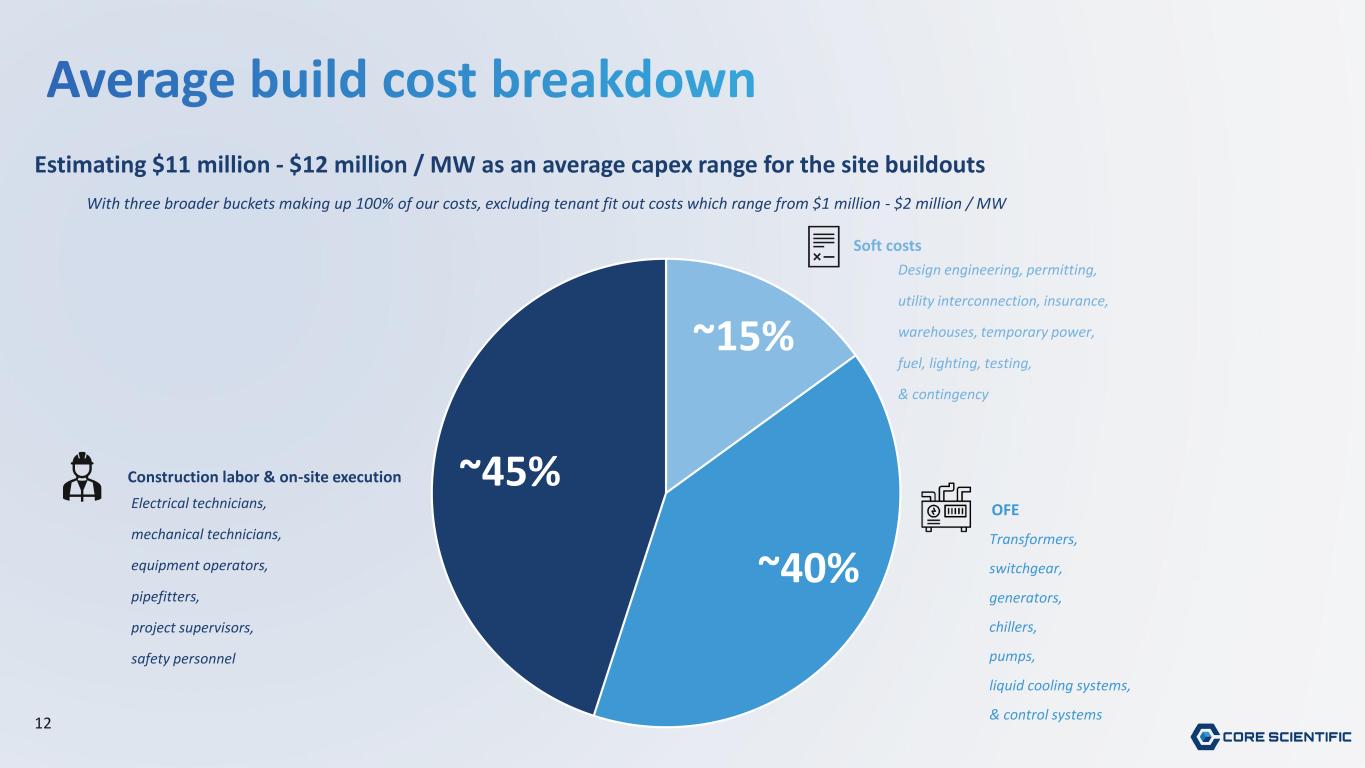
12 Average build cost breakdown Estimating $11 million - $12 million / MW as an average capex range for the site buildouts With three broader buckets making up 100% of our costs, excluding tenant fit out costs which range from $1 million - $2 million / MW ~45% ~40% ~15% Construction labor & on-site execution OFE Soft costs Transformers, switchgear, generators, chillers, pumps, liquid cooling systems, & control systems Design engineering, permitting, utility interconnection, insurance, warehouses, temporary power, fuel, lighting, testing, & contingency Electrical technicians, mechanical technicians, equipment operators, pipefitters, project supervisors, safety personnel
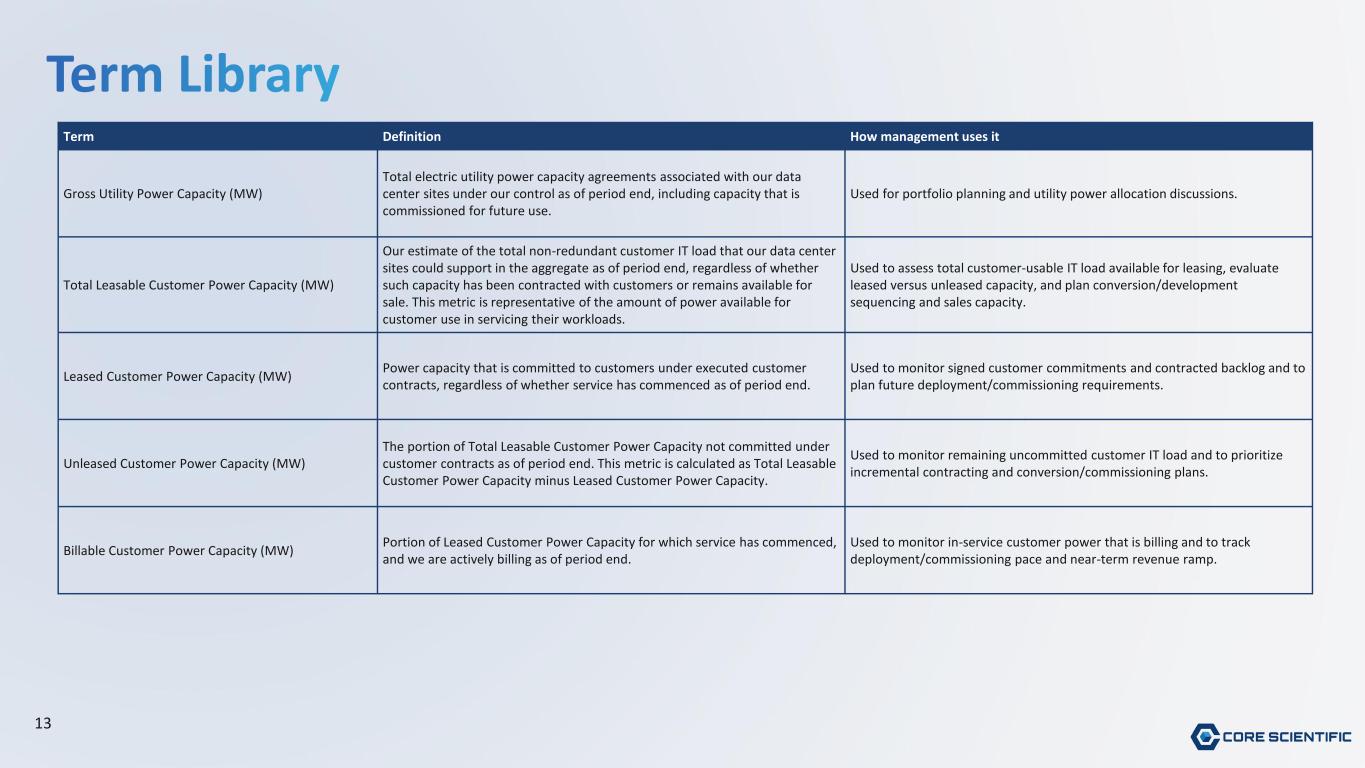
13 Term Library Term Definition How management uses it Gross Utility Power Capacity (MW) Total electric utility power capacity agreements associated with our data center sites under our control as of period end, including capacity that is commissioned for future use. Used for portfolio planning and utility power allocation discussions. Total Leasable Customer Power Capacity (MW) Our estimate of the total non-redundant customer IT load that our data center sites could support in the aggregate as of period end, regardless of whether such capacity has been contracted with customers or remains available for sale. This metric is representative of the amount of power available for customer use in servicing their workloads. Used to assess total customer-usable IT load available for leasing, evaluate leased versus unleased capacity, and plan conversion/development sequencing and sales capacity. Leased Customer Power Capacity (MW) Power capacity that is committed to customers under executed customer contracts, regardless of whether service has commenced as of period end. Used to monitor signed customer commitments and contracted backlog and to plan future deployment/commissioning requirements. Unleased Customer Power Capacity (MW) The portion of Total Leasable Customer Power Capacity not committed under customer contracts as of period end. This metric is calculated as Total Leasable Customer Power Capacity minus Leased Customer Power Capacity. Used to monitor remaining uncommitted customer IT load and to prioritize incremental contracting and conversion/commissioning plans. Billable Customer Power Capacity (MW) Portion of Leased Customer Power Capacity for which service has commenced, and we are actively billing as of period end. Used to monitor in-service customer power that is billing and to track deployment/commissioning pace and near-term revenue ramp.
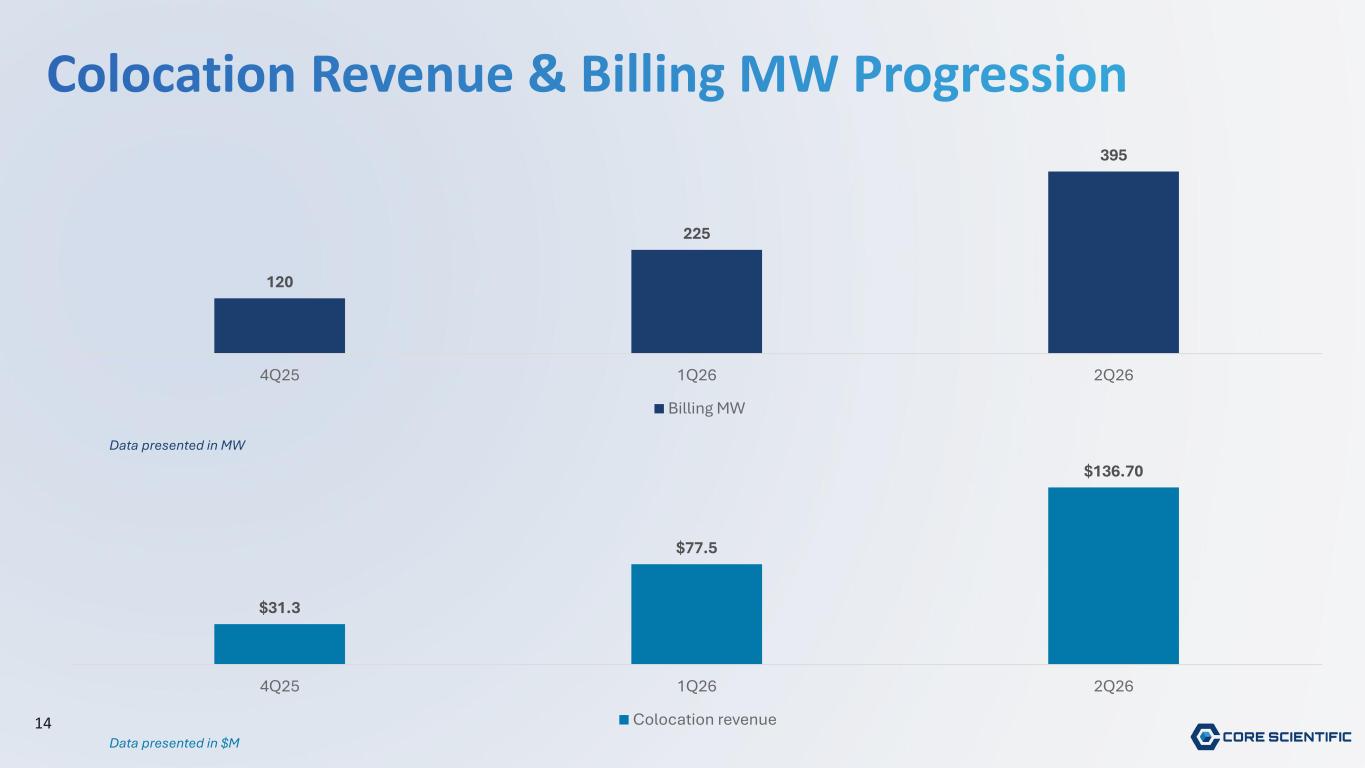
14 Colocation Revenue & Billing MW Progression 120 225 395 4Q25 1Q26 2Q26 Billing MW $31.3 $77.5 $136.70 4Q25 1Q26 2Q26 Colocation revenue Data presented in MW Data presented in $M
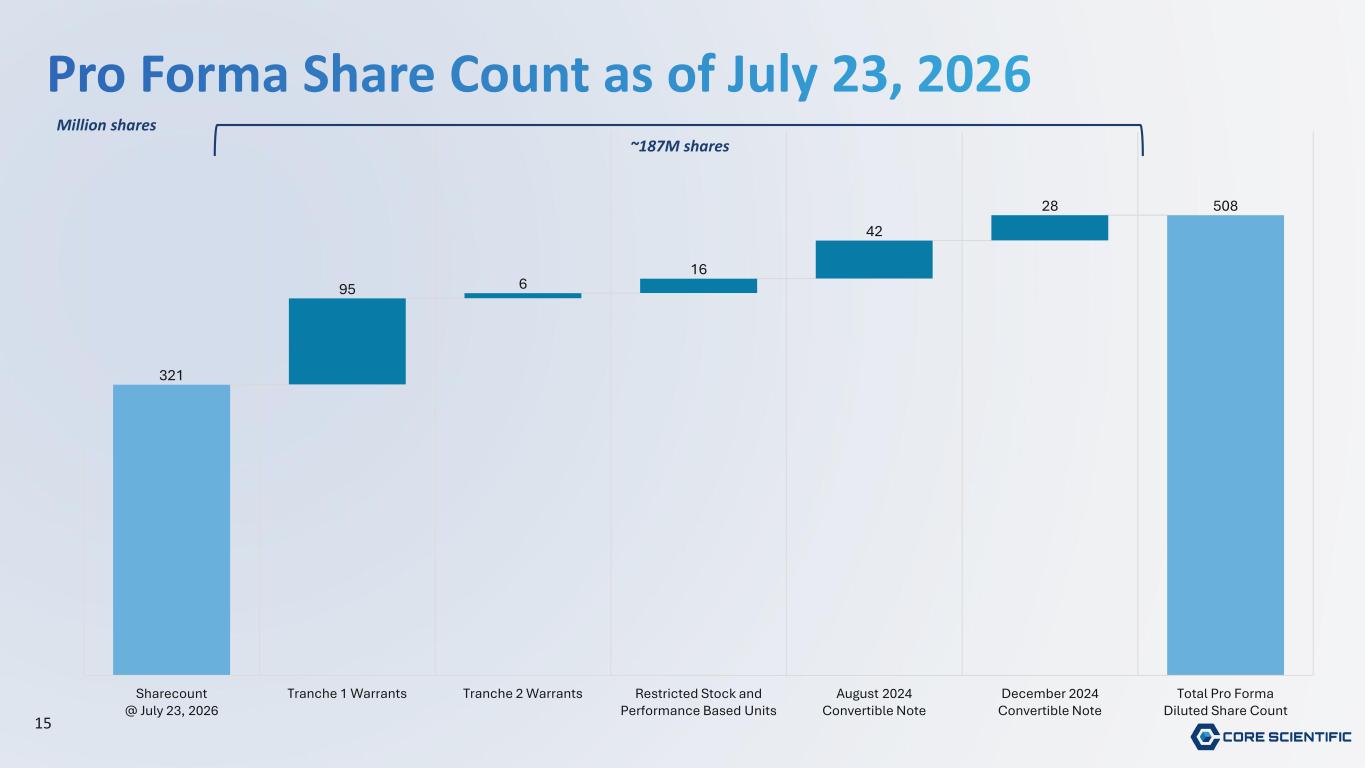
15 Pro Forma Share Count as of July 23, 2026 Million shares ~187M shares 321 95 6 16 42 28 508 Sharecount @ July 23, 2026 Tranche 1 Warrants Tranche 2 Warrants Restricted Stock and Performance Based Units August 2024 Convertible Note December 2024 Convertible Note Total Pro Forma Diluted Share Count