
CTVA 8-K
Corteva, Inc. (CTVA)
8-K
2020-01-30
For: 2020-01-30
View Original
Added on
April 12, 2026
UNITED STATES
SECURITIES AND EXCHANGE COMMISSION
WASHINGTON, D.C. 20549
FORM 8-K
CURRENT REPORT
PURSUANT TO SECTION 13 OR 15(d) OF
THE SECURITIES EXCHANGE ACT OF 1934
Date of Report (Date of Earliest Event Reported): January 30, 2020
(Exact Name of Registrant as Specified in Its Charter)
(State or other jurisdiction | (Commission | (I.R.S. Employer | ||
of Incorporation) | File Number) | Identification No.) | ||
(Address of principal executive offices)(Zip Code)
(302 ) 485-3000
(Registrant’s telephone number, including area code)
Check the appropriate box below if the Form 8-K filing is intended to simultaneously satisfy the filing obligation of the registrant under any of the following provisions:
Securities registered pursuant to Section 12(b) of the Act:
Title of each class | Trading Symbol(s) | Name of each exchange on which registered | ||
Indicate by check mark whether the registrant is an emerging growth company as defined in Rule 405 of the Securities Act of 1933 (§230.405 of this chapter) or Rule 12b-2 of the Securities Exchange Act of 1934 (§240.12b-2 of this chapter).
Emerging growth company ☐
If an emerging growth company, indicate by check mark if the registrant has elected not to use the extended transition period for complying with any new or revised financial accounting standards provided pursuant to Section 13(a) of the Exchange Act. o
Item 2.02 Results of Operations and Financial Condition
On January 30, 2020, Corteva, Inc. (the "Company") announced its consolidated financial results for the quarter and year ended December 31, 2019. A copy of the Company’s press release, financial statement schedules, and related presentation are furnished herewith on Form 8-K as Exhibits 99.1, 99.2, and 99.3, respectively. The information contained in this report, including Exhibits 99.1, 99.2, and 99.3, is being furnished and shall not be deemed “filed” for purposes of Section 18 of the Securities Exchange Act of 1934, as amended (the “Exchange Act”), or otherwise subject to the liability of that section. In addition, the information contained in this report shall not be deemed to be incorporated by reference into any registration statement or other document filed by the Company under the Securities Act of 1933, as amended, or the Exchange Act except as expressly set forth by specific reference in such filing.
Item 9.01 Financial Statements and Exhibits
(d) | Exhibits. |
SIGNATURE
Pursuant to the requirements of the Securities Exchange Act of 1934, the Registrant has duly caused this report to be signed on its behalf by the undersigned hereunto duly authorized.
CORTEVA, INC. | |
(Registrant) | |
/s/ Brian Titus | |
Brian Titus | |
Vice President and Controller | |
January 30, 2020
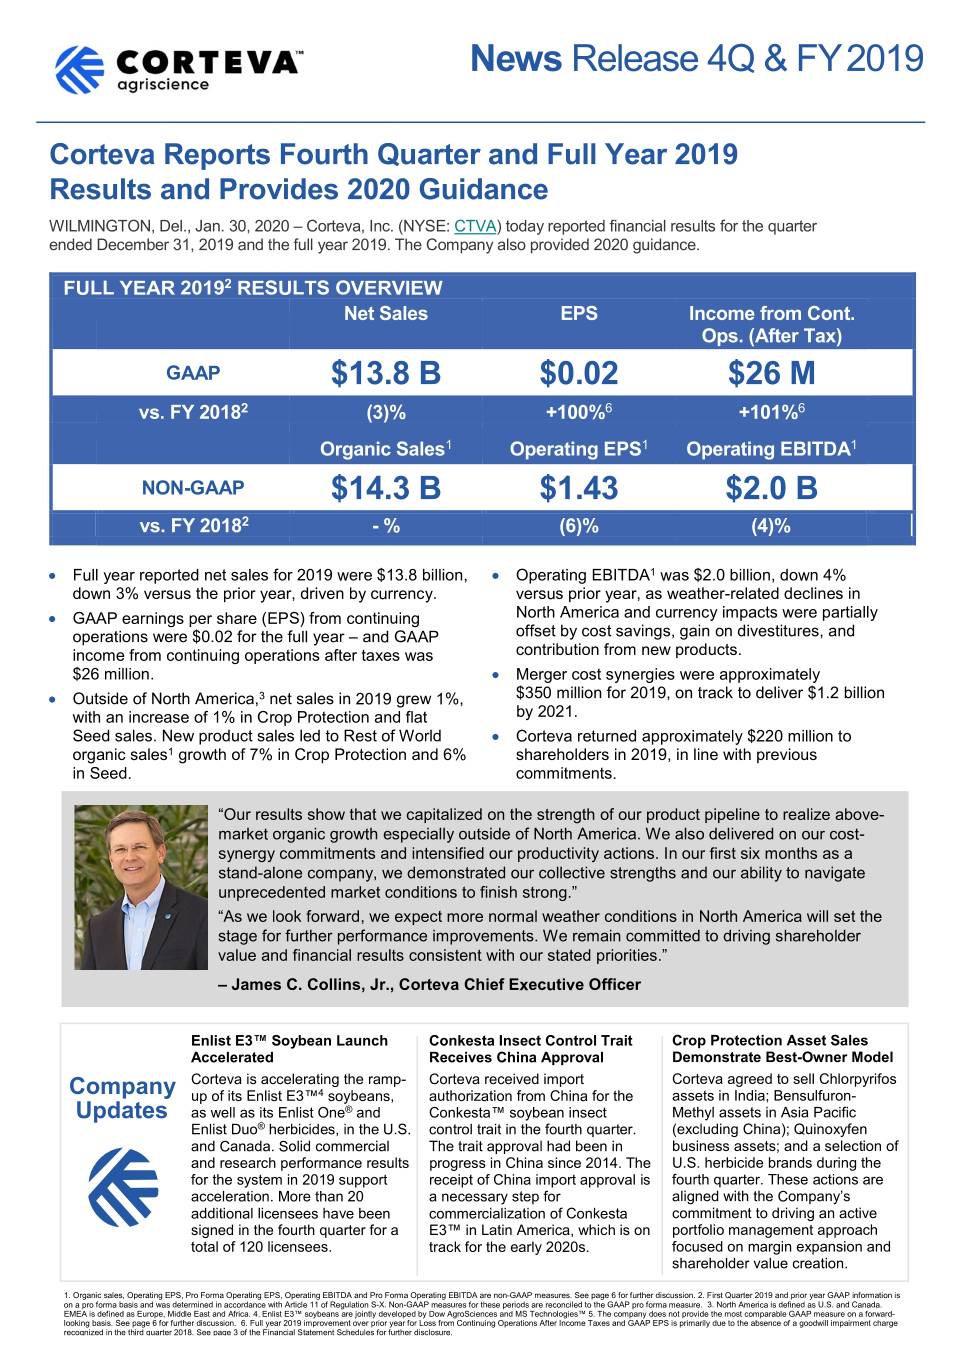
News Release 4Q & FY 2019 Corteva Reports Fourth Quarter and Full Year 2019 Results and Provides 2020 Guidance WILMINGTON, Del., Jan. 30, 2020 – Corteva, Inc. (NYSE: CTVA) today reported financial results for the quarter ended December 31, 2019 and the full year 2019. The Company also provided 2020 guidance. FULL YEAR 20192 RESULTS OVERVIEW Net Sales EPS Income from Cont. Ops. (After Tax) GAAP $13.8 B $0.02 $26 M vs. FY 20182 (3)% +100%6 +101%6 Organic Sales1 Operating EPS1 Operating EBITDA1 NON-GAAP $14.3 B $1.43 $2.0 B vs. FY 20182 - % (6)% (4)% • Full year reported net sales for 2019 were $13.8 billion, • Operating EBITDA1 was $2.0 billion, down 4% down 3% versus the prior year, driven by currency. versus prior year, as weather-related declines in • GAAP earnings per share (EPS) from continuing North America and currency impacts were partially operations were $0.02 for the full year – and GAAP offset by cost savings, gain on divestitures, and income from continuing operations after taxes was contribution from new products. $26 million. • Merger cost synergies were approximately • Outside of North America,3 net sales in 2019 grew 1%, $350 million for 2019, on track to deliver $1.2 billion with an increase of 1% in Crop Protection and flat by 2021. Seed sales. New product sales led to Rest of World • Corteva returned approximately $220 million to organic sales1 growth of 7% in Crop Protection and 6% shareholders in 2019, in line with previous in Seed. commitments. “Our results show that we capitalized on the strength of our product pipeline to realize above- market organic growth especially outside of North America. We also delivered on our cost- synergy commitments and intensified our productivity actions. In our first six months as a stand-alone company, we demonstrated our collective strengths and our ability to navigate unprecedented market conditions to finish strong.” “As we look forward, we expect more normal weather conditions in North America will set the stage for further performance improvements. We remain committed to driving shareholder value and financial results consistent with our stated priorities.” – James C. Collins, Jr., Corteva Chief Executive Officer Enlist E3™ Soybean Launch Conkesta Insect Control Trait Crop Protection Asset Sales Accelerated Receives China Approval Demonstrate Best-Owner Model Corteva is accelerating the ramp- Corteva received import Corteva agreed to sell Chlorpyrifos Company up of its Enlist E3™4 soybeans, authorization from China for the assets in India; Bensulfuron- Updates as well as its Enlist One® and Conkesta™ soybean insect Methyl assets in Asia Pacific Enlist Duo® herbicides, in the U.S. control trait in the fourth quarter. (excluding China); Quinoxyfen and Canada. Solid commercial The trait approval had been in business assets; and a selection of and research performance results progress in China since 2014. The U.S. herbicide brands during the for the system in 2019 support receipt of China import approval is fourth quarter. These actions are acceleration. More than 20 a necessary step for aligned with the Company’s additional licensees have been commercialization of Conkesta commitment to driving an active signed in the fourth quarter for a E3™ in Latin America, which is on portfolio management approach total of 120 licensees. track for the early 2020s. focused on margin expansion and shareholder value creation. 1. Organic sales, Operating EPS, Pro Forma Operating EPS, Operating EBITDA and Pro Forma Operating EBITDA are non-GAAP measures. See page 6 for further discussion. 2. First Quarter 2019 and prior year GAAP information is on a pro forma basis and was determined in accordance with Article 11 of Regulation S-X. Non-GAAP measures for these periods are reconciled to the GAAP pro forma measure. 3. North America is defined as U.S. and Canada. EMEA is defined as Europe, Middle East and Africa. 4. Enlist E3™ soybeans are jointly developed by Dow AgroSciences and MS Technologies™ 5. The company does not provide the most comparable GAAP measure on a forward- looking basis. See page 6 for further discussion. 6. Full year 2019 improvement over prior year for Loss from Continuing Operations After Income Taxes and GAAP EPS is primarily due to the absence of a goodwill impairment charge recognized in the third quarter 2018. See page 3 of the Financial Statement Schedules for further disclosure.
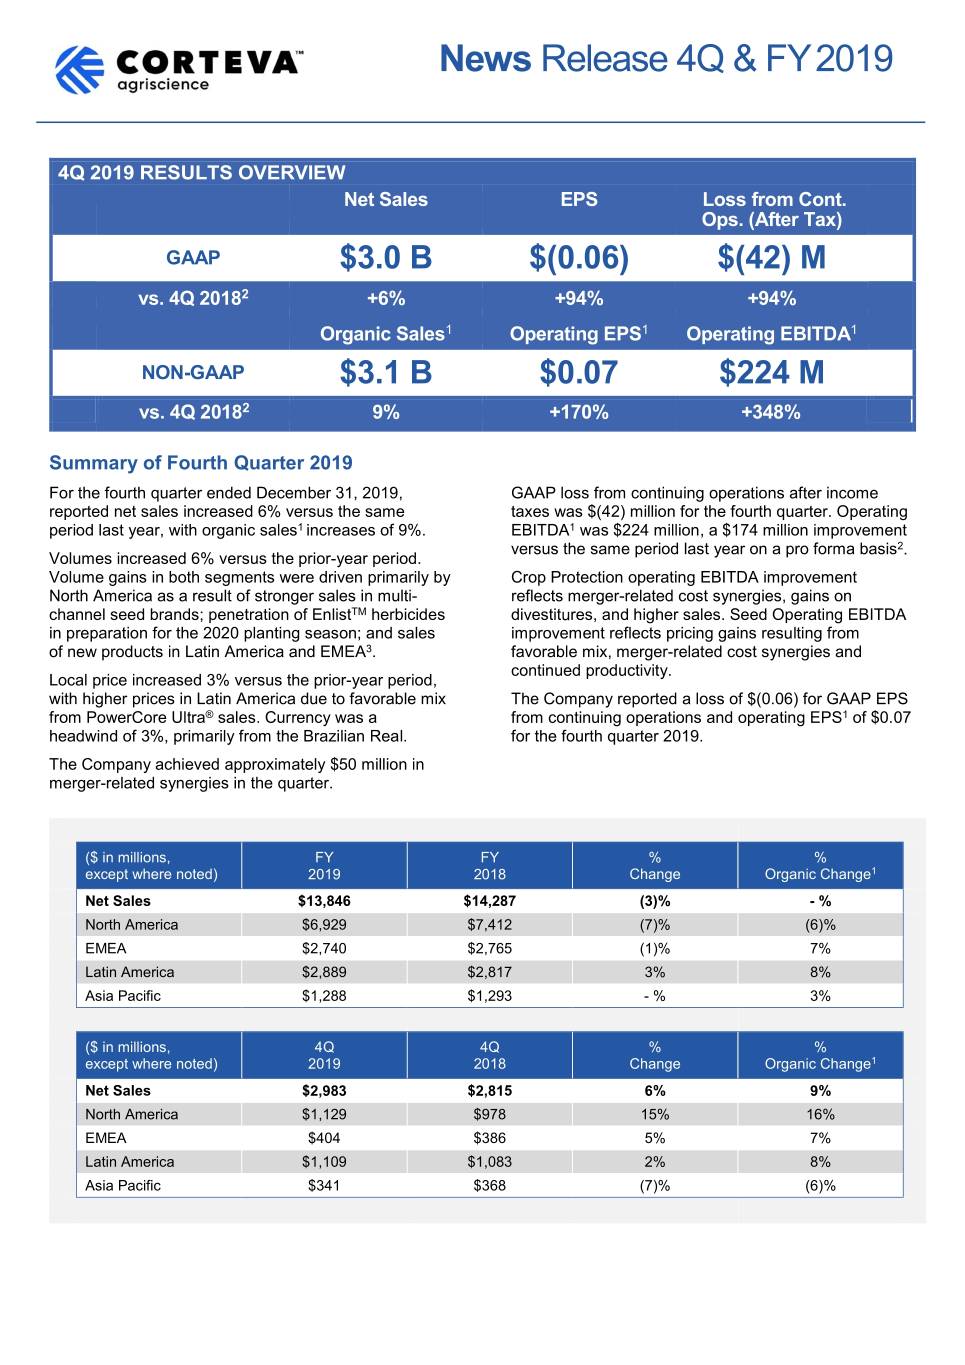
News Release 4Q & FY 2019 4Q 2019 RESULTS OVERVIEW Net Sales EPS Loss from Cont. Ops. (After Tax) GAAP $3.0 B $(0.06) $(42) M vs. 4Q 20182 +6% +94% +94% Organic Sales1 Operating EPS1 Operating EBITDA1 NON-GAAP $3.1 B $0.07 $224 M vs. 4Q 20182 9% +170% +348% Summary of Fourth Quarter 2019 For the fourth quarter ended December 31, 2019, GAAP loss from continuing operations after income reported net sales increased 6% versus the same taxes was $(42) million for the fourth quarter. Operating period last year, with organic sales1 increases of 9%. EBITDA1 was $224 million, a $174 million improvement versus the same period last year on a pro forma basis2. Volumes increased 6% versus the prior-year period. Volume gains in both segments were driven primarily by Crop Protection operating EBITDA improvement North America as a result of stronger sales in multi- reflects merger-related cost synergies, gains on channel seed brands; penetration of EnlistTM herbicides divestitures, and higher sales. Seed Operating EBITDA in preparation for the 2020 planting season; and sales improvement reflects pricing gains resulting from of new products in Latin America and EMEA3. favorable mix, merger-related cost synergies and continued productivity. Local price increased 3% versus the prior-year period, with higher prices in Latin America due to favorable mix The Company reported a loss of $(0.06) for GAAP EPS from PowerCore Ultra® sales. Currency was a from continuing operations and operating EPS1 of $0.07 headwind of 3%, primarily from the Brazilian Real. for the fourth quarter 2019. The Company achieved approximately $50 million in merger-related synergies in the quarter. ($ in millions, FY FY % % except where noted) 2019 2018 Change Organic Change1 Net Sales $13,846 $14,287 (3)% - % North America $6,929 $7,412 (7)% (6)% EMEA $2,740 $2,765 (1)% 7% Latin America $2,889 $2,817 3% 8% Asia Pacific $1,288 $1,293 - % 3% ($ in millions, 4Q 4Q % % except where noted) 2019 2018 Change Organic Change1 Net Sales $2,983 $2,815 6% 9% North America $1,129 $978 15% 16% EMEA $404 $386 5% 7% Latin America $1,109 $1,083 2% 8% Asia Pacific $341 $368 (7)% (6)%
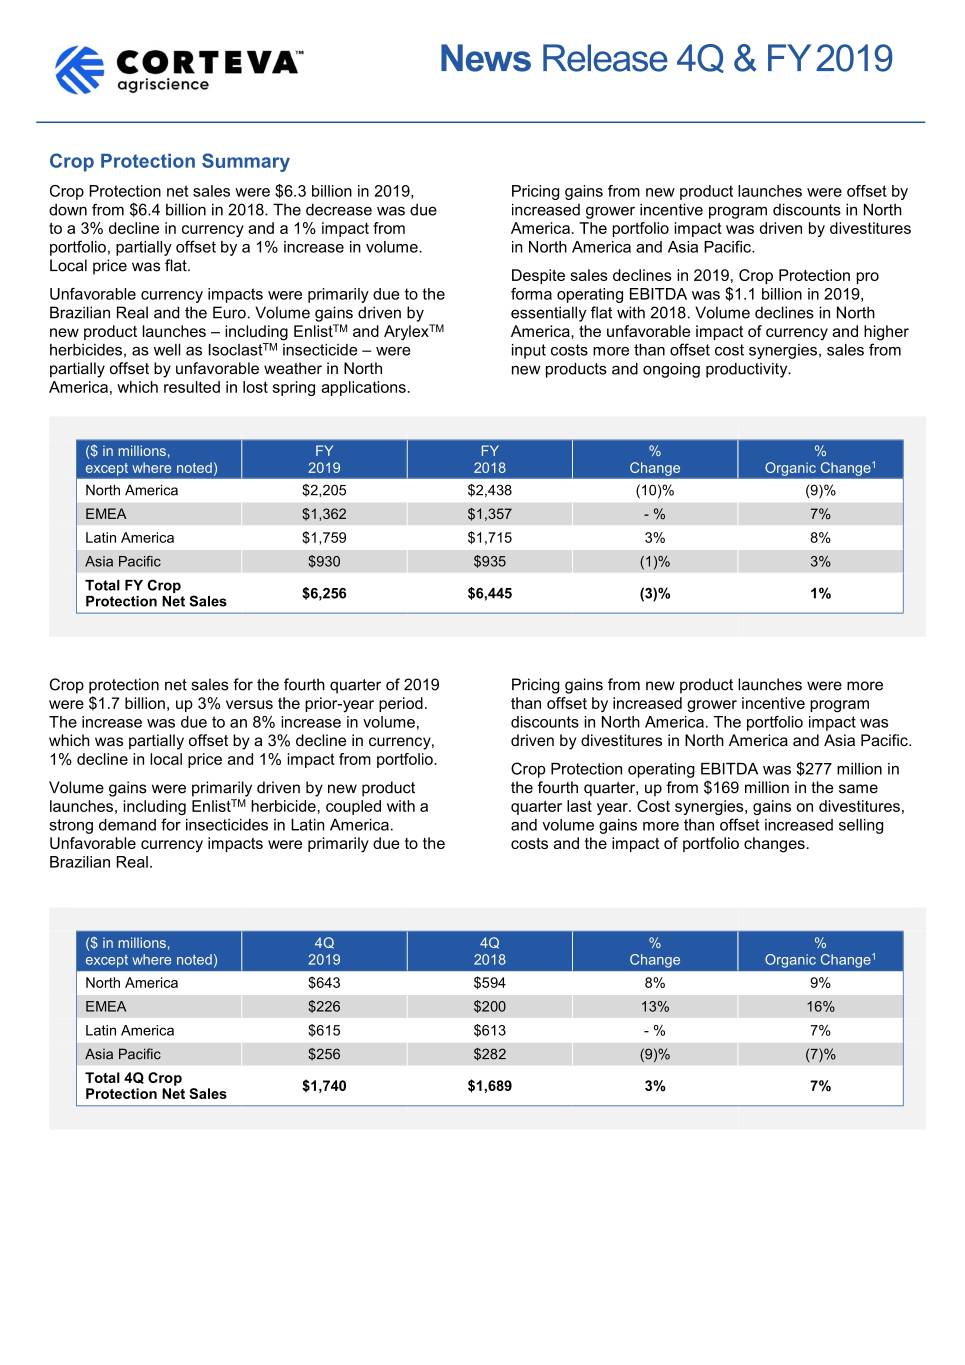
News Release 4Q & FY 2019 Crop Protection Summary Crop Protection net sales were $6.3 billion in 2019, Pricing gains from new product launches were offset by down from $6.4 billion in 2018. The decrease was due increased grower incentive program discounts in North to a 3% decline in currency and a 1% impact from America. The portfolio impact was driven by divestitures portfolio, partially offset by a 1% increase in volume. in North America and Asia Pacific. Local price was flat. Despite sales declines in 2019, Crop Protection pro Unfavorable currency impacts were primarily due to the forma operating EBITDA was $1.1 billion in 2019, Brazilian Real and the Euro. Volume gains driven by essentially flat with 2018. Volume declines in North new product launches – including EnlistTM and ArylexTM America, the unfavorable impact of currency and higher herbicides, as well as IsoclastTM insecticide – were input costs more than offset cost synergies, sales from partially offset by unfavorable weather in North new products and ongoing productivity. America, which resulted in lost spring applications. ($ in millions, FY FY % % except where noted) 2019 2018 Change Organic Change1 North America $2,205 $2,438 (10)% (9)% EMEA $1,362 $1,357 - % 7% Latin America $1,759 $1,715 3% 8% Asia Pacific $930 $935 (1)% 3% Total FY Crop $6,256 $6,445 (3)% 1% Protection Net Sales Crop protection net sales for the fourth quarter of 2019 Pricing gains from new product launches were more were $1.7 billion, up 3% versus the prior-year period. than offset by increased grower incentive program The increase was due to an 8% increase in volume, discounts in North America. The portfolio impact was which was partially offset by a 3% decline in currency, driven by divestitures in North America and Asia Pacific. 1% decline in local price and 1% impact from portfolio. Crop Protection operating EBITDA was $277 million in Volume gains were primarily driven by new product the fourth quarter, up from $169 million in the same launches, including EnlistTM herbicide, coupled with a quarter last year. Cost synergies, gains on divestitures, strong demand for insecticides in Latin America. and volume gains more than offset increased selling Unfavorable currency impacts were primarily due to the costs and the impact of portfolio changes. Brazilian Real. ($ in millions, 4Q 4Q % % except where noted) 2019 2018 Change Organic Change1 North America $643 $594 8% 9% EMEA $226 $200 13% 16% Latin America $615 $613 - % 7% Asia Pacific $256 $282 (9)% (7)% Total 4Q Crop $1,740 $1,689 3% 7% Protection Net Sales
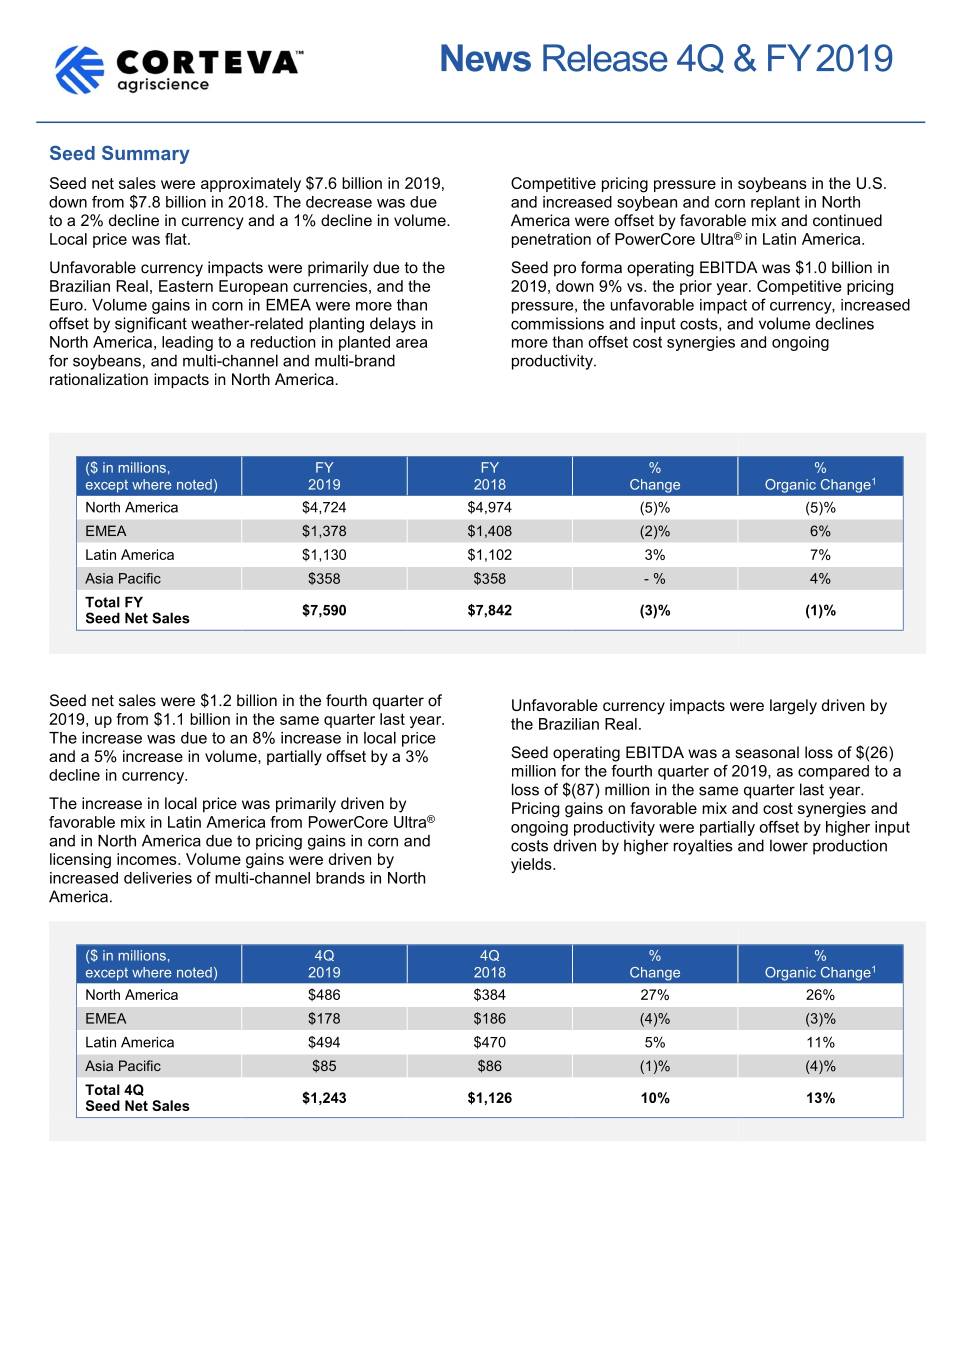
News Release 4Q & FY 2019 Seed Summary Seed net sales were approximately $7.6 billion in 2019, Competitive pricing pressure in soybeans in the U.S. down from $7.8 billion in 2018. The decrease was due and increased soybean and corn replant in North to a 2% decline in currency and a 1% decline in volume. America were offset by favorable mix and continued Local price was flat. penetration of PowerCore Ultra® in Latin America. Unfavorable currency impacts were primarily due to the Seed pro forma operating EBITDA was $1.0 billion in Brazilian Real, Eastern European currencies, and the 2019, down 9% vs. the prior year. Competitive pricing Euro. Volume gains in corn in EMEA were more than pressure, the unfavorable impact of currency, increased offset by significant weather-related planting delays in commissions and input costs, and volume declines North America, leading to a reduction in planted area more than offset cost synergies and ongoing for soybeans, and multi-channel and multi-brand productivity. rationalization impacts in North America. ($ in millions, FY FY % % except where noted) 2019 2018 Change Organic Change1 North America $4,724 $4,974 (5)% (5)% EMEA $1,378 $1,408 (2)% 6% Latin America $1,130 $1,102 3% 7% Asia Pacific $358 $358 - % 4% Total FY $7,590 $7,842 (3)% (1)% Seed Net Sales Seed net sales were $1.2 billion in the fourth quarter of Unfavorable currency impacts were largely driven by 2019, up from $1.1 billion in the same quarter last year. the Brazilian Real. The increase was due to an 8% increase in local price and a 5% increase in volume, partially offset by a 3% Seed operating EBITDA was a seasonal loss of $(26) decline in currency. million for the fourth quarter of 2019, as compared to a loss of $(87) million in the same quarter last year. The increase in local price was primarily driven by Pricing gains on favorable mix and cost synergies and ® favorable mix in Latin America from PowerCore Ultra ongoing productivity were partially offset by higher input and in North America due to pricing gains in corn and costs driven by higher royalties and lower production licensing incomes. Volume gains were driven by yields. increased deliveries of multi-channel brands in North America. ($ in millions, 4Q 4Q % % except where noted) 2019 2018 Change Organic Change1 North America $486 $384 27% 26% EMEA $178 $186 (4)% (3)% Latin America $494 $470 5% 11% Asia Pacific $85 $86 (1)% (4)% Total 4Q $1,243 $1,126 10% 13% Seed Net Sales
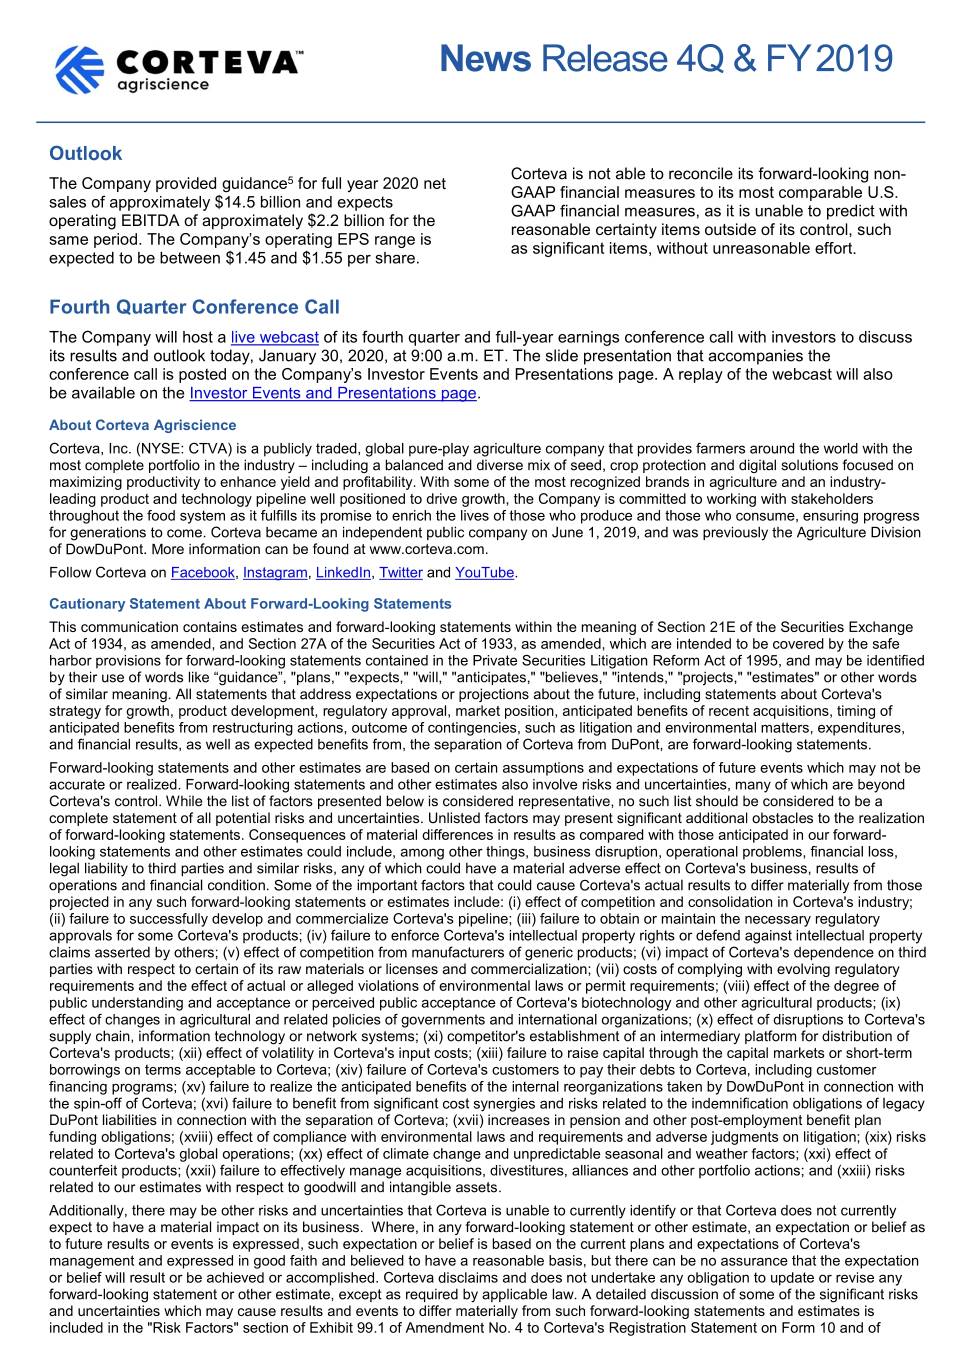
News Release 4Q & FY 2019 Outlook Corteva is not able to reconcile its forward-looking non- The Company provided guidance5 for full year 2020 net GAAP financial measures to its most comparable U.S. sales of approximately $14.5 billion and expects GAAP financial measures, as it is unable to predict with operating EBITDA of approximately $2.2 billion for the reasonable certainty items outside of its control, such same period. The Company’s operating EPS range is as significant items, without unreasonable effort. expected to be between $1.45 and $1.55 per share. Fourth Quarter Conference Call The Company will host a live webcast of its fourth quarter and full-year earnings conference call with investors to discuss its results and outlook today, January 30, 2020, at 9:00 a.m. ET. The slide presentation that accompanies the conference call is posted on the Company’s Investor Events and Presentations page. A replay of the webcast will also be available on the Investor Events and Presentations page. About Corteva Agriscience Corteva, Inc. (NYSE: CTVA) is a publicly traded, global pure-play agriculture company that provides farmers around the world with the most complete portfolio in the industry – including a balanced and diverse mix of seed, crop protection and digital solutions focused on maximizing productivity to enhance yield and profitability. With some of the most recognized brands in agriculture and an industry- leading product and technology pipeline well positioned to drive growth, the Company is committed to working with stakeholders throughout the food system as it fulfills its promise to enrich the lives of those who produce and those who consume, ensuring progress for generations to come. Corteva became an independent public company on June 1, 2019, and was previously the Agriculture Division of DowDuPont. More information can be found at www.corteva.com. Follow Corteva on Facebook, Instagram, LinkedIn, Twitter and YouTube. Cautionary Statement About Forward-Looking Statements This communication contains estimates and forward-looking statements within the meaning of Section 21E of the Securities Exchange Act of 1934, as amended, and Section 27A of the Securities Act of 1933, as amended, which are intended to be covered by the safe harbor provisions for forward-looking statements contained in the Private Securities Litigation Reform Act of 1995, and may be identified by their use of words like “guidance”, "plans," "expects," "will," "anticipates," "believes," "intends," "projects," "estimates" or other words of similar meaning. All statements that address expectations or projections about the future, including statements about Corteva's strategy for growth, product development, regulatory approval, market position, anticipated benefits of recent acquisitions, timing of anticipated benefits from restructuring actions, outcome of contingencies, such as litigation and environmental matters, expenditures, and financial results, as well as expected benefits from, the separation of Corteva from DuPont, are forward-looking statements. Forward-looking statements and other estimates are based on certain assumptions and expectations of future events which may not be accurate or realized. Forward-looking statements and other estimates also involve risks and uncertainties, many of which are beyond Corteva's control. While the list of factors presented below is considered representative, no such list should be considered to be a complete statement of all potential risks and uncertainties. Unlisted factors may present significant additional obstacles to the realization of forward-looking statements. Consequences of material differences in results as compared with those anticipated in our forward- looking statements and other estimates could include, among other things, business disruption, operational problems, financial loss, legal liability to third parties and similar risks, any of which could have a material adverse effect on Corteva's business, results of operations and financial condition. Some of the important factors that could cause Corteva's actual results to differ materially from those projected in any such forward-looking statements or estimates include: (i) effect of competition and consolidation in Corteva's industry; (ii) failure to successfully develop and commercialize Corteva's pipeline; (iii) failure to obtain or maintain the necessary regulatory approvals for some Corteva's products; (iv) failure to enforce Corteva's intellectual property rights or defend against intellectual property claims asserted by others; (v) effect of competition from manufacturers of generic products; (vi) impact of Corteva's dependence on third parties with respect to certain of its raw materials or licenses and commercialization; (vii) costs of complying with evolving regulatory requirements and the effect of actual or alleged violations of environmental laws or permit requirements; (viii) effect of the degree of public understanding and acceptance or perceived public acceptance of Corteva's biotechnology and other agricultural products; (ix) effect of changes in agricultural and related policies of governments and international organizations; (x) effect of disruptions to Corteva's supply chain, information technology or network systems; (xi) competitor's establishment of an intermediary platform for distribution of Corteva's products; (xii) effect of volatility in Corteva's input costs; (xiii) failure to raise capital through the capital markets or short-term borrowings on terms acceptable to Corteva; (xiv) failure of Corteva's customers to pay their debts to Corteva, including customer financing programs; (xv) failure to realize the anticipated benefits of the internal reorganizations taken by DowDuPont in connection with the spin-off of Corteva; (xvi) failure to benefit from significant cost synergies and risks related to the indemnification obligations of legacy DuPont liabilities in connection with the separation of Corteva; (xvii) increases in pension and other post-employment benefit plan funding obligations; (xviii) effect of compliance with environmental laws and requirements and adverse judgments on litigation; (xix) risks related to Corteva's global operations; (xx) effect of climate change and unpredictable seasonal and weather factors; (xxi) effect of counterfeit products; (xxii) failure to effectively manage acquisitions, divestitures, alliances and other portfolio actions; and (xxiii) risks related to our estimates with respect to goodwill and intangible assets. Additionally, there may be other risks and uncertainties that Corteva is unable to currently identify or that Corteva does not currently expect to have a material impact on its business. Where, in any forward-looking statement or other estimate, an expectation or belief as to future results or events is expressed, such expectation or belief is based on the current plans and expectations of Corteva's management and expressed in good faith and believed to have a reasonable basis, but there can be no assurance that the expectation or belief will result or be achieved or accomplished. Corteva disclaims and does not undertake any obligation to update or revise any forward-looking statement or other estimate, except as required by applicable law. A detailed discussion of some of the significant risks and uncertainties which may cause results and events to differ materially from such forward-looking statements and estimates is included in the "Risk Factors" section of Exhibit 99.1 of Amendment No. 4 to Corteva's Registration Statement on Form 10 and of
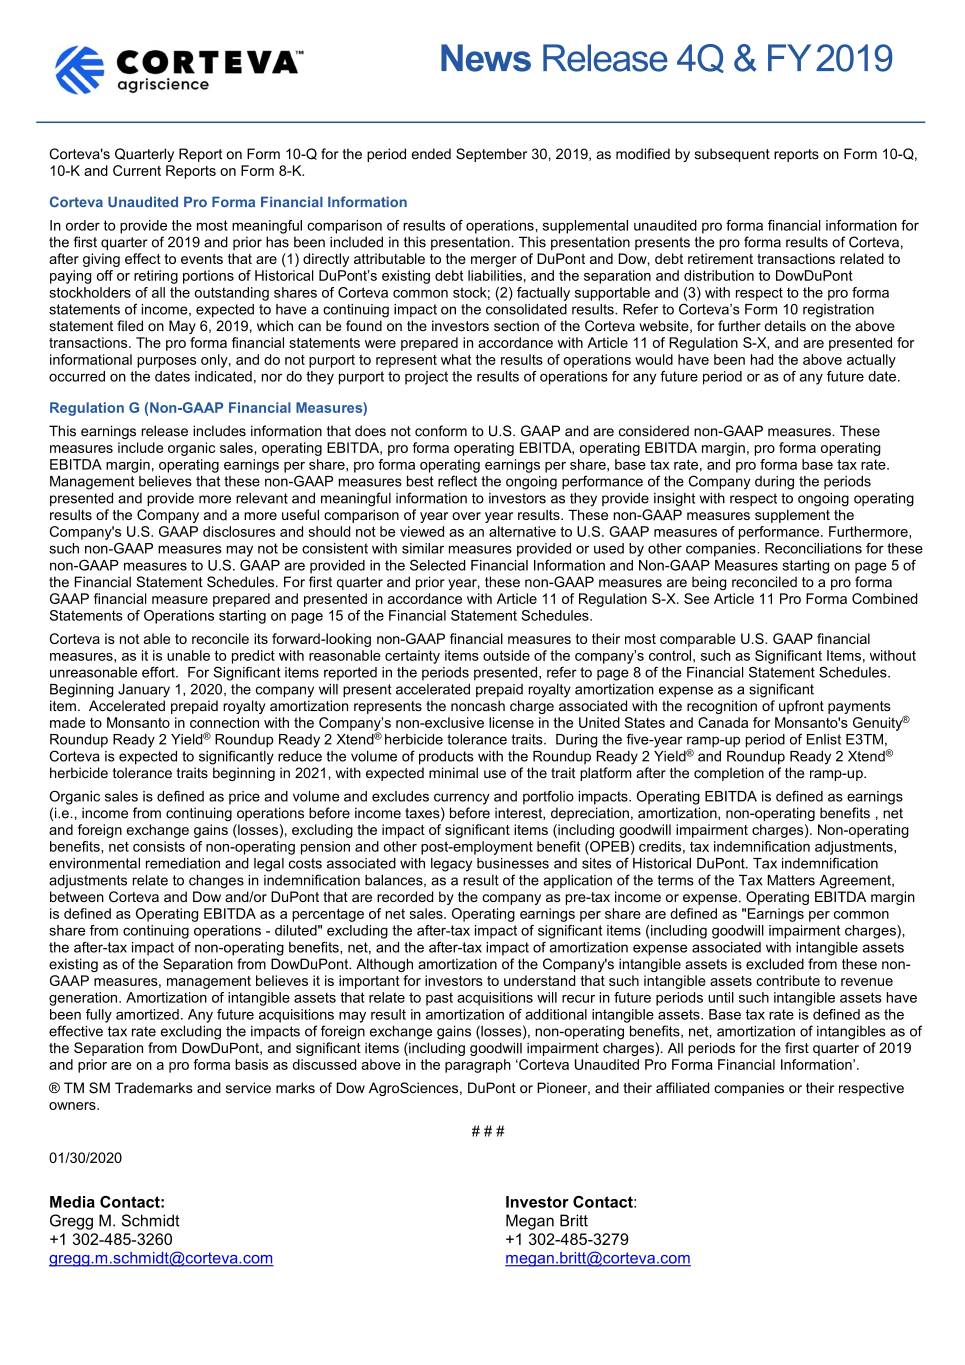
News Release 4Q & FY 2019 Corteva's Quarterly Report on Form 10-Q for the period ended September 30, 2019, as modified by subsequent reports on Form 10-Q, 10-K and Current Reports on Form 8-K. Corteva Unaudited Pro Forma Financial Information In order to provide the most meaningful comparison of results of operations, supplemental unaudited pro forma financial information for the first quarter of 2019 and prior has been included in this presentation. This presentation presents the pro forma results of Corteva, after giving effect to events that are (1) directly attributable to the merger of DuPont and Dow, debt retirement transactions related to paying off or retiring portions of Historical DuPont’s existing debt liabilities, and the separation and distribution to DowDuPont stockholders of all the outstanding shares of Corteva common stock; (2) factually supportable and (3) with respect to the pro forma statements of income, expected to have a continuing impact on the consolidated results. Refer to Corteva’s Form 10 registration statement filed on May 6, 2019, which can be found on the investors section of the Corteva website, for further details on the above transactions. The pro forma financial statements were prepared in accordance with Article 11 of Regulation S-X, and are presented for informational purposes only, and do not purport to represent what the results of operations would have been had the above actually occurred on the dates indicated, nor do they purport to project the results of operations for any future period or as of any future date. Regulation G (Non-GAAP Financial Measures) This earnings release includes information that does not conform to U.S. GAAP and are considered non-GAAP measures. These measures include organic sales, operating EBITDA, pro forma operating EBITDA, operating EBITDA margin, pro forma operating EBITDA margin, operating earnings per share, pro forma operating earnings per share, base tax rate, and pro forma base tax rate. Management believes that these non-GAAP measures best reflect the ongoing performance of the Company during the periods presented and provide more relevant and meaningful information to investors as they provide insight with respect to ongoing operating results of the Company and a more useful comparison of year over year results. These non-GAAP measures supplement the Company's U.S. GAAP disclosures and should not be viewed as an alternative to U.S. GAAP measures of performance. Furthermore, such non-GAAP measures may not be consistent with similar measures provided or used by other companies. Reconciliations for these non-GAAP measures to U.S. GAAP are provided in the Selected Financial Information and Non-GAAP Measures starting on page 5 of the Financial Statement Schedules. For first quarter and prior year, these non-GAAP measures are being reconciled to a pro forma GAAP financial measure prepared and presented in accordance with Article 11 of Regulation S-X. See Article 11 Pro Forma Combined Statements of Operations starting on page 15 of the Financial Statement Schedules. Corteva is not able to reconcile its forward-looking non-GAAP financial measures to their most comparable U.S. GAAP financial measures, as it is unable to predict with reasonable certainty items outside of the company’s control, such as Significant Items, without unreasonable effort. For Significant items reported in the periods presented, refer to page 8 of the Financial Statement Schedules. Beginning January 1, 2020, the company will present accelerated prepaid royalty amortization expense as a significant item. Accelerated prepaid royalty amortization represents the noncash charge associated with the recognition of upfront payments made to Monsanto in connection with the Company’s non-exclusive license in the United States and Canada for Monsanto's Genuity® Roundup Ready 2 Yield® Roundup Ready 2 Xtend® herbicide tolerance traits. During the five-year ramp-up period of Enlist E3TM, Corteva is expected to significantly reduce the volume of products with the Roundup Ready 2 Yield® and Roundup Ready 2 Xtend® herbicide tolerance traits beginning in 2021, with expected minimal use of the trait platform after the completion of the ramp-up. Organic sales is defined as price and volume and excludes currency and portfolio impacts. Operating EBITDA is defined as earnings (i.e., income from continuing operations before income taxes) before interest, depreciation, amortization, non-operating benefits , net and foreign exchange gains (losses), excluding the impact of significant items (including goodwill impairment charges). Non-operating benefits, net consists of non-operating pension and other post-employment benefit (OPEB) credits, tax indemnification adjustments, environmental remediation and legal costs associated with legacy businesses and sites of Historical DuPont. Tax indemnification adjustments relate to changes in indemnification balances, as a result of the application of the terms of the Tax Matters Agreement, between Corteva and Dow and/or DuPont that are recorded by the company as pre-tax income or expense. Operating EBITDA margin is defined as Operating EBITDA as a percentage of net sales. Operating earnings per share are defined as "Earnings per common share from continuing operations - diluted" excluding the after-tax impact of significant items (including goodwill impairment charges), the after-tax impact of non-operating benefits, net, and the after-tax impact of amortization expense associated with intangible assets existing as of the Separation from DowDuPont. Although amortization of the Company's intangible assets is excluded from these non- GAAP measures, management believes it is important for investors to understand that such intangible assets contribute to revenue generation. Amortization of intangible assets that relate to past acquisitions will recur in future periods until such intangible assets have been fully amortized. Any future acquisitions may result in amortization of additional intangible assets. Base tax rate is defined as the effective tax rate excluding the impacts of foreign exchange gains (losses), non-operating benefits, net, amortization of intangibles as of the Separation from DowDuPont, and significant items (including goodwill impairment charges). All periods for the first quarter of 2019 and prior are on a pro forma basis as discussed above in the paragraph ‘Corteva Unaudited Pro Forma Financial Information’. ® TM SM Trademarks and service marks of Dow AgroSciences, DuPont or Pioneer, and their affiliated companies or their respective owners. # # # 01/30/2020 Media Contact: Investor Contact: Gregg M. Schmidt Megan Britt +1 302-485-3260 +1 302-485-3279 [email protected] [email protected]
1
Corteva, Inc.
Consolidated Statements of Operations
(Dollars in millions, except per share amounts)
Three Months Ended December 31, | Twelve Months Ended December 31, | ||||||||||||||
2019 | 2018 | 2019 | 2018 | ||||||||||||
Net sales | $ | 2,983 | $ | 2,815 | $ | 13,846 | $ | 14,287 | |||||||
Cost of goods sold | 1,968 | 2,024 | 8,575 | 9,948 | |||||||||||
Research and development expense | 290 | 345 | 1,147 | 1,355 | |||||||||||
Selling, general and administrative expenses | 747 | 694 | 3,065 | 3,041 | |||||||||||
Amortization of intangibles | 161 | 107 | 475 | 391 | |||||||||||
Restructuring and asset related charges - net | 55 | 228 | 222 | 694 | |||||||||||
Integration and separation costs | 50 | 295 | 744 | 992 | |||||||||||
Goodwill impairment charge | — | — | — | 4,503 | |||||||||||
Other income - net | 125 | 131 | 215 | 249 | |||||||||||
Loss on early extinguishment of debt | — | 81 | 13 | 81 | |||||||||||
Interest expense | 24 | 86 | 136 | 337 | |||||||||||
Loss from continuing operations before income taxes | (187 | ) | (914 | ) | (316 | ) | (6,806 | ) | |||||||
(Benefit from) provision for income taxes on continuing operations | (145 | ) | 156 | (46 | ) | (31 | ) | ||||||||
Loss from continuing operations after income taxes | (42 | ) | (1,070 | ) | (270 | ) | (6,775 | ) | |||||||
Income (loss) from discontinued operations after income taxes | 24 | 548 | (671 | ) | 1,748 | ||||||||||
Net loss | (18 | ) | (522 | ) | (941 | ) | (5,027 | ) | |||||||
Net income attributable to noncontrolling interests | 3 | 9 | 18 | 38 | |||||||||||
Net loss attributable to Corteva | $ | (21 | ) | $ | (531 | ) | $ | (959 | ) | $ | (5,065 | ) | |||
Basic loss per share of common stock: | |||||||||||||||
Basic loss per share of common stock from continuing operations | $ | (0.06 | ) | $ | (1.44 | ) | $ | (0.38 | ) | $ | (9.08 | ) | |||
Basic earnings (loss) per share of common stock from discontinued operations | 0.03 | 0.73 | (0.90 | ) | 2.32 | ||||||||||
Basic loss per share of common stock | $ | (0.03 | ) | $ | (0.71 | ) | $ | (1.28 | ) | $ | (6.76 | ) | |||
Diluted loss per share of common stock: | |||||||||||||||
Diluted loss per share of common stock from continuing operations | $ | (0.06 | ) | $ | (1.44 | ) | $ | (0.38 | ) | $ | (9.08 | ) | |||
Diluted earnings (loss) per share of common stock from discontinued operations | 0.03 | 0.73 | (0.90 | ) | 2.32 | ||||||||||
Diluted loss per share of common stock | $ | (0.03 | ) | $ | (0.71 | ) | $ | (1.28 | ) | $ | (6.76 | ) | |||
Average number of shares outstanding used in earnings per share (EPS) calculation (in millions)1 | |||||||||||||||
Basic | 749.6 | 749.4 | 749.5 | 749.4 | |||||||||||
Diluted | 749.6 | 749.4 | 749.5 | 749.4 | |||||||||||
1. | On June 1, 2019, DuPont de Nemours, Inc. ("DuPont") distributed 748,815,000 shares of Corteva, Inc. common stock to holders of its common stock. Basic and diluted (loss) earnings per common share for the three and twelve months ended December 31, 2018 were calculated using the shares distributed on June 1, 2019 plus 582,000 of additional shares in which accelerated vesting conditions have been met. |
2
Corteva, Inc.
Condensed Consolidated Balance Sheets
(Dollars in millions, except per share amounts)
December 31, 2019 | December 31, 2018 | |||||||
Assets | ||||||||
Current assets | ||||||||
Cash and cash equivalents | $ | 1,764 | $ | 2,270 | ||||
Marketable securities | 5 | 5 | ||||||
Accounts and notes receivable, net | 5,528 | 5,260 | ||||||
Inventories | 5,032 | 5,310 | ||||||
Other current assets | 1,190 | 1,038 | ||||||
Assets of discontinued operations - current | — | 9,089 | ||||||
Total current assets | 13,519 | 22,972 | ||||||
Investment in nonconsolidated affiliates | 66 | 138 | ||||||
Property, plant and equipment, net of accumulated depreciation December 31, 2019 - $3,326 and December 31, 2018 - $2,796 | 4,546 | 4,544 | ||||||
Goodwill | 10,229 | 10,193 | ||||||
Other intangible assets | 11,424 | 12,055 | ||||||
Deferred income taxes | 287 | 304 | ||||||
Other assets | 2,326 | 1,932 | ||||||
Assets of discontinued operations - noncurrent | — | 56,545 | ||||||
Total Assets | $ | 42,397 | $ | 108,683 | ||||
Liabilities and Equity | ||||||||
Current liabilities | ||||||||
Short-term borrowings and finance lease obligations | $ | 7 | $ | 2,154 | ||||
Accounts payable | 3,702 | 3,798 | ||||||
Income taxes payable | 95 | 186 | ||||||
Accrued and other current liabilities | 4,434 | 4,005 | ||||||
Liabilities of discontinued operations - current | — | 3,167 | ||||||
Total current liabilities | 8,238 | 13,310 | ||||||
Long-Term Debt | 115 | 5,784 | ||||||
Other Noncurrent Liabilities | ||||||||
Deferred income tax liabilities | 920 | 1,480 | ||||||
Pension and other post employment benefits - noncurrent | 6,377 | 5,677 | ||||||
Other noncurrent obligations | 2,192 | 1,795 | ||||||
Liabilities of discontinued operations - noncurrent | — | 5,484 | ||||||
Total noncurrent liabilities | 9,604 | 20,220 | ||||||
Commitments and contingent liabilities | ||||||||
Stockholders' equity | ||||||||
Common stock, $0.01 par value; 1,666,667,000 shares authorized; issued at December 31, 2019 - 748,577,000 | 7 | — | ||||||
Additional paid-in capital | 27,997 | — | ||||||
Divisional equity | — | 78,020 | ||||||
Accumulated deficit | (425 | ) | — | |||||
Accumulated other comprehensive loss | (3,270 | ) | (3,360 | ) | ||||
Total Corteva stockholders' equity | 24,309 | 74,660 | ||||||
Noncontrolling interests | 246 | 493 | ||||||
Total equity | 24,555 | 75,153 | ||||||
Total Liabilities and Equity | $ | 42,397 | $ | 108,683 | ||||
3
Corteva, Inc.
Pro Forma Consolidated Statements of Operations1
(Dollars in millions, except per share amounts)
Three Months Ended December 31, | Twelve Months Ended December 31, | ||||||||||||||
2019 2 | 2018 | 2019 | 2018 | ||||||||||||
Net sales | $ | 2,983 | $ | 2,815 | $ | 13,846 | $ | 14,287 | |||||||
Cost of goods sold | 1,968 | 1,906 | 8,386 | 8,449 | |||||||||||
Research and development expense | 290 | 344 | 1,147 | 1,352 | |||||||||||
Selling, general and administrative expenses | 747 | 694 | 3,068 | 3,042 | |||||||||||
Amortization of intangibles | 161 | 107 | 475 | 391 | |||||||||||
Restructuring and asset related charges - net | 55 | 228 | 222 | 694 | |||||||||||
Integration and separation costs | 50 | 187 | 632 | 571 | |||||||||||
Goodwill impairment charge | — | — | — | 4,503 | |||||||||||
Other income - net | 125 | 131 | 215 | 249 | |||||||||||
Loss on early extinguishment of debt | — | — | 13 | — | |||||||||||
Interest expense | 24 | 25 | 91 | 76 | |||||||||||
(Loss) income from continuing operations before income taxes | (187 | ) | (545 | ) | 27 | (4,542 | ) | ||||||||
(Benefit from) provision for income taxes on continuing operations | (145 | ) | 201 | 1 | 395 | ||||||||||
(Loss) income from continuing operations after income taxes | (42 | ) | (746 | ) | 26 | (4,937 | ) | ||||||||
Net income from continuing operations attributable to noncontrolling interests | 3 | 6 | 13 | 29 | |||||||||||
Net (loss) income from continuing operations attributable to Corteva | $ | (45 | ) | $ | (752 | ) | $ | 13 | $ | (4,966 | ) | ||||
Basic (loss) earnings per share of common stock from continuing operations | $ | (0.06 | ) | $ | (1.00 | ) | $ | 0.02 | $ | (6.63 | ) | ||||
Diluted (loss) earnings per share of common stock from continuing operations | $ | (0.06 | ) | $ | (1.00 | ) | $ | 0.02 | $ | (6.63 | ) | ||||
Average number of shares outstanding used in earnings per share (EPS) calculation (in millions) 3 | |||||||||||||||
Basic | 749.6 | 749.4 | 749.5 | 749.4 | |||||||||||
Diluted | 749.6 | 749.4 | 749.5 | 749.4 | |||||||||||
1. | See Article 11 Pro Forma Combined Statements of Operations beginning on page 15. |
2. | The three months ended December 31, 2019 are on an as reported basis. |
3. | On June 1, 2019, DuPont distributed 748,815,000 shares of Corteva, Inc. common stock to holders of its common stock. Basic and diluted (loss) earnings per common share for the three and twelve months ended December 31, 2018 were calculated using the shares distributed on June 1, 2019 plus 582,000 of additional shares in which accelerated vesting conditions have been met. |
4
Corteva, Inc.
Consolidated Segment Information
(Dollars in millions)
Three Months Ended December 31, | Twelve Months Ended December 31, | |||||||||||||||
SEGMENT NET SALES - SEED | 2019 | 2018 | 2019 | 2018 | ||||||||||||
Corn | $ | 962 | $ | 891 | $ | 5,111 | $ | 5,180 | ||||||||
Soybean | 74 | 45 | 1,371 | 1,494 | ||||||||||||
Other oilseeds | 92 | 93 | 561 | 607 | ||||||||||||
Other | 115 | 97 | 547 | 561 | ||||||||||||
Seed | $ | 1,243 | $ | 1,126 | $ | 7,590 | $ | 7,842 | ||||||||
Three Months Ended December 31, | Twelve Months Ended December 31, | |||||||||||||||
SEGMENT NET SALES - CROP PROTECTION | 2019 | 2018 | 2019 | 2018 | ||||||||||||
Herbicides | $ | 871 | $ | 836 | $ | 3,270 | $ | 3,415 | ||||||||
Insecticides | 494 | 395 | 1,652 | 1,506 | ||||||||||||
Fungicides | 305 | 303 | 1,081 | 1,142 | ||||||||||||
Other | 70 | 155 | 253 | 382 | ||||||||||||
Crop Protection | $ | 1,740 | $ | 1,689 | $ | 6,256 | $ | 6,445 | ||||||||
Three Months Ended December 31, | Twelve Months Ended December 31, | |||||||||||||||
GEOGRAPHIC NET SALES - SEED | 2019 | 2018 | 2019 | 2018 | ||||||||||||
North America 1 | $ | 486 | $ | 384 | $ | 4,724 | $ | 4,974 | ||||||||
EMEA 2 | 178 | 186 | 1,378 | 1,408 | ||||||||||||
Asia Pacific | 85 | 86 | 358 | 358 | ||||||||||||
Latin America | 494 | 470 | 1,130 | 1,102 | ||||||||||||
Rest of World 3 | 757 | 742 | 2,866 | 2,868 | ||||||||||||
Net Sales | $ | 1,243 | $ | 1,126 | $ | 7,590 | $ | 7,842 | ||||||||
Three Months Ended December 31, | Twelve Months Ended December 31, | |||||||||||||||
GEOGRAPHIC NET SALES - CROP PROTECTION | 2019 | 2018 | 2019 | 2018 | ||||||||||||
North America 1 | $ | 643 | $ | 594 | $ | 2,205 | $ | 2,438 | ||||||||
EMEA 2 | 226 | 200 | 1,362 | 1,357 | ||||||||||||
Asia Pacific | 256 | 282 | 930 | 935 | ||||||||||||
Latin America | 615 | 613 | 1,759 | 1,715 | ||||||||||||
Rest of World 3 | 1,097 | 1,095 | 4,051 | 4,007 | ||||||||||||
Net Sales | $ | 1,740 | $ | 1,689 | $ | 6,256 | $ | 6,445 | ||||||||
1. Reflects U.S. & Canada | ||||||||||||||||
2. Reflects Europe, Middle East, and Africa | ||||||||||||||||
3. Reflects EMEA, Latin America, and Asia Pacific | ||||||||||||||||
5
Corteva, Inc.
Reconciliation of Non-GAAP Measures
(Dollars in millions, except per share amounts)
Three Months Ended December 31, | Twelve Months Ended December 31, | |||||||||||||||
2019 | 2018 | 2019 | 2018 | |||||||||||||
OPERATING EBITDA | As Reported | Pro Forma | Pro Forma | Pro Forma | ||||||||||||
Seed | $ | (26 | ) | $ | (87 | ) | $ | 1,040 | $ | 1,139 | ||||||
Crop Protection | 277 | 169 | 1,066 | 1,074 | ||||||||||||
Corporate Expenses | (27 | ) | (32 | ) | (119 | ) | (141 | ) | ||||||||
Operating EBITDA (Non-GAAP) | $ | 224 | $ | 50 | $ | 1,987 | $ | 2,072 | ||||||||
Three Months Ended December 31, | Twelve Months Ended December 31, | |||||||||||||||
2019 | 2018 | 2019 | 2018 | |||||||||||||
RECONCILIATION OF (LOSS) INCOME FROM CONTINUING OPERATIONS AFTER INCOME TAXES TO OPERATING EBITDA | As Reported | Pro Forma | Pro Forma | Pro Forma | ||||||||||||
(Loss) income from continuing operations after income taxes (GAAP) | $ | (42 | ) | $ | (746 | ) | $ | 26 | $ | (4,937 | ) | |||||
(Benefit from) provision for income taxes on continuing operations | (145 | ) | 201 | 1 | 395 | |||||||||||
(Loss) income from continuing operations before income taxes (GAAP) | (187 | ) | (545 | ) | 27 | (4,542 | ) | |||||||||
Depreciation and amortization | 289 | 242 | 1,000 | 909 | ||||||||||||
Interest income | (13 | ) | (23 | ) | (59 | ) | (86 | ) | ||||||||
Interest expense | 24 | 25 | 91 | 76 | ||||||||||||
Exchange losses (gains) - net1 | 29 | (63 | ) | 66 | 77 | |||||||||||
Non-operating benefits - net2 | (23 | ) | (56 | ) | (129 | ) | (211 | ) | ||||||||
Goodwill impairment charge | — | — | — | 4,503 | ||||||||||||
Significant items charge3 | 105 | 470 | 991 | 1,346 | ||||||||||||
Operating EBITDA (Non-GAAP) | 224 | 50 | 1,987 | 2,072 | ||||||||||||
1. | Refer to page 14 for pre-tax and after tax impacts of exchange losses (gains) - net. |
2. | Non-operating benefits—net consists of non-operating pension and other post-employment benefit (OPEB) (benefits) costs, tax indemnification adjustments, environmental remediation and legal costs associated with legacy EID businesses and sites. Tax indemnification adjustments relate to changes in indemnification balances, as a result of the application of the terms of the Tax Matters Agreement, between Corteva and Dow and/or DuPont that are recorded by the company as pre-tax income or expense. |
3. | Refer to page 8 for pre-tax and after tax impacts of significant items. |
6
Corteva, Inc.
Reconciliation of Non-GAAP Measures
(Dollars in millions, except per share amounts)
PRICE - VOLUME - CURRENCY ANALYSIS | ||||||||||||||||||
REGION | ||||||||||||||||||
Q4 2019 vs. Q4 2018 | Percent Change Due To: | |||||||||||||||||
Net Sales Change (GAAP) | Organic Change 1 (Non-GAAP) | Local Price & | Portfolio / | |||||||||||||||
$ | % | $ | % | Product Mix | Volume | Currency | Other | |||||||||||
North America | $ | 151 | 15 | % | $ | 156 | 16 | % | 2 | % | 14 | % | — | % | (1 | )% | ||
EMEA | 18 | 5 | % | 25 | 7 | % | 4 | % | 3 | % | (2 | )% | — | % | ||||
Asia Pacific | (27 | ) | (7 | )% | (23 | ) | (6 | )% | (2 | )% | (4 | )% | 1 | % | (2 | )% | ||
Latin America | 26 | 2 | % | 95 | 8 | % | 4 | % | 4 | % | (6 | )% | — | % | ||||
Rest of World | 17 | 1 | % | 97 | 5 | % | 3 | % | 2 | % | (4 | )% | — | % | ||||
Total | $ | 168 | 6 | % | $ | 253 | 9 | % | 3 | % | 6 | % | (3 | )% | — | % | ||
SEED | ||||||||||||||||||
Q4 2019 vs. Q4 2018 | Percent Change Due To: | |||||||||||||||||
Net Sales Change (GAAP) | Organic Change 1 (Non-GAAP) | Local Price & | Portfolio / | |||||||||||||||
$ | % | $ | % | Product Mix | Volume | Currency | Other | |||||||||||
North America | $ | 102 | 27 | % | $ | 100 | 26 | % | 10 | % | 16 | % | — | % | 1 | % | ||
EMEA | (8 | ) | (4 | )% | (7 | ) | (3 | )% | (1 | )% | (2 | )% | (1 | )% | — | % | ||
Asia Pacific | (1 | ) | (1 | )% | (4 | ) | (4 | )% | (2 | )% | (2 | )% | 3 | % | — | % | ||
Latin America | 24 | 5 | % | 53 | 11 | % | 12 | % | (1 | )% | (6 | )% | — | % | ||||
Rest of World | 15 | 2 | % | 42 | 6 | % | 7 | % | (1 | )% | (4 | )% | — | % | ||||
Total | $ | 117 | 10 | % | $ | 142 | 13 | % | 8 | % | 5 | % | (3 | )% | — | % | ||
CROP PROTECTION | ||||||||||||||||||
Q4 2019 vs. Q4 2018 | Percent Change Due To: | |||||||||||||||||
Net Sales Change (GAAP) | Organic Change 1 (Non-GAAP) | Local Price & | Portfolio / | |||||||||||||||
$ | % | $ | % | Product Mix | Volume | Currency | Other | |||||||||||
North America | $ | 49 | 8 | % | $ | 56 | 9 | % | (4 | )% | 13 | % | — | % | (1 | )% | ||
EMEA | 26 | 13 | % | 32 | 16 | % | 9 | % | 7 | % | (3 | )% | — | % | ||||
Asia Pacific | (26 | ) | (9 | )% | (19 | ) | (7 | )% | (2 | )% | (5 | )% | 1 | % | (3 | )% | ||
Latin America | 2 | — | % | 42 | 7 | % | (1 | )% | 8 | % | (7 | )% | — | % | ||||
Rest of World | 2 | — | % | 55 | 5 | % | 1 | % | 4 | % | (4 | )% | (1 | )% | ||||
Total | $ | 51 | 3 | % | $ | 111 | 7 | % | (1 | )% | 8 | % | (3 | )% | (1 | )% | ||
7
Corteva, Inc.
Reconciliation of Non-GAAP Measures
(Dollars in millions, except per share amounts)
PRICE - VOLUME - CURRENCY ANALYSIS | ||||||||||||||||||
REGION | ||||||||||||||||||
Twelve Months 2019 vs. Twelve Months 2018 | Percent Change Due To: | |||||||||||||||||
Net Sales Change (GAAP) | Organic Change 1 (Non-GAAP) | Local Price & | Portfolio / | |||||||||||||||
$ | % | $ | % | Product Mix | Volume | Currency | Other | |||||||||||
North America | $ | (483 | ) | (7 | )% | $ | (448 | ) | (6 | )% | (2 | )% | (4 | )% | (1 | )% | — | % |
EMEA | (25 | ) | (1 | )% | 189 | 7 | % | 2 | % | 5 | % | (8 | )% | — | % | |||
Asia Pacific | (5 | ) | — | % | 43 | 3 | % | 2 | % | 1 | % | (3 | )% | — | % | |||
Latin America | 72 | 3 | % | 208 | 8 | % | 4 | % | 4 | % | (5 | )% | — | % | ||||
Rest of World | 42 | 1 | % | 440 | 7 | % | 3 | % | 4 | % | (6 | )% | — | % | ||||
Total | $ | (441 | ) | (3 | )% | $ | (8 | ) | — | % | — | % | — | % | (3 | )% | — | % |
SEED | ||||||||||||||||||
Twelve Months 2019 vs. Twelve Months 2018 | Percent Change Due To: | |||||||||||||||||
Net Sales Change (GAAP) | Organic Change 1 (Non-GAAP) | Local Price & | Portfolio / | |||||||||||||||
$ | % | $ | % | Product Mix | Volume | Currency | Other | |||||||||||
North America | $ | (250 | ) | (5 | )% | $ | (237 | ) | (5 | )% | (2 | )% | (3 | )% | — | % | — | % |
EMEA | (30 | ) | (2 | )% | 85 | 6 | % | 1 | % | 5 | % | (8 | )% | — | % | |||
Asia Pacific | — | — | % | 14 | 4 | % | 2 | % | 2 | % | (4 | )% | — | % | ||||
Latin America | 28 | 3 | % | 82 | 7 | % | 8 | % | (1 | )% | (4 | )% | — | % | ||||
Rest of World | (2 | ) | — | % | 181 | 6 | % | 4 | % | 2 | % | (6 | )% | — | % | |||
Total | $ | (252 | ) | (3 | )% | $ | (56 | ) | (1 | )% | — | % | (1 | )% | (2 | )% | — | % |
CROP PROTECTION | ||||||||||||||||||
Twelve Months 2019 vs. Twelve Months 2018 | Percent Change Due To: | |||||||||||||||||
Net Sales Change (GAAP) | Organic Change 1 (Non-GAAP) | Local Price & | Portfolio / | |||||||||||||||
$ | % | $ | % | Product Mix | Volume | Currency | Other | |||||||||||
North America | $ | (233 | ) | (10 | )% | $ | (211 | ) | (9 | )% | (3 | )% | (6 | )% | — | % | (1 | )% |
EMEA | 5 | — | % | 104 | 7 | % | 2 | % | 5 | % | (7 | )% | — | % | ||||
Asia Pacific | (5 | ) | (1 | )% | 29 | 3 | % | 3 | % | — | % | (3 | )% | (1 | )% | |||
Latin America | 44 | 3 | % | 126 | 8 | % | 1 | % | 7 | % | (5 | )% | — | % | ||||
Rest of World | 44 | 1 | % | 259 | 7 | % | 2 | % | 5 | % | (5 | )% | (1 | )% | ||||
Total | $ | (189 | ) | (3 | )% | $ | 48 | 1 | % | — | % | 1 | % | (3 | )% | (1 | )% | |
1. | Organic sales is defined as price and volume and excludes currency and portfolio impacts. |
8
Corteva, Inc.
Significant Items
(Dollars in millions, except per share amounts)
SIGNIFICANT ITEMS BY SEGMENT (PRE-TAX) | |||||||||||||||
Three Months Ended December 31, | Twelve Months Ended December 31, | ||||||||||||||
2019 | 2018 | 2019 | 2018 | ||||||||||||
As Reported | Pro Forma | Pro Forma | Pro Forma | ||||||||||||
Seed | $ | (90 | ) | $ | (150 | ) | $ | (304 | ) | $ | (399 | ) | |||
Crop Protection | 1 | (16 | ) | (23 | ) | (58 | ) | ||||||||
Corporate | (16 | ) | (304 | ) | (664 | ) | (889 | ) | |||||||
Total significant items before income taxes | $ | (105 | ) | $ | (470 | ) | $ | (991 | ) | $ | (1,346 | ) | |||
SIGNIFICANT ITEMS - PRE-TAX, AFTER TAX, AND EPS IMPACTS | ||||||||||||||||||||||||
Pre-tax | After tax10 | ($ Per Share)11 | ||||||||||||||||||||||
2019 | 2018 | 2019 | 2018 | 2019 | 2018 | |||||||||||||||||||
1st Quarter | Pro Forma | Pro Forma | Pro Forma | Pro Forma | Pro Forma | Pro Forma | ||||||||||||||||||
Integration costs 1 | $ | (100 | ) | $ | (124 | ) | $ | (16 | ) | $ | (93 | ) | $ | (0.02 | ) | $ | (0.12 | ) | ||||||
Restructuring and asset related charges, net 2 | (61 | ) | (130 | ) | (53 | ) | (100 | ) | (0.07 | ) | (0.13 | ) | ||||||||||||
Loss on divestiture 3 | (24 | ) | — | (24 | ) | — | (0.03 | ) | — | |||||||||||||||
Income tax items 4 | — | (50 | ) | — | (102 | ) | — | (0.14 | ) | |||||||||||||||
1st Quarter - Total | $ | (185 | ) | $ | (304 | ) | $ | (93 | ) | $ | (295 | ) | $ | (0.12 | ) | $ | (0.39 | ) | ||||||
2nd Quarter | As Reported | Pro Forma | As Reported | Pro Forma | As Reported | Pro Forma | ||||||||||||||||||
Integration and separation costs 1 | $ | (330 | ) | $ | (126 | ) | $ | (436 | ) | $ | (97 | ) | $ | (0.58 | ) | $ | (0.13 | ) | ||||||
Restructuring and asset related charges, net 2 | (60 | ) | (101 | ) | (48 | ) | (81 | ) | (0.06 | ) | (0.11 | ) | ||||||||||||
Gain on sale of assets 5 | — | 24 | — | 19 | — | 0.03 | ||||||||||||||||||
Amortization of inventory step up 6 | (52 | ) | — | (41 | ) | — | (0.06 | ) | — | |||||||||||||||
Loss on early extinguishment of debt 7 | (13 | ) | — | (10 | ) | — | (0.01 | ) | — | |||||||||||||||
Income tax items 4 | — | — | — | (7 | ) | — | (0.01 | ) | ||||||||||||||||
2nd Quarter - Total | $ | (455 | ) | $ | (203 | ) | $ | (535 | ) | $ | (166 | ) | $ | (0.71 | ) | $ | (0.22 | ) | ||||||
3rd Quarter | As Reported | Pro Forma | As Reported | Pro Forma | As Reported | Pro Forma | ||||||||||||||||||
Integration and separation costs 1 | $ | (152 | ) | $ | (134 | ) | $ | (119 | ) | $ | (162 | ) | $ | (0.16 | ) | $ | (0.22 | ) | ||||||
Restructuring and asset related charges, net 2 | (46 | ) | (235 | ) | (34 | ) | (192 | ) | (0.04 | ) | (0.26 | ) | ||||||||||||
Amortization of inventory step up 6 | (15 | ) | — | (15 | ) | — | (0.02 | ) | — | |||||||||||||||
Argentina currency devaluation 8 | (33 | ) | — | (38 | ) | — | (0.05 | ) | — | |||||||||||||||
Income tax items4 | — | — | 38 | (2 | ) | 0.05 | — | |||||||||||||||||
3rd Quarter - Total | $ | (246 | ) | $ | (369 | ) | $ | (168 | ) | $ | (356 | ) | $ | (0.22 | ) | $ | (0.48 | ) | ||||||
4th Quarter | As Reported | Pro Forma | As Reported | Pro Forma | As Reported | Pro Forma | ||||||||||||||||||
Integration and separation costs 1 | $ | (50 | ) | $ | (187 | ) | $ | 20 | $ | (147 | ) | $ | 0.03 | $ | (0.20 | ) | ||||||||
Restructuring and asset related charges, net 2 | (55 | ) | (228 | ) | (42 | ) | (172 | ) | (0.06 | ) | (0.23 | ) | ||||||||||||
Loss on divestiture 3 | — | (2 | ) | — | (3 | ) | — | — | ||||||||||||||||
Loss on deconsolidation of subsidiary 9 | — | (53 | ) | — | (41 | ) | — | (0.05 | ) | |||||||||||||||
Income tax items4 | — | — | 34 | (274 | ) | 0.05 | (0.37 | ) | ||||||||||||||||
4th Quarter - Total | $ | (105 | ) | $ | (470 | ) | $ | 12 | $ | (637 | ) | $ | 0.02 | $ | (0.85 | ) | ||||||||
Year-to-date Total 11 | $ | (991 | ) | $ | (1,346 | ) | $ | (784 | ) | $ | (1,454 | ) | $ | (1.04 | ) | $ | (1.94 | ) | ||||||
9
Corteva, Inc.
Significant Items
(Dollars in millions, except per share amounts)
1. | Integration and separation costs is included in "Integration and separation costs" on the Consolidated Statement of Operations. Beginning in Q2 2019, this includes both integration and separation costs. |
The after tax benefit for the fourth quarter of 2019 includes a net tax benefit of $48 related to application of the U.S. Tax Reform’s foreign tax provisions.
The after tax charge for the third quarter of 2019 includes a net tax benefit of $13 related to application of the U.S. Tax Reform’s foreign tax provisions.
The after tax charge for the second quarter of 2019 includes a net tax charge of $(114) related to U.S. state blended tax rate changes associated with the Business Separations and a net tax charge of $(96) related to application of the U.S. Tax Reform’s foreign tax provisions.
The after tax charge for the first quarter of 2019 includes a net tax charge of $(32) related to U.S. state blended tax rate changes associated with the Business Separations and a tax benefit of $102 related to an internal legal entity restructuring associated with the Business Separations.
2. | Fourth quarter, third quarter, second quarter, and first quarter 2019 included restructuring and asset related charges of $(55), $(46), $(60) and $(61), respectively. The charge for the fourth quarter included a $(90) non-cash intangible asset impairment charge as a result of the company’s decision to accelerate the ramp up of the Enlist E3TM trait platform in the company’s soybean portfolio mix across all brands, including Pioneer brands, over the next five years with minimal use of the Roundup Ready 2 Yield® and Roundup Ready 2 Xtend® traits thereafter for the remainder of the Roundup Ready 2 License Agreement. This charge was partially offset by a benefit of $22 associated with the DowDuPont Cost Synergy Program and a benefit of $13 associated with the DowDuPont Agriculture Division Restructuring Program. The charge for the third quarter included a $(54) non-cash asset impairment related to certain intangible assets that primarily relate to heritage Dow AgroSciences intangibles previously acquired from Cooperativa Central de Pesquisa Agrícola's ("Coodetec"), classified as developed technology, other intangible assets and in-process research and development ("IPR&D"), partially offset by a benefit of $8 associated with the DowDuPont Cost Synergy Program. The charge for the first and second quarter is primarily related to the DowDuPont Cost Synergy Program. |
Fourth quarter, third quarter, second quarter, and first quarter 2018 included restructuring and asset related charges of $(228), $(235), $(101) and $(130), respectively. The charges for the first and second quarter primarily related to the DowDuPont Cost Synergy Program. The charges for the third quarter included a $(109) charge related to the DowDuPont Cost Synergy Program, an $(85) non-cash asset impairment related to certain IPR&D intangibles, and a $(41) other than temporary non-cash impairment related to an investment in nonconsolidated affiliates in China. The charges for the fourth quarter consisted of a $(144) charge related to the DowDuPont Cost Synergy Program and an $(84) charge related to the DowDuPont Agriculture Division Restructuring Program.
3. | First quarter 2019 included a loss of $(24) included in other income - net related to Historical Dow's sale of a joint venture related to synergy actions. |
Fourth quarter 2018 includes a $(2) loss related to an asset sale.
4. | Fourth quarter 2019 includes an after tax benefit related to the impact of the release of a tax valuation allowance recorded against the net deferred tax asset position of a Swiss legal entity. |
Third quarter 2019 includes an after tax benefit related to Swiss Tax Reform.
Fourth quarter 2018 relates to effects of U.S. tax reform.
Third quarter 2018 includes an after tax benefit related to the impacts of a tax valuation allowance recorded against the net deferred tax asset position of a Brazilian legal entity ($75 expense), a tax charge related to an internal legal entity restructuring associated with the Business Separations ($25 expense), and U.S. Tax Reform ($16 expense), which were almost entirely offset by the impact of the company's discretionary pension contribution in 2018 which was deducted on a 2017 tax return ($114 benefit).
Second quarter 2018 relates to effects of U.S. tax reform.
10
Corteva, Inc.
Significant Items
(Dollars in millions, except per share amounts)
First quarter 2018 includes a $(50) pre-tax foreign exchange loss related to adjustments to foreign currency exchange contracts as a result of U.S. tax reform and a $(64) after tax charge related to effects of U.S. tax reform.
5. | Second quarter 2018 includes a gain of $24 included in other income - net related to an asset sale. |
6. | Third quarter and second quarter 2019 include amortization of inventory step up of $(15) and $(52), respectively, included in cost of goods sold related to the amortization of the inventory step-up in connection with the Merger. |
7. | Second quarter 2019 includes a loss on the early extinguishment of debt related to the difference between the redemption price and the par value of the Make Whole Notes and Term Loan Facility, partially offset by the write-off of unamortized step-up related to the fair value step-up of EID’s debt. |
8. | Third quarter 2019 includes a $(33) loss included in other income - net associated with remeasuring the company’s Argentine Peso net monetary assets, resulting from an unexpected August primary election result in Argentina. Throughout the three months ended September 30, 2019, the Argentine Peso dropped approximately a third of its value against the U.S. dollar and in September of 2019, the country’s central bank announced new restrictions on foreign currency transactions. The after tax charge of $(38) includes a tax valuation allowance recorded against the net deferred tax asset position of an Argentine legal entity. |
9. | Fourth quarter 2018 includes a loss related to the deconsolidation of a subsidiary. |
10. | Unless specifically addressed in notes above, the income tax effect on significant items was calculated based upon the enacted tax laws and statutory income tax rates applicable in the tax jurisdiction(s) of the underlying non-GAAP adjustment. |
11. | Earnings per share for the year may not equal the sum of quarterly earnings per share due to rounding and the changes in average share calculations. |
11
Corteva, Inc.
Reconciliation of Non-GAAP Measures
(Dollars in millions, except per share amounts)
Operating Earnings (Loss) Per Share (Non-GAAP) | ||||||||||||||||
Operating earnings (loss) per share is defined as earnings per share from continuing operations – diluted, excluding non-operating benefits - net, amortization of intangibles (existing as of Separation), significant items, and goodwill impairment charges. | ||||||||||||||||
Three Months Ended December 31, | ||||||||||||||||
2019 | 20182 | 2019 | 20182 | |||||||||||||
$ | $ | EPS (diluted) | EPS (diluted) | |||||||||||||
Net loss from continuing operations attributable to Corteva (GAAP) | $ | (45 | ) | $ | (752 | ) | $ | (0.06 | ) | $ | (1.00 | ) | ||||
Less: Non-operating benefits - net, after tax 1 | 16 | 44 | 0.02 | 0.06 | ||||||||||||
Less: Amortization of intangibles (existing as of Separation), after tax | (126 | ) | (86 | ) | (0.17 | ) | (0.11 | ) | ||||||||
Less: Significant items benefit (charge), after tax | 12 | (637 | ) | 0.02 | (0.85 | ) | ||||||||||
Operating Earnings (Loss) (Non-GAAP) | $ | 53 | $ | (73 | ) | $ | 0.07 | $ | (0.10 | ) | ||||||
Twelve Months Ended December 31, | ||||||||||||||||
20192 | 20182 | 20192 | 20182 | |||||||||||||
$ | $ | EPS (diluted) | EPS (diluted) | |||||||||||||
Net income (loss) from continuing operations attributable to Corteva (GAAP) | $ | 13 | $ | (4,966 | ) | $ | 0.02 | $ | (6.63 | ) | ||||||
Less: Non-operating benefits - net, after tax 1 | 100 | 165 | 0.13 | 0.22 | ||||||||||||
Less: Amortization of intangibles (existing as of Separation), after tax | (376 | ) | (313 | ) | (0.50 | ) | (0.42 | ) | ||||||||
Less: Goodwill impairment charge, after tax | — | (4,503 | ) | — | (6.01 | ) | ||||||||||
Less: Significant items charge, after tax | (784 | ) | (1,454 | ) | (1.04 | ) | (1.94 | ) | ||||||||
Operating Earnings (Non-GAAP) | $ | 1,073 | $ | 1,139 | $ | 1.43 | $ | 1.52 | ||||||||
1. | Non-operating benefits—net consists of non-operating pension and other post-employment benefit (OPEB) benefits (costs), tax indemnification adjustments, and environmental remediation and legal costs associated with legacy EID businesses and sites. Tax indemnification adjustments relate to changes in indemnification balances, as a result of the application of the terms of the Tax Matters Agreement, between Corteva and Dow and/or DuPont that are recorded by the company as pre-tax income or expense. |
2. | Periods are presented on a Pro Forma Basis, prepared in accordance with Article 11 of Regulation S-X. |
12
Corteva, Inc.
Operating EBITDA to Operating Earnings Per Share
(Dollars in millions, except per share amounts)
Operating EBITDA to Operating Earnings (Loss) Per Share | ||||||||||||||||
Three Months Ended December 31, | Twelve Months Ended December 31, | |||||||||||||||
2019 | 2018 | 2019 | 2018 | |||||||||||||
As Reported | Pro Forma | Pro Forma | Pro Forma | |||||||||||||
Operating EBITDA (Non-GAAP)1 | $ | 224 | $ | 50 | 1,987 | 2,072 | ||||||||||
Depreciation | (128 | ) | (135 | ) | (525 | ) | (518 | ) | ||||||||
Interest Income | 13 | 23 | 59 | 86 | ||||||||||||
Interest Expense | (24 | ) | (25 | ) | (91 | ) | (76 | ) | ||||||||
(Provision for) benefit from income taxes on continuing operations before significant items, goodwill impairment charges, non-operating benefits - net, amortization of intangibles (existing as of Separation), and exchange (gains) losses, net (Non-GAAP) | (15 | ) | 35 | (280 | ) | (255 | ) | |||||||||
Base income tax rate from continuing operations (Non-GAAP)1 | 17.6 | % | 40.2 | % | 19.6 | % | 16.3 | % | ||||||||
Exchange losses - net, after tax2 | (14 | ) | (15 | ) | (64 | ) | (141 | ) | ||||||||
Net income attributable to non-controlling interests | (3 | ) | (6 | ) | (13 | ) | (29 | ) | ||||||||
Operating Earnings (Loss) (Non-GAAP)1 | $ | 53 | $ | (73 | ) | $ | 1,073 | $ | 1,139 | |||||||
Diluted Shares (in millions) | 749.6 | 749.4 | 749.5 | 749.4 | ||||||||||||
Operating Earnings (Loss) Per Share (Non-GAAP)1 | $ | 0.07 | $ | (0.10 | ) | $ | 1.43 | $ | 1.52 | |||||||
1. | Refer to pages 5, 11, and 13 for Non-GAAP reconciliations. |
2. | Refer to page 14 for pre-tax and after tax impacts of exchange gains (losses) - net. |
13
Corteva, Inc.
Reconciliation of Non-GAAP Measures
(Dollars in millions)
Reconciliation of Base Income Tax Rate to Effective Income Tax Rate | |||||||||||||||
Base income tax rate is defined as the effective income tax rate less the effect of exchange gains (losses), significant items, goodwill impairment charges, amortization of intangibles (existing as of Separation), and non-operating benefits - net. | |||||||||||||||
Three Months Ended December 31, | Twelve Months Ended December 31, | ||||||||||||||
2019 | 2018 | 2019 | 2018 | ||||||||||||
As Reported | Pro Forma | Pro Forma | Pro Forma | ||||||||||||
(Loss) income from continuing operations before income taxes (GAAP) | $ | (187 | ) | $ | (545 | ) | $ | 27 | $ | (4,542 | ) | ||||
Add: Significant items - charge 1 | 105 | 470 | 991 | 1,346 | |||||||||||
Goodwill impairment charge | — | — | — | 4,503 | |||||||||||
Non-operating benefits - net | (23 | ) | (56 | ) | (129 | ) | (211 | ) | |||||||
Amortization of intangibles (existing as of Separation) | 161 | 107 | 475 | 391 | |||||||||||
Less: Exchange (losses) gains, net 2 | (29 | ) | 63 | (66 | ) | (77 | ) | ||||||||
Income (loss) from continuing operations before income taxes, significant items, goodwill impairment charges, non-operating benefits - net, amortization of intangibles (existing as of Separation), and exchange (gains) losses, net (Non-GAAP) | $ | 85 | $ | (87 | ) | $ | 1,430 | $ | 1,564 | ||||||
(Benefit from) provision for income taxes on continuing operations (GAAP) | $ | (145 | ) | $ | 201 | $ | 1 | $ | 395 | ||||||
Add: Tax benefits (expenses) on significant items charge | 117 | (167 | ) | 207 | (108 | ) | |||||||||
Tax expenses on goodwill impairment charge | — | — | — | — | |||||||||||
Tax expenses on non-operating benefits - net | (7 | ) | (12 | ) | (29 | ) | (46 | ) | |||||||
Tax benefits on amortization of intangibles (existing as of Separation) | 35 | 21 | 99 | 78 | |||||||||||
Tax benefits (expenses) on exchange gains (losses), net | 15 | (78 | ) | 2 | (64 | ) | |||||||||
Provision for (benefit from) income taxes on continuing operations before significant items, goodwill impairment charges, non-operating benefits - net, amortization of intangibles (existing as of Separation), and exchange (gains) losses, net (Non-GAAP) | $ | 15 | $ | (35 | ) | $ | 280 | $ | 255 | ||||||
Effective income tax rate (GAAP) | 77.5 | % | (36.9 | )% | 3.7 | % | (8.7 | )% | |||||||
Significant items, goodwill impairment charge, non-operating benefits, and amortization of intangibles (existing as of Separation) effect | (77.5 | )% | (142.3 | )% | 16.7 | % | 30.2 | % | |||||||
Tax rate from continuing operations before significant items, goodwill impairment charge, non-operating benefits - net, and amortization of intangibles (existing as of Separation) | — | % | (179.2 | )% | 20.4 | % | 21.5 | % | |||||||
Exchange gains (losses), net effect | 17.6 | % | 219.4 | % | (0.8 | )% | (5.2 | )% | |||||||
Base income tax rate from continuing operations (Non-GAAP) | 17.6 | % | 40.2 | % | 19.6 | % | 16.3 | % | |||||||
1. See Significant Items table for further detail. | |||||||||||||||
2. Pre-tax exchange gains (losses), net for the twelve months ended December 31, 2019, on an operating earnings basis (Non-GAAP), exclude a $(33) exchange loss associated with the devaluation of the Argentine peso. Pre-tax exchange loss, net for the twelve months ended December 31, 2018, on an operating earnings basis (Non-GAAP), excludes a $(50) exchange loss related to adjustments to foreign currency exchange contracts as a result of U.S. tax reform. | |||||||||||||||
14
Corteva, Inc.
(Dollars in millions, except per share amounts)
Exchange Gains/Losses | ||||||||||||||||
The company routinely uses foreign currency exchange contracts to offset its net exposures, by currency, related to the foreign currency-denominated monetary assets and liabilities. The objective of this program is to maintain an approximately balanced position in foreign currencies in order to minimize, on an after-tax basis, the effects of exchange rate changes on net monetary asset positions. The hedging program gains (losses) are largely taxable (tax deductible) in the United States (U.S.), whereas the offsetting exchange gains (losses) on the remeasurement of the net monetary asset positions are often not taxable (tax deductible) in their local jurisdictions. The net pre-tax exchange gains (losses) are recorded in other income (expense) - net and the related tax impact is recorded in provision for (benefit from) income taxes on continuing operations in the Consolidated Statements of Operations. | ||||||||||||||||
Three Months Ended December 31, | Twelve Months Ended December 31, | |||||||||||||||
2019 | 2018 | 2019 | 2018 | |||||||||||||
Subsidiary Monetary Position Gain (Loss) | ||||||||||||||||
Pre-tax exchange gains (losses) | $ | 18 | $ | (4 | ) | $ | (8 | ) | $ | (221 | ) | |||||
Local tax benefits (expenses) | 4 | (63 | ) | (11 | ) | (31 | ) | |||||||||
Net after tax impact from subsidiary exchange gains (losses) | $ | 22 | $ | (67 | ) | $ | (19 | ) | $ | (252 | ) | |||||
Hedging Program (Loss) Gain | ||||||||||||||||
Pre-tax exchange (losses) gains | $ | (47 | ) | $ | 67 | $ | (58 | ) | $ | 144 | ||||||
Tax benefits (expenses) | 11 | (15 | ) | 13 | (33 | ) | ||||||||||
Net after tax impact from hedging program exchange (losses) gains | $ | (36 | ) | $ | 52 | $ | (45 | ) | $ | 111 | ||||||
Total Exchange (Loss) Gain | ||||||||||||||||
Pre-tax exchange (losses) gains 1 | $ | (29 | ) | $ | 63 | $ | (66 | ) | $ | (77 | ) | |||||
Tax benefits (expenses) | 15 | (78 | ) | 2 | (64 | ) | ||||||||||
Net after tax exchange losses | $ | (14 | ) | $ | (15 | ) | $ | (64 | ) | $ | (141 | ) | ||||
As shown above, the "Total Exchange (Loss) Gain" is the sum of the "Subsidiary Monetary Position Loss" and the "Hedging Program Gain (Loss)." | ||||||||||||||||
1. Pre-tax exchange (losses) gains, net for the twelve months ended December 31, 2019, on an operating earnings basis (Non-GAAP), excludes a $(33) exchange loss associated with the devaluation of the Argentine peso. Pre-tax exchange loss, net for the twelve months ended December 31, 2018, on an operating earnings basis (Non-GAAP), excludes a $(50) exchange loss related to adjustments to foreign currency exchange contracts as a result of U.S. tax reform. | ||||||||||||||||
15
Corteva, Inc.
Article 11 Pro Forma Combined Statement of Operations
(Dollars in millions, except per share amounts)
Three Months Ended December 31, 2018 | |||||||||||||||||||
As Reported Corteva | Adjustments | Pro Forma Corteva | |||||||||||||||||
Merger1 | Debt Retirement2 | Separations Related3 | |||||||||||||||||
Net sales | $ | 2,815 | $ | — | $ | — | $ | — | $ | 2,815 | |||||||||
Cost of goods sold | 2,024 | (130 | ) | — | 12 | 1,906 | |||||||||||||
Research and development expense | 345 | — | — | (1 | ) | 344 | |||||||||||||
Selling, general and administrative expenses | 694 | — | — | — | 694 | ||||||||||||||
Amortization of intangibles | 107 | — | — | — | 107 | ||||||||||||||
Restructuring and asset related charges - net | 228 | — | — | — | 228 | ||||||||||||||
Integration and separation costs | 295 | — | — | (108 | ) | 187 | |||||||||||||
Other income - net | 131 | — | — | — | 131 | ||||||||||||||
Loss on early extinguishment of debt | 81 | — | (81 | ) | — | — | |||||||||||||
Interest expense | 86 | — | (61 | ) | — | 25 | |||||||||||||
Loss from continuing operations before income taxes | (914 | ) | 130 | 142 | 97 | (545 | ) | ||||||||||||
Provision for income taxes on continuing operations | 156 | 31 | 32 | (18 | ) | 201 | |||||||||||||
Loss from continuing operations after income taxes | (1,070 | ) | 99 | 110 | 115 | (746 | ) | ||||||||||||
Net income from continuing operations attributable to noncontrolling interests | 6 | — | — | — | 6 | ||||||||||||||
Net loss from continuing operations attributable to Corteva | $ | (1,076 | ) | $ | 99 | $ | 110 | $ | 115 | $ | (752 | ) | |||||||
Basic loss per share of common stock from continuing operations | $ | (1.44 | ) | $ | (1.00 | ) | |||||||||||||
Diluted loss per share of common stock from continuing operations | $ | (1.44 | ) | $ | (1.00 | ) | |||||||||||||
Average number of shares outstanding used in earnings per share (EPS) calculation (in millions): | |||||||||||||||||||
Basic | 749.4 | 749.4 | |||||||||||||||||
Diluted | 749.4 | 749.4 | |||||||||||||||||
1. | Related to the amortization of EID’s agriculture business’ inventory step-up recognized in connection with the Merger, as the incremental amortization is directly attributable to the Merger and will not have a continuing impact. |
2. | Represents removal of interest expense related to the debt redemptions/repayments and the removal of loss on extinguishment of debt related to the difference between the redemption price and the par value of the Make Whole Notes, the Term Loan Facility, and the SMR Notes, partially offset by the write-off of unamortized step-up related to the fair value step-up of EID’s debt. |
3. | Adjustments directly attributable to the separations and distributions of Corteva, Inc. include the following: removal of Telone® Soil Fumigant business (“Telone®”) results (as Telone® did not transfer to Corteva as part of the common control combination of DAS); impact from the distribution agreement entered into between Corteva and Dow that allows for Corteva to become the exclusive distributor of Telone® products for Dow; elimination of one-time transaction costs directly attributable to the Corteva Distribution; the impact of certain manufacturing, leasing and supply agreements entered into in connection with the Corteva Distribution; and the related tax impacts of these items. |
16
Corteva, Inc.
Article 11 Pro Forma Combined Statement of Operations
(Dollars in millions, except per share amounts)
Twelve Months Ended December 31, 2019 | |||||||||||||||||||
As Reported Corteva | Adjustments | Pro Forma Corteva | |||||||||||||||||
Merger1 | Debt Retirement2 | Separations Related3 | |||||||||||||||||
Net sales | $ | 13,846 | $ | — | $ | — | $ | — | $ | 13,846 | |||||||||
Cost of goods sold | 8,575 | (205 | ) | — | 16 | 8,386 | |||||||||||||
Research and development expense | 1,147 | — | — | — | 1,147 | ||||||||||||||
Selling, general and administrative expenses | 3,065 | — | — | 3 | 3,068 | ||||||||||||||
Amortization of intangibles | 475 | — | — | — | 475 | ||||||||||||||
Restructuring and asset related charges - net | 222 | — | — | — | 222 | ||||||||||||||
Integration and separation costs | 744 | — | — | (112 | ) | 632 | |||||||||||||
Other income - net | 215 | — | — | — | 215 | ||||||||||||||
Loss on early extinguishment of debt | 13 | — | — | — | 13 | ||||||||||||||
Interest expense | 136 | — | (45 | ) | — | 91 | |||||||||||||
(Loss) income from continuing operations before income taxes | (316 | ) | 205 | 45 | 93 | 27 | |||||||||||||
(Benefit from) provision for income taxes on continuing operations | (46 | ) | 36 | 10 | 1 | 1 | |||||||||||||
(Loss) income from continuing operations after income taxes | (270 | ) | 169 | 35 | 92 | 26 | |||||||||||||
Net income from continuing operations attributable to noncontrolling interests | 13 | — | — | — | 13 | ||||||||||||||
Net (loss) income from continuing operations attributable to Corteva | $ | (283 | ) | $ | 169 | $ | 35 | $ | 92 | $ | 13 | ||||||||
Basic (loss) earnings per share of common stock from continuing operations | $ | (0.38 | ) | $ | 0.02 | ||||||||||||||
Diluted (loss) earnings per share of common stock from continuing operations | $ | (0.38 | ) | $ | 0.02 | ||||||||||||||
Average number of shares outstanding used in earnings per share (EPS) calculation (in millions): | |||||||||||||||||||
Basic | 749.5 | 749.5 | |||||||||||||||||
Diluted | 749.5 | 749.5 | |||||||||||||||||
1. | Related to the amortization of EID’s agriculture business’ inventory step-up recognized in connection with the Merger, as the incremental amortization is directly attributable to the Merger and will not have a continuing impact. |
2. | Represents removal of interest expense related to the debt redemptions/repayments. |
3. | Adjustments directly attributable to the separations and distributions of Corteva, Inc. include the following: removal of Telone® Soil Fumigant business (“Telone®”) results (as Telone® did not transfer to Corteva as part of the common control combination of DAS); impact from the distribution agreement entered into between Corteva and Dow that allows for Corteva to become the exclusive distributor of Telone® products for Dow; elimination of one-time transaction costs directly attributable to the Corteva Distribution; the impact of certain manufacturing, leasing and supply agreements entered into in connection with the Corteva Distribution; and the related tax impacts of these items. |
17
Corteva, Inc.
Article 11 Pro Forma Combined Statement of Operations
(Dollars in millions, except per share amounts)
Twelve Months Ended December 31, 2018 | |||||||||||||||||||
As Reported Corteva | Adjustments | Pro Forma Corteva | |||||||||||||||||
Merger1 | Debt Retirement2 | Separations Related3 | |||||||||||||||||
Net sales | $ | 14,287 | $ | — | $ | — | $ | — | $ | 14,287 | |||||||||
Cost of goods sold | 9,948 | (1,554 | ) | — | 55 | 8,449 | |||||||||||||
Research and development expense | 1,355 | — | — | (3 | ) | 1,352 | |||||||||||||
Selling, general and administrative expenses | 3,041 | — | — | 1 | 3,042 | ||||||||||||||
Amortization of intangibles | 391 | — | — | — | 391 | ||||||||||||||
Restructuring and asset related charges - net | 694 | — | — | — | 694 | ||||||||||||||
Integration and separation costs | 992 | — | — | (421 | ) | 571 | |||||||||||||
Goodwill impairment charge | 4,503 | — | — | — | 4,503 | ||||||||||||||
Other income - net | 249 | — | — | — | 249 | ||||||||||||||
Loss on early extinguishment of debt | 81 | — | (81 | ) | — | — | |||||||||||||
Interest expense | 337 | — | (261 | ) | — | 76 | |||||||||||||
Loss from continuing operations before income taxes | (6,806 | ) | 1,554 | 342 | 368 | (4,542 | ) | ||||||||||||
(Benefit from) provision for income taxes on continuing operations | (31 | ) | 295 | 78 | 53 | 395 | |||||||||||||
Loss from continuing operations after income taxes | (6,775 | ) | 1,259 | 264 | 315 | (4,937 | ) | ||||||||||||
Net income from continuing operations attributable to noncontrolling interests | 29 | — | — | — | 29 | ||||||||||||||
Net loss from continuing operations attributable to Corteva | $ | (6,804 | ) | $ | 1,259 | $ | 264 | $ | 315 | $ | (4,966 | ) | |||||||
Basic loss per share of common stock from continuing operations | $ | (9.08 | ) | $ | (6.63 | ) | |||||||||||||
Diluted loss per share of common stock from continuing operations | $ | (9.08 | ) | $ | (6.63 | ) | |||||||||||||
Average number of shares outstanding used in earnings per share (EPS) calculation (in millions): | |||||||||||||||||||
Basic | 749.4 | 749.4 | |||||||||||||||||
Diluted | 749.4 | 749.4 | |||||||||||||||||
1. | Related to the amortization of EID’s agriculture business’ inventory step-up recognized in connection with the Merger, as the incremental amortization is directly attributable to the Merger and will not have a continuing impact. |
2. | Represents removal of interest expense related to the debt redemptions/repayments and the removal of loss on extinguishment of debt related to the difference between the redemption price and the par value of the Make Whole Notes, the Term Loan Facility, and the SMR Notes, partially offset by the write-off of unamortized step-up related to the fair value step-up of EID’s debt. |
3. | Adjustments directly attributable to the separations and distributions of Corteva, Inc. include the following: removal of Telone® Soil Fumigant business (“Telone®”) results (as Telone® did not transfer to Corteva as part of the common control combination of DAS); impact from the distribution agreement entered into between Corteva and Dow that allows for Corteva to become the exclusive distributor of Telone® products for Dow; elimination of one-time transaction costs directly attributable to the Corteva Distribution; the impact of certain manufacturing, leasing and supply agreements entered into in connection with the Corteva Distribution; and the related tax impacts of these items. |

DRAFT 4Q/FY 2019 Earnings Conference Call January 30, 2020 Insert Risk Classification
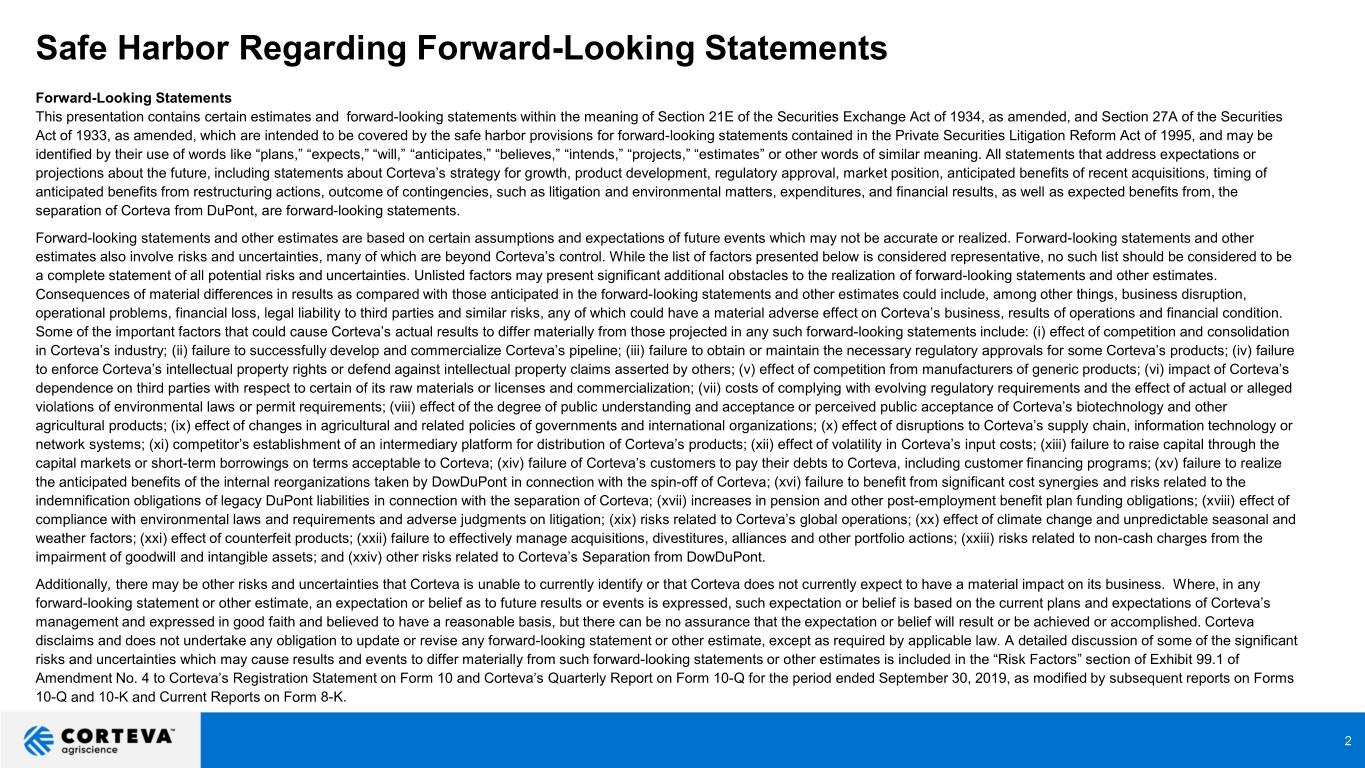
Safe Harbor Regarding Forward-Looking Statements Forward-Looking Statements This presentation contains certain estimates and forward-looking statements within the meaning of Section 21E of the Securities Exchange Act of 1934, as amended, and Section 27A of the Securities Act of 1933, as amended, which are intended to be covered by the safe harbor provisions for forward-looking statements contained in the Private Securities Litigation Reform Act of 1995, and may be identified by their use of words like “plans,” “expects,” “will,” “anticipates,” “believes,” “intends,” “projects,” “estimates” or other words of similar meaning. All statements that address expectations or projections about the future, including statements about Corteva’s strategy for growth, product development, regulatory approval, market position, anticipated benefits of recent acquisitions, timing of anticipated benefits from restructuring actions, outcome of contingencies, such as litigation and environmental matters, expenditures, and financial results, as well as expected benefits from, the separation of Corteva from DuPont, are forward-looking statements. Forward-looking statements and other estimates are based on certain assumptions and expectations of future events which may not be accurate or realized. Forward-looking statements and other estimates also involve risks and uncertainties, many of which are beyond Corteva’s control. While the list of factors presented below is considered representative, no such list should be considered to be a complete statement of all potential risks and uncertainties. Unlisted factors may present significant additional obstacles to the realization of forward-looking statements and other estimates. Consequences of material differences in results as compared with those anticipated in the forward-looking statements and other estimates could include, among other things, business disruption, operational problems, financial loss, legal liability to third parties and similar risks, any of which could have a material adverse effect on Corteva’s business, results of operations and financial condition. Some of the important factors that could cause Corteva’s actual results to differ materially from those projected in any such forward-looking statements include: (i) effect of competition and consolidation in Corteva’s industry; (ii) failure to successfully develop and commercialize Corteva’s pipeline; (iii) failure to obtain or maintain the necessary regulatory approvals for some Corteva’s products; (iv) failure to enforce Corteva’s intellectual property rights or defend against intellectual property claims asserted by others; (v) effect of competition from manufacturers of generic products; (vi) impact of Corteva’s dependence on third parties with respect to certain of its raw materials or licenses and commercialization; (vii) costs of complying with evolving regulatory requirements and the effect of actual or alleged violations of environmental laws or permit requirements; (viii) effect of the degree of public understanding and acceptance or perceived public acceptance of Corteva’s biotechnology and other agricultural products; (ix) effect of changes in agricultural and related policies of governments and international organizations; (x) effect of disruptions to Corteva’s supply chain, information technology or network systems; (xi) competitor’s establishment of an intermediary platform for distribution of Corteva’s products; (xii) effect of volatility in Corteva’s input costs; (xiii) failure to raise capital through the capital markets or short-term borrowings on terms acceptable to Corteva; (xiv) failure of Corteva’s customers to pay their debts to Corteva, including customer financing programs; (xv) failure to realize the anticipated benefits of the internal reorganizations taken by DowDuPont in connection with the spin-off of Corteva; (xvi) failure to benefit from significant cost synergies and risks related to the indemnification obligations of legacy DuPont liabilities in connection with the separation of Corteva; (xvii) increases in pension and other post-employment benefit plan funding obligations; (xviii) effect of compliance with environmental laws and requirements and adverse judgments on litigation; (xix) risks related to Corteva’s global operations; (xx) effect of climate change and unpredictable seasonal and weather factors; (xxi) effect of counterfeit products; (xxii) failure to effectively manage acquisitions, divestitures, alliances and other portfolio actions; (xxiii) risks related to non-cash charges from the impairment of goodwill and intangible assets; and (xxiv) other risks related to Corteva’s Separation from DowDuPont. Additionally, there may be other risks and uncertainties that Corteva is unable to currently identify or that Corteva does not currently expect to have a material impact on its business. Where, in any forward-looking statement or other estimate, an expectation or belief as to future results or events is expressed, such expectation or belief is based on the current plans and expectations of Corteva’s management and expressed in good faith and believed to have a reasonable basis, but there can be no assurance that the expectation or belief will result or be achieved or accomplished. Corteva disclaims and does not undertake any obligation to update or revise any forward-looking statement or other estimate, except as required by applicable law. A detailed discussion of some of the significant risks and uncertainties which may cause results and events to differ materially from such forward-looking statements or other estimates is included in the “Risk Factors” section of Exhibit 99.1 of Amendment No. 4 to Corteva’s Registration Statement on Form 10 and Corteva’s Quarterly Report on Form 10-Q for the period ended September 30, 2019, as modified by subsequent reports on Forms 10-Q and 10-K and Current Reports on Form 8-K. 2
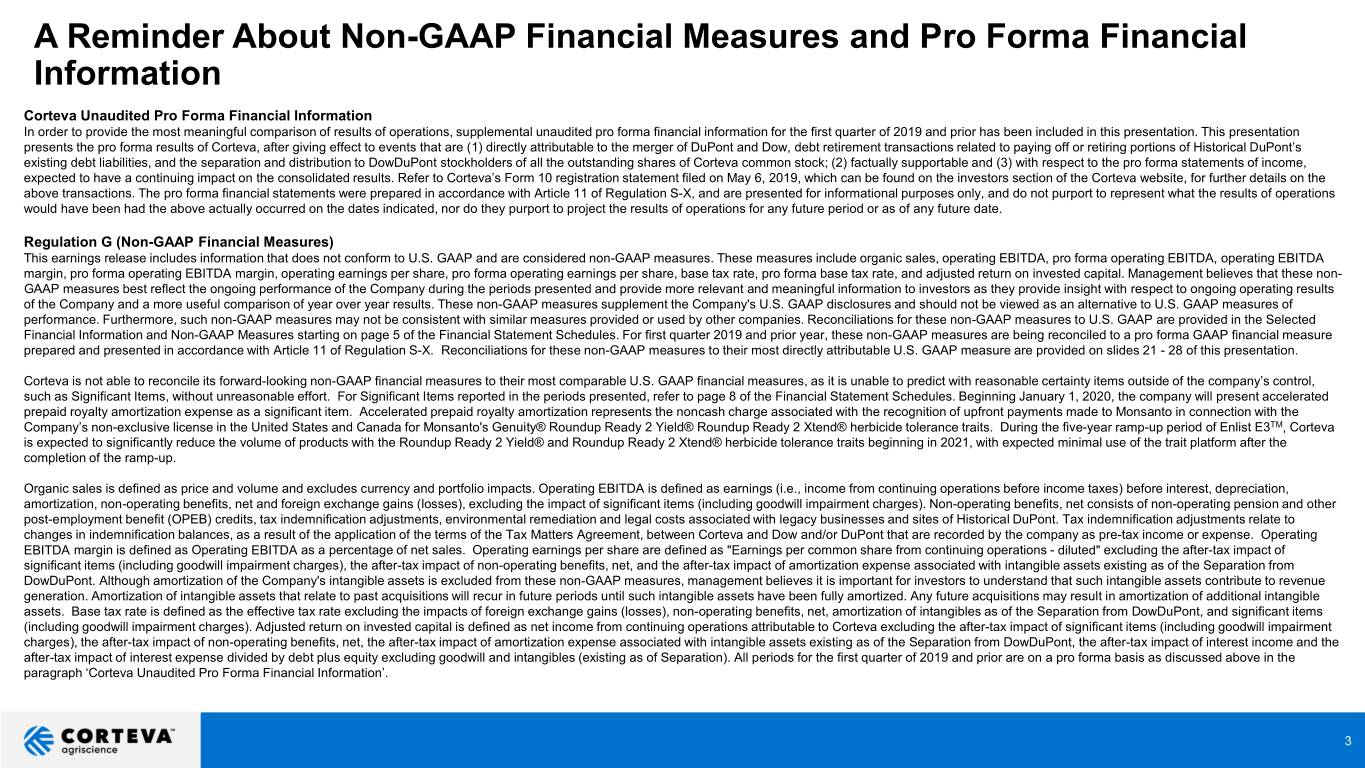
A Reminder About Non-GAAP Financial Measures and Pro Forma Financial Information Corteva Unaudited Pro Forma Financial Information In order to provide the most meaningful comparison of results of operations, supplemental unaudited pro forma financial information for the first quarter of 2019 and prior has been included in this presentation. This presentation presents the pro forma results of Corteva, after giving effect to events that are (1) directly attributable to the merger of DuPont and Dow, debt retirement transactions related to paying off or retiring portions of Historical DuPont’s existing debt liabilities, and the separation and distribution to DowDuPont stockholders of all the outstanding shares of Corteva common stock; (2) factually supportable and (3) with respect to the pro forma statements of income, expected to have a continuing impact on the consolidated results. Refer to Corteva’s Form 10 registration statement filed on May 6, 2019, which can be found on the investors section of the Corteva website, for further details on the above transactions. The pro forma financial statements were prepared in accordance with Article 11 of Regulation S-X, and are presented for informational purposes only, and do not purport to represent what the results of operations would have been had the above actually occurred on the dates indicated, nor do they purport to project the results of operations for any future period or as of any future date. Regulation G (Non-GAAP Financial Measures) This earnings release includes information that does not conform to U.S. GAAP and are considered non-GAAP measures. These measures include organic sales, operating EBITDA, pro forma operating EBITDA, operating EBITDA margin, pro forma operating EBITDA margin, operating earnings per share, pro forma operating earnings per share, base tax rate, pro forma base tax rate, and adjusted return on invested capital. Management believes that these non- GAAP measures best reflect the ongoing performance of the Company during the periods presented and provide more relevant and meaningful information to investors as they provide insight with respect to ongoing operating results of the Company and a more useful comparison of year over year results. These non-GAAP measures supplement the Company's U.S. GAAP disclosures and should not be viewed as an alternative to U.S. GAAP measures of performance. Furthermore, such non-GAAP measures may not be consistent with similar measures provided or used by other companies. Reconciliations for these non-GAAP measures to U.S. GAAP are provided in the Selected Financial Information and Non-GAAP Measures starting on page 5 of the Financial Statement Schedules. For first quarter 2019 and prior year, these non-GAAP measures are being reconciled to a pro forma GAAP financial measure prepared and presented in accordance with Article 11 of Regulation S-X. Reconciliations for these non-GAAP measures to their most directly attributable U.S. GAAP measure are provided on slides 21 - 28 of this presentation. Corteva is not able to reconcile its forward-looking non-GAAP financial measures to their most comparable U.S. GAAP financial measures, as it is unable to predict with reasonable certainty items outside of the company’s control, such as Significant Items, without unreasonable effort. For Significant Items reported in the periods presented, refer to page 8 of the Financial Statement Schedules. Beginning January 1, 2020, the company will present accelerated prepaid royalty amortization expense as a significant item. Accelerated prepaid royalty amortization represents the noncash charge associated with the recognition of upfront payments made to Monsanto in connection with the Company’s non-exclusive license in the United States and Canada for Monsanto's Genuity® Roundup Ready 2 Yield® Roundup Ready 2 Xtend® herbicide tolerance traits. During the five-year ramp-up period of Enlist E3TM, Corteva is expected to significantly reduce the volume of products with the Roundup Ready 2 Yield® and Roundup Ready 2 Xtend® herbicide tolerance traits beginning in 2021, with expected minimal use of the trait platform after the completion of the ramp-up. Organic sales is defined as price and volume and excludes currency and portfolio impacts. Operating EBITDA is defined as earnings (i.e., income from continuing operations before income taxes) before interest, depreciation, amortization, non-operating benefits, net and foreign exchange gains (losses), excluding the impact of significant items (including goodwill impairment charges). Non-operating benefits, net consists of non-operating pension and other post-employment benefit (OPEB) credits, tax indemnification adjustments, environmental remediation and legal costs associated with legacy businesses and sites of Historical DuPont. Tax indemnification adjustments relate to changes in indemnification balances, as a result of the application of the terms of the Tax Matters Agreement, between Corteva and Dow and/or DuPont that are recorded by the company as pre-tax income or expense. Operating EBITDA margin is defined as Operating EBITDA as a percentage of net sales. Operating earnings per share are defined as "Earnings per common share from continuing operations - diluted" excluding the after-tax impact of significant items (including goodwill impairment charges), the after-tax impact of non-operating benefits, net, and the after-tax impact of amortization expense associated with intangible assets existing as of the Separation from DowDuPont. Although amortization of the Company's intangible assets is excluded from these non-GAAP measures, management believes it is important for investors to understand that such intangible assets contribute to revenue generation. Amortization of intangible assets that relate to past acquisitions will recur in future periods until such intangible assets have been fully amortized. Any future acquisitions may result in amortization of additional intangible assets. Base tax rate is defined as the effective tax rate excluding the impacts of foreign exchange gains (losses), non-operating benefits, net, amortization of intangibles as of the Separation from DowDuPont, and significant items (including goodwill impairment charges). Adjusted return on invested capital is defined as net income from continuing operations attributable to Corteva excluding the after-tax impact of significant items (including goodwill impairment charges), the after-tax impact of non-operating benefits, net, the after-tax impact of amortization expense associated with intangible assets existing as of the Separation from DowDuPont, the after-tax impact of interest income and the after-tax impact of interest expense divided by debt plus equity excluding goodwill and intangibles (existing as of Separation). All periods for the first quarter of 2019 and prior are on a pro forma basis as discussed above in the paragraph ‘Corteva Unaudited Pro Forma Financial Information’. 3
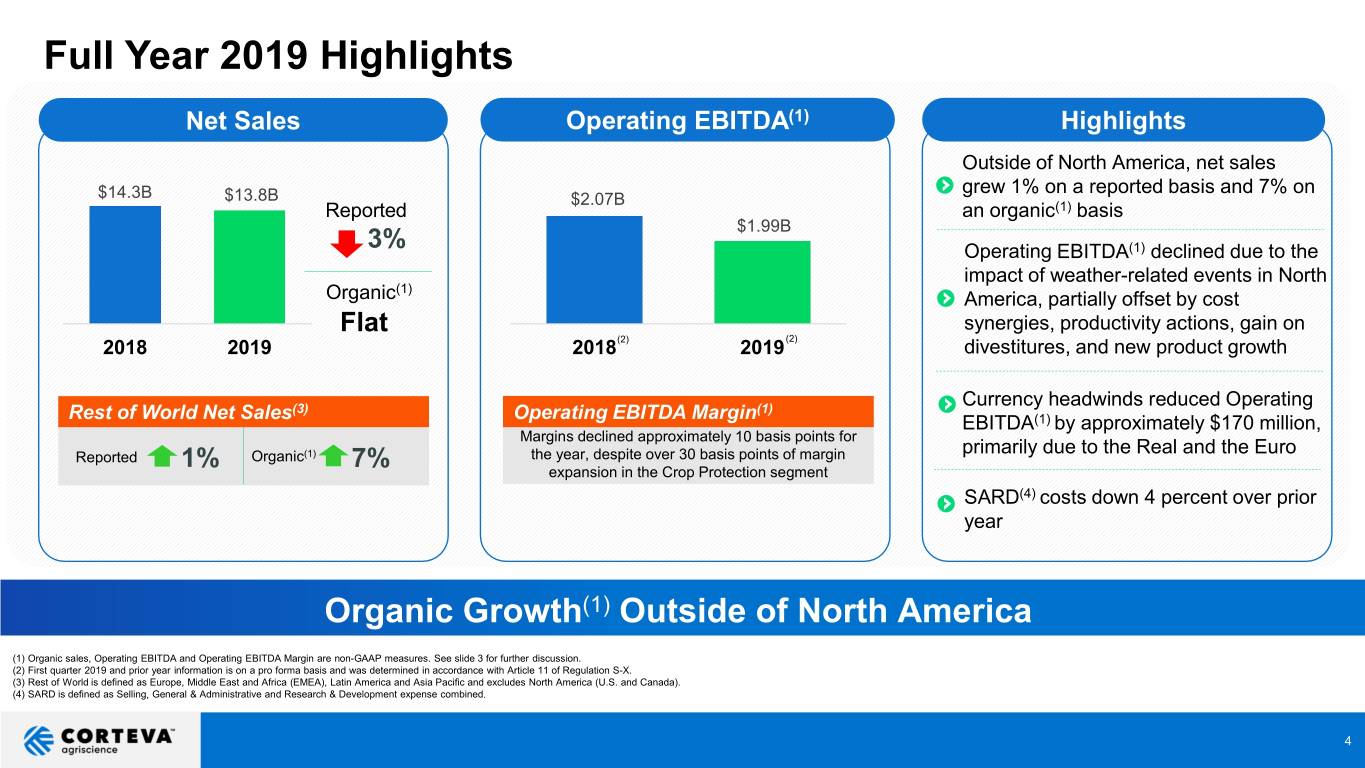
Full Year 2019 Highlights Net Sales Operating EBITDA(1) Highlights Outside of North America, net sales grew 1% on a reported basis and 7% on $14.3B $13.8B $2.07B Reported an organic(1) basis $1.99B 3% Operating EBITDA(1) declined due to the impact of weather-related events in North (1) Organic America, partially offset by cost synergies, productivity actions, gain on Flat (2) (2) 2018 2019 2018 2019 divestitures, and new product growth (3) (1) Currency headwinds reduced Operating Rest of World Net Sales Operating EBITDA Margin EBITDA(1) by approximately $170 million, Margins declined approximately 10 basis points for Reported Organic(1) the year, despite over 30 basis points of margin primarily due to the Real and the Euro 1% 7% expansion in the Crop Protection segment SARD(4) costs down 4 percent over prior year Organic Growth(1) Outside of North America (1) Organic sales, Operating EBITDA and Operating EBITDA Margin are non-GAAP measures. See slide 3 for further discussion. (2) First quarter 2019 and prior year information is on a pro forma basis and was determined in accordance with Article 11 of Regulation S-X. (3) Rest of World is defined as Europe, Middle East and Africa (EMEA), Latin America and Asia Pacific and excludes North America (U.S. and Canada). (4) SARD is defined as Selling, General & Administrative and Research & Development expense combined. 4
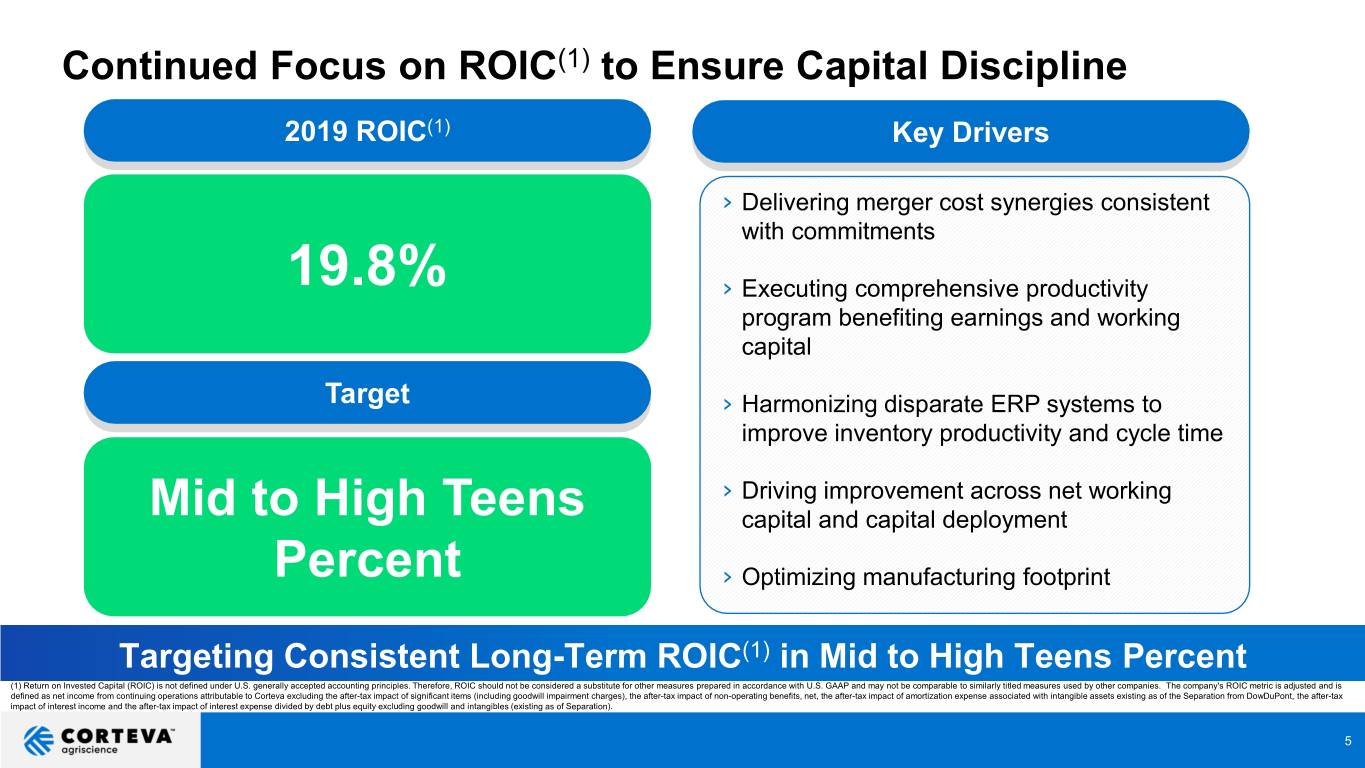
Continued Focus on ROIC(1) to Ensure Capital Discipline 2019 ROIC(1) Key Drivers › Delivering merger cost synergies consistent with commitments 19.8% › Executing comprehensive productivity program benefiting earnings and working capital Target › Harmonizing disparate ERP systems to improve inventory productivity and cycle time › Driving improvement across net working Mid to High Teens capital and capital deployment Percent › Optimizing manufacturing footprint Targeting Consistent Long-Term ROIC(1) in Mid to High Teens Percent (1) Return on Invested Capital (ROIC) is not defined under U.S. generally accepted accounting principles. Therefore, ROIC should not be considered a substitute for other measures prepared in accordance with U.S. GAAP and may not be comparable to similarly titled measures used by other companies. The company's ROIC metric is adjusted and is defined as net income from continuing operations attributable to Corteva excluding the after-tax impact of significant items (including goodwill impairment charges), the after-tax impact of non-operating benefits, net, the after-tax impact of amortization expense associated with intangible assets existing as of the Separation from DowDuPont, the after-tax impact of interest income and the after-tax impact of interest expense divided by debt plus equity excluding goodwill and intangibles (existing as of Separation). 5
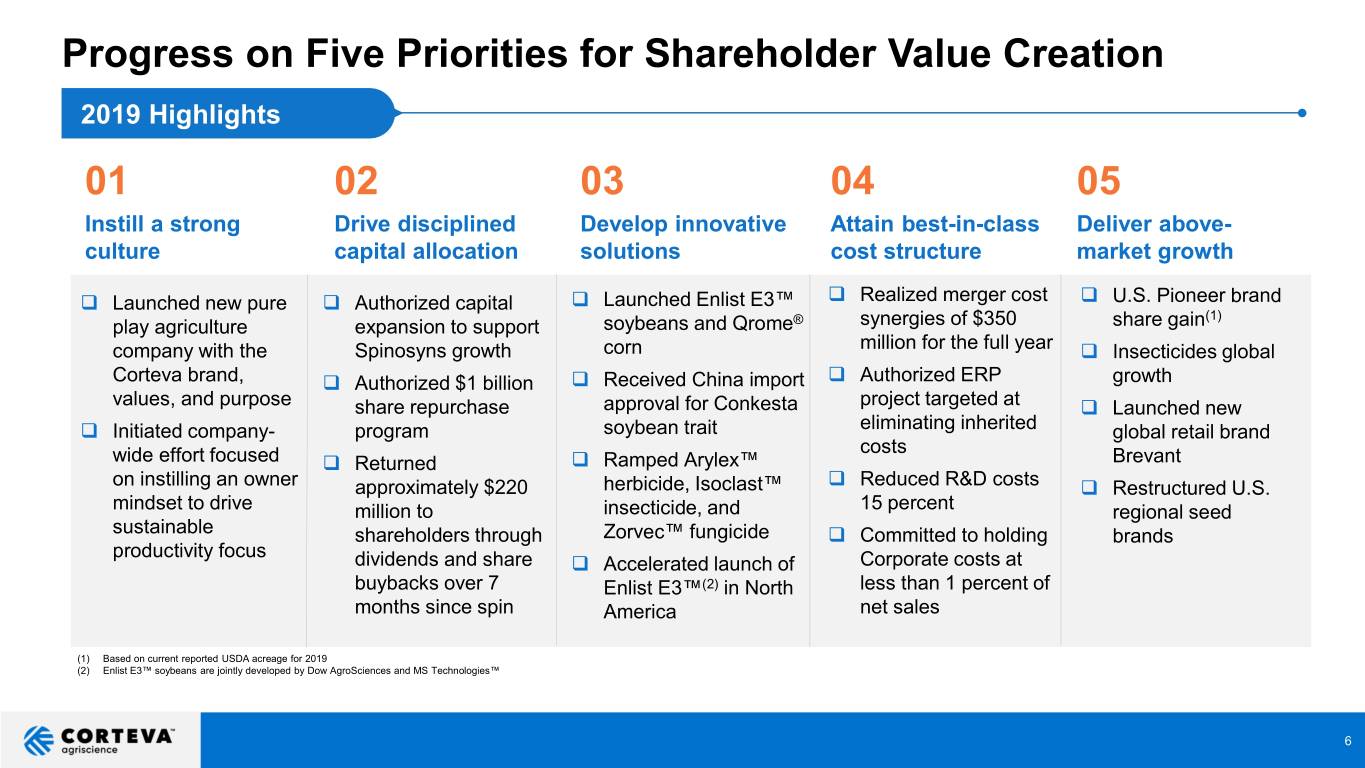
Progress on Five Priorities for Shareholder Value Creation 2019 Highlights 01 02 03 04 05 Instill a strong Drive disciplined Develop innovative Attain best-in-class Deliver above- culture capital allocation solutions cost structure market growth Launched new pure Authorized capital Launched Enlist E3™ Realized merger cost U.S. Pioneer brand (1) play agriculture expansion to support soybeans and Qrome® synergies of $350 share gain company with the Spinosyns growth corn million for the full year Insecticides global Corteva brand, Authorized $1 billion Received China import Authorized ERP growth values, and purpose share repurchase approval for Conkesta project targeted at Launched new Initiated company- program soybean trait eliminating inherited global retail brand costs wide effort focused Returned Ramped Arylex™ Brevant on instilling an owner approximately $220 herbicide, Isoclast™ Reduced R&D costs Restructured U.S. mindset to drive million to insecticide, and 15 percent regional seed sustainable shareholders through Zorvec™ fungicide Committed to holding brands productivity focus dividends and share Accelerated launch of Corporate costs at buybacks over 7 Enlist E3™(2) in North less than 1 percent of months since spin America net sales (1) Based on current reported USDA acreage for 2019 (2) Enlist E3™ soybeans are jointly developed by Dow AgroSciences and MS Technologies™ 6
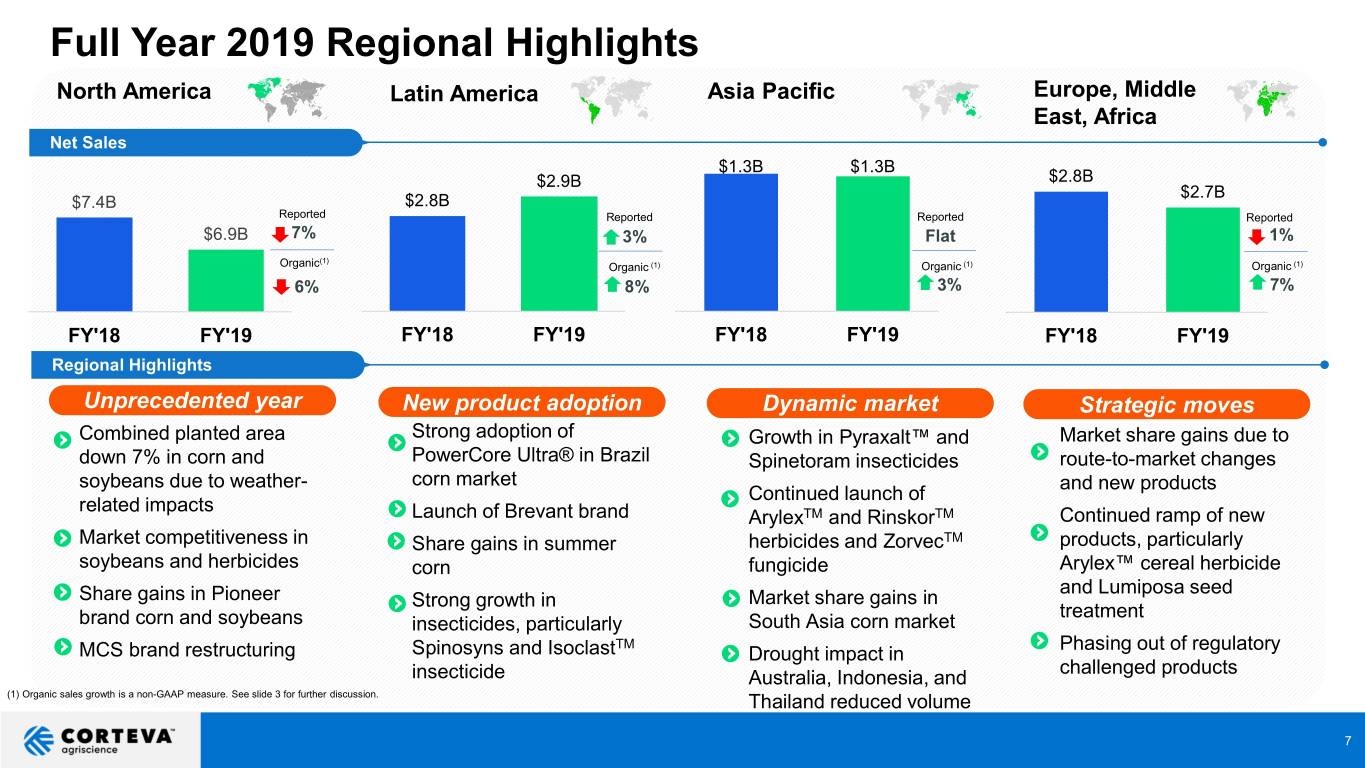
Full Year 2019 Regional Highlights North America Latin America Asia Pacific Europe, Middle East, Africa Net Sales $1.3B $1.3B $2.9B $2.8B $2.7B $7.4B $2.8B Reported Reported Reported Reported $6.9B 7% 3% Flat 1% (1) Organic Organic (1) Organic (1) Organic (1) 6% 8% 3% 7% FY'18 FY'19 FY'18 FY'19 FY'18 FY'19 FY'18 FY'19 Regional Highlights Unprecedented year New product adoption Dynamic market Strategic moves Combined planted area Strong adoption of Growth in Pyraxalt™ and Market share gains due to down 7% in corn and PowerCore Ultra® in Brazil Spinetoram insecticides route-to-market changes soybeans due to weather- corn market and new products Continued launch of related impacts Launch of Brevant brand ArylexTM and RinskorTM Continued ramp of new Market competitiveness in Share gains in summer herbicides and ZorvecTM products, particularly soybeans and herbicides corn fungicide Arylex™ cereal herbicide and Lumiposa seed Share gains in Pioneer Strong growth in Market share gains in treatment brand corn and soybeans insecticides, particularly South Asia corn market TM Phasing out of regulatory MCS brand restructuring Spinosyns and Isoclast Drought impact in challenged products insecticide Australia, Indonesia, and (1) Organic sales growth is a non-GAAP measure. See slide 3 for further discussion. Thailand reduced volume 7
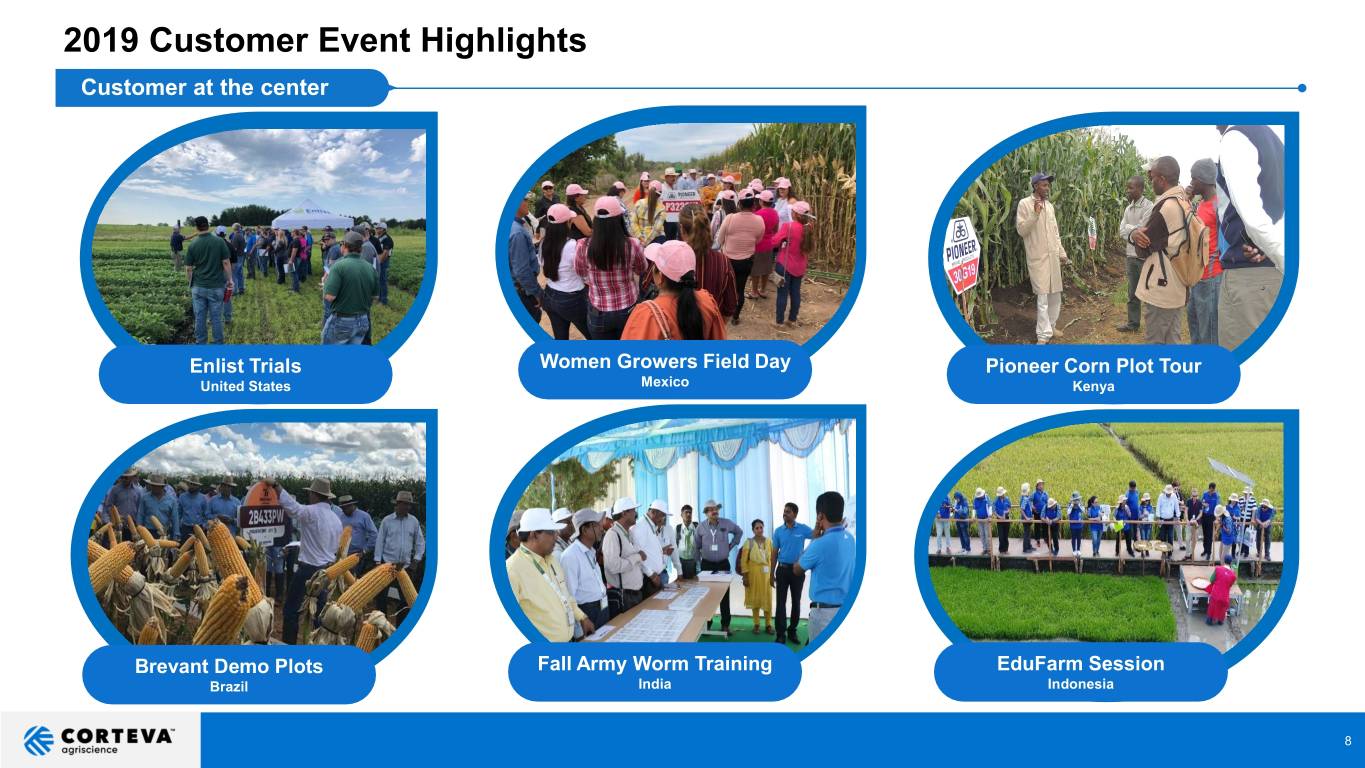
2019 Customer Event Highlights Customer at the center Enlist Trials Women Growers Field Day Pioneer Corn Plot Tour United States Mexico Kenya Brevant Demo Plots Fall Army Worm Training EduFarm Session Brazil India Indonesia 8
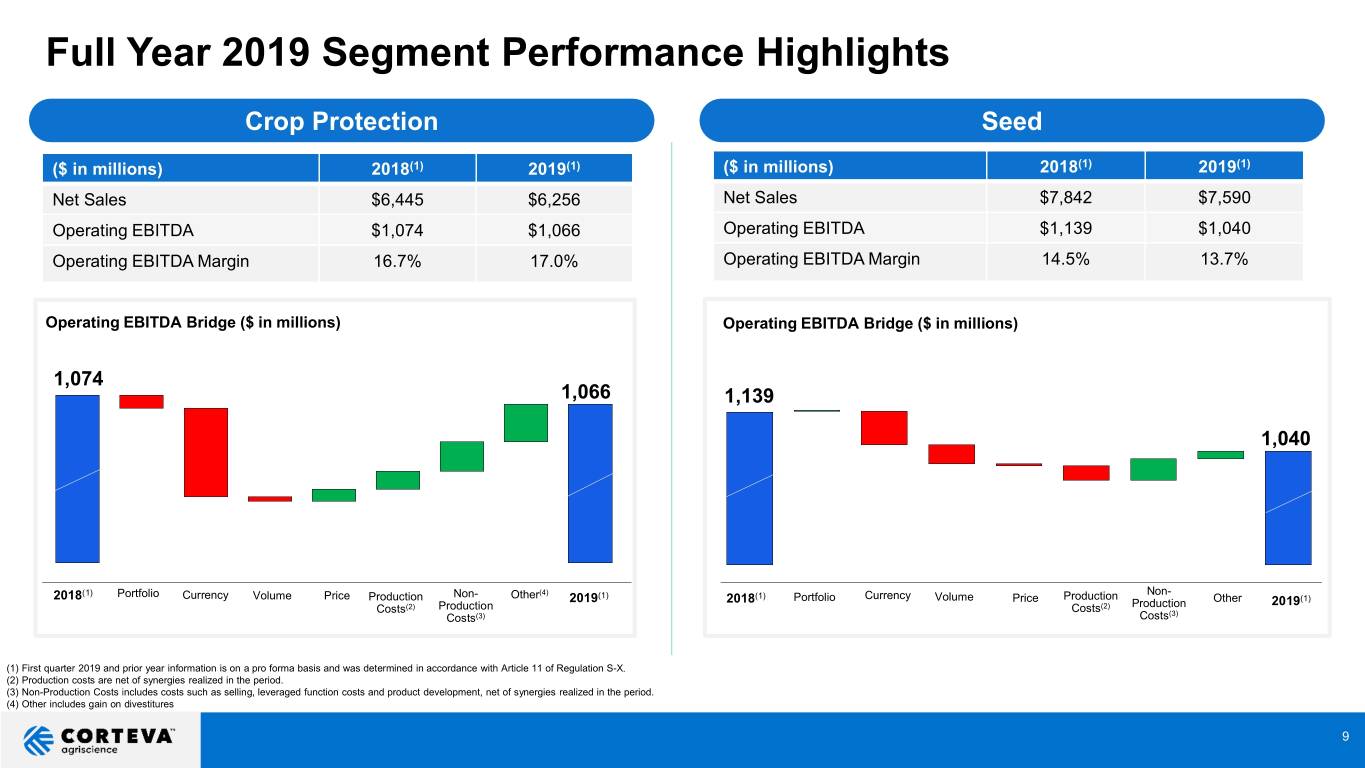
Full Year 2019 Segment Performance Highlights Crop Protection Seed ($ in millions) 2018(1) 2019(1) ($ in millions) 2018(1) 2019(1) Net Sales $6,445 $6,256 Net Sales $7,842 $7,590 Operating EBITDA $1,074 $1,066 Operating EBITDA $1,139 $1,040 Operating EBITDA Margin 16.7% 17.0% Operating EBITDA Margin 14.5% 13.7% Operating EBITDA Bridge ($ in millions) Operating EBITDA Bridge ($ in millions) 1,074 1,066 1,139 1,040 (1) Portfolio Currency Non- Other(4) (1) (1) Currency Non- 2018 Volume Price Production 2019 2018 Portfolio Volume Price Production Other 2019(1) Costs(2) Production Costs(2) Production Costs(3) Costs(3) (1) First quarter 2019 and prior year information is on a pro forma basis and was determined in accordance with Article 11 of Regulation S-X. (2) Production costs are net of synergies realized in the period. (3) Non-Production Costs includes costs such as selling, leveraged function costs and product development, net of synergies realized in the period. (4) Other includes gain on divestitures 9
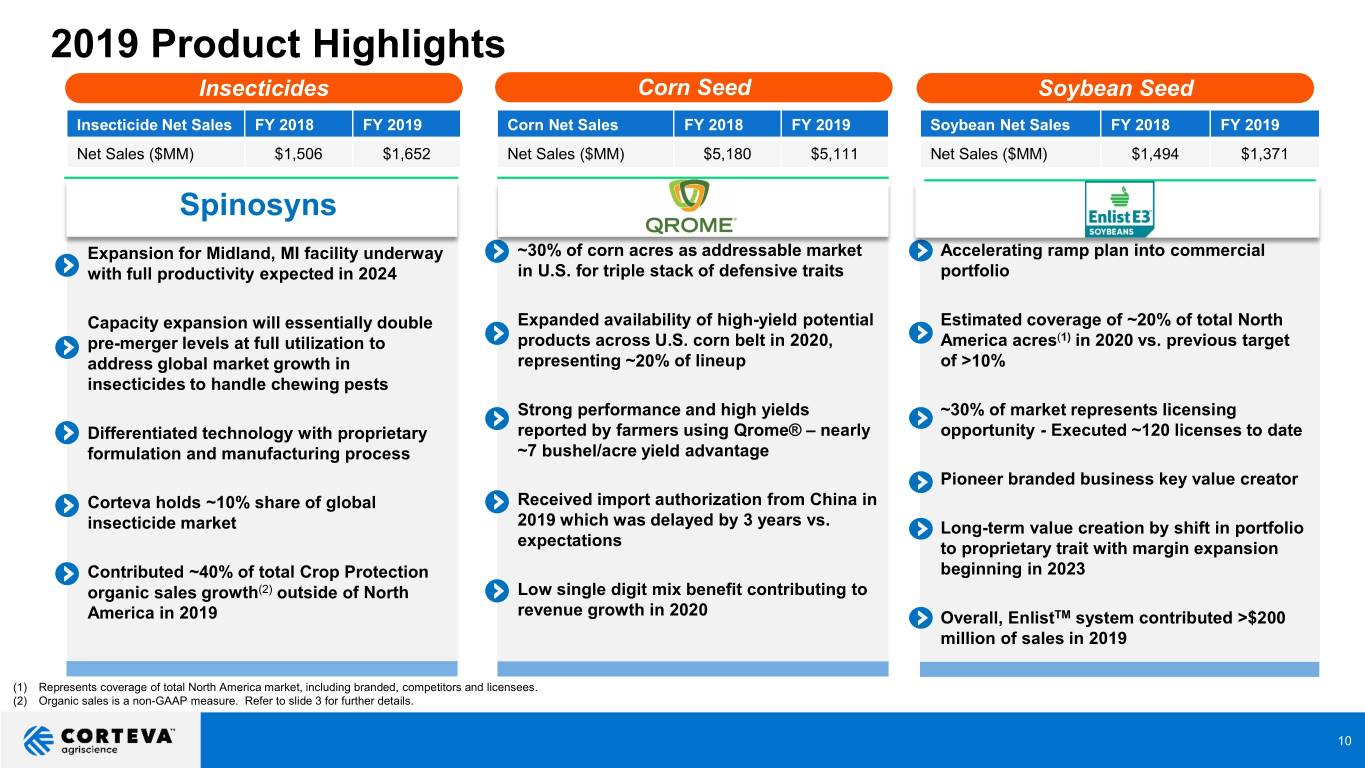
2019 Product Highlights Insecticides Corn Seed Soybean Seed Insecticide Net Sales FY 2018 FY 2019 Corn Net Sales FY 2018 FY 2019 Soybean Net Sales FY 2018 FY 2019 Net Sales ($MM) $1,506 $1,652 Net Sales ($MM) $5,180 $5,111 Net Sales ($MM) $1,494 $1,371 Spinosyns Expansion for Midland, MI facility underway ~30% of corn acres as addressable market Accelerating ramp plan into commercial with full productivity expected in 2024 in U.S. for triple stack of defensive traits portfolio Capacity expansion will essentially double Expanded availability of high-yield potential Estimated coverage of ~20% of total North pre-merger levels at full utilization to products across U.S. corn belt in 2020, America acres(1) in 2020 vs. previous target address global market growth in representing ~20% of lineup of >10% insecticides to handle chewing pests Strong performance and high yields ~30% of market represents licensing Differentiated technology with proprietary reported by farmers using Qrome® – nearly opportunity - Executed ~120 licenses to date formulation and manufacturing process ~7 bushel/acre yield advantage Pioneer branded business key value creator Corteva holds ~10% share of global Received import authorization from China in insecticide market 2019 which was delayed by 3 years vs. Long-term value creation by shift in portfolio expectations to proprietary trait with margin expansion Contributed ~40% of total Crop Protection beginning in 2023 organic sales growth(2) outside of North Low single digit mix benefit contributing to America in 2019 revenue growth in 2020 Overall, EnlistTM system contributed >$200 million of sales in 2019 (1) Represents coverage of total North America market, including branded, competitors and licensees. (2) Organic sales is a non-GAAP measure. Refer to slide 3 for further details. 10
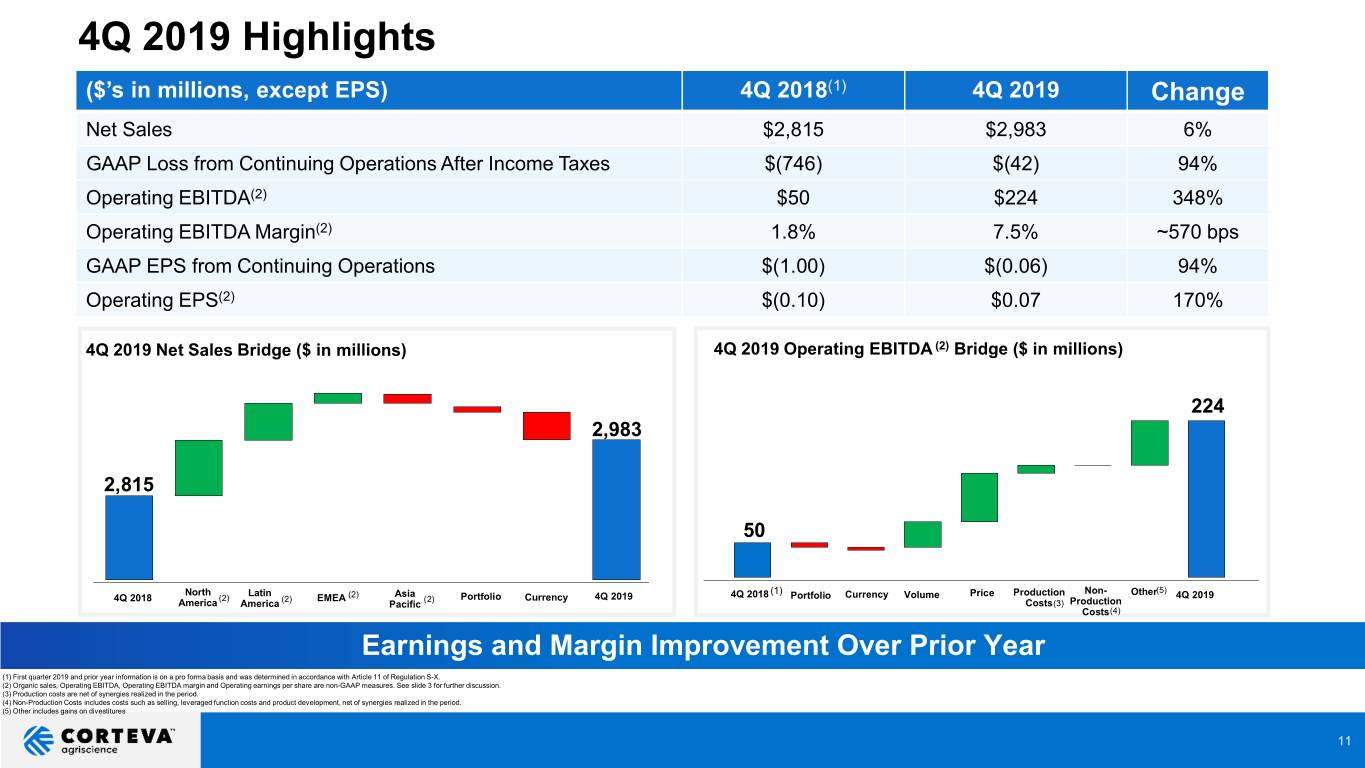
4Q 2019 Highlights ($’s in millions, except EPS) 4Q 2018(1) 4Q 2019 Change Net Sales $2,815 $2,983 6% GAAP Loss from Continuing Operations After Income Taxes $(746) $(42) 94% Operating EBITDA(2) $50 $224 348% Operating EBITDA Margin(2) 1.8% 7.5% ~570 bps GAAP EPS from Continuing Operations $(1.00) $(0.06) 94% Operating EPS(2) $(0.10) $0.07 170% 4Q 2019 Net Sales Bridge ($ in millions) 4Q 2019 Operating EBITDA (2) Bridge ($ in millions) 224 2,983 2,815 50 (5) North Latin (2) Asia (1) Price Production Non- Other 4Q 2018 (2) (2) EMEA (2) Portfolio Currency 4Q 2019 4Q 2018 Portfolio Currency Volume 4Q 2019 America America Pacific Costs(3) Production Costs(4) Earnings and Margin Improvement Over Prior Year (1) First quarter 2019 and prior year information is on a pro forma basis and was determined in accordance with Article 11 of Regulation S-X. (2) Organic sales, Operating EBITDA, Operating EBITDA margin and Operating earnings per share are non-GAAP measures. See slide 3 for further discussion. (3) Production costs are net of synergies realized in the period. (4) Non-Production Costs includes costs such as selling, leveraged function costs and product development, net of synergies realized in the period. (5) Other includes gains on divestitures 11
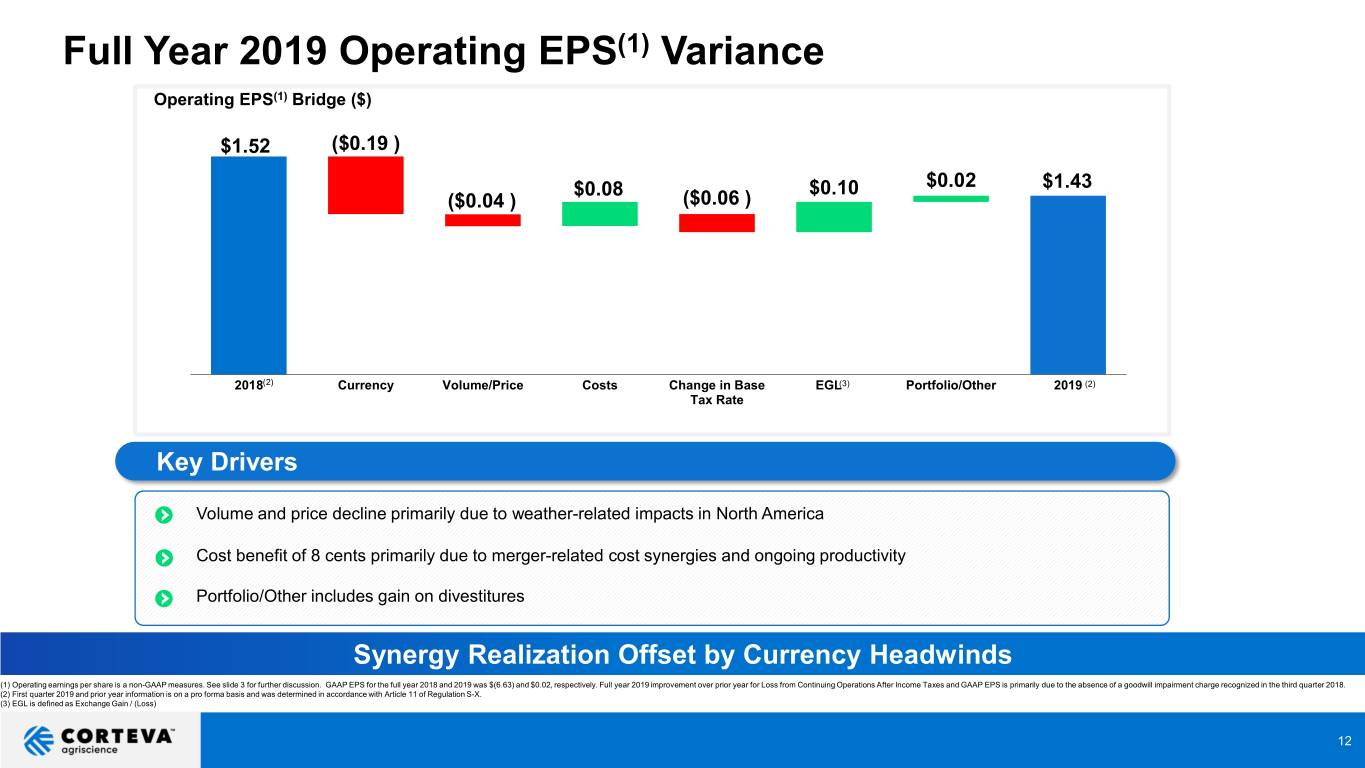
Full Year 2019 Operating EPS(1) Variance Operating EPS(1) Bridge ($) $1.52 ($0.19 ) $0.08 $0.10 $0.02 $1.43 ($0.04 ) ($0.06 ) 2018(2) Currency Volume/Price Costs Change in Base EGL(3) Portfolio/Other 2019 (2) Tax Rate Key Drivers Volume and price decline primarily due to weather-related impacts in North America Cost benefit of 8 cents primarily due to merger-related cost synergies and ongoing productivity Portfolio/Other includes gain on divestitures Synergy Realization Offset by Currency Headwinds (1) Operating earnings per share is a non-GAAP measures. See slide 3 for further discussion. GAAP EPS for the full year 2018 and 2019 was $(6.63) and $0.02, respectively. Full year 2019 improvement over prior year for Loss from Continuing Operations After Income Taxes and GAAP EPS is primarily due to the absence of a goodwill impairment charge recognized in the third quarter 2018. (2) First quarter 2019 and prior year information is on a pro forma basis and was determined in accordance with Article 11 of Regulation S-X. (3) EGL is defined as Exchange Gain / (Loss) 12
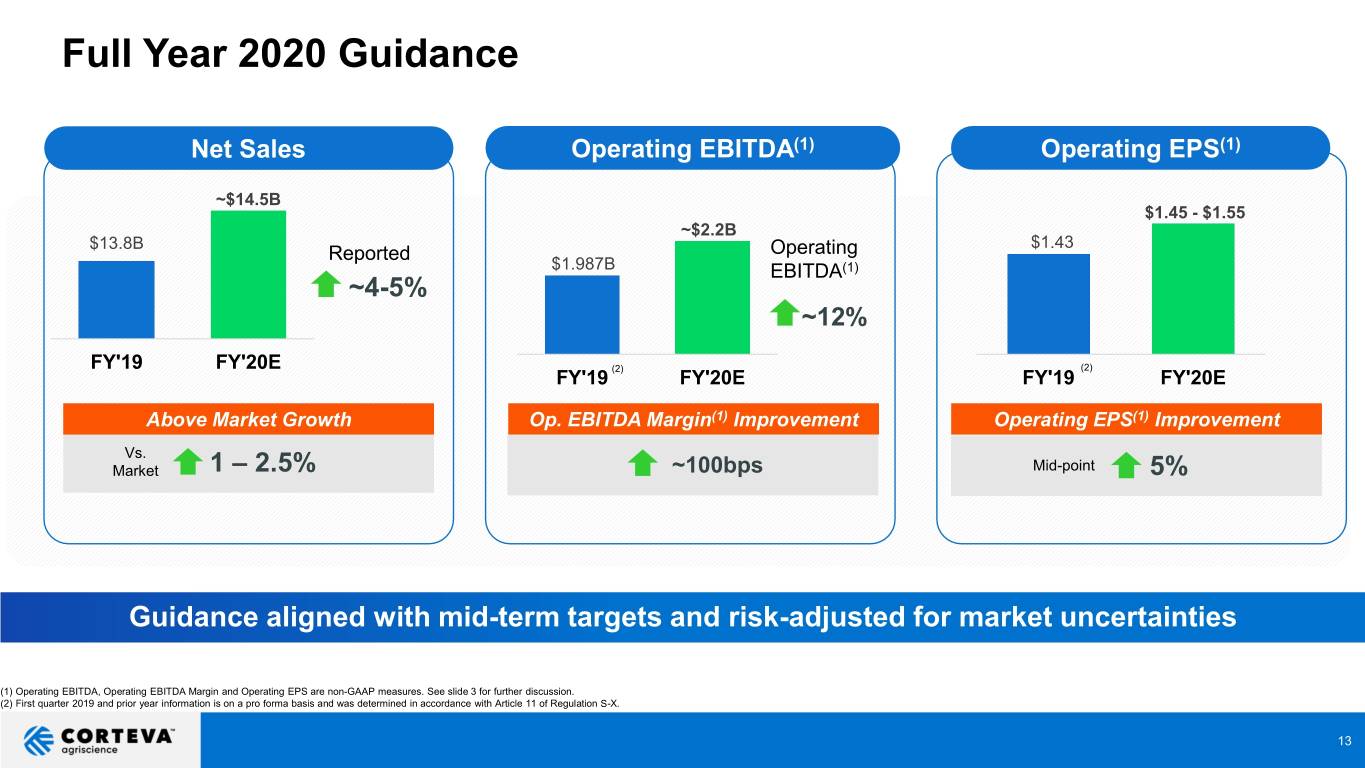
Full Year 2020 Guidance Net Sales Operating EBITDA(1) Operating EPS(1) ~$14.5B $1.45 - $1.55 ~$2.2B $13.8B $1.43 Reported Operating $1.987B EBITDA(1) ~4-5% ~12% FY'19 FY'20E (2) (2) FY'19 FY'20E FY'19 FY'20E Above Market Growth Op. EBITDA Margin(1) Improvement Operating EPS(1) Improvement Vs. Market 1 – 2.5% ~100bps Mid-point 5% Guidance aligned with mid-term targets and risk-adjusted for market uncertainties (1) Operating EBITDA, Operating EBITDA Margin and Operating EPS are non-GAAP measures. See slide 3 for further discussion. (2) First quarter 2019 and prior year information is on a pro forma basis and was determined in accordance with Article 11 of Regulation S-X. 13
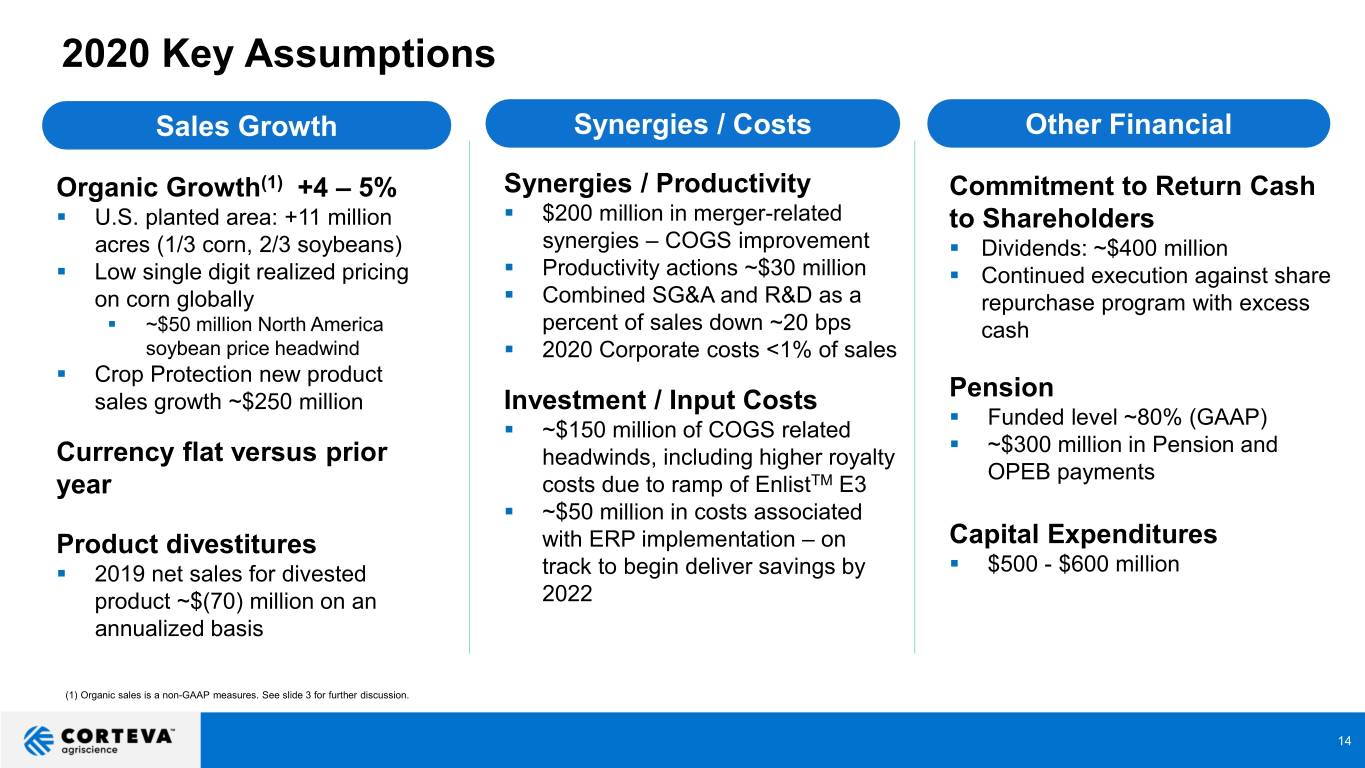
2020 Key Assumptions Sales Growth Synergies / Costs Other Financial Organic Growth(1) +4 – 5% Synergies / Productivity Commitment to Return Cash . U.S. planted area: +11 million . $200 million in merger-related to Shareholders acres (1/3 corn, 2/3 soybeans) synergies – COGS improvement . Dividends: ~$400 million . Low single digit realized pricing . Productivity actions ~$30 million . Continued execution against share on corn globally . Combined SG&A and R&D as a repurchase program with excess . ~$50 million North America percent of sales down ~20 bps cash soybean price headwind . 2020 Corporate costs <1% of sales . Crop Protection new product sales growth ~$250 million Investment / Input Costs Pension . Funded level ~80% (GAAP) . ~$150 million of COGS related . ~$300 million in Pension and Currency flat versus prior headwinds, including higher royalty OPEB payments year costs due to ramp of EnlistTM E3 . ~$50 million in costs associated Product divestitures with ERP implementation – on Capital Expenditures . . 2019 net sales for divested track to begin deliver savings by $500 - $600 million product ~$(70) million on an 2022 annualized basis (1) Organic sales is a non-GAAP measures. See slide 3 for further discussion. 14

15
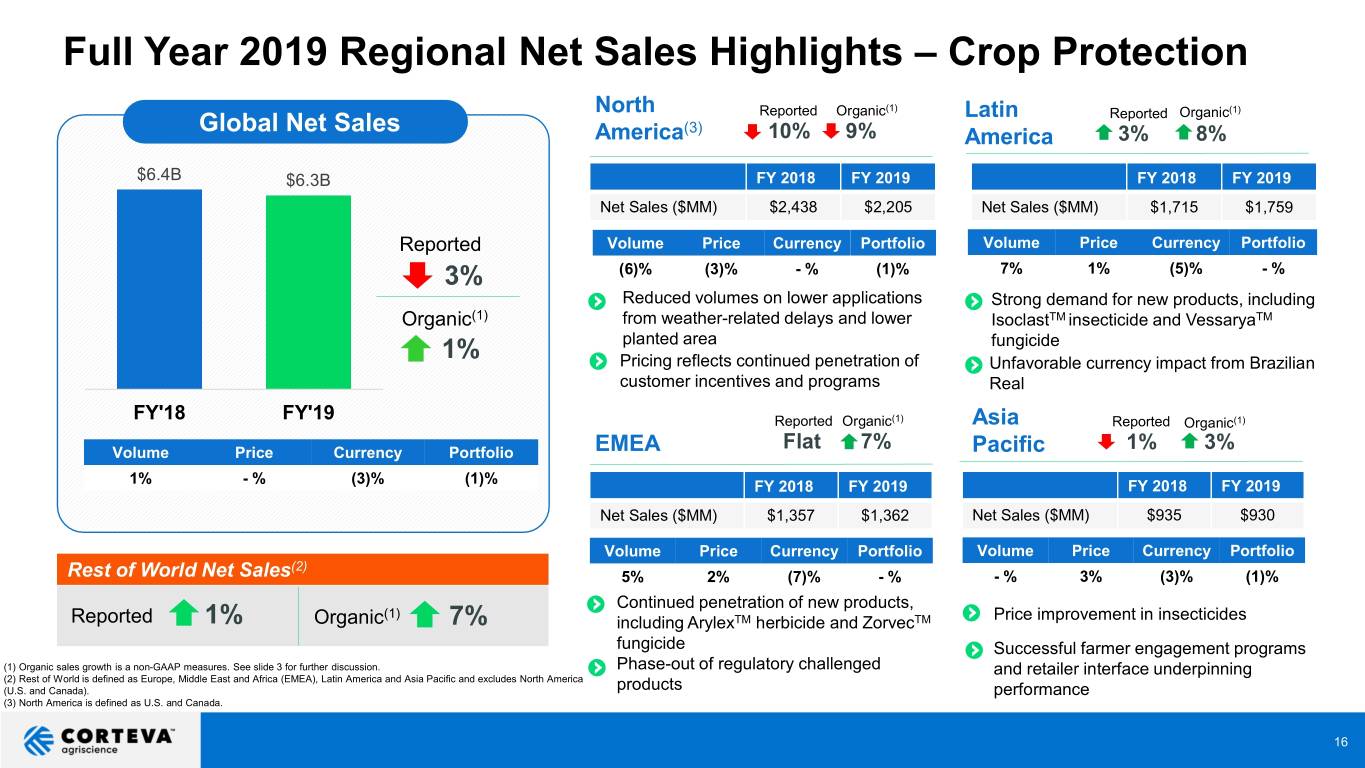
Full Year 2019 Regional Net Sales Highlights – Crop Protection North Reported Organic(1) Latin Reported Organic(1) Global Net Sales (3) America 10% 9% America 3% 8% $6.4B $6.3B FY 2018 FY 2019 FY 2018 FY 2019 Net Sales ($MM) $2,438 $2,205 Net Sales ($MM) $1,715 $1,759 Reported Volume Price Currency Portfolio Volume Price Currency Portfolio 3% (6)% (3)% - % (1)% 7% 1% (5)% - % Reduced volumes on lower applications Strong demand for new products, including Organic(1) from weather-related delays and lower IsoclastTM insecticide and VessaryaTM planted area fungicide 1% Pricing reflects continued penetration of Unfavorable currency impact from Brazilian customer incentives and programs Real FY'18 FY'19 Reported Organic(1) Asia Reported Organic(1) Volume Price Currency Portfolio EMEA Flat 7% Pacific 1% 3% 1% - % (3)% (1)% FY 2018 FY 2019 FY 2018 FY 2019 Net Sales ($MM) $1,357 $1,362 Net Sales ($MM) $935 $930 Volume Price Currency Portfolio Volume Price Currency Portfolio (2) Rest of World Net Sales 5% 2% (7)% - % - % 3% (3)% (1)% Continued penetration of new products, (1) Price improvement in insecticides Reported 1% Organic 7% including ArylexTM herbicide and ZorvecTM fungicide Successful farmer engagement programs (1) Organic sales growth is a non-GAAP measures. See slide 3 for further discussion. Phase-out of regulatory challenged and retailer interface underpinning (2) Rest of World is defined as Europe, Middle East and Africa (EMEA), Latin America and Asia Pacific and excludes North America (U.S. and Canada). products performance (3) North America is defined as U.S. and Canada. 16
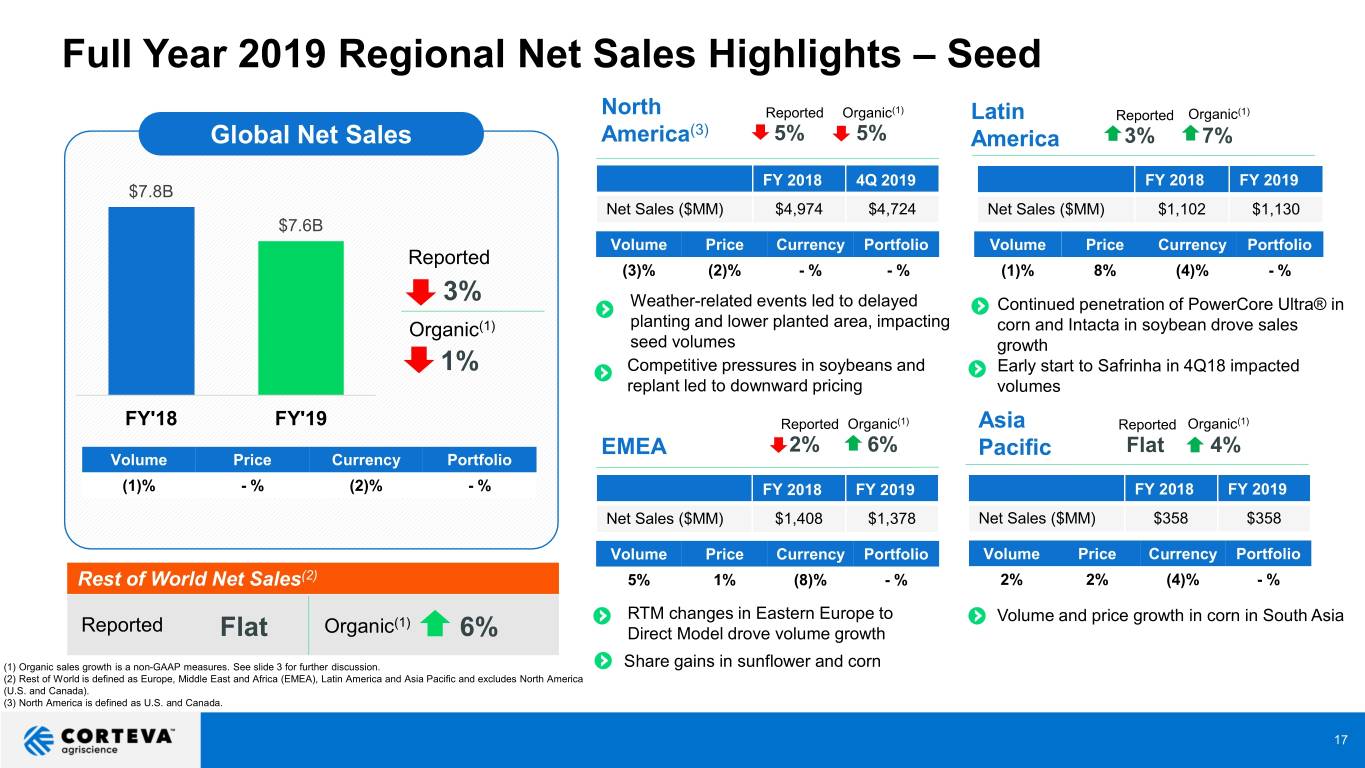
Full Year 2019 Regional Net Sales Highlights – Seed North Reported Organic(1) Latin Reported Organic(1) (3) Global Net Sales America 5% 5% America 3% 7% FY 2018 4Q 2019 FY 2018 FY 2019 $7.8B Net Sales ($MM) $4,974 $4,724 Net Sales ($MM) $1,102 $1,130 $7.6B Volume Price Currency Portfolio Volume Price Currency Portfolio Reported (3)% (2)% - % - % (1)% 8% (4)% - % 3% Weather-related events led to delayed Continued penetration of PowerCore Ultra® in Organic(1) planting and lower planted area, impacting corn and Intacta in soybean drove sales seed volumes growth 1% Competitive pressures in soybeans and Early start to Safrinha in 4Q18 impacted replant led to downward pricing volumes FY'18 FY'19 Reported Organic(1) Asia Reported Organic(1) EMEA 2% 6% Flat 4% Volume Price Currency Portfolio Pacific (1)% - % (2)% - % FY 2018 FY 2019 FY 2018 FY 2019 Net Sales ($MM) $1,408 $1,378 Net Sales ($MM) $358 $358 Volume Price Currency Portfolio Volume Price Currency Portfolio Rest of World Net Sales(2) 5% 1% (8)% - % 2% 2% (4)% - % (1) RTM changes in Eastern Europe to Volume and price growth in corn in South Asia Reported Flat Organic 6% Direct Model drove volume growth (1) Organic sales growth is a non-GAAP measures. See slide 3 for further discussion. Share gains in sunflower and corn (2) Rest of World is defined as Europe, Middle East and Africa (EMEA), Latin America and Asia Pacific and excludes North America (U.S. and Canada). (3) North America is defined as U.S. and Canada. 17
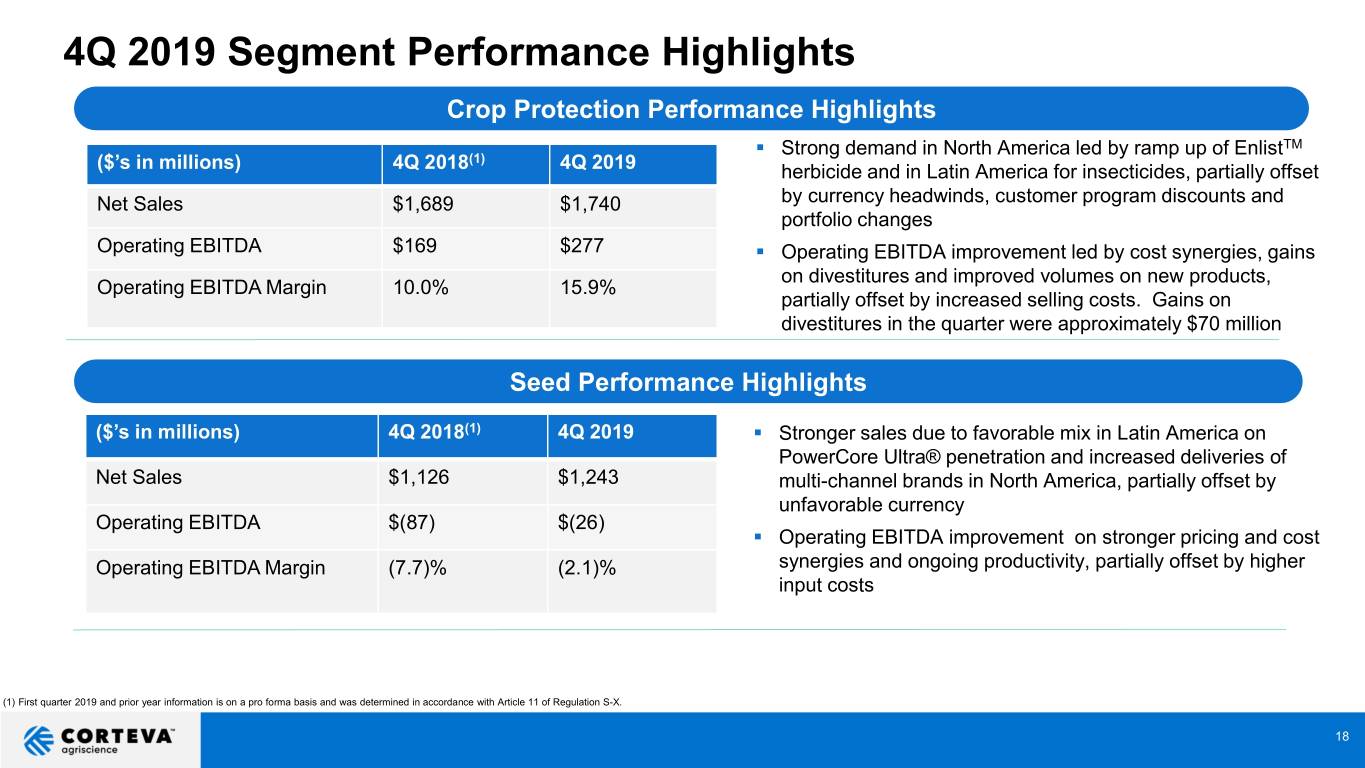
4Q 2019 Segment Performance Highlights Crop Protection Performance Highlights . Strong demand in North America led by ramp up of EnlistTM (1) ($’s in millions) 4Q 2018 4Q 2019 herbicide and in Latin America for insecticides, partially offset Net Sales $1,689 $1,740 by currency headwinds, customer program discounts and portfolio changes Operating EBITDA $169 $277 . Operating EBITDA improvement led by cost synergies, gains on divestitures and improved volumes on new products, Operating EBITDA Margin 10.0% 15.9% partially offset by increased selling costs. Gains on divestitures in the quarter were approximately $70 million Seed Performance Highlights ($’s in millions) 4Q 2018(1) 4Q 2019 . Stronger sales due to favorable mix in Latin America on PowerCore Ultra® penetration and increased deliveries of Net Sales $1,126 $1,243 multi-channel brands in North America, partially offset by unfavorable currency Operating EBITDA $(87) $(26) . Operating EBITDA improvement on stronger pricing and cost Operating EBITDA Margin (7.7)% (2.1)% synergies and ongoing productivity, partially offset by higher input costs (1) First quarter 2019 and prior year information is on a pro forma basis and was determined in accordance with Article 11 of Regulation S-X. 18
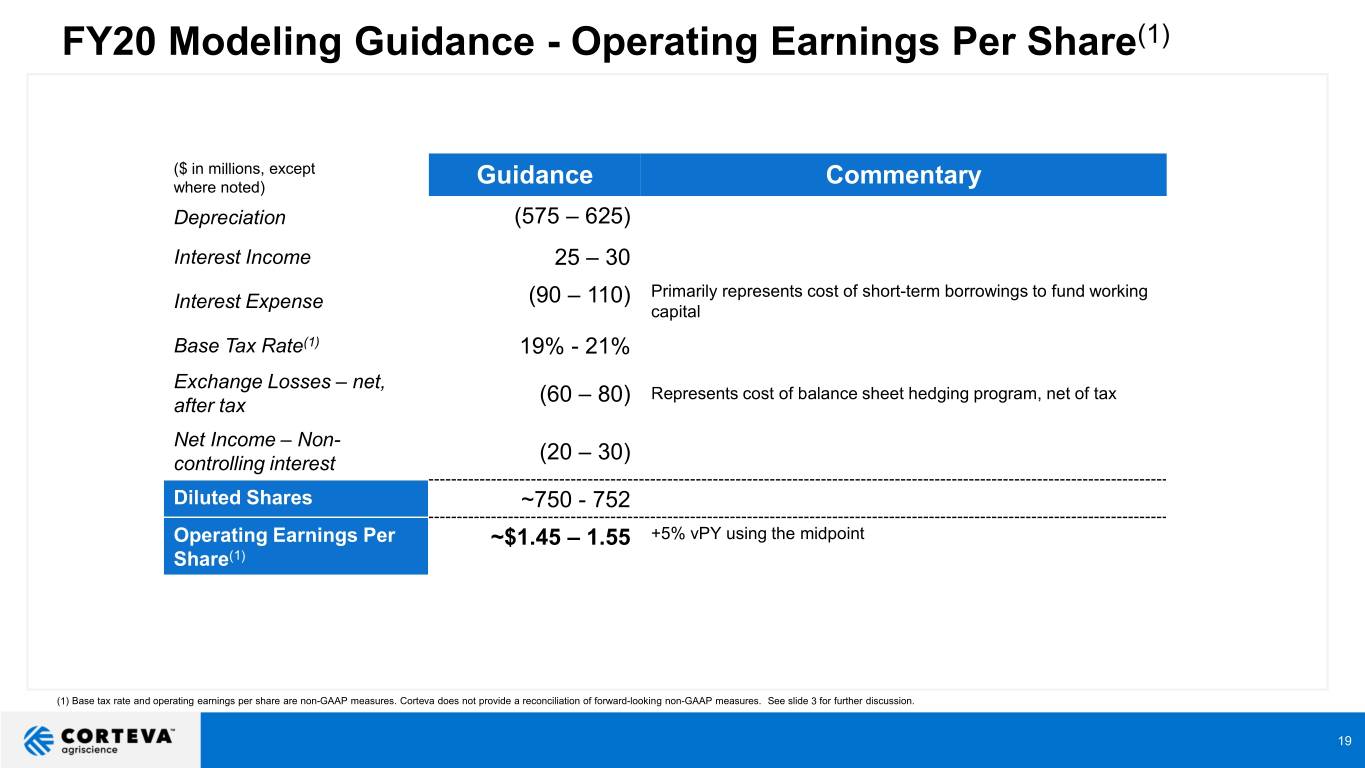
FY20 Modeling Guidance - Operating Earnings Per Share(1) ($ in millions, except where noted) Guidance Commentary Depreciation (575 – 625) Interest Income 25 – 30 (90 – 110) Primarily represents cost of short-term borrowings to fund working Interest Expense capital Base Tax Rate(1) 19% - 21% Exchange Losses – net, Represents cost of balance sheet hedging program, net of tax after tax (60 – 80) Net Income – Non- controlling interest (20 – 30) Diluted Shares ~750 - 752 Operating Earnings Per ~$1.45 – 1.55 +5% vPY using the midpoint Share(1) (1) Base tax rate and operating earnings per share are non-GAAP measures. Corteva does not provide a reconciliation of forward-looking non-GAAP measures. See slide 3 for further discussion. 19
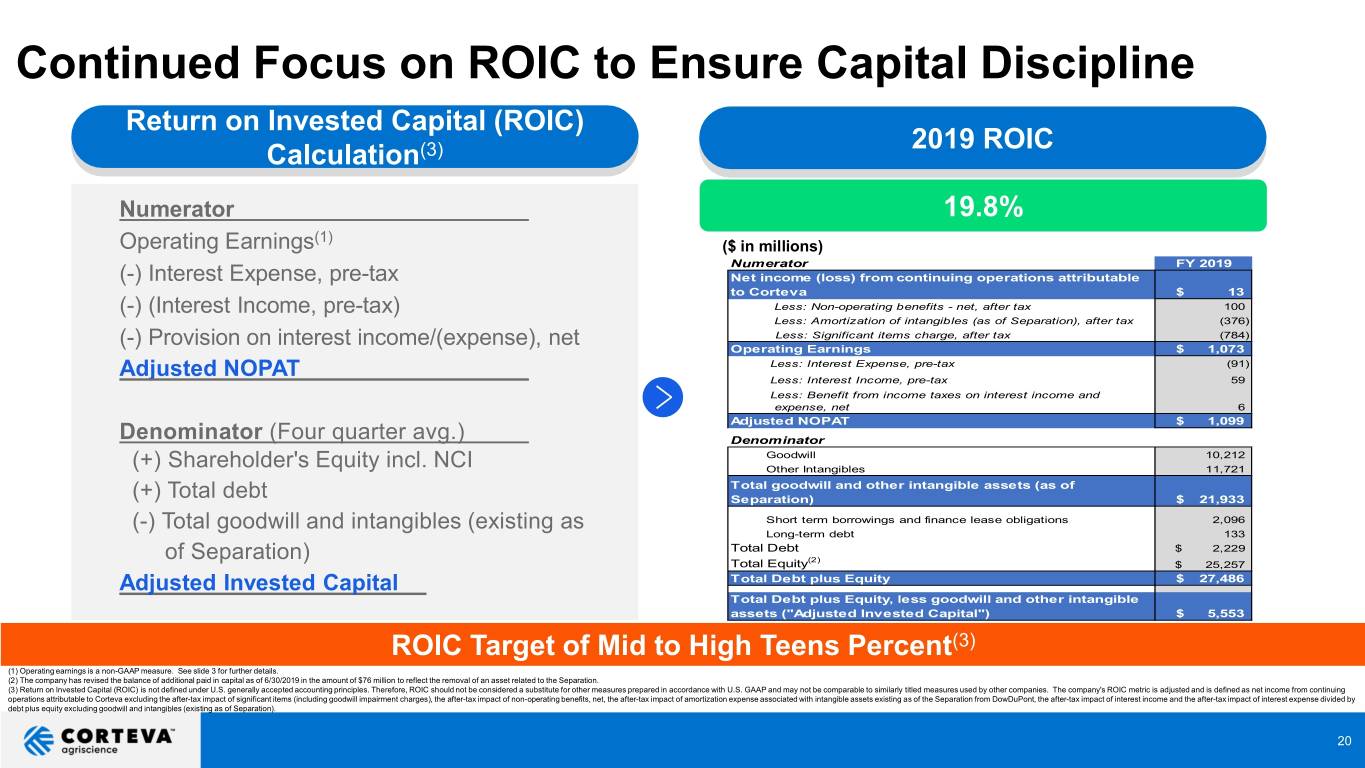
Continued Focus on ROIC to Ensure Capital Discipline Return on Invested Capital (ROIC) 2019 ROIC Calculation(3) Numerator 19.8% (1) Operating Earnings ($ in millions) Numerator FY 2019 (-) Interest Expense, pre-tax Net income (loss) from continuing operations attributable to Corteva $ 13 (-) (Interest Income, pre-tax) Less: Non-operating benefits - net, after tax 100 Less: Amortization of intangibles (as of Separation), after tax (376) Less: Significant(1) items charge, after tax (784) (-) Provision on interest income/(expense), net Operating Earnings $ 1,073 Less: Interest Expense, pre-tax (91) Adjusted NOPAT Less: Interest Income, pre-tax 59 Less: Benefit from income taxes on interest income and expense, net 6 Adjusted NOPAT $ 1,099 Denominator (Four quarter avg.) Denominator Goodwill 10,212 (+) Shareholder's Equity incl. NCI Other Intangibles 11,721 Total goodwill and other intangible assets (as of (+) Total debt Separation) $ 21,933 Short term borrowings and finance lease obligations 2,096 (-) Total goodwill and intangibles (existing as Long-term debt 133 Total Debt $ 2,229 (2) of Separation) Total Equity $ 25,257 Adjusted Invested Capital Total Debt plus Equity $ 27,486 Total Debt plus Equity, less goodwill and other intangible assets ("Adjusted Invested Capital") $ 5,553 ROIC Target of Mid to High Teens Percent(3) (1) Operating earnings is a non-GAAP measure. See slide 3 for further details. (2) The company has revised the balance of additional paid in capital as of 6/30/2019 in the amount of $76 million to reflect the removal of an asset related to the Separation. (3) Return on Invested Capital (ROIC) is not defined under U.S. generally accepted accounting principles. Therefore, ROIC should not be considered a substitute for other measures prepared in accordance with U.S. GAAP and may not be comparable to similarly titled measures used by other companies. The company's ROIC metric is adjusted and is defined as net income from continuing operations attributable to Corteva excluding the after-tax impact of significant items (including goodwill impairment charges), the after-tax impact of non-operating benefits, net, the after-tax impact of amortization expense associated with intangible assets existing as of the Separation from DowDuPont, the after-tax impact of interest income and the after-tax impact of interest expense divided by debt plus equity excluding goodwill and intangibles (existing as of Separation). 20
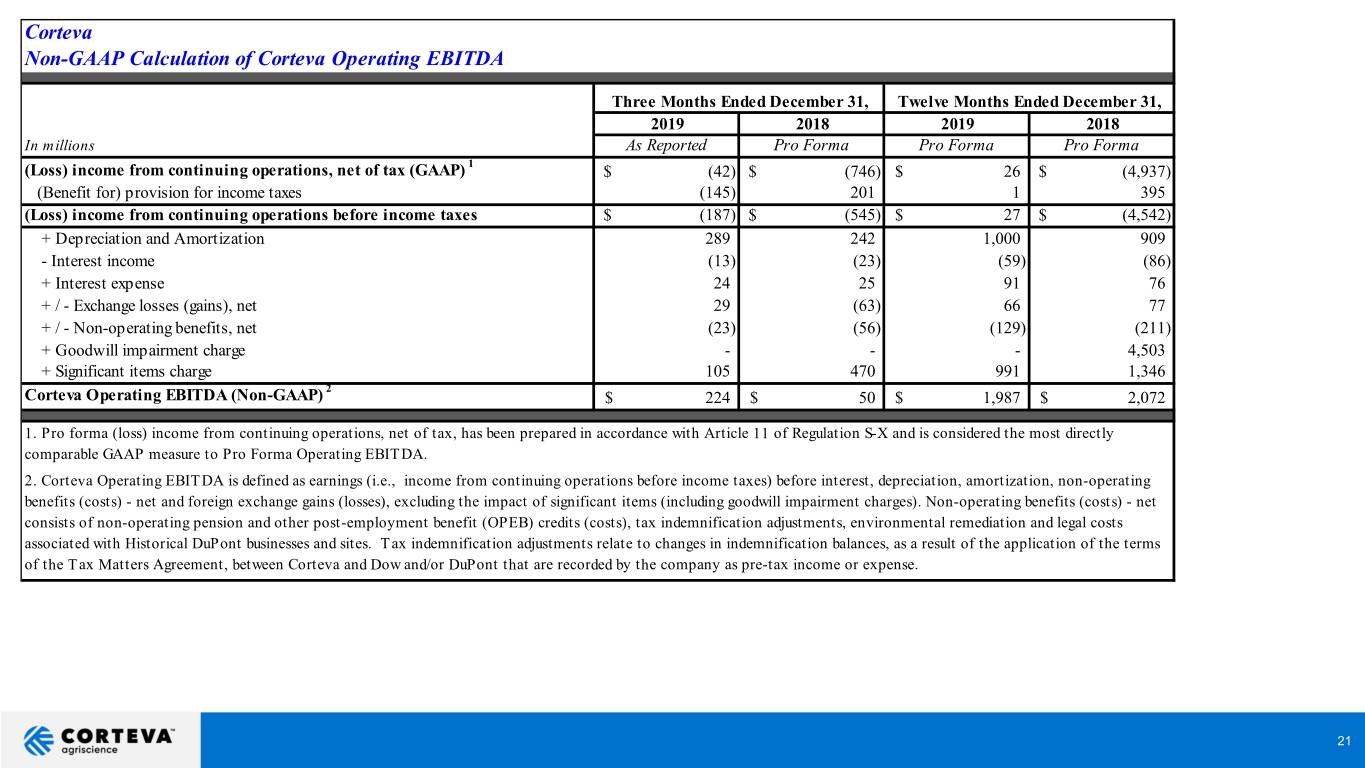
Corteva Non-GAAP Calculation of Corteva Operating EBITDA Three Months Ended December 31, Twelve Months Ended December 31, 2019 2018 2019 2018 In millions As Reported Pro Forma Pro Forma Pro Forma 1 (Loss) income from continuing operations, net of tax (GAAP) $ (42) $ (746) $ 26 $ (4,937) (Benefit for) provision for income taxes (145) 201 1 395 (Loss) income from continuing operations before income taxes $ (187) $ (545) $ 27 $ (4,542) + Depreciation and Amortization 289 242 1,000 909 - Interest income (13) (23) (59) (86) + Interest expense 24 25 91 76 + / - Exchange losses (gains), net 29 (63) 66 77 + / - Non-operating benefits, net (23) (56) (129) (211) + Goodwill impairment charge - - - 4,503 + Significant items charge 105 470 991 1,346 2 Corteva Operating EBITDA (Non-GAAP) $ 224 $ 50 $ 1,987 $ 2,072 1. Pro forma (loss) income from continuing operations, net of tax, has been prepared in accordance with Article 11 of Regulation S-X and is considered the most directly comparable GAAP measure to Pro Forma Operating EBITDA. 2. Corteva Operating EBITDA is defined as earnings (i.e., income from continuing operations before income taxes) before interest, depreciation, amortization, non-operating benefits (costs) - net and foreign exchange gains (losses), excluding the impact of significant items (including goodwill impairment charges). Non-operating benefits (costs) - net consists of non-operating pension and other post-employment benefit (OPEB) credits (costs), tax indemnification adjustments, environmental remediation and legal costs associated with Historical DuPont businesses and sites. Tax indemnification adjustments relate to changes in indemnification balances, as a result of the application of the terms of the Tax Matters Agreement, between Corteva and Dow and/or DuPont that are recorded by the company as pre-tax income or expense. 21
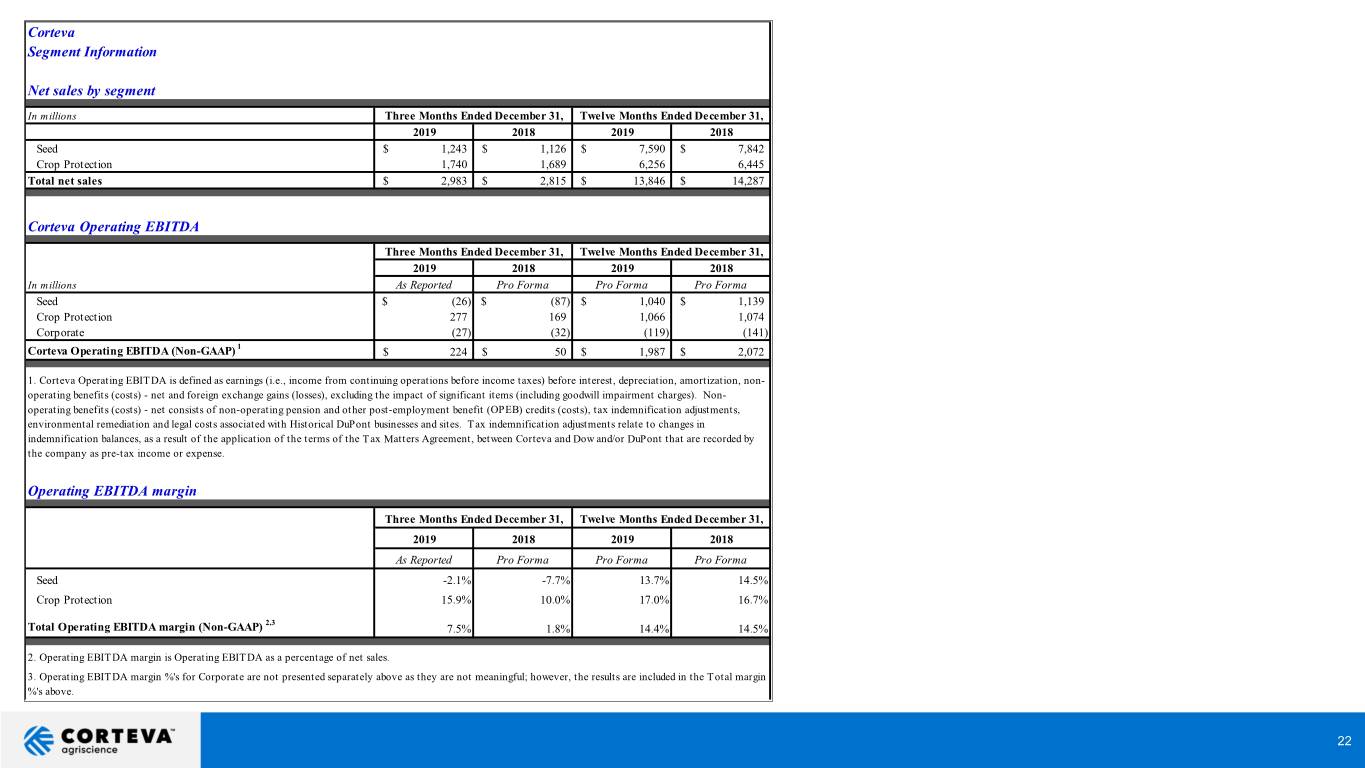
Corteva Segment Information Net sales by segment In millions Three Months Ended December 31, Twelve Months Ended December 31, 2019 2018 2019 2018 Seed $ 1,243 $ 1,126 $ 7,590 $ 7,842 Crop Protection 1,740 1,689 6,256 6,445 Total net sales $ 2,983 $ 2,815 $ 13,846 $ 14,287 Corteva Operating EBITDA Three Months Ended December 31, Twelve Months Ended December 31, 2019 2018 2019 2018 In millions As Reported Pro Forma Pro Forma Pro Forma Seed $ (26) $ (87) $ 1,040 $ 1,139 Crop Protection 277 169 1,066 1,074 Corporate (27) (32) (119) (141) 1 Corteva Operating EBITDA (Non-GAAP) $ 224 $ 50 $ 1,987 $ 2,072 1. Corteva Operating EBITDA is defined as earnings (i.e., income from continuing operations before income taxes) before interest, depreciation, amortization, non- operating benefits (costs) - net and foreign exchange gains (losses), excluding the impact of significant items (including goodwill impairment charges). Non- operating benefits (costs) - net consists of non-operating pension and other post-employment benefit (OPEB) credits (costs), tax indemnification adjustments, environmental remediation and legal costs associated with Historical DuPont businesses and sites. Tax indemnification adjustments relate to changes in indemnification balances, as a result of the application of the terms of the Tax Matters Agreement, between Corteva and Dow and/or DuPont that are recorded by the company as pre-tax income or expense. Operating EBITDA margin Three Months Ended December 31, Twelve Months Ended December 31, 2019 2018 2019 2018 As Reported Pro Forma Pro Forma Pro Forma Seed -2.1% -7.7% 13.7% 14.5% Crop Protection 15.9% 10.0% 17.0% 16.7% 2,3 Total Operating EBITDA margin (Non-GAAP) 7.5% 1.8% 14.4% 14.5% 2. Operating EBITDA margin is Operating EBITDA as a percentage of net sales. 3. Operating EBITDA margin %'s for Corporate are not presented separately above as they are not meaningful; however, the results are included in the Total margin %'s above. 22
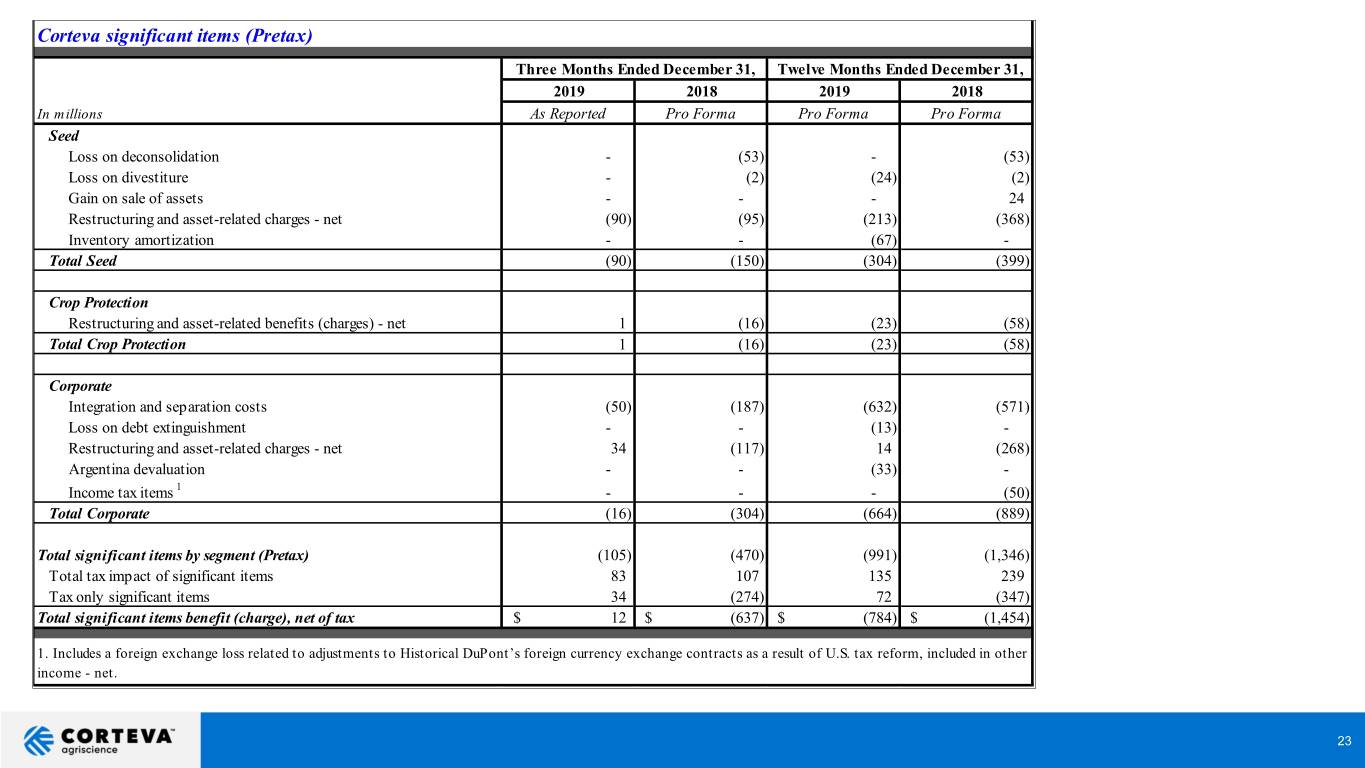
Corteva significant items (Pretax) Three Months Ended December 31, Twelve Months Ended December 31, 2019 2018 2019 2018 In millions As Reported Pro Forma Pro Forma Pro Forma Seed Loss on deconsolidation - (53) - (53) Loss on divestiture - (2) (24) (2) Gain on sale of assets - - - 24 Restructuring and asset-related charges - net (90) (95) (213) (368) Inventory amortization - - (67) - Total Seed (90) (150) (304) (399) Crop Protection Restructuring and asset-related benefits (charges) - net 1 (16) (23) (58) Total Crop Protection 1 (16) (23) (58) Corporate Integration and separation costs (50) (187) (632) (571) Loss on debt extinguishment - - (13) - Restructuring and asset-related charges - net 34 (117) 14 (268) Argentina devaluation - - (33) - Income tax items 1 - - - (50) Total Corporate (16) (304) (664) (889) Total significant items by segment (Pretax) (105) (470) (991) (1,346) Total tax impact of significant items 83 107 135 239 Tax only significant items 34 (274) 72 (347) Total significant items benefit (charge), net of tax $ 12 $ (637) $ (784) $ (1,454) 1. Includes a foreign exchange loss related to adjustments to Historical DuPont’s foreign currency exchange contracts as a result of U.S. tax reform, included in other income - net. 23
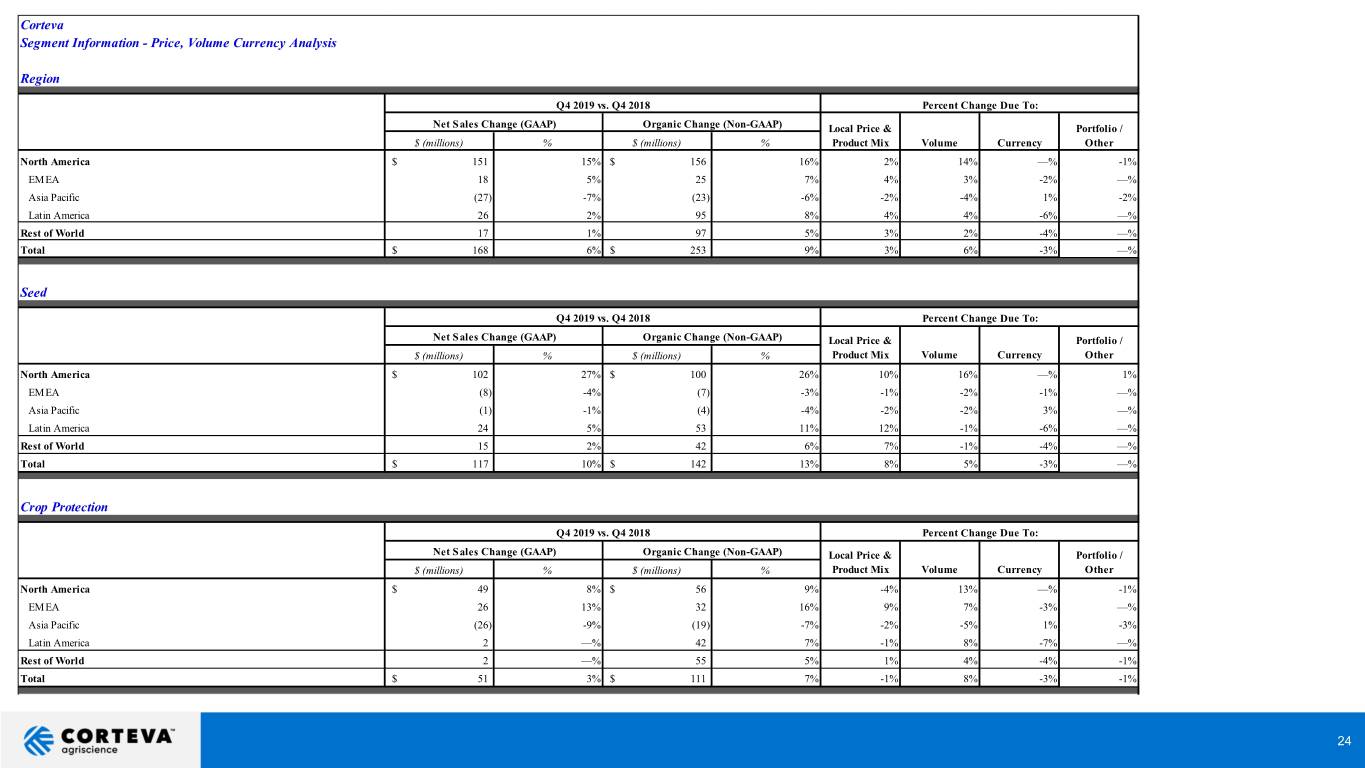
Corteva Segment Information - Price, Volume Currency Analysis Region Q4 2019 vs. Q4 2018 Percent Change Due To: Net Sales Change (GAAP) Organic Change (Non-GAAP) Local Price & Portfolio / $ (millions) % $ (millions) % Product Mix Volume Currency Other North America $ 151 15% $ 156 16% 2% 14% —% -1% EM EA 18 5% 25 7% 4% 3% -2% —% Asia Pacific (27) -7% (23) -6% -2% -4% 1% -2% Latin America 26 2% 95 8% 4% 4% -6% —% Rest of World 17 1% 97 5% 3% 2% -4% —% Total $ 168 6% $ 253 9% 3% 6% -3% —% Seed Q4 2019 vs. Q4 2018 Percent Change Due To: Net Sales Change (GAAP) Organic Change (Non-GAAP) Local Price & Portfolio / $ (millions) % $ (millions) % Product Mix Volume Currency Other North America $ 102 27% $ 100 26% 10% 16% —% 1% EM EA (8) -4% (7) -3% -1% -2% -1% —% Asia Pacific (1) -1% (4) -4% -2% -2% 3% —% Latin America 24 5% 53 11% 12% -1% -6% —% Rest of World 15 2% 42 6% 7% -1% -4% —% Total $ 117 10% $ 142 13% 8% 5% -3% —% Crop Protection Q4 2019 vs. Q4 2018 Percent Change Due To: Net Sales Change (GAAP) Organic Change (Non-GAAP) Local Price & Portfolio / $ (millions) % $ (millions) % Product Mix Volume Currency Other North America $ 49 8% $ 56 9% -4% 13% —% -1% EM EA 26 13% 32 16% 9% 7% -3% —% Asia Pacific (26) -9% (19) -7% -2% -5% 1% -3% Latin America 2 —% 42 7% -1% 8% -7% —% Rest of World 2 —% 55 5% 1% 4% -4% -1% Total $ 51 3% $ 111 7% -1% 8% -3% -1% 24
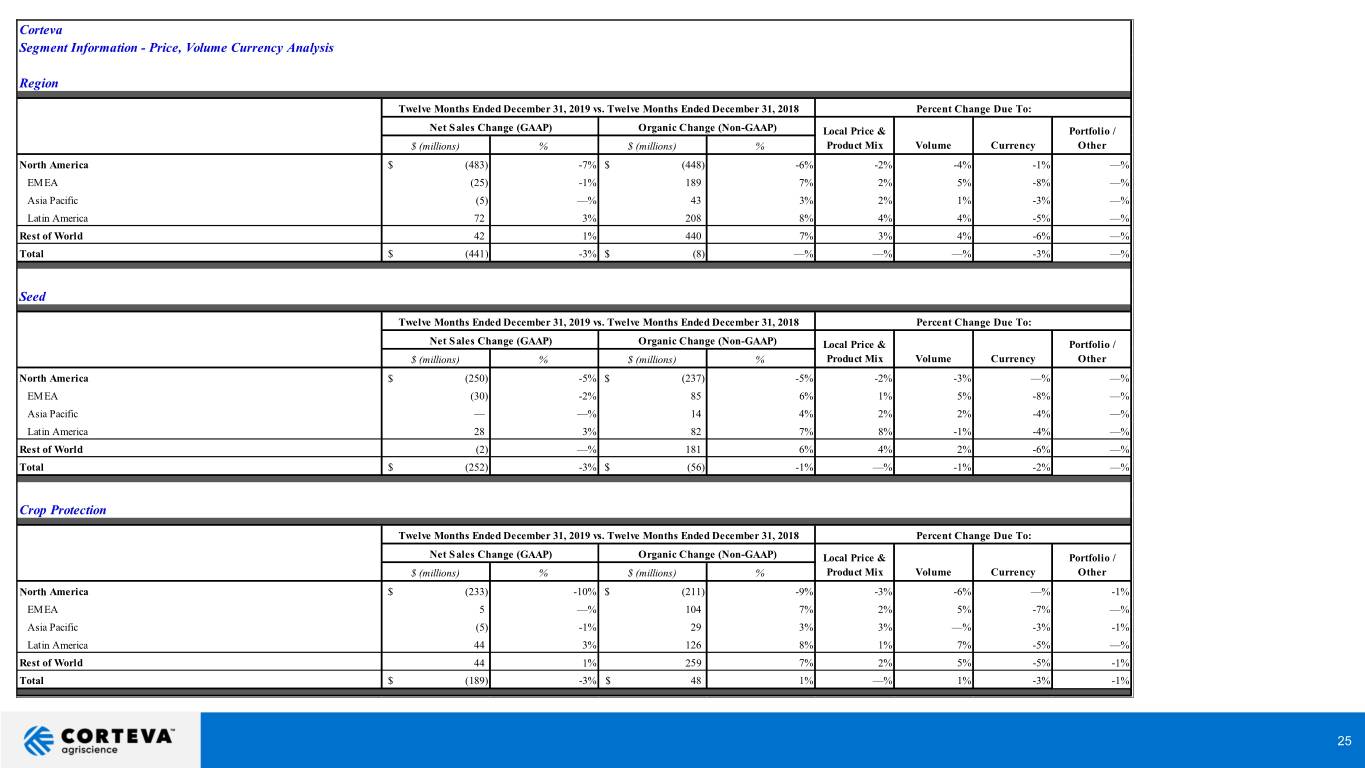
Corteva Segment Information - Price, Volume Currency Analysis Region Twelve Months Ended December 31, 2019 vs. Twelve Months Ended December 31, 2018 Percent Change Due To: Net Sales Change (GAAP) Organic Change (Non-GAAP) Local Price & Portfolio / $ (millions) % $ (millions) % Product Mix Volume Currency Other North America $ (483) -7% $ (448) -6% -2% -4% -1% —% EM EA (25) -1% 189 7% 2% 5% -8% —% Asia Pacific (5) —% 43 3% 2% 1% -3% —% Latin America 72 3% 208 8% 4% 4% -5% —% Rest of World 42 1% 440 7% 3% 4% -6% —% Total $ (441) -3% $ (8) —% —% —% -3% —% Seed Twelve Months Ended December 31, 2019 vs. Twelve Months Ended December 31, 2018 Percent Change Due To: Net Sales Change (GAAP) Organic Change (Non-GAAP) Local Price & Portfolio / $ (millions) % $ (millions) % Product Mix Volume Currency Other North America $ (250) -5% $ (237) -5% -2% -3% —% —% EM EA (30) -2% 85 6% 1% 5% -8% —% Asia Pacific — —% 14 4% 2% 2% -4% —% Latin America 28 3% 82 7% 8% -1% -4% —% Rest of World (2) —% 181 6% 4% 2% -6% —% Total $ (252) -3% $ (56) -1% —% -1% -2% —% Crop Protection Twelve Months Ended December 31, 2019 vs. Twelve Months Ended December 31, 2018 Percent Change Due To: Net Sales Change (GAAP) Organic Change (Non-GAAP) Local Price & Portfolio / $ (millions) % $ (millions) % Product Mix Volume Currency Other North America $ (233) -10% $ (211) -9% -3% -6% —% -1% EM EA 5 —% 104 7% 2% 5% -7% —% Asia Pacific (5) -1% 29 3% 3% —% -3% -1% Latin America 44 3% 126 8% 1% 7% -5% —% Rest of World 44 1% 259 7% 2% 5% -5% -1% Total $ (189) -3% $ 48 1% —% 1% -3% -1% 25
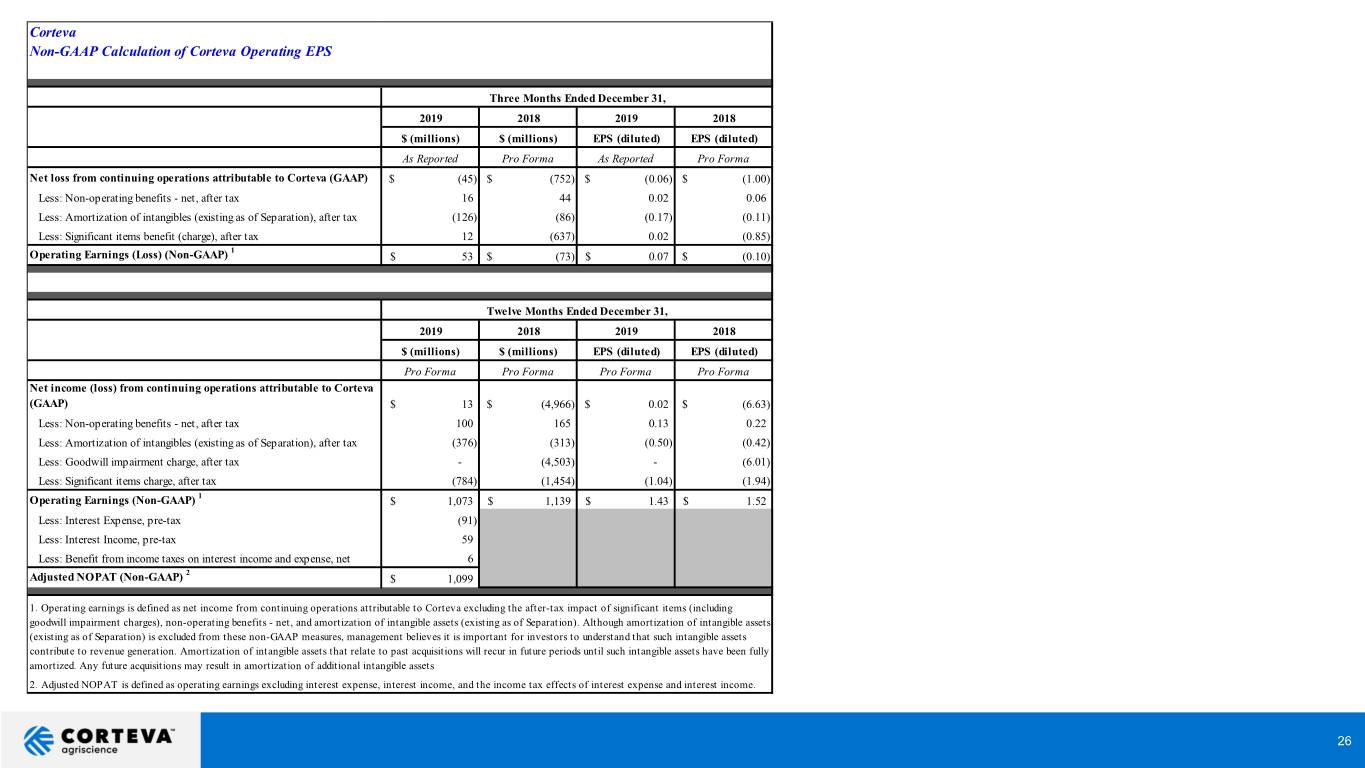
Corteva Non-GAAP Calculation of Corteva Operating EPS Three Months Ended December 31, 2019 2018 2019 2018 $ (millions) $ (millions) EPS (diluted) EPS (diluted) As Reported Pro Forma As Reported Pro Forma Net loss from continuing operations attributable to Corteva (GAAP) $ (45) $ (752) $ (0.06) $ (1.00) Less: Non-operating benefits - net, after tax 16 44 0.02 0.06 Less: Amortization of intangibles (existing as of Separation), after tax (126) (86) (0.17) (0.11) Less: Significant items benefit (charge), after tax 12 (637) 0.02 (0.85) 1 Operating Earnings (Loss) (Non-GAAP) $ 53 $ (73) $ 0.07 $ (0.10) Twelve Months Ended December 31, 2019 2018 2019 2018 $ (millions) $ (millions) EPS (diluted) EPS (diluted) Pro Forma Pro Forma Pro Forma Pro Forma Net income (loss) from continuing operations attributable to Corteva (GAAP) $ 13 $ (4,966) $ 0.02 $ (6.63) Less: Non-operating benefits - net, after tax 100 165 0.13 0.22 Less: Amortization of intangibles (existing as of Separation), after tax (376) (313) (0.50) (0.42) Less: Goodwill impairment charge, after tax - (4,503) - (6.01) Less: Significant items charge, after tax (784) (1,454) (1.04) (1.94) 1 Operating Earnings (Non-GAAP) $ 1,073 $ 1,139 $ 1.43 $ 1.52 Less: Interest Expense, pre-tax (91) Less: Interest Income, pre-tax 59 Less: Benefit from income taxes on interest income and expense, net 6 2 Adjusted NOPAT (Non-GAAP) $ 1,099 1. Operating earnings is defined as net income from continuing operations attributable to Corteva excluding the after-tax impact of significant items (including goodwill impairment charges), non-operating benefits - net, and amortization of intangible assets (existing as of Separation). Although amortization of intangible assets (existing as of Separation) is excluded from these non-GAAP measures, management believes it is important for investors to understand that such intangible assets contribute to revenue generation. Amortization of intangible assets that relate to past acquisitions will recur in future periods until such intangible assets have been fully amortized. Any future acquisitions may result in amortization of additional intangible assets 2. Adjusted NOPAT is defined as operating earnings excluding interest expense, interest income, and the income tax effects of interest expense and interest income. 26
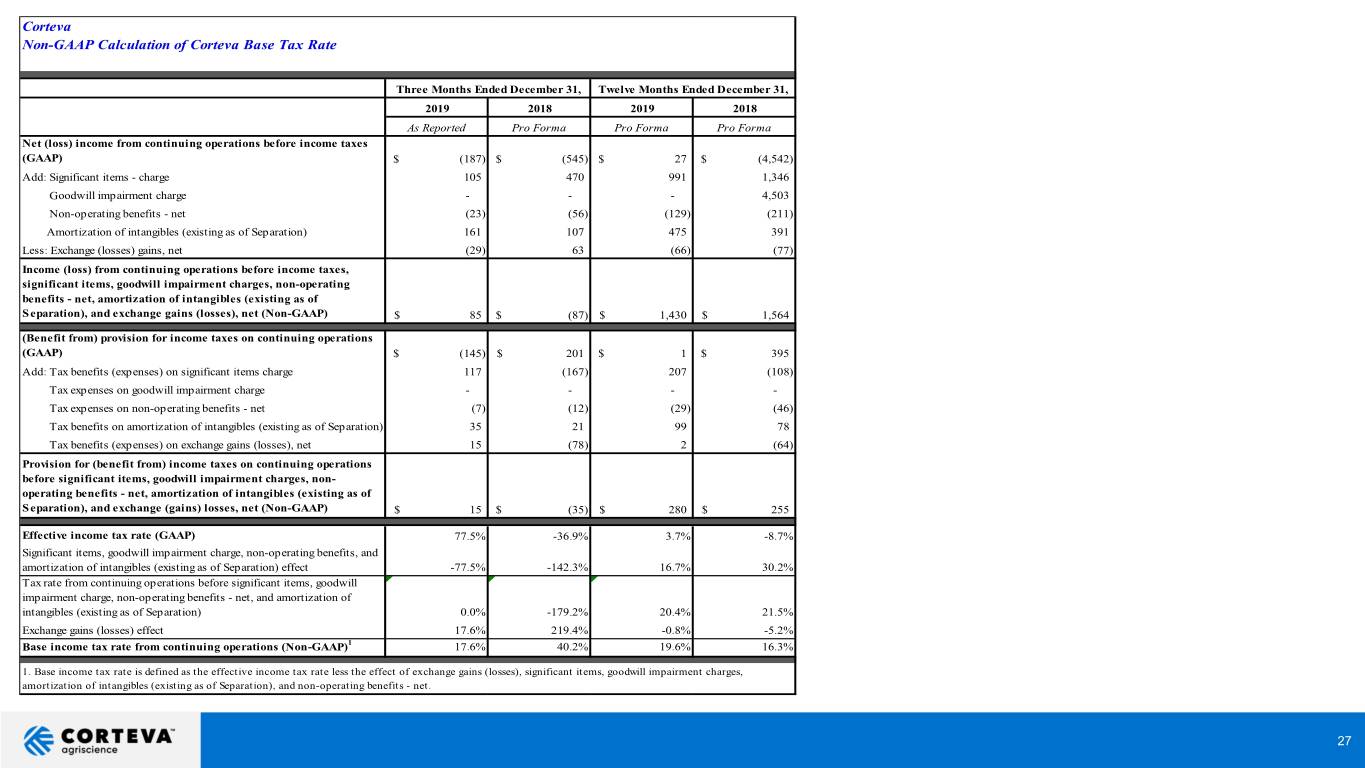
Corteva Non-GAAP Calculation of Corteva Base Tax Rate Three Months Ended December 31, Twelve Months Ended December 31, 2019 2018 2019 2018 As Reported Pro Forma Pro Forma Pro Forma Net (loss) income from continuing operations before income taxes (GAAP) $ (187) $ (545) $ 27 $ (4,542) Add: Significant items - charge 105 470 991 1,346 Goodwill impairment charge - - - 4,503 Non-operating benefits - net (23) (56) (129) (211) Amortization of intangibles (existing as of Separation) 161 107 475 391 Less: Exchange (losses) gains, net (29) 63 (66) (77) Income (loss) from continuing operations before income taxes, significant items, goodwill impairment charges, non-operating benefits - net, amortization of intangibles (existing as of Separation), and exchange gains (losses), net (Non-GAAP) $ 85 $ (87) $ 1,430 $ 1,564 (Benefit from) provision for income taxes on continuing operations (GAAP) $ (145) $ 201 $ 1 $ 395 Add: Tax benefits (expenses) on significant items charge 117 (167) 207 (108) Tax expenses on goodwill impairment charge - - - - Tax expenses on non-operating benefits - net (7) (12) (29) (46) Tax benefits on amortization of intangibles (existing as of Separation) 35 21 99 78 Tax benefits (expenses) on exchange gains (losses), net 15 (78) 2 (64) Provision for (benefit from) income taxes on continuing operations before significant items, goodwill impairment charges, non- operating benefits - net, amortization of intangibles (existing as of Separation), and exchange (gains) losses, net (Non-GAAP) $ 15 $ (35) $ 280 $ 255 Effective income tax rate (GAAP) 77.5% -36.9% 3.7% -8.7% Significant items, goodwill impairment charge, non-operating benefits, and amortization of intangibles (existing as of Separation) effect -77.5% -142.3% 16.7% 30.2% Tax rate from continuing operations before significant items, goodwill impairment charge, non-operating benefits - net, and amortization of intangibles (existing as of Separation) 0.0% -179.2% 20.4% 21.5% Exchange gains (losses) effect 17.6% 219.4% -0.8% -5.2% Base income tax rate from continuing operations (Non-GAAP)1 17.6% 40.2% 19.6% 16.3% 1. Base income tax rate is defined as the effective income tax rate less the effect of exchange gains (losses), significant items, goodwill impairment charges, amortization of intangibles (existing as of Separation), and non-operating benefits - net. 27
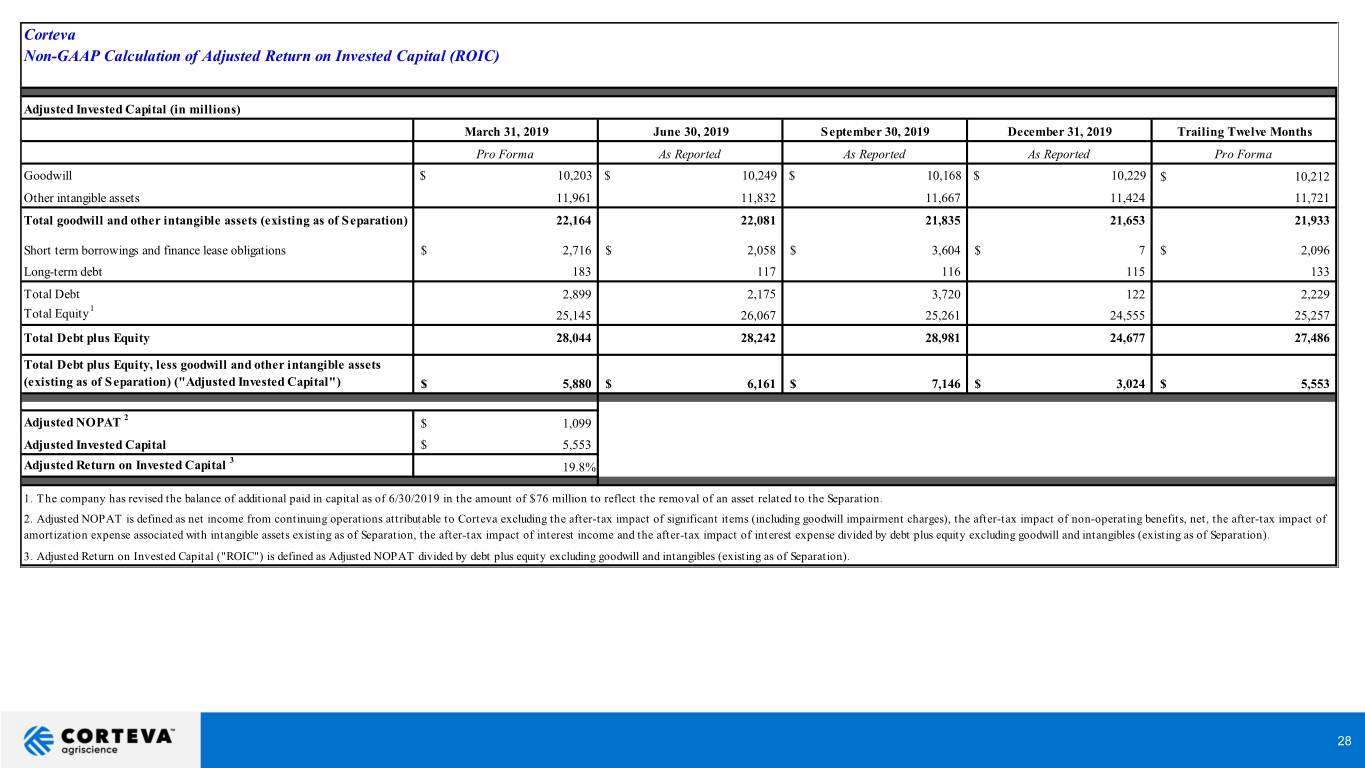
Corteva Non-GAAP Calculation of Adjusted Return on Invested Capital (ROIC) Adjusted Invested Capital (in millions) March 31, 2019 June 30, 2019 September 30, 2019 December 31, 2019 Trailing Twelve Months Pro Forma As Reported As Reported As Reported Pro Forma Goodwill $ 10,203 $ 10,249 $ 10,168 $ 10,229 $ 10,212 Other intangible assets 11,961 11,832 11,667 11,424 11,721 Total goodwill and other intangible assets (existing as of Separation) 22,164 22,081 21,835 21,653 21,933 Short term borrowings and finance lease obligations $ 2,716 $ 2,058 $ 3,604 $ 7 $ 2,096 Long-term debt 183 117 116 115 133 Total Debt 2,899 2,175 3,720 122 2,229 1 Total Equity 25,145 26,067 25,261 24,555 25,257 Total Debt plus Equity 28,044 28,242 28,981 24,677 27,486 Total Debt plus Equity, less goodwill and other intangible assets (existing as of Separation) ("Adjusted Invested Capital") $ 5,880 $ 6,161 $ 7,146 $ 3,024 $ 5,553 2 Adjusted NOPAT $ 1,099 Adjusted Invested Capital $ 5,553 3 Adjusted Return on Invested Capital 19.8% 1. The company has revised the balance of additional paid in capital as of 6/30/2019 in the amount of $76 million to reflect the removal of an asset related to the Separation. 2. Adjusted NOPAT is defined as net income from continuing operations attributable to Corteva excluding the after-tax impact of significant items (including goodwill impairment charges), the after-tax impact of non-operating benefits, net, the after-tax impact of amortization expense associated with intangible assets existing as of Separation, the after-tax impact of interest income and the after-tax impact of interest expense divided by debt plus equity excluding goodwill and intangibles (existing as of Separation). 3. Adjust ed Ret urn on Invest ed Capit al ("ROIC") is defined as Adjust ed NOPAT divided by debt plus equit y excluding goodwill and int angibles (exist ing as of Separat ion). 28