
CUBI 8-K
Customers Bancorp, Inc. (CUBI)
8-K
2020-10-28
For: 2020-10-28
View Original
Added on
April 09, 2026
UNITED STATES
SECURITIES AND EXCHANGE COMMISSION
Washington, D.C. 20549
FORM 8-K
CURRENT REPORT
Pursuant to Section 13 or 15(d)
of the
Securities Exchange Act of 1934
Date of Report (date of earliest event reported): October 28, 2020

(Exact name of registrant as specified in its charter)
| (State or other jurisdiction of incorporation or organization) | (Commission File number) | (IRS Employer Identification No.) | ||||||
(Address of principal executive offices, including zip code)
(610 ) 933-2000
(Registrant’s telephone number, including area code)
N/A
(Former name, former address and former fiscal year, if changed since last report)
Check the appropriate box below if the form 8-K filing is intended to simultaneously satisfy the filing obligations of the registrant under any of the following provisions (see General Instructions A.2. below):
| Written communications pursuant to Rule 425 under the Securities Act (17 CFR 230.425) | |||||
| Soliciting material pursuant to Rule 14a-12 under the Exchange Act (17 CFR 240.14a-12) | |||||
| Pre-commencement communications pursuant to Rule 14d-2(b) under the Exchange Act (17 CFR 240.14d-2(b)) | |||||
| Pre-commencement communications pursuant to Rule 13e-4(c) under the Exchange Act (17 CFR 240.13e-4(c)) | |||||
Securities registered pursuant to Section 12(g) of the Act:
| Title of Each Class | Trading Symbols | Name of Each Exchange on which Registered | ||||||||||||
Preferred Stock, Series C, par value $1.00 per share | ||||||||||||||
Preferred Stock, Series D, par value $1.00 per share | ||||||||||||||
Preferred Stock, Series E, par value $1.00 per share | ||||||||||||||
Preferred Stock, Series F, par value $1.00 per share | ||||||||||||||
Indicate by check mark whether the registrant is an emerging growth company as defined in Rule 405 of the Securities Act of 1933 (17 CFR §230.405) or Rule 12b-2 of the Securities Exchange Act of 1934 (17 CFR §240.12b-2). Emerging growth company ☐
If an emerging growth company, indicate by check mark if the registrant has elected not to use the extended transition period for complying with any new or revised financial accounting standards provided pursuant to Section 13(a) of the Exchange Act. ☐
Item 2.02. Results of Operations and Financial Condition
On October 28, 2020 , Customers Bancorp, Inc. (the "Company") issued a press release announcing unaudited financial information for the quarter ended September 30, 2020, a copy of which is included as Exhibit 99.1 to this Current Report on Form 8-K and incorporated by reference herein.
Item 7.01 Regulation FD Disclosure
The Company has posted to its website a slide presentation which is attached hereto as Exhibit 99.2 to this Current Report on Form 8-K and incorporated into this Item 7.01 by reference.
The information in this Current Report on Form 8-K, including Exhibits 99.1 and 99.2 attached hereto and incorporated by reference into Item 2.02 and Item 7.01, respectively, shall not be deemed "filed" for purposes of Section 18 of the Securities Exchange Act of 1934, as amended, or otherwise subject to the liabilities under that Section. Furthermore, such information, including the exhibits attached hereto, shall not be deemed incorporated by reference into any of the Company's reports or filings with the SEC, whether made before or after the date hereof, except as expressly set forth by specific reference in such report or filing. The information in this Current Report on Form 8-K, including the exhibits attached hereto, shall not be deemed an admission as to the materiality of any information in this Current Report on Form 8-K that is required to be disclosed solely to satisfy the requirements of Regulation FD.
Item 9.01. Financial Statements and Exhibits
(d) Exhibits.
| Exhibit | Description | |||||||
| Press Release dated October 28, 2020 | ||||||||
| Slide presentation dated October 2020 | ||||||||
SIGNATURE
Pursuant to the requirements of the Securities Exchange Act of 1934, the Registrant has duly caused this report to be signed on its behalf by the undersigned, hereunto duly authorized.
| CUSTOMERS BANCORP, INC. | |||||
By: /s/ Carla A. Leibold | |||||
| Name: Carla A. Leibold | |||||
| Title: Executive Vice President - Chief Financial Officer | |||||
Date: October 28, 2020
EXHIBIT INDEX
| Exhibit No. | Description | |||||||
| Press Release dated October 28, 2020 | ||||||||
| Slide presentation dated October 2020 | ||||||||
Exhibit 99.1

Customers Bancorp, Inc.
701 Reading Avenue
West Reading, PA 19611
Contacts:
Jay Sidhu, Chairman & CEO 610-935-8693
Richard Ehst, President & COO 610-917-3263
Carla Leibold, CFO 484-923-8802
Sam Sidhu, Head of Corporate Development 212-843-2485
Jay Sidhu, Chairman & CEO 610-935-8693
Richard Ehst, President & COO 610-917-3263
Carla Leibold, CFO 484-923-8802
Sam Sidhu, Head of Corporate Development 212-843-2485
Customers Bancorp Reports Record Third Quarter 2020 Results
GAAP Net Income of $47.1 million, or $1.48 Per Diluted Share,
up 100% over Q3 2019
ROAA of 1.12%, ROCE of 23.05%, and PTPP ROAA of 1.43%
•Q3 2020 GAAP earnings of $47.1 million, or $1.48 per diluted share, up 100% over Q3 2019.
•Q3 2020 core earnings (a non-GAAP measure) was $38.2 million, or $1.20 per diluted share, up 62% over Q3 2019.
•Adjusted pre-tax pre-provision net income (a non-GAAP measure) for Q3 2020 was $64.2 million, an increase of 63% over Q3 2019 adjusted pre-tax pre-provision net income of $39.4 million. Q3 2020 adjusted pre-tax pre-provision return on average assets (a non-GAAP measure) was 1.43%.
•Q3 2020 results include a provision for credit losses on loans and leases of $13.0 million. At September 30, 2020, the coverage of credit loss reserves for loans and leases held for investment, excluding Paycheck Protection Program ("PPP") loans (a non-GAAP measure), was 2.0%, up from 0.8% at December 31, 2019.
•Non-performing assets were 0.34% of total assets at September 30, 2020 compared to 0.48% of total assets at June 30, 2020. Our allowance for credit losses equaled 245% of non-performing loans at September 30, 2020, up from 185% at June 30, 2020.
•Total revenues were up 23.7% over Q2 2020 and 42.5% over Q3 2019. The Bank will earn approximately $100 million in pre-tax origination fees from PPP loans, significantly adding to its common tangible equity in 2021.
•Net interest income increased by $15.5 million, or 16.8%, over Q2 2020 and $31.7 million, or 41.9%, over Q3 2019. Net interest income, excluding the impact of PPP loans (a non-GAAP measure), increased by $4.7 million, or 5.7%, over Q2 2020 and $11.7 million, or 15.4%, over Q3 2019.
•Q3 2020 net interest margin, excluding the impact of PPP loans (a non-GAAP measure), was 2.86%, an 11 basis point decline from Q2 2020 and a 3 basis point increase from Q3 2019. Q3 2020 net interest margin (a non-GAAP measure) declined 15 basis points from Q2 2020 to 2.50%, mostly due to PPP loans at an average yield of 1.97% and excess cash on balance sheet.
•Total loans and leases increased $6.3 billion, or 61.6%, year-over-year driven by PPP loans of $5.0 billion and strong growth in short-term commercial loans to mortgage companies of $1.4
1
billion. Total loans and leases, excluding PPP loans, increased $1.4 billion, or 13.3%, year-over-year.
•Total deposits increased $1.9 billion, or 21.4%, year-over-year, which included a $1.9 billion, or 71.1%, increase in demand deposits. The total cost of deposits dropped to 0.67% in Q3 2020, a decline of 115 basis points from 1.82% in the year-ago quarter.
•Excluding PPP loans, total deferments declined to $302 million, or 2.6%, of total loans and leases at September 30, 2020, down from $750.5 million, or 7.3%, of total loans and leases at July 24, 2020.
•Commercial criticized loans as a percent of total loans and leases, excluding PPP loans (a non-GAAP measure), remained relatively low at 2.56% at September 30, 2020.
West Reading, PA, October 28, 2020 - Customers Bancorp, Inc. (NYSE: CUBI), the parent company of Customers Bank and its operating division BankMobile (collectively “Customers” or "CUBI"), today reported third quarter 2020 ("Q3 2020") net income to common shareholders of $47.1 million, or $1.48 per diluted share. Core earnings (a non-GAAP measure) for Q3 2020 totaled $38.2 million. or $1.20 per diluted share.
“We are thrilled to report another strong quarter of financial results despite a challenging economic environment,” said Customers Bancorp Chairman and CEO Jay Sidhu. "Our revenues are up 42% over last year, while we have held our expense growth to 10%. At the same time, our asset quality improved materially with non-performing assets as a percent of total assets declining to only 0.34% at September 30, 2020. Our superior financial results were achieved in spite of a $2.4 million decrease in our card related interchange income during the quarter primarily caused by the Durbin Amendment. We are very proud of Customers' talented and hard-working team members who continue to deliver tremendous service to our clients. Earlier this year, our team overcame tremendous obstacles to give approximately 100,000 small businesses and non-profits access to Paycheck Protection Program loans. This initiative has provided substantial benefits to our clients, communities, and shareholders. Customers anticipates continued short-term and long-term improvements in building a very strong franchise focused principally on providing private banking to privately held businesses.”
Loan Portfolio Management During the COVID-19 Crisis
Maintaining strong asset quality remains the highest priority at Customers Bancorp, which includes a highly active portfolio monitoring process. In addition to frequent client outreach and monitoring at the individual loan level, Customers employs a bottom-up data driven approach to analyze its commercial portfolio. "Each borrower has been stressed for liquidity, debt capacity, and business profitability using forward looking views of their particular business sector, which sometimes reflect shock, reboot, and new normal scenarios. This data driven approach, completed with our traditional high touch approach with risk management processes best positions us to get out ahead of any deterioration in credit quality," Sidhu stated.
Strong commercial loan portfolio with very low concentration in COVID-19 impacted industries and CRE
•Total commercial deferments declined to $277 million or 2.4% of total loans and leases, excluding PPP loans (a non-GAAP measure), at September 30, 2020, down from $691 million, or 6.8% of total loans and leases, excluding PPP loans, at July 24, 2020. Customers' commercial deferments peaked at about $1.2 billion earlier this year.
•Exposure to industry segments significantly impacted by COVID-19 is not substantial. At September 30, 2020, Customers had $86 million in energy and utilities exposure (79% are wind farms; with no deferments); $64 million in colleges and universities (no deferments requested); $71 million in CRE retail sales exposure (mostly auto sales; with no deferments); $29 million in franchise restaurants and dining; and $26 million in entertainment only businesses.
2
•At quarter-end, the hospitality portfolio was approximately $404 million (3.5% of total loans and leases, excluding PPP loans), with 31% in deferment. Approximately 19% of the portfolio was operating at 95%+ occupancy under government contracts for transitional housing. The portfolio had an average loan to value of 65% (generally based on appraised value at time of origination) with approximately 74% having full or partial recourse. The majority of the hotels in our current assessment have on-hand and/or access to the cash resources needed to get through the COVID-19 crisis, and for those who may need assistance the Bank is working with them closely to bridge any potential cash flow gaps.
•At September 30, 2020, the healthcare portfolio was approximately $310 million, comprised predominantly of skilled nursing, which has been deemed an essential business and through a number of federal and state actions has been provided immunity from liability for COVID-19 related deaths. No deferments have been requested and there are no delinquencies.
•The multi-family portfolio is highly seasoned, with an average vacancy rate of 3.4% and loan to value of 60.3% (generally based on appraised value at time of origination) as of quarter-end. 58% of the portfolio was in New York City, of which 70% was in rent controlled/regulated properties with a vacancy rate of only 1.8%. As of September 30, 2020, 4% of the portfolio was on 90-day deferment.
•At September 30, 2020, investment CRE had a DSCR of 1.95x and loan to value of 59% (generally based on appraised value at time of origination), with most of the portfolio housed in the New York, Philadelphia, and Boston metro and surrounding markets.
Consumer installment, mortgage and home equity loan portfolio continues to perform well
•Total consumer-related deferments declined to $25 million, or 0.2% of total loans and leases, excluding PPP loans, at September 30, 2020, down from $60 million, or 0.6% of total loans and leases, excluding PPP loans, at July 24, 2020.
•The $1.2 billion consumer installment loan portfolio outperformed industry peers with deferments dropping to 1.2% and 30+ DPD delinquency below 1%. Strong credit quality (avg. FICO: 741), low concentration in at risk job segments, and outstanding performance of CB Direct originations have resulted in solid results through the end of Q3 2020.
•Installment loan portfolio has been managed to moderate growth and strengthening credit quality, by replacing run-off with CB Direct originations at 700 FICO score and above.
Aggressively addressing non-performing assets
During September 2020, Customers sold a collateral dependent loan secured by a Class A office building in northern New Jersey. Customers is also proactively addressing another large loan, which makes up approximately 29% of non-performing assets as of September 30, 2020, and plans to move it off the balance sheet over the next 2 - 3 months. “We expect our credit quality to improve or stay unchanged over the next few quarters,” stated Sidhu.
3
Focus on Building TCE Ratio and other Capital Ratios
Customers remains well capitalized by all regulatory measures. At the Customers Bancorp level, the total risk based capital ratio (estimate) and the tangible common equity to tangible assets ("TCE ratio"), excluding PPP loans (a non-GAAP measure), were 11.6% and 5.9%, respectively, at September 30, 2020. At June 30, 2020, Customers Bancorp's total risk based capital ratio and TCE ratio, excluding PPP loans (a non-GAAP measure), were 12.0% and 5.9%, respectively. Our capital ratios in 2020 were impacted by strong growth in mortgage warehouse balances ($1.6 billion in growth year-to-date) and our TCE ratio was also impacted by a $61.5 million charge to retained earnings in Q1 2020 upon the adoption of CECL. The mortgage warehouse trend has been a function of greater refinance activity due to sharply lower interest rates, an increase in home purchase volumes, and market share gains from other banks. The average life of these warehouse loans (a $3.9 billion balance at September 30, 2020) are generally less than 30 days, affording us a high level of control over our capital position. We forecast our capital levels to improve in fourth quarter 2020 and step-up materially in 2021. We expect capital accretion to be driven by the recognition of $100 million in PPP loan origination fees and a cyclical decline in mortgage warehouse balances. “We forecast our total risk based capital ratio to exceed 12% by the end of this year and 14% by year-end 2021,” Sidhu concluded.
Looking Ahead to $3.00 or higher EPS in 2020 and 2021
Mr. Sidhu stated, "Before COVID-19, Customers was projecting core earnings per share of $3.00 for 2020 with continued improvement expected in all profitability metrics. Like the rest of the industry, rapid changes in economic activity introduced uncertainty to our near-term profitability. We have pivoted our strategy in this environment to building a stronger balance sheet and assisting our customers, team members and community to effectively deal with this crisis and still meet or exceed our core earnings goals for 2020. Our provisions are higher, most customer activity remains slow, and there have been disruptions, but we are also seeing positive trends in deposits, selected growth in certain loan categories, and opportunities to steal market share stemming from our participation in the Paycheck Protection Program.” Mr. Sidhu continued, "Despite all of this, we are still expecting to achieve about $3.00 per share in core earnings for 2020, subject to the amount of PPP revenues that will be recognized in 2020. Longer term, we remain confident in our ability to achieve a run-rate of about $3.00 in core earnings for 2021 and about $6.00 per share in annual core earnings by the end of 2026. We will show progress toward these goals on our quarterly calls,” stated Sidhu.
Customers is well positioned to execute on its 2020 and 2026 LT strategies
•Loan growth, excluding PPP and mortgage warehouse balances, is expected to average in the mid-to-high single digits over the next several quarters.
•Total assets are projected to be about $12 billion -$13 billion at year-end 2020, excluding PPP loans and subject to refinance activity impacting loans to mortgage companies.
•The total risk based capital ratio is expected to exceed 12% by year-end 2020 and be about 14% by year-end 2021.
•Preferred equity will not be called in 2020 or 2021.
•We project the NIM in the 2.90%-3.00% range for the full year 2020 excluding PPP loans.
•Operating expenses are expected to be about flat over the next few quarters excluding the impact of the BankMobile divestiture.
•The effective tax rate is forecast to be about 21% - 22.0% for 2020
•PPP loans will add about $100 million in pre-tax origination fees. A substantial portion of this amount will be recognized in the first half of 2021.
•A run-rate of $3.00+ in core EPS for 2020 and 2021 and $6.00 in core EPS for 2026 remains a goal.
BankMobile
•BankMobile is expected to remain profitable in 2020
•The divestiture is on target for completion by year-end 2020
4
Status Report on Strategic Priorities Articulated at Last Analysts Day
Improve Profitability: Top Quartile Profitability with 1.25% Core ROAA in 2-3 years
As stated during our last Analysts Day in October 2018, Customers expects to remain focused on growing its core businesses, while improving margins, capital and profitability. Through favorable mix shifts in both assets and liabilities, while maintaining its superior credit quality culture and extreme focus on productivity improvement, Customers improved the overall quality of its balance sheet and deposit franchise, expanded its net interest margin, enhanced liquidity and remains relatively neutral to interest rate changes. The strategies articulated at the last Analysts Day in October 2018 and subsequent progress through Q3 2020 are summarized below:
5
• | Target ROAA in top quartile of peer group, which we expect will equate to a ROAA of 1.25% or higher over the next 2-3 years. ROAA was 1.12% in Q3 2020, up from Q2 2020 ROAA of 0.62% due to increases of $15.5 million in net interest income and $11.6 million in non-interest income, primarily driven by $11.7 million of gain on sale of investment securities, and an $8.0 million reduction in provision for credit losses on loans and leases, mostly due to improving macroeconomic forecasts since Q2 2020. The pre-tax and pre-provision adjusted ROAA (a non-GAAP measure) was 1.43% for Q3 2020, up 4 basis points from 1.39% in Q3 2019. | ||||
• | Achieve NIM expansion to 2.75% or greater by Q4 2019, with full year 2019 NIM above 2.70%, through an expected shift in asset and funding mix. Actual results for 2019 were materially better, with full year 2019 NIM of 2.75%. NIM in Q3 2020 was 2.50%, down from 2.65% in Q2 2020 and 2.83% in Q3 2019. NIM, excluding PPP loans (a non-GAAP measure), was 2.86% in Q3 2020, down from 2.97% in Q2 2020. NIM, excluding PPP loans, is expected to remain on average between 2.9% and 3.0% for 2020. | ||||
• | BankMobile growth and maturity was expected with profitability achieved by year end 2019. BankMobile reached profitability in Q3 2019 and maintained profitability in Q4 2019, Q2 2020, and Q3 2020, and was also profitable in Q1 2020 on an adjusted pre-tax pre-provision basis (a non-GAAP measure). BankMobile's profitability in Q1 2020 was negatively impacted by increased CECL-related provision expense, the COVID-19 crisis, a legal reserve of $1 million related to the previously disclosed U.S. Department of Education matter, increased depreciation expense related to capitalized development costs for technology placed in service in 2019 and non-capitalizable technology-related expenses. Key strategic priorities for 2020 include keeping BankMobile profitable, and divesting BankMobile Technologies, Inc. ("BMT"), the technology arm of the BankMobile segment, by the end of 2020. | ||||
• | Expense control. Customers' efficiency ratio was 50.71% in Q3 2020, down from 58.44% in Q2 2020 and 61.58% in Q3 2019. Improving operating efficiency is a high priority. | ||||
• | Growth in core deposits and good quality higher-yielding loans. Demand Deposit Accounts ("DDAs") grew 71% year-over-year. Lower yielding multi-family loans decreased by $847 million, or 30%, year-over-year and were replaced by higher yielding C&I loans and leases and installment loans, which had net growth of $408 million and $599 million year-over-year, respectively. Customers originated an additional $198 million of PPP loans during Q3 2020, with a balance of $5.0 billion at September 30, 2020. | ||||
• | Maintain strong credit quality and superior risk management. Non-performing loans ("NPLs") were negatively impacted by one commercial real estate loan. In spite of this, NPLs were only 0.38% of total loans and leases at September 30, 2020. Customers expects to resolve this credit during Q4 2020 or Q1 2021. Reserves to NPLs at September 30, 2020 were 245% and the coverage ratio was 2.0% of loans and leases receivable, excluding PPP loans (a non-GAAP measure). The Bank is relatively neutral to interest rate changes at September 30, 2020. We remain very focused on a strong Risk Management culture throughout our company. | ||||
• | Evaluate opportunities to redeem our preferred stock as it becomes callable. Redeeming all of the preferred stock as it becomes callable would result in an increase to our diluted earnings per share by approximately $0.43 annually, if not replaced. Given the current economic uncertainty stemming from the COVID-19 crisis, Customers will not call for redemption any preferred stock in 2020 or 2021. | ||||
6
Net Interest Income
Net interest income totaled $107.4 million in Q3 2020, an increase of $15.5 million from Q2 2020, primarily due to a $3.1 billion increase in average interest-earning assets. Earning assets were driven by PPP loan originations and increases in commercial loans to mortgage companies, commercial and industrial loans and leases, investment securities, and interest earning deposits. The benefit of this growth was partially offset by a 15 basis point linked-quarter decline in NIM (a non-GAAP measure) to 2.50%. Compared to Q2 2020, total loan yields decreased 31 basis points to 3.41%. The decrease is attributable to the origination of PPP loans carrying an average yield of 1.97% and lower market interest rates due to the Federal Reserve's forecast of interest rates at zero through 2023. The cost of interest-bearing deposits in Q3 2020 similarly decreased by 26 basis points to 0.85% due to the decline in market interest rates and strategic decisions to reallocate deposit funding to lower cost deposits. Borrowing costs decreased 27 basis points to 0.97% due to the utilization of the FRB PPP Liquidity Facility, costing 0.35%, to fund PPP loans.
Total loans and leases increased $6.3 billion, or 62%, to $16.6 billion at September 30, 2020 compared to the year-ago period. PPP loans originated directly or through fintech partnerships were $5.0 billion at September 30, 2020. Additionally, the loan mix improved year-over-year as commercial loans to mortgage companies increased $1.4 billion to $3.9 billion, commercial and industrial loans and leases increased $408 million to $2.2 billion, and commercial real estate owner occupied loans increased $82 million to $558 million. These increases were offset in part by planned decreases in multi-family loans of $847 million to $2.0 billion and residential mortgages of $297 million to $344 million. “Looking ahead, we see continued growth in core C&I loans offsetting some of the expected decreases in loans to mortgage companies," stated Sidhu.
Total deposits increased $1.9 billion, or 21%, to $10.8 billion at September 30, 2020 compared to the year-ago period. Total demand deposits increased $1.9 billion, or 71%, to $4.6 billion, money market deposits increased $855 million, or 27%, to $4.1 billion, and savings deposits increased $582 million, or 98%, to $1.2 billion. These increases were offset, in part, by a decrease in time deposits of $1.5 billion, or 60%, to $972 million. The total cost of deposits declined to 0.67% for the three months ended September 30, 2020 from 1.82% for the three months ended September 30, 2019.
Risk Management, Provision and Credit Quality
Risk management is a critical component of how Customers creates long-term shareholder value, and Customers believes that asset quality is one of the most important prerequisites to creating shareholder value. Customers believes that asset quality must be diligently addressed through prudent underwriting standards when the economy is strong so that we are well positioned when an economic downturn arises. Since mid-2019, Customers has been operating as though a recession was imminent in the immediate future. "Our Credit Administration Group and Market Presidents started analyzing their portfolios, in detail, and stressing them under adverse scenarios and either exiting or increasing the monitoring activities of higher risk credits early in 2019. Customers' non-performing loans at September 30, 2020 were only 0.38% of total loans and leases. Our Q3 2020 non-performing loans were impacted by one commercial real estate credit, which is expected to be resolved during Q4 2020, reducing our non-performing loans by year-end. We fully expect to maintain superior asset quality in good times and in difficult years," said Mr. Sidhu.
The provision for credit losses on loans and leases in Q3 2020, which was calculated under the CECL accounting standard effective January 1, 2020, was $13.0 million, compared to $20.9 million in Q2 2020. The decrease in Q3 2020 primarily resulted from an improvement in current and future macroeconomic conditions since Q2 2020, partially offset by a $9.6 million charge-off related to one commercial real estate credit expected to be sold during Q4 2020 or Q1 2021. The allowance for credit losses on loans and leases represented just over 2.0% of total loans and leases receivable, excluding PPP loans (a non-GAAP measure) at September 30, 2020, compared to 2.2% at June 30, 2020, and 0.8% at December 31, 2019.
7
Non-Interest Income
Non-interest income totaled $33.8 million for Q3 2020, an increase of $11.6 million compared to Q2 2020. The increase in non-interest income primarily resulted from an increase of $7.4 million in gain on sale of investment securities, $5.5 million in other non-interest income, $1.0 million in mortgage banking income, and $0.7 million in mortgage warehouse transactional fees, partially offset by a decrease of $2.4 million in interchange and card revenue and a $1.0 million decline in unrealized gains on equity securities issued by a foreign entity. The increase in gain on sale of investment securities primarily resulted from the sale of $58.4 million of agency-guaranteed mortgage-backed securities and $70.0 million in corporate notes in Q3 2020. The increase in other non-interest income was driven by a net derivative valuation adjustment of $5.0 million due to changes in market interest rates and a negative credit valuation adjustment and an unrealized loss on one loan held for sale of $1.5 million during Q2 2020. The increase in mortgage banking income was mainly related to unrealized gains on derivatives and gains on sales of mortgage servicing rights. The increase in mortgage warehouse transactional fees primarily resulted from an increase in transaction volumes due to continued low market interest rates. The decrease in interchange and card revenue primarily resulted from Customers becoming subject to the Federal Reserve's regulation limits on interchange fees for banks over $10 billion in total assets beginning on July 1, 2020. The decrease in unrealized gains on equity securities issued by a foreign entity primarily resulted from a decline in the valuation of those securities.
Non-Interest Expense
Non-interest expense totaled $65.6 million for Q3 2020, an increase of $2.1 million compared to Q2 2020. The increase in non-interest expense primarily resulted from increases of $2.7 million in professional services, $1.4 million in salaries and employee benefits, $1.4 million in FDIC assessments, non-income taxes and regulatory fees, and $1.0 million in merger and acquisition related expenses, partially offset by decreases of $3.6 million in other non-interest expenses and $1.0 million in loan workout expenses. The increase in professional services primarily resulted from consulting services associated with supporting our white label partnership and digital transformation efforts. The increase in salaries and employee benefits primarily resulted from an increase in full time equivalents needed for future growth, one additional business day in Q3 2020, and an increase in incentive accruals tied to Customers' overall performance. The increase in FDIC assessments, non-income taxes and regulatory fees was a function of an increase in FDIC assessment rates due to the temporary utilization of brokered deposits to fund PPP loans. The increase in merger and acquisition related expenses primarily resulted from the pending merger of BankMobile Technologies, Inc. and Megalith Financial Acquisition Corp. The decrease in other non-interest expense primarily resulted from an increase in operating cost reimbursements from Customers' white label partnership. The decrease in loan workout expenses primarily resulted from lower costs related to the workout of two commercial relationships.
Taxes
Customers' effective tax rate was 19.5% for Q3 2020 compared to 23.7% for Q2 2020. The effective tax rate is expected to be between 20% - 21% for 2020.
Webcast
Date: Thursday, October 29, 2020
Time: 9:00 AM EDT
The live audio webcast, presentation slides, and earnings press release will be made available at https://www.customersbank.com/investor-relations/ and at the Customers Bank 3rd Quarter Earnings Webcast.
The third quarter 2020 earnings press release will be issued after the market close on Wednesday, October 28, 2020.
You may submit questions in advance of the live webcast by emailing Customers' Communications & Marketing Director, David Patti at [email protected]; questions may also be asked during the webcast through the webcast application.
The webcast will be archived for viewing on the Customers Bank Investor Relations page and available beginning approximately two hours after the conclusion of the live event.
8
Institutional Background
Customers Bancorp, Inc. is a bank holding company located in West Reading, Pennsylvania engaged in banking and related businesses through its bank subsidiary, Customers Bank. Customers Bank is a community-based, full-service bank with assets of approximately $18.8 billion at September 30, 2020. A member of the Federal Reserve System with deposits insured by the Federal Deposit Insurance Corporation, Customers Bank is an equal opportunity lender that provides a range of banking services to small and medium-sized businesses, professionals, individuals and families through offices in Pennsylvania, Illinois, New York, Rhode Island, Massachusetts, New Hampshire and New Jersey. Committed to fostering customer loyalty, Customers Bank uses a High Tech/High Touch strategy that includes use of industry-leading technology to provide customers better access to their money, as well as Concierge Banking® by appointment at customers’ homes or offices 12 hours a day, seven days a week. Customers Bank offers a continually expanding portfolio of loans to small businesses, multi-family projects, mortgage companies and consumers.
Customers Bancorp, Inc.'s voting common shares are listed on the New York Stock Exchange under the symbol CUBI. Additional information about Customers Bancorp, Inc. can be found on the Company’s website, www.customersbank.com.
“Safe Harbor” Statement
In addition to historical information, this press release may contain ”forward-looking statements” within the meaning of the ”safe harbor” provisions of the Private Securities Litigation Reform Act of 1995. These forward-looking statements include statements with respect to Customers Bancorp, Inc.’s strategies, goals, beliefs, expectations, estimates, intentions, capital raising efforts, financial condition and results of operations, future performance and business. Statements preceded by, followed by, or that include the words “may,” “could,” “should,” “pro forma,” “looking forward,” “would,” “believe,” “expect,” “anticipate,” “estimate,” “intend,” “plan,” or similar expressions generally indicate a forward-looking statement. These forward-looking statements involve risks and uncertainties that are subject to change based on various important factors (some of which, in whole or in part, are beyond Customers Bancorp, Inc.’s control). Numerous competitive, economic, regulatory, legal and technological events and factors, among others, could cause Customers Bancorp, Inc.’s financial performance to differ materially from the goals, plans, objectives, intentions and expectations expressed in such forward-looking statements, including: the adverse impact on the U.S. economy, including the markets in which we operate, of the coronavirus outbreak, and the impact of a slowing U.S. economy and increased unemployment on the performance of our loan and lease portfolio, the market value of our investment securities, the demand for our products and services and the availability of sources of funding; the effects of actions by the federal government, including the Board of Governors of the Federal Reserve System and other government agencies, that effect market interest rates and the money supply; actions that we and our customers take in response to these developments and the effects such actions have on our operations, products, services and customer relationships; the effects of changes in accounting standards or policies, including Accounting Standards Update ("ASU") 2016-13, Financial Instruments—Credit Losses ("CECL"); and, our ability to divest BankMobile on terms and conditions acceptable to us, in the timeframe we currently intend, and the possible effects on our business and results of operations of a divestiture of BankMobile or if we are unable to divest BankMobile for an extended period of time. Customers Bancorp, Inc. cautions that the foregoing factors are not exclusive, and neither such factors nor any such forward-looking statement takes into account the impact of any future events. All forward-looking statements and information set forth herein are based on management’s current beliefs and assumptions as of the date hereof and speak only as of the date they are made. For a more complete discussion of the assumptions, risks and uncertainties related to our business, you are encouraged to review Customers Bancorp, Inc.’s filings with the Securities and Exchange Commission, including its most recent annual report on Form 10-K for the year ended December 31, 2019, subsequently filed quarterly reports on Form 10-Q and current reports on Form 8-K, including any amendments thereto, that update or provide information in addition to the information included in the Form 10-K and Form 10-Q filings, if any. Customers Bancorp, Inc. does not undertake to update any forward-looking statement whether written or oral, that may be made from time to time by Customers Bancorp, Inc. or by or on behalf of Customers Bank, except as may be required under applicable law.
9
Q3 2020 Overview
The following table presents a summary of key earnings and performance metrics for the quarter ended September 30, 2020 and the preceding four quarters:
| CUSTOMERS BANCORP, INC. AND SUBSIDIARIES | ||||||||||||||||||||||||||
| EARNINGS SUMMARY - UNAUDITED | ||||||||||||||||||||||||||
| (Dollars in thousands, except per share data and stock price data) | Q3 | Q2 | Q1 | Q4 | Q3 | Nine Months Ended September 30, | ||||||||||||||||||||
| 2020 | 2020 | 2020 | 2019 | 2019 | 2020 | 2019 | ||||||||||||||||||||
| GAAP Profitability Metrics: | ||||||||||||||||||||||||||
| Net income available to common shareholders | $ | 47,085 | $ | 19,137 | $ | (515) | $ | 23,911 | $ | 23,451 | $ | 65,706 | $ | 40,957 | ||||||||||||
| Per share amounts: | ||||||||||||||||||||||||||
| Earnings per share - basic | $ | 1.49 | $ | 0.61 | $ | (0.02) | $ | 0.76 | $ | 0.75 | $ | 2.09 | $ | 1.32 | ||||||||||||
| Earnings per share - diluted | $ | 1.48 | $ | 0.61 | $ | (0.02) | $ | 0.75 | $ | 0.74 | $ | 2.07 | $ | 1.30 | ||||||||||||
Book value per common share (1) | $ | 26.43 | $ | 25.08 | $ | 23.74 | $ | 26.66 | $ | 25.66 | $ | 26.43 | $ | 25.66 | ||||||||||||
CUBI stock price (1) | $ | 11.20 | $ | 12.02 | $ | 10.93 | $ | 23.81 | $ | 20.74 | $ | 11.20 | $ | 20.74 | ||||||||||||
CUBI stock price as % of book value (1) | 42 | % | 48 | % | 46 | % | 89 | % | 81 | % | 42 | % | 81 | % | ||||||||||||
| Average shares outstanding - basic | 31,517,504 | 31,477,591 | 31,391,151 | 31,306,813 | 31,223,777 | 31,462,284 | 31,142,400 | |||||||||||||||||||
| Average shares outstanding - diluted | 31,736,311 | 31,625,771 | 31,391,151 | 31,876,341 | 31,644,728 | 31,666,027 | 31,581,029 | |||||||||||||||||||
Shares outstanding (1) | 31,555,124 | 31,510,287 | 31,470,026 | 31,336,791 | 31,245,776 | 31,555,124 | 31,245,776 | |||||||||||||||||||
| Return on average assets ("ROAA") | 1.12 | % | 0.62 | % | 0.11 | % | 0.97 | % | 0.95 | % | 0.69 | % | 0.66 | % | ||||||||||||
| Return on average common equity ("ROCE") | 23.05 | % | 9.97 | % | (0.26) | % | 11.58 | % | 11.81 | % | 11.01 | % | 7.12 | % | ||||||||||||
| Efficiency ratio | 50.71 | % | 58.44 | % | 66.03 | % | 56.98 | % | 61.58 | % | 57.74 | % | 68.48 | % | ||||||||||||
Non-GAAP Profitability Metrics (2): | ||||||||||||||||||||||||||
| Core earnings | $ | 38,210 | $ | 19,174 | $ | 603 | $ | 23,843 | $ | 23,402 | $ | 57,986 | $ | 48,170 | ||||||||||||
| Adjusted pre-tax pre-provision net income | $ | 64,176 | $ | 50,766 | $ | 38,595 | $ | 44,676 | $ | 39,440 | $ | 153,537 | $ | 90,885 | ||||||||||||
| Per share amounts: | ||||||||||||||||||||||||||
| Core earnings per share - diluted | $ | 1.20 | $ | 0.61 | $ | 0.02 | $ | 0.75 | $ | 0.74 | $ | 1.83 | $ | 1.53 | ||||||||||||
Tangible book value per common share (1) | $ | 25.97 | $ | 24.62 | $ | 23.27 | $ | 26.17 | $ | 25.16 | $ | 25.97 | $ | 25.16 | ||||||||||||
CUBI stock price as % of tangible book value (1) | 43 | % | 49 | % | 47 | % | 91 | % | 82 | % | 43 | % | 82 | % | ||||||||||||
| Core ROAA | 0.93 | % | 0.62 | % | 0.15 | % | 0.97 | % | 0.95 | % | 0.62 | % | 0.75 | % | ||||||||||||
| Core ROCE | 18.71 | % | 9.99 | % | 0.30 | % | 11.55 | % | 11.78 | % | 9.71 | % | 8.37 | % | ||||||||||||
| Adjusted ROAA - pre-tax and pre-provision | 1.43 | % | 1.39 | % | 1.34 | % | 1.57 | % | 1.39 | % | 1.39 | % | 1.16 | % | ||||||||||||
| Adjusted ROCE - pre-tax and pre-provision | 29.74 | % | 24.59 | % | 17.41 | % | 19.89 | % | 18.04 | % | 23.94 | % | 13.91 | % | ||||||||||||
| Net interest margin, tax equivalent | 2.50 | % | 2.65 | % | 2.99 | % | 2.89 | % | 2.83 | % | 2.68 | % | 2.69 | % | ||||||||||||
| Net interest margin, tax equivalent, excluding PPP loans | 2.86 | % | 2.97 | % | 2.99 | % | 2.89 | % | 2.83 | % | 2.93 | % | 2.69 | % | ||||||||||||
| Core efficiency ratio | 49.81 | % | 55.39 | % | 63.33 | % | 56.76 | % | 59.21 | % | 55.68 | % | 65.15 | % | ||||||||||||
| Asset Quality: | ||||||||||||||||||||||||||
| Net charge-offs | $ | 17,299 | $ | 10,325 | $ | 18,711 | $ | 4,362 | $ | 1,761 | $ | 46,335 | $ | 3,458 | ||||||||||||
| Annualized net charge-offs to average total loans and leases | 0.45 | % | 0.32 | % | 0.79 | % | 0.18 | % | 0.07 | % | 0.49 | % | 0.05 | % | ||||||||||||
Non-performing loans ("NPLs") to total loans and leases (1) | 0.38 | % | 0.56 | % | 0.49 | % | 0.21 | % | 0.17 | % | 0.38 | % | 0.17 | % | ||||||||||||
Reserves to NPLs (1) | 244.70 | % | 185.36 | % | 296.44 | % | 264.67 | % | 288.58 | % | 244.70 | % | 288.58 | % | ||||||||||||
| Non-performing assets ("NPAs") to total assets | 0.34 | % | 0.48 | % | 0.53 | % | 0.19 | % | 0.15 | % | 0.34 | % | 0.15 | % | ||||||||||||
Customers Bank Capital Ratios (3): | ||||||||||||||||||||||||||
| Common equity Tier 1 capital to risk-weighted assets | 10.12 | % | 10.64 | % | 10.60 | % | 11.32 | % | 10.85 | % | 10.12 | % | 10.85 | % | ||||||||||||
| Tier 1 capital to risk-weighted assets | 10.12 | % | 10.64 | % | 10.60 | % | 11.32 | % | 10.85 | % | 10.12 | % | 10.85 | % | ||||||||||||
| Total capital to risk-weighted assets | 11.62 | % | 12.30 | % | 12.21 | % | 12.93 | % | 12.42 | % | 11.62 | % | 12.42 | % | ||||||||||||
| Tier 1 capital to average assets (leverage ratio) | 9.14 | % | 9.59 | % | 9.99 | % | 10.38 | % | 9.83 | % | 9.14 | % | 9.83 | % | ||||||||||||
| (1) Metric is a spot balance for the last day of each quarter presented. | ||||||||||||||||||||||||||
| (2) Non-GAAP measures exclude unrealized gains (losses) on loans HFS, investment securities gains and losses, severance expense, merger and acquisition-related expenses, losses realized from the sale of non-QM residential mortgage loans, loss upon acquisition of interest-only GNMA securities, legal reserves, credit valuation adjustments on derivatives, risk participation agreement mark-to-market adjustments, and goodwill and intangible assets. These notable items are not included in Customers' disclosures of core earnings and other core profitability metrics. Please note that not each of the aforementioned adjustments affected the reported amount in each of the periods presented. Customers' reasons for the use of these non-GAAP measures and a detailed reconciliation between the non-GAAP measures and the comparable GAAP amounts are included at the end of this document. | ||||||||||||||||||||||||||
| (3) Regulatory capital ratios are estimated for Q3 2020 and actual for the remaining periods. In accordance with regulatory capital rules, Customers elected an option to delay the estimated impact of CECL on its regulatory capital over a five-year transition period ending January 1, 2025. As a result, capital ratios and amounts as of Q3 2020 exclude the impact of the increased allowance for credit losses on loans and leases and unfunded loan commitments attributed to the adoption of CECL and 25% of the quarterly provision for credit losses for subsequent quarters through Q4 2021. | ||||||||||||||||||||||||||
10
| CUSTOMERS BANCORP, INC. AND SUBSIDIARIES | |||||||||||||||||||||||||||||||||||||||||
| CONSOLIDATED STATEMENTS OF OPERATIONS - UNAUDITED | |||||||||||||||||||||||||||||||||||||||||
| (Dollars in thousands, except per share data) | Nine Months Ended | ||||||||||||||||||||||||||||||||||||||||
| Q3 | Q2 | Q1 | Q4 | Q3 | September 30, | ||||||||||||||||||||||||||||||||||||
| 2020 | 2020 | 2020 | 2019 | 2019 | 2020 | 2019 | |||||||||||||||||||||||||||||||||||
| Interest income: | |||||||||||||||||||||||||||||||||||||||||
| Loans and leases | $ | 132,107 | $ | 118,447 | $ | 116,080 | $ | 116,365 | $ | 118,444 | $ | 366,634 | $ | 315,126 | |||||||||||||||||||||||||||
| Investment securities | 6,297 | 6,155 | 4,977 | 5,125 | 5,867 | 17,429 | 18,589 | ||||||||||||||||||||||||||||||||||
| Other | 1,246 | 616 | 4,286 | 2,505 | 2,407 | 6,149 | 6,030 | ||||||||||||||||||||||||||||||||||
| Total interest income | 139,650 | 125,218 | 125,343 | 123,995 | 126,718 | 390,212 | 339,745 | ||||||||||||||||||||||||||||||||||
| Interest expense: | |||||||||||||||||||||||||||||||||||||||||
| Deposits | 18,347 | 23,238 | 34,353 | 35,992 | 38,267 | 75,939 | 105,472 | ||||||||||||||||||||||||||||||||||
| FHLB advances | 5,762 | 4,736 | 5,390 | 6,056 | 7,563 | 15,889 | 20,463 | ||||||||||||||||||||||||||||||||||
| Subordinated debt | 2,689 | 2,689 | 2,689 | 1,930 | 1,684 | 8,066 | 5,053 | ||||||||||||||||||||||||||||||||||
| Federal funds purchased and other borrowings | 5,413 | 2,573 | 1,590 | 2,424 | 3,469 | 9,576 | 9,039 | ||||||||||||||||||||||||||||||||||
| Total interest expense | 32,211 | 33,236 | 44,022 | 46,402 | 50,983 | 109,470 | 140,027 | ||||||||||||||||||||||||||||||||||
| Net interest income | 107,439 | 91,982 | 81,321 | 77,593 | 75,735 | 280,742 | 199,718 | ||||||||||||||||||||||||||||||||||
| Provision for credit losses on loans and leases | 12,955 | 20,946 | 31,786 | 9,689 | 4,426 | 65,688 | 14,539 | ||||||||||||||||||||||||||||||||||
| Net interest income after provision for credit losses on loans and leases | 94,484 | 71,036 | 49,535 | 67,904 | 71,309 | 215,054 | 185,179 | ||||||||||||||||||||||||||||||||||
| Non-interest income: | |||||||||||||||||||||||||||||||||||||||||
| Interchange and card revenue | 4,081 | 6,478 | 6,809 | 6,506 | 6,869 | 17,368 | 22,435 | ||||||||||||||||||||||||||||||||||
| Deposit fees | 3,439 | 3,321 | 3,460 | 3,616 | 3,642 | 10,221 | 9,199 | ||||||||||||||||||||||||||||||||||
| Commercial lease income | 4,510 | 4,508 | 4,268 | 3,839 | 3,080 | 13,286 | 8,212 | ||||||||||||||||||||||||||||||||||
| Bank-owned life insurance | 1,746 | 1,757 | 1,762 | 1,795 | 1,824 | 5,265 | 5,477 | ||||||||||||||||||||||||||||||||||
| Mortgage warehouse transactional fees | 3,320 | 2,582 | 1,952 | 1,983 | 2,150 | 7,854 | 5,145 | ||||||||||||||||||||||||||||||||||
| Gain (loss) on sale of SBA and other loans | 286 | 23 | 11 | 2,770 | — | 320 | — | ||||||||||||||||||||||||||||||||||
| Mortgage banking income (loss) | 1,013 | 38 | 296 | (635) | 283 | 1,347 | 701 | ||||||||||||||||||||||||||||||||||
| Loss upon acquisition of interest-only GNMA securities | — | — | — | — | — | — | (7,476) | ||||||||||||||||||||||||||||||||||
| Gain (loss) on sale of investment securities | 11,707 | 4,353 | 3,974 | — | 1,001 | 20,035 | 1,001 | ||||||||||||||||||||||||||||||||||
| Unrealized gain (loss) on investment securities | 238 | 1,200 | (1,378) | 310 | 1,333 | 60 | 988 | ||||||||||||||||||||||||||||||||||
| Other | 3,453 | (2,024) | 776 | 5,629 | 3,187 | 2,203 | 9,443 | ||||||||||||||||||||||||||||||||||
| Total non-interest income | 33,793 | 22,236 | 21,930 | 25,813 | 23,369 | 77,959 | 55,125 | ||||||||||||||||||||||||||||||||||
| Non-interest expense: | |||||||||||||||||||||||||||||||||||||||||
| Salaries and employee benefits | 32,676 | 31,296 | 28,310 | 27,697 | 27,193 | 92,283 | 79,936 | ||||||||||||||||||||||||||||||||||
| Technology, communication and bank operations | 13,215 | 13,310 | 13,050 | 10,370 | 8,755 | 39,576 | 33,110 | ||||||||||||||||||||||||||||||||||
| Professional services | 7,253 | 4,552 | 7,670 | 6,470 | 8,348 | 19,476 | 18,639 | ||||||||||||||||||||||||||||||||||
| Occupancy | 3,632 | 3,025 | 3,032 | 3,470 | 3,661 | 9,689 | 9,628 | ||||||||||||||||||||||||||||||||||
| Commercial lease depreciation | 3,663 | 3,643 | 3,427 | 2,840 | 2,459 | 10,733 | 6,633 | ||||||||||||||||||||||||||||||||||
| FDIC assessments, non-income taxes and regulatory fees | 3,784 | 2,368 | 2,867 | 2,492 | (777) | 9,019 | 3,368 | ||||||||||||||||||||||||||||||||||
| Provision for operating losses | 1,186 | 1,068 | 912 | 1,415 | 3,998 | 3,166 | 8,223 | ||||||||||||||||||||||||||||||||||
| Advertising and promotion | — | 582 | 1,641 | 899 | 976 | 2,221 | 3,145 | ||||||||||||||||||||||||||||||||||
| Merger and acquisition related expenses | 1,035 | 25 | 50 | 100 | — | 1,110 | — | ||||||||||||||||||||||||||||||||||
| Loan workout | 846 | 1,808 | 366 | 230 | 495 | 3,020 | 1,458 | ||||||||||||||||||||||||||||||||||
| Other real estate owned | 7 | 12 | 8 | 247 | 108 | 26 | 151 | ||||||||||||||||||||||||||||||||||
| Other | (1,736) | 1,817 | 5,126 | 2,510 | 4,376 | 5,206 | 8,869 | ||||||||||||||||||||||||||||||||||
| Total non-interest expense | 65,561 | 63,506 | 66,459 | 58,740 | 59,592 | 195,525 | 173,160 | ||||||||||||||||||||||||||||||||||
| Income before income tax expense | 62,716 | 29,766 | 5,006 | 34,977 | 35,086 | 97,488 | 67,144 | ||||||||||||||||||||||||||||||||||
| Income tax expense | 12,201 | 7,048 | 1,906 | 7,451 | 8,020 | 21,156 | 15,343 | ||||||||||||||||||||||||||||||||||
| Net income | 50,515 | 22,718 | 3,100 | 27,526 | 27,066 | 76,332 | 51,801 | ||||||||||||||||||||||||||||||||||
| Preferred stock dividends | 3,430 | 3,581 | 3,615 | 3,615 | 3,615 | 10,626 | 10,844 | ||||||||||||||||||||||||||||||||||
| Net income available to common shareholders | $ | 47,085 | $ | 19,137 | $ | (515) | $ | 23,911 | $ | 23,451 | $ | 65,706 | $ | 40,957 | |||||||||||||||||||||||||||
| Basic earnings per common share | $ | 1.49 | $ | 0.61 | $ | (0.02) | $ | 0.76 | $ | 0.75 | $ | 2.09 | $ | 1.32 | |||||||||||||||||||||||||||
| Diluted earnings per common share | $ | 1.48 | $ | 0.61 | $ | (0.02) | $ | 0.75 | $ | 0.74 | $ | 2.07 | $ | 1.30 | |||||||||||||||||||||||||||
11
| CUSTOMERS BANCORP, INC. AND SUBSIDIARIES | |||||||||||||||||||||||||||||
| CONSOLIDATED BALANCE SHEET - UNAUDITED | |||||||||||||||||||||||||||||
| (Dollars in thousands) | |||||||||||||||||||||||||||||
| September 30, | June 30, | March 31, | December 31, | September 30, | |||||||||||||||||||||||||
| 2020 | 2020 | 2020 | 2019 | 2019 | |||||||||||||||||||||||||
| ASSETS | |||||||||||||||||||||||||||||
| Cash and due from banks | $ | 5,822 | $ | 44,577 | $ | 18,842 | $ | 33,095 | $ | 12,555 | |||||||||||||||||||
| Interest earning deposits | 325,594 | 1,022,753 | 237,390 | 179,410 | 169,663 | ||||||||||||||||||||||||
| Cash and cash equivalents | 331,416 | 1,067,330 | 256,232 | 212,505 | 182,218 | ||||||||||||||||||||||||
| Investment securities, at fair value | 1,133,831 | 681,382 | 712,657 | 595,876 | 608,714 | ||||||||||||||||||||||||
| Loans held for sale | 26,689 | 464,164 | 450,157 | 486,328 | 502,854 | ||||||||||||||||||||||||
| Loans receivable, mortgage warehouse, at fair value | 3,913,593 | 2,793,164 | 2,518,012 | 2,245,758 | 2,438,530 | ||||||||||||||||||||||||
| Loans receivable, PPP | 4,964,105 | 4,760,427 | — | — | — | ||||||||||||||||||||||||
| Loans and leases receivable | 7,700,892 | 7,272,447 | 7,353,262 | 7,318,988 | 7,336,237 | ||||||||||||||||||||||||
| Allowance for credit losses on loans and leases | (155,561) | (159,905) | (149,283) | (56,379) | (51,053) | ||||||||||||||||||||||||
| Total loans and leases receivable, net of allowance for credit losses on loans and leases | 16,423,029 | 14,666,133 | 9,721,991 | 9,508,367 | 9,723,714 | ||||||||||||||||||||||||
| FHLB, Federal Reserve Bank, and other restricted stock | 70,387 | 91,023 | 87,140 | 84,214 | 81,853 | ||||||||||||||||||||||||
| Accrued interest receivable | 65,668 | 49,911 | 40,570 | 38,072 | 38,412 | ||||||||||||||||||||||||
| Bank premises and equipment, net | 11,744 | 8,380 | 8,890 | 9,389 | 14,075 | ||||||||||||||||||||||||
| Bank-owned life insurance | 277,826 | 275,842 | 273,576 | 272,546 | 270,526 | ||||||||||||||||||||||||
| Other real estate owned | 131 | 131 | 131 | 173 | 204 | ||||||||||||||||||||||||
| Goodwill and other intangibles | 14,437 | 14,575 | 14,870 | 15,195 | 15,521 | ||||||||||||||||||||||||
| Other assets | 423,569 | 584,247 | 452,585 | 298,052 | 285,699 | ||||||||||||||||||||||||
| Total assets | $ | 18,778,727 | $ | 17,903,118 | $ | 12,018,799 | $ | 11,520,717 | $ | 11,723,790 | |||||||||||||||||||
| LIABILITIES AND SHAREHOLDERS' EQUITY | |||||||||||||||||||||||||||||
| Demand, non-interest bearing deposits | $ | 2,327,017 | $ | 1,879,789 | $ | 1,435,151 | $ | 1,343,391 | $ | 1,569,918 | |||||||||||||||||||
| Interest bearing deposits | 8,512,060 | 9,086,086 | 6,978,492 | 7,305,545 | 7,355,767 | ||||||||||||||||||||||||
| Total deposits | 10,839,077 | 10,965,875 | 8,413,643 | 8,648,936 | 8,925,685 | ||||||||||||||||||||||||
| FRB advances | — | — | 175,000 | — | — | ||||||||||||||||||||||||
| Federal funds purchased | 680,000 | — | 705,000 | 538,000 | 373,000 | ||||||||||||||||||||||||
| FHLB advances | 850,000 | 850,000 | 1,260,000 | 850,000 | 1,040,800 | ||||||||||||||||||||||||
| Other borrowings | 123,935 | 123,833 | 123,732 | 123,630 | 123,528 | ||||||||||||||||||||||||
| Subordinated debt | 181,324 | 181,255 | 181,185 | 181,115 | 109,050 | ||||||||||||||||||||||||
| FRB PPP liquidity facility | 4,811,009 | 4,419,967 | — | — | — | ||||||||||||||||||||||||
| Accrued interest payable and other liabilities | 241,891 | 354,341 | 195,603 | 126,241 | 132,577 | ||||||||||||||||||||||||
| Total liabilities | 17,727,236 | 16,895,271 | 11,054,163 | 10,467,922 | 10,704,640 | ||||||||||||||||||||||||
| Preferred stock | 217,471 | 217,471 | 217,471 | 217,471 | 217,471 | ||||||||||||||||||||||||
| Common stock | 32,836 | 32,791 | 32,751 | 32,617 | 32,526 | ||||||||||||||||||||||||
| Additional paid in capital | 452,965 | 450,665 | 446,840 | 444,218 | 441,499 | ||||||||||||||||||||||||
| Retained earnings | 385,750 | 338,665 | 319,529 | 381,519 | 357,608 | ||||||||||||||||||||||||
| Accumulated other comprehensive loss | (15,751) | (9,965) | (30,175) | (1,250) | (8,174) | ||||||||||||||||||||||||
| Treasury stock, at cost | (21,780) | (21,780) | (21,780) | (21,780) | (21,780) | ||||||||||||||||||||||||
| Total shareholders' equity | 1,051,491 | 1,007,847 | 964,636 | 1,052,795 | 1,019,150 | ||||||||||||||||||||||||
| Total liabilities & shareholders' equity | $ | 18,778,727 | $ | 17,903,118 | $ | 12,018,799 | $ | 11,520,717 | $ | 11,723,790 | |||||||||||||||||||
12
| CUSTOMERS BANCORP, INC. AND SUBSIDIARIES | ||||||||||||||||||||||||||
| AVERAGE BALANCE SHEET / NET INTEREST MARGIN - UNAUDITED | ||||||||||||||||||||||||||
| (Dollars in thousands) | ||||||||||||||||||||||||||
| Three Months Ended | ||||||||||||||||||||||||||
| September 30, 2020 | June 30, 2020 | September 30, 2019 | ||||||||||||||||||||||||
| Average Balance | Average Yield or Cost (%) | Average Balance | Average Yield or Cost (%) | Average Balance | Average Yield or Cost (%) | |||||||||||||||||||||
| Assets | ||||||||||||||||||||||||||
| Interest earning deposits | $ | 686,928 | 0.12% | $ | 384,622 | 0.12% | $ | 100,343 | 3.26% | |||||||||||||||||
Investment securities (1) | 950,723 | 2.65% | 705,389 | 3.49% | 652,142 | 3.60% | ||||||||||||||||||||
| Loans and leases: | ||||||||||||||||||||||||||
| Commercial loans to mortgage companies | 2,847,169 | 2.90% | 2,456,067 | 2.91% | 2,103,612 | 4.58% | ||||||||||||||||||||
| Multi-family loans | 1,989,074 | 3.72% | 2,009,847 | 3.87% | 2,929,650 | 3.91% | ||||||||||||||||||||
Commercial and industrial loans and leases (2) | 2,599,806 | 3.82% | 2,460,060 | 4.05% | 2,159,067 | 5.24% | ||||||||||||||||||||
| Loans receivable, PPP | 4,909,197 | 1.97% | 2,754,920 | 1.71% | — | —% | ||||||||||||||||||||
| Non-owner occupied commercial real estate loans | 1,388,306 | 3.70% | 1,392,131 | 3.81% | 1,294,246 | 4.57% | ||||||||||||||||||||
| Residential mortgages | 414,781 | 3.97% | 429,609 | 3.53% | 729,603 | 4.11% | ||||||||||||||||||||
| Installment loans | 1,255,505 | 8.37% | 1,288,999 | 8.72% | 600,256 | 9.47% | ||||||||||||||||||||
Total loans and leases (3) | 15,403,838 | 3.41% | 12,791,633 | 3.72% | 9,816,434 | 4.79% | ||||||||||||||||||||
| Other interest-earning assets | 79,656 | 5.23% | 98,377 | 2.06% | 98,279 | 6.39% | ||||||||||||||||||||
| Total interest-earning assets | 17,121,145 | 3.25% | 13,980,021 | 3.60% | 10,667,198 | 4.72% | ||||||||||||||||||||
| Non-interest-earning assets | 744,429 | 695,563 | 591,946 | |||||||||||||||||||||||
| Total assets | $ | 17,865,574 | $ | 14,675,584 | $ | 11,259,144 | ||||||||||||||||||||
| Liabilities | ||||||||||||||||||||||||||
| Interest checking accounts | $ | 2,370,709 | 0.78% | $ | 2,482,222 | 0.75% | $ | 1,014,590 | 1.83 % | |||||||||||||||||
| Money market deposit accounts | 3,786,032 | 0.65% | 3,034,457 | 0.85% | 3,100,975 | 2.22 % | ||||||||||||||||||||
| Other savings accounts | 1,125,273 | 1.06% | 1,177,554 | 1.94% | 561,790 | 2.19 % | ||||||||||||||||||||
| Certificates of deposit | 1,344,134 | 1.35% | 1,734,062 | 1.51% | 2,227,817 | 2.34 % | ||||||||||||||||||||
Total interest-bearing deposits (4) | 8,626,148 | 0.85% | 8,428,295 | 1.11% | 6,905,172 | 2.20 % | ||||||||||||||||||||
| FRB PPP liquidity facility | 4,479,036 | 0.35% | 942,258 | 0.35% | — | —% | ||||||||||||||||||||
| Borrowings | 1,236,127 | 3.19% | 2,282,761 | 1.62% | 1,770,459 | 2.86 % | ||||||||||||||||||||
| Total interest-bearing liabilities | 14,341,311 | 0.89% | 11,653,314 | 1.15% | 8,675,631 | 2.33 % | ||||||||||||||||||||
Non-interest-bearing deposits (4) | 2,194,689 | 1,890,955 | 1,431,810 | |||||||||||||||||||||||
| Total deposits and borrowings | 16,536,000 | 0.78% | 13,544,269 | 0.99% | 10,107,441 | 2.00 % | ||||||||||||||||||||
| Other non-interest-bearing liabilities | 299,526 | 142,181 | 146,347 | |||||||||||||||||||||||
| Total liabilities | 16,835,526 | 13,686,450 | 10,253,788 | |||||||||||||||||||||||
| Shareholders' equity | 1,030,048 | 989,134 | 1,005,356 | |||||||||||||||||||||||
| Total liabilities and shareholders' equity | $ | 17,865,574 | $ | 14,675,584 | $ | 11,259,144 | ||||||||||||||||||||
| Interest spread | 2.47% | 2.61% | 2.71 % | |||||||||||||||||||||||
| Net interest margin | 2.50% | 2.65% | 2.82% | |||||||||||||||||||||||
Net interest margin tax equivalent (5) | 2.50% | 2.65% | 2.83% | |||||||||||||||||||||||
Net interest margin tax equivalent excl. PPP (6) | 2.86% | 2.97% | 2.83% | |||||||||||||||||||||||
| (1) For presentation in this table, average balances and the corresponding average yields for investment securities are based upon historical cost, adjusted for amortization of premiums and accretion of discounts. | ||||||||||||||||||||||||||
| (2) Includes owner occupied commercial real estate loans. | ||||||||||||||||||||||||||
| (3) Includes non-accrual loans, the effect of which is to reduce the yield earned on loans and leases, and deferred loan fees. | ||||||||||||||||||||||||||
| (4) Total costs of deposits (including interest bearing and non-interest bearing) were 0.67%, 0.91% and 1.82% for the three months ended September 30, 2020, June 30, 2020 and September 30, 2019, respectively. | ||||||||||||||||||||||||||
| (5) Non-GAAP tax-equivalent basis, using an estimated marginal tax rate of 26% for the three months ended September 30, 2020, June 30, 2020 and September 30, 2019, presented to approximate interest income as a taxable asset. Management uses non-GAAP measures to present historical periods comparable to the current period presentation. In addition, management believes the use of these non-GAAP measures provides additional clarity when assessing Customers’ financial results. These disclosures should not be viewed as substitutes for results determined to be in accordance with U.S. GAAP, nor are they necessarily comparable to non-GAAP performance measures that may be presented by other entities. | ||||||||||||||||||||||||||
| (6) Non-GAAP tax-equivalent basis, as described in note (5) for the three months ended September 30, 2020, June 30, 2020 and September 30, 2019, excluding net interest income from PPP loans and related borrowings, along with the related PPP loan balances and PPP fees receivable from interest-earning assets. Management uses non-GAAP measures to present historical periods comparable to the current period presentation. In addition, management believes the use of these non-GAAP measures provides additional clarity when assessing Customers’ financial results. These disclosures should not be viewed as substitutes for results determined to be in accordance with U.S. GAAP, nor are they necessarily comparable to non-GAAP performance measures that may be presented by other entities. | ||||||||||||||||||||||||||
13
| CUSTOMERS BANCORP, INC. AND SUBSIDIARIES | |||||||||||||||||
| AVERAGE BALANCE SHEET / NET INTEREST MARGIN - UNAUDITED | |||||||||||||||||
| (Dollars in thousands) | |||||||||||||||||
| Nine Months Ended | |||||||||||||||||
| September 30, 2020 | September 30, 2019 | ||||||||||||||||
| Average Balance | Average Yield or Cost (%) | Average Balance | Average Yield or Cost (%) | ||||||||||||||
| Assets | |||||||||||||||||
| Interest earning deposits | $ | 614,863 | 0.69% | $ | 88,146 | 2.95 % | |||||||||||
Investment securities (1) | 741,566 | 3.13% | 676,859 | 3.66 % | |||||||||||||
| Loans and leases: | |||||||||||||||||
| Commercial loans to mortgage companies | 2,383,331 | 3.14% | 1,678,461 | 4.75 % | |||||||||||||
| Multi-family loans | 2,070,564 | 3.89% | 3,092,473 | 3.84 % | |||||||||||||
Commercial and industrial loans and leases (2) | 2,507,231 | 4.18% | 2,041,379 | 5.19 % | |||||||||||||
| Loans receivable, PPP | 2,563,299 | 1.88% | — | —% | |||||||||||||
| Non-owner occupied commercial real estate loans | 1,372,090 | 3.94% | 1,215,469 | 4.52 % | |||||||||||||
| Residential mortgages | 430,058 | 3.82% | 716,294 | 4.19 % | |||||||||||||
| Installment loans | 1,267,806 | 8.74% | 337,126 | 9.42 % | |||||||||||||
Total loans and leases (3) | 12,594,379 | 3.89% | 9,081,202 | 4.64 % | |||||||||||||
| Other interest-earning assets | 86,454 | 4.60% | 91,135 | 5.99 % | |||||||||||||
| Total interest-earning assets | 14,037,262 | 3.71% | 9,937,342 | 4.57 % | |||||||||||||
| Non-interest-earning assets | 679,128 | 531,656 | |||||||||||||||
| Total assets | $ | 14,716,390 | $ | 10,468,998 | |||||||||||||
| Liabilities | |||||||||||||||||
| Interest checking accounts | $ | 2,050,184 | 0.90% | $ | 889,336 | 1.89 % | |||||||||||
| Money market deposit accounts | 3,486,445 | 1.10% | 3,138,112 | 2.24 % | |||||||||||||
| Other savings accounts | 1,147,994 | 1.68% | 476,331 | 2.14 % | |||||||||||||
| Certificates of deposit | 1,533,628 | 1.64% | 1,920,063 | 2.28 % | |||||||||||||
Total interest-bearing deposits (4) | 8,218,251 | 1.23% | 6,423,842 | 2.20 % | |||||||||||||
| FRB PPP liquidity facility | 1,816,849 | 0.35% | — | —% | |||||||||||||
| Borrowings | 1,581,498 | 2.43% | 1,556,405 | 2.97 % | |||||||||||||
| Total interest-bearing liabilities | 11,616,598 | 1.26% | 7,980,247 | 2.35 % | |||||||||||||
Non-interest-bearing deposits (4) | 1,887,463 | 1,379,633 | |||||||||||||||
| Total deposits and borrowings | 13,504,061 | 1.08% | 9,359,880 | 2.00% | |||||||||||||
| Other non-interest-bearing liabilities | 197,428 | 122,309 | |||||||||||||||
| Total liabilities | 13,701,489 | 9,482,189 | |||||||||||||||
| Shareholders' equity | 1,014,901 | 986,809 | |||||||||||||||
| Total liabilities and shareholders' equity | $ | 14,716,390 | $ | 10,468,998 | |||||||||||||
| Interest spread | 2.63% | 2.57% | |||||||||||||||
| Net interest margin | 2.67% | 2.69% | |||||||||||||||
Net interest margin tax equivalent (5) | 2.68% | 2.69% | |||||||||||||||
Net interest margin tax equivalent (6) | 2.93% | 2.69% | |||||||||||||||
| (1) For presentation in this table, average balances and the corresponding average yields for investment securities are based upon historical cost, adjusted for amortization of premiums and accretion of discounts. | |||||||||||||||||
| (2) Includes owner occupied commercial real estate loans. | |||||||||||||||||
| (3) Includes non-accrual loans, the effect of which is to reduce the yield earned on loans and leases, and deferred loan fees. | |||||||||||||||||
| (4) Total costs of deposits (including interest bearing and non-interest bearing) were 1.00% and 1.81% for the nine months ended September 30, 2020 and September 30, 2019, respectively. | |||||||||||||||||
| (5) Non-GAAP tax-equivalent basis, using an estimated marginal tax rate of 26% for both the nine months ended September 30, 2020 and 2019, presented to approximate interest income as a taxable asset. Management uses non-GAAP measures to present historical periods comparable to the current period presentation. In addition, management believes the use of these non-GAAP measures provides additional clarity when assessing Customers’ financial results. These disclosures should not be viewed as substitutes for results determined to be in accordance with U.S. GAAP, nor are they necessarily comparable to non-GAAP performance measures that may be presented by other entities. | |||||||||||||||||
| (6) Non-GAAP tax-equivalent basis as described in noted (5), for both the nine months ended September 30, 2020 and 2019, excluding net interest income from PPP loans and related borrowings, along with the related PPP loan balances and PPP fees receivable from interest-earning assets. Management uses non-GAAP measures to present historical periods comparable to the current period presentation. In addition, management believes the use of these non-GAAP measures provides additional clarity when assessing Customers’ financial results. These disclosures should not be viewed as substitutes for results determined to be in accordance with U.S. GAAP, nor are they necessarily comparable to non-GAAP performance measures that may be presented by other entities. | |||||||||||||||||
14
| CUSTOMERS BANCORP, INC. AND SUBSIDIARIES | |||||||||||||||||||||||||||||
| SEGMENT REPORTING - UNAUDITED | |||||||||||||||||||||||||||||
(Dollars in thousands, except per share amounts) | |||||||||||||||||||||||||||||
The following tables present Customers' business segment results for the three and nine months ended September 30, 2020 and 2019:
| Three Months Ended September 30, 2020 | Three Months Ended September 30, 2019 | ||||||||||||||||||||||||||||||||||
| Customers Bank Business Banking | BankMobile | Consolidated | Customers Bank Business Banking | BankMobile | Consolidated | ||||||||||||||||||||||||||||||
Interest income (1) | $ | 126,648 | $ | 13,002 | $ | 139,650 | $ | 113,995 | $ | 12,723 | $ | 126,718 | |||||||||||||||||||||||
| Interest expense | 31,718 | 493 | 32,211 | 50,734 | 249 | 50,983 | |||||||||||||||||||||||||||||
| Net interest income | 94,930 | 12,509 | 107,439 | 63,261 | 12,474 | 75,735 | |||||||||||||||||||||||||||||
| Provision for credit losses on loans and leases | 8,699 | 4,256 | 12,955 | 2,475 | 1,951 | 4,426 | |||||||||||||||||||||||||||||
| Non-interest income | 21,603 | 12,190 | 33,793 | 11,757 | 11,612 | 23,369 | |||||||||||||||||||||||||||||
| Non-interest expense | 48,926 | 16,635 | 65,561 | 38,347 | 21,245 | 59,592 | |||||||||||||||||||||||||||||
| Income (loss) before income tax expense (benefit) | 58,908 | 3,808 | 62,716 | 34,196 | 890 | 35,086 | |||||||||||||||||||||||||||||
| Income tax expense (benefit) | 11,374 | 827 | 12,201 | 7,814 | 206 | 8,020 | |||||||||||||||||||||||||||||
| Net income (loss) | 47,534 | 2,981 | 50,515 | 26,382 | 684 | 27,066 | |||||||||||||||||||||||||||||
| Preferred stock dividends | 3,430 | — | 3,430 | 3,615 | — | 3,615 | |||||||||||||||||||||||||||||
| Net income (loss) available to common shareholders | $ | 44,104 | $ | 2,981 | $ | 47,085 | $ | 22,767 | $ | 684 | $ | 23,451 | |||||||||||||||||||||||
| Basic earnings (loss) per common share | $ | 1.40 | $ | 0.09 | $ | 1.49 | $ | 0.73 | $ | 0.02 | $ | 0.75 | |||||||||||||||||||||||
| Diluted earnings (loss) per common share | $ | 1.39 | $ | 0.09 | $ | 1.48 | $ | 0.72 | $ | 0.02 | $ | 0.74 | |||||||||||||||||||||||
(1) Amounts reported include funds transfer pricing of $2.2 million and $0.3 million for the three months ended September 30, 2020 and 2019, respectively, credited to BankMobile for the value provided to the Customers Bank Business Banking segment for the use of excess low/no cost deposits.
15
| Nine Months Ended September 30, 2020 | Nine Months Ended September 30, 2019 | ||||||||||||||||||||||||||||||||||
| Customers Bank Business Banking | BankMobile | Consolidated | Customers Bank Business Banking | BankMobile | Consolidated | ||||||||||||||||||||||||||||||
Interest income (1) | $ | 351,819 | $ | 38,393 | $ | 390,212 | $ | 309,882 | $ | 29,863 | $ | 339,745 | |||||||||||||||||||||||
| Interest expense | 108,251 | 1,219 | 109,470 | 139,402 | 625 | 140,027 | |||||||||||||||||||||||||||||
| Net interest income | 243,568 | 37,174 | 280,742 | 170,480 | 29,238 | 199,718 | |||||||||||||||||||||||||||||
| Provision for credit losses on loans and leases | 55,620 | 10,068 | 65,688 | 3,245 | 11,294 | 14,539 | |||||||||||||||||||||||||||||
| Non-interest income | 44,422 | 33,537 | 77,959 | 20,304 | 34,821 | 55,125 | |||||||||||||||||||||||||||||
| Non-interest expense | 137,055 | 58,470 | 195,525 | 111,840 | 61,320 | 173,160 | |||||||||||||||||||||||||||||
| Income (loss) before income tax expense (benefit) | 95,315 | 2,173 | 97,488 | 75,699 | (8,555) | 67,144 | |||||||||||||||||||||||||||||
| Income tax expense (benefit) | 20,708 | 448 | 21,156 | 17,324 | (1,981) | 15,343 | |||||||||||||||||||||||||||||
| Net income (loss) | 74,607 | 1,725 | 76,332 | 58,375 | (6,574) | 51,801 | |||||||||||||||||||||||||||||
| Preferred stock dividends | 10,626 | — | 10,626 | 10,844 | — | 10,844 | |||||||||||||||||||||||||||||
| Net income (loss) available to common shareholders | $ | 63,981 | $ | 1,725 | $ | 65,706 | $ | 47,531 | $ | (6,574) | $ | 40,957 | |||||||||||||||||||||||
| Basic earnings (loss) per common share | $ | 2.03 | $ | 0.05 | $ | 2.09 | $ | 1.53 | $ | (0.21) | $ | 1.32 | |||||||||||||||||||||||
| Diluted earnings (loss) per common share | $ | 2.02 | $ | 0.05 | $ | 2.07 | $ | 1.51 | $ | (0.21) | $ | 1.30 | |||||||||||||||||||||||
As of September 30, 2020 and 2019 | |||||||||||||||||||||||||||||||||||
| Goodwill and other intangibles | $ | 3,629 | $ | 10,808 | $ | 14,437 | $ | 3,629 | $ | 11,892 | $ | 15,521 | |||||||||||||||||||||||
Total assets (2) | $ | 18,203,784 | $ | 574,943 | $ | 18,778,727 | $ | 11,131,914 | $ | 591,876 | $ | 11,723,790 | |||||||||||||||||||||||
| Total deposits | $ | 9,895,328 | $ | 943,749 | $ | 10,839,077 | $ | 8,260,080 | $ | 665,605 | $ | 8,925,685 | |||||||||||||||||||||||
Total non-deposit liabilities (2) | $ | 6,853,184 | $ | 34,975 | $ | 6,888,159 | $ | 1,747,846 | $ | 31,109 | $ | 1,778,955 | |||||||||||||||||||||||
(1) Amounts reported include funds transfer pricing of $5.3 million and $8.1 million for the nine months ended September 30, 2020 and 2019, respectively, credited to BankMobile for the value provided to the Customers Bank Business Banking segment for the use of excess low/no cost deposits.
(2) Amounts reported exclude inter-segment receivables and payables.
16
The following tables present Customers' business segment results for the quarter ended September 30, 2020, the preceding four quarters, and the nine months ended September 30, 2020 and 2019, respectively:
| Customers Bank Business Banking: | Nine Months Ended September 30, | |||||||||||||||||||||||||||||||||||||||||||
| Q3 2020 | Q2 2020 | Q1 2020 | Q4 2019 | Q3 2019 | 2020 | 2019 | ||||||||||||||||||||||||||||||||||||||
Interest income (1) | $ | 126,648 | $ | 112,455 | $ | 112,717 | $ | 112,212 | $ | 113,995 | $ | 351,819 | $ | 309,882 | ||||||||||||||||||||||||||||||
| Interest expense | 31,718 | 32,856 | 43,678 | 46,111 | 50,734 | 108,251 | 139,402 | |||||||||||||||||||||||||||||||||||||
| Net interest income | 94,930 | 79,599 | 69,039 | 66,101 | 63,261 | 243,568 | 170,480 | |||||||||||||||||||||||||||||||||||||
| Provision for credit losses on loans and leases | 8,699 | 19,623 | 27,298 | 6,846 | 2,475 | 55,620 | 3,245 | |||||||||||||||||||||||||||||||||||||
| Non-interest income | 21,603 | 11,683 | 11,136 | 14,964 | 11,757 | 44,422 | 20,304 | |||||||||||||||||||||||||||||||||||||
| Non-interest expense | 48,926 | 44,270 | 43,860 | 41,494 | 38,347 | 137,055 | 111,840 | |||||||||||||||||||||||||||||||||||||
| Income (loss) before income tax expense (benefit) | 58,908 | 27,389 | 9,017 | 32,725 | 34,196 | 95,315 | 75,699 | |||||||||||||||||||||||||||||||||||||
| Income tax expense (benefit) | 11,374 | 6,611 | 2,722 | 6,892 | 7,814 | 20,708 | 17,324 | |||||||||||||||||||||||||||||||||||||
| Net income (loss) | 47,534 | 20,778 | 6,295 | 25,833 | 26,382 | 74,607 | 58,375 | |||||||||||||||||||||||||||||||||||||
| Preferred stock dividends | 3,430 | 3,581 | 3,615 | 3,615 | 3,615 | 10,626 | 10,844 | |||||||||||||||||||||||||||||||||||||
| Net income (loss) available to common shareholders | $ | 44,104 | $ | 17,197 | $ | 2,680 | $ | 22,218 | $ | 22,767 | $ | 63,981 | $ | 47,531 | ||||||||||||||||||||||||||||||
| Basic earnings (loss) per common share | $ | 1.40 | $ | 0.55 | $ | 0.09 | $ | 0.71 | $ | 0.73 | $ | 2.03 | $ | 1.53 | ||||||||||||||||||||||||||||||
| Diluted earnings (loss) per common share | $ | 1.39 | $ | 0.54 | $ | 0.09 | $ | 0.70 | $ | 0.72 | $ | 2.02 | $ | 1.51 | ||||||||||||||||||||||||||||||
(1) Amounts reported include funds transfer pricing of $2.2 million, $1.6 million, $1.4 million, $0.7 million and $0.3 million for the three months ended September 30, 2020, June 30, 2020, March 31, 2020, December 31, 2019, and September 30, 2019, respectively. Amounts reported also include funds transfer pricing of $5.3 million and $8.1 million for the nine months ended September 30, 2020 and 2019, respectively. These amounts are credited to BankMobile for the value provided to the Customers Bank Business Banking segment for the use of excess low/no cost deposits.
| BankMobile: | Nine Months Ended September 30, | |||||||||||||||||||||||||||||||||||||||||||
| Q3 2020 | Q2 2020 | Q1 2020 | Q4 2019 | Q3 2019 | 2020 | 2019 | ||||||||||||||||||||||||||||||||||||||
Interest income (2) | $ | 13,002 | $ | 12,763 | $ | 12,626 | $ | 11,783 | $ | 12,723 | $ | 38,393 | $ | 29,863 | ||||||||||||||||||||||||||||||
| Interest expense | 493 | 380 | 344 | 291 | 249 | 1,219 | 625 | |||||||||||||||||||||||||||||||||||||
| Net interest income | 12,509 | 12,383 | 12,282 | 11,492 | 12,474 | 37,174 | 29,238 | |||||||||||||||||||||||||||||||||||||
| Provision for credit losses on loans and leases | 4,256 | 1,323 | 4,488 | 2,843 | 1,951 | 10,068 | 11,294 | |||||||||||||||||||||||||||||||||||||
| Non-interest income | 12,190 | 10,553 | 10,794 | 10,849 | 11,612 | 33,537 | 34,821 | |||||||||||||||||||||||||||||||||||||
| Non-interest expense | 16,635 | 19,236 | 22,599 | 17,246 | 21,245 | 58,470 | 61,320 | |||||||||||||||||||||||||||||||||||||
| Income (loss) before income tax expense (benefit) | 3,808 | 2,377 | (4,011) | 2,252 | 890 | 2,173 | (8,555) | |||||||||||||||||||||||||||||||||||||
| Income tax expense (benefit) | 827 | 437 | (816) | 559 | 206 | 448 | (1,981) | |||||||||||||||||||||||||||||||||||||
| Net income (loss) available to common shareholders | $ | 2,981 | $ | 1,940 | $ | (3,195) | $ | 1,693 | $ | 684 | $ | 1,725 | $ | (6,574) | ||||||||||||||||||||||||||||||
| Basic income (loss) per common share | $ | 0.09 | $ | 0.06 | $ | (0.10) | $ | 0.05 | $ | 0.02 | $ | 0.05 | $ | (0.21) | ||||||||||||||||||||||||||||||
| Diluted income (loss) per common share | $ | 0.09 | $ | 0.06 | $ | (0.10) | $ | 0.05 | $ | 0.02 | $ | 0.05 | $ | (0.21) | ||||||||||||||||||||||||||||||
Deposit balances (3) | ||||||||||||||||||||||||||||||||||||||||||||
| Disbursements business deposits | $ | 644,658 | $ | 500,072 | $ | 502,711 | $ | 319,263 | $ | 598,064 | ||||||||||||||||||||||||||||||||||
| White label deposits | 299,091 | 162,691 | 107,054 | 81,837 | 67,541 | |||||||||||||||||||||||||||||||||||||||
| Total deposits | $ | 943,749 | $ | 662,763 | $ | 609,765 | $ | 401,100 | $ | 665,605 | ||||||||||||||||||||||||||||||||||
(2) Amounts reported include funds transfer pricing of $2.2 million, $1.6 million, $1.4 million, $0.7 million and $0.3 million for the three months ended September 30, 2020, June 30, 2020, March 31, 2020, December 31, 2019, and September 30, 2019, respectively. Amounts reported also include funds transfer pricing of $5.3 million and $8.1 million for the nine months ended September 30, 2020 and 2019, respectively. These amounts are credited to BankMobile for the value provided to the Customers Bank Business Banking segment for the use of excess low/no cost deposits.
(3) As of September 30, 2020, June 30, 2020, March 31, 2020, December 31, 2019, and September 30, 2019.
17
| CUSTOMERS BANCORP, INC. AND SUBSIDIARIES | |||||||||||||||||||||||||||||
| PERIOD END LOAN AND LEASE COMPOSITION - UNAUDITED | |||||||||||||||||||||||||||||
| (Dollars in thousands) | |||||||||||||||||||||||||||||
| September 30, | June 30, | March 31, | December 31, | September 30, | |||||||||||||||||||||||||
| 2020 | 2020 | 2020 | 2019 | 2019 | |||||||||||||||||||||||||
| Commercial: | |||||||||||||||||||||||||||||
| Multi-family | $ | 1,950,300 | $ | 2,023,571 | $ | 2,069,077 | $ | 2,390,204 | $ | 2,797,579 | |||||||||||||||||||
| Mortgage warehouse | 3,947,828 | 2,832,112 | 2,573,397 | 2,305,784 | 2,549,088 | ||||||||||||||||||||||||
| Commercial & industrial | 2,186,480 | 2,060,494 | 2,017,567 | 1,831,126 | 1,778,423 | ||||||||||||||||||||||||
| Commercial real estate owner occupied | 557,595 | 544,772 | 543,945 | 551,948 | 475,774 | ||||||||||||||||||||||||
| Loans receivable, PPP | 4,964,105 | 4,760,427 | — | — | — | ||||||||||||||||||||||||
| Commercial real estate non-owner occupied | 1,233,882 | 1,262,373 | 1,252,826 | 1,222,772 | 1,267,679 | ||||||||||||||||||||||||
| Construction | 122,963 | 128,834 | 115,448 | 117,617 | 60,429 | ||||||||||||||||||||||||
| Total commercial loans and leases | 14,963,153 | 13,612,583 | 8,572,260 | 8,419,451 | 8,928,972 | ||||||||||||||||||||||||
| Consumer: | |||||||||||||||||||||||||||||
| Residential | 343,775 | 352,941 | 364,760 | 386,089 | 640,786 | ||||||||||||||||||||||||
| Manufactured housing | 64,638 | 66,865 | 69,240 | 71,359 | 73,626 | ||||||||||||||||||||||||
| Installment | 1,233,713 | 1,257,813 | 1,315,171 | 1,174,175 | 634,237 | ||||||||||||||||||||||||
| Total consumer loans | 1,642,126 | 1,677,619 | 1,749,171 | 1,631,623 | 1,348,649 | ||||||||||||||||||||||||
| Total loans and leases | $ | 16,605,279 | $ | 15,290,202 | $ | 10,321,431 | $ | 10,051,074 | $ | 10,277,621 | |||||||||||||||||||
| CUSTOMERS BANCORP, INC. AND SUBSIDIARIES | |||||||||||||||||||||||||||||
| PERIOD END DEPOSIT COMPOSITION - UNAUDITED | |||||||||||||||||||||||||||||
| (Dollars in thousands) | |||||||||||||||||||||||||||||
| September 30, | June 30, | March 31, | December 31, | September 30, | |||||||||||||||||||||||||
| 2020 | 2020 | 2020 | 2019 | 2019 | |||||||||||||||||||||||||
| Demand, non-interest bearing | $ | 2,327,017 | $ | 1,879,789 | $ | 1,435,151 | $ | 1,343,391 | $ | 1,569,918 | |||||||||||||||||||
| Demand, interest bearing | 2,308,627 | 2,666,209 | 1,577,034 | 1,235,292 | 1,139,675 | ||||||||||||||||||||||||
| Total demand deposits | 4,635,644 | 4,545,998 | 3,012,185 | 2,578,683 | 2,709,593 | ||||||||||||||||||||||||
| Savings | 1,173,641 | 1,144,788 | 1,168,121 | 919,214 | 591,336 | ||||||||||||||||||||||||
| Money market | 4,057,366 | 3,404,709 | 2,833,990 | 3,482,505 | 3,201,883 | ||||||||||||||||||||||||
| Time deposits | 972,426 | 1,870,380 | 1,399,347 | 1,668,534 | 2,422,873 | ||||||||||||||||||||||||
| Total deposits | $ | 10,839,077 | $ | 10,965,875 | $ | 8,413,643 | $ | 8,648,936 | $ | 8,925,685 | |||||||||||||||||||
18
| CUSTOMERS BANCORP, INC. AND SUBSIDIARIES | |||||||||||||||||||||||||||||||||||||||||||||||
| ASSET QUALITY - UNAUDITED | |||||||||||||||||||||||||||||||||||||||||||||||
| (Dollars in thousands) | As of September 30, 2020 | As of June 30, 2020 | As of September 30, 2019 | ||||||||||||||||||||||||||||||||||||||||||||
| Total loans | Non accrual /NPLs | Allowance for credit losses | Total NPLs to total loans | Total reserves to total NPLs | Total loans | Non accrual /NPLs | Allowance for credit losses | Total NPLs to total loans | Total reserves to total NPLs | Total loans | Non accrual /NPLs | Allowance for credit losses | Total NPLs to total loans | Total reserves to total NPLs | |||||||||||||||||||||||||||||||||
| Loan type | |||||||||||||||||||||||||||||||||||||||||||||||
| Multi-family | $ | 1,950,300 | $ | 11,710 | $ | 15,026 | 0.60 | % | 128.32 | % | $ | 1,581,839 | $ | 7,013 | $ | 14,697 | 0.44 | % | 209.57 | % | $ | 2,297,807 | $ | — | $ | 7,498 | — | % | — | % | |||||||||||||||||
Commercial & industrial(1) | 2,220,715 | 9,633 | 12,926 | 0.43 | % | 134.18 | % | 2,099,442 | 9,974 | 12,302 | 0.48 | % | 123.34 | % | 1,888,981 | 5,339 | 17,299 | 0.28 | % | 324.01 | % | ||||||||||||||||||||||||||
| Commercial real estate owner occupied | 557,595 | 3,599 | 9,552 | 0.65 | % | 265.41 | % | 544,772 | 4,022 | 11,405 | 0.74 | % | 283.57 | % | 475,774 | 2,072 | 1,466 | 0.44 | % | 70.75 | % | ||||||||||||||||||||||||||
| Commercial real estate non-owner occupied | 1,215,516 | 2,408 | 20,200 | 0.20 | % | 838.87 | % | 1,244,773 | 30,257 | 26,493 | 2.43 | % | 87.56 | % | 1,267,679 | 83 | 6,440 | 0.01 | % | 7759.04 | % | ||||||||||||||||||||||||||
| Construction | 122,963 | — | 6,423 | — | % | — | % | 128,834 | — | 5,297 | — | % | — | % | 60,429 | — | 658 | — | % | — | % | ||||||||||||||||||||||||||
| Total commercial loans and leases receivable | 6,067,089 | 27,350 | 64,127 | 0.45 | % | 234.47 | % | 5,599,660 | 51,266 | 70,194 | 0.92 | % | 136.92 | % | 5,990,670 | 7,494 | 33,361 | 0.13 | % | 445.17 | % | ||||||||||||||||||||||||||
| Residential | 335,452 | 10,634 | 4,649 | 3.17 | % | 43.72 | % | 348,109 | 7,857 | 4,550 | 2.26 | % | 57.91 | % | 637,707 | 6,165 | 4,083 | 0.97 | % | 66.23 | % | ||||||||||||||||||||||||||
| Manufactured housing | 64,638 | 2,778 | 5,625 | 4.30 | % | 202.48 | % | 66,865 | 3,331 | 6,014 | 4.98 | % | 180.55 | % | 73,625 | 1,567 | 1,027 | 2.13 | % | 65.54 | % | ||||||||||||||||||||||||||
| Installment | 1,233,713 | 3,118 | 81,160 | 0.25 | % | 2602.95 | % | 1,257,813 | 4,887 | 79,147 | 0.39 | % | 1619.54 | % | 634,235 | 1,140 | 12,582 | 0.18 | % | 1103.68 | % | ||||||||||||||||||||||||||
| Total consumer loans receivable | 1,633,803 | 16,530 | 91,434 | 1.01 | % | 553.14 | % | 1,672,787 | 16,075 | 89,711 | 0.96 | % | 558.08 | % | 1,345,567 | 8,872 | 17,692 | 0.66 | % | 199.41 | % | ||||||||||||||||||||||||||
Loans and leases receivable(1) | 7,700,892 | 43,880 | 155,561 | 0.57 | % | 354.51 | % | 7,272,447 | 67,341 | 159,905 | 0.93 | % | 237.46 | % | 7,336,237 | 16,366 | 51,053 | 0.22 | % | 311.95 | % | ||||||||||||||||||||||||||
| Loans receivable, PPP | 4,964,105 | — | — | — | % | — | % | 4,760,427 | — | — | — | % | — | % | — | — | — | — | % | — | % | ||||||||||||||||||||||||||
| Loans receivable, mortgage warehouse, at fair value | 3,913,593 | — | — | — | % | — | % | 2,793,164 | — | — | 2,438,530 | — | — | ||||||||||||||||||||||||||||||||||
| Total loans held for sale | 26,689 | 19,691 | — | 73.78 | % | — | % | 464,164 | 18,925 | — | 4.08 | % | — | % | 502,854 | 1,325 | — | 0.26 | % | — | % | ||||||||||||||||||||||||||
| Total portfolio | $ | 16,605,279 | $ | 63,571 | $ | 155,561 | 0.38 | % | 244.70 | % | $ | 15,290,202 | $ | 86,266 | $ | 159,905 | 0.56 | % | 185.36 | % | $ | 10,277,621 | $ | 17,691 | $ | 51,053 | 0.17 | % | 288.58 | % | |||||||||||||||||
(1) Excluding loans receivable, PPP from total loans and leases receivable is a non-GAAP measure. Management believes the use of these non-GAAP measures provides additional clarity when assessing Customers' financial results. These disclosures should not be viewed as substitutes for results determined to be in accordance with U.S. GAAP, nor are they necessarily comparable to non-GAAP performance measures that may be presented by other entities. Please refer to the reconciliation schedules that follow this table.
19
| CUSTOMERS BANCORP, INC. AND SUBSIDIARIES | |||||||||||||||||||||||||||||||||||||||||
| NET CHARGE-OFFS/(RECOVERIES) - UNAUDITED | |||||||||||||||||||||||||||||||||||||||||
| (Dollars in thousands) | |||||||||||||||||||||||||||||||||||||||||
| Q3 | Q2 | Q1 | Q4 | Q3 | Nine Months Ended September 30, | ||||||||||||||||||||||||||||||||||||
| 2020 | 2020 | 2020 | 2019 | 2019 | 2020 | 2019 | |||||||||||||||||||||||||||||||||||
| Loan type | |||||||||||||||||||||||||||||||||||||||||
| Multi-family | $ | — | $ | — | $ | — | $ | — | $ | — | $ | — | $ | 534 | |||||||||||||||||||||||||||
| Commercial & industrial | (55) | (4) | 43 | (224) | (20) | (16) | (294) | ||||||||||||||||||||||||||||||||||
| Commercial real estate owner occupied | 44 | (2) | (3) | (1) | 35 | 39 | (116) | ||||||||||||||||||||||||||||||||||
| Commercial real estate non-owner occupied | 8,923 | 2,801 | 12,797 | — | — | 24,521 | — | ||||||||||||||||||||||||||||||||||
| Construction | (6) | (113) | (3) | (8) | (8) | (122) | (128) | ||||||||||||||||||||||||||||||||||
| Residential | (17) | (26) | (29) | 181 | (5) | (72) | 89 | ||||||||||||||||||||||||||||||||||
| Installment | 8,410 | 7,669 | 5,906 | 4,414 | 1,759 | 21,985 | 3,373 | ||||||||||||||||||||||||||||||||||
| Total net charge-offs (recoveries) from loans held for investment | $ | 17,299 | $ | 10,325 | $ | 18,711 | $ | 4,362 | $ | 1,761 | $ | 46,335 | $ | 3,458 | |||||||||||||||||||||||||||
20
| CUSTOMERS BANCORP, INC. AND SUBSIDIARIES | |||||||||||||||||||||||||||||
| RECONCILIATION OF GAAP TO NON-GAAP MEASURES - UNAUDITED | |||||||||||||||||||||||||||||
Customers believes that the non-GAAP measurements disclosed within this document are useful for investors, regulators, management and others to evaluate our core results of operations and financial condition relative to other financial institutions. These non-GAAP financial measures are frequently used by securities analysts, investors, and other interested parties in the evaluation of companies in Customers' industry. These non-GAAP financial measures exclude from corresponding GAAP measures the impact of certain elements that we do not believe are representative of our ongoing financial results, which we believe enhance an overall understanding of our performance and increases comparability of our period to period results. Investors should consider our performance and financial condition as reported under GAAP and all other relevant information when assessing our performance or financial condition. Although non-GAAP financial measures are frequently used in the evaluation of a company, they have limitations as analytical tools and should not be considered in isolation or as a substitute for analysis of our results of operations or financial condition as reported under GAAP.
The following tables present reconciliations of GAAP to non-GAAP measures disclosed within this document.
| Core Earnings - Customers Bancorp | Nine Months Ended September 30, | |||||||||||||||||||||||||||||||||||||||||||||||||||||||||||||
| Q3 2020 | Q2 2020 | Q1 2020 | Q4 2019 | Q3 2019 | 2020 | 2019 | ||||||||||||||||||||||||||||||||||||||||||||||||||||||||
| (dollars in thousands except per share data) | USD | Per share | USD | Per share | USD | Per share | USD | Per share | USD | Per share | USD | Per share | USD | Per share | ||||||||||||||||||||||||||||||||||||||||||||||||
| GAAP net income to common shareholders | $ | 47,085 | $ | 1.48 | $ | 19,137 | $ | 0.61 | $ | (515) | $ | (0.02) | $ | 23,911 | $ | 0.75 | $ | 23,451 | $ | 0.74 | $ | 65,706 | $ | 2.07 | $ | 40,957 | $ | 1.30 | ||||||||||||||||||||||||||||||||||
| Reconciling items (after tax): | ||||||||||||||||||||||||||||||||||||||||||||||||||||||||||||||
| Severance expense | — | — | — | — | — | — | — | — | — | — | — | — | 373 | 0.01 | ||||||||||||||||||||||||||||||||||||||||||||||||
| Loss upon acquisition of interest-only GNMA securities | — | — | — | — | — | — | — | — | — | — | — | — | 5,682 | 0.18 | ||||||||||||||||||||||||||||||||||||||||||||||||
| Merger and acquisition related expenses | 833 | 0.03 | 19 | — | 40 | — | 76 | — | — | — | 892 | 0.03 | — | — | ||||||||||||||||||||||||||||||||||||||||||||||||
| Legal reserves | 258 | 0.01 | — | — | 830 | 0.03 | — | — | 1,520 | 0.05 | 1,088 | 0.03 | 1,520 | 0.05 | ||||||||||||||||||||||||||||||||||||||||||||||||
| (Gains) losses on investment securities | (9,662) | (0.30) | (4,543) | (0.14) | (1,788) | (0.06) | (310) | (0.01) | (1,947) | (0.06) | (15,993) | (0.51) | (1,602) | (0.05) | ||||||||||||||||||||||||||||||||||||||||||||||||
| Derivative credit valuation adjustment | (304) | (0.01) | 4,527 | 0.14 | 2,036 | 0.06 | (429) | (0.01) | 378 | 0.01 | 6,259 | 0.20 | 1,240 | 0.04 | ||||||||||||||||||||||||||||||||||||||||||||||||
| Risk participation agreement mark-to-market adjustment | — | — | (1,080) | (0.03) | — | — | — | — | — | — | (1,080) | (0.03) | — | — | ||||||||||||||||||||||||||||||||||||||||||||||||
| Losses on sale of non-QM residential mortgage loans | — | — | — | — | — | — | 595 | 0.02 | — | — | — | — | — | — | ||||||||||||||||||||||||||||||||||||||||||||||||
| Unrealized losses on loans held for sale | — | — | 1,114 | 0.04 | — | — | — | — | — | — | 1,114 | 0.04 | — | — | ||||||||||||||||||||||||||||||||||||||||||||||||
| Core earnings | $ | 38,210 | $ | 1.20 | $ | 19,174 | $ | 0.61 | $ | 603 | $ | 0.02 | $ | 23,843 | $ | 0.75 | $ | 23,402 | $ | 0.74 | $ | 57,986 | $ | 1.83 | $ | 48,170 | $ | 1.53 | ||||||||||||||||||||||||||||||||||
21
| CUSTOMERS BANCORP, INC. AND SUBSIDIARIES | |||||||||||||||||||||||||||||
| RECONCILIATION OF GAAP TO NON-GAAP MEASURES - UNAUDITED | |||||||||||||||||||||||||||||
| (Dollars in thousands, except per share data) | |||||||||||||||||||||||||||||
| Core Return on Average Assets - Customers Bancorp | Nine Months Ended September 30, | ||||||||||||||||||||||||||||||||||||||||
| (dollars in thousands except per share data) | Q3 2020 | Q2 2020 | Q1 2020 | Q4 2019 | Q3 2019 | 2020 | 2019 | ||||||||||||||||||||||||||||||||||
| GAAP net income | $ | 50,515 | $ | 22,718 | $ | 3,100 | $ | 27,526 | $ | 27,066 | $ | 76,332 | $ | 51,801 | |||||||||||||||||||||||||||
| Reconciling items (after tax): | |||||||||||||||||||||||||||||||||||||||||
| Severance expense | — | — | — | — | — | — | 373 | ||||||||||||||||||||||||||||||||||
| Loss upon acquisition of interest-only GNMA securities | — | — | — | — | — | — | 5,682 | ||||||||||||||||||||||||||||||||||
Merger and acquisition related expenses | 833 | 19 | 40 | 76 | — | 892 | — | ||||||||||||||||||||||||||||||||||
| Legal reserves | 258 | — | 830 | — | 1,520 | 1,088 | 1,520 | ||||||||||||||||||||||||||||||||||
| (Gains) losses on investment securities | (9,662) | (4,543) | (1,788) | (310) | (1,947) | (15,993) | (1,602) | ||||||||||||||||||||||||||||||||||
| Derivative credit valuation adjustment | (304) | 4,527 | 2,036 | (429) | 378 | 6,259 | 1,240 | ||||||||||||||||||||||||||||||||||
| Risk participation agreement mark-to-market adjustment | — | (1,080) | — | — | — | (1,080) | — | ||||||||||||||||||||||||||||||||||
| Losses on sale of non-QM residential mortgage loans | — | — | — | 595 | — | — | — | ||||||||||||||||||||||||||||||||||
| Unrealized losses on loans held for sale | — | 1,114 | — | — | — | 1,114 | — | ||||||||||||||||||||||||||||||||||
Core net income | $ | 41,640 | $ | 22,755 | $ | 4,218 | $ | 27,458 | $ | 27,017 | $ | 68,612 | $ | 59,014 | |||||||||||||||||||||||||||
Average total assets | $ | 17,865,574 | $ | 14,675,584 | $ | 11,573,406 | $ | 11,257,207 | $ | 11,259,144 | $ | 14,716,390 | $ | 10,468,998 | |||||||||||||||||||||||||||
| Core return on average assets | 0.93 | % | 0.62 | % | 0.15 | % | 0.97 | % | 0.95 | % | 0.62 | % | 0.75 | % | |||||||||||||||||||||||||||
22
| CUSTOMERS BANCORP, INC. AND SUBSIDIARIES | |||||||||||||||||||||||||||||
| RECONCILIATION OF GAAP TO NON-GAAP MEASURES - UNAUDITED (CONTINUED) | |||||||||||||||||||||||||||||
(Dollars in thousands, except per share data)
| Adjusted Net Income and Adjusted ROAA - Pre-Tax Pre-Provision - Customers Bancorp | Nine Months Ended September 30, | ||||||||||||||||||||||||||||||||||||||||
| (dollars in thousands except per share data) | Q3 2020 | Q2 2020 | Q1 2020 | Q4 2019 | Q3 2019 | 2020 | 2019 | ||||||||||||||||||||||||||||||||||
| GAAP net income | $ | 50,515 | $ | 22,718 | $ | 3,100 | $ | 27,526 | $ | 27,066 | $ | 76,332 | $ | 51,801 | |||||||||||||||||||||||||||
| Reconciling items: | |||||||||||||||||||||||||||||||||||||||||
Income tax expense | 12,201 | 7,048 | 1,906 | 7,451 | 8,020 | 21,156 | 15,343 | ||||||||||||||||||||||||||||||||||
Provision for credit losses on loans and leases | 12,955 | 20,946 | 31,786 | 9,689 | 4,426 | 65,688 | 14,539 | ||||||||||||||||||||||||||||||||||
| Provision for credit losses on unfunded commitments | (527) | (356) | 751 | 3 | (235) | (132) | (406) | ||||||||||||||||||||||||||||||||||
| Severance expense | — | — | — | — | — | — | 490 | ||||||||||||||||||||||||||||||||||
| Loss upon acquisition of interest-only GNMA securities | — | — | — | — | — | — | 7,476 | ||||||||||||||||||||||||||||||||||
Merger and acquisition related expenses | 1,035 | 25 | 50 | 100 | — | 1,110 | — | ||||||||||||||||||||||||||||||||||
| Legal reserves | 320 | — | 1,042 | — | 2,000 | 1,362 | 2,000 | ||||||||||||||||||||||||||||||||||
| (Gains) losses on investment securities | (11,945) | (5,553) | (2,596) | (310) | (2,334) | (20,095) | (1,989) | ||||||||||||||||||||||||||||||||||
| Derivative credit valuation adjustment | (378) | 5,895 | 2,556 | (565) | 497 | 8,073 | 1,631 | ||||||||||||||||||||||||||||||||||
| Risk participation agreement mark-to-market adjustment | — | (1,407) | — | — | — | (1,407) | — | ||||||||||||||||||||||||||||||||||
| Losses on sale of non-QM residential mortgage loans | — | — | — | 782 | — | — | — | ||||||||||||||||||||||||||||||||||
| Unrealized losses on loans held for sale | — | 1,450 | — | — | — | 1,450 | — | ||||||||||||||||||||||||||||||||||
Adjusted net income - pre-tax pre-provision | $ | 64,176 | $ | 50,766 | $ | 38,595 | $ | 44,676 | $ | 39,440 | $ | 153,537 | $ | 90,885 | |||||||||||||||||||||||||||
Average total assets | $ | 17,865,574 | $ | 14,675,584 | $ | 11,573,406 | $ | 11,257,207 | $ | 11,259,144 | $ | 14,716,390 | $ | 10,468,998 | |||||||||||||||||||||||||||
| Adjusted ROAA - pre-tax pre-provision | 1.43 | % | 1.39 | % | 1.34 | % | 1.57 | % | 1.39 | % | 1.39 | % | 1.16 | % | |||||||||||||||||||||||||||
| Core Return on Average Common Equity - Customers Bancorp | Nine Months Ended September 30, | ||||||||||||||||||||||||||||||||||||||||
| (dollars in thousands except per share data) | Q3 2020 | Q2 2020 | Q1 2020 | Q4 2019 | Q3 2019 | 2020 | 2019 | ||||||||||||||||||||||||||||||||||
| GAAP net income to common shareholders | $ | 47,085 | $ | 19,137 | $ | (515) | $ | 23,911 | $ | 23,451 | $ | 65,706 | $ | 40,957 | |||||||||||||||||||||||||||
| Reconciling items (after tax): | |||||||||||||||||||||||||||||||||||||||||
| Severance expense | — | — | — | — | — | — | 373 | ||||||||||||||||||||||||||||||||||
| Loss upon acquisition of interest-only GNMA securities | — | — | — | — | — | — | 5,682 | ||||||||||||||||||||||||||||||||||
Merger and acquisition related expenses | 833 | 19 | 40 | 76 | — | 892 | — | ||||||||||||||||||||||||||||||||||
| Legal reserves | 258 | — | 830 | — | 1,520 | 1,088 | 1,520 | ||||||||||||||||||||||||||||||||||
| (Gains) losses on investment securities | (9,662) | (4,543) | (1,788) | (310) | (1,947) | (15,993) | (1,602) | ||||||||||||||||||||||||||||||||||
| Derivative credit valuation adjustment | (304) | 4,527 | 2,036 | (429) | 378 | 6,259 | 1,240 | ||||||||||||||||||||||||||||||||||
| Risk participation agreement mark-to-market adjustment | — | (1,080) | — | — | — | (1,080) | — | ||||||||||||||||||||||||||||||||||
| Losses on sale of non-QM residential mortgage loans | — | — | — | 595 | — | — | — | ||||||||||||||||||||||||||||||||||
| Unrealized losses on loans held for sale | — | 1,114 | — | — | — | 1,114 | — | ||||||||||||||||||||||||||||||||||
Core earnings | $ | 38,210 | $ | 19,174 | $ | 603 | $ | 23,843 | $ | 23,402 | $ | 57,986 | $ | 48,170 | |||||||||||||||||||||||||||
| Average total common shareholders' equity | $ | 812,577 | $ | 771,663 | $ | 807,884 | $ | 819,018 | $ | 787,885 | $ | 797,430 | $ | 769,338 | |||||||||||||||||||||||||||
| Core return on average common equity | 18.71 | % | 9.99 | % | 0.30 | % | 11.55 | % | 11.78 | % | 9.71 | % | 8.37 | % | |||||||||||||||||||||||||||
23
| CUSTOMERS BANCORP, INC. AND SUBSIDIARIES | |||||||||||||||||||||||||||||
| RECONCILIATION OF GAAP TO NON-GAAP MEASURES - UNAUDITED (CONTINUED) | |||||||||||||||||||||||||||||
(Dollars in thousands, except per share data)
| Adjusted ROCE - Pre-Tax Pre-Provision - Customers Bancorp | Nine Months Ended September 30, | ||||||||||||||||||||||||||||||||||||||||
| (dollars in thousands except per share data) | Q3 2020 | Q2 2020 | Q1 2020 | Q4 2019 | Q3 2019 | 2020 | 2019 | ||||||||||||||||||||||||||||||||||
| GAAP net income to common shareholders | $ | 47,085 | $ | 19,137 | $ | (515) | $ | 23,911 | $ | 23,451 | $ | 65,706 | $ | 40,957 | |||||||||||||||||||||||||||
| Reconciling items: | |||||||||||||||||||||||||||||||||||||||||
Income tax expense | 12,201 | 7,048 | 1,906 | 7,451 | 8,020 | 21,156 | 15,343 | ||||||||||||||||||||||||||||||||||
Provision for credit losses on loan and leases | 12,955 | 20,946 | 31,786 | 9,689 | 4,426 | 65,688 | 14,539 | ||||||||||||||||||||||||||||||||||
| Provision for credit losses on unfunded commitments | (527) | (356) | 751 | 3 | (235) | (132) | (406) | ||||||||||||||||||||||||||||||||||
| Severance expense | — | — | — | — | — | — | 490 | ||||||||||||||||||||||||||||||||||
| Loss upon acquisition of interest-only GNMA securities | — | — | — | — | — | — | 7,476 | ||||||||||||||||||||||||||||||||||
Merger and acquisition related expenses | 1,035 | 25 | 50 | 100 | — | 1,110 | — | ||||||||||||||||||||||||||||||||||
| Legal reserves | 320 | — | 1,042 | — | 2,000 | 1,362 | 2,000 | ||||||||||||||||||||||||||||||||||
| (Gains) losses on investment securities | (11,945) | (5,553) | (2,596) | (310) | (2,334) | (20,095) | (1,989) | ||||||||||||||||||||||||||||||||||
| Derivative credit valuation adjustment | (378) | 5,895 | 2,556 | (565) | 497 | 8,073 | 1,631 | ||||||||||||||||||||||||||||||||||
| Risk participation agreement mark-to-market adjustment | — | (1,407) | — | — | — | (1,407) | — | ||||||||||||||||||||||||||||||||||
| Losses on sale of non-QM residential mortgage loans | — | — | — | 782 | — | — | — | ||||||||||||||||||||||||||||||||||
| Unrealized losses on loans held for sale | — | 1,450 | — | — | — | 1,450 | — | ||||||||||||||||||||||||||||||||||
Pre-tax pre-provision adjusted net income available to common shareholders | $ | 60,746 | $ | 47,185 | $ | 34,980 | $ | 41,061 | $ | 35,825 | $ | 142,911 | $ | 80,041 | |||||||||||||||||||||||||||
Average total common shareholders' equity | $ | 812,577 | $ | 771,663 | $ | 807,884 | $ | 819,018 | $ | 787,885 | $ | 797,430 | $ | 769,338 | |||||||||||||||||||||||||||
| Adjusted ROCE - pre-tax pre-provision | 29.74 | % | 24.59 | % | 17.41 | % | 19.89 | % | 18.04 | % | 23.94 | % | 13.91 | % | |||||||||||||||||||||||||||
| Net Interest Margin, Tax Equivalent - Customers Bancorp | Nine Months Ended September 30, | ||||||||||||||||||||||||||||||||||||||||
| (dollars in thousands except per share data) | Q3 2020 | Q2 2020 | Q1 2020 | Q4 2019 | Q3 2019 | 2020 | 2019 | ||||||||||||||||||||||||||||||||||
| GAAP net interest income | $ | 107,439 | $ | 91,982 | $ | 81,321 | $ | 77,593 | $ | 75,735 | $ | 280,742 | $ | 199,718 | |||||||||||||||||||||||||||
| Tax-equivalent adjustment | 225 | 225 | 205 | 187 | 184 | 655 | 548 | ||||||||||||||||||||||||||||||||||
| Net interest income tax equivalent | $ | 107,664 | $ | 92,207 | $ | 81,526 | $ | 77,780 | $ | 75,919 | $ | 281,397 | $ | 200,266 | |||||||||||||||||||||||||||
| Average total interest earning assets | $ | 17,121,145 | $ | 13,980,021 | $ | 10,976,731 | $ | 10,676,730 | $ | 10,667,198 | $ | 14,037,262 | $ | 9,937,342 | |||||||||||||||||||||||||||
| Net interest margin, tax equivalent | 2.50 | % | 2.65 | % | 2.99 | % | 2.89 | % | 2.83 | % | 2.68 | % | 2.69 | % | |||||||||||||||||||||||||||
| Net Interest Margin, Tax Equivalent, Excluding PPP - Customers Bancorp | Nine Months Ended September 30, | ||||||||||||||||||||||||||||||||||||||||
| (dollars in thousands except per share data) | Q3 2020 | Q2 2020 | Q1 2020 | Q4 2019 | Q3 2019 | 2020 | 2019 | ||||||||||||||||||||||||||||||||||
| GAAP net interest income | $ | 107,439 | $ | 91,982 | $ | 81,321 | $ | 77,593 | $ | 75,735 | $ | 280,742 | $ | 199,718 | |||||||||||||||||||||||||||
| PPP net interest income | (20,018) | (9,308) | — | — | — | (29,326) | — | ||||||||||||||||||||||||||||||||||
| Tax-equivalent adjustment | 225 | 225 | 205 | 187 | 184 | 655 | 548 | ||||||||||||||||||||||||||||||||||
| Net interest income, tax equivalent, excluding PPP | $ | 87,646 | $ | 82,899 | $ | 81,526 | $ | 77,780 | $ | 75,919 | $ | 252,071 | $ | 200,266 | |||||||||||||||||||||||||||
| GAAP average total interest earning assets | $ | 17,121,145 | $ | 13,980,021 | $ | 10,976,731 | $ | 10,676,730 | $ | 10,667,198 | $ | 14,037,262 | $ | 9,937,342 | |||||||||||||||||||||||||||
| Average PPP loans | (4,909,197) | (2,754,920) | — | — | — | (2,563,299) | — | ||||||||||||||||||||||||||||||||||
| Adjusted average total interest earning assets | $ | 12,211,948 | $ | 11,225,101 | $ | 10,976,731 | $ | 10,676,730 | $ | 10,667,198 | $ | 11,473,963 | $ | 9,937,342 | |||||||||||||||||||||||||||
| Net interest margin, tax equivalent, excluding PPP | 2.86 | % | 2.97 | % | 2.99 | % | 2.89 | % | 2.83 | % | 2.93 | % | 2.69 | % | |||||||||||||||||||||||||||
24
| CUSTOMERS BANCORP, INC. AND SUBSIDIARIES | |||||||||||||||||||||||||||||
| RECONCILIATION OF GAAP TO NON-GAAP MEASURES - UNAUDITED (CONTINUED) | |||||||||||||||||||||||||||||
(Dollars in thousands, except per share data)
| Core Efficiency Ratio - Customers Bancorp | Nine Months Ended September 30, | ||||||||||||||||||||||||||||||||||||||||
| (dollars in thousands except per share data) | Q3 2020 | Q2 2020 | Q1 2020 | Q4 2019 | Q3 2019 | 2020 | 2019 | ||||||||||||||||||||||||||||||||||
| GAAP net interest income | $ | 107,439 | $ | 91,982 | $ | 81,321 | $ | 77,593 | $ | 75,735 | $ | 280,742 | $ | 199,718 | |||||||||||||||||||||||||||
| GAAP non-interest income | $ | 33,793 | $ | 22,236 | $ | 21,930 | $ | 25,813 | $ | 23,369 | $ | 77,959 | $ | 55,125 | |||||||||||||||||||||||||||
| Loss upon acquisition of interest-only GNMA securities | — | — | — | — | — | — | 7,476 | ||||||||||||||||||||||||||||||||||
| (Gains) losses on investment securities | (11,945) | (5,553) | (2,596) | (310) | (2,334) | (20,095) | (1,989) | ||||||||||||||||||||||||||||||||||
| Derivative credit valuation adjustment | (378) | 5,895 | 2,556 | (565) | 497 | 8,073 | 1,631 | ||||||||||||||||||||||||||||||||||
| Risk participation agreement mark-to-market adjustment | — | (1,407) | — | — | — | (1,407) | — | ||||||||||||||||||||||||||||||||||
| Losses on sale of non-QM residential mortgage loans | — | — | — | 782 | — | — | — | ||||||||||||||||||||||||||||||||||
| Unrealized losses on loans held for sale | — | 1,450 | — | — | — | 1,450 | — | ||||||||||||||||||||||||||||||||||
| Core non-interest income | 21,470 | 22,621 | 21,890 | 25,720 | 21,532 | 65,980 | 62,243 | ||||||||||||||||||||||||||||||||||
| Core revenue | $ | 128,909 | $ | 114,603 | $ | 103,211 | $ | 103,313 | $ | 97,267 | $ | 346,722 | $ | 261,961 | |||||||||||||||||||||||||||
| GAAP non-interest expense | $ | 65,561 | $ | 63,506 | $ | 66,459 | $ | 58,740 | $ | 59,592 | $ | 195,525 | $ | 173,160 | |||||||||||||||||||||||||||
| Severance expense | — | — | — | — | — | — | (490) | ||||||||||||||||||||||||||||||||||
| Legal reserves | (320) | — | (1,042) | — | (2,000) | (1,362) | (2,000) | ||||||||||||||||||||||||||||||||||
| Merger and acquisition related expenses | (1,035) | (25) | (50) | (100) | — | (1,110) | — | ||||||||||||||||||||||||||||||||||
| Core non-interest expense | $ | 64,206 | $ | 63,481 | $ | 65,367 | $ | 58,640 | $ | 57,592 | $ | 193,053 | $ | 170,670 | |||||||||||||||||||||||||||
Core efficiency ratio (1) | 49.81 | % | 55.39 | % | 63.33 | % | 56.76 | % | 59.21 | % | 55.68 | % | 65.15 | % | |||||||||||||||||||||||||||
(1) Core efficiency ratio calculated as core non-interest expense divided by core revenue.
| Tangible Common Equity to Tangible Assets - Customers Bancorp | |||||||||||||||||||||||||||||
| (dollars in thousands except per share data) | Q3 2020 | Q2 2020 | Q1 2020 | Q4 2019 | Q3 2019 | ||||||||||||||||||||||||
| GAAP total shareholders' equity | $ | 1,051,491 | $ | 1,007,847 | $ | 964,636 | $ | 1,052,795 | $ | 1,019,150 | |||||||||||||||||||
| Reconciling items: | |||||||||||||||||||||||||||||
| Preferred stock | (217,471) | (217,471) | (217,471) | (217,471) | (217,471) | ||||||||||||||||||||||||
| Goodwill and other intangibles | (14,437) | (14,575) | (14,870) | (15,195) | (15,521) | ||||||||||||||||||||||||
| Tangible common equity | $ | 819,583 | $ | 775,801 | $ | 732,295 | $ | 820,129 | $ | 786,158 | |||||||||||||||||||
| GAAP total assets | $ | 18,778,727 | $ | 17,903,118 | $ | 12,018,799 | $ | 11,520,717 | $ | 11,723,790 | |||||||||||||||||||
| Reconciling items: | |||||||||||||||||||||||||||||
| Goodwill and other intangibles | (14,437) | (14,575) | (14,870) | (15,195) | (15,521) | ||||||||||||||||||||||||
| Tangible assets | $ | 18,764,290 | $ | 17,888,543 | $ | 12,003,929 | $ | 11,505,522 | $ | 11,708,269 | |||||||||||||||||||
| Tangible common equity to tangible assets | 4.37 | % | 4.34 | % | 6.10 | % | 7.13 | % | 6.71 | % | |||||||||||||||||||
25
| CUSTOMERS BANCORP, INC. AND SUBSIDIARIES | |||||||||||||||||||||||||||||
| RECONCILIATION OF GAAP TO NON-GAAP MEASURES - UNAUDITED (CONTINUED) | |||||||||||||||||||||||||||||
(Dollars in thousands, except per share data)
| Tangible Book Value per Common Share - Customers Bancorp | |||||||||||||||||||||||||||||
| (dollars in thousands except share and per share data) | Q3 2020 | Q2 2020 | Q1 2020 | Q4 2019 | Q3 2019 | ||||||||||||||||||||||||
| GAAP total shareholders' equity | $ | 1,051,491 | $ | 1,007,847 | $ | 964,636 | $ | 1,052,795 | $ | 1,019,150 | |||||||||||||||||||
| Reconciling Items: | |||||||||||||||||||||||||||||
| Preferred stock | (217,471) | (217,471) | (217,471) | (217,471) | (217,471) | ||||||||||||||||||||||||
| Goodwill and other intangibles | (14,437) | (14,575) | (14,870) | (15,195) | (15,521) | ||||||||||||||||||||||||
| Tangible common equity | $ | 819,583 | $ | 775,801 | $ | 732,295 | $ | 820,129 | $ | 786,158 | |||||||||||||||||||
| Common shares outstanding | 31,555,124 | 31,510,287 | 31,470,026 | 31,336,791 | 31,245,776 | ||||||||||||||||||||||||
| Tangible book value per common share | $ | 25.97 | $ | 24.62 | $ | 23.27 | $ | 26.17 | $ | 25.16 | |||||||||||||||||||
| Adjusted Net Income - Pre-Tax Pre-Provision - BankMobile | Nine Months Ended September 30, | ||||||||||||||||||||||||||||||||||||||||
| (dollars in thousands except per share data) | Q3 2020 | Q2 2020 | Q1 2020 | Q4 2019 | Q3 2019 | 2020 | 2019 | ||||||||||||||||||||||||||||||||||
| GAAP net income to common shareholders | $ | 2,981 | $ | 1,940 | $ | (3,195) | $ | 1,693 | $ | 684 | $ | 1,725 | $ | (6,574) | |||||||||||||||||||||||||||
| Reconciling items: | |||||||||||||||||||||||||||||||||||||||||
| Income tax expense (benefit) | 827 | 437 | (816) | 559 | 206 | 448 | (1,981) | ||||||||||||||||||||||||||||||||||
| Provision for credit losses on loans and leases | 4,256 | 1,323 | 4,488 | 2,843 | 1,951 | 10,068 | 11,294 | ||||||||||||||||||||||||||||||||||
| Severance expense | — | — | — | — | — | — | 18 | ||||||||||||||||||||||||||||||||||
| Merger and acquisition related expenses | 377 | 25 | 50 | 100 | — | 452 | — | ||||||||||||||||||||||||||||||||||
| Legal reserves | — | — | 1,042 | — | 1,000 | 1,042 | 1,000 | ||||||||||||||||||||||||||||||||||
| Pre-tax pre-provision adjusted net income available to common shareholders | $ | 8,441 | $ | 3,725 | $ | 1,569 | $ | 5,195 | $ | 3,841 | $ | 13,735 | $ | 3,757 | |||||||||||||||||||||||||||
| Total Loans and Leases, excluding PPP | |||||||||||||||||||||||||||||
| (dollars in thousands) | Q3 2020 | Q2 2020 | Q1 2020 | Q4 2019 | Q3 2019 | ||||||||||||||||||||||||
| Total loans and leases | $ | 16,605,279 | $ | 15,290,202 | $ | 10,321,431 | $ | 10,051,074 | $ | 10,277,621 | |||||||||||||||||||
| Loans receivable, PPP | (4,964,105) | (4,760,427) | — | — | — | ||||||||||||||||||||||||
| Loans and leases, excluding PPP | $ | 11,641,174 | $ | 10,529,775 | $ | 10,321,431 | $ | 10,051,074 | $ | 10,277,621 | |||||||||||||||||||
| Total Assets, excluding PPP | |||||||||||||||||||||||||||||
| (dollars in thousands) | Q3 2020 | Q2 2020 | Q1 2020 | Q4 2019 | Q3 2019 | ||||||||||||||||||||||||
| Total asset | $ | 18,778,727 | $ | 17,903,118 | $ | 12,018,799 | $ | 11,520,717 | $ | 11,723,790 | |||||||||||||||||||
| Loans receivable, PPP | (4,964,105) | (4,760,427) | — | — | — | ||||||||||||||||||||||||
| Total assets, excluding PPP | $ | 13,814,622 | $ | 13,142,691 | $ | 12,018,799 | $ | 11,520,717 | $ | 11,723,790 | |||||||||||||||||||
| Coverage of credit loss reserves for loans and leases held for investment, excluding PPP | |||||||||||||||||||||||||||||
| (dollars in thousands) | Q3 2020 | Q2 2020 | Q1 2020 | Q4 2019 | Q3 2019 | ||||||||||||||||||||||||
| Loans and leases receivable | $ | 12,664,997 | $ | 12,032,874 | $ | 7,353,262 | $ | 7,318,988 | $ | 7,336,237 | |||||||||||||||||||
| Loans receivable, PPP | (4,964,105) | (4,760,427) | — | — | — | ||||||||||||||||||||||||
| Loans and leases held for investment, excluding PPP | $ | 7,700,892 | $ | 7,272,447 | $ | 7,353,262 | $ | 7,318,988 | $ | 7,336,237 | |||||||||||||||||||
| Allowance for credit losses on loans and leases | 155,561 | 159,905 | 149,283 | 56,379 | 51,053 | ||||||||||||||||||||||||
| Coverage of credit loss reserves for loans and leases held for investment, excluding PPP | 2.02 | % | 2.20 | % | 2.03 | % | 0.77 | % | 0.70 | % | |||||||||||||||||||
26
| CUSTOMERS BANCORP, INC. AND SUBSIDIARIES | |||||||||||||||||||||||||||||
| RECONCILIATION OF GAAP TO NON-GAAP MEASURES - UNAUDITED (CONTINUED) | |||||||||||||||||||||||||||||
(Dollars in thousands, except per share data)
| Tangible Common Equity to Tangible Assets, excluding PPP - Customers Bancorp | |||||||||||||||||||||||||||||
| (dollars in thousands except per share data) | Q3 2020 | Q2 2020 | Q1 2020 | Q4 2019 | Q3 2019 | ||||||||||||||||||||||||
| GAAP total shareholders' equity | $ | 1,051,491 | $ | 1,007,847 | $ | 964,636 | $ | 1,052,795 | $ | 1,019,150 | |||||||||||||||||||
| Reconciling items: | |||||||||||||||||||||||||||||
| Preferred stock | (217,471) | (217,471) | (217,471) | (217,471) | (217,471) | ||||||||||||||||||||||||
| Goodwill and other intangibles | (14,437) | (14,575) | (14,870) | (15,195) | (15,521) | ||||||||||||||||||||||||
| Tangible common equity | $ | 819,583 | $ | 775,801 | $ | 732,295 | $ | 820,129 | $ | 786,158 | |||||||||||||||||||
| GAAP total assets | $ | 18,778,727 | $ | 17,903,118 | $ | 12,018,799 | $ | 11,520,717 | $ | 11,723,790 | |||||||||||||||||||
| Loans receivable, PPP | (4,964,105) | (4,760,427) | — | — | — | ||||||||||||||||||||||||
| Total assets, excluding PPP | $ | 13,814,622 | $ | 13,142,691 | $ | 12,018,799 | $ | 11,520,717 | $ | 11,723,790 | |||||||||||||||||||
| Reconciling items: | |||||||||||||||||||||||||||||
| Goodwill and other intangibles | (14,437) | (14,575) | (14,870) | (15,195) | (15,521) | ||||||||||||||||||||||||
| Tangible assets | $ | 13,800,185 | $ | 13,128,116 | $ | 12,003,929 | $ | 11,505,522 | $ | 11,708,269 | |||||||||||||||||||
| Tangible common equity to tangible assets | 5.94 | % | 5.91 | % | 6.10 | % | 7.13 | % | 6.71 | % | |||||||||||||||||||
| Commercial criticized loans and leases receivable to total loans and leases, excluding PPP | |||||||||||||||||||||||||||||
| (dollars in thousands) | Q3 2020 | Q2 2020 | Q1 2020 | Q4 2019 | Q3 2019 | ||||||||||||||||||||||||
| Special mention loans | $ | 126,361 | $ | 105,110 | $ | 75,838 | $ | 111,157 | $ | 68,878 | |||||||||||||||||||
| Substandard loans | 172,217 | 119,651 | 130,370 | 139,744 | 107,086 | ||||||||||||||||||||||||
| Doubtful loans | — | 27,921 | 19,050 | — | — | ||||||||||||||||||||||||
| Criticized commercial loans and leases receivable | $ | 298,578 | $ | 252,682 | $ | 225,258 | $ | 250,901 | $ | 175,964 | |||||||||||||||||||
| Total loans and leases | 16,605,279 | 15,290,202 | 10,321,431 | 10,051,074 | 10,277,621 | ||||||||||||||||||||||||
| Loans receivable, PPP | (4,964,105) | (4,760,427) | — | — | — | ||||||||||||||||||||||||
| Total loans and leases, excluding PPP | $ | 11,641,174 | $ | 10,529,775 | $ | 10,321,431 | $ | 10,051,074 | $ | 10,277,621 | |||||||||||||||||||
| Commercial criticized loans and leases receivable to total loans and leases, excluding PPP | 2.56 | % | 2.40 | % | 2.18 | % | 2.50 | % | 1.71 | % | |||||||||||||||||||
27

Third Quarter 2020 Earnings Conference Call October 29, 2020 NYSE: CUBI
Forward-Looking Statements In addition to historical information, this presentation may contain ”forward-looking statements” within the meaning of the ”safe harbor” provisions of the Private Securities Litigation Reform Act of 1995. These forward-looking statements include statements with respect to Customers Bancorp, Inc.’s strategies, goals, beliefs, expectations, estimates, intentions, capital raising efforts, financial condition and results of operations, future performance and business. Statements preceded by, followed by, or that include the words “may,” “could,” “should,” “pro forma,” “looking forward,” “would,” “believe,” “expect,” “anticipate,” “estimate,” “intend,” “plan,” or similar expressions generally indicate a forward-looking statement. These forward-looking statements involve risks and uncertainties that are subject to change based on various important factors (some of which, in whole or in part, are beyond Customers Bancorp, Inc.’s control). Numerous competitive, economic, regulatory, legal and technological events and factors, among others, could cause Customers Bancorp, Inc.’s financial performance to differ materially from the goals, plans, objectives, intentions and expectations expressed in such forward-looking statements, including: the adverse impact on the U.S. economy, including the markets in which we operate, of the coronavirus outbreak, and the impact of a slowing U.S. economy and increased unemployment on the performance of our loan and lease portfolio, the market value of our investment securities, the demand for our products and services and the availability of sources of funding; the effects of actions by the federal government, including the Board of Governors of the Federal Reserve System and other government agencies, that effect market interest rates and the money supply; actions that we and our customers take in response to these developments and the effects such actions have on our operations, products, services and customer relationships; the effects of changes in accounting standards or policies, including Accounting Standards Update (ASU) 2016-13, Financial Instruments—Credit Losses (CECL); and, our ability to divest BankMobile on terms and conditions acceptable to us, in the timeframe we currently intend, and the possible effects on our business and results of operations of a divestiture of BankMobile or if we are unable to divest BankMobile for an extended period of time. Customers Bancorp, Inc. cautions that the foregoing factors are not exclusive, and neither such factors nor any such forward-looking statement takes into account the impact of any future events. All forward-looking statements and information set forth herein are based on management’s current beliefs and assumptions as of the date hereof and speak only as of the date they are made. For a more complete discussion of the assumptions, risks and uncertainties related to our business, you are encouraged to review Customers Bancorp, Inc.’s filings with the Securities and Exchange Commission, including its most recent annual report on Form 10-K for the year ended December 31, 2019, subsequently filed quarterly reports on Form 10-Q and current reports on Form 8-K, including any amendments thereto, that update or provide information in addition to the information included in the Form 10-K and Form 10-Q filings, if any. Customers Bancorp, Inc. does not undertake to update any forward-looking statement whether written or oral, that may be made from time to time by Customers Bancorp, Inc. or by or on behalf of Customers Bank, except as may be required under applicable law. This does not constitute an offer to sell, or a solicitation of an offer to buy, any security in any state or jurisdiction in which such offer, solicitation or sale would be unlawful. 2
Q3 2020 Investor Presentation I. Overview A. Franchise B. Key Features II. Financial Highlights A. Capital Trends B. Credit Quality C. Deposit Mix Shift III. Outlook A. Strategic Priorities B. Guidance IV. Appendix 3

I. Overview
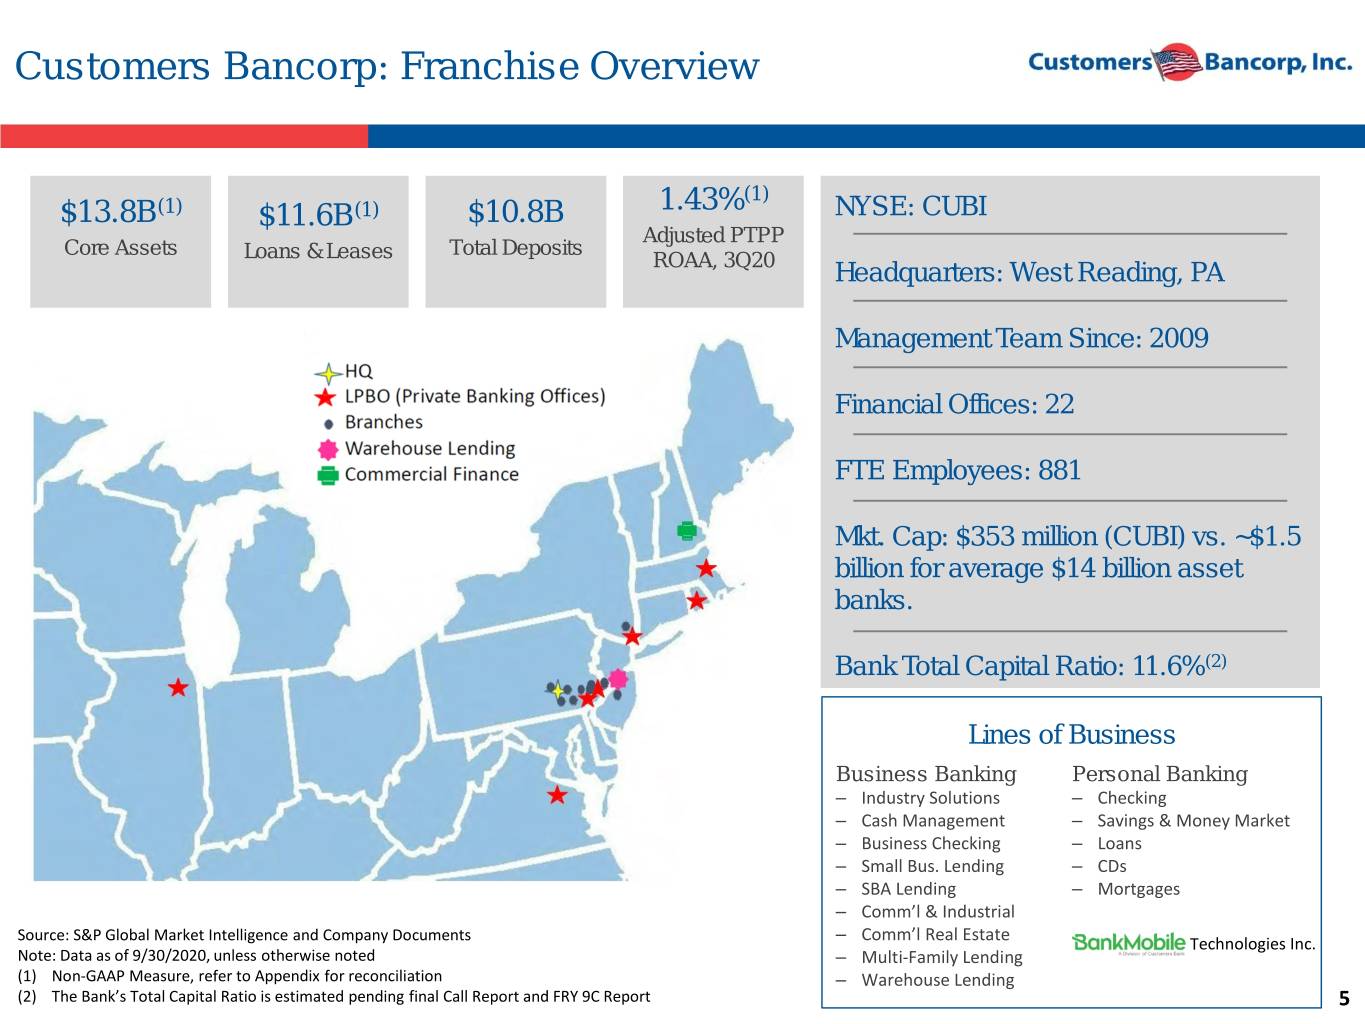
Customers Bancorp: Franchise Overview 1.43%(1) $13.8B(1) $11.6B(1) $10.8B NYSE: CUBI Adjusted PTPP Core Assets Loans & Leases Total Deposits ROAA, 3Q20 Headquarters: West Reading, PA Management Team Since: 2009 Financial Offices: 22 FTE Employees: 881 Mkt. Cap: $353 million (CUBI) vs. ~$1.5 billion for average $14 billion asset banks. Bank Total Capital Ratio: 11.6%(2) Lines of Business Business Banking Personal Banking ‒ Industry Solutions ‒ Checking ‒ Cash Management ‒ Savings & Money Market ‒ Business Checking ‒ Loans ‒ Small Bus. Lending ‒ CDs ‒ SBA Lending ‒ Mortgages ‒ Comm’l & Industrial ‒ Source: S&P Global Market Intelligence and Company Documents Comm’l Real Estate Technologies Inc. Note: Data as of 9/30/2020, unless otherwise noted ‒ Multi-Family Lending (1) Non-GAAP Measure, refer to Appendix for reconciliation ‒ Warehouse Lending (2) The Bank’s Total Capital Ratio is estimated pending final Call Report and FRY 9C Report 5
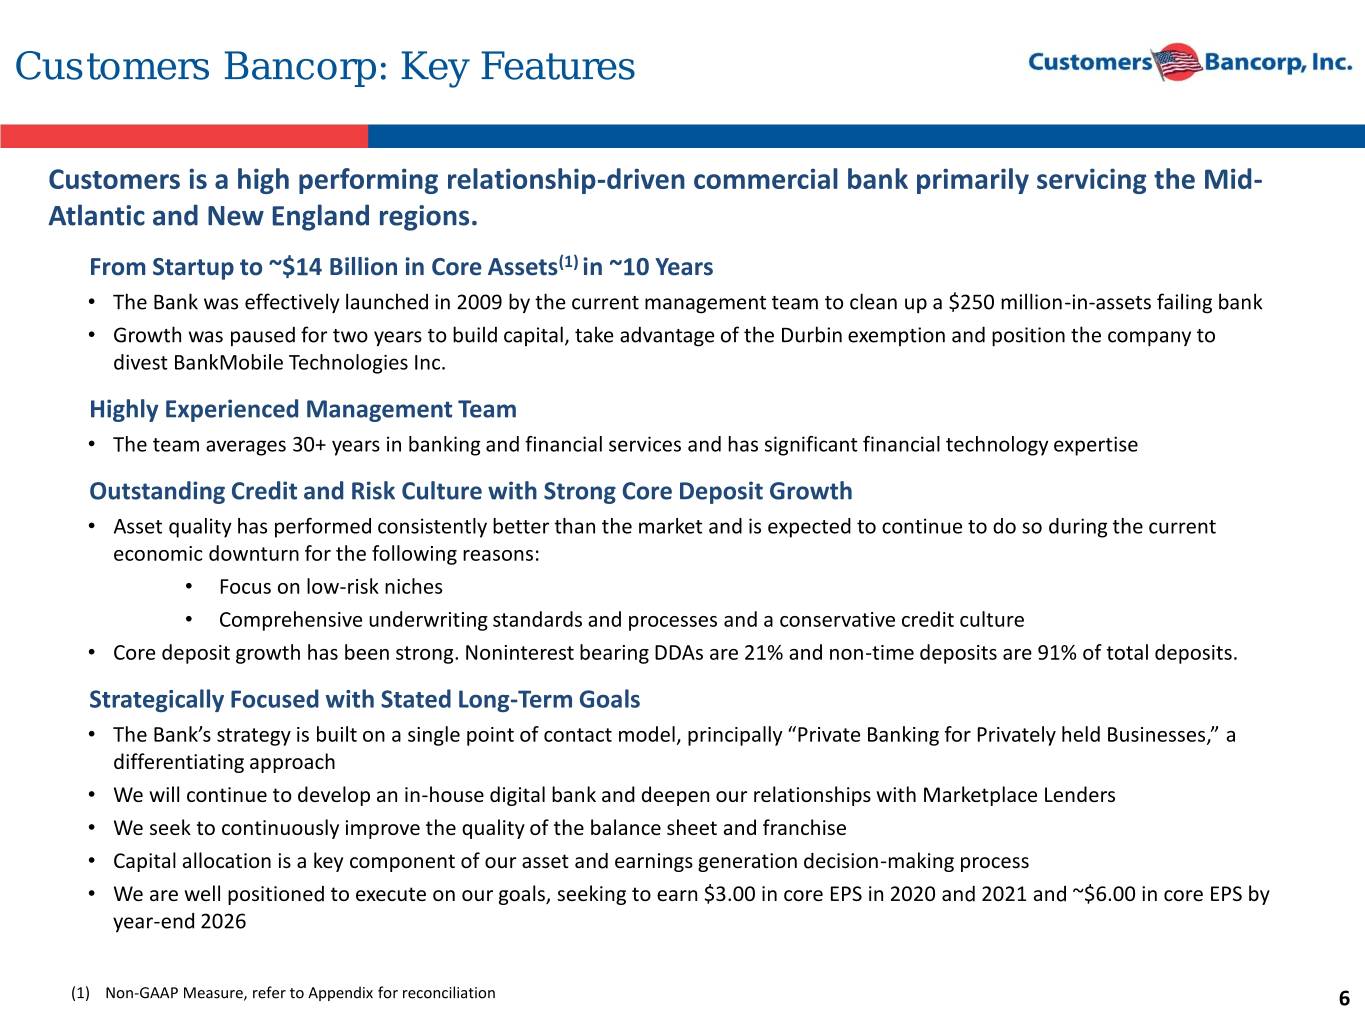
Customers Bancorp: Key Features Customers is a high performing relationship-driven commercial bank primarily servicing the Mid- Atlantic and New England regions. From Startup to ~$14 Billion in Core Assets(1) in ~10 Years • The Bank was effectively launched in 2009 by the current management team to clean up a $250 million-in-assets failing bank • Growth was paused for two years to build capital, take advantage of the Durbin exemption and position the company to divest BankMobile Technologies Inc. Highly Experienced Management Team • The team averages 30+ years in banking and financial services and has significant financial technology expertise Outstanding Credit and Risk Culture with Strong Core Deposit Growth • Asset quality has performed consistently better than the market and is expected to continue to do so during the current economic downturn for the following reasons: • Focus on low-risk niches • Comprehensive underwriting standards and processes and a conservative credit culture • Core deposit growth has been strong. Noninterest bearing DDAs are 21% and non-time deposits are 91% of total deposits. Strategically Focused with Stated Long-Term Goals • The Bank’s strategy is built on a single point of contact model, principally “Private Banking for Privately held Businesses,” a differentiating approach • We will continue to develop an in-house digital bank and deepen our relationships with Marketplace Lenders • We seek to continuously improve the quality of the balance sheet and franchise • Capital allocation is a key component of our asset and earnings generation decision-making process • We are well positioned to execute on our goals, seeking to earn $3.00 in core EPS in 2020 and 2021 and ~$6.00 in core EPS by year-end 2026 (1) Non-GAAP Measure, refer to Appendix for reconciliation 6

II. Financial Highlights
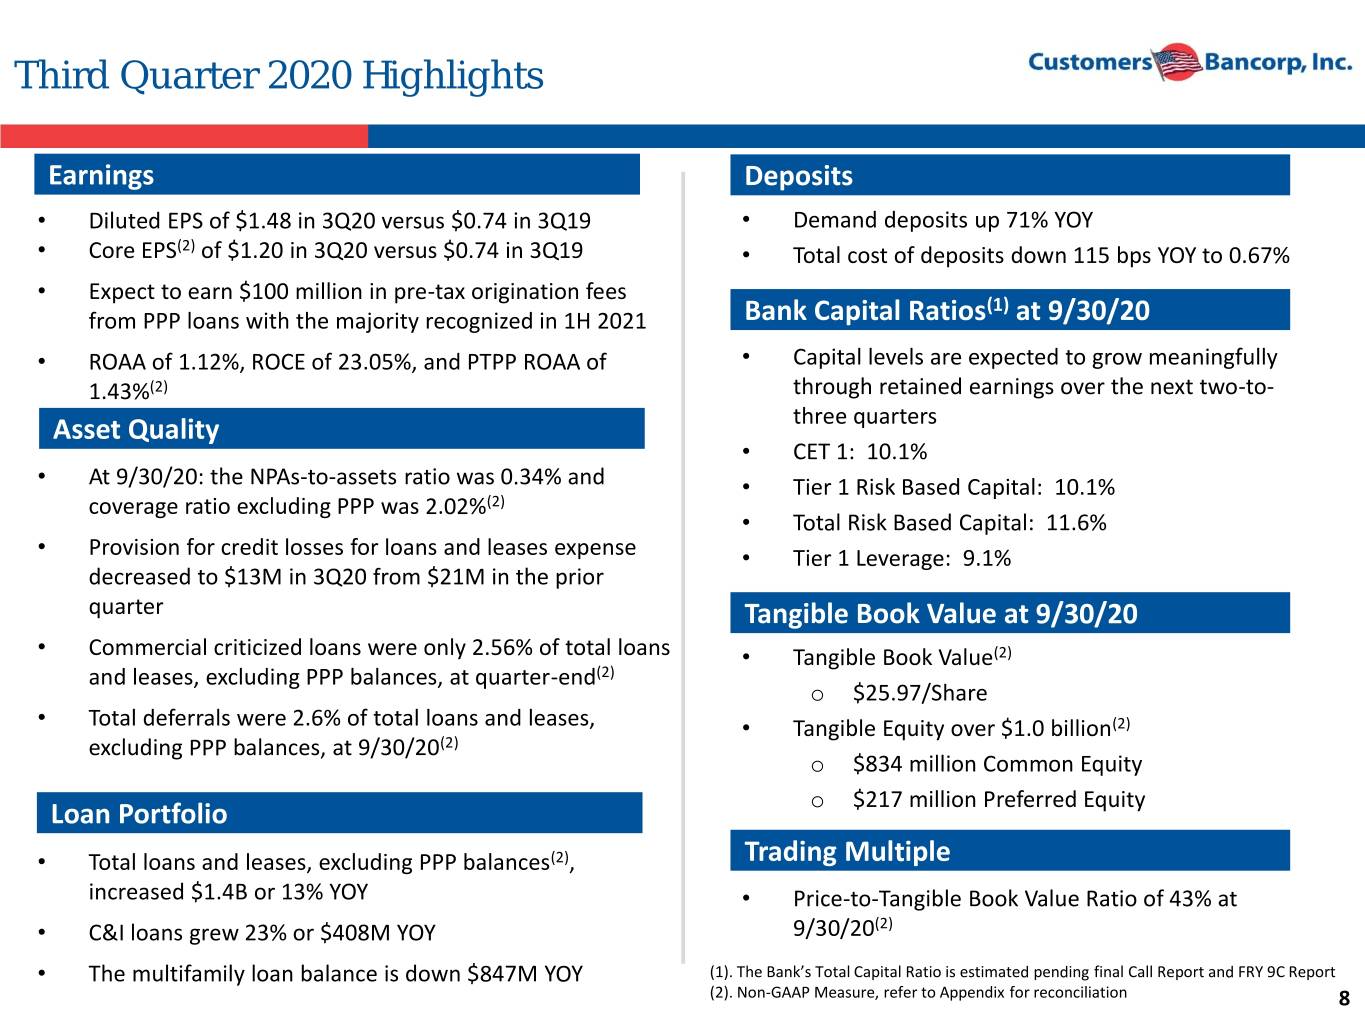
Third Quarter 2020 Highlights Earnings DepositsDeposits • Diluted EPS of $1.48 in 3Q20 versus $0.74 in 3Q19 • Demand deposits up 71% YOY • Core EPS(2) of $1.20 in 3Q20 versus $0.74 in 3Q19 • Total cost of deposits down 115 bps YOY to 0.67% • Expect to earn $100 million in pre-tax origination fees (1) from PPP loans with the majority recognized in 1H 2021 CapitalBank Capital Ratios* Ratios at 9/30/20 • ROAA of 1.12%, ROCE of 23.05%, and PTPP ROAA of • Capital levels are expected to grow meaningfully 1.43%(2) through retained earnings over the next two-to- Asset Quality three quarters • CET 1: 10.1% • At 9/30/20: the NPAs-to-assets ratio was 0.34% and • Tier 1 Risk Based Capital: 10.1% coverage ratio excluding PPP was 2.02%(2) • Total Risk Based Capital: 11.6% • Provision for credit losses for loans and leases expense • Tier 1 Leverage: 9.1% decreased to $13M in 3Q20 from $21M in the prior quarter Tangible Book Value at 9/30/20 • Commercial criticized loans were only 2.56% of total loans • Tangible Book Value(2) and leases, excluding PPP balances, at quarter-end(2) o $25.97/Share • Total deferrals were 2.6% of total loans and leases, • Tangible Equity over $1.0 billion(2) excluding PPP balances, at 9/30/20(2) o $834 million Common Equity o Loan Portfolio $217 million Preferred Equity • Total loans and leases, excluding PPP balances(2), Trading Multiple increased $1.4B or 13% YOY • Price-to-Tangible Book Value Ratio of 43% at • C&I loans grew 23% or $408M YOY 9/30/20(2) • The multifamily loan balance is down $847M YOY (1). The Bank’s Total Capital Ratio is estimated pending final Call Report and FRY 9C Report (2). Non-GAAP Measure, refer to Appendix for reconciliation 8
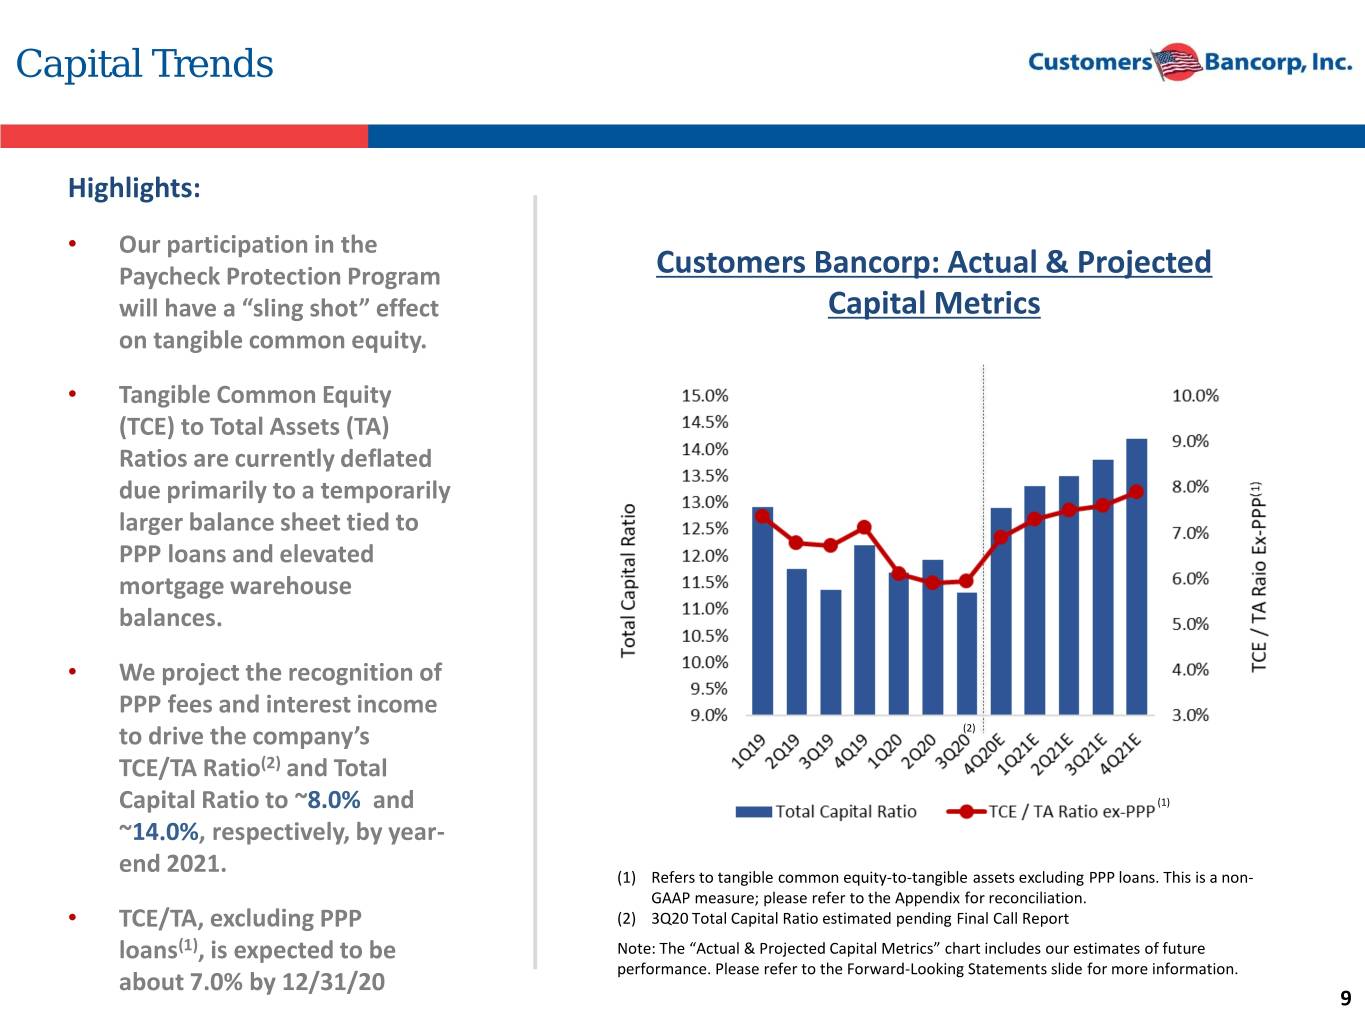
Capital Trends Highlights: • Our participation in the Paycheck Protection Program Customers Bancorp: Actual & Projected will have a “sling shot” effect Capital Metrics on tangible common equity. • Tangible Common Equity (TCE) to Total Assets (TA) Ratios are currently deflated due primarily to a temporarily larger balance sheet tied to PPP loans and elevated mortgage warehouse balances. • We project the recognition of PPP fees and interest income to drive the company’s (2) TCE/TA Ratio(2) and Total Capital Ratio to ~8.0% and (1) ~14.0%, respectively, by year- end 2021. (1) Refers to tangible common equity-to-tangible assets excluding PPP loans. This is a non- GAAP measure; please refer to the Appendix for reconciliation. • TCE/TA, excluding PPP (2) 3Q20 Total Capital Ratio estimated pending Final Call Report loans(1), is expected to be Note: The “Actual & Projected Capital Metrics” chart includes our estimates of future performance. Please refer to the Forward-Looking Statements slide for more information. about 7.0% by 12/31/20 9
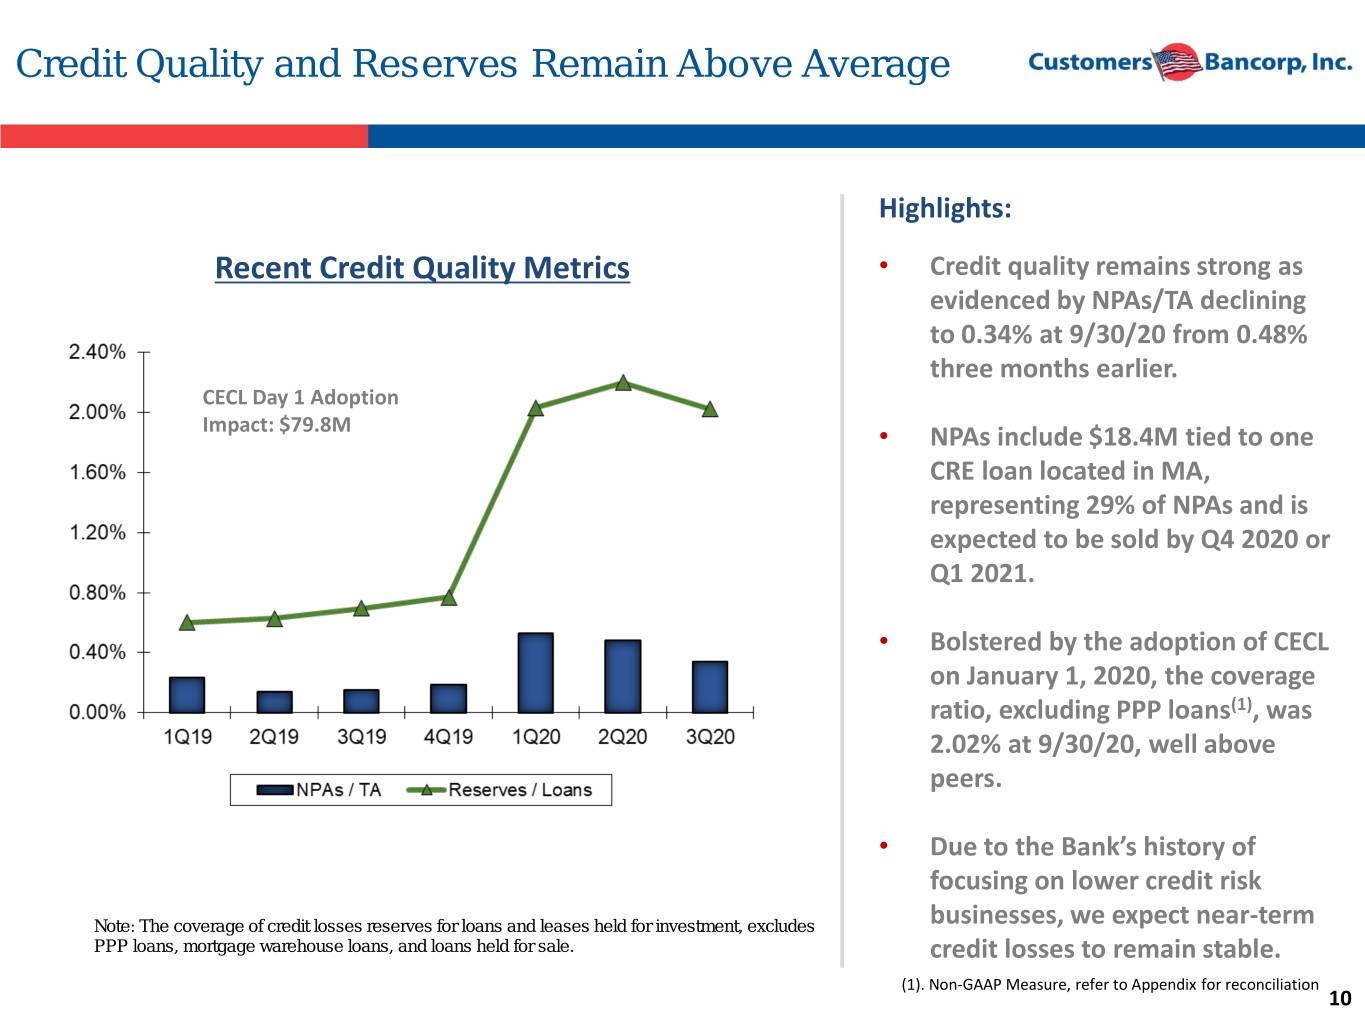
Credit Quality and Reserves Remain Above Average Highlights: Recent Credit Quality Metrics • Credit quality remains strong as evidenced by NPAs/TA declining to 0.34% at 9/30/20 from 0.48% three months earlier. CECL Day 1 Adoption Impact: $79.8M • NPAs include $18.4M tied to one CRE loan located in MA, representing 29% of NPAs and is expected to be sold by Q4 2020 or Q1 2021. • Bolstered by the adoption of CECL on January 1, 2020, the coverage ratio, excluding PPP loans(1), was 2.02% at 9/30/20, well above peers. • Due to the Bank’s history of focusing on lower credit risk Note: The coverage of credit losses reserves for loans and leases held for investment, excludes businesses, we expect near-term PPP loans, mortgage warehouse loans, and loans held for sale. credit losses to remain stable. (1). Non-GAAP Measure, refer to Appendix for reconciliation 10
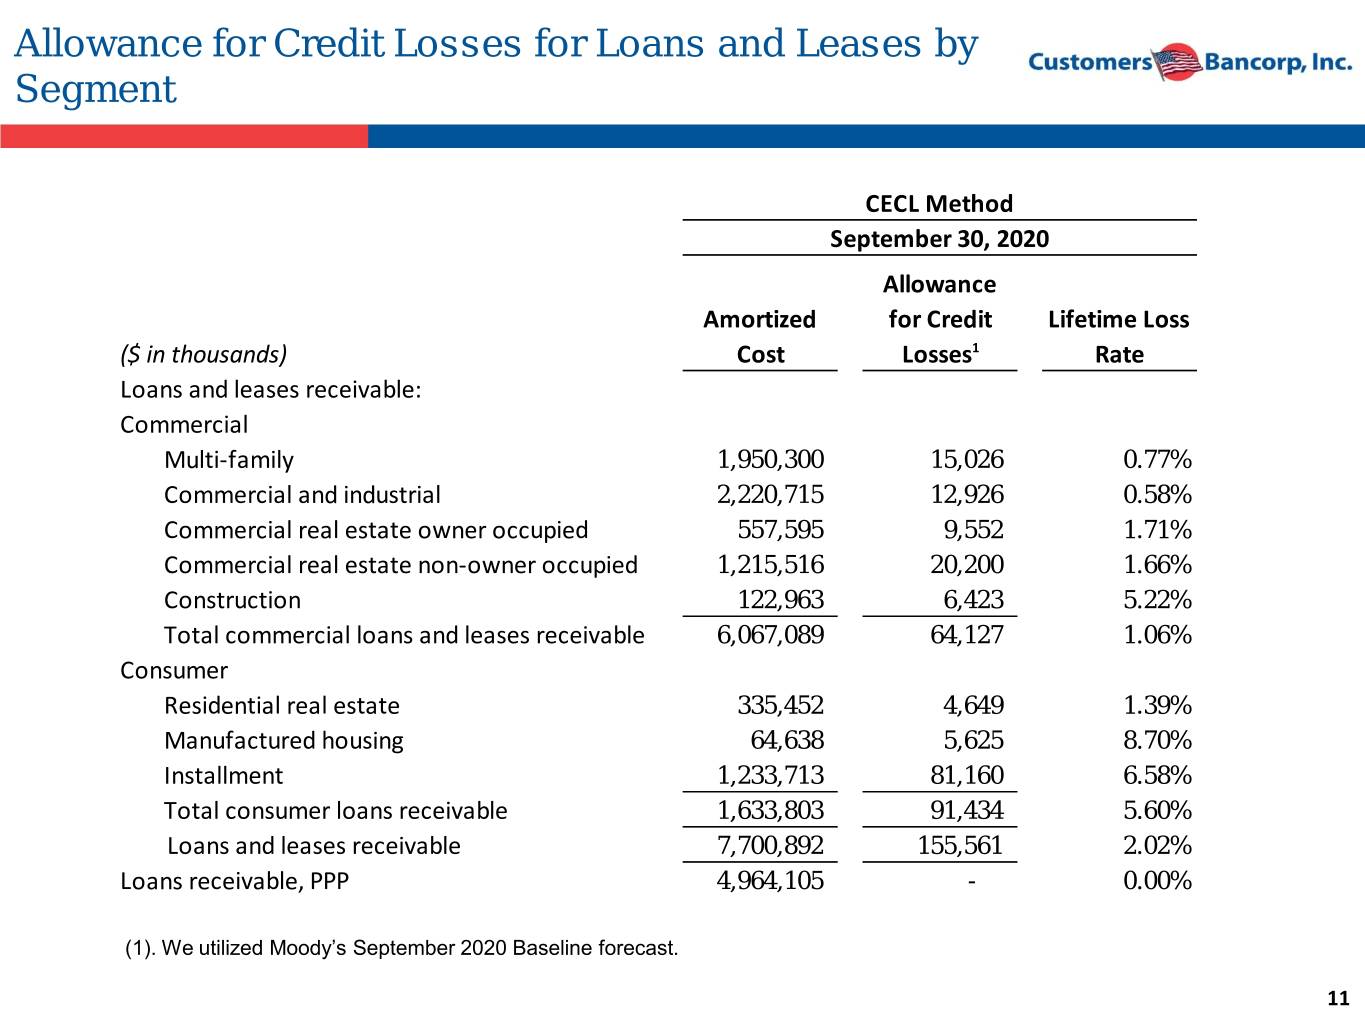
Allowance for Credit Losses for Loans and Leases by Segment CECL Method September 30, 2020 Allowance Amortized for Credit Lifetime Loss ($ in thousands) Cost Losses1 Rate Loans and leases receivable: Commercial Multi-family 1,950,300 15,026 0.77% Commercial and industrial 2,220,715 12,926 0.58% Commercial real estate owner occupied 557,595 9,552 1.71% Commercial real estate non-owner occupied 1,215,516 20,200 1.66% Construction 122,963 6,423 5.22% Total commercial loans and leases receivable 6,067,089 64,127 1.06% Consumer Residential real estate 335,452 4,649 1.39% Manufactured housing 64,638 5,625 8.70% Installment 1,233,713 81,160 6.58% Total consumer loans receivable 1,633,803 91,434 5.60% Loans and leases receivable 7,700,892 155,561 2.02% Loans receivable, PPP 4,964,105 - 0.00% (1). We utilized Moody’s September 2020 Baseline forecast. 11
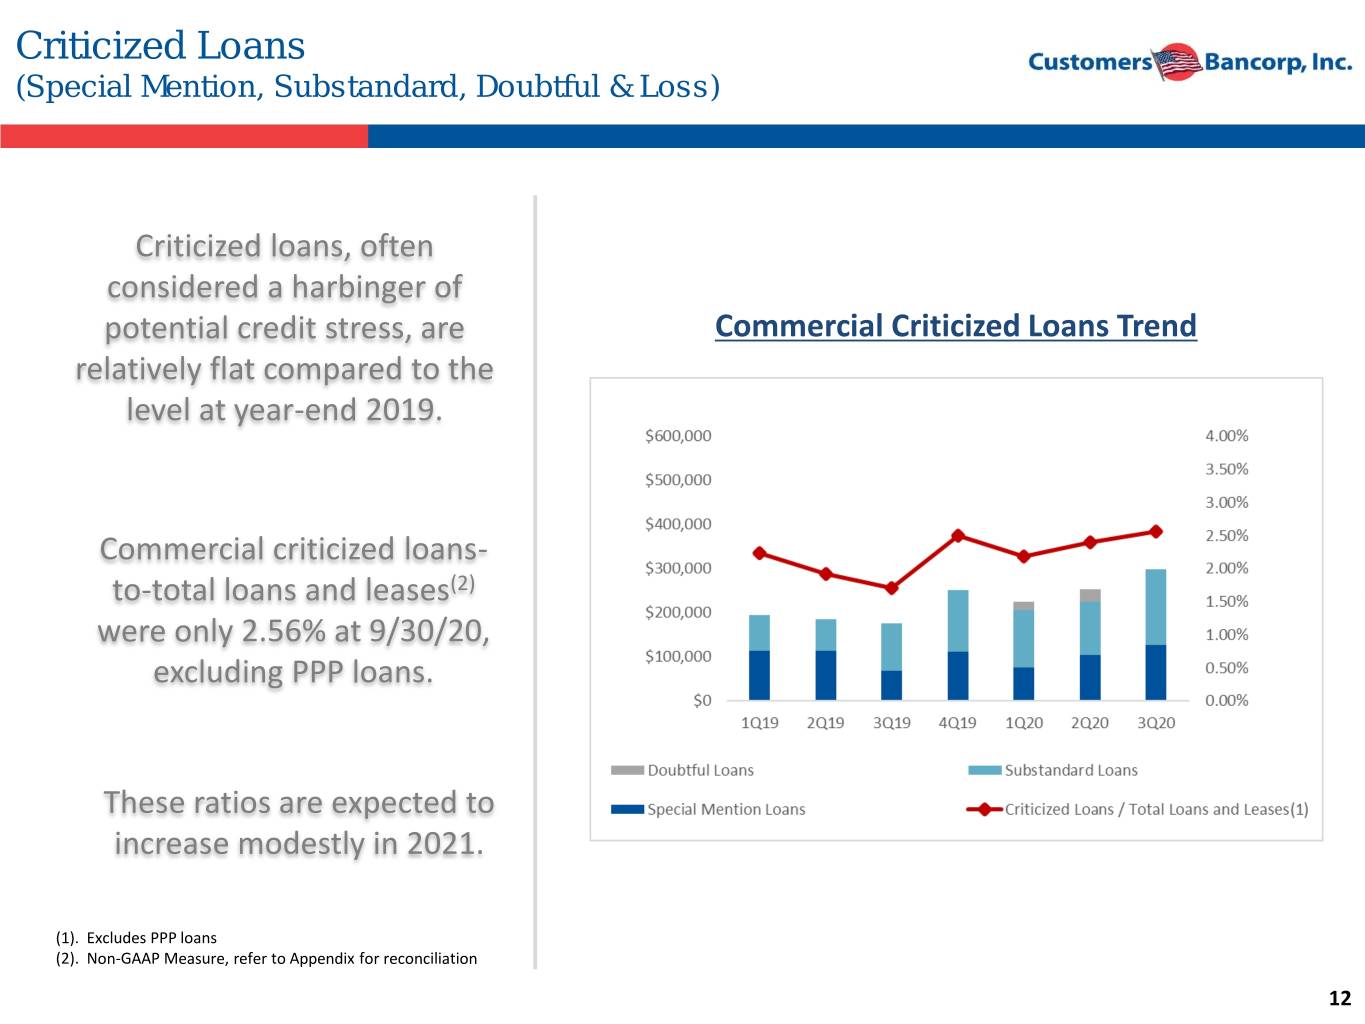
Criticized Loans (Special Mention, Substandard, Doubtful & Loss) Criticized loans, often considered a harbinger of potential credit stress, are Commercial Criticized Loans Trend relatively flat compared to the level at year-end 2019. Commercial criticized loans- to-total loans and leases(2) were only 2.56% at 9/30/20, excluding PPP loans. These ratios are expected to increase modestly in 2021. (1). Excludes PPP loans (2). Non-GAAP Measure, refer to Appendix for reconciliation 12
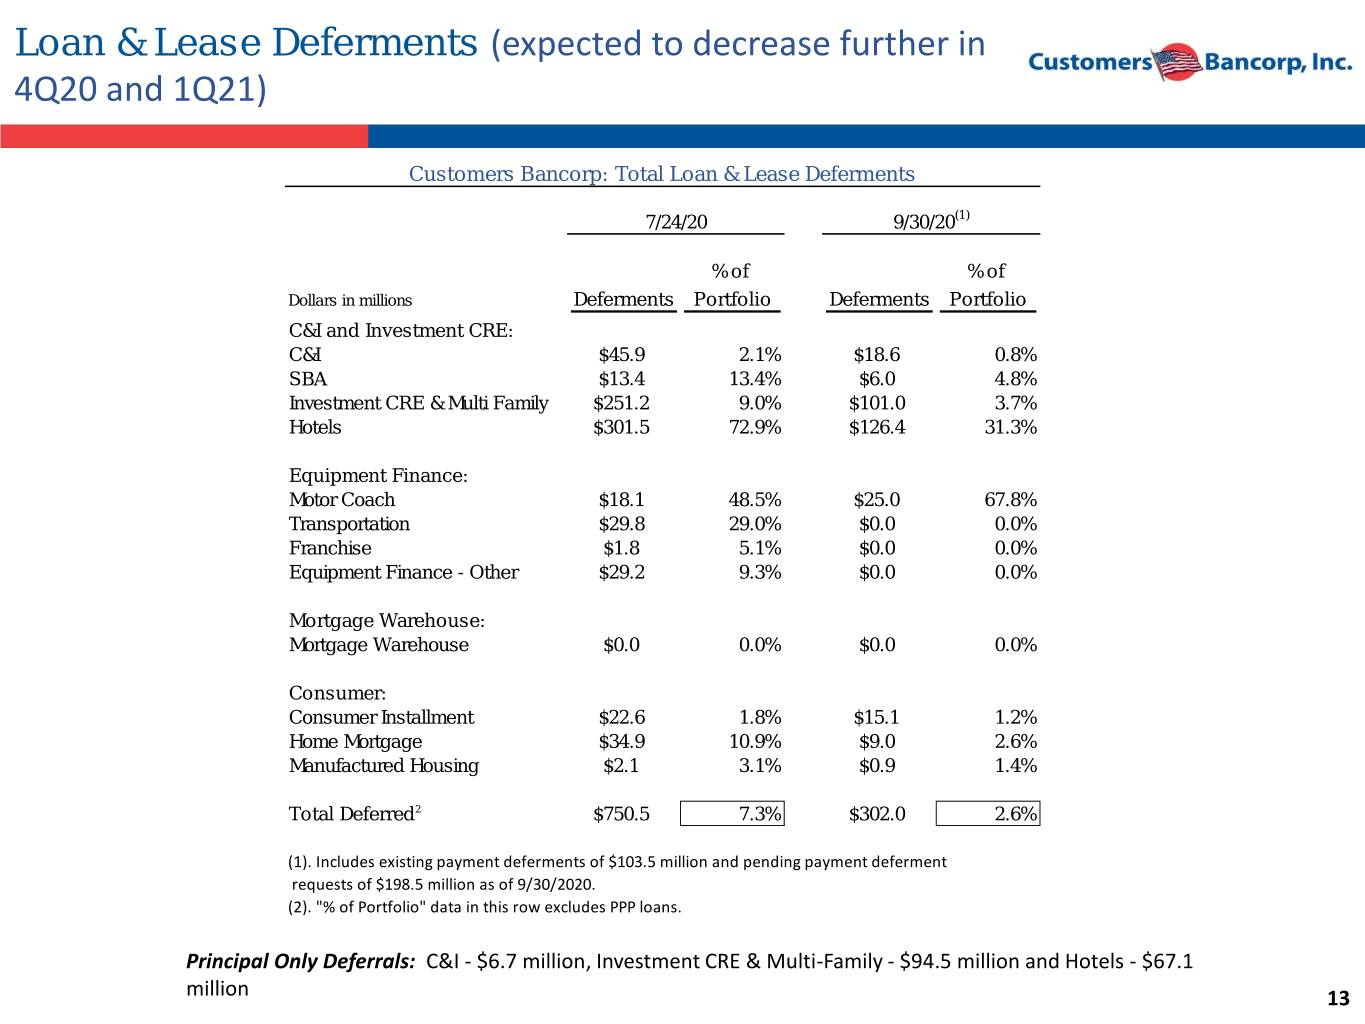
Loan & Lease Deferments (expected to decrease further in 4Q20 and 1Q21) Customers Bancorp: Total Loan & Lease Deferments 7/24/20 9/30/20(1) % of % of Dollars in millions Deferments Portfolio Deferments Portfolio C&I and Investment CRE: C&I $45.9 2.1% $18.6 0.8% SBA $13.4 13.4% $6.0 4.8% Investment CRE & Multi Family $251.2 9.0% $101.0 3.7% Hotels $301.5 72.9% $126.4 31.3% Equipment Finance: Motor Coach $18.1 48.5% $25.0 67.8% Transportation $29.8 29.0% $0.0 0.0% Franchise $1.8 5.1% $0.0 0.0% Equipment Finance - Other $29.2 9.3% $0.0 0.0% Mortgage Warehouse: Mortgage Warehouse $0.0 0.0% $0.0 0.0% Consumer: Consumer Installment $22.6 1.8% $15.1 1.2% Home Mortgage $34.9 10.9% $9.0 2.6% Manufactured Housing $2.1 3.1% $0.9 1.4% Total Deferred2 $750.5 7.3% $302.0 2.6% (1). Includes existing payment deferments of $103.5 million and pending payment deferment requests of $198.5 million as of 9/30/2020. (2). "% of Portfolio" data in this row excludes PPP loans. Principal Only Deferrals: C&I - $6.7 million, Investment CRE & Multi-Family - $94.5 million and Hotels - $67.1 million 13
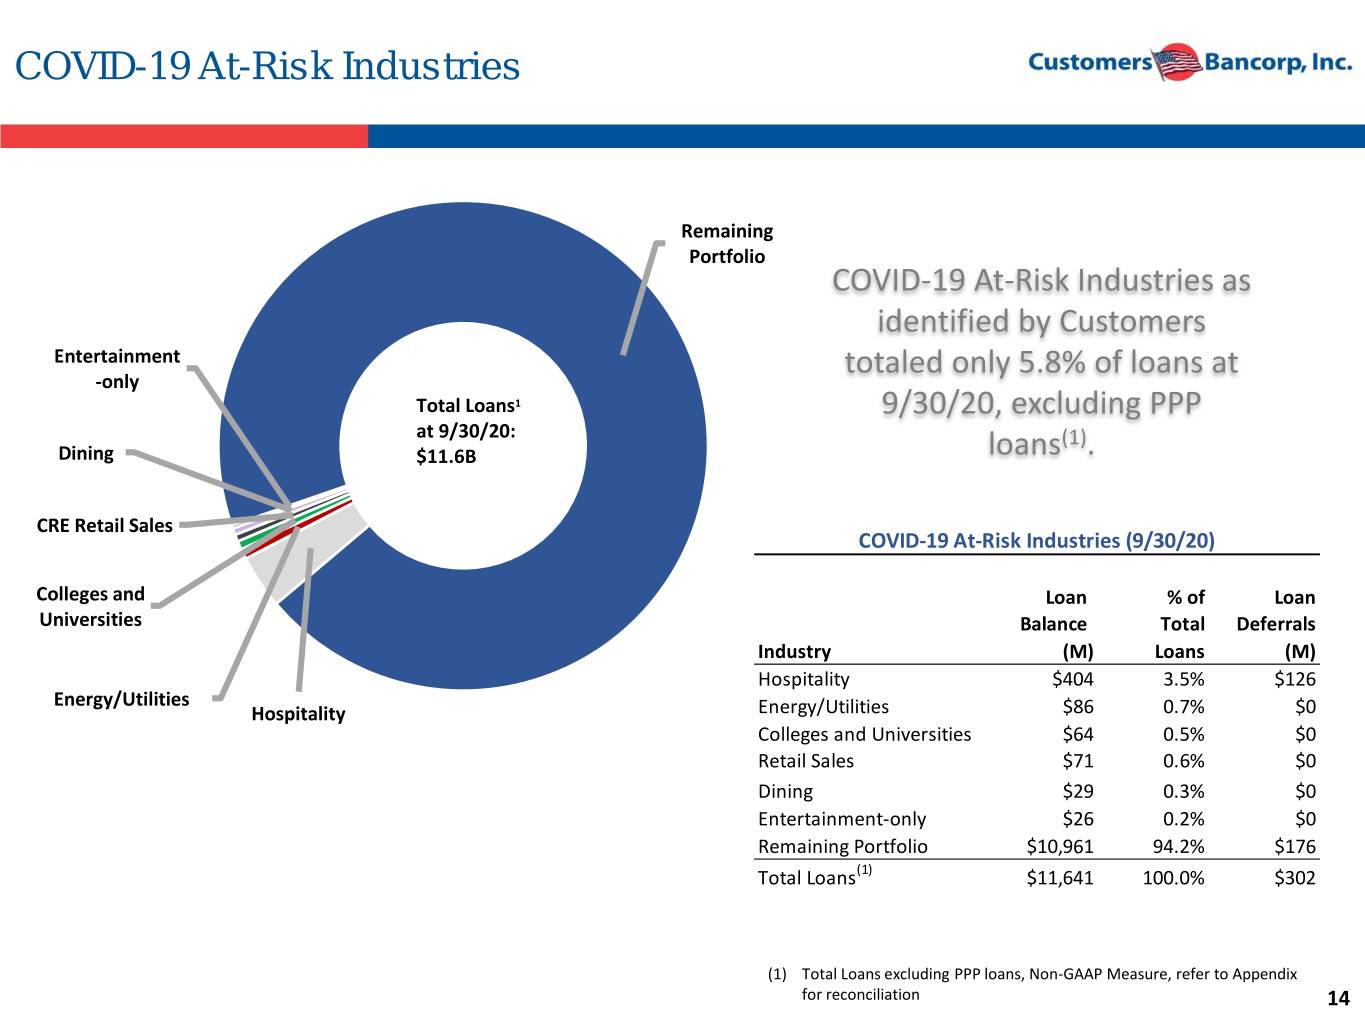
COVID-19 At-Risk Industries Remaining Portfolio COVID-19 At-Risk Industries as identified by Customers Entertainment totaled only 5.8% of loans at -only Total Loans1 9/30/20, excluding PPP at 9/30/20: (1) Dining $11.6B loans . CRE Retail Sales COVID-19 At-Risk Industries (9/30/20) Colleges and Loan % of Loan Universities Balance Total Deferrals Industry (M) Loans (M) Hospitality $404 3.5% $126 Energy/Utilities Hospitality Energy/Utilities $86 0.7% $0 Colleges and Universities $64 0.5% $0 Retail Sales $71 0.6% $0 Dining $29 0.3% $0 Entertainment-only $26 0.2% $0 Remaining Portfolio $10,961 94.2% $176 Total Loans(1) $11,641 100.0% $302 (1) Total Loans excluding PPP loans, Non-GAAP Measure, refer to Appendix for reconciliation 14
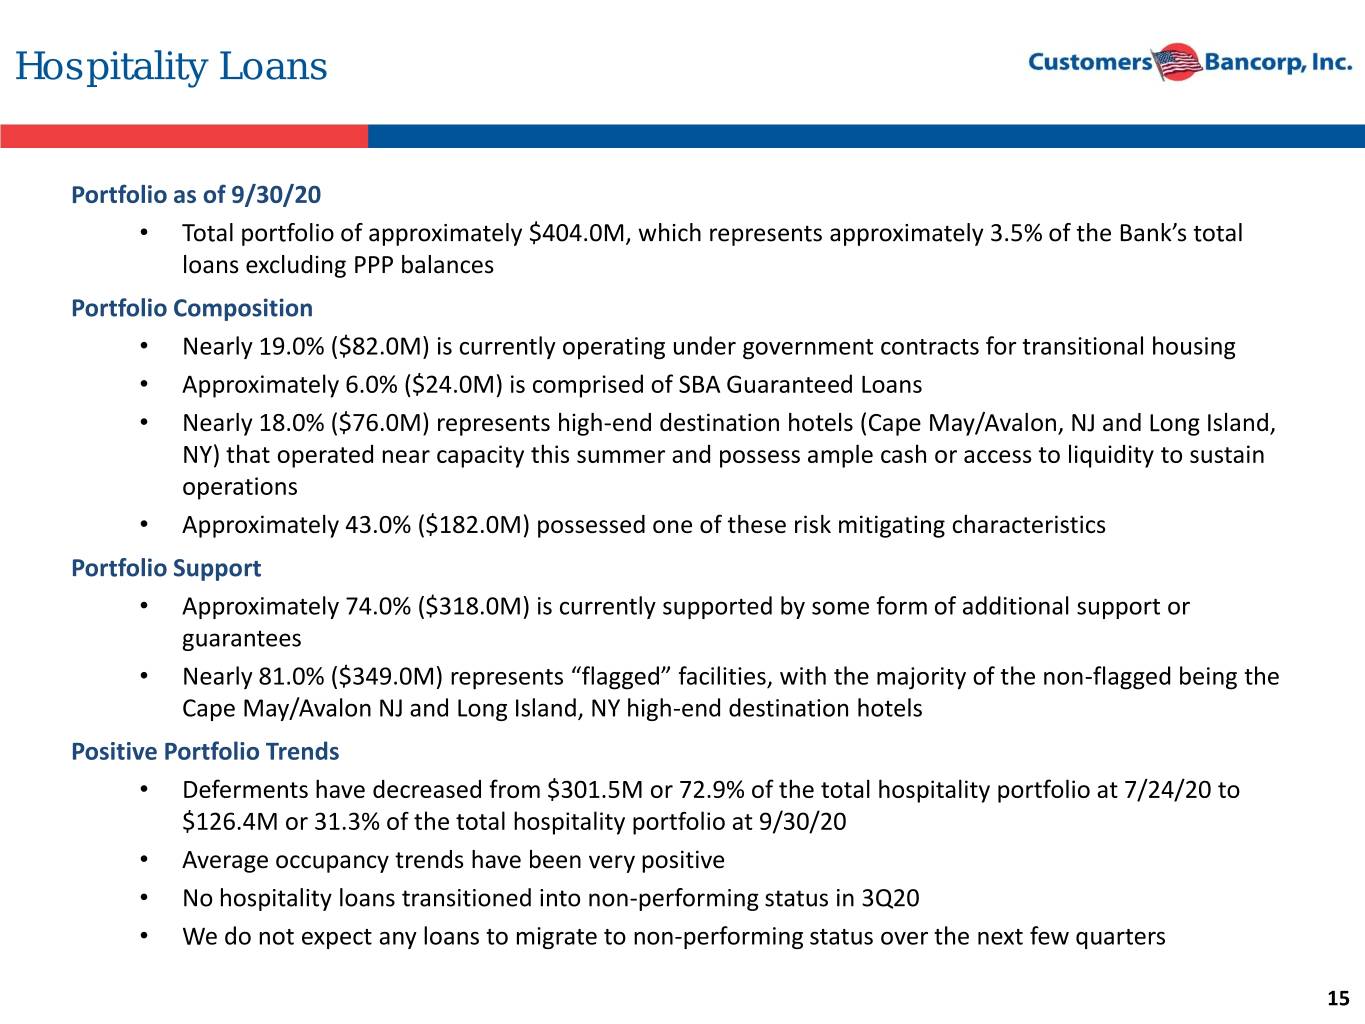
Hospitality Loans Portfolio as of 9/30/20 • Total portfolio of approximately $404.0M, which represents approximately 3.5% of the Bank’s total loans excluding PPP balances Portfolio Composition • Nearly 19.0% ($82.0M) is currently operating under government contracts for transitional housing • Approximately 6.0% ($24.0M) is comprised of SBA Guaranteed Loans • Nearly 18.0% ($76.0M) represents high-end destination hotels (Cape May/Avalon, NJ and Long Island, NY) that operated near capacity this summer and possess ample cash or access to liquidity to sustain operations • Approximately 43.0% ($182.0M) possessed one of these risk mitigating characteristics Portfolio Support • Approximately 74.0% ($318.0M) is currently supported by some form of additional support or guarantees • Nearly 81.0% ($349.0M) represents “flagged” facilities, with the majority of the non-flagged being the Cape May/Avalon NJ and Long Island, NY high-end destination hotels Positive Portfolio Trends • Deferments have decreased from $301.5M or 72.9% of the total hospitality portfolio at 7/24/20 to $126.4M or 31.3% of the total hospitality portfolio at 9/30/20 • Average occupancy trends have been very positive • No hospitality loans transitioned into non-performing status in 3Q20 • We do not expect any loans to migrate to non-performing status over the next few quarters 15
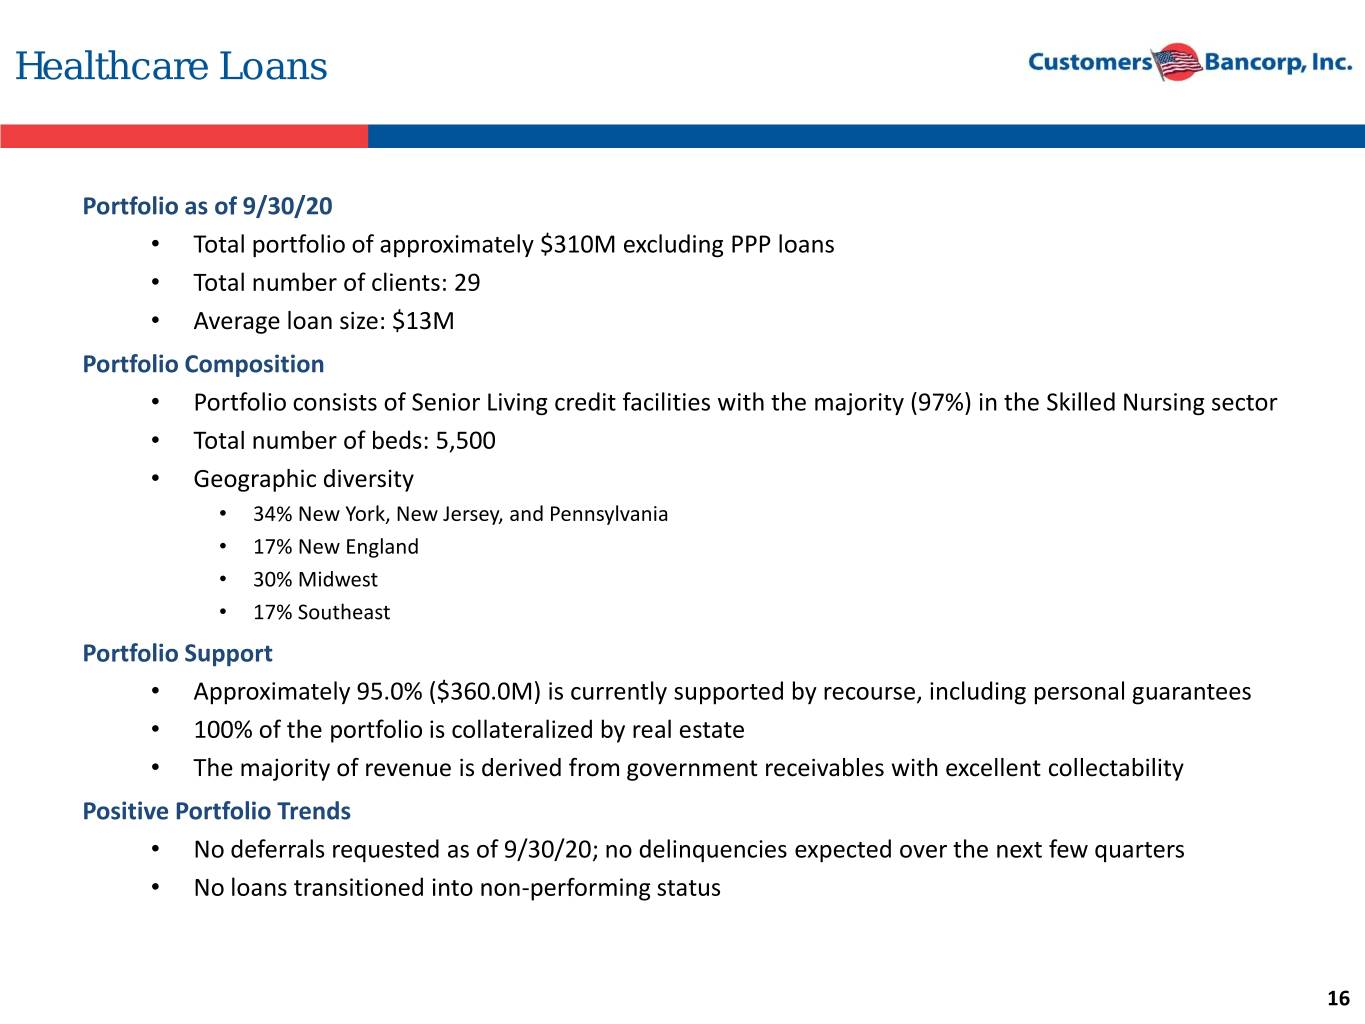
Healthcare Loans Portfolio as of 9/30/20 • Total portfolio of approximately $310M excluding PPP loans • Total number of clients: 29 • Average loan size: $13M Portfolio Composition • Portfolio consists of Senior Living credit facilities with the majority (97%) in the Skilled Nursing sector • Total number of beds: 5,500 • Geographic diversity • 34% New York, New Jersey, and Pennsylvania • 17% New England • 30% Midwest • 17% Southeast Portfolio Support • Approximately 95.0% ($360.0M) is currently supported by recourse, including personal guarantees • 100% of the portfolio is collateralized by real estate • The majority of revenue is derived from government receivables with excellent collectability Positive Portfolio Trends • No deferrals requested as of 9/30/20; no delinquencies expected over the next few quarters • No loans transitioned into non-performing status 16
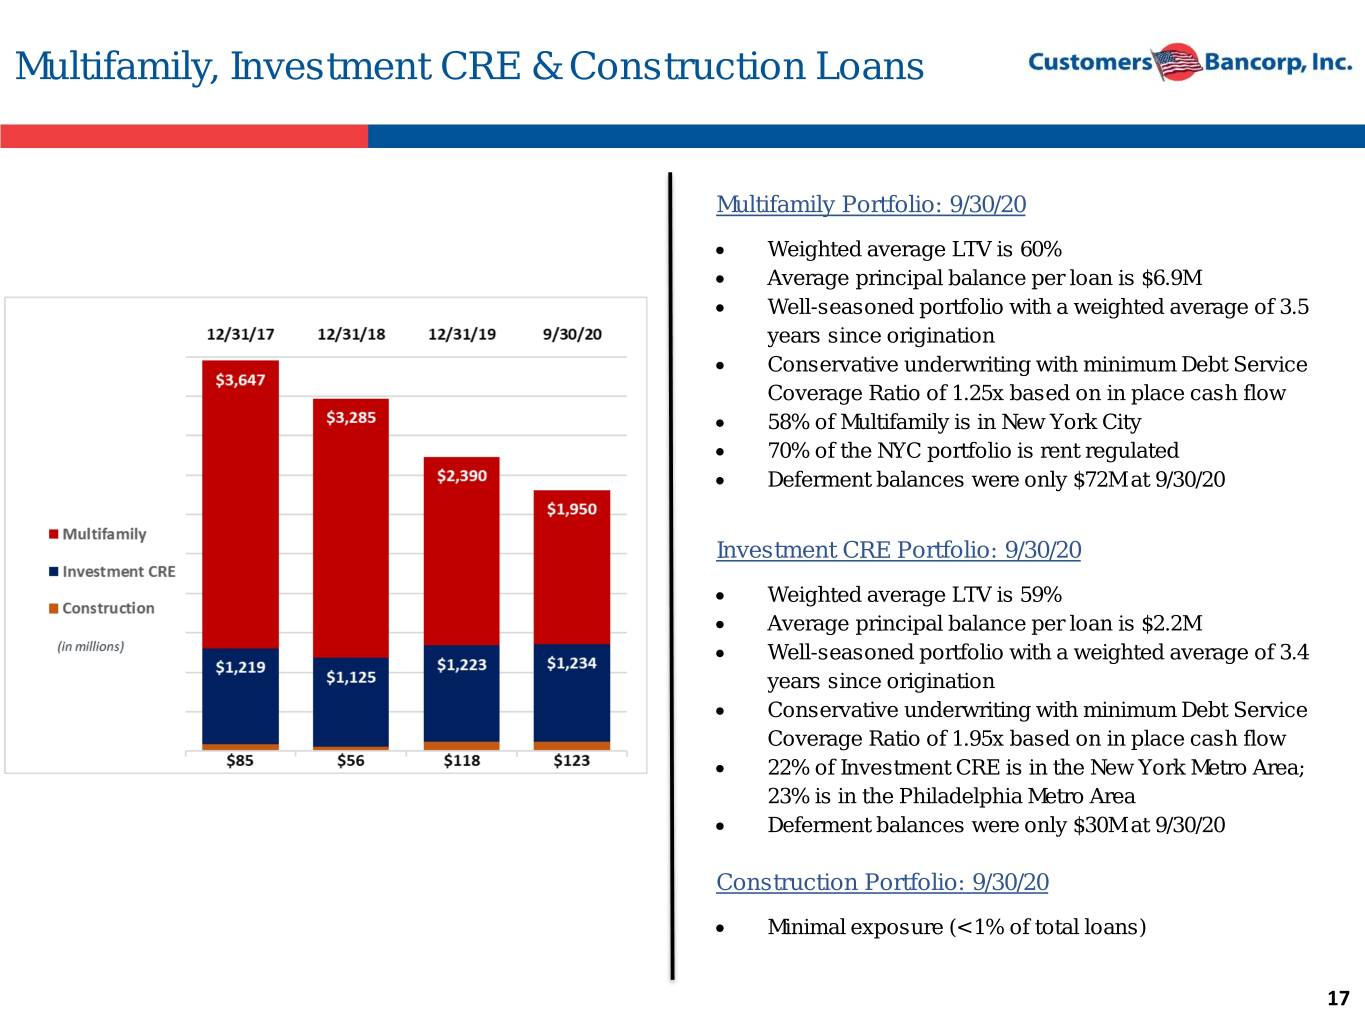
Multifamily, Investment CRE & Construction Loans Multifamily Portfolio: 9/30/20 • Weighted average LTV is 60% • Average principal balance per loan is $6.9M • Well-seasoned portfolio with a weighted average of 3.5 years since origination • Conservative underwriting with minimum Debt Service Coverage Ratio of 1.25x based on in place cash flow • 58% of Multifamily is in New York City • 70% of the NYC portfolio is rent regulated • Deferment balances were only $72M at 9/30/20 Investment CRE Portfolio: 9/30/20 • Weighted average LTV is 59% • Average principal balance per loan is $2.2M • Well-seasoned portfolio with a weighted average of 3.4 years since origination • Conservative underwriting with minimum Debt Service Coverage Ratio of 1.95x based on in place cash flow • 22% of Investment CRE is in the New York Metro Area; 23% is in the Philadelphia Metro Area • Deferment balances were only $30M at 9/30/20 Construction Portfolio: 9/30/20 • Minimal exposure (< 1% of total loans) 17
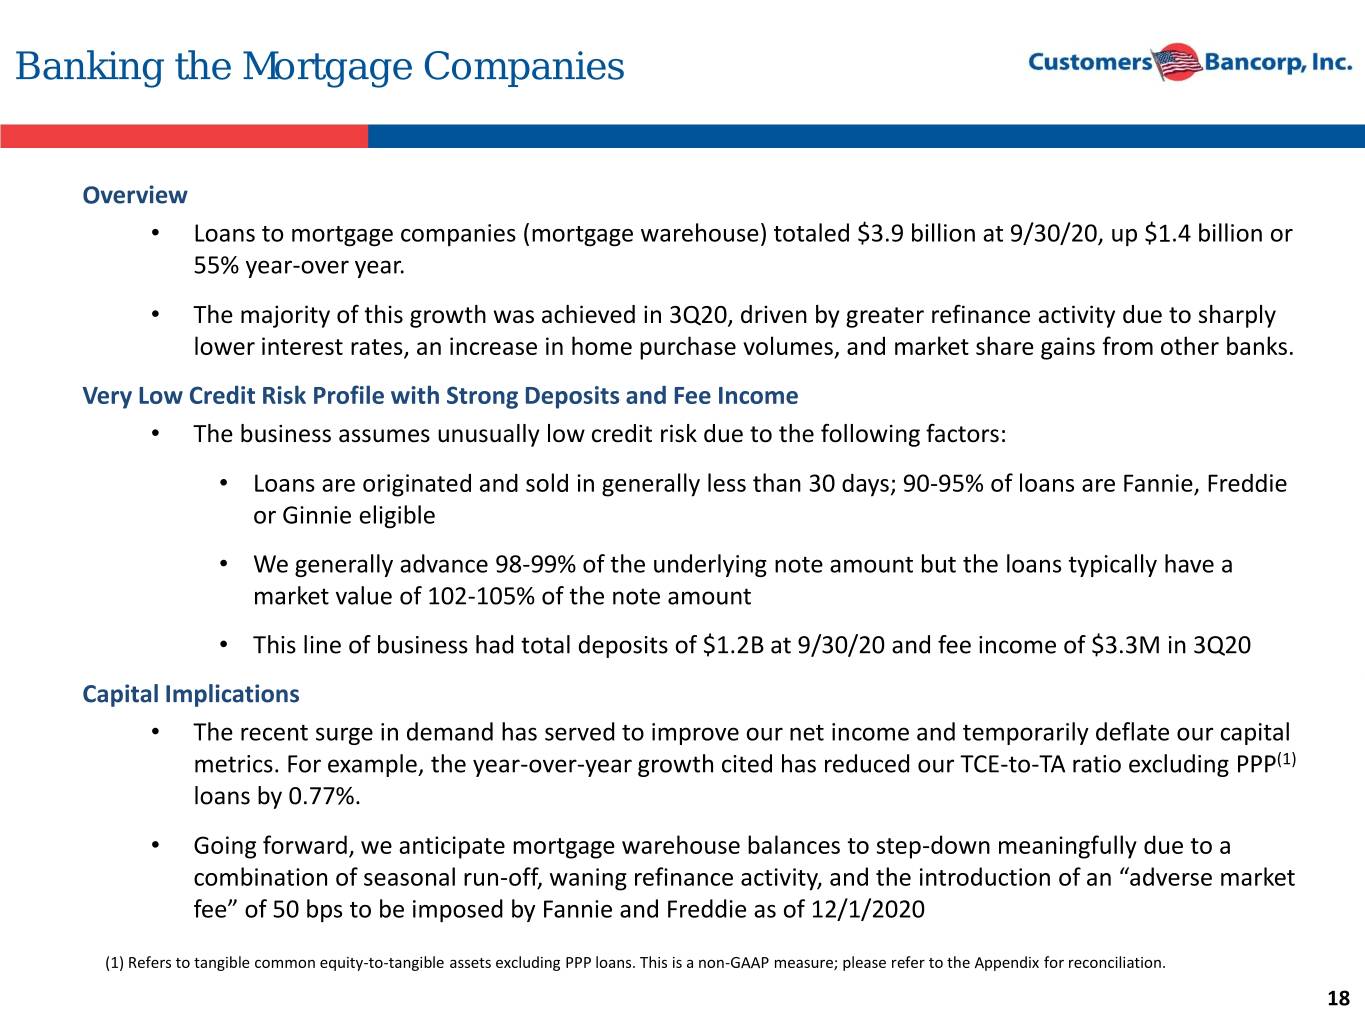
Banking the Mortgage Companies Overview • Loans to mortgage companies (mortgage warehouse) totaled $3.9 billion at 9/30/20, up $1.4 billion or 55% year-over year. • The majority of this growth was achieved in 3Q20, driven by greater refinance activity due to sharply lower interest rates, an increase in home purchase volumes, and market share gains from other banks. Very Low Credit Risk Profile with Strong Deposits and Fee Income • The business assumes unusually low credit risk due to the following factors: • Loans are originated and sold in generally less than 30 days; 90-95% of loans are Fannie, Freddie or Ginnie eligible • We generally advance 98-99% of the underlying note amount but the loans typically have a market value of 102-105% of the note amount • This line of business had total deposits of $1.2B at 9/30/20 and fee income of $3.3M in 3Q20 Capital Implications • The recent surge in demand has served to improve our net income and temporarily deflate our capital metrics. For example, the year-over-year growth cited has reduced our TCE-to-TA ratio excluding PPP(1) loans by 0.77%. • Going forward, we anticipate mortgage warehouse balances to step-down meaningfully due to a combination of seasonal run-off, waning refinance activity, and the introduction of an “adverse market fee” of 50 bps to be imposed by Fannie and Freddie as of 12/1/2020 (1) Refers to tangible common equity-to-tangible assets excluding PPP loans. This is a non-GAAP measure; please refer to the Appendix for reconciliation. 18
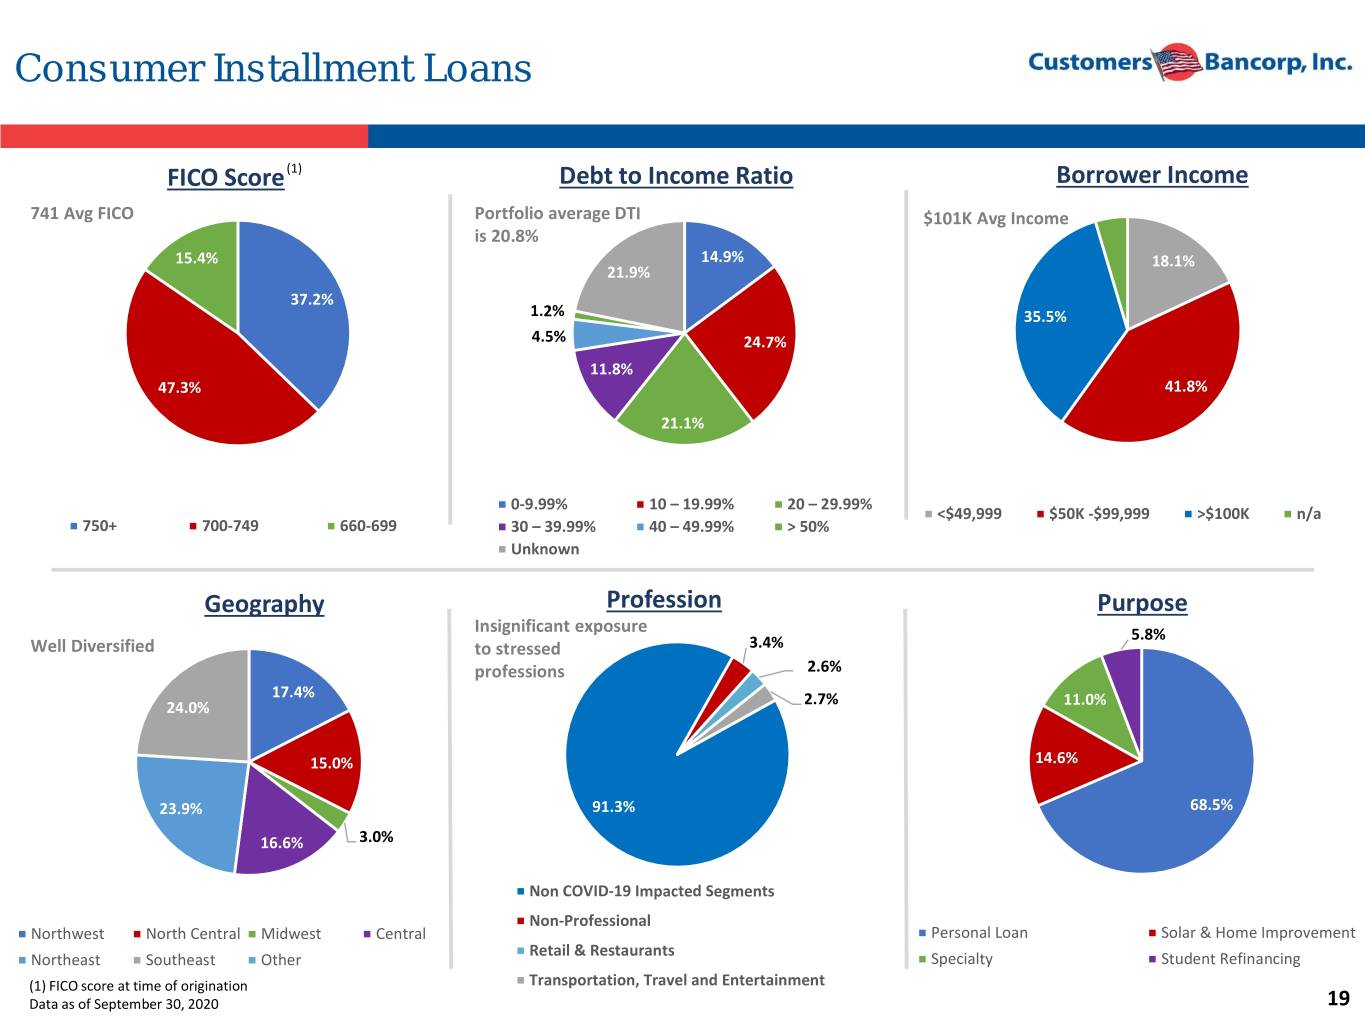
Consumer Installment Loans FICO Score (1) Debt to Income Ratio Borrower Income 4.6% 741 Avg FICO Portfolio average DTI $101K Avg Income is 20.8% 15.4% 14.9% 18.1% 21.9% 37.2% 1.2% 35.5% 4.5% 24.7% 11.8% 47.3% 41.8% 21.1% 0-9.99% 10 – 19.99% 20 – 29.99% <$49,999 $50K -$99,999 >$100K n/a 750+ 700-749 660-699 30 – 39.99% 40 – 49.99% > 50% Unknown Geography Profession Purpose Insignificant exposure 0.0% 5.8% Well Diversified to stressed 3.4% professions 2.6% 17.4% 2.7% 24.0% 11.0% 15.0% 14.6% 23.9% 91.3% 68.5% 16.6% 3.0% Non COVID-19 Impacted Segments Non-Professional Northwest North Central Midwest Central Personal Loan Solar & Home Improvement Retail & Restaurants Northeast Southeast Other Specialty Student Refinancing (1) FICO score at time of origination Transportation, Travel and Entertainment Data as of September 30, 2020 19
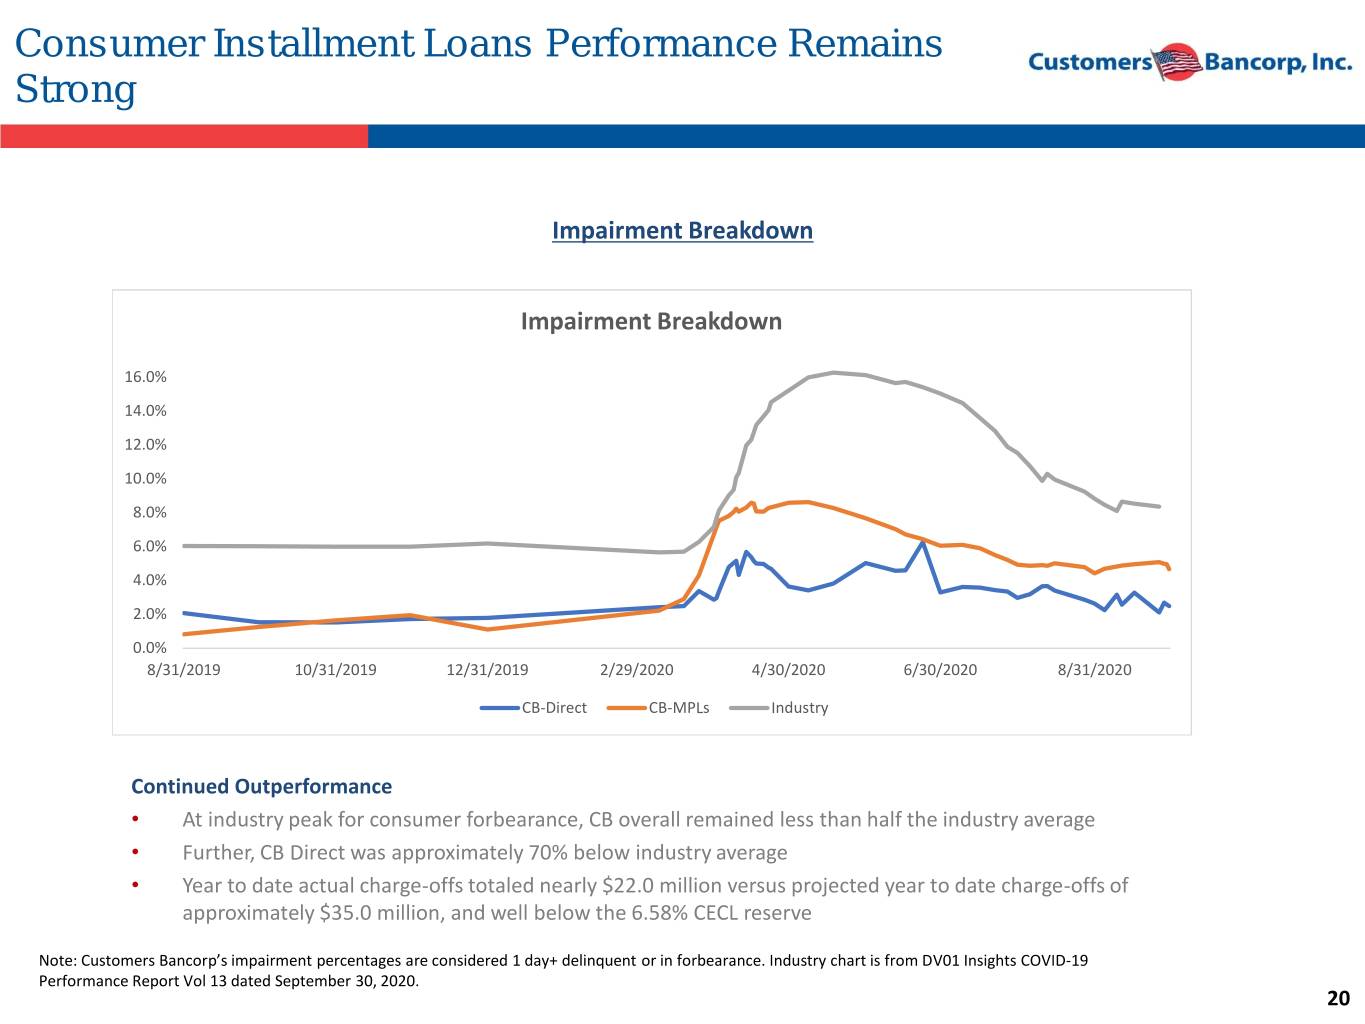
Consumer Installment Loans Performance Remains Strong Impairment Breakdown Impairment Breakdown 16.0% 14.0% 12.0% 10.0% 8.0% 6.0% 4.0% 2.0% 0.0% 8/31/2019 10/31/2019 12/31/2019 2/29/2020 4/30/2020 6/30/2020 8/31/2020 CB-Direct CB-MPLs Industry Continued Outperformance • At industry peak for consumer forbearance, CB overall remained less than half the industry average • Further, CB Direct was approximately 70% below industry average • Year to date actual charge-offs totaled nearly $22.0 million versus projected year to date charge-offs of approximately $35.0 million, and well below the 6.58% CECL reserve Note: Customers Bancorp’s impairment percentages are considered 1 day+ delinquent or in forbearance. Industry chart is from DV01 Insights COVID-19 Performance Report Vol 13 dated September 30, 2020. 20
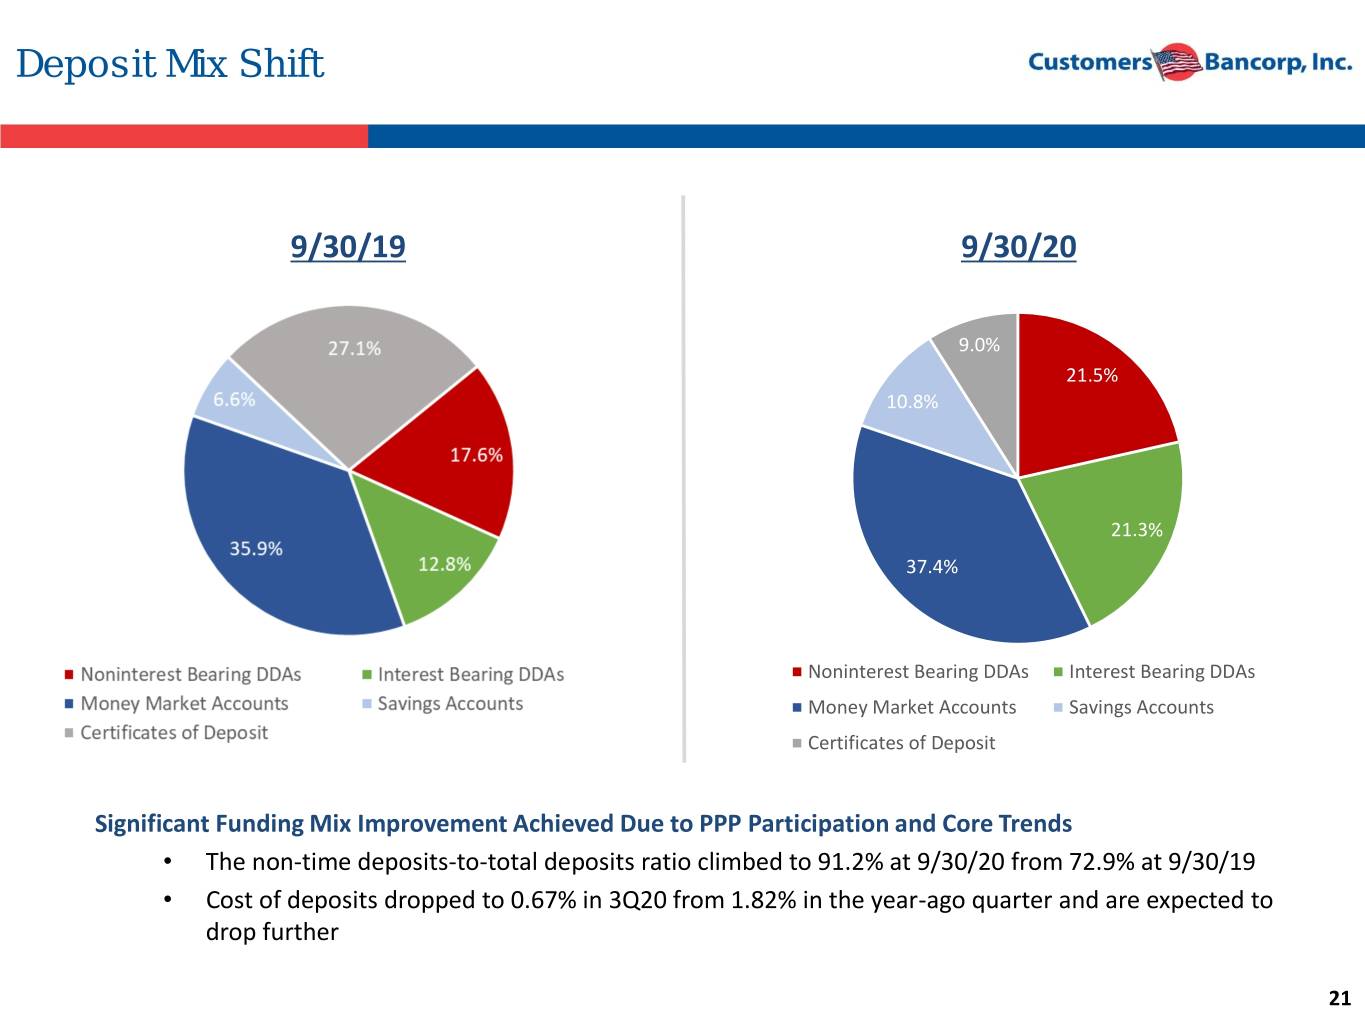
Deposit Mix Shift 9/30/19 9/30/20 9.0% 21.5% 10.8% 21.3% 37.4% Noninterest Bearing DDAs Interest Bearing DDAs Money Market Accounts Savings Accounts Certificates of Deposit Significant Funding Mix Improvement Achieved Due to PPP Participation and Core Trends • The non-time deposits-to-total deposits ratio climbed to 91.2% at 9/30/20 from 72.9% at 9/30/19 • Cost of deposits dropped to 0.67% in 3Q20 from 1.82% in the year-ago quarter and are expected to drop further 21

III. Outlook
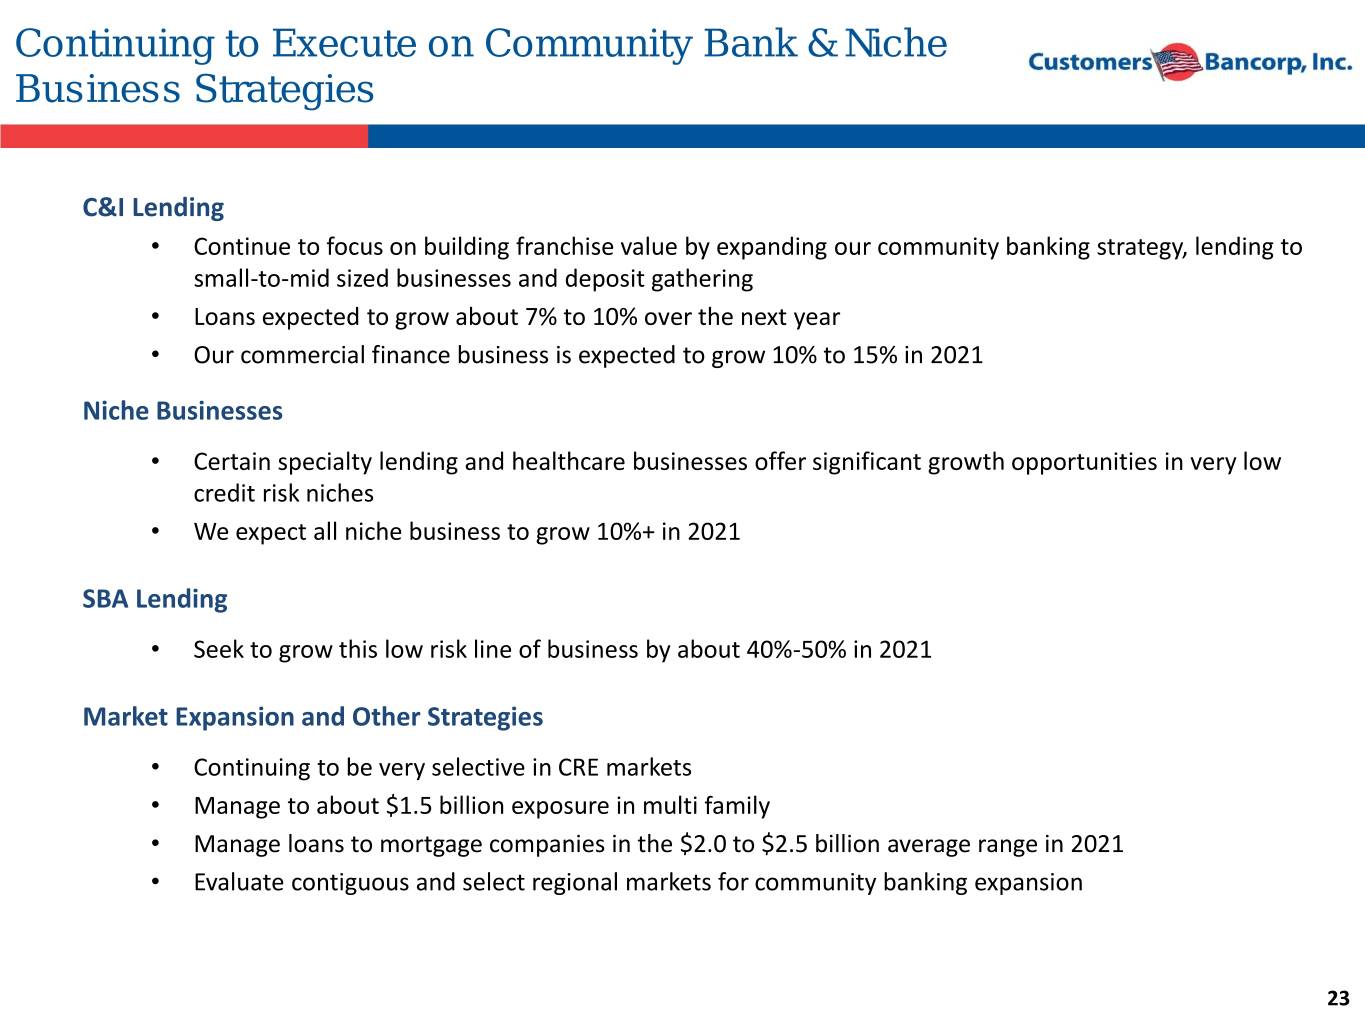
Continuing to Execute on Community Bank & Niche Business Strategies C&I Lending • Continue to focus on building franchise value by expanding our community banking strategy, lending to small-to-mid sized businesses and deposit gathering • Loans expected to grow about 7% to 10% over the next year • Our commercial finance business is expected to grow 10% to 15% in 2021 Niche Businesses • Certain specialty lending and healthcare businesses offer significant growth opportunities in very low credit risk niches • We expect all niche business to grow 10%+ in 2021 SBA Lending • Seek to grow this low risk line of business by about 40%-50% in 2021 Market Expansion and Other Strategies • Continuing to be very selective in CRE markets • Manage to about $1.5 billion exposure in multi family • Manage loans to mortgage companies in the $2.0 to $2.5 billion average range in 2021 • Evaluate contiguous and select regional markets for community banking expansion 23
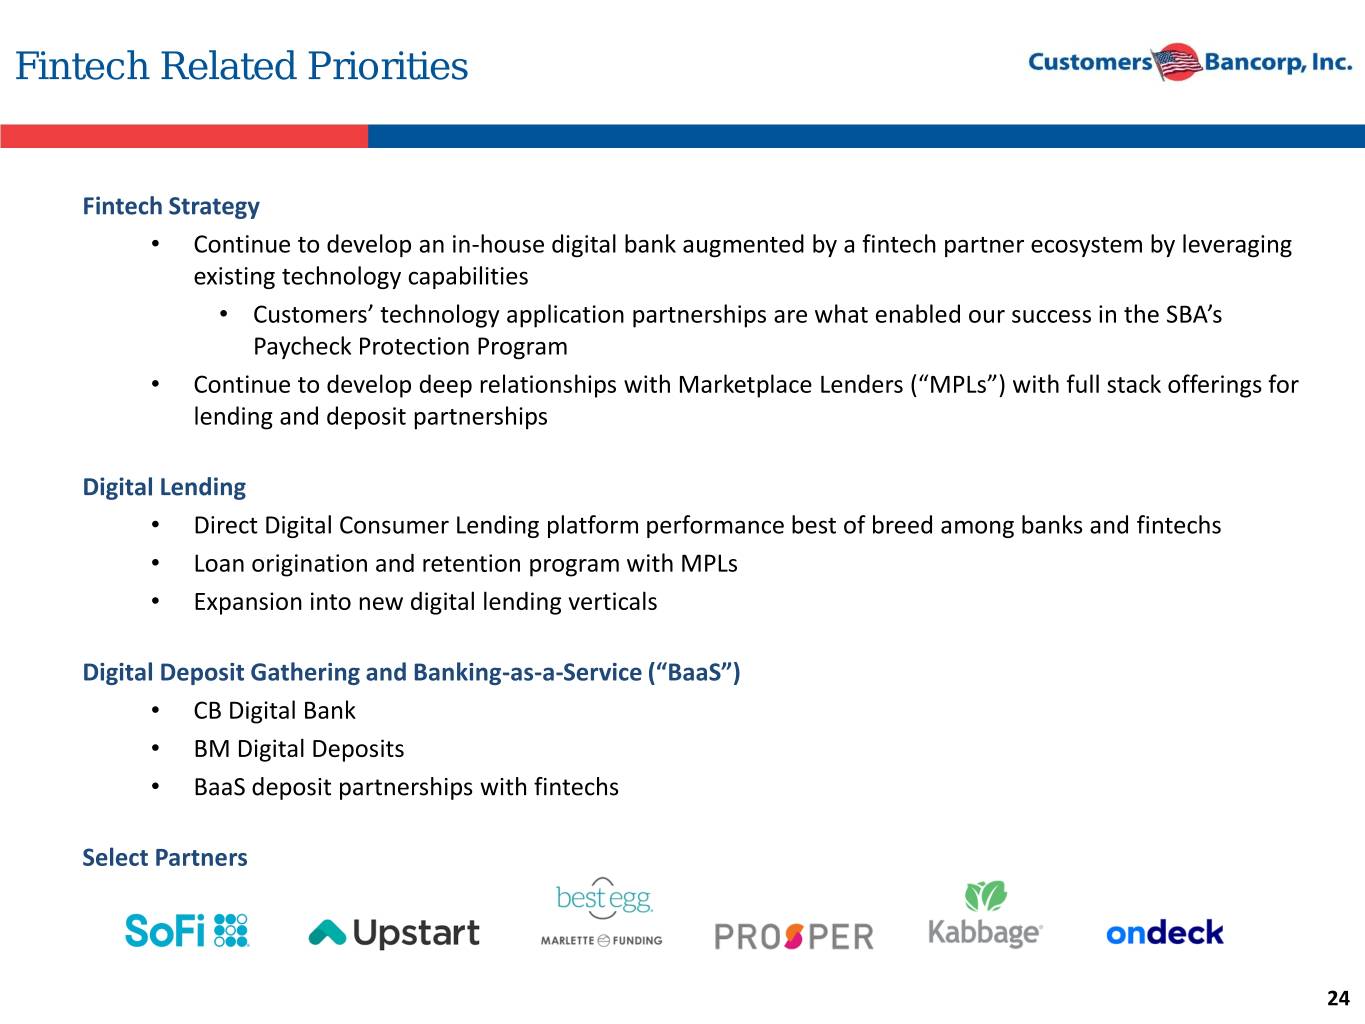
Fintech Related Priorities Fintech Strategy • Continue to develop an in-house digital bank augmented by a fintech partner ecosystem by leveraging existing technology capabilities • Customers’ technology application partnerships are what enabled our success in the SBA’s Paycheck Protection Program • Continue to develop deep relationships with Marketplace Lenders (“MPLs”) with full stack offerings for lending and deposit partnerships Digital Lending • Direct Digital Consumer Lending platform performance best of breed among banks and fintechs • Loan origination and retention program with MPLs • Expansion into new digital lending verticals Digital Deposit Gathering and Banking-as-a-Service (“BaaS”) • CB Digital Bank • BM Digital Deposits • BaaS deposit partnerships with fintechs Select Partners 24
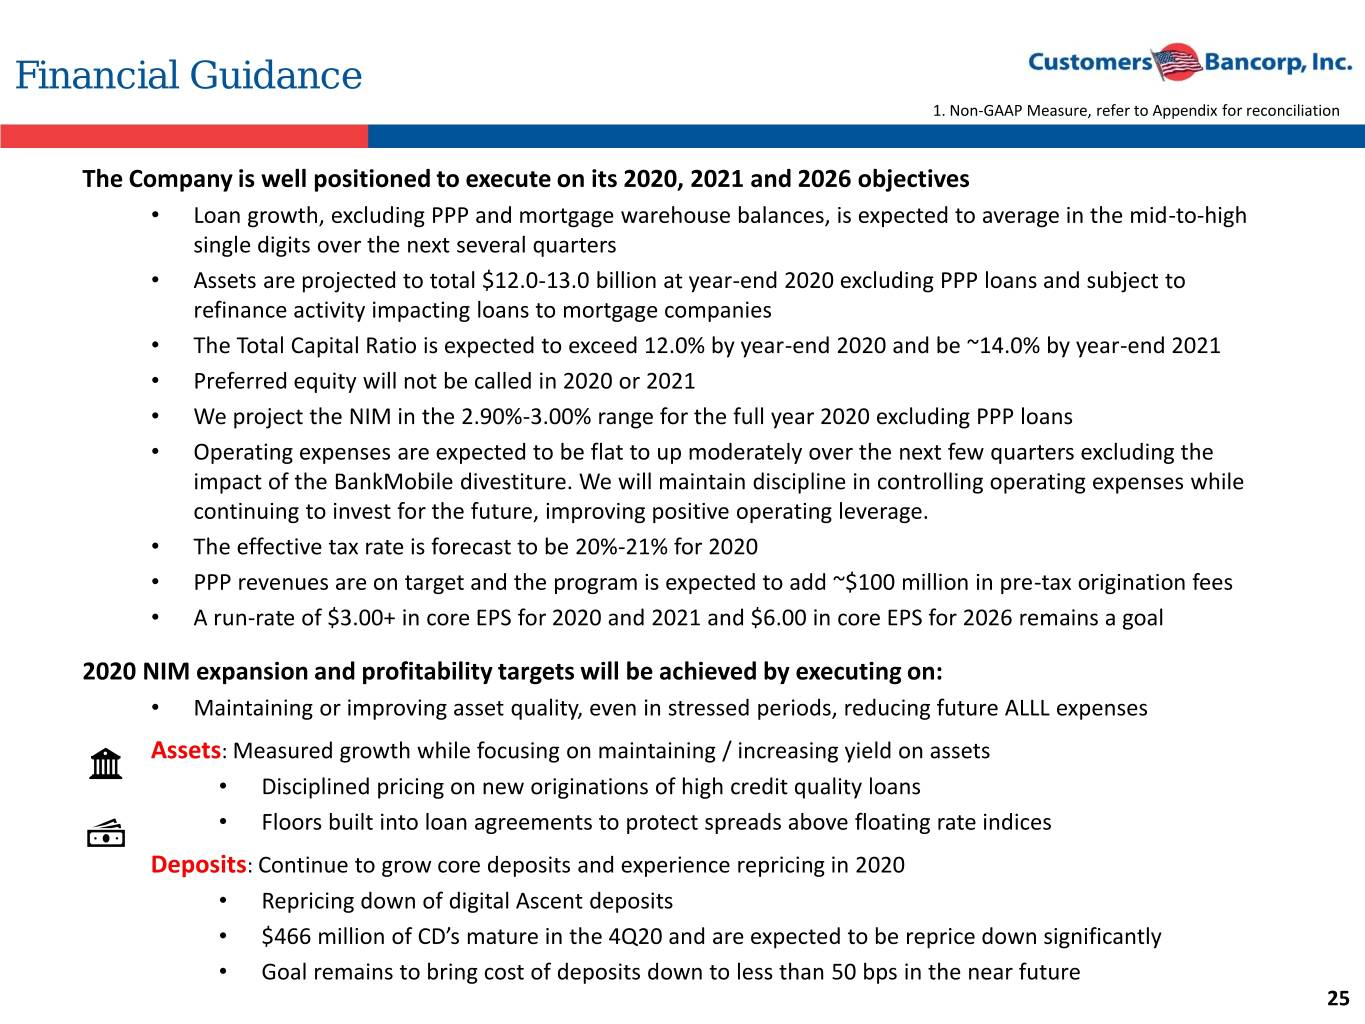
Financial Guidance 1. Non-GAAP Measure, refer to Appendix for reconciliation The Company is well positioned to execute on its 2020, 2021 and 2026 objectives • Loan growth, excluding PPP and mortgage warehouse balances, is expected to average in the mid-to-high single digits over the next several quarters • Assets are projected to total $12.0-13.0 billion at year-end 2020 excluding PPP loans and subject to refinance activity impacting loans to mortgage companies • The Total Capital Ratio is expected to exceed 12.0% by year-end 2020 and be ~14.0% by year-end 2021 • Preferred equity will not be called in 2020 or 2021 • We project the NIM in the 2.90%-3.00% range for the full year 2020 excluding PPP loans • Operating expenses are expected to be flat to up moderately over the next few quarters excluding the impact of the BankMobile divestiture. We will maintain discipline in controlling operating expenses while continuing to invest for the future, improving positive operating leverage. • The effective tax rate is forecast to be 20%-21% for 2020 • PPP revenues are on target and the program is expected to add ~$100 million in pre-tax origination fees • A run-rate of $3.00+ in core EPS for 2020 and 2021 and $6.00 in core EPS for 2026 remains a goal 2020 NIM expansion and profitability targets will be achieved by executing on: • Maintaining or improving asset quality, even in stressed periods, reducing future ALLL expenses Assets: Measured growth while focusing on maintaining / increasing yield on assets • Disciplined pricing on new originations of high credit quality loans • Floors built into loan agreements to protect spreads above floating rate indices Deposits: Continue to grow core deposits and experience repricing in 2020 • Repricing down of digital Ascent deposits • $466 million of CD’s mature in the 4Q20 and are expected to be reprice down significantly • Goal remains to bring cost of deposits down to less than 50 bps in the near future 25
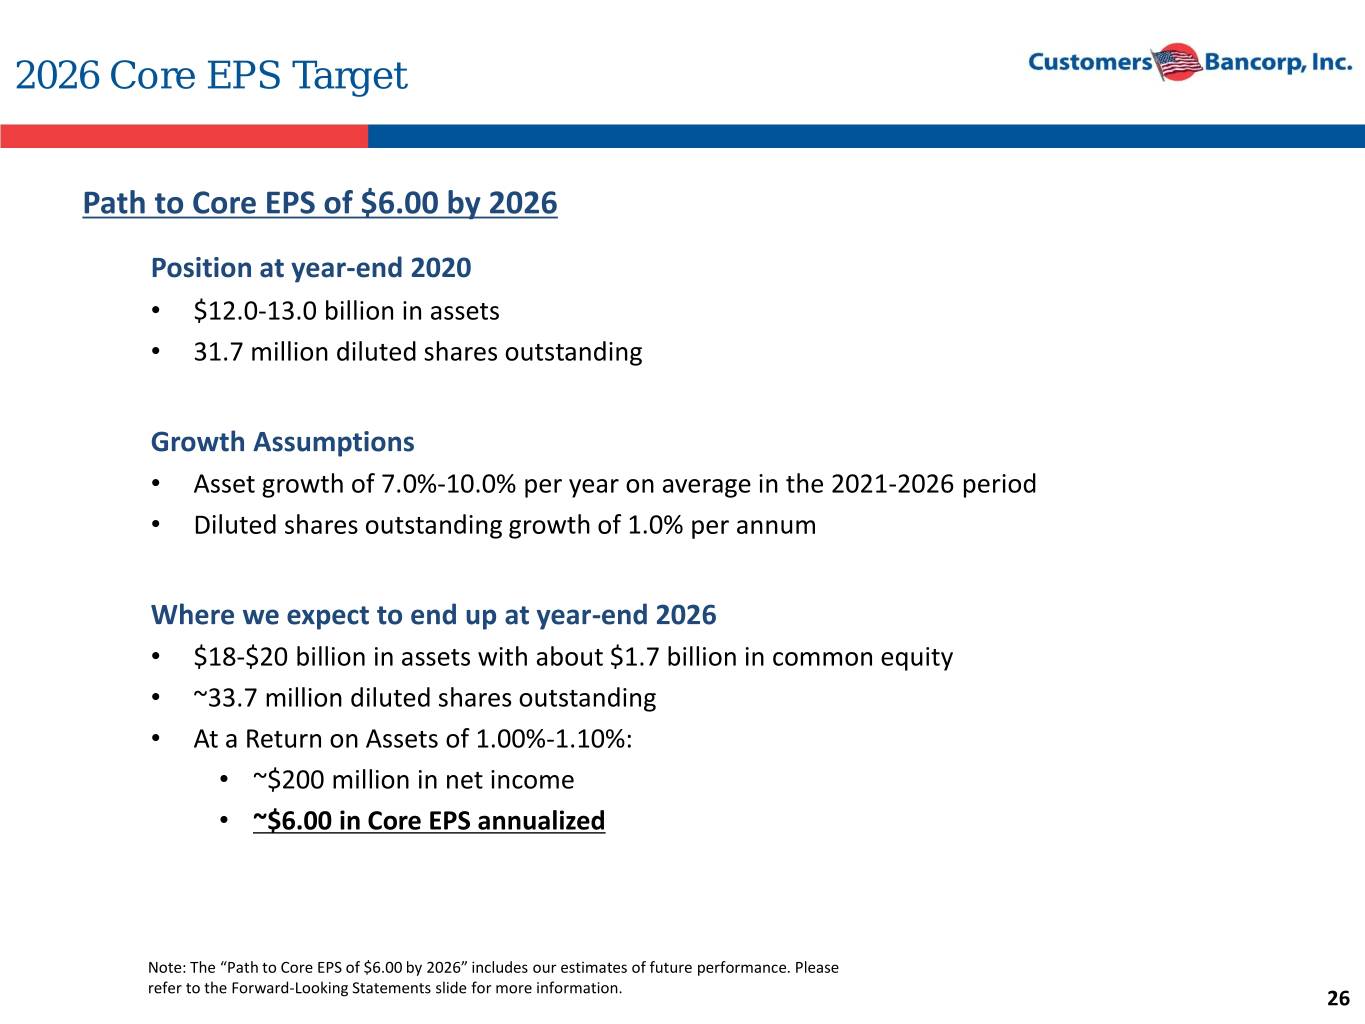
2026 Core EPS Target Path to Core EPS of $6.00 by 2026 Position at year-end 2020 • $12.0-13.0 billion in assets • 31.7 million diluted shares outstanding Growth Assumptions • Asset growth of 7.0%-10.0% per year on average in the 2021-2026 period • Diluted shares outstanding growth of 1.0% per annum Where we expect to end up at year-end 2026 • $18-$20 billion in assets with about $1.7 billion in common equity • ~33.7 million diluted shares outstanding • At a Return on Assets of 1.00%-1.10%: • ~$200 million in net income • ~$6.00 in Core EPS annualized Note: The “Path to Core EPS of $6.00 by 2026” includes our estimates of future performance. Please refer to the Forward-Looking Statements slide for more information. 26
IV. Appendix
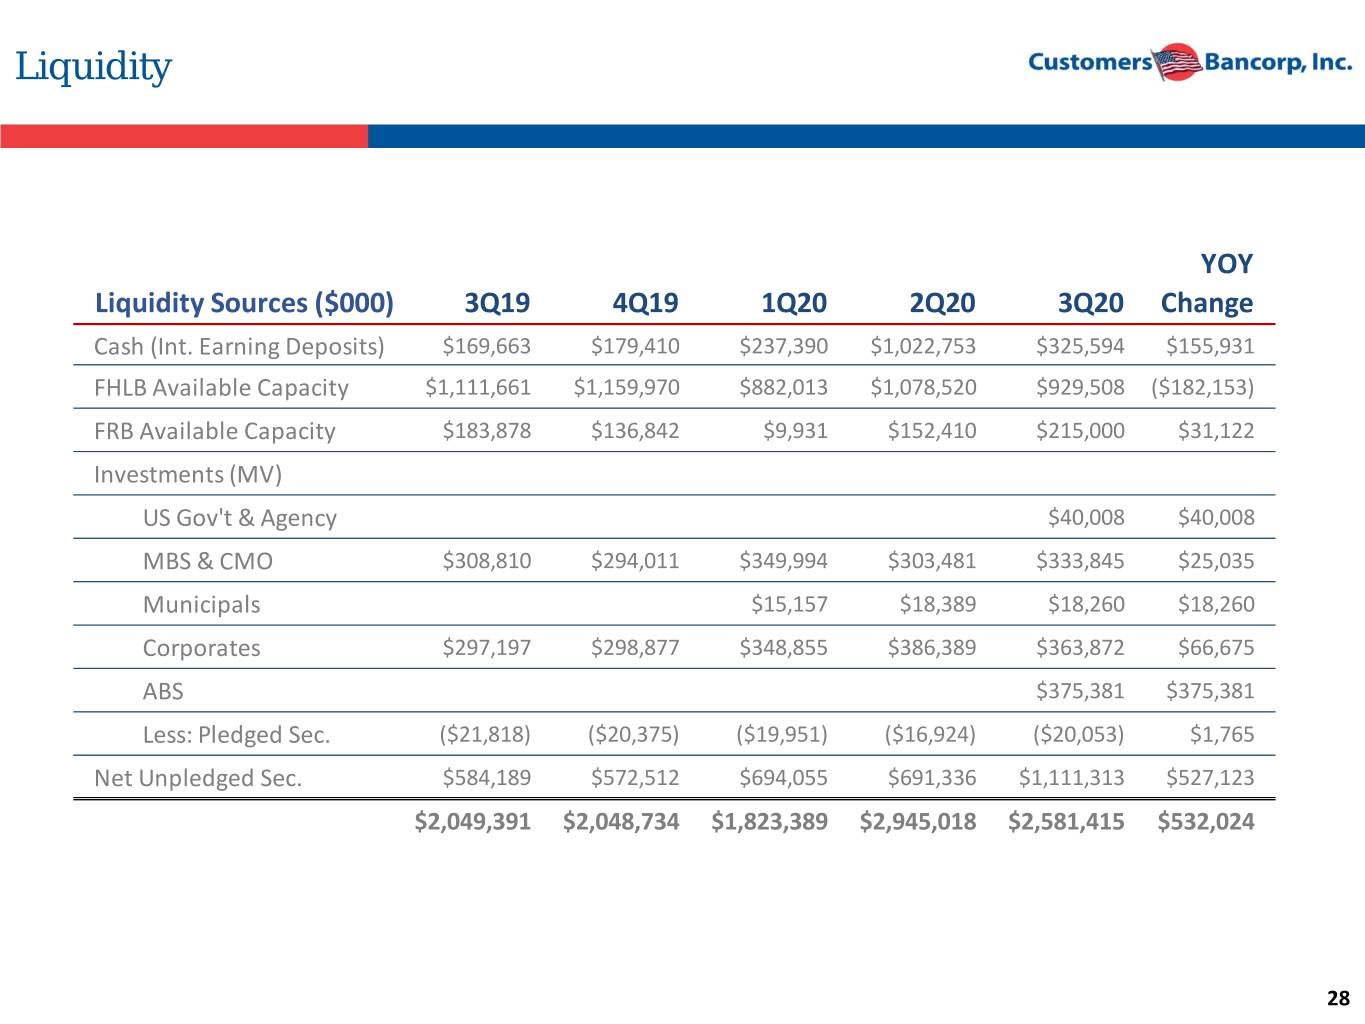
Liquidity YOY Liquidity Sources ($000) 3Q19 4Q19 1Q20 2Q20 3Q20 Change Cash (Int. Earning Deposits) $169,663 $179,410 $237,390 $1,022,753 $325,594 $155,931 FHLB Available Capacity $1,111,661 $1,159,970 $882,013 $1,078,520 $929,508 ($182,153) FRB Available Capacity $183,878 $136,842 $9,931 $152,410 $215,000 $31,122 Investments (MV) US Gov't & Agency $40,008 $40,008 MBS & CMO $308,810 $294,011 $349,994 $303,481 $333,845 $25,035 Municipals $15,157 $18,389 $18,260 $18,260 Corporates $297,197 $298,877 $348,855 $386,389 $363,872 $66,675 ABS $375,381 $375,381 Less: Pledged Sec. ($21,818) ($20,375) ($19,951) ($16,924) ($20,053) $1,765 Net Unpledged Sec. $584,189 $572,512 $694,055 $691,336 $1,111,313 $527,123 $2,049,391 $2,048,734 $1,823,389 $2,945,018 $2,581,415 $532,024 28
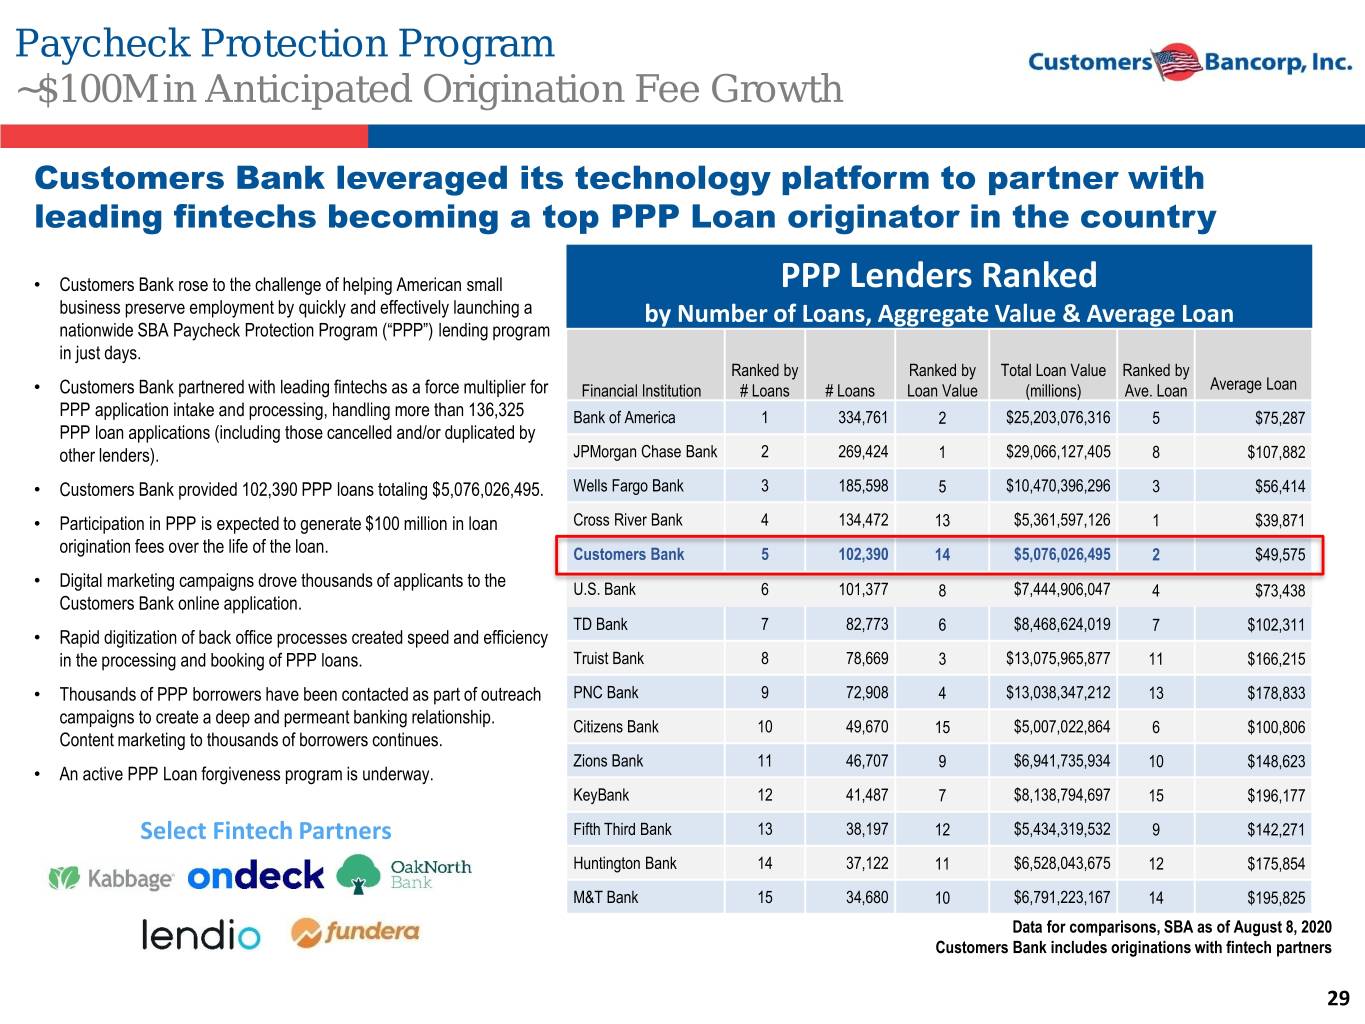
Paycheck Protection Program ~$100M in Anticipated Origination Fee Growth Customers Bank leveraged its technology platform to partner with leading fintechs becoming a top PPP Loan originator in the country • Customers Bank rose to the challenge of helping American small PPP Lenders Ranked business preserve employment by quickly and effectively launching a by Number of Loans, Aggregate Value & Average Loan nationwide SBA Paycheck Protection Program (“PPP”) lending program in just days. Ranked by Ranked by Total Loan Value Ranked by • Customers Bank partnered with leading fintechs as a force multiplier for Financial Institution # Loans # Loans Loan Value (millions) Ave. Loan Average Loan PPP application intake and processing, handling more than 136,325 Bank of America 1 334,761 2 $25,203,076,316 5 $75,287 PPP loan applications (including those cancelled and/or duplicated by other lenders). JPMorgan Chase Bank 2 269,424 1 $29,066,127,405 8 $107,882 • Customers Bank provided 102,390 PPP loans totaling $5,076,026,495. Wells Fargo Bank 3 185,598 5 $10,470,396,296 3 $56,414 • Participation in PPP is expected to generate $100 million in loan Cross River Bank 4 134,472 13 $5,361,597,126 1 $39,871 origination fees over the life of the loan. Customers Bank 5 102,390 14 $5,076,026,495 2 $49,575 • Digital marketing campaigns drove thousands of applicants to the U.S. Bank 6 101,377 8 $7,444,906,047 4 $73,438 Customers Bank online application. TD Bank 7 82,773 6 $8,468,624,019 7 $102,311 • Rapid digitization of back office processes created speed and efficiency in the processing and booking of PPP loans. Truist Bank 8 78,669 3 $13,075,965,877 11 $166,215 • Thousands of PPP borrowers have been contacted as part of outreach PNC Bank 9 72,908 4 $13,038,347,212 13 $178,833 campaigns to create a deep and permeant banking relationship. Citizens Bank 10 49,670 15 $5,007,022,864 6 $100,806 Content marketing to thousands of borrowers continues. Zions Bank 11 46,707 9 $6,941,735,934 10 $148,623 • An active PPP Loan forgiveness program is underway. KeyBank 12 41,487 7 $8,138,794,697 15 $196,177 Select Fintech Partners Fifth Third Bank 13 38,197 12 $5,434,319,532 9 $142,271 Huntington Bank 14 37,122 11 $6,528,043,675 12 $175,854 M&T Bank 15 34,680 10 $6,791,223,167 14 $195,825 Data for comparisons, SBA as of August 8, 2020 Customers Bank includes originations with fintech partners 29
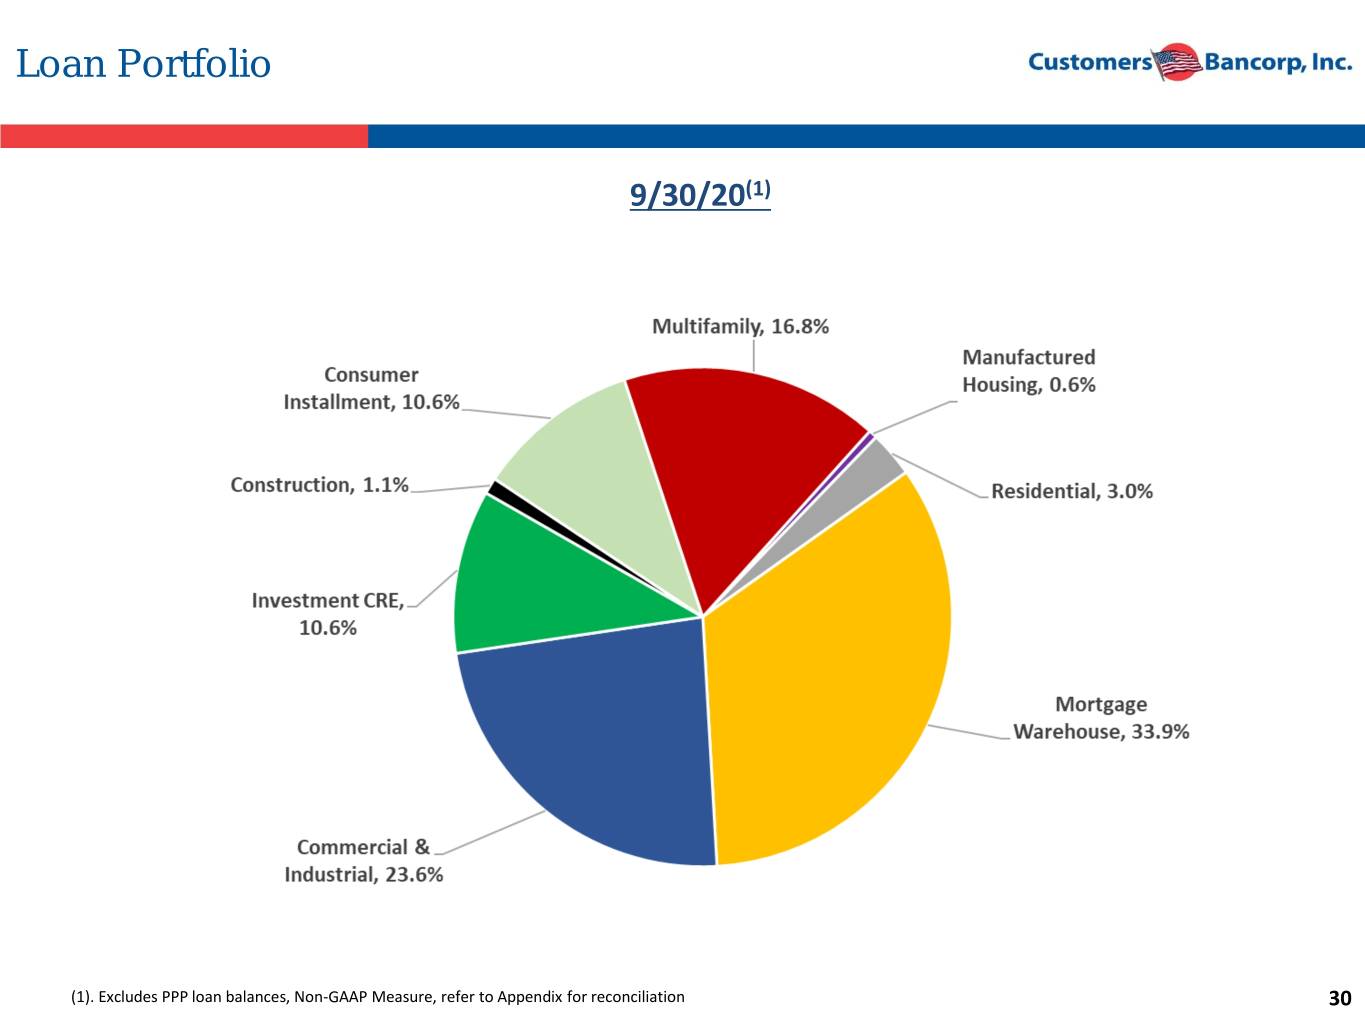
Loan Portfolio 9/30/20(1) (1). Excludes PPP loan balances, Non-GAAP Measure, refer to Appendix for reconciliation 30

CUBI and Paycheck Protection Program Newsworthy “Consider: Customers Bank, which set up an online portal to handle PPP applications in April. The initial loans coming in were rather large, averaging around $150,000 to $200,000, said Sam Sidhu, “As complaints mounted last month [April] that big banks the bank’s vice chairman and chief operating officer…. The Phoenixville, Penn.-based bank favored larger businesses over smaller ones in the $3.5 trillion handled 1,200 loans by itself during the first round of the PPP, a spokesman said. With the fintechs, Customers Bank has provided over 95,000 loans, more than 78 times what it did alone, while the federal lending program for small firms battered by the coronavirus pandemic, two little-known companies emerged as average size dropped to below $60,000, Sidhu said.” (Interview early June 2020; Published July 15, 2020) Main Street’s saviors. … a small business loan broker, https://www.barrons.com/articles/fintechs-are-making-inroads-in-small-business-loans-51594839654 accepted tens of thousands of applications from the smallest of businesses without imposing the strict criteria demanded by large banks, such as having an existing loan with the bank …. borrowers waited weeks for their money as the clock ticked down on their ability to survive…. …Customers Bank … stepped in to finance the loans on April 30.” (May 7, 2020) https://www.usatoday.com/story/money/2020/05/07/coronavirus- For large banks, the PPP loans are still a small small-lender-kept-thousands-businesses-waiting-loans/3091942001/ part of total lending, but smaller banks have approved loans that amount to a significant portion of existing loan books. Wyomissing, Pa.- based, Customers Bancorp Inc., a bank with just over $12 billion in total assets, partnered with Kabbage has made more than 130,000 New York City-based Ready Capital Corp., SBA-approved PPP loans worth more than among other fintechs to process PPP loans. The $3.8 billion through a platform it built just bank's $5 billion in PPP lending is nearly 50% of “Customers Bank, a midsize firm based in Wyomissing, Pennsylvania, saw before the program started on April 3. … In its total lending at the end of the 2020 first about half of its loans made through its direct channel go to clients new to less than 10 states, Kabbage is not a direct quarter. (May 28, 2020) lender and it’s making the loans through the bank. By the first week of May, more than 1,000 PPP recipients had Cross River Bank or Customers Bancorp. https://platform.mi.spglobal.com/web/client?auth moved their primary checking relationship to Customers, and the bank was (June 18, 2020) =inherit&overridecdc=1&#news/article?id=58681 expecting to double its number of overall business customers by the end of 922&KeyProductLinkType=6 PPP, says Vice Chairman and COO Sam Sidhu.” (June 10, 2020) https://www.americanbanker.com/news/kabbage-lets- uber-drivers-apply-for-ppp-loans-from-their-phones https://bankingjournal.aba.com/2020/06/we-were-economic-first-responders-ppp/ 31
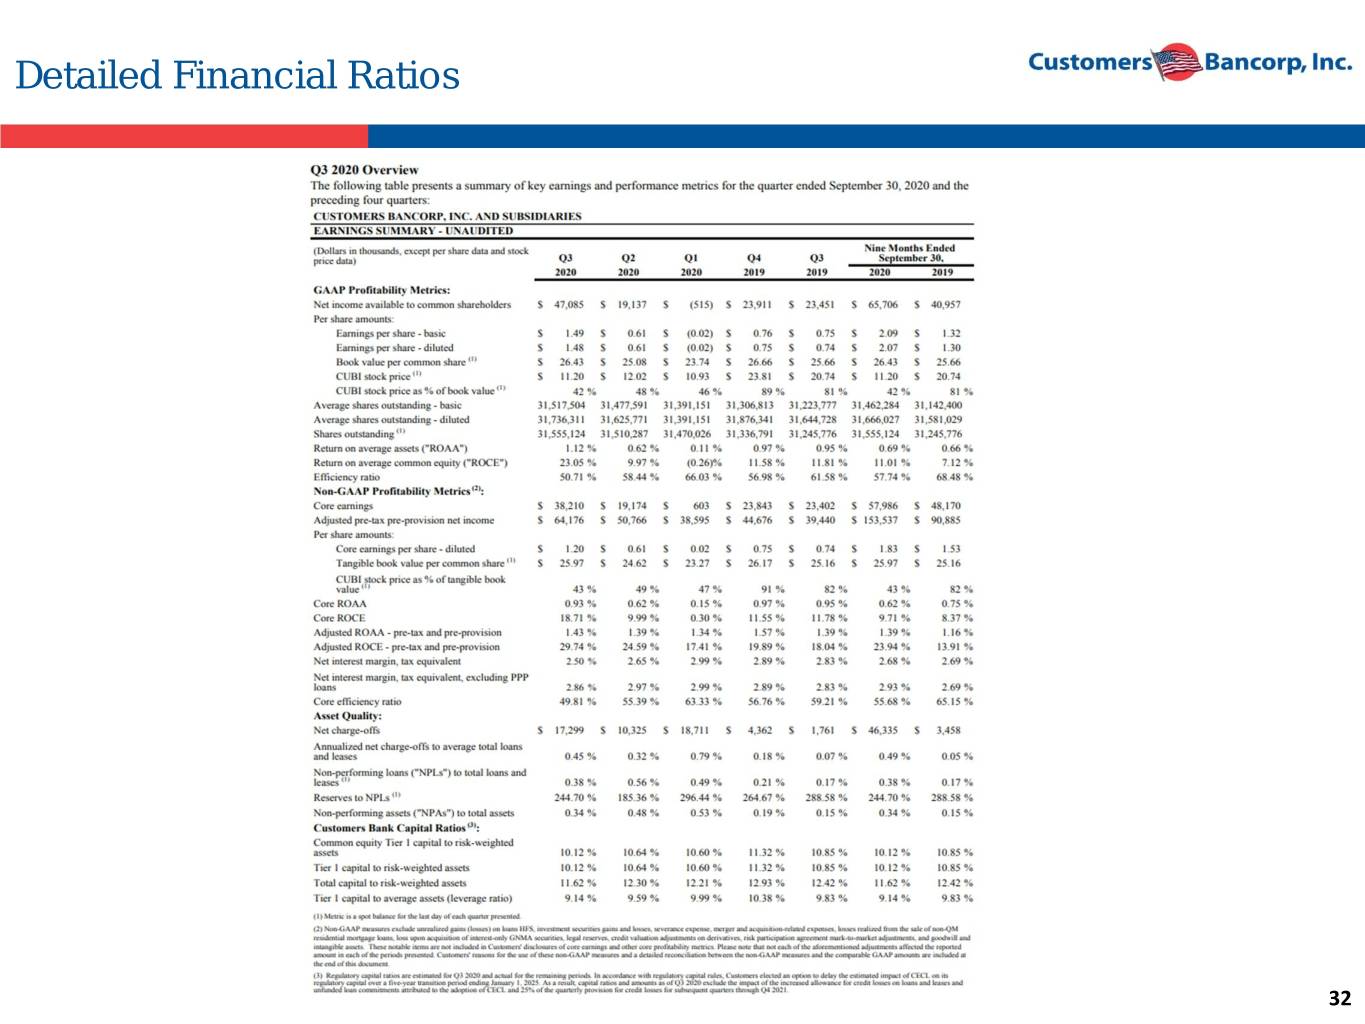
Detailed Financial Ratios 32
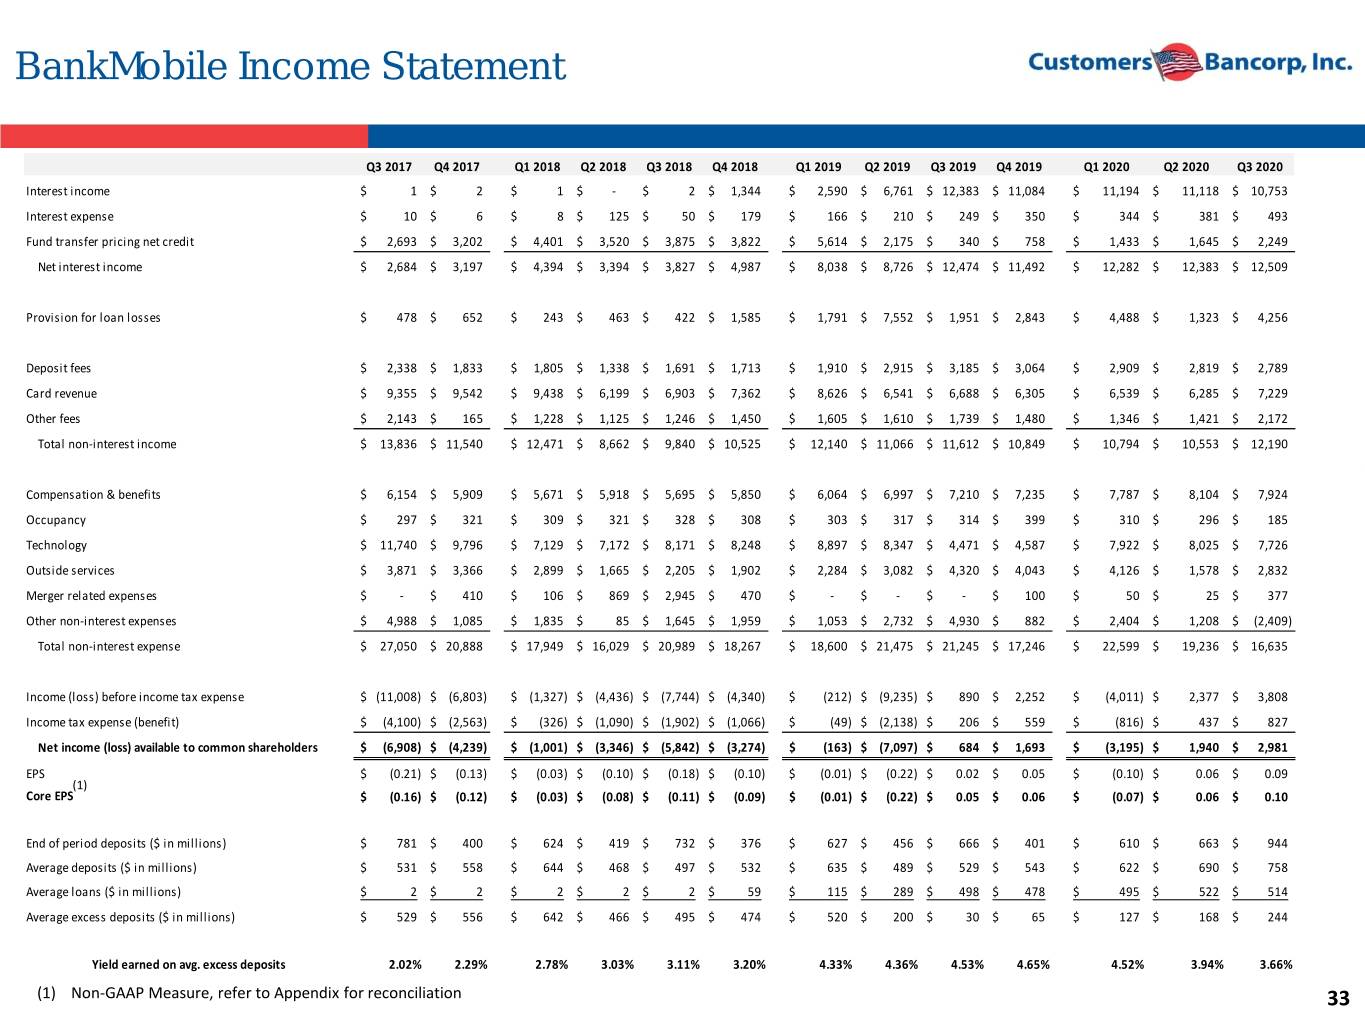
BankMobile Income Statement Q3 2017 Q4 2017 Q1 2018 Q2 2018 Q3 2018 Q4 2018 Q1 2019 Q2 2019 Q3 2019 Q4 2019 Q1 2020 Q2 2020 Q3 2020 Interest income $ 1 $ 2 $ 1 $ - $ 2 $ 1,344 $ 2,590 $ 6,761 $ 12,383 $ 11,084 $ 11,194 $ 11,118 $ 10,753 Interest expense $ 10 $ 6 $ 8 $ 125 $ 50 $ 179 $ 166 $ 210 $ 249 $ 350 $ 344 $ 381 $ 493 Fund transfer pricing net credit $ 2,693 $ 3,202 $ 4,401 $ 3,520 $ 3,875 $ 3,822 $ 5,614 $ 2,175 $ 340 $ 758 $ 1,433 $ 1,645 $ 2,249 Net interest income $ 2,684 $ 3,197 $ 4,394 $ 3,394 $ 3,827 $ 4,987 $ 8,038 $ 8,726 $ 12,474 $ 11,492 $ 12,282 $ 12,383 $ 12,509 Provision for loan losses $ 478 $ 652 $ 243 $ 463 $ 422 $ 1,585 $ 1,791 $ 7,552 $ 1,951 $ 2,843 $ 4,488 $ 1,323 $ 4,256 Deposit fees $ 2,338 $ 1,833 $ 1,805 $ 1,338 $ 1,691 $ 1,713 $ 1,910 $ 2,915 $ 3,185 $ 3,064 $ 2,909 $ 2,819 $ 2,789 Card revenue $ 9,355 $ 9,542 $ 9,438 $ 6,199 $ 6,903 $ 7,362 $ 8,626 $ 6,541 $ 6,688 $ 6,305 $ 6,539 $ 6,285 $ 7,229 Other fees $ 2,143 $ 165 $ 1,228 $ 1,125 $ 1,246 $ 1,450 $ 1,605 $ 1,610 $ 1,739 $ 1,480 $ 1,346 $ 1,421 $ 2,172 Total non-interest income $ 13,836 $ 11,540 $ 12,471 $ 8,662 $ 9,840 $ 10,525 $ 12,140 $ 11,066 $ 11,612 $ 10,849 $ 10,794 $ 10,553 $ 12,190 Compensation & benefits $ 6,154 $ 5,909 $ 5,671 $ 5,918 $ 5,695 $ 5,850 $ 6,064 $ 6,997 $ 7,210 $ 7,235 $ 7,787 $ 8,104 $ 7,924 Occupancy $ 297 $ 321 $ 309 $ 321 $ 328 $ 308 $ 303 $ 317 $ 314 $ 399 $ 310 $ 296 $ 185 Technology $ 11,740 $ 9,796 $ 7,129 $ 7,172 $ 8,171 $ 8,248 $ 8,897 $ 8,347 $ 4,471 $ 4,587 $ 7,922 $ 8,025 $ 7,726 Outside services $ 3,871 $ 3,366 $ 2,899 $ 1,665 $ 2,205 $ 1,902 $ 2,284 $ 3,082 $ 4,320 $ 4,043 $ 4,126 $ 1,578 $ 2,832 Merger related expenses $ - $ 410 $ 106 $ 869 $ 2,945 $ 470 $ - $ - $ - $ 100 $ 50 $ 25 $ 377 Other non-interest expenses $ 4,988 $ 1,085 $ 1,835 $ 85 $ 1,645 $ 1,959 $ 1,053 $ 2,732 $ 4,930 $ 882 $ 2,404 $ 1,208 $ (2,409) Total non-interest expense $ 27,050 $ 20,888 $ 17,949 $ 16,029 $ 20,989 $ 18,267 $ 18,600 $ 21,475 $ 21,245 $ 17,246 $ 22,599 $ 19,236 $ 16,635 Income (loss) before income tax expense $ (11,008) $ (6,803) $ (1,327) $ (4,436) $ (7,744) $ (4,340) $ (212) $ (9,235) $ 890 $ 2,252 $ (4,011) $ 2,377 $ 3,808 Income tax expense (benefit) $ (4,100) $ (2,563) $ (326) $ (1,090) $ (1,902) $ (1,066) $ (49) $ (2,138) $ 206 $ 559 $ (816) $ 437 $ 827 Net income (loss) available to common shareholders $ (6,908) $ (4,239) $ (1,001) $ (3,346) $ (5,842) $ (3,274) $ (163) $ (7,097) $ 684 $ 1,693 $ (3,195) $ 1,940 $ 2,981 EPS $ (0.21) $ (0.13) $ (0.03) $ (0.10) $ (0.18) $ (0.10) $ (0.01) $ (0.22) $ 0.02 $ 0.05 $ (0.10) $ 0.06 $ 0.09 (1) Core EPS $ (0.16) $ (0.12) $ (0.03) $ (0.08) $ (0.11) $ (0.09) $ (0.01) $ (0.22) $ 0.05 $ 0.06 $ (0.07) $ 0.06 $ 0.10 End of period deposits ($ in millions) $ 781 $ 400 $ 624 $ 419 $ 732 $ 376 $ 627 $ 456 $ 666 $ 401 $ 610 $ 663 $ 944 Average deposits ($ in millions) $ 531 $ 558 $ 644 $ 468 $ 497 $ 532 $ 635 $ 489 $ 529 $ 543 $ 622 $ 690 $ 758 Average loans ($ in millions) $ 2 $ 2 $ 2 $ 2 $ 2 $ 59 $ 115 $ 289 $ 498 $ 478 $ 495 $ 522 $ 514 Average excess deposits ($ in millions) $ 529 $ 556 $ 642 $ 466 $ 495 $ 474 $ 520 $ 200 $ 30 $ 65 $ 127 $ 168 $ 244 Yield earned on avg. excess deposits 2.02% 2.29% 2.78% 3.03% 3.11% 3.20% 4.33% 4.36% 4.53% 4.65% 4.52% 3.94% 3.66% (1) Non-GAAP Measure, refer to Appendix for reconciliation 33
Reconciliation of Non-GAAP Measures - Unaudited Customers believes that the non-GAAP measurements disclosed within this document are useful for investors, regulators, management and others to evaluate our core results of operations and financial condition relative to other financial institutions. These non-GAAP financial measures are frequently used by securities analysts, investors, and other interested parties in the evaluation of companies in Customers' industry. These non-GAAP financial measures exclude from corresponding GAAP measures the impact of certain elements that we do not believe are representative of our ongoing financial results, which we believe enhance an overall understanding of our performance and increases comparability of our period to period results. Investors should consider our performance and financial condition as reported under GAAP and all other relevant information when assessing our performance or financial condition. Although non-GAAP financial measures are frequently used in the evaluation of a company, they have limitations as analytical tools and should not be considered in isolation or as a substitute for analysis of our results of operations or financial condition as reported under GAAP. The following tables present reconciliations of GAAP to non-GAAP measures disclosed within this document. 34
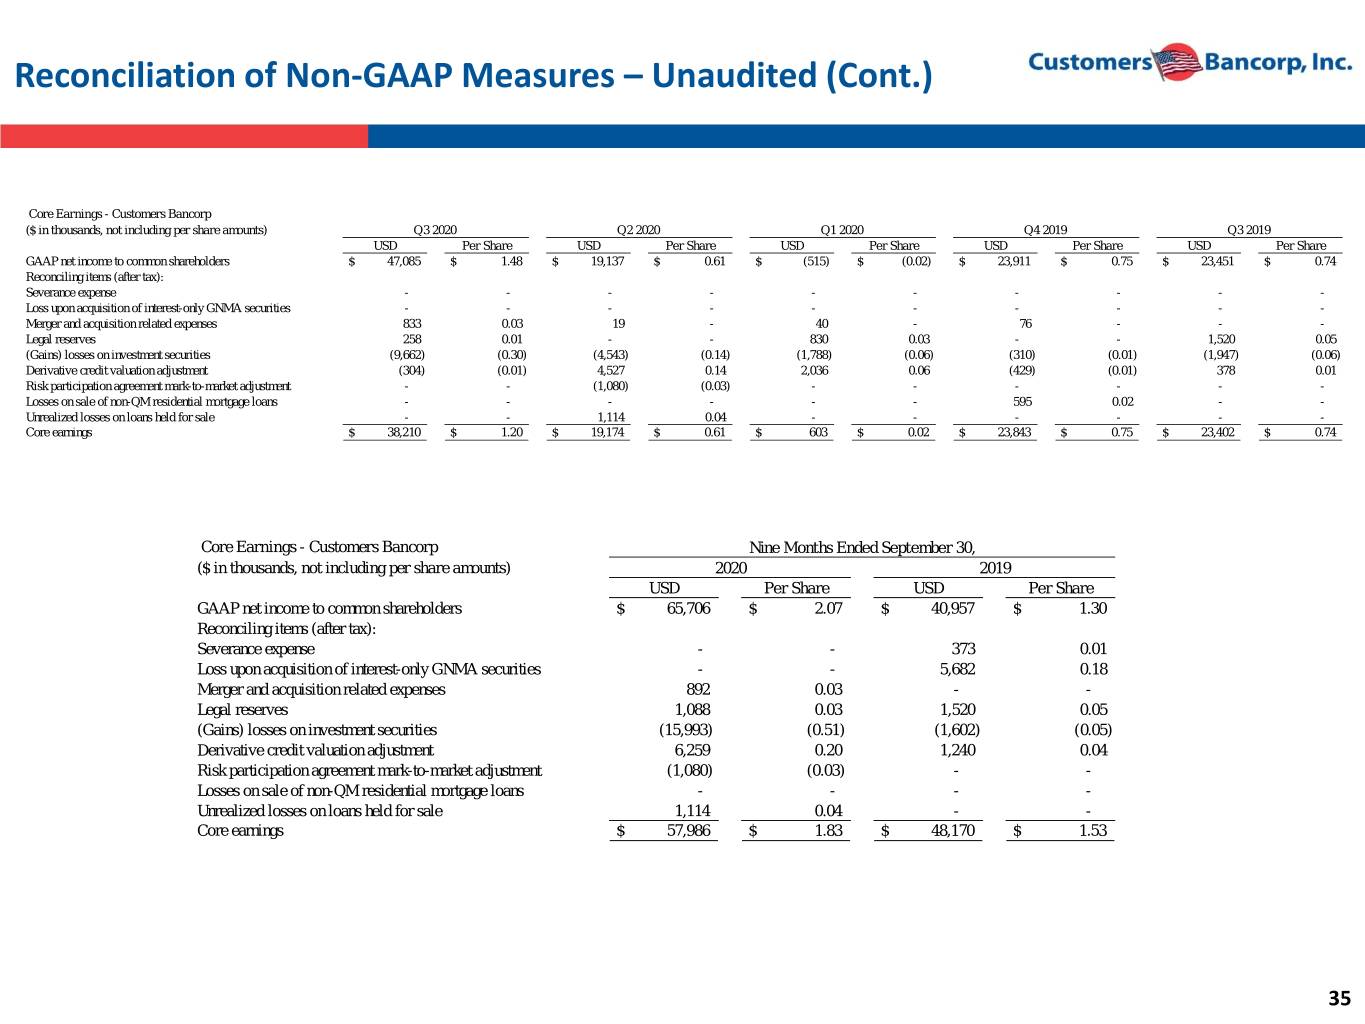
Reconciliation of Non-GAAP Measures – Unaudited (Cont.) Core Earnings - Customers Bancorp ($ in thousands, not including per share amounts) Q3 2020 Q2 2020 Q1 2020 Q4 2019 Q3 2019 USD Per Share USD Per Share USD Per Share USD Per Share USD Per Share GAAP net income to common shareholders $ 47,085 $ 1.48 $ 19,137 $ 0.61 $ (515) $ (0.02) $ 23,911 $ 0.75 $ 23,451 $ 0.74 Reconciling items (after tax): Severance expense - - - - - - - - - - Loss upon acquisition of interest-only GNMA securities - - - - - - - - - - Merger and acquisition related expenses 833 0.03 19 - 40 - 76 - - - Legal reserves 258 0.01 - - 830 0.03 - - 1,520 0.05 (Gains) losses on investment securities (9,662) (0.30) (4,543) (0.14) (1,788) (0.06) (310) (0.01) (1,947) (0.06) Derivative credit valuation adjustment (304) (0.01) 4,527 0.14 2,036 0.06 (429) (0.01) 378 0.01 Risk participation agreement mark-to-market adjustment - - (1,080) (0.03) - - - - - - Losses on sale of non-QM residential mortgage loans - - - - - - 595 0.02 - - Unrealized losses on loans held for sale - - 1,114 0.04 - - - - - - Core earnings $ 38,210 $ 1.20 $ 19,174 $ 0.61 $ 603 $ 0.02 $ 23,843 $ 0.75 $ 23,402 $ 0.74 Core Earnings - Customers Bancorp Nine Months Ended September 30, ($ in thousands, not including per share amounts) 2020 2019 USD Per Share USD Per Share GAAP net income to common shareholders $ 65,706 $ 2.07 $ 40,957 $ 1.30 Reconciling items (after tax): Severance expense - - 373 0.01 Loss upon acquisition of interest-only GNMA securities - - 5,682 0.18 Merger and acquisition related expenses 892 0.03 - - Legal reserves 1,088 0.03 1,520 0.05 (Gains) losses on investment securities (15,993) (0.51) (1,602) (0.05) Derivative credit valuation adjustment 6,259 0.20 1,240 0.04 Risk participation agreement mark-to-market adjustment (1,080) (0.03) - - Losses on sale of non-QM residential mortgage loans - - - - Unrealized losses on loans held for sale 1,114 0.04 - - Core earnings $ 57,986 $ 1.83 $ 48,170 $ 1.53 35
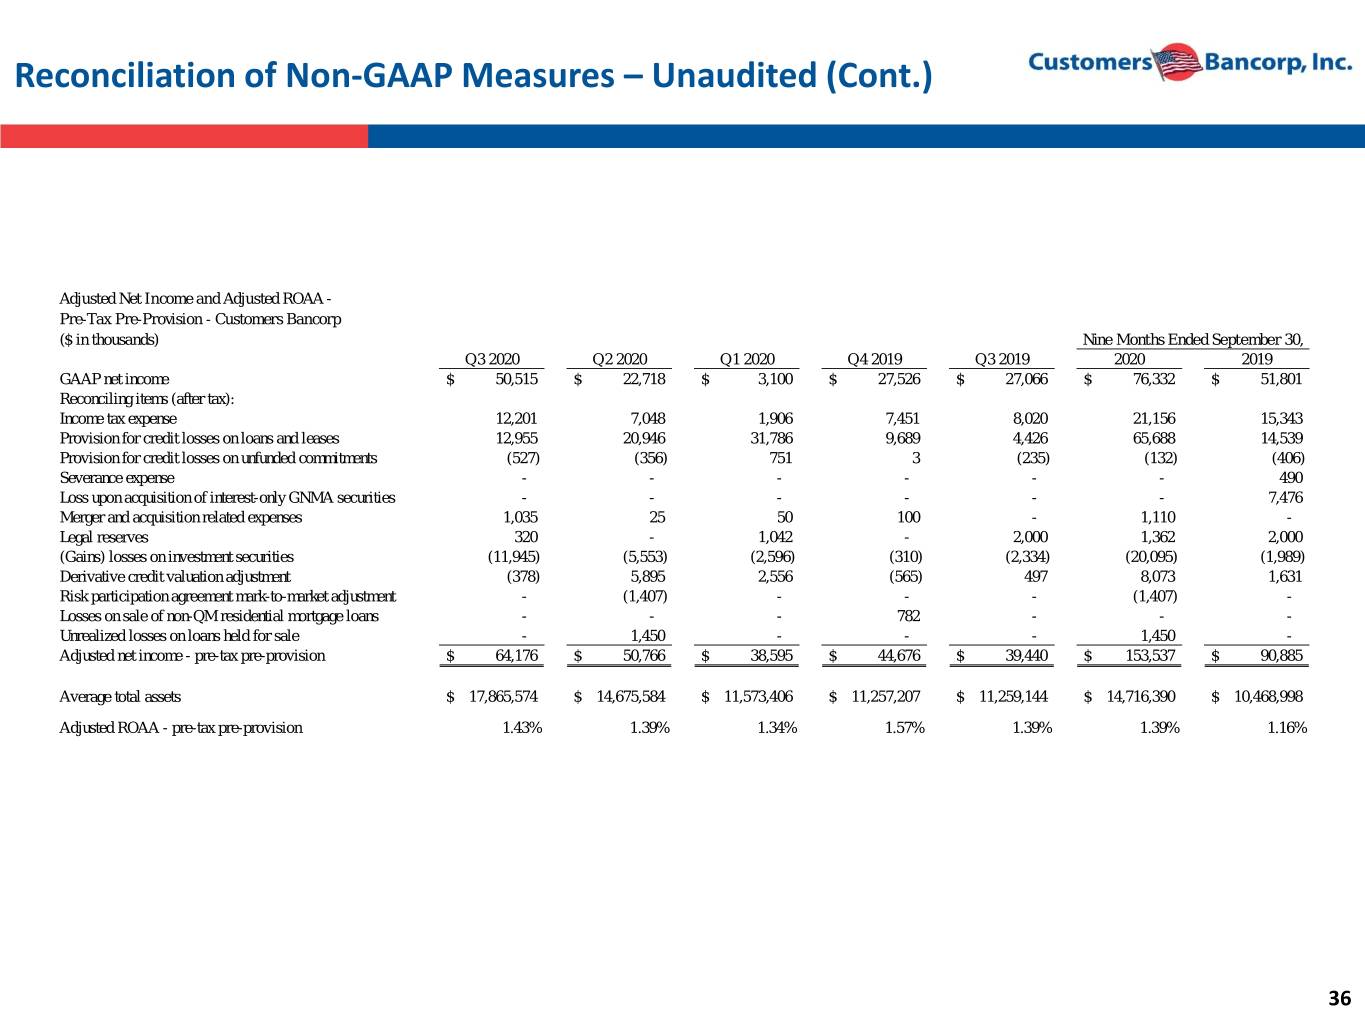
Reconciliation of Non-GAAP Measures – Unaudited (Cont.) Adjusted Net Income and Adjusted ROAA - Pre-Tax Pre-Provision - Customers Bancorp ($ in thousands) Nine Months Ended September 30, Q3 2020 Q2 2020 Q1 2020 Q4 2019 Q3 2019 2020 2019 GAAP net income $ 50,515 $ 22,718 $ 3,100 $ 27,526 $ 27,066 $ 76,332 $ 51,801 Reconciling items (after tax): Income tax expense 12,201 7,048 1,906 7,451 8,020 21,156 15,343 Provision for credit losses on loans and leases 12,955 20,946 31,786 9,689 4,426 65,688 14,539 Provision for credit losses on unfunded commitments (527) (356) 751 3 (235) (132) (406) Severance expense - - - - - - 490 Loss upon acquisition of interest-only GNMA securities - - - - - - 7,476 Merger and acquisition related expenses 1,035 25 50 100 - 1,110 - Legal reserves 320 - 1,042 - 2,000 1,362 2,000 (Gains) losses on investment securities (11,945) (5,553) (2,596) (310) (2,334) (20,095) (1,989) Derivative credit valuation adjustment (378) 5,895 2,556 (565) 497 8,073 1,631 Risk participation agreement mark-to-market adjustment - (1,407) - - - (1,407) - Losses on sale of non-QM residential mortgage loans - - - 782 - - - Unrealized losses on loans held for sale - 1,450 - - - 1,450 - Adjusted net income - pre-tax pre-provision $ 64,176 $ 50,766 $ 38,595 $ 44,676 $ 39,440 $ 153,537 $ 90,885 Average total assets $ 17,865,574 $ 14,675,584 $ 11,573,406 $ 11,257,207 $ 11,259,144 $ 14,716,390 $ 10,468,998 Adjusted ROAA - pre-tax pre-provision 1.43% 1.39% 1.34% 1.57% 1.39% 1.39% 1.16% 36
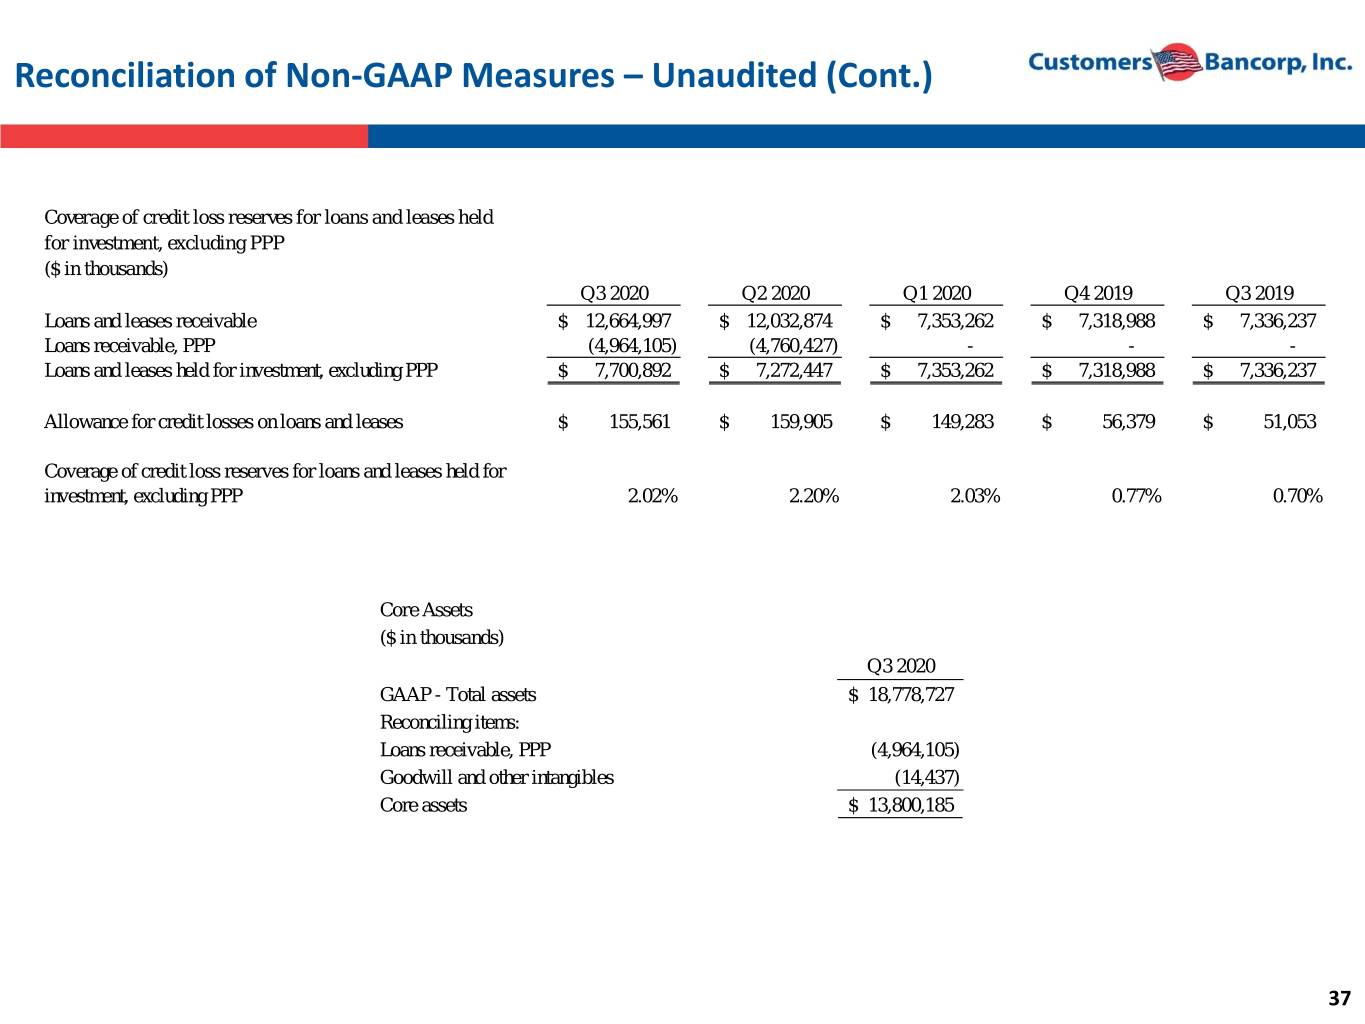
Reconciliation of Non-GAAP Measures – Unaudited (Cont.) Coverage of credit loss reserves for loans and leases held for investment, excluding PPP ($ in thousands) Q3 2020 Q2 2020 Q1 2020 Q4 2019 Q3 2019 Loans and leases receivable $ 12,664,997 $ 12,032,874 $ 7,353,262 $ 7,318,988 $ 7,336,237 Loans receivable, PPP (4,964,105) (4,760,427) - - - Loans and leases held for investment, excluding PPP $ 7,700,892 $ 7,272,447 $ 7,353,262 $ 7,318,988 $ 7,336,237 Allowance for credit losses on loans and leases $ 155,561 $ 159,905 $ 149,283 $ 56,379 $ 51,053 Coverage of credit loss reserves for loans and leases held for investment, excluding PPP 2.02% 2.20% 2.03% 0.77% 0.70% Core Assets ($ in thousands) Q3 2020 GAAP - Total assets $ 18,778,727 Reconciling items: Loans receivable, PPP (4,964,105) Goodwill and other intangibles (14,437) Core assets $ 13,800,185 37
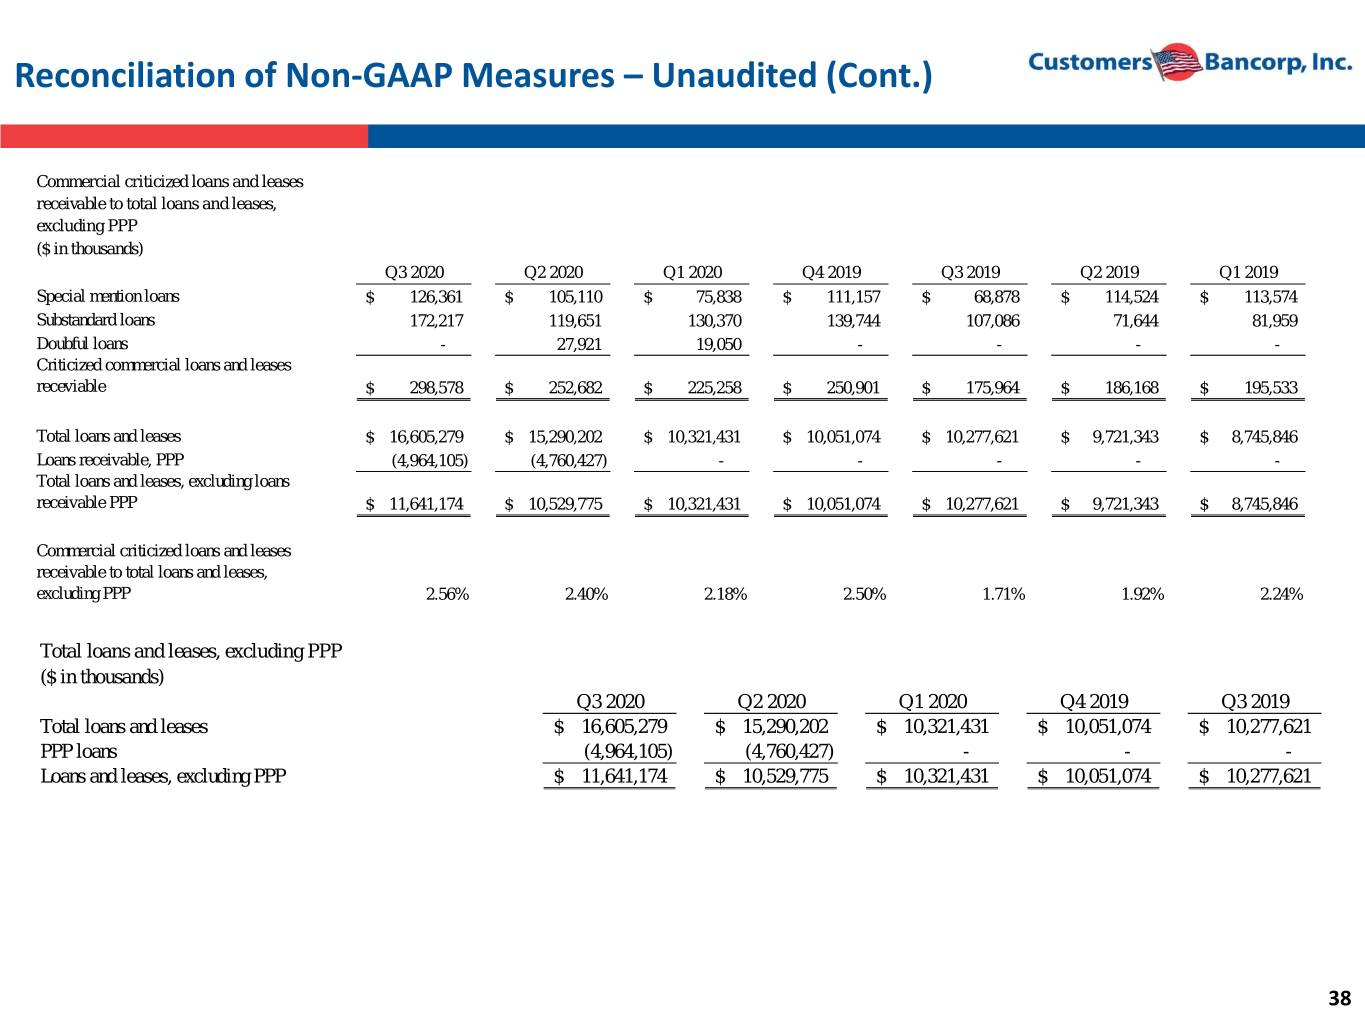
Reconciliation of Non-GAAP Measures – Unaudited (Cont.) Commercial criticized loans and leases receivable to total loans and leases, excluding PPP ($ in thousands) Q3 2020 Q2 2020 Q1 2020 Q4 2019 Q3 2019 Q2 2019 Q1 2019 Special mention loans $ 126,361 $ 105,110 $ 75,838 $ 111,157 $ 68,878 $ 114,524 $ 113,574 Substandard loans 172,217 119,651 130,370 139,744 107,086 71,644 81,959 Doubful loans - 27,921 19,050 - - - - Criticized commercial loans and leases receviable $ 298,578 $ 252,682 $ 225,258 $ 250,901 $ 175,964 $ 186,168 $ 195,533 Total loans and leases $ 16,605,279 $ 15,290,202 $ 10,321,431 $ 10,051,074 $ 10,277,621 $ 9,721,343 $ 8,745,846 Loans receivable, PPP (4,964,105) (4,760,427) - - - - - Total loans and leases, excluding loans receivable PPP $ 11,641,174 $ 10,529,775 $ 10,321,431 $ 10,051,074 $ 10,277,621 $ 9,721,343 $ 8,745,846 Commercial criticized loans and leases receivable to total loans and leases, excluding PPP 2.56% 2.40% 2.18% 2.50% 1.71% 1.92% 2.24% Total loans and leases, excluding PPP ($ in thousands) Q3 2020 Q2 2020 Q1 2020 Q4 2019 Q3 2019 Total loans and leases $ 16,605,279 $ 15,290,202 $ 10,321,431 $ 10,051,074 $ 10,277,621 PPP loans (4,964,105) (4,760,427) - - - Loans and leases, excluding PPP $ 11,641,174 $ 10,529,775 $ 10,321,431 $ 10,051,074 $ 10,277,621 38
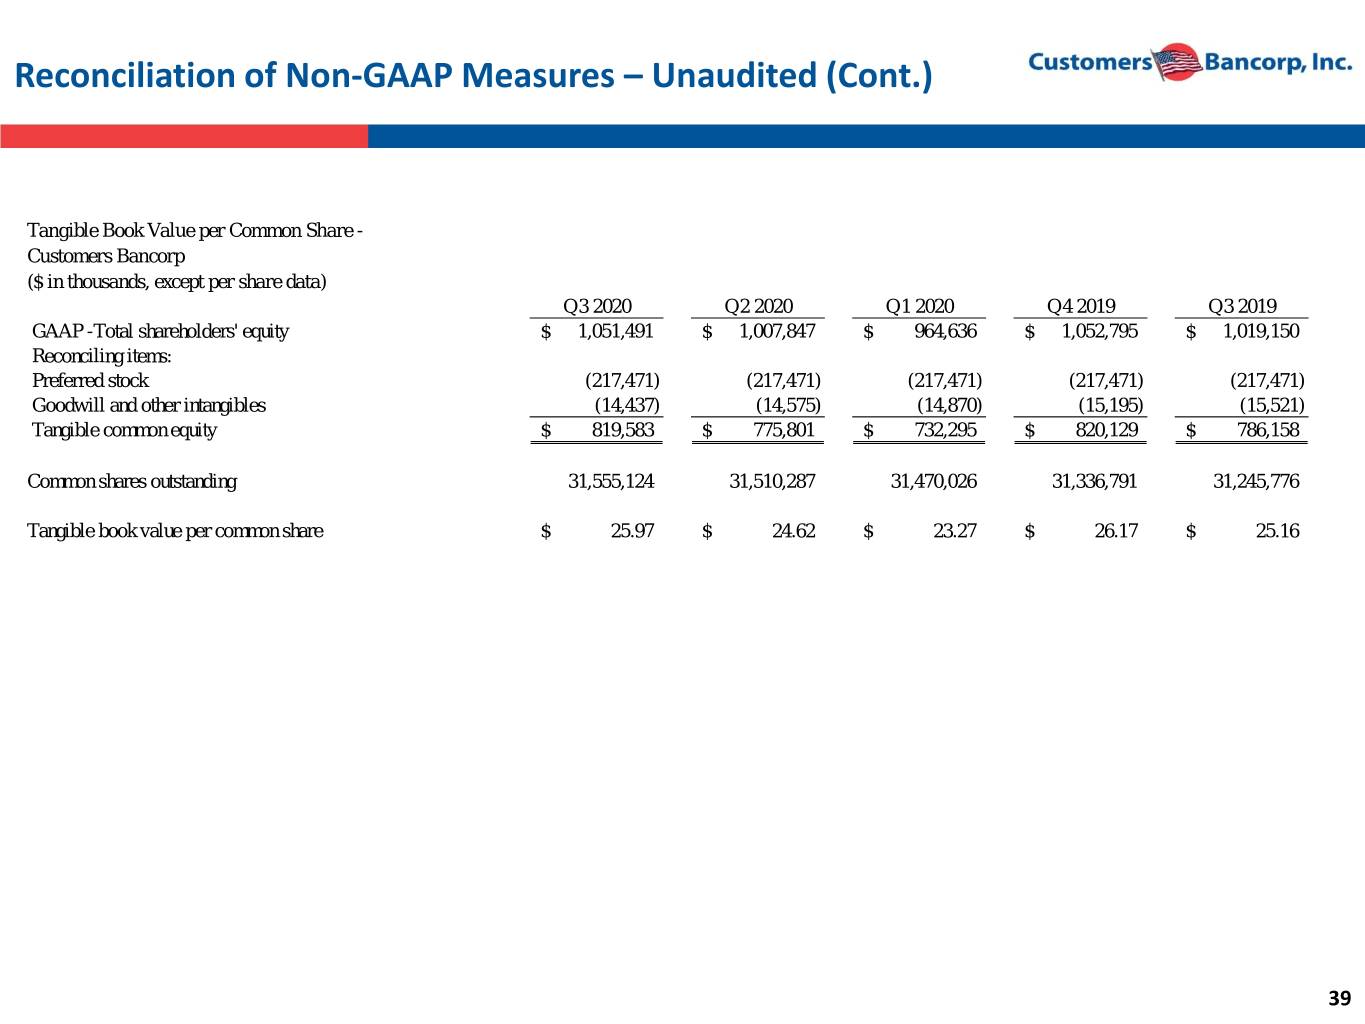
Reconciliation of Non-GAAP Measures – Unaudited (Cont.) Tangible Book Value per Common Share - Customers Bancorp ($ in thousands, except per share data) Q3 2020 Q2 2020 Q1 2020 Q4 2019 Q3 2019 GAAP -Total shareholders' equity $ 1,051,491 $ 1,007,847 $ 964,636 $ 1,052,795 $ 1,019,150 Reconciling items: Preferred stock (217,471) (217,471) (217,471) (217,471) (217,471) Goodwill and other intangibles (14,437) (14,575) (14,870) (15,195) (15,521) Tangible common equity $ 819,583 $ 775,801 $ 732,295 $ 820,129 $ 786,158 Common shares outstanding 31,555,124 31,510,287 31,470,026 31,336,791 31,245,776 Tangible book value per common share $ 25.97 $ 24.62 $ 23.27 $ 26.17 $ 25.16 39
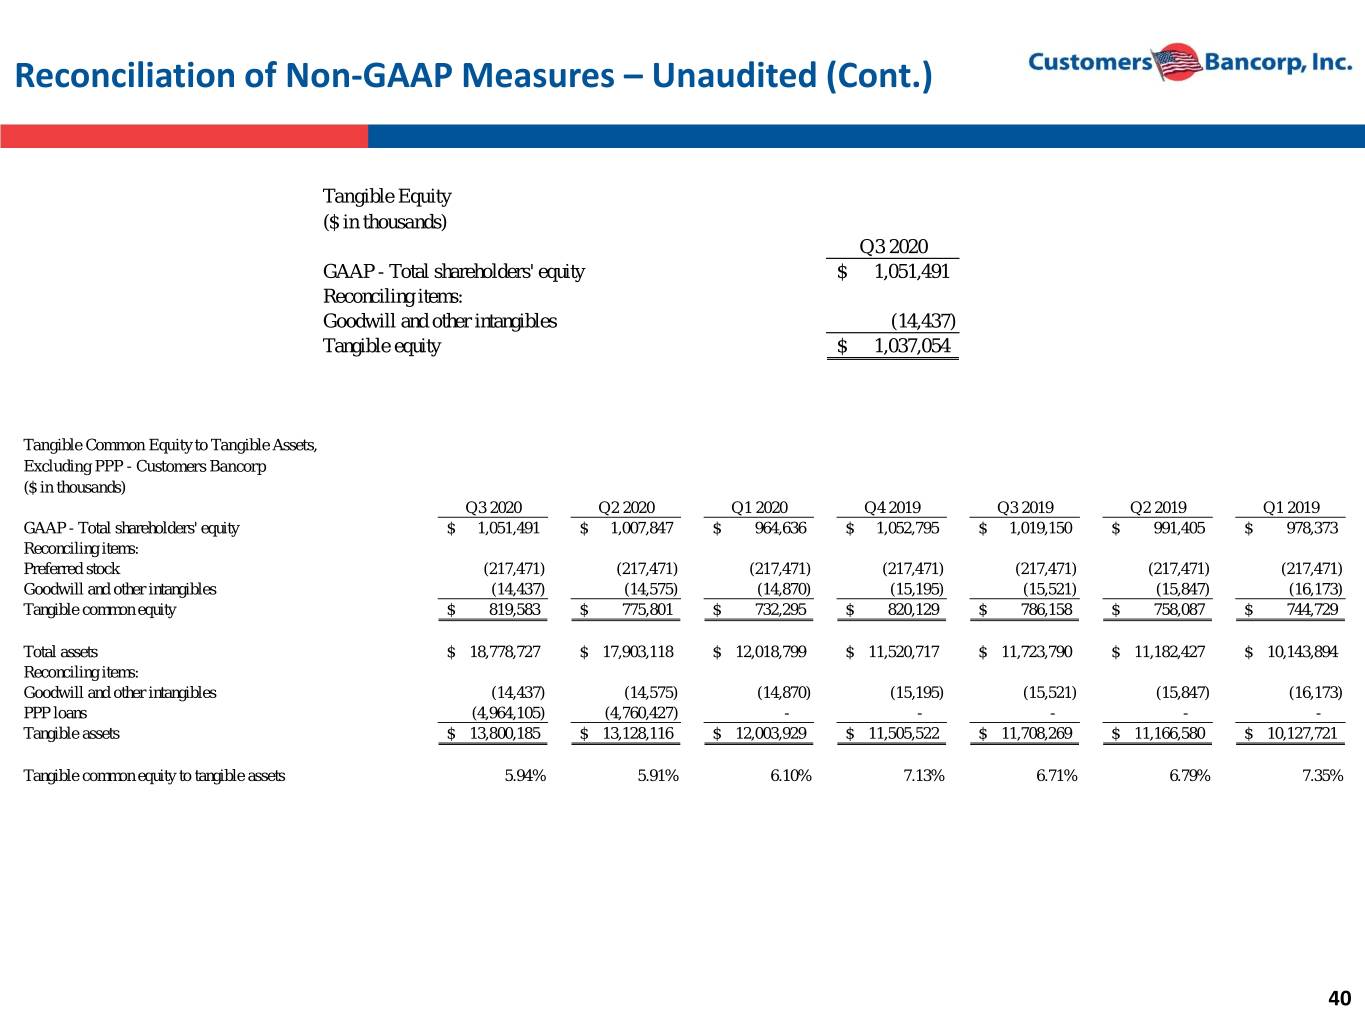
Reconciliation of Non-GAAP Measures – Unaudited (Cont.) Tangible Equity ($ in thousands) Q3 2020 GAAP - Total shareholders' equity $ 1,051,491 Reconciling items: Goodwill and other intangibles (14,437) Tangible equity $ 1,037,054 Tangible Common Equity to Tangible Assets, Excluding PPP - Customers Bancorp ($ in thousands) Q3 2020 Q2 2020 Q1 2020 Q4 2019 Q3 2019 Q2 2019 Q1 2019 GAAP - Total shareholders' equity $ 1,051,491 $ 1,007,847 $ 964,636 $ 1,052,795 $ 1,019,150 $ 991,405 $ 978,373 Reconciling items: Preferred stock (217,471) (217,471) (217,471) (217,471) (217,471) (217,471) (217,471) Goodwill and other intangibles (14,437) (14,575) (14,870) (15,195) (15,521) (15,847) (16,173) Tangible common equity $ 819,583 $ 775,801 $ 732,295 $ 820,129 $ 786,158 $ 758,087 $ 744,729 Total assets $ 18,778,727 $ 17,903,118 $ 12,018,799 $ 11,520,717 $ 11,723,790 $ 11,182,427 $ 10,143,894 Reconciling items: Goodwill and other intangibles (14,437) (14,575) (14,870) (15,195) (15,521) (15,847) (16,173) PPP loans (4,964,105) (4,760,427) - - - - - Tangible assets $ 13,800,185 $ 13,128,116 $ 12,003,929 $ 11,505,522 $ 11,708,269 $ 11,166,580 $ 10,127,721 Tangible common equity to tangible assets 5.94% 5.91% 6.10% 7.13% 6.71% 6.79% 7.35% 40
Contacts Leadership: Analysts: Carla Leibold B. Riley Financial CFO of Customers Bancorp, Inc and Customers Steve Moss Bank Tel: 484-923-8802 D.A. Davidson Company [email protected] Russell Gunther Jay Sidhu Hovde Group Chairman & CEO of Customers Bancorp, Inc. and Will Curtiss Executive Chairman of Customers Bank Tel: 610-935-8693 [email protected] Keefe, Bruyette & Woods Michael Perito Richard Ehst President & COO of Customers Bancorp, Inc. and Maxim Group CEO of Customers Bank Michael Diana Tel: 610-917-3263 [email protected] Piper Sandler Companies Frank Schiraldi Sam Sidhu COO of Customers Bank & Head of Corporate Development of Customers Bancorp Tel: 212-843-2485 [email protected] 41