
DAR 8-K
Darling Ingredients Inc. (DAR)
8-K
2020-08-05
For: 2020-08-05
View Original
Added on
April 04, 2026
UNITED STATES
SECURITIES AND EXCHANGE COMMISSION
WASHINGTON, D.C. 20549
FORM 8-K
CURRENT REPORT
Pursuant to Section 13 or 15(d) of the
Securities Exchange Act of 1934
Date of report (Date of earliest event reported) | ||||||||||||||
| (Exact Name of Registrant as Specified in Charter) | ||||||||||||||
| (State or Other Jurisdiction of Incorporation) | (Commission File Number) | (IRS Employer Identification No.) | ||||||
(Address of Principal Executive Offices) (Zip Code)
Registrant’s telephone number, including area code: (972 ) 717-0300
Check the appropriate box below if the Form 8-K filing is intended to simultaneously satisfy the filing obligation of the registrant under any of the following provisions (see General Instruction A.2. below):
| Written communications pursuant to Rule 425 under the Securities Act (17 CFR 230.425) | |||||
| Soliciting material pursuant to Rule 14a-12 under the Exchange Act (17 CFR 240.14a-12) | |||||
| Pre-commencement communications pursuant to Rule 14d-2(b) under the Exchange Act (17 CFR 240.14d-2(b)) | |||||
| Pre-commencement communications pursuant to Rule 13e-4(c) under the Exchange Act (17 CFR 240.13e-4(c)) | |||||
Securities registered pursuant to Section 12(b) of the Act:
| Title of each class | Trading Symbol(s) | Name of each exchange on which registered | |||||||||
| (“NYSE”) | |||||||||||
Indicate by check mark whether the registrant is an emerging growth company as defined in Rule 405 of the Securities Act of 1933 (§230.405 of this chapter) or Rule 12b-2 of the Securities Exchange Act of 1934 (§240.12b-2 of this chapter).
| Emerging growth company | |||||
If an emerging growth company, indicate by check mark if the registrant has elected not to use the extended transition period for complying with any new or revised financial accounting standards provided pursuant to Section 13(a) of the Exchange Act. ☐
1
Item 2.02. Results of Operations and Financial Condition.
On August 5, 2020, Darling Ingredients Inc. (the “Company”) issued a press release announcing financial results for the second quarter ended June 27, 2020. A copy of this press release is attached hereto as Exhibit 99.1.
The Company will hold a conference call and webcast on Thursday, August 6, 2020 to discuss these financial results. The Company will have a slide presentation available to augment management's formal presentation, which will be accessible via the investor relations section of the Company's website. A copy of this slide presentation is attached hereto as Exhibit 99.2.
The Company is making reference to non-GAAP financial measures in both the press release and the conference call. A reconciliation of these non-GAAP financial measures to the comparable GAAP financial measures is contained in the attached press release.
The information in this Item 2.02, including the exhibits attached hereto, shall not be deemed "filed" for purposes of Section 18 of the Securities Exchange Act of 1934, nor shall it be deemed incorporated by reference in any filing under the Securities Act of 1933, except as shall be expressly set forth by specific reference in such filing.
Item 8.01. Other Events.
On August 3, 2020, the Company’s Board of Directors approved the extension for an additional two years of its previously announced share repurchase program and refreshed the amount of the program back up to its original amount of an aggregate of $200.0 million of the Company's Common depending on market conditions.
Item 9.01. Financial Statements and Exhibits.
(d) Exhibits.
| 99.1 | ||||||||
| 99.2 | ||||||||
| 104 | Cover Page Interactive Data File (embedded within Inline XBRL document) | |||||||
2
SIGNATURES
Pursuant to the requirements of the Securities Exchange Act of 1934, the registrant has duly caused this report to be signed on its behalf by the undersigned hereunto duly authorized.
| DARLING INGREDIENTS INC. | |||||||||||
| Date: August 5, 2020 | By: | /s/ John F. Sterling | |||||||||
| John F. Sterling | |||||||||||
| Executive Vice President, General Counsel | |||||||||||
3
EXHIBIT 99.1
News Release

DARLING INGREDIENTS INC. REPORTS SECOND QUARTER 2020 FINANCIAL RESULTS
IRVING, TEXAS, August 5, 2020/PRNewswire/ Darling Ingredients Inc. (NYSE: DAR, “Darling”) --
Second Quarter 2020
•Net income of $65.4 million, or $0.39 per GAAP diluted share
•Net Sales of $848.7 million
•Combined adjusted EBITDA of $195.2 million
•Core business EBITDA of $126.1 million, $16 million better than Q1-2020; $24 million better than Q2-2019, excluding the $13.1 million gain on the sale of assets in Q2-2019
•Diamond Green Diesel (“DGD”) earned $1.91 EBITDA per gallon on approximately 72 million gallons sold
•In July, Darling received an $80 million distribution from DGD, total distributions received in 2020 is $205 million
Darling reported net sales of $848.7 million for the second quarter of 2020, as compared with net sales of $827.3 million for the same period a year ago. Net income attributable to Darling for the three months ended June 27, 2020 was $65.4 million, or $0.39 per diluted share, compared to a net income of $26.3 million, or $0.16 per diluted share, for the second quarter of 2019.
“We had another solid quarter of execution from our employees worldwide who delivered a strong second quarter financial performance, generating $195 million of combined adjusted EBITDA,” said Randall C. Stuewe, Chairman and Chief Executive Officer of Darling Ingredients Inc. “Our core business navigated through a turbulent second quarter with our feed segment posting its best quarterly EBITDA of $85.2 million in over the last three years. We did benefit from over 40 million pounds of depopulated hog volumes through our processing locations during the quarter.”
“Darling’s diversification provides our global business platform earnings sustainability as demonstrated in the second quarter. Our DGD JV financial performance was impacted by the sharp decline in the energy sector as a result of the COVID pandemic, but still produced good results which were enhanced by a better performance in our feed segment. Excluding the gain on the sale of assets in the food segment from a year ago, this year’s food segment performance was on par to 2019,” added Stuewe.
“We did use the DGD distribution proceeds received in April to pay down our outstanding debt in the second quarter, lowering our leverage ratio to 2.39 as measured by our bank covenant. We remain diligent on our capital expenditures, investing approximately $123 million for the first six months of 2020. We continue to target a deferral of 15% to 20% in capital expenditures as the uncertainty surrounding COVID-19 persists,” commented Stuewe.
The Darling Ingredients Board has approved replenishing the Company’s previously announced share repurchase program back to $200 million of availability and have extended the term of the program for an additional two years to August 13, 2022, to be exercised depending on market conditions. The repurchases may be made from time to time on the open market at prevailing market prices or in negotiated transactions off the market. Repurchases may occur over the authorized period unless extended or shortened by the Board of Directors.
In accordance with the distribution policy at Diamond Green Diesel, Darling received an $80 million distribution from DGD in July 2020. Total distributions received in the first six months of 2020 total $205 million.
| News Release August 5, 2020 Page 2 | ||||||||||
For the six months ended June 27, 2020, Darling reported net sales of $1.7 billion, as compared with net sales of $1.7 billion for the same period of 2019. Net Income attributable to Darling for the first six months of 2020 was $150.9 million, or $0.90 per diluted share, as compared to a net income of $44.3 million, or $0.26 per diluted share, for the first six months of 2019.
As of June 27, 2020, Darling had $76.2 million in cash and cash equivalents, and $939.7 million available under committed revolving credit agreements. Total debt outstanding at the end of the second quarter of 2020 was $1.6 billion.
Combined adjusted EBITDA was $195.2 million for the second quarter of 2020, compared to $159.4 million for the same period in 2019. On a year-to-date basis, combined adjusted EBITDA totaled $408.5 million for 2020, compared to $292.7 million on a year-to-date basis for 2019.
Segment Financial Tables (in thousands)
| Three Months Ended June 27, 2020 | Feed Ingredients | Food Ingredients | Fuel Ingredients | Corporate | Total | ||||||||||||
| Net sales | $ | 503,690 | $ | 278,934 | $ | 66,049 | $ | — | $ | 848,673 | |||||||
| Cost of sales and operating expenses | 367,902 | 220,159 | 44,286 | — | 632,347 | ||||||||||||
| Gross margin | $ | 135,788 | $ | 58,775 | $ | 21,763 | $ | — | $ | 216,326 | |||||||
| Loss on sale of assets | 76 | (48) | (1) | — | 27 | ||||||||||||
| Selling, general and administrative expenses | 50,484 | 22,564 | 3,953 | 13,192 | 90,193 | ||||||||||||
| Depreciation and amortization | 52,683 | 19,972 | 7,980 | 2,675 | 83,310 | ||||||||||||
| Equity in net income of Diamond Green Diesel | — | — | 63,492 | — | 63,492 | ||||||||||||
| Segment operating income/(loss) | $ | 32,545 | $ | 16,287 | $ | 73,323 | $ | (15,867) | $ | 106,288 | |||||||
| Equity in net income of unconsolidated subsidiaries | $ | 692 | $ | — | $ | — | $ | — | $ | 692 | |||||||
| Segment Income/(loss) | $ | 33,237 | $ | 16,287 | $ | 73,323 | $ | (15,867) | $ | 106,980 | |||||||
| Segment EBITDA | $ | 85,228 | $ | 36,259 | $ | 17,811 | $ | (13,192) | $ | 126,106 | |||||||
| DGD Adjusted EBITDA (Darling's Share) | $ | — | $ | — | $ | 69,108 | $ | — | $ | 69,108 | |||||||
| Combined adjusted EBITDA | $ | 85,228 | $ | 36,259 | $ | 86,919 | $ | (13,192) | $ | 195,214 | |||||||
| Three Months Ended June 29, 2019 | Feed Ingredients | Food Ingredients | Fuel Ingredients | Corporate | Total | ||||||||||||
| Net sales | $ | 487,447 | $ | 274,835 | $ | 65,042 | $ | — | $ | 827,324 | |||||||
| Cost of sales and operating expenses | 376,955 | 214,444 | 53,317 | — | 644,716 | ||||||||||||
| Gross margin | $ | 110,492 | $ | 60,391 | $ | 11,725 | $ | — | $ | 182,608 | |||||||
| Loss/(gain) on sale of assets | (524) | (13,379) | (23) | — | (13,926) | ||||||||||||
| Selling, general and administrative expenses | 46,465 | 23,431 | 425 | 10,696 | 81,017 | ||||||||||||
| Depreciation and amortization | 48,720 | 19,861 | 8,362 | 2,543 | 79,486 | ||||||||||||
| Equity in net income of Diamond Green Diesel | — | — | 38,093 | — | 38,093 | ||||||||||||
| Segment operating income/(loss) | $ | 15,831 | $ | 30,478 | $ | 41,054 | $ | (13,239) | $ | 74,124 | |||||||
| Equity in net loss of unconsolidated subsidiaries | $ | 82 | $ | — | $ | — | $ | — | $ | 82 | |||||||
| Segment Income/(loss) | $ | 15,913 | $ | 30,478 | $ | 41,054 | $ | (13,239) | $ | 74,206 | |||||||
| Segment EBITDA | $ | 64,551 | $ | 50,339 | $ | 11,323 | $ | (10,696) | $ | 115,517 | |||||||
| DGD Adjusted EBITDA (Darling's Share) | $ | — | $ | — | $ | 43,894 | $ | — | $ | 43,894 | |||||||
| Combined adjusted EBITDA | $ | 64,551 | $ | 50,339 | $ | 55,217 | $ | (10,696) | $ | 159,411 | |||||||
| News Release August 5, 2020 Page 3 | ||||||||||
Segment Financial Tables (in thousands) continued
| Six Months Ended June 27, 2020 | Feed Ingredients | Food Ingredients | Fuel Ingredients | Corporate | Total | ||||||||||||
| Net sales | $ | 1,016,315 | $ | 549,228 | $ | 135,972 | $ | — | $ | 1,701,515 | |||||||
| Cost of sales and operating expenses | 756,355 | 425,589 | 97,311 | — | 1,279,255 | ||||||||||||
| Gross margin | $ | 259,960 | $ | 123,639 | $ | 38,661 | $ | — | $ | 422,260 | |||||||
| Loss on sale of assets | 126 | (46) | 8 | — | 88 | ||||||||||||
| Selling, general and administrative expenses | 104,431 | 48,040 | 5,607 | 28,308 | 186,386 | ||||||||||||
| Depreciation and amortization | 106,204 | 40,277 | 16,072 | 5,428 | 167,981 | ||||||||||||
| Equity in net income of Diamond Green Diesel | — | — | 161,312 | — | 161,312 | ||||||||||||
| Segment operating income/(loss) | $ | 49,199 | $ | 35,368 | $ | 178,286 | $ | (33,736) | $ | 229,117 | |||||||
| Equity in net income of unconsolidated subsidiaries | $ | 1,561 | $ | — | $ | — | $ | — | $ | 1,561 | |||||||
| Segment Income/(loss) | $ | 50,760 | $ | 35,368 | $ | 178,286 | $ | (33,736) | $ | 230,678 | |||||||
| Segment EBITDA | $ | 155,403 | $ | 75,645 | $ | 33,046 | $ | (28,308) | $ | 235,786 | |||||||
| DGD Adjusted EBITDA (Darling's Share) | $ | — | $ | — | $ | 172,742 | $ | — | $ | 172,742 | |||||||
| Combined adjusted EBITDA | $ | 155,403 | $ | 75,645 | $ | 205,788 | $ | (28,308) | $ | 408,528 | |||||||
| Six Months Ended June 29, 2019 | Feed Ingredients | Food Ingredients | Fuel Ingredients | Corporate | Total | ||||||||||||
| Net sales | $ | 983,266 | $ | 553,999 | $ | 125,163 | $ | — | $ | 1,662,428 | |||||||
| Cost of sales and operating expenses | 763,814 | 428,448 | 103,367 | — | 1,295,629 | ||||||||||||
| Gross margin | $ | 219,452 | $ | 125,551 | $ | 21,796 | $ | — | $ | 366,799 | |||||||
| Loss/(gain) on sale of assets | (4,914) | (13,265) | 3 | — | (18,176) | ||||||||||||
| Selling, general and administrative expenses | 95,296 | 45,318 | (329) | 25,735 | 166,020 | ||||||||||||
| Depreciation and amortization | 98,089 | 39,372 | 16,160 | 5,029 | 158,650 | ||||||||||||
| Equity in net income of Diamond Green Diesel | — | — | 62,370 | — | 62,370 | ||||||||||||
| Segment operating income/(loss) | $ | 30,981 | $ | 54,126 | $ | 68,332 | $ | (30,764) | $ | 122,675 | |||||||
| Equity in net loss of unconsolidated subsidiaries | $ | (422) | $ | — | $ | — | $ | — | $ | (422) | |||||||
| Segment Income/(loss) | $ | 30,559 | $ | 54,126 | $ | 68,332 | $ | (30,764) | $ | 122,253 | |||||||
| Segment EBITDA | $ | 129,070 | $ | 93,498 | $ | 22,122 | $ | (25,735) | $ | 218,955 | |||||||
| DGD Adjusted EBITDA (Darling's Share) | $ | — | $ | — | $ | 73,721 | $ | — | $ | 73,721 | |||||||
| Combined adjusted EBITDA | $ | 129,070 | $ | 93,498 | $ | 95,843 | $ | (25,735) | $ | 292,676 | |||||||
| News Release August 5, 2020 Page 4 | ||||||||||
Darling Ingredients Inc. and Subsidiaries
Condensed Consolidated Balance Sheets
June 27, 2020 and December 28, 2019
(in thousands)
| June 27, | December 28, | |||||||||||||
| 2020 | 2019 | |||||||||||||
| ASSETS | (unaudited) | |||||||||||||
| Current assets: | ||||||||||||||
| Cash and cash equivalents | $ | 76,185 | $ | 72,935 | ||||||||||
| Restricted cash | 103 | 110 | ||||||||||||
| Accounts receivable, net | 375,908 | 406,338 | ||||||||||||
| Inventories | 394,708 | 362,957 | ||||||||||||
| Prepaid expenses | 46,003 | 46,599 | ||||||||||||
| Income taxes refundable | 3,752 | 3,317 | ||||||||||||
| Other current assets | 34,392 | 25,032 | ||||||||||||
| Total current assets | 931,051 | 917,288 | ||||||||||||
| Property, plant and equipment, net | 1,773,329 | 1,802,411 | ||||||||||||
| Intangible assets, net | 485,148 | 526,394 | ||||||||||||
| Goodwill | 1,217,177 | 1,223,291 | ||||||||||||
| Investment in unconsolidated subsidiaries | 729,094 | 689,354 | ||||||||||||
| Operating lease right-of-use assets | 134,901 | 124,726 | ||||||||||||
| Other assets | 41,651 | 47,400 | ||||||||||||
| Deferred income taxes | 14,803 | 14,394 | ||||||||||||
| $ | 5,327,154 | $ | 5,345,258 | |||||||||||
| LIABILITIES AND STOCKHOLDERS' EQUITY | ||||||||||||||
| Current liabilities: | ||||||||||||||
| Current portion of long-term debt | $ | 42,758 | $ | 90,996 | ||||||||||
| Accounts payable, principally trade | 197,528 | 239,252 | ||||||||||||
| Income taxes payable | 16,474 | 8,895 | ||||||||||||
| Current operating lease liabilities | 39,532 | 37,805 | ||||||||||||
| Accrued expenses | 310,004 | 311,391 | ||||||||||||
| Total current liabilities | 606,296 | 688,339 | ||||||||||||
| Long-term debt, net of current portion | 1,553,118 | 1,558,429 | ||||||||||||
| Long-term operating lease liabilities | 99,482 | 91,424 | ||||||||||||
| Other noncurrent liabilities | 109,046 | 115,785 | ||||||||||||
| Deferred income taxes | 260,858 | 247,931 | ||||||||||||
| Total liabilities | 2,628,800 | 2,701,908 | ||||||||||||
| Commitments and contingencies | ||||||||||||||
| Total Darling's stockholders' equity | 2,633,360 | 2,565,819 | ||||||||||||
| Noncontrolling interests | 64,994 | 77,531 | ||||||||||||
| Total stockholders' equity | $ | 2,698,354 | $ | 2,643,350 | ||||||||||
| $ | 5,327,154 | $ | 5,345,258 | |||||||||||
| News Release August 5, 2020 Page 5 | ||||||||||
Darling Ingredients Inc. and Subsidiaries
Consolidated Operating Results
For the Three-Month and Six-Month Periods Ended June 27, 2020 and June 29, 2019
(in thousands, except per share data)
(unaudited)
| Three Months Ended | Six Months Ended | |||||||||||||||||||||||||||||||||||||
| $ Change | $ Change | |||||||||||||||||||||||||||||||||||||
| June 27, | June 29, | Favorable | June 27, | June 29, | Favorable | |||||||||||||||||||||||||||||||||
| 2020 | 2019 | (Unfavorable) | 2020 | 2019 | (Unfavorable) | |||||||||||||||||||||||||||||||||
| Net sales | $ | 848,673 | $ | 827,324 | $ | 21,349 | $ | 1,701,515 | $ | 1,662,428 | $ | 39,087 | ||||||||||||||||||||||||||
| Costs and expenses: | ||||||||||||||||||||||||||||||||||||||
| Cost of sales and operating expenses | 632,347 | 644,716 | 12,369 | 1,279,255 | 1,295,629 | 16,374 | ||||||||||||||||||||||||||||||||
Loss (gain) on sale of assets | 27 | (13,926) | (13,953) | 88 | (18,176) | (18,264) | ||||||||||||||||||||||||||||||||
Selling, general and administrative expenses | 90,193 | 81,017 | (9,176) | 186,386 | 166,020 | (20,366) | ||||||||||||||||||||||||||||||||
| Depreciation and amortization | 83,310 | 79,486 | (3,824) | 167,981 | 158,650 | (9,331) | ||||||||||||||||||||||||||||||||
| Total costs and expenses | 805,877 | 791,293 | (14,584) | 1,633,710 | 1,602,123 | (31,587) | ||||||||||||||||||||||||||||||||
| Equity in net income of Diamond Green Diesel | 63,492 | 38,093 | 25,399 | 161,312 | 62,370 | 98,942 | ||||||||||||||||||||||||||||||||
| Operating income | 106,288 | 74,124 | 32,164 | 229,117 | 122,675 | 106,442 | ||||||||||||||||||||||||||||||||
| Other expense: | ||||||||||||||||||||||||||||||||||||||
| Interest expense | (17,920) | (20,853) | 2,933 | (37,010) | (40,729) | 3,719 | ||||||||||||||||||||||||||||||||
| Debt extinguishment costs | — | (12,126) | 12,126 | — | (12,126) | 12,126 | ||||||||||||||||||||||||||||||||
| Foreign currency gain/(loss) | (1,134) | (388) | (746) | 530 | (1,120) | 1,650 | ||||||||||||||||||||||||||||||||
| Other income (expense), net | (1,485) | (2,019) | 534 | (3,366) | (4,544) | 1,178 | ||||||||||||||||||||||||||||||||
| Total other expense | (20,539) | (35,386) | 14,847 | (39,846) | (58,519) | 18,673 | ||||||||||||||||||||||||||||||||
Equity in net income/(loss) of unconsolidated subsidiaries | 692 | 82 | 610 | 1,561 | (422) | 1,983 | ||||||||||||||||||||||||||||||||
| Income before income taxes | 86,441 | 38,820 | 47,621 | 190,832 | 63,734 | 127,098 | ||||||||||||||||||||||||||||||||
| Income tax expense | 19,946 | 7,776 | (12,170) | 38,246 | 13,050 | (25,196) | ||||||||||||||||||||||||||||||||
| Net income | 66,495 | 31,044 | 35,451 | 152,586 | 50,684 | 101,902 | ||||||||||||||||||||||||||||||||
Net income attributable to noncontrolling interests | (1,056) | (4,786) | 3,730 | (1,637) | (6,414) | 4,777 | ||||||||||||||||||||||||||||||||
| Net income attributable to Darling | $ | 65,439 | $ | 26,258 | $ | 39,181 | $ | 150,949 | $ | 44,270 | $ | 106,679 | ||||||||||||||||||||||||||
| Basic income per share: | $ | 0.40 | $ | 0.16 | $ | 0.24 | $ | 0.93 | $ | 0.27 | $ | 0.66 | ||||||||||||||||||||||||||
| Diluted income per share: | $ | 0.39 | $ | 0.16 | $ | 0.23 | $ | 0.90 | $ | 0.26 | $ | 0.64 | ||||||||||||||||||||||||||
| Number of diluted common shares: | 165,999 | 168,432 | 166,963 | 168,546 | ||||||||||||||||||||||||||||||||||
| News Release August 5, 2020 Page 6 | ||||||||||
Darling Ingredients Inc. and Subsidiaries
Consolidated Statement of Cash Flows
Periods Ended June 27, 2020 and June 29, 2019
(in thousands)
(unaudited)
| Six Months Ended | |||||||||||
| June 27, | June 29, | ||||||||||
| Cash flows from operating activities: | 2020 | 2019 | |||||||||
| Net income | $ | 152,586 | $ | 50,684 | |||||||
| Adjustments to reconcile net income to net cash provided by operating activities: | |||||||||||
| Depreciation and amortization | 167,981 | 158,650 | |||||||||
| Loss/(gain) on disposal of property, plant, equipment and other assets | 88 | (18,176) | |||||||||
| Gain on insurance proceeds from insurance settlements | — | (845) | |||||||||
| Deferred taxes | 13,998 | (3,137) | |||||||||
| Increase (decrease) in long-term pension liability | (890) | 1,010 | |||||||||
| Stock-based compensation expense | 15,566 | 14,182 | |||||||||
| Write-off deferred loan costs | — | 4,547 | |||||||||
| Deferred loan cost amortization | 2,835 | 3,010 | |||||||||
| Equity in net income of Diamond Green Diesel and other unconsolidated subsidiaries | (162,873) | (61,948) | |||||||||
| Distribution of earnings from unconsolidated subsidiaries | 125,891 | 17,755 | |||||||||
| Changes in operating assets and liabilities, net of effects from acquisitions: | |||||||||||
| Accounts receivable | 26,077 | 27,218 | |||||||||
| Income taxes refundable/payable | 6,119 | 7,140 | |||||||||
| Inventories and prepaid expenses | (35,413) | (17,374) | |||||||||
| Accounts payable and accrued expenses | (33,375) | (29,849) | |||||||||
| Other | (14,941) | 1,437 | |||||||||
| Net cash provided by operating activities | 263,649 | 154,304 | |||||||||
| Cash flows from investing activities: | |||||||||||
| Capital expenditures | (123,204) | (167,871) | |||||||||
| Acquisition, net of cash acquired | — | (1,431) | |||||||||
| Investment of unconsolidated subsidiaries | — | (1,000) | |||||||||
| Gross proceeds from disposal of property, plant and equipment and other assets | 1,053 | 9,814 | |||||||||
| Proceeds from insurance settlement | — | 845 | |||||||||
| Payments related to routes and other intangibles | (3,712) | (3,150) | |||||||||
| Net cash used by investing activities | (125,863) | (162,793) | |||||||||
| Cash flows from financing activities: | |||||||||||
| Proceeds from long-term debt | 16,164 | 507,722 | |||||||||
| Payments on long-term debt | (18,239) | (526,230) | |||||||||
| Borrowings from revolving credit facility | 375,971 | 273,485 | |||||||||
| Payments on revolving credit facility | (405,800) | (266,884) | |||||||||
| Net cash overdraft financing | (26,461) | 11,178 | |||||||||
| Deferred loan costs | — | (7,003) | |||||||||
| Issuance of common stock | 67 | 12 | |||||||||
| Repurchase of common stock | (55,044) | — | |||||||||
| Minimum withholding taxes paid on stock awards | (4,863) | (3,193) | |||||||||
| Acquisition of noncontrolling interest | (8,784) | — | |||||||||
| Distributions to noncontrolling interests | (987) | — | |||||||||
| Net cash provided by financing activities | (127,976) | (10,913) | |||||||||
| Effect of exchange rate changes on cash flows | (6,567) | (853) | |||||||||
| Net increase/(decrease) in cash, cash equivalents and restricted cash | 3,243 | (20,255) | |||||||||
| Cash, cash equivalents and restricted cash at beginning of year | 73,045 | 107,369 | |||||||||
| Cash, cash equivalents and restricted cash at end of period | $ | 76,288 | $ | 87,114 | |||||||
| Supplemental disclosure of cash flow information: | |||||||||||
| Accrued capital expenditures | $ | 23 | $ | (7,542) | |||||||
| Cash paid during the period for: | |||||||||||
| Interest, net of capitalized interest | $ | 35,070 | $ | 45,196 | |||||||
| Income taxes, net of refunds | $ | 18,030 | $ | 12,607 | |||||||
| Non-cash operating activities: | |||||||||||
| Operating lease right of use asset obtained in exchange for new lease liabilities | $ | 28,801 | $ | 7,492 | |||||||
| Non-cash financing activities: | |||||||||||
| Debt issued for service contract assets | $ | 21 | $ | — | |||||||
| News Release August 5, 2020 Page 7 | ||||||||||
Diamond Green Diesel Joint Venture
Condensed Consolidated Balance Sheets
June 30, 2020 and December 31, 2019
(in thousands)
| June 30, | December 31, | ||||||||||
| 2020 | 2019 | ||||||||||
| (unaudited) | |||||||||||
| Assets: | |||||||||||
| Total current assets | $ | 581,334 | $ | 668,026 | |||||||
| Property, plant and equipment, net | 894,415 | 713,489 | |||||||||
| Other assets | 27,959 | 30,710 | |||||||||
| Total assets | $ | 1,503,708 | $ | 1,412,225 | |||||||
| Liabilities and members' equity: | |||||||||||
| Total current portion of long term debt | $ | 495 | $ | 341 | |||||||
| Total other current liabilities | 89,533 | 75,802 | |||||||||
| Total long term debt | 8,969 | 8,742 | |||||||||
| Total other long term liabilities | 4,023 | 4,422 | |||||||||
| Total members' equity | 1,400,688 | 1,322,918 | |||||||||
| Total liabilities and members' equity | $ | 1,503,708 | $ | 1,412,225 | |||||||
Diamond Green Diesel Joint Venture
Operating Financial Results
For the Three-Month and Six-Month Periods Ended June 30, 2020 and June 30, 2019
(in thousands)
(unaudited)
| Three Months Ended | Six Months Ended | |||||||||||||||||||||||||||||||||||||
| $ Change | $ Change | |||||||||||||||||||||||||||||||||||||
| June 30, | June 30, | Favorable | June 30, | June 30, | Favorable | |||||||||||||||||||||||||||||||||
| 2020 | 2019 | (Unfavorable) | 2020 | 2019 | (Unfavorable) | |||||||||||||||||||||||||||||||||
| Revenues: | ||||||||||||||||||||||||||||||||||||||
| Operating revenues | $ | 295,826 | $ | 294,811 | $ | 1,015 | $ | 654,441 | $ | 597,529 | $ | 56,912 | ||||||||||||||||||||||||||
| Expenses: | ||||||||||||||||||||||||||||||||||||||
Total costs and expenses less depreciation, amortization and accretion expense | 157,611 | 207,024 | 49,413 | 308,958 | 450,087 | 141,129 | ||||||||||||||||||||||||||||||||
Depreciation, amortization and accretion expense | 11,114 | 11,914 | 800 | 22,888 | 23,332 | 444 | ||||||||||||||||||||||||||||||||
| Total costs and expenses | 168,725 | 218,938 | 50,213 | 331,846 | 473,419 | 141,573 | ||||||||||||||||||||||||||||||||
| Operating income | 127,101 | 75,873 | 51,228 | 322,595 | 124,110 | 198,485 | ||||||||||||||||||||||||||||||||
| Other income | 200 | 634 | (434) | 661 | 1,275 | (614) | ||||||||||||||||||||||||||||||||
| Interest and debt expense, net | (317) | (321) | 4 | (632) | (645) | 13 | ||||||||||||||||||||||||||||||||
| Net income | $ | 126,984 | $ | 76,186 | $ | 50,798 | $ | 322,624 | $ | 124,740 | $ | 197,884 | ||||||||||||||||||||||||||
| News Release August 5, 2020 Page 8 | ||||||||||
Darling Ingredients Inc. reports Adjusted EBITDA results, which is a Non-GAAP financial measure, as a complement to results provided in accordance with generally accepted accounting principles (GAAP) (for additional information, see “Use of Non-GAAP Financial Measures” included later in this media release). The Company believes that Adjusted EBITDA provides additional useful information to investors. Adjusted EBITDA, as the Company uses the term, is calculated below:
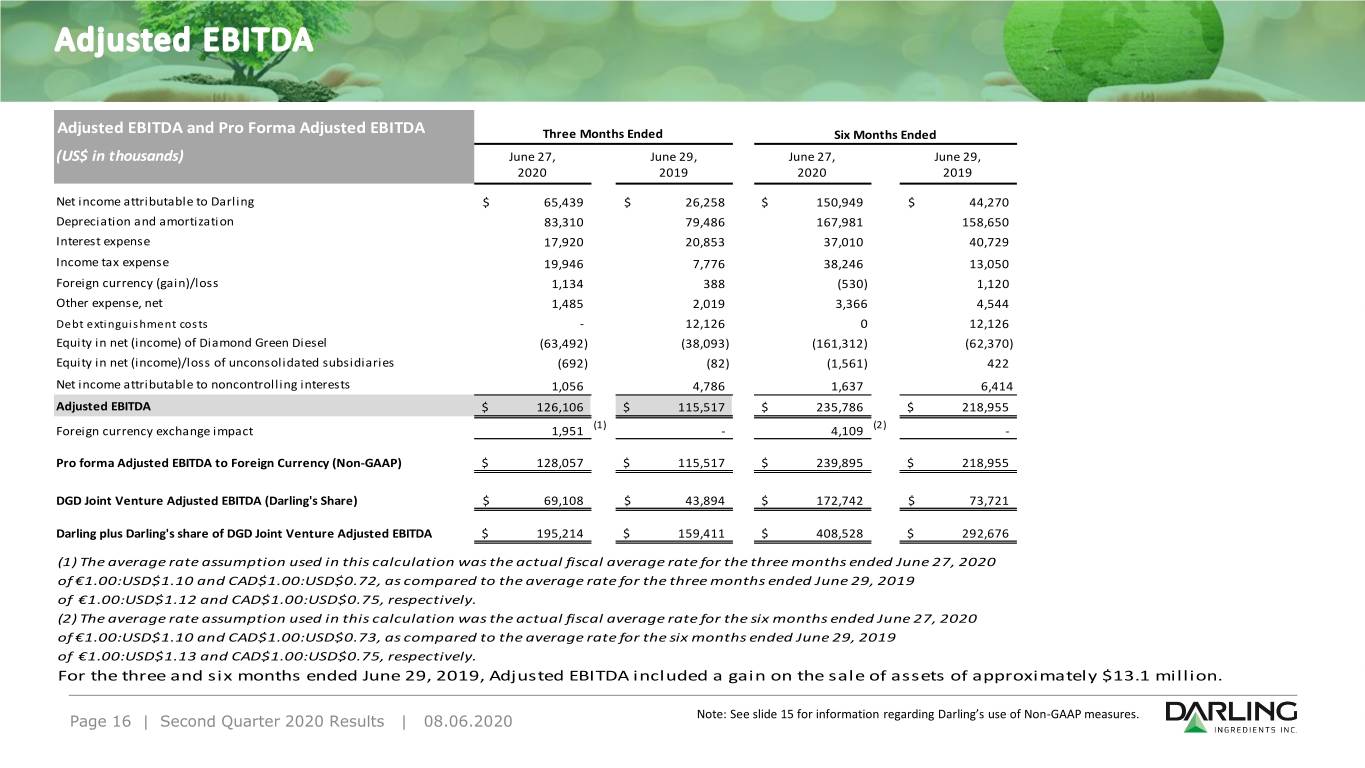
Reconciliation of Net Income to (Non-GAAP) Adjusted EBITDA and (Non-GAAP) Pro forma Adjusted EBITDA For the Three-Month and Six-Month Periods ended June 27, 2020 and June 29, 2019
| Three Months Ended | Six Months Ended | |||||||||||||||||||||||||
| Adjusted EBITDA | June 27, | June 29, | June 27, | June 29, | ||||||||||||||||||||||
| (U.S. dollars in thousands) | 2020 | 2019 | 2020 | 2019 | ||||||||||||||||||||||
| Net income attributable to Darling | $ | 65,439 | $ | 26,258 | $ | 150,949 | $ | 44,270 | ||||||||||||||||||
| Depreciation and amortization | 83,310 | 79,486 | 167,981 | 158,650 | ||||||||||||||||||||||
| Interest expense | 17,920 | 20,853 | 37,010 | 40,729 | ||||||||||||||||||||||
| Income tax expense | 19,946 | 7,776 | 38,246 | 13,050 | ||||||||||||||||||||||
| Foreign currency loss/(gain) | 1,134 | 388 | (530) | 1,120 | ||||||||||||||||||||||
| Other expense, net | 1,485 | 2,019 | 3,366 | 4,544 | ||||||||||||||||||||||
| Debt extinguishment costs | — | 12,126 | — | 12,126 | ||||||||||||||||||||||
| Equity in net (income) of Diamond Green Diesel | (63,492) | (38,093) | (161,312) | (62,370) | ||||||||||||||||||||||
| Equity in net (income)/loss of unconsolidated subsidiaries | (692) | (82) | (1,561) | 422 | ||||||||||||||||||||||
| Net income attributable to noncontrolling interests | 1,056 | 4,786 | 1,637 | 6,414 | ||||||||||||||||||||||
| Adjusted EBITDA (Non-GAAP) | $ | 126,106 | $ | 115,517 | $ | 235,786 | $ | 218,955 | ||||||||||||||||||
| Foreign currency exchange impact | 1,951 | (1) | — | 4,109 | (2) | — | ||||||||||||||||||||
| Pro forma Adjusted EBITDA to Foreign Currency (Non-GAAP) | $ | 128,057 | $ | 115,517 | $ | 239,895 | $ | 218,955 | ||||||||||||||||||
| DGD Joint Venture Adjusted EBITDA (Darling's share) | $ | 69,108 | $ | 43,894 | $ | 172,742 | $ | 73,721 | ||||||||||||||||||
| Darling plus Darling's share of DGD Joint Venture Adjusted EBITDA | $ | 195,214 | $ | 159,411 | $ | 408,528 | $ | 292,676 | ||||||||||||||||||
| (1) The average rates assumption used in the calculation was the actual fiscal average rate for the three months ended June 27, 2020 of €1.00:USD$1.10 and CAD$1.00:USD$0.72 as compared to the average rate for the three months ended June 29, 2019 of €1.00:USD$1.12 and CAD$1.00:USD $0.75, respectively. (2) The average rates assumption used in the calculation was the actual fiscal average rate for the six months ended June 27, 2020 of €1.00:USD$1.10 and CAD$1.00:USD$0.73 as compared to the average rate for the six months ended June 29, 2019 of €1.00:USD$1.13 and CAD$1.00:USD$0.75, respectively. | ||||||||||||||||||||||||||
For the three and six months ended June 29, 2019, Adjusted EBITDA included a gain on the sale of assets of approximately $13.1 million.
About Darling
Darling Ingredients Inc. is a global developer and producer of sustainable natural ingredients from edible and inedible bio-nutrients, creating a wide range of ingredients and specialty solutions for customers in the pharmaceutical, food, pet food, feed, technical, fuel, bioenergy, and fertilizer industries. With operations on five continents, the Company collects and transforms all aspects of animal by-product streams into useable and specialty ingredients, such as collagen, edible fats, feed-grade fats, animal proteins and meals, plasma, pet food ingredients, organic fertilizers, yellow grease, fuel feedstocks, green energy, natural casings and hides. The Company also recovers and converts recycled oils (used cooking oil and animal fats) into valuable feed and fuel ingredients and collects and processes residual bakery products into feed ingredients. In addition, the Company provides environmental services, such as grease trap collection and disposal services to food service establishments. The Company sells its products domestically and internationally and operates within three industry segments: Feed Ingredients, Food Ingredients and Fuel Ingredients. For additional information, visit the Company's website at http://www.darlingii.com.
| News Release August 5, 2020 Page 9 | ||||||||||
Darling Ingredients Inc. will host a conference call to discuss the Company’s second quarter 2020 financial results at 9:00 am Eastern Time (8:00 am Central Time) on Thursday, August 6, 2020. To listen to the conference call, participants calling from within North America should dial 1-844-868-8847; international participants should dial 1-412-317-6593. Please refer to access code 10146331. Please call approximately ten minutes before the start of the call to ensure that you are connected.
The call will also be available as a live audio webcast that can be accessed on the Company website at http://ir.darlingii.com. Beginning one hour after its completion, a replay of the call can be accessed through August 13, 2020, by dialing 1-877-344-7529 (U.S. callers), 1-855-669-9658 (Canada) and 1-412-317-0088 (international callers). The access code for the replay is 10146331. The conference call will also be archived on the Company’s website.
Use of Non-GAAP Financial Measures:
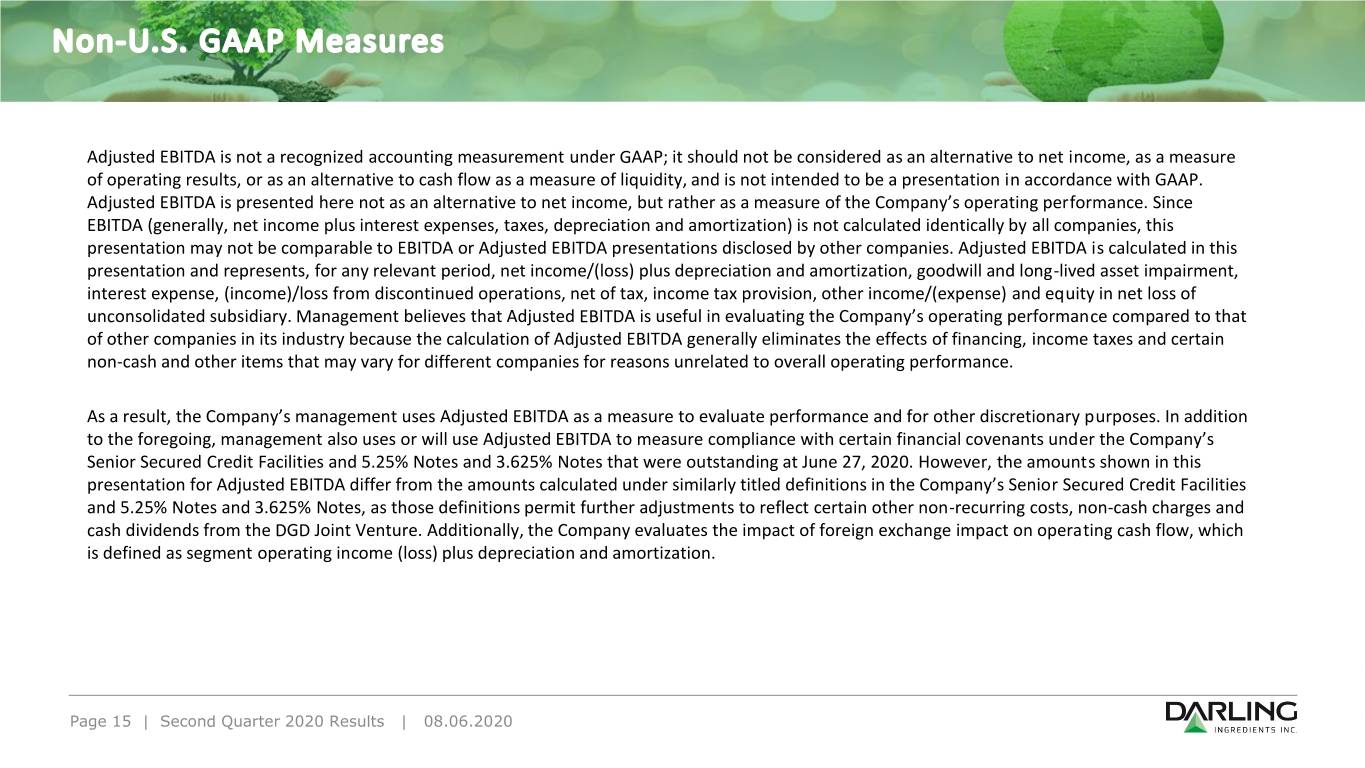
Adjusted EBITDA is not a recognized accounting measurement under GAAP; it should not be considered as an alternative to net income, as a measure of operating results, or as an alternative to cash flow as a measure of liquidity and is not intended to be a presentation in accordance with GAAP. Adjusted EBITDA is presented here not as an alternative to net income, but rather as a measure of the Company’s operating performance. Since EBITDA (generally, net income plus interest expenses, taxes, depreciation and amortization) is not calculated identically by all companies, this presentation may not be comparable to EBITDA or Adjusted EBITDA presentations disclosed by other companies. Adjusted EBITDA is calculated in this presentation and represents, for any relevant period, net income/(loss) plus depreciation and amortization, goodwill and long-lived asset impairment, interest expense, (income)/loss from discontinued operations, net of tax, income tax provision, other income/(expense) and equity in net loss of unconsolidated subsidiary. Management believes that Adjusted EBITDA is useful in evaluating the Company’s operating performance compared to that of other companies in its industry because the calculation of Adjusted EBITDA generally eliminates the effects of financing, income taxes and certain non-cash and other items that may vary for different companies for reasons unrelated to overall operating performance.
As a result, the Company’s management uses Adjusted EBITDA as a measure to evaluate performance and for other discretionary purposes. In addition to the foregoing, management also uses or will use Adjusted EBITDA to measure compliance with certain financial covenants under the Company’s Senior Secured Credit Facilities and 5.25% Notes and 3.625% Notes that were outstanding at June 27, 2020. However, the amounts shown in this presentation for Adjusted EBITDA differ from the amounts calculated under similarly titled definitions in the Company’s Senior Secured Credit Facilities and 5.25% Notes and 3.625% Notes, as those definitions permit further adjustments to reflect certain other non-recurring costs, non-cash charges and cash dividends from the DGD Joint Venture. Additionally, the Company evaluates the impact of foreign exchange impact on operating cash flow, which is defined as segment operating income (loss) plus depreciation and amortization.
Cautionary Statements Regarding Forward-Looking Information:
{This media release contains “forward-looking” statements regarding the business operations and prospects of Darling Ingredients Inc. and industry factors affecting it. These statements are identified by words such as “believe,” “anticipate,” “expect,” “estimate,” “intend,” “could,” “may,” “will,” “should,” “planned,” “potential,” “continue,” “momentum,” and other words referring to events that may occur in the future. These statements reflect Darling Ingredient’s current view of future events and are based on its assessment of, and are subject to, a variety of risks and uncertainties beyond its control, each of which could cause actual results to differ materially from those indicated in the forward-looking statements. These factors include, among others, existing and unknown future limitations on the ability of the Company's direct and indirect subsidiaries to make their cash flow available to the Company for payments on the Company's indebtedness or other purposes; global demands for bio-fuels and grain and oilseed commodities, which have exhibited volatility, and can impact the cost of feed for cattle, hogs and poultry, thus affecting available rendering feedstock and selling prices for the Company’s products; reductions in raw material volumes available to the Company due to weak margins in the meat production industry as a result of higher feed costs, reduced consumer demand or other factors, reduced volume from food service establishments, or otherwise; reduced demand for animal feed; reduced finished product prices, including a decline in fat and used cooking oil finished product prices; changes to worldwide government policies relating to renewable fuels
| News Release August 5, 2020 Page 10 | ||||||||||
and greenhouse gas(“GHG”) emissions that adversely affect programs like the U.S. government’s renewable fuel standard, low carbon fuel standards (“LCFS”) and tax credits for biofuels both in the United States and abroad; possible product recall resulting from developments relating to the discovery of unauthorized adulterations to food or food additives; the occurrence of 2009 H1N1 flu (initially known as “Swine Flu”), Highly pathogenic strains of avian influenza (collectively known as “Bird Flu”), severe acute respiratory syndrome (“SARS”), bovine spongiform encephalopathy (or "BSE"), porcine epidemic diarrhea ("PED") or other diseases associated with animal origin in the United States or elsewhere, such as the outbreak of African Swine Fever (“ASF”) in China and elsewhere; the occurrence of pandemics, epidemics or disease outbreaks, such as the current COVID-19 outbreak; unanticipated costs and/or reductions in raw material volumes related to the Company’s compliance with the existing or unforeseen new U.S. or foreign (including, without limitation, China) regulations (including new or modified animal feed, Bird Flu, SARS, PED, BSE, ASF or similar or unanticipated regulations) affecting the industries in which the Company operates or its value added products; risks associated with the DGD Joint Venture, including possible unanticipated operating disruptions and issues relating to the announced expansion project; risks and uncertainties relating to international sales and operations, including imposition of tariffs, quotas, trade barriers and other trade protections imposed by foreign countries; difficulties or a significant disruption in our information systems or failure to implement new systems and software successfully, risks relating to possible third party claims of intellectual property infringement; increased contributions to the Company’s pension and benefit plans, including multiemployer and employer-sponsored defined benefit pension plans as required by legislation, regulation or other applicable U.S. or foreign law or resulting from a U.S. mass withdrawal event; bad debt write-offs; loss of or failure to obtain necessary permits and registrations; continued or escalated conflict in the Middle East, North Korea, Ukraine or elsewhere; uncertainty regarding the exit of the U.K. from the European Union; and/or unfavorable export or import markets. These factors, coupled with volatile prices for natural gas and diesel fuel, climate conditions, currency exchange fluctuations, general performance of the U.S. and global economies, disturbances in world financial, credit, commodities and stock markets, and any decline in consumer confidence and discretionary spending, including the inability of consumers and companies to obtain credit due to lack of liquidity in the financial markets, among others, could cause actual results to vary materially from the forward looking statements included in this release or negatively impact the Company's results of operations. Among other things, future profitability may be affected by the Company’s ability to grow its business, which faces competition from companies that may have substantially greater resources than the Company. The Company’s announced share repurchase program may be suspended or discontinued at any time and purchases of shares under the program are subject to market conditions and other factors, which are likely to change from time to time. Other risks and uncertainties regarding Darling Ingredients Inc., its business and the industries in which it operates are referenced from time to time in the Company’s filings with the Securities and Exchange Commission. Darling Ingredients Inc. is under no obligation to (and expressly disclaims any such obligation to) update or alter its forward-looking statements whether as a result of new information, future events or otherwise.}
For More Information, contact:
Jim Stark, Vice President, Investor Relations Email : [email protected]
5601 MacArthur Blvd., Irving, Texas 75038 Phone : 972-281-4823
Exhibit 99.2 Second Quarter 2020 Conference Call
This presentation contains “forward-looking” statements that are subject to risks and uncertainties that could cause the actual results of Darling Ingredients Inc. (the “Company”) to differ materially from those expressed or implied in the statements. Statements that are not statements of historical facts are forward-looking statements and are made pursuant to the safe harbor provisions of the Private Securities Litigation Reform Act of 1995. Words such as “estimate,” “project,” “planned,” “contemplate,” “potential,” “possible,” “proposed,” “intend,” “believe,” “anticipate,” “expect,” “may,” “will,” “would,” “should,” “could” and similar expressions are intended to identify forward-looking statements. Forward-looking statements are based on the Company’s current expectations and assumptions regarding its business, the economy and other future conditions. The Company cautions readers that any such forward-looking statements it makes are not guarantees of future performance and that actual results may differ materially from anticipated results or expectations expressed in its forward-looking statements as a result of a variety of factors, including many that are beyond the Company’s control. These factors include, among others, existing and unknown future limitations on the ability of the Company's direct and indirect subsidiaries to make their cash flow available to the Company for payments on the Company's indebtedness or other purposes; global demands for bio-fuels and grain and oilseed commodities, which have exhibited volatility, and can impact the cost of feed for cattle, hogs and poultry, thus affecting available rendering feedstock and selling prices for the Company’s products; reductions in raw material volumes available to the Company due to weak margins in the meat production industry as a result of higher feed costs, reduced consumer demand or other factors, reduced volume from food service establishments, or otherwise; reduced demand for animal feed; reduced finished product prices, including a decline in fat and used cooking oil finished product prices; changes to worldwide government policies relating to renewable fuels and greenhouse gas(“GHG”) emissions that adversely affect programs like the U.S. government’s renewable fuel standard, low carbon fuel standards (“LCFS”) and tax credits for biofuels both in the United States and abroad; possible product recall resulting from developments relating to the discovery of unauthorized adulterations to food or food additives; the occurrence of 2009 H1N1 flu (initially known as “Swine Flu”), Highly pathogenic strains of avian influenza (collectively known as “Bird Flu”), severe acute respiratory syndrome (“SARS”), bovine spongiform encephalopathy (or "BSE"), porcine epidemic diarrhea ("PED") or other diseases associated with animal origin in the United States or elsewhere, such as the outbreak of African Swine Fever (“ASF”) in China and elsewhere; the occurrence of pandemics, epidemics or disease outbreaks, such as the current COVID-19 outbreak; unanticipated costs and/or reductions in raw material volumes related to the Company’s compliance with the existing or unforeseen new U.S. or foreign (including, without limitation, China) regulations (including new or modified animal feed, Bird Flu, SARS, PED, BSE, ASF or similar or unanticipated regulations) affecting the industries in which the Company operates or its value added products; risks associated with the DGD Joint Venture, including possible unanticipated operating disruptions and issues relating to the announced expansion project; risks and uncertainties relating to international sales and operations, including imposition of tariffs, quotas, trade barriers and other trade protections imposed by foreign countries; difficulties or a significant disruption in our information systems or failure to implement new systems and software successfully, risks relating to possible third party claims of intellectual property infringement; increased contributions to the Company’s pension and benefit plans, including multiemployer and employer-sponsored defined benefit pension plans as required by legislation, regulation or other applicable U.S. or foreign law or resulting from a U.S. mass withdrawal event; bad debt write-offs; loss of or failure to obtain necessary permits and registrations; continued or escalated conflict in the Middle East, North Korea, Ukraine or elsewhere; uncertainty regarding the exit of the U.K. from the European Union; and/or unfavorable export or import markets. These factors, coupled with volatile prices for natural gas and diesel fuel, climate conditions, currency exchange fluctuations, general performance of the U.S. and global economies, disturbances in world financial, credit, commodities and stock markets, and any decline in consumer confidence and discretionary spending, including the inability of consumers and companies to obtain credit due to lack of liquidity in the financial markets, among others, could cause actual results to vary materially from the forward looking statements included in this release or negatively impact the Company's results of operations. Among other things, future profitability may be affected by the Company’s ability to grow its business, which faces competition from companies that may have substantially greater resources than the Company. The Company’s announced share repurchase program may be suspended or discontinued at any time and purchases of shares under the program are subject to market conditions and other factors, which are likely to change from time to time. Other risks and uncertainties regarding Darling Ingredients Inc., its business and the industries in which it operates are referenced from time to time in the Company’s filings with the Securities and Exchange Commission. Darling Ingredients Inc. is under no obligation to (and expressly disclaims any such obligation to) update or alter its forward-looking statements whether as a result of new information, future events or otherwise. Page 2 | Second Quarter 2020 Results | 08.06.2020
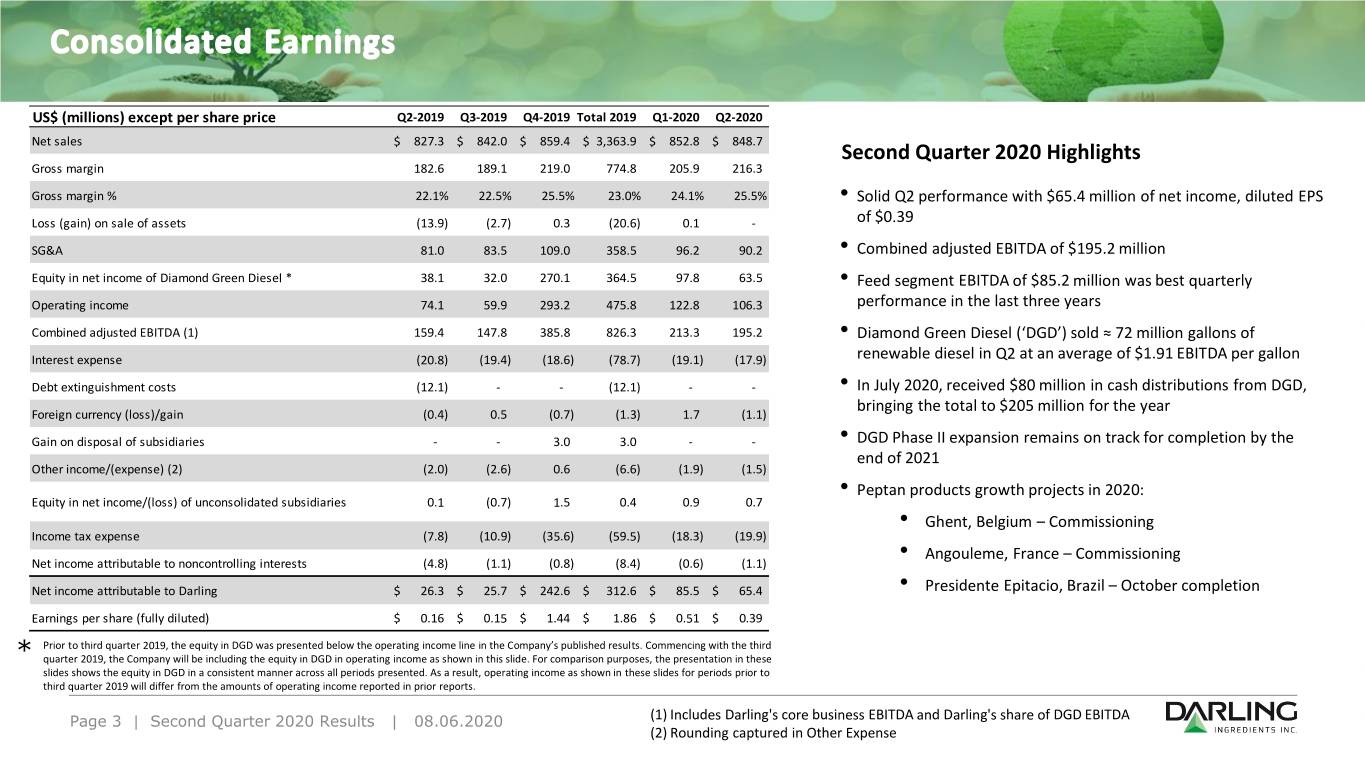
US$ (millions) except per share price Q2-2019 Q3-2019 Q4-2019 Total 2019 Q1-2020 Q2-2020 Net sales $ 827.3 $ 842.0 $ 859.4 $ 3,363.9 $ 852.8 $ 848.7 Second Quarter 2020 Highlights Gross margin 182.6 189.1 219.0 774.8 205.9 216.3 Gross margin % 22.1% 22.5% 25.5% 23.0% 24.1% 25.5% • Solid Q2 performance with $65.4 million of net income, diluted EPS Loss (gain) on sale of assets (13.9) (2.7) 0.3 (20.6) 0.1 - of $0.39 SG&A 81.0 83.5 109.0 358.5 96.2 90.2 • Combined adjusted EBITDA of $195.2 million Equity in net income of Diamond Green Diesel * 38.1 32.0 270.1 364.5 97.8 63.5 • Feed segment EBITDA of $85.2 million was best quarterly Operating income 74.1 59.9 293.2 475.8 122.8 106.3 performance in the last three years Combined adjusted EBITDA (1) 159.4 147.8 385.8 826.3 213.3 195.2 • Diamond Green Diesel (‘DGD’) sold ≈ 72 million gallons of Interest expense (20.8) (19.4) (18.6) (78.7) (19.1) (17.9) renewable diesel in Q2 at an average of $1.91 EBITDA per gallon Debt extinguishment costs (12.1) - - (12.1) - - • In July 2020, received $80 million in cash distributions from DGD, bringing the total to $205 million for the year Foreign currency (loss)/gain (0.4) 0.5 (0.7) (1.3) 1.7 (1.1) Gain on disposal of subsidiaries - - 3.0 3.0 - - • DGD Phase II expansion remains on track for completion by the end of 2021 Other income/(expense) (2) (2.0) (2.6) 0.6 (6.6) (1.9) (1.5) • Peptan products growth projects in 2020: Equity in net income/(loss) of unconsolidated subsidiaries 0.1 (0.7) 1.5 0.4 0.9 0.7 • Ghent, Belgium – Commissioning Income tax expense (7.8) (10.9) (35.6) (59.5) (18.3) (19.9) • Angouleme, France – Commissioning Net income attributable to noncontrolling interests (4.8) (1.1) (0.8) (8.4) (0.6) (1.1) Net income attributable to Darling $ 26.3 $ 25.7 $ 242.6 $ 312.6 $ 85.5 $ 65.4 • Presidente Epitacio, Brazil – October completion Earnings per share (fully diluted) $ 0.16 $ 0.15 $ 1.44 $ 1.86 $ 0.51 $ 0.39 Prior to third quarter 2019, the equity in DGD was presented below the operating income line in the Company’s published results. Commencing with the third * quarter 2019, the Company will be including the equity in DGD in operating income as shown in this slide. For comparison purposes, the presentation in these slides shows the equity in DGD in a consistent manner across all periods presented. As a result, operating income as shown in these slides for periods prior to third quarter 2019 will differ from the amounts of operating income reported in prior reports. Page 3 | Second Quarter 2020 Results | 08.06.2020 (1) Includes Darling's core business EBITDA and Darling's share of DGD EBITDA (2) Rounding captured in Other Expense
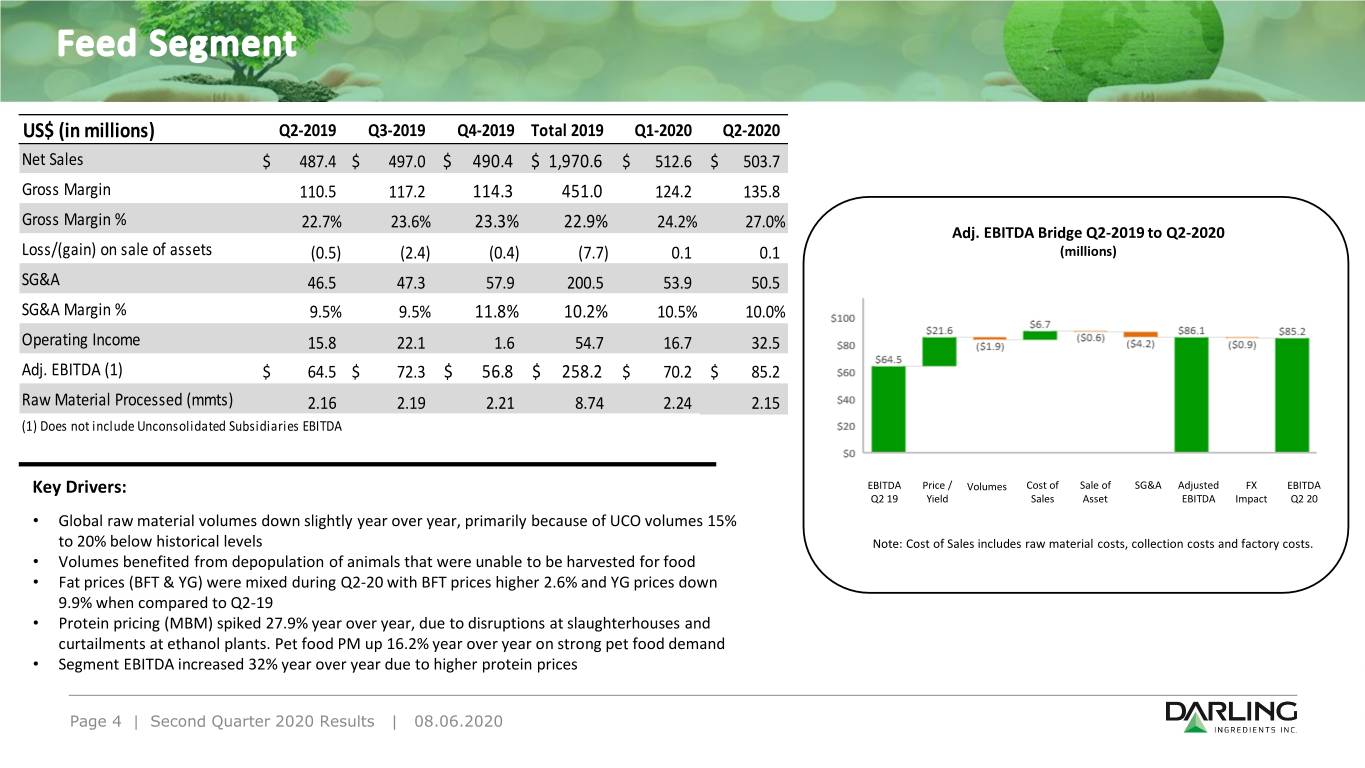
US$ (in millions) Q2-2019 Q3-2019 Q4-2019 Total 2019 Q1-2020 Q2-2020 Net Sales $ 487.4 $ 497.0 $ 490.4 $ 1,970.6 $ 512.6 $ 503.7 Gross Margin 110.5 117.2 114.3 451.0 124.2 135.8 Gross Margin % 22.7% 23.6% 23.3% 22.9% 24.2% 27.0% Adj. EBITDA Bridge Q2-2019 to Q2-2020 Loss/(gain) on sale of assets (0.5) (2.4) (0.4) (7.7) 0.1 0.1 (millions) SG&A 46.5 47.3 57.9 200.5 53.9 50.5 SG&A Margin % 9.5% 9.5% 11.8% 10.2% 10.5% 10.0% Operating Income 15.8 22.1 1.6 54.7 16.7 32.5 Adj. EBITDA (1) $ 64.5 $ 72.3 $ 56.8 $ 258.2 $ 70.2 $ 85.2 Raw Material Processed (mmts) 2.16 2.19 2.21 8.74 2.24 2.15 (1) Does not include Unconsolidated Subsidiaries EBITDA Key Drivers: EBITDA Price / Volumes Cost of Sale of SG&A Adjusted FX EBITDA Q2 19 Yield Sales Asset EBITDA Impact Q2 20 • Global raw material volumes down slightly year over year, primarily because of UCO volumes 15% to 20% below historical levels Note: Cost of Sales includes raw material costs, collection costs and factory costs. • Volumes benefited from depopulation of animals that were unable to be harvested for food • Fat prices (BFT & YG) were mixed during Q2-20 with BFT prices higher 2.6% and YG prices down 9.9% when compared to Q2-19 • Protein pricing (MBM) spiked 27.9% year over year, due to disruptions at slaughterhouses and curtailments at ethanol plants. Pet food PM up 16.2% year over year on strong pet food demand • Segment EBITDA increased 32% year over year due to higher protein prices Page 4 | Second Quarter 2020 Results | 08.06.2020
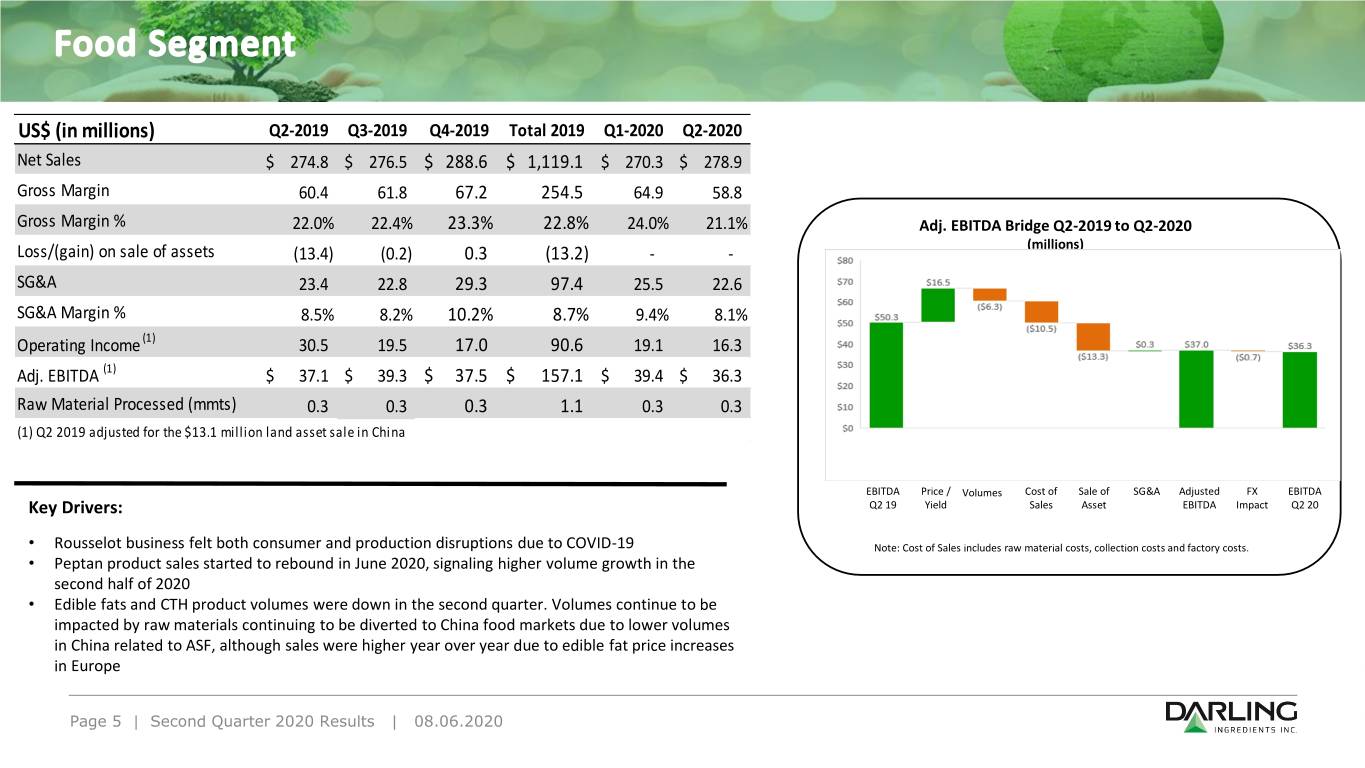
US$ (in millions) Q2-2019 Q3-2019 Q4-2019 Total 2019 Q1-2020 Q2-2020 Net Sales $ 274.8 $ 276.5 $ 288.6 $ 1,119.1 $ 270.3 $ 278.9 Gross Margin 60.4 61.8 67.2 254.5 64.9 58.8 Gross Margin % 22.0% 22.4% 23.3% 22.8% 24.0% 21.1% Adj. EBITDA Bridge Q2-2019 to Q2-2020 (millions) Loss/(gain) on sale of assets (13.4) (0.2) 0.3 (13.2) - - SG&A 23.4 22.8 29.3 97.4 25.5 22.6 SG&A Margin % 8.5% 8.2% 10.2% 8.7% 9.4% 8.1% Operating Income (1) 30.5 19.5 17.0 90.6 19.1 16.3 Adj. EBITDA (1) $ 37.1 $ 39.3 $ 37.5 $ 157.1 $ 39.4 $ 36.3 Raw Material Processed (mmts) 0.3 0.3 0.3 1.1 0.3 0.3 (1) Q2 2019 adjusted for the $13.1 million land asset sale in China EBITDA Price / Volumes Cost of Sale of SG&A Adjusted FX EBITDA Key Drivers: Q2 19 Yield Sales Asset EBITDA Impact Q2 20 • Rousselot business felt both consumer and production disruptions due to COVID-19 Note: Cost of Sales includes raw material costs, collection costs and factory costs. • Peptan product sales started to rebound in June 2020, signaling higher volume growth in the second half of 2020 • Edible fats and CTH product volumes were down in the second quarter. Volumes continue to be impacted by raw materials continuing to be diverted to China food markets due to lower volumes in China related to ASF, although sales were higher year over year due to edible fat price increases in Europe Page 5 | Second Quarter 2020 Results | 08.06.2020
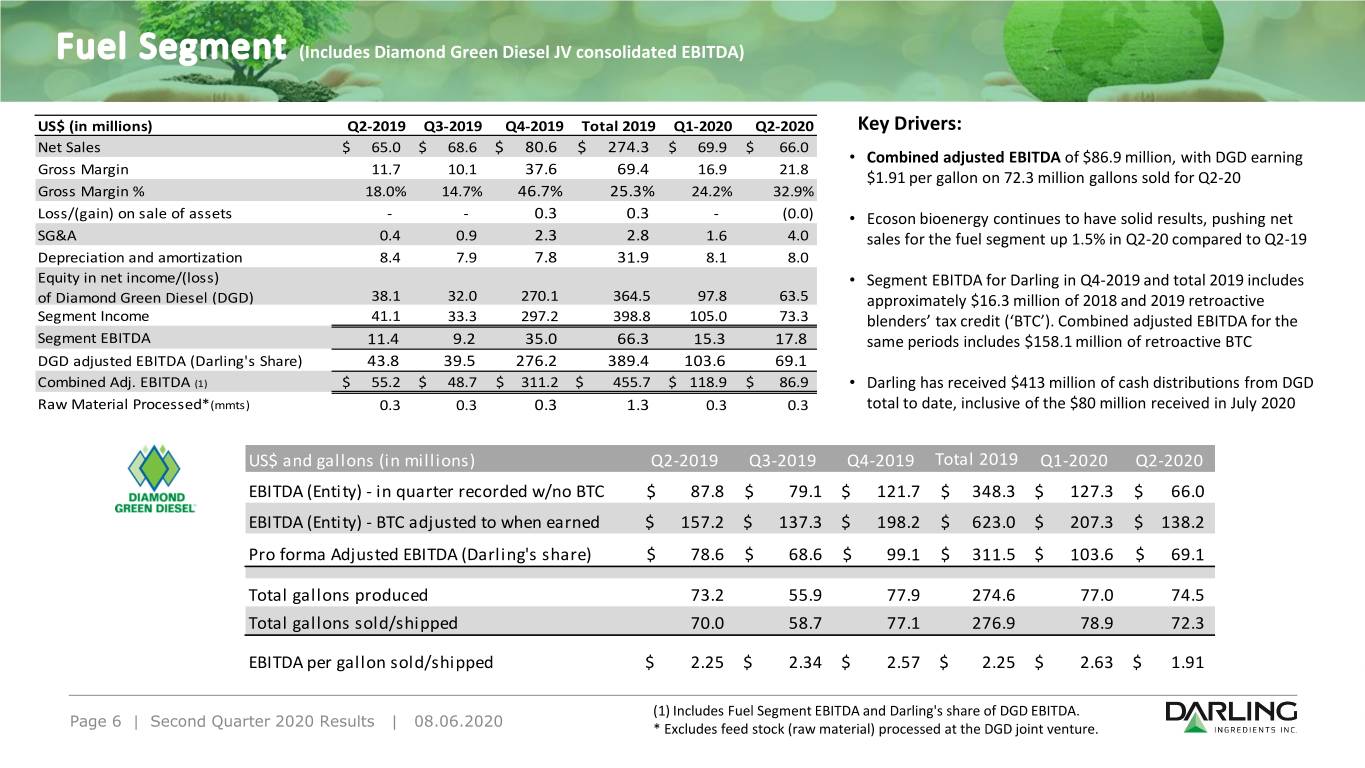
(Includes Diamond Green Diesel JV consolidated EBITDA) US$ (in millions) Q2-2019 Q3-2019 Q4-2019 Total 2019 Q1-2020 Q2-2020 Key Drivers: Net Sales $ 65.0 $ 68.6 $ 80.6 $ 274.3 $ 69.9 $ 66.0 • Combined adjusted EBITDA of $86.9 million, with DGD earning Gross Margin 11.7 10.1 37.6 69.4 16.9 21.8 $1.91 per gallon on 72.3 million gallons sold for Q2-20 Gross Margin % 18.0% 14.7% 46.7% 25.3% 24.2% 32.9% Loss/(gain) on sale of assets - - 0.3 0.3 - (0.0) • Ecoson bioenergy continues to have solid results, pushing net SG&A 0.4 0.9 2.3 2.8 1.6 4.0 sales for the fuel segment up 1.5% in Q2-20 compared to Q2-19 Depreciation and amortization 8.4 7.9 7.8 31.9 8.1 8.0 Equity in net income/(loss) • Segment EBITDA for Darling in Q4-2019 and total 2019 includes of Diamond Green Diesel (DGD) 38.1 32.0 270.1 364.5 97.8 63.5 approximately $16.3 million of 2018 and 2019 retroactive Segment Income 41.1 33.3 297.2 398.8 105.0 73.3 blenders’ tax credit (‘BTC’). Combined adjusted EBITDA for the Segment EBITDA 11.4 9.2 35.0 66.3 15.3 17.8 same periods includes $158.1 million of retroactive BTC DGD adjusted EBITDA (Darling's Share) 43.8 39.5 276.2 389.4 103.6 69.1 Combined Adj. EBITDA (1) $ 55.2 $ 48.7 $ 311.2 $ 455.7 $ 118.9 $ 86.9 • Darling has received $413 million of cash distributions from DGD Raw Material Processed*(mmts) 0.3 0.3 0.3 1.3 0.3 0.3 total to date, inclusive of the $80 million received in July 2020 US$ and gallons (in millions) Q2-2019 Q3-2019 Q4-2019 Total 2019 Q1-2020 Q2-2020 EBITDA (Entity) - in quarter recorded w/no BTC $ 87.8 $ 79.1 $ 121.7 $ 348.3 $ 127.3 $ 66.0 EBITDA (Entity) - BTC adjusted to when earned $ 157.2 $ 137.3 $ 198.2 $ 623.0 $ 207.3 $ 138.2 Pro forma Adjusted EBITDA (Darling's share) $ 78.6 $ 68.6 $ 99.1 $ 311.5 $ 103.6 $ 69.1 Total gallons produced 73.2 55.9 77.9 274.6 77.0 74.5 Total gallons sold/shipped 70.0 58.7 77.1 276.9 78.9 72.3 EBITDA per gallon sold/shipped $ 2.25 $ 2.34 $ 2.57 $ 2.25 $ 2.63 $ 1.91 (1) Includes Fuel Segment EBITDA and Darling's share of DGD EBITDA. Page 6 | Second Quarter 2020 Results | 08.06.2020 * Excludes feed stock (raw material) processed at the DGD joint venture.
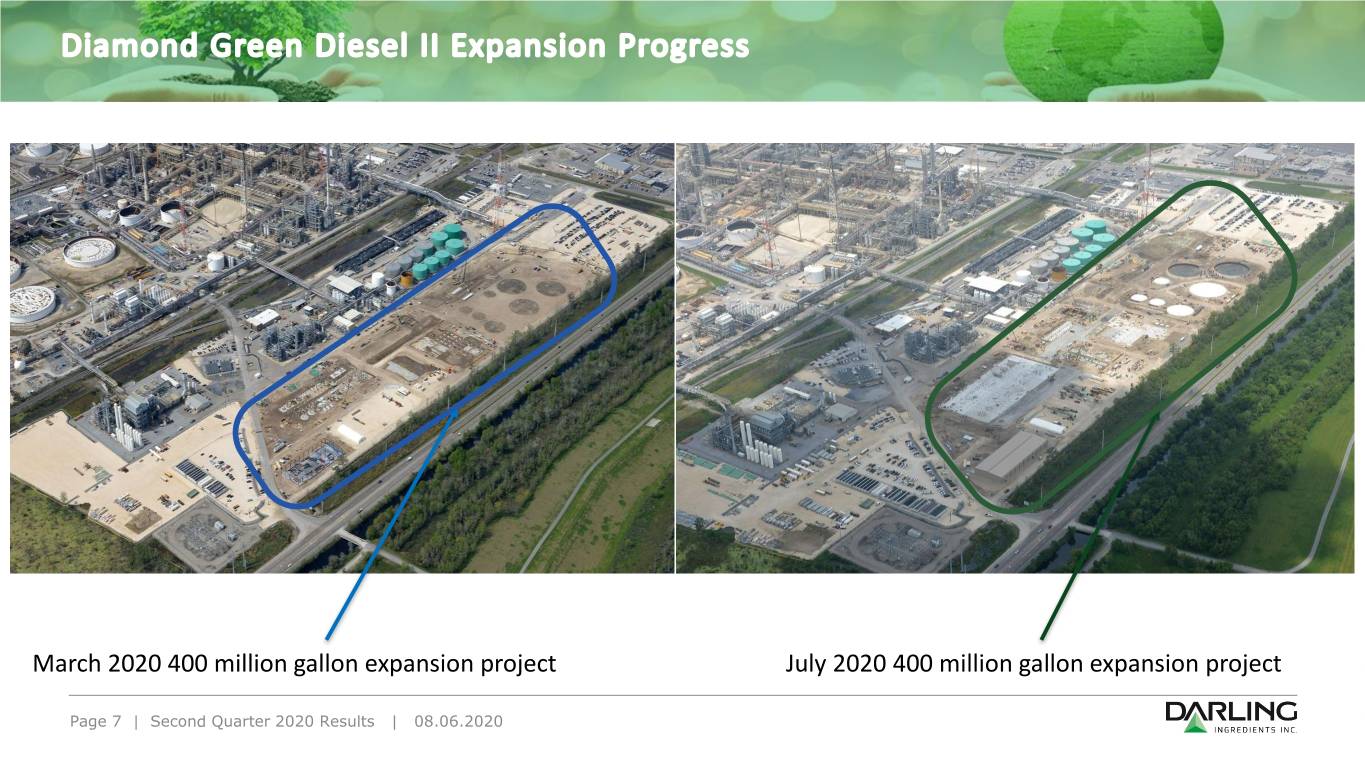
March 2020 400 million gallon expansion project July 2020 400 million gallon expansion project Page 7 | Second Quarter 2020 Results | 08.06.2020
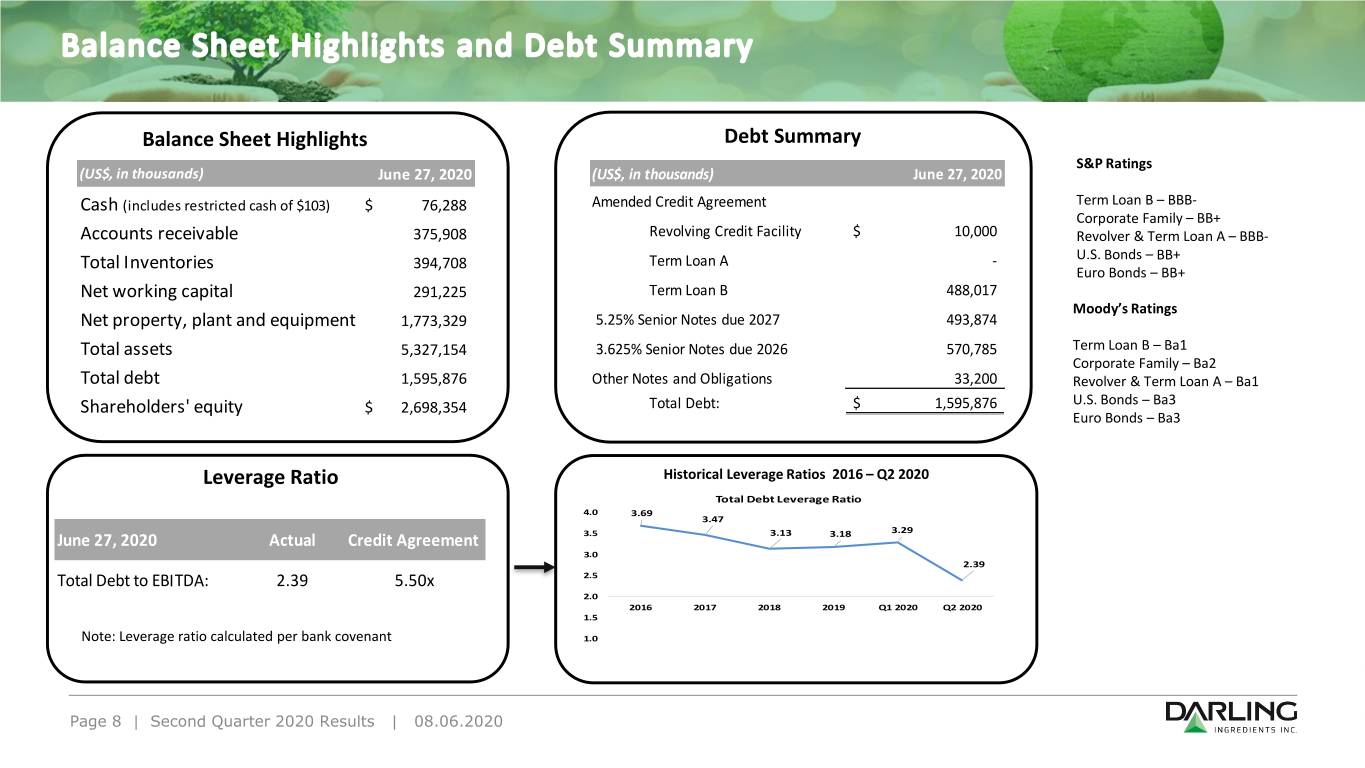
Balance Sheet Highlights Debt Summary S&P Ratings (US$, in thousands) June 27, 2020 (US$, in thousands) June 27, 2020 Cash (includes restricted cash of $103) $ 76,288 Amended Credit Agreement Term Loan B – BBB- (US$, in thousands) June 30, 2018 Corporate Family – BB+ Accounts receivable 375,908 Revolving Credit Facility $ 10,000 Revolver & Term Loan A – BBB- Cash (1,624,354 U.S. Bonds – BB+ Total Inventories 394,708 Term Loan A - Total assets 4,856,916 Euro Bonds – BB+ Net working capital 291,225 Term Loan B 488,017 Total debt 1,695,289 Moody’s Ratings Net property, plant and equipment 1,773,329 5.25% Senior Notes due 2027 493,874 Shareholders' equity $2,238,031 Total assets 5,327,154 3.625% Senior Notes due 2026 570,785 Term Loan B – Ba1 Corporate Family – Ba2 Total debt 1,595,876 Other Notes and Obligations 33,200 Revolver & Term Loan A – Ba1 Shareholders' equity $ 2,698,354 Total Debt: $ 1,595,876 U.S. Bonds – Ba3 Euro Bonds – Ba3 Leverage Ratio Historical Leverage Ratios 2016 – Q2 2020 Total Debt Leverage Ratio 4.0 3.69 3.47 3.29 June 27, 2020 Actual Credit Agreement 3.5 3.13 3.18 3.0 2.39 Total Debt to EBITDA: 2.39 5.50x 2.5 2.0 2016 2017 2018 2019 Q1 2020 Q2 2020 1.5 Note: Leverage ratio calculated per bank covenant 1.0 Page 8 | Second Quarter 2020 Results | 08.06.2020
Appendix – Additional Information Page 9 | Second Quarter 2020 Results | 08.06.2020
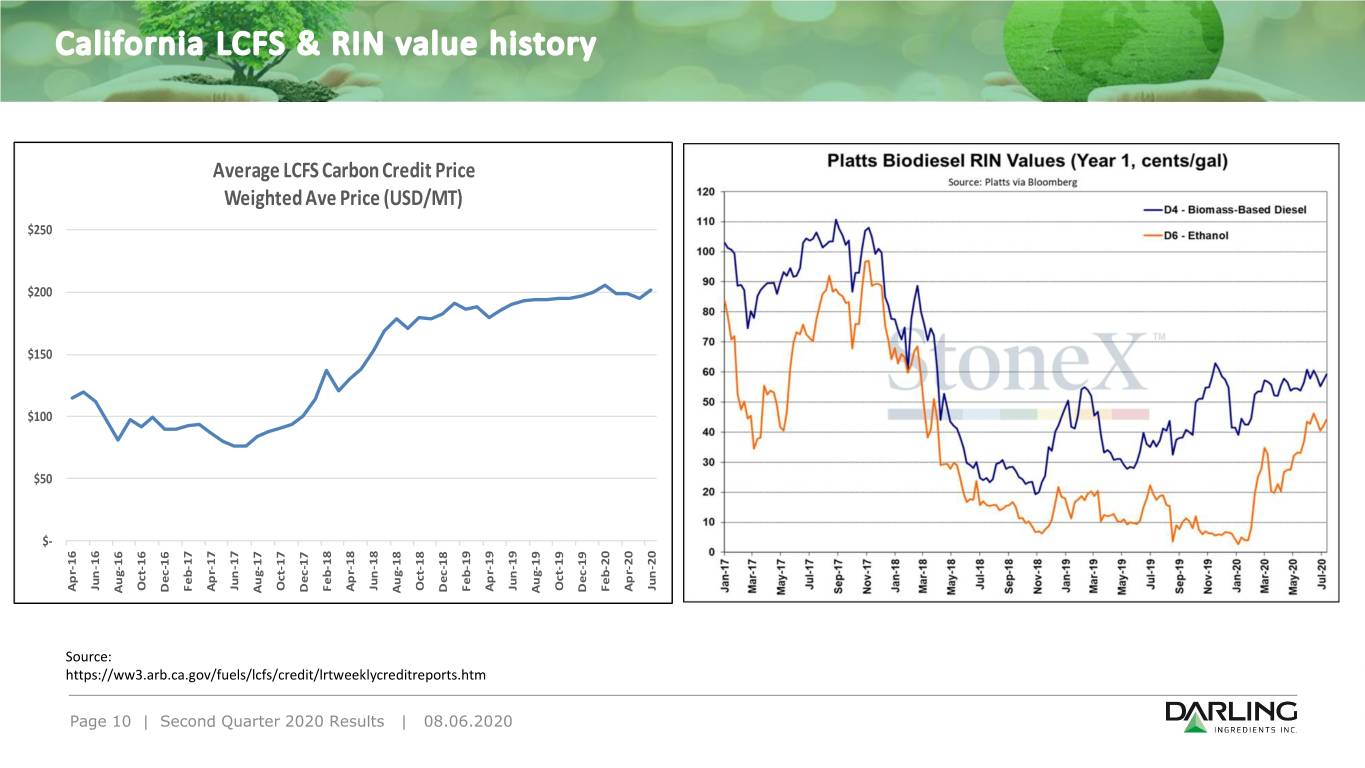
$250 $200 $150 $100 $50 $- https://ww3.arb.ca.gov/fuels/lcfs/credit/lrtweeklycreditreports.htm Source: Page Apr-16 Jun-16 10 Aug-16 | Second Second |Quarter 08.06.2020 Results | 2020 Oct-16 Dec-16 Feb-17 Apr-17 Average LCFS Carbon Credit Price Weighted Ave Price (USD/MT) Jun-17 Aug-17 Oct-17 Dec-17 Feb-18 Apr-18 Jun-18 Aug-18 Oct-18 Dec-18 Feb-19 Apr-19 Jun-19 Aug-19 Oct-19 Dec-19 Feb-20 Apr-20 Jun-20
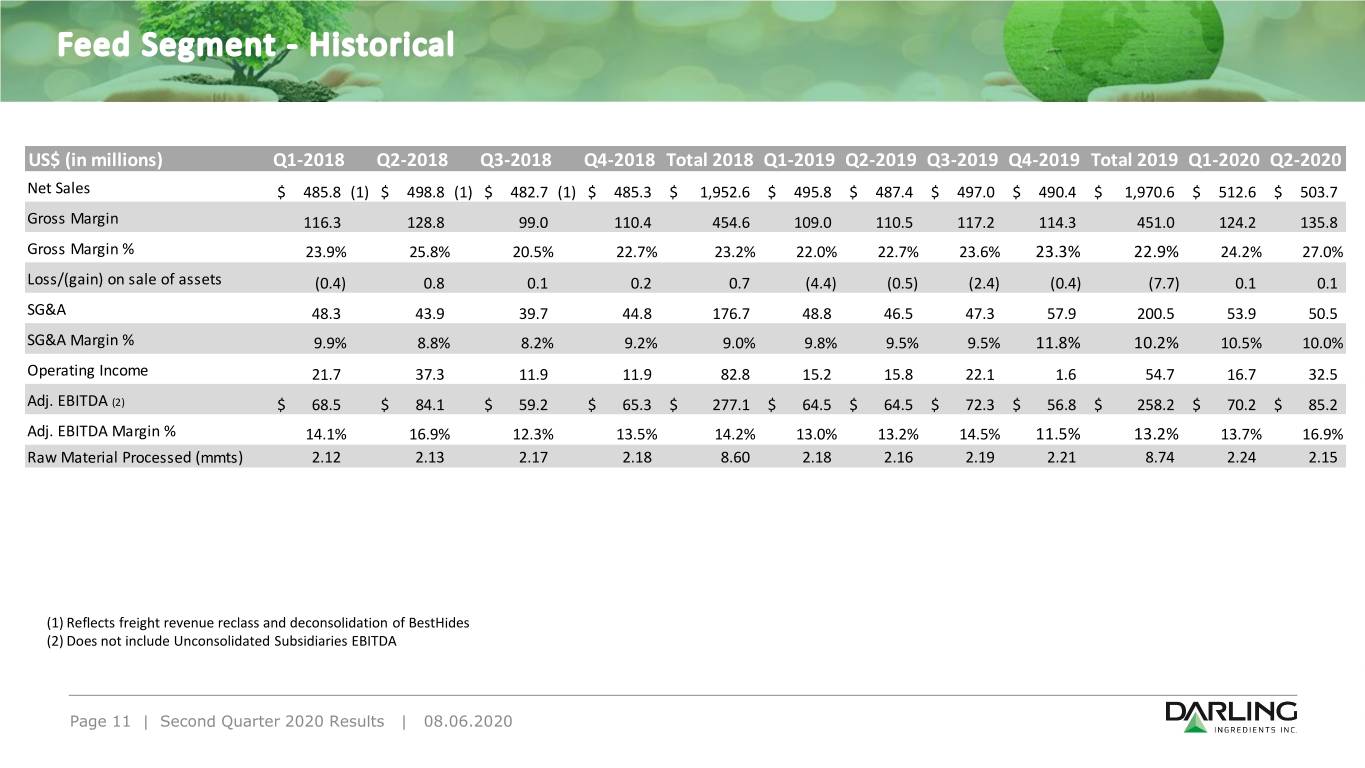
US$ (in millions) Q1-2018 Q2-2018 Q3-2018 Q4-2018 Total 2018 Q1-2019 Q2-2019 Q3-2019 Q4-2019 Total 2019 Q1-2020 Q2-2020 Net Sales $ 485.8 (1) $ 498.8 (1) $ 482.7 (1) $ 485.3 $ 1,952.6 $ 495.8 $ 487.4 $ 497.0 $ 490.4 $ 1,970.6 $ 512.6 $ 503.7 Gross Margin 116.3 128.8 99.0 110.4 454.6 109.0 110.5 117.2 114.3 451.0 124.2 135.8 Gross Margin % 23.9% 25.8% 20.5% 22.7% 23.2% 22.0% 22.7% 23.6% 23.3% 22.9% 24.2% 27.0% Loss/(gain) on sale of assets (0.4) 0.8 0.1 0.2 0.7 (4.4) (0.5) (2.4) (0.4) (7.7) 0.1 0.1 SG&A 48.3 43.9 39.7 44.8 176.7 48.8 46.5 47.3 57.9 200.5 53.9 50.5 SG&A Margin % 9.9% 8.8% 8.2% 9.2% 9.0% 9.8% 9.5% 9.5% 11.8% 10.2% 10.5% 10.0% Operating Income 21.7 37.3 11.9 11.9 82.8 15.2 15.8 22.1 1.6 54.7 16.7 32.5 Adj. EBITDA (2) $ 68.5 $ 84.1 $ 59.2 $ 65.3 $ 277.1 $ 64.5 $ 64.5 $ 72.3 $ 56.8 $ 258.2 $ 70.2 $ 85.2 Adj. EBITDA Margin % 14.1% 16.9% 12.3% 13.5% 14.2% 13.0% 13.2% 14.5% 11.5% 13.2% 13.7% 16.9% Raw Material Processed (mmts) 2.12 2.13 2.17 2.18 8.60 2.18 2.16 2.19 2.21 8.74 2.24 2.15 (1) Reflects freight revenue reclass and deconsolidation of BestHides (2) Does not include Unconsolidated Subsidiaries EBITDA Page 11 | Second Quarter 2020 Results | 08.06.2020
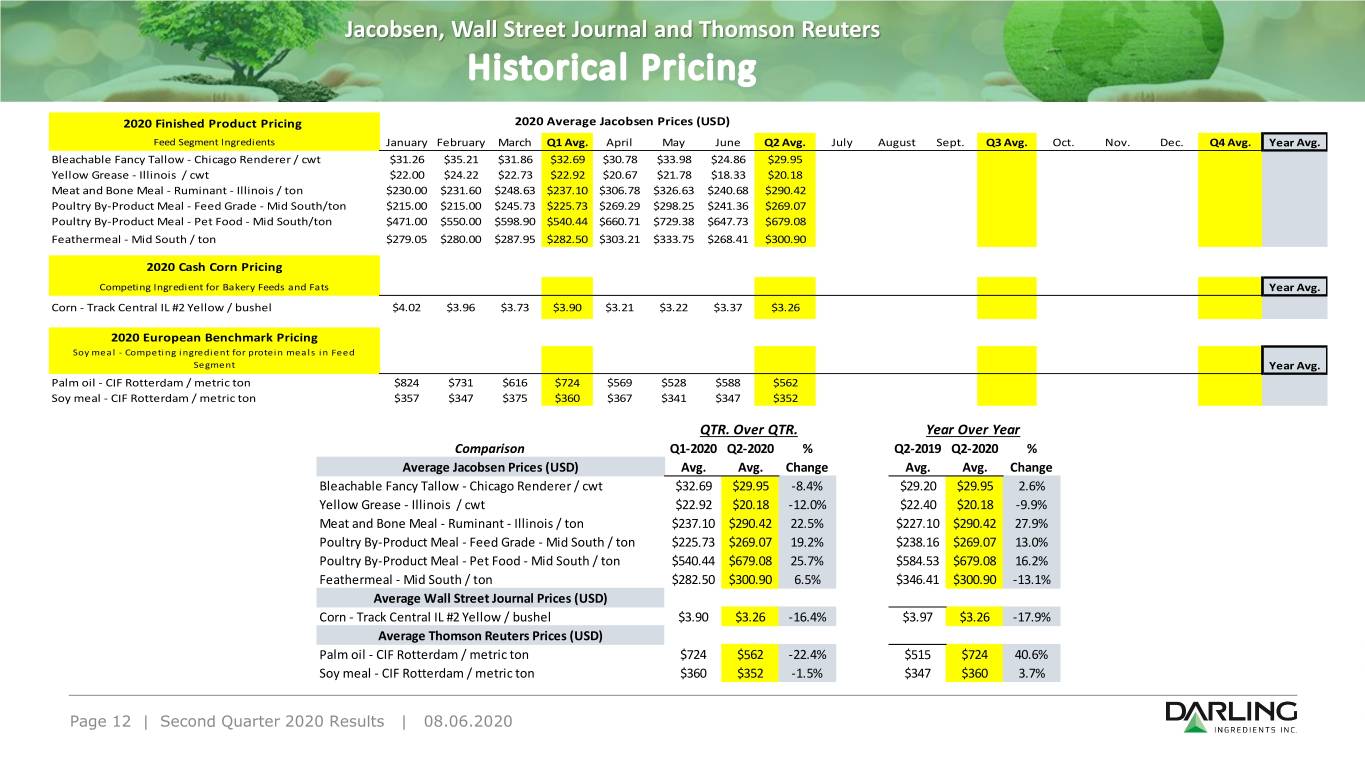
Jacobsen, Wall Street Journal and Thomson Reuters 2020 Finished Product Pricing 2020 Average Jacobsen Prices (USD) Feed Segment Ingredients January February March Q1 Avg. April May June Q2 Avg. July August Sept. Q3 Avg. Oct. Nov. Dec. Q4 Avg. Year Avg. Bleachable Fancy Tallow - Chicago Renderer / cwt $31.26 $35.21 $31.86 $32.69 $30.78 $33.98 $24.86 $29.95 Yellow Grease - Illinois / cwt $22.00 $24.22 $22.73 $22.92 $20.67 $21.78 $18.33 $20.18 Meat and Bone Meal - Ruminant - Illinois / ton $230.00 $231.60 $248.63 $237.10 $306.78 $326.63 $240.68 $290.42 Poultry By-Product Meal - Feed Grade - Mid South/ton $215.00 $215.00 $245.73 $225.73 $269.29 $298.25 $241.36 $269.07 Poultry By-Product Meal - Pet Food - Mid South/ton $471.00 $550.00 $598.90 $540.44 $660.71 $729.38 $647.73 $679.08 Feathermeal - Mid South / ton $279.05 $280.00 $287.95 $282.50 $303.21 $333.75 $268.41 $300.90 2020 Cash Corn Pricing Competing Ingredient for Bakery Feeds and Fats Year Avg. Corn - Track Central IL #2 Yellow / bushel $4.02 $3.96 $3.73 $3.90 $3.21 $3.22 $3.37 $3.26 Palm Oil - Competing2020 European ingredient Benchmark for edible fats Pricing in Food Segment Soy meal - Competing ingredient for protein meals in Feed Segment Year Avg. Palm oil - CIF Rotterdam / metric ton $824 $731 $616 $724 $569 $528 $588 $562 Soy meal - CIF Rotterdam / metric ton $357 $347 $375 $360 $367 $341 $347 $352 QTR. Over QTR. Year Over Year Comparison Q1-2020 Q2-2020 % Q2-2019 Q2-2020 % Average Jacobsen Prices (USD) Avg. Avg. Change Avg. Avg. Change Bleachable Fancy Tallow - Chicago Renderer / cwt $32.69 $29.95 -8.4% $29.20 $29.95 2.6% Yellow Grease - Illinois / cwt $22.92 $20.18 -12.0% $22.40 $20.18 -9.9% Meat and Bone Meal - Ruminant - Illinois / ton $237.10 $290.42 22.5% $227.10 $290.42 27.9% Poultry By-Product Meal - Feed Grade - Mid South / ton $225.73 $269.07 19.2% $238.16 $269.07 13.0% Poultry By-Product Meal - Pet Food - Mid South / ton $540.44 $679.08 25.7% $584.53 $679.08 16.2% Feathermeal - Mid South / ton $282.50 $300.90 6.5% $346.41 $300.90 -13.1% Average Wall Street Journal Prices (USD) Corn - Track Central IL #2 Yellow / bushel $3.90 $3.26 -16.4% $3.97 $3.26 -17.9% Average Thomson Reuters Prices (USD) Palm oil - CIF Rotterdam / metric ton $724 $562 -22.4% $515 $724 40.6% Soy meal - CIF Rotterdam / metric ton $360 $352 -1.5% $347 $360 3.7% Page 12 | Second Quarter 2020 Results | 08.06.2020
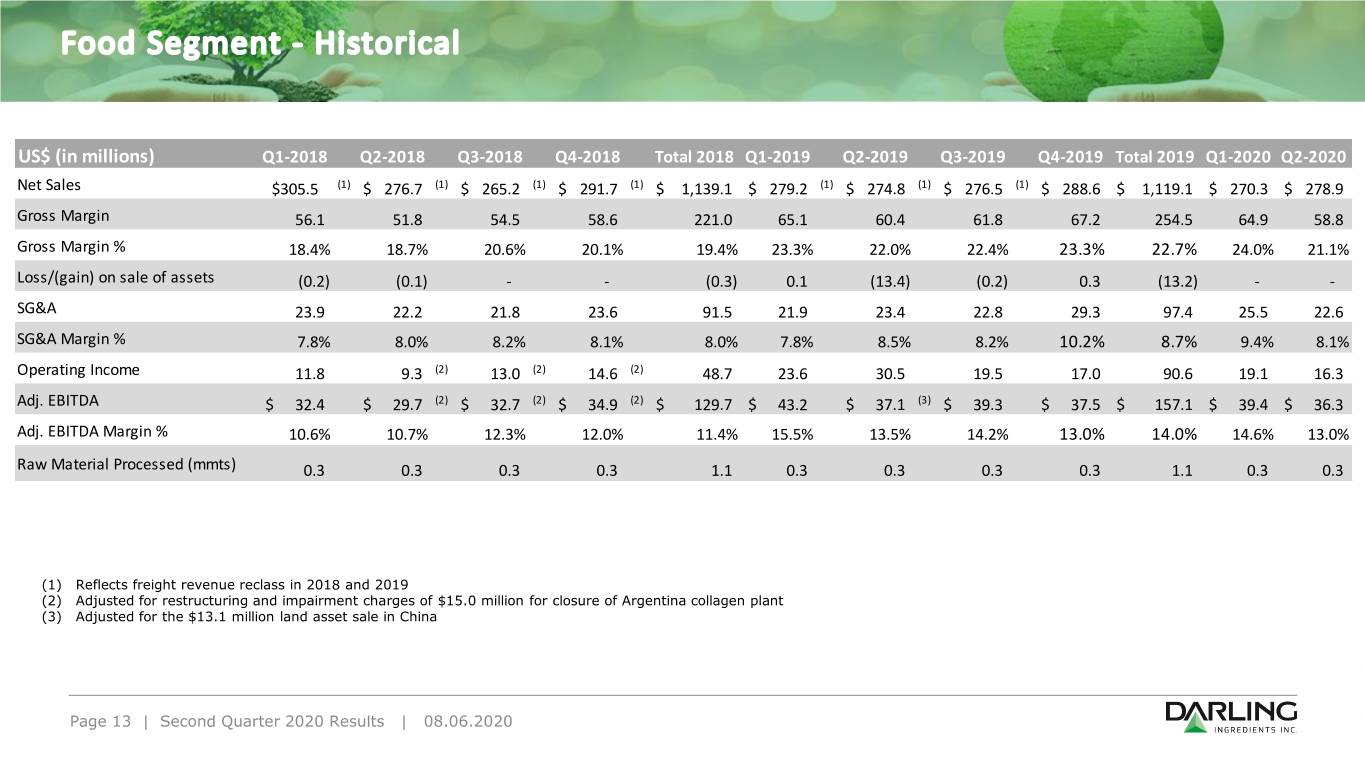
US$ (in millions) Q1-2018 Q2-2018 Q3-2018 Q4-2018 Total 2018 Q1-2019 Q2-2019 Q3-2019 Q4-2019 Total 2019 Q1-2020 Q2-2020 Net Sales $305.5 (1) $ 276.7 (1) $ 265.2 (1) $ 291.7 (1) $ 1,139.1 $ 279.2 (1) $ 274.8 (1) $ 276.5 (1) $ 288.6 $ 1,119.1 $ 270.3 $ 278.9 Gross Margin 56.1 51.8 54.5 58.6 221.0 65.1 60.4 61.8 67.2 254.5 64.9 58.8 Gross Margin % 18.4% 18.7% 20.6% 20.1% 19.4% 23.3% 22.0% 22.4% 23.3% 22.7% 24.0% 21.1% Loss/(gain) on sale of assets (0.2) (0.1) - - (0.3) 0.1 (13.4) (0.2) 0.3 (13.2) - - SG&A 23.9 22.2 21.8 23.6 91.5 21.9 23.4 22.8 29.3 97.4 25.5 22.6 SG&A Margin % 7.8% 8.0% 8.2% 8.1% 8.0% 7.8% 8.5% 8.2% 10.2% 8.7% 9.4% 8.1% Operating Income 11.8 9.3 (2) 13.0 (2) 14.6 (2) 48.7 23.6 30.5 19.5 17.0 90.6 19.1 16.3 Adj. EBITDA $ 32.4 $ 29.7 (2) $ 32.7 (2) $ 34.9 (2) $ 129.7 $ 43.2 $ 37.1 (3) $ 39.3 $ 37.5 $ 157.1 $ 39.4 $ 36.3 Adj. EBITDA Margin % 10.6% 10.7% 12.3% 12.0% 11.4% 15.5% 13.5% 14.2% 13.0% 14.0% 14.6% 13.0% Raw Material Processed (mmts) 0.3 0.3 0.3 0.3 1.1 0.3 0.3 0.3 0.3 1.1 0.3 0.3 (1) Reflects freight revenue reclass in 2018 and 2019 (2) Adjusted for restructuring and impairment charges of $15.0 million for closure of Argentina collagen plant (3) Adjusted for the $13.1 million land asset sale in China Page 13 | Second Quarter 2020 Results | 08.06.2020
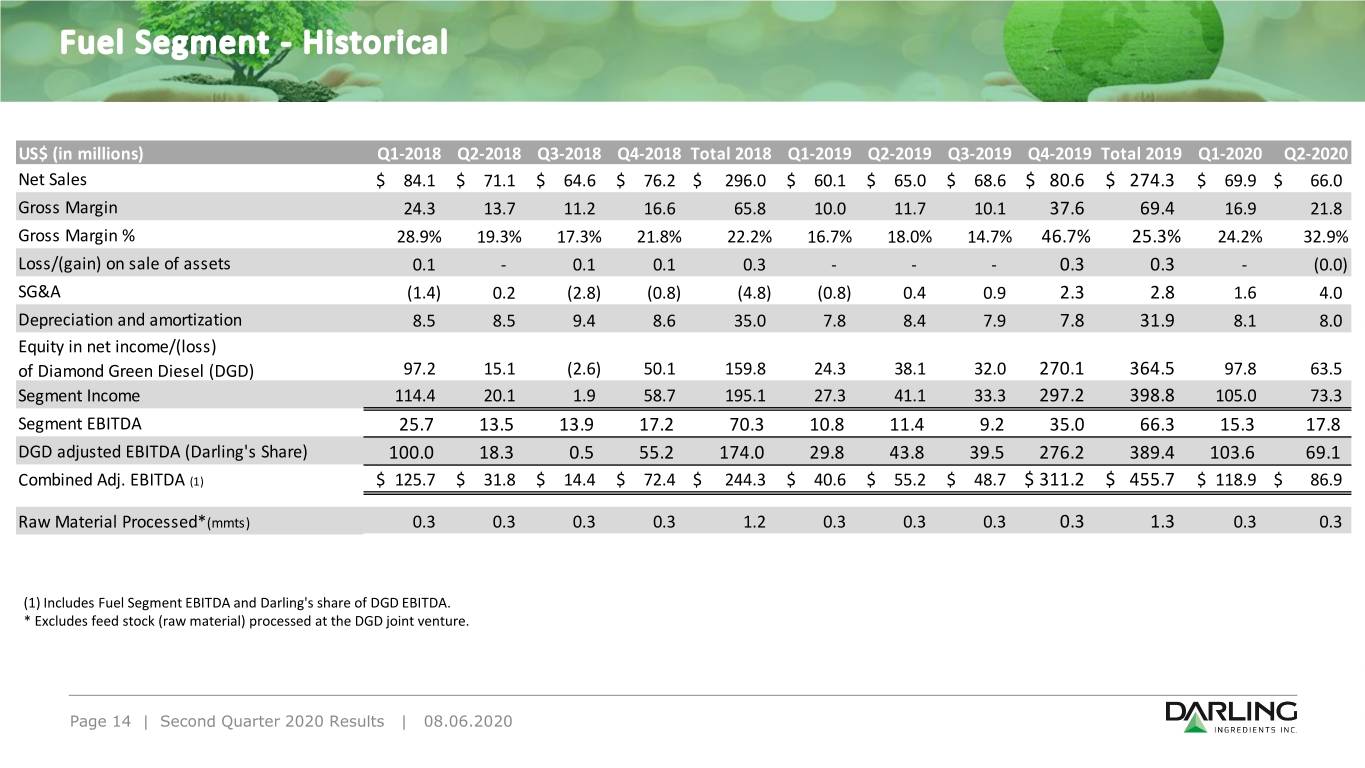
US$ (in millions) Q1-2018 Q2-2018 Q3-2018 Q4-2018 Total 2018 Q1-2019 Q2-2019 Q3-2019 Q4-2019 Total 2019 Q1-2020 Q2-2020 Net Sales $ 84.1 $ 71.1 $ 64.6 $ 76.2 $ 296.0 $ 60.1 $ 65.0 $ 68.6 $ 80.6 $ 274.3 $ 69.9 $ 66.0 Gross Margin 24.3 13.7 11.2 16.6 65.8 10.0 11.7 10.1 37.6 69.4 16.9 21.8 Gross Margin % 28.9% 19.3% 17.3% 21.8% 22.2% 16.7% 18.0% 14.7% 46.7% 25.3% 24.2% 32.9% Loss/(gain) on sale of assets 0.1 - 0.1 0.1 0.3 - - - 0.3 0.3 - (0.0) SG&A (1.4) 0.2 (2.8) (0.8) (4.8) (0.8) 0.4 0.9 2.3 2.8 1.6 4.0 Depreciation and amortization 8.5 8.5 9.4 8.6 35.0 7.8 8.4 7.9 7.8 31.9 8.1 8.0 Equity in net income/(loss) of Diamond Green Diesel (DGD) 97.2 15.1 (2.6) 50.1 159.8 24.3 38.1 32.0 270.1 364.5 97.8 63.5 Segment Income 114.4 20.1 1.9 58.7 195.1 27.3 41.1 33.3 297.2 398.8 105.0 73.3 Segment EBITDA 25.7 13.5 13.9 17.2 70.3 10.8 11.4 9.2 35.0 66.3 15.3 17.8 DGD adjusted EBITDA (Darling's Share) 100.0 18.3 0.5 55.2 174.0 29.8 43.8 39.5 276.2 389.4 103.6 69.1 Combined Adj. EBITDA (1) $ 125.7 $ 31.8 $ 14.4 $ 72.4 $ 244.3 $ 40.6 $ 55.2 $ 48.7 $ 311.2 $ 455.7 $ 118.9 $ 86.9 Raw Material Processed*(mmts) 0.3 0.3 0.3 0.3 1.2 0.3 0.3 0.3 0.3 1.3 0.3 0.3 (1) Includes Fuel Segment EBITDA and Darling's share of DGD EBITDA. * Excludes feed stock (raw material) processed at the DGD joint venture. Page 14 | Second Quarter 2020 Results | 08.06.2020
Adjusted EBITDA is not a recognized accounting measurement under GAAP; it should not be considered as an alternative to net income, as a measure of operating results, or as an alternative to cash flow as a measure of liquidity, and is not intended to be a presentation in accordance with GAAP. Adjusted EBITDA is presented here not as an alternative to net income, but rather as a measure of the Company’s operating performance. Since EBITDA (generally, net income plus interest expenses, taxes, depreciation and amortization) is not calculated identically by all companies, this presentation may not be comparable to EBITDA or Adjusted EBITDA presentations disclosed by other companies. Adjusted EBITDA is calculated in this presentation and represents, for any relevant period, net income/(loss) plus depreciation and amortization, goodwill and long-lived asset impairment, interest expense, (income)/loss from discontinued operations, net of tax, income tax provision, other income/(expense) and equity in net loss of unconsolidated subsidiary. Management believes that Adjusted EBITDA is useful in evaluating the Company’s operating performance compared to that of other companies in its industry because the calculation of Adjusted EBITDA generally eliminates the effects of financing, income taxes and certain non-cash and other items that may vary for different companies for reasons unrelated to overall operating performance. As a result, the Company’s management uses Adjusted EBITDA as a measure to evaluate performance and for other discretionary purposes. In addition to the foregoing, management also uses or will use Adjusted EBITDA to measure compliance with certain financial covenants under the Company’s Senior Secured Credit Facilities and 5.25% Notes and 3.625% Notes that were outstanding at June 27, 2020. However, the amounts shown in this presentation for Adjusted EBITDA differ from the amounts calculated under similarly titled definitions in the Company’s Senior Secured Credit Facilities and 5.25% Notes and 3.625% Notes, as those definitions permit further adjustments to reflect certain other non-recurring costs, non-cash charges and cash dividends from the DGD Joint Venture. Additionally, the Company evaluates the impact of foreign exchange impact on operating cash flow, which is defined as segment operating income (loss) plus depreciation and amortization. Page 15 | Second Quarter 2020 Results | 08.06.2020
Adjusted EBITDA and Pro Forma Adjusted EBITDA Three Months Ended Six Months Ended (US$ in thousands) June 27, June 29, June 27, June 29, 2020 2019 2020 2019 Net income attributable to Darling $ 65,439 $ 26,258 $ 150,949 $ 44,270 Depreciation and amortization 83,310 79,486 167,981 158,650 Interest expense 17,920 20,853 37,010 40,729 Income tax expense 19,946 7,776 38,246 13,050 Foreign currency (gain)/loss 1,134 388 (530) 1,120 Other expense, net 1,485 2,019 3,366 4,544 Debt extinguishment costs - 12,126 0 12,126 Equity in net (income) of Diamond Green Diesel (63,492) (38,093) (161,312) (62,370) Equity in net (income)/loss of unconsolidated subsidiaries (692) (82) (1,561) 422 Net income attributable to noncontrolling interests 1,056 4,786 1,637 6,414 Adjusted EBITDA $ 126,106 $ 115,517 $ 235,786 $ 218,955 Foreign currency exchange impact 1,951 (1) - 4,109 (2) - Pro forma Adjusted EBITDA to Foreign Currency (Non-GAAP) $ 128,057 $ 115,517 $ 239,895 $ 218,955 DGD Joint Venture Adjusted EBITDA (Darling's Share) $ 69,108 $ 43,894 $ 172,742 $ 73,721 Darling plus Darling's share of DGD Joint Venture Adjusted EBITDA $ 195,214 $ 159,411 $ 408,528 $ 292,676 (1) The average rate assumption used in this calculation was the actual fiscal average rate for the three months ended June 27, 2020 of €1.00:USD$1.10 and CAD$1.00:USD$0.72, as compared to the average rate for the three months ended June 29, 2019 of €1.00:USD$1.12 and CAD$1.00:USD$0.75, respectively. (2) The average rate assumption used in this calculation was the actual fiscal average rate for the six months ended June 27, 2020 of €1.00:USD$1.10 and CAD$1.00:USD$0.73, as compared to the average rate for the six months ended June 29, 2019 of €1.00:USD$1.13 and CAD$1.00:USD$0.75, respectively. For the three and six months ended June 29, 2019, Adjusted EBITDA included a gain on the sale of assets of approximately $13.1 million. Page 16 | Second Quarter 2020 Results | 08.06.2020 Note: See slide 15 for information regarding Darling’s use of Non-GAAP measures.
Thank you