
DBRG 8-K
DigitalBridge Group, Inc. (DBRG)
8-K
2020-02-28
For: 2020-02-28
View Original
Added on
April 05, 2026
UNITED STATES
SECURITIES AND EXCHANGE COMMISSION
Washington, D.C. 20549
FORM 8-K
CURRENT REPORT
Pursuant to Section 13 or 15(d)
of the Securities Exchange Act of 1934
Date of Report (Date of earliest event reported): February 28, 2020
(Exact Name of Registrant as Specified in Its Charter) | ||
(State or Other Jurisdiction of Incorporation or Organization) | (Commission File Number) | (I.R.S. Employer Identification No.) | ||
(Address of Principal Executive Offices, Including Zip Code)
(310 ) 282-8820
Registrant’s telephone number, including area code:
N/A
(Former name or former address, if changed since last report.)
Check the appropriate box below if the Form 8-K filing is intended to simultaneously satisfy the filing obligation of the registrant under any of the following provisions (see General Instruction A.2. below):
Written communications pursuant to Rule 425 under the Securities Act (17 CFR 230.425) | |
Soliciting material pursuant to Rule 14a-12 under the Exchange Act (17 CFR 240.14a-12) | |
Pre-commencement communications pursuant to Rule 14d-2(b) under the Exchange Act (17 CFR 240.14d-2(b)) | |
Pre-commencement communications pursuant to Rule 13e-4(c) under the Exchange Act (17 CFR 240.13e-4(c)) | |
Securities registered pursuant to Section 12(b) of the Act: | ||||
Title of Class | Trading Symbol(s) | Name of Each Exchange on Which Registered | ||
Indicate by check mark whether the registrant is an emerging growth company as defined in Rule 405 of the Securities Act of 1933 (§230.405 of this chapter) or Rule 12b-2 of the Securities Exchange Act of 1934 (§240.12b-2 of this chapter). | |||
Emerging growth company | |||
If an emerging growth company, indicate by check mark if the registrant has elected not to use the extended transition period for complying with any new or revised financial accounting standards provided pursuant to Section 13(a) of the Exchange Act. | ☐ | ||
Item 2.02 Results of Operations and Financial Condition.
On February 28, 2020, Colony Capital, Inc. (the “Company”) issued a press release announcing its financial position as of December 31, 2019 and its financial results for the quarter and full year ended December 31, 2019. A copy of the press release is attached as Exhibit 99.1 to this Current Report on Form 8-K and is incorporated herein by reference.
On February 28, 2020, the Company made available a Corporate Overview and Supplemental Financial Disclosure Presentation for the quarter ended December 31, 2019 on the Company’s website at www.clny.com. A copy of the Corporate Overview and Supplemental Financial Disclosure Presentation is attached as Exhibit 99.2 to this Current Report on Form 8-K and is incorporated herein by reference.
The information included in this Current Report on Form 8-K (including Exhibits 99.1 and 99.2 hereto) shall not be deemed “filed” for the purposes of Section 18 of the Securities Exchange Act of 1934, as amended (the “Exchange Act”), or otherwise subject to the liabilities of that section, nor shall it be deemed incorporated by reference into any filing made by the Company under the Exchange Act or the Securities Act of 1933, as amended, except as shall be expressly set forth by specific reference in such a filing.
Use of Website to Distribute Material Company Information
The Company’s website address is www.clny.com. The Company uses its website as a channel of distribution for important company information. Important information, including press releases, analyst presentations and financial information regarding the Company, is routinely posted on and accessible on the Public Shareholders subpage of its website, which is accessible by clicking on the tab labeled “Public Shareholders” on the website home page. The Company also uses its website to expedite public access to time-critical information regarding the Company in advance of or in lieu of distributing a press release or a filing with the U.S. Securities and Exchange Commission disclosing the same information. Therefore, investors should look to the Public Shareholders subpage of the Company’s website for important and time-critical information. Visitors to the Company’s website can also register to receive automatic e-mail and other notifications alerting them when new information is made available on the Public Shareholders subpage of the website.
Item 9.01 Financial Statements and Exhibits.
(d) Exhibits. The following exhibits are being furnished herewith to this Current Report on Form 8-K.
SIGNATURES
Pursuant to the requirements of the Securities Exchange Act of 1934, as amended, the registrant has duly caused this report to be signed on its behalf by the undersigned hereunto duly authorized.
Date: | February 28, 2020 | COLONY CAPITAL, INC. | |
By: | /s/ Mark M. Hedstrom | ||
Mark M. Hedstrom | |||
Chief Financial Officer, Chief Operating Officer and Treasurer | |||
 | ||
Exhibit 99.1
COLONY CAPITAL ANNOUNCES FOURTH QUARTER AND FULL YEAR 2019 FINANCIAL RESULTS AND AFFIRMS FULL YEAR 2020 DIVIDEND
LOS ANGELES, February 28, 2020 - Colony Capital, Inc. (NYSE:CLNY) and subsidiaries (collectively, “Colony Capital,” or the “Company”) today announced financial results for the fourth quarter and full year ended December 31, 2019. The Company’s Board of Directors declared a first quarter 2020 dividend of $0.11 per share and the Company expects to maintain a $0.44 per share regular dividend on its Class A and B common stock for the full year 2020. Underlying this expectation is the Company’s full year 2020 outlook for (i) Core FFO excluding gains and losses of $0.35 to $0.40 per share and (ii) significant anticipated 2020 net cash gains, including $106 million, or $0.20 per share of realized gain through the sale of our interest in RXR Realty earlier this month.
“Having built a strong foundation over the past year, we are now well on our way to becoming the leading platform for digital real estate and infrastructure,” said Thomas. J. Barrack, Jr., Executive Chairman and Chief Executive Officer. “We made significant progress in 2019 simplifying, segregating and revaluing certain non-digital businesses to set up the Company for its digital evolution. 2020 will be a transformative, transitional year that positions Colony Capital to take advantage of the significant global opportunities in the digital ecosystem and deliver value for shareholders.”
Key 2019 foundational transactions included the:
• | Highly profitable sale of our industrial real estate portfolio for $5.7 billion |
• | Closing of our inaugural $4.1 billion digital infrastructure fund, which substantially surpassed its initial fundraising target |
• | Combination with Digital Bridge, the leading global investment management firm focused on digital infrastructure |
• | $185 million controlling investment in DataBank, an owner of edge data centers serving fast growing markets |
Fourth Quarter and Full Year 2019 Financial Results and Highlights
• | Net loss attributable to common stockholders was $(26.3) million, or $(0.06) per share, for the fourth quarter and $(1.15) billion, or $(2.41) per share, for the full year |
• | As part of the Company’s ongoing transition and rotation to an investment management and operating business focused on digital real estate and infrastructure, the Company continues to pivot away from certain of its non-digital investment management businesses and, as such, the Company recorded impairments to the intangible carrying value of certain of its non-digital investment management businesses in the amount of $411 million in the fourth quarter of 2019 |
• | Core FFO was $47.6 million, or $0.09 per share, for the fourth quarter and $266.3 million, or $0.50 per share, for the full year |
• | For fourth quarter 2019, excluding net losses of $21.4 million primarily related to net investment losses in Other Equity and Debt, Core FFO was $69.0 million, or $0.13 per share; for full year 2019, excluding net investment losses of $52.0 million, Core FFO was $318.3 million, or $0.60 per share |
• | The Company’s Board of Directors declared and paid a fourth quarter 2019 dividend of $0.11 per share to holders of Class A and B common stock |
During the fourth quarter 2019, the Company:
Digital Infrastructure
• | Acquired a 20.4% controlling interest in DataBank, a leading private owner and manager of edge data centers in the U.S., for approximately $185 million, representing the Company’s inaugural direct balance sheet investment in digital real estate |
• | Increased digital assets under management (“AUM”) to $13.8 billion as of December 31, 2019, which represents approximately 29% of the Company’s overall AUM and is a significant transformation from $1.9 billion of Digital AUM as of December 31, 2018 |
• | Completed the acquisitions of Beanfield Technologies Inc., a Canadian fiber network owner and operator, and Highline do Brasil, a telecommunications infrastructure provider in Brazil, by Digital Colony Partners (“DCP”), the Company’s $4.1 billion digital real estate and infrastructure private equity fund |
1
| ||
Dispositions
• | Completed the sale of the Company’s light industrial portfolio, including the related operating platform, for $5.7 billion, which resulted in a net cash gain and incentive fees of approximately $475 million and net cash proceeds of approximately $1.25 billion for the Company’s share |
• | Completed the planned sales and/or monetization of $66 million of assets, with net equity proceeds of $35 million within the Other Equity and Debt segment, and for full year 2019, sold $717 million of assets with net equity proceeds of $566 million |
• | Completed the sale of three unencumbered hospitals resulting in net proceeds to the Company of $82 million; in June 2019 the Company had initially contributed $175 million to refinance its share of $1.725 billion of healthcare debt and removed these assets from the collateral pool at that time, such that these sale proceeds effectively decrease the equity contribution required to complete the refinancing to a net amount of $93 million |
Financing and Other
• | Announced and completed the redemption of all its outstanding 8.25% Series B and 8.75% Series E cumulative redeemable perpetual preferred stock for $408 million, including accrued dividends of $5 million, which was settled in January 2020 eliminating $34 million of annualized preferred dividends |
• | Refinanced a £212 million loan on a U.K. portfolio of senior housing assets and a $48 million loan on skilled nursing facilities portfolios, which, together with previously completed refinancing transactions in 2019, addresses all material near-term healthcare real estate loan maturities |
• | Refinanced an aggregate $982 million of debt on two hospitality portfolios significantly extending the outside maturity dates to 2026 at slightly lower interest rates on average |
• | Raised additional third-party capital of €115 million for AccorInvest bringing total third-party capital raised to €717 million alongside the Company’s investment of €46 million |
• | Successfully closed a $125 million senior financing and $60 million co-invest equity syndication of Alpine Energy Capital, LLC's (“Alpine”) $320 million commitment to an energy development joint venture with California Resources Corporation (NYSE: CRC) |
Subsequent to the fourth quarter 2019:
Digital Infrastructure
• | DCP invested and committed to three digital real estate and infrastructure investments and is now 73% committed (pro forma for the completion of the Zayo acquisition) |
Dispositions
• | Completed the sale of the Company’s 27.2% ownership interest in RXR Realty, a non-wholly owned real estate investment management platform, for approximately $200 million resulting in a realized pre-tax gain of $106 million |
• | Announced that the Company is pursuing a disposition of its management contract with Colony Credit Real Estate, Inc. (NYSE: CLNC), which may include a potential internalization of the Company’s management contract with CLNC, a sale of the CLNC management contract to a third party or another transaction that would result in the disposal of the CLNC management contract |
Corporate
• | Achieved well over 100% of the expected total $50 to $55 million, or $45 to $50 million on a cash basis, of the previously announced annual compensation and administrative cost savings in the fourth quarter of 2018 on a run rate basis |
• | In connection with CLNC’s recent announcement that Kevin Traenkle has resigned as CLNC’s Chief Executive Officer and President, the Company announced that Mr. Traenkle will be stepping down as the Colony Capital’s Chief Investment Officer, effective February 29, 2020 |
2
| ||
• | Announced that Justin Metz has stepped down as a member of the Company’s Board of Directors (including its committees, as applicable), effective February 25, 2020. Separately, in furtherance of the previously announced process undertaken by the Nominating and Corporate Governance Committee (“NCG Committee”) of the Company’s Board, the Company also announced that it has engaged an executive search firm to assist the Company’s Board, including the NCG Committee, in its ongoing process to evaluate board composition, governance and refreshment matters, with a focus on identifying potential director candidates with appropriate digital experience to join the Company’s Board as the Company continues to execute on its digital evolution |
• | As of February 25, 2020, the Company had significant liquidity of $1.3 billion including $520 million cash-on-hand and through availability under its revolving credit facility |
For more information and a reconciliation of net income/(loss) to common stockholders to Core FFO and/or NOI, please refer to the non-GAAP financial measure definitions and tables at the end of this press release.
Digital Evolution
In December 2019, the Company publicly filed a presentation and held a conference call to provide an update on its digital evolution. The presentation highlighted the completion of the highly profitable sale of the industrial portfolio and related investment management platform, which resulted in approximately $1.25 billion of net proceeds to the Company, and the immediate allocation of those proceeds to:
i. | accelerate the expansion into digital real estate with the acquisition of a 20% interest in DataBank for approximately $185 million; |
ii. | fund the remaining approximately $200 million commitment to DCP; and |
iii. | redeem $403 million of high cost preferred equity to improve the Company’s capital structure. |
The presentation also provided details of the Digital Colony playbook to establish the leading platform for digital real estate and infrastructure, which has been approved and supported by the Company’s Board and management team.
To execute on its digital evolution, the Company continues to operate its non-digital business units to maximize cash flows and value over time.
• | With respect to the healthcare and hospitality units, the Company successfully addressed all material near-term debt maturities allowing the respective business unit leaders to focus on improving cash flows through operational management and capital expenditures. |
• | With respect to Other Equity and Debt (“OED”), the Company has a 2020 asset sale and monetization target of $300 to $500 million with the goal to ultimately monetize the entire OED portfolio, except for Digital related investments, such as the Company’s investment in DataBank and GP co-investment in DCP. |
• | With respect to the Company’s 48 million shares in CLNC, the Company will evaluate sales in a responsible manner, but believes the current CLNC share price represents an excessive discount to book value. |
• | In addition, the Company is pursuing a disposition of its management contract with CLNC, but there can be no assurance that the Company will consummate any transaction. |
• | Further, with respect to other non-digital investment management businesses, the Company is exploring all potential opportunities to maximize value of the credit and opportunity fund investment management business, while minimizing balance sheet commitments, including, but not limited to, joint ventures with third party capital providers, sales and/or realignment of operational management. |
3
| ||
Fourth Quarter and Full Year 2019 Operating Results
($ in thousands, except per share data) | Fourth quarter 2019 | Full Year 2019 | |||||
Net loss attributable to common stockholders | $ | (26,251 | ) | $ | (1,152,207 | ) | |
Net loss attributable to common stockholders per share | (0.06 | ) | (2.41 | ) | |||
Core FFO | 47,590 | 266,278 | |||||
Core FFO per share | 0.09 | 0.50 | |||||
Core FFO excluding net investment losses | 68,972 | 318,257 | |||||
Core FFO excluding net investment losses per share | 0.13 | 0.60 | |||||
Fourth quarter 2019 net loss attributable to common stockholders was $(26.3) million, or $(0.06) per share. As part of the Company’s ongoing transition and rotation to an investment management and operating business focused on digital real estate and infrastructure, the Company continues to pivot away from certain of its non-digital investment management businesses. As a result, fourth quarter 2019 net loss included $484 million of consolidated impairments ($470 million CLNY OP share), with $401 million related to a reduction of goodwill associated with businesses to be sold or resolved.
Fourth Quarter 2019 Impairments Summary
($ in millions) | Consolidated | CLNY OP Share | |||||
Goodwill and $10 million related to Investment Management Intangibles | $ | 411.0 | $ | 411.0 | |||
Healthcare | 43.1 | 33.3 | |||||
Hospitality | 14.6 | 13.4 | |||||
Other Equity and Debt | 2.5 | (1.1 | ) | ||||
Sub-total impairments | 471.2 | 456.6 | |||||
CRE Securities other-than-temporary-impairments (OTTI) and unconsolidated investments Equity Method impairments in Other Equity and Debt | 13.2 | 13.2 | |||||
Grand total impairments | $ | 484.4 | $ | 469.8 | |||
Fourth Quarter 2019 Operating Results and Investment Activity by Segment
The Company is providing operating results and investment activity for the following segments: Investment Management (including Digital Investment Management), Healthcare Real Estate; Industrial Real Estate; Hospitality Real Estate; CLNC; and Other Equity and Debt.
Investment Management
The Company’s Investment Management segment includes the management of digital real estate and infrastructure assets through Digital Colony and traditional commercial real estate investments through private real estate credit funds and related co-investment vehicles, CLNC, a public non-traded healthcare REIT, and interests in other investment management platforms, among other smaller investment vehicles. This segment included the industrial investment management business, which was sold with the light industrial portfolio in December 2019, and is presented as discontinued operations on the consolidated statements of operations. As of December 31, 2019, the Company had $36.3 billion of third-party AUM compared to $39.3 billion as of September 30, 2019. As of December 31, 2019, Fee-Earning Equity Under Management (“FEEUM”) was $19.4 billion compared to $22.4 billion as of September 30, 2019. The decrease in FEEUM was primarily attributable to the sale of the light industrial investment management platform and to a lesser degree the sales of our interest in Hamburg Trust (a non-wholly owned real estate investment management platform) and assets underlying managed funds, which were partially offset by capital raised in AccorInvest.
During the fourth quarter 2019, this segment’s aggregate net loss attributable to common stockholders was $(335.7) million and Core FFO was $48.9 million. Net loss included a $401 million write-down of goodwill resulting from a reduction in value of the non-digital investment management business and a $10 million write-down of contract intangibles. Reduction of goodwill and contract intangibles are added back to the Company's net loss to calculate Core FFO. In addition, this segment’s net loss and Core FFO included $17 million of realized incentive fees from the sale of the light industrial portfolio and $2.8 million of unrealized carried interest from the Company's investment in AccorInvest, both of which were net of related compensation expense. Further, this segment’s net loss and Core FFO included a $1.4 million placement fee related to third-party capital raised in AccorInvest, which is fully expensed upfront although payments are made ratably over the next four years.
4
| ||
Digital Investment Management
During the fourth quarter 2019, DCP completed the acquisition of Beanfield Technologies Inc., a leading enterprise and residential fiber connectivity provider with over 700 on-net locations in Toronto and Montreal. Also, DCP completed the acquisition of Highline do Brasil, an independent infrastructure solutions provider for the telecommunications industry with a portfolio of wireless infrastructure assets, including macro towers, which span all the major urban, suburban, and rural areas of Brazil.
Subsequent to the fourth quarter 2019, DCP invested and committed to three digital real estate and infrastructure investments and is now 73% committed (pro forma for the completion of the Zayo acquisition).
Other Investment Management
During the fourth quarter 2019, the Company raised additional third-party capital of €115 million for AccorInvest, bringing total third-party capital commitments raised to €717 million alongside the Company’s investment of €46 million. In addition, the Company successfully closed a $125 million senior financing and $60 million co-invest equity syndication of Alpine's $320 million commitment to an energy development joint venture with CRC. Alpine is the Company’s upstream energy investment management platform, jointly owned in partnership with Equity Group Investments.
During the fourth quarter 2019, the Company completed the sale of its ownership interest in Hamburg Trust, a non-wholly owned real estate investment management platform, for approximately $19 million of net proceeds after tax. The carrying value of the investment was $17 million as of September 30, 2019.
Subsequent to the fourth quarter 2019, the Company completed the sale of its 27.2% ownership interest in RXR Realty, a non-wholly owned real estate investment management platform, for approximately $200 million. The carrying value of the investment was $93 million as of December 31, 2019.
Digital Balance Sheet Investment
In addition to GP fundings into DCP made in prior quarters, the Company acquired a 20.4% controlling interest in DataBank for approximately $185 million in the fourth quarter 2019. DataBank is a leading provider of enterprise-class data center, connectivity and managed services operating in Dallas, Minneapolis, Kansas City, Cleveland, Pittsburgh, Salt Lake City, Baltimore, Atlanta, and Indianapolis. The Company’s investment represents the balance sheet’s first step in investing in the edge/colocation data center sector and supporting future growth opportunities through potential add-on acquisitions and greenfield edge data center developments.
5
| ||
Assets Under Management (“AUM”)
As of December 31, 2019, the Company had $49 billion of AUM:
December 31, 2019 | September 30, 2019 | ||||||||||||
($ in billions) | Amount | % of Grand Total | Amount | % of Grand Total | |||||||||
Balance Sheet (CLNY OP Share): | |||||||||||||
Healthcare | $ | 3.6 | 7.3 | % | $ | 3.7 | 6.9 | % | |||||
Industrial | 0.2 | 0.4 | % | 1.7 | 3.2 | % | |||||||
Hospitality | 3.8 | 7.8 | % | 3.8 | 7.1 | % | |||||||
Other Equity and Debt(1) | 3.1 | 6.3 | % | 2.8 | 5.3 | % | |||||||
CLNC(2) | 2.0 | 4.1 | % | 2.0 | 3.8 | % | |||||||
Balance Sheet Subtotal | 12.7 | 25.9 | % | 14.0 | 26.3 | % | |||||||
Investment Management: | |||||||||||||
Digital(3) | 13.5 | 27.7 | % | 13.8 | 25.9 | % | |||||||
Other Institutional Funds | 8.5 | 17.3 | % | 10.6 | 19.9 | % | |||||||
Colony Credit Real Estate (NYSE:CLNC)(4) | 3.5 | 7.1 | % | 3.5 | 6.6 | % | |||||||
Retail Companies | 3.4 | 6.9 | % | 3.4 | 6.4 | % | |||||||
Non-Wholly Owned REIM Platforms(5) | 7.4 | 15.1 | % | 8.0 | 14.9 | % | |||||||
Investment Management Subtotal | 36.3 | 74.1 | % | 39.3 | 73.7 | % | |||||||
Grand Total | $ | 49.0 | 100.0 | % | $ | 53.3 | 100.0 | % | |||||
___________________________________________________
(1) | Includes approximately $0.3 billion and $0.05 billion, as of December 31, 2019 and September 30, 2019, respectively of digital investments. |
(2) | Represents the Company’s 36% ownership share of CLNC’s total pro-rata share of assets of $5.6 billion as of December 31, 2019 and September 30, 2019. |
(3) | Approximately $0.2 billion transferred to Other Equity and Debt as a result of acquisition of a 20.4% interest in DataBank from existing third-party investors. |
(4) | Represents third-party 64% ownership share of CLNC’s total pro-rata share of assets of $5.6 billion as of December 31, 2019 and September 30, 2019. |
(5) | REIM: Real Estate Investment Management (RXR Realty LLC, Alpine Energy LLC and American Healthcare Investors) |
Healthcare Real Estate
As of December 31, 2019, the consolidated healthcare portfolio consisted of 358 properties: 154 senior housing properties, 106 medical office properties, 89 skilled nursing facilities and 9 hospitals. The Company’s equity interest in the consolidated Healthcare Real Estate segment was approximately 71% as of December 31, 2019. The healthcare portfolio earns rental income from our senior housing, skilled nursing facilities and hospital assets that are under net leases to single tenants/operators and from medical office buildings which are both single tenant and multi-tenant. In addition, we also earn resident fee income from senior housing properties that are managed by operators under a REIT Investment Diversification and Empowerment Act of 2007 (“RIDEA”) structure.
During the fourth quarter 2019, this segment’s net loss attributable to common stockholders was $(31.1) million, Core FFO was $19.6 million and consolidated NOI was $76.6 million. Net loss included the Company’s share of impairments of $33.3 million related primarily to assets which have been or will be marketed for sale in the near term and have fair market values below their prior respective carrying values. Impairments are added back to the Company's net income (loss) to calculate FFO and Core FFO. In the fourth quarter 2019, healthcare same store portfolio sequential quarter to quarter comparable NOI increased 11.1% and compared to the same period last year, fourth quarter 2019 same store NOI increased 8.4%. Fourth quarter 2019 NOI included an aggregate $5.6 million consolidated, or $4.0 million CLNY OP share, of one-time recovery of tenant rent receivables from certain tenants in the Skilled Nursing Facilities, Triple-Net Lease Senior Housing Properties and Hospitals portfolios and termination fees in the Medical Office Buildings portfolio. Also, third quarter 2019 NOI included a $1.6 million consolidated, or $1.2 million CLNY OP share, one-time write-off of a certain tenant rent receivable in the Hospitals portfolio. Excluding these one-time items from same store NOI, the healthcare same store portfolio sequential quarter to quarter comparable NOI would have been flat. Healthcare same store portfolio full year 2019 NOI was flat compared to 2018. The healthcare same store portfolio is defined as properties in operation throughout
6
| ||
the full periods presented under the comparison and included 358 properties in the comparisons. Properties acquired or disposed during these periods are excluded for the same store portfolio.
The following table presents NOI and certain operating metrics by property types in the Company’s Healthcare Real Estate segment:
Consolidated | CLNY OP | Same Store | ||||||||||||||||||||
NOI | Share NOI(1) | Consolidated NOI | Occupancy %(2) | TTM Lease Coverage(3) | ||||||||||||||||||
($ in millions) | Q4 2019 | Q4 2019 | Q4 2019 | Q3 2019 | Q4 2019 | Q3 2019 | 9/30/19 | 6/30/19 | ||||||||||||||
Senior Housing - Operating | $ | 15.7 | $ | 11.1 | $ | 15.7 | $ | 15.6 | 86.5 | % | 86.2 | % | N/A | N/A | ||||||||
Medical Office Buildings (MOB) | 13.8 | 9.8 | 13.8 | 12.9 | 82.2 | % | 82.2 | % | N/A | N/A | ||||||||||||
Triple-Net Lease: | ||||||||||||||||||||||
Senior Housing | 16.1 | 11.4 | 15.8 | 13.8 | 79.7 | % | 79.8 | % | 1.3x | 1.3x | ||||||||||||
Skilled Nursing Facilities | 24.4 | 17.3 | 24.4 | 23.4 | 82.7 | % | 82.5 | % | 1.2x | 1.2x | ||||||||||||
Hospitals | 6.6 | 4.7 | 4.3 | 0.8 | 65.3 | % | 61.3 | % | 1.3x | 1.3x | ||||||||||||
Healthcare Total | $ | 76.6 | $ | 54.3 | $ | 74.0 | $ | 66.5 | ||||||||||||||
___________________________________________________
(1) | CLNY OP Share NOI represents fourth quarter 2019 Consolidated NOI multiplied by CLNY OP’s ownership interest as of December 31, 2019. |
(2) | Occupancy % for Senior Housing - Operating represents average during the presented quarter, for MOB’s represents as of last day in the quarter and for other types represents average during the prior quarter. |
(3) | Represents the ratio of the tenant’s/operator’s EBITDAR to cash rent payable to the Company’s Healthcare Real Estate segment on a trailing twelve month basis. |
Asset Acquisition, Dispositions and Financing
During the fourth quarter 2019, the Company sold three unencumbered hospitals and 11 triple-net lease senior housing properties for aggregate consideration of $151 million, or $107 million CLNY OP share, resulting in net proceeds of $118 million, or $82 million CLNY OP share. In addition, the Company acquired a property in its U.K. triple-net leased senior housing portfolio for $13 million, which was funded through a development facility with the operator of the U.K. portfolio, pursuant to which the Company finances development subject to a purchase option.
During the fourth quarter 2019, the Healthcare Real Estate segment refinanced a £212 million loan on the U.K. triple-net leased senior housing portfolio with an interest rate of LIBOR plus 4.25% with a new £223 million fully extended five-year loan with an interest rate of LIBOR plus 3.75%, and a $48 million loan on skilled nursing facilities portfolios, extending the fully extended maturity date to 2024 at a similar interest rate. These refinancings, together with previously completed refinancing transactions in 2019, address all material near-term healthcare real estate loan maturities.
Industrial Real Estate
In December 2019, the Company completed the sale of its light industrial portfolio and related operating platform for an aggregate $5.7 billion, which resulted in a net cash gain and incentive fees of approximately $475 million and net cash proceeds of approximately $1.25 billion for the Company’s share. Accordingly, this segment will no longer be a reportable segment in the future and for all current and prior periods presented, the related operating results are presented as income from discontinued operations on the consolidated statement of operations. The Company continues to own the remaining bulk industrial assets, which are still held for sale with operating results presented as income from discontinued operations on the consolidated statements of operations.
As of December 31, 2019, the consolidated bulk industrial portfolio consisted of six bulk industrial buildings totaling 4.2 million rentable square feet across five major U.S. markets and was 67% leased. The Company's equity interest in the consolidated bulk industrial portfolio was approximately 51%, or $72 million, with the other 49% owned by third-party capital, which is managed by the Company.
During the fourth quarter 2019, Industrial segment net income attributable to common stockholders was $435.5 million, Core FFO was $11.6 million and consolidated NOI was $53.2 million, of which the bulk industrial portfolio contributed $3.3 million. This segment’s net income represents a partial quarter of activity through the closing date of the light industrial portfolio sale and included a $1.4 billion, or $487 million CLNY OP share, U.S. GAAP gain related to the sale, which is not included in Core FFO.
7
| ||
Hospitality Real Estate
As of December 31, 2019, the consolidated hospitality portfolio consisted of 157 properties: 87 select service properties, 66 extended stay properties and four full service properties. The Company’s equity interest in the consolidated Hospitality Real Estate segment was approximately 94% as of December 31, 2019. The hospitality portfolio consists primarily of select service and extended stay hotels located mostly in major metropolitan markets in the U.S., with the majority affiliated with top hotel brands. The select service hospitality portfolio referred to as the THL Hotel Portfolio, which the Company acquired through consensual transfer during the third quarter 2017, is not included in the Hospitality Real Estate segment and is included in the Other Equity and Debt segment.
During the fourth quarter 2019, this segment’s net loss attributable to common stockholders was $(35.5) million, Core FFO was $17.4 million and consolidated NOI before FF&E Reserve was $54.1 million. Net loss included the Company’s share of impairments of $13.4 million related primarily to assets which have fair market values below their respective carrying values due principally to new competition resulting in anticipated weaker future operating performance. Impairments are added back to the Company's net income (loss) to calculate FFO and Core FFO. Compared to the same period last year, fourth quarter 2019 hospitality same store portfolio revenue decreased (2.4)% and NOI before FF&E Reserve decreased (10.4)%, primarily due to incremental room demand generated from one-time events in the fourth quarter of 2018 and higher room revenue displacement from hotels under renovation and continued wage pressure during the fourth quarter of 2019. Excluding the impact of an aggregate $1.9 million of one-time events in the fourth quarter of 2018 and room revenue displacement in the fourth quarter of 2019, fourth quarter 2019 NOI before FFE Reserve decreased (7.6)% compared to the same period last year. Hospitality same store portfolio full year 2019 NOI before FF&E Reserve decreased (2.0)% compared to 2018. The Company’s hotels typically experience seasonal variations in occupancy, which may cause quarterly fluctuations in revenues and therefore sequential quarter to quarter revenue and NOI before FF&E Reserve result comparisons are not meaningful. The hospitality same store portfolio is defined as hotels in operation throughout the full periods presented under the comparison and included 157 hotels.
The following table presents NOI before FF&E Reserve and certain operating metrics by brands in the Company’s Hospitality Real Estate segment:
Same Store | |||||||||||||||||||||||||||||||||
Consolidated | CLNY OP Share | Consolidated | Avg. Daily Rate | RevPAR(3) | |||||||||||||||||||||||||||||
NOI before FF&E Reserve(1) | NOI before FF&E Reserve(2) | NOI before FF&E Reserve | Occupancy %(4) | (In dollars)(4) | (In dollars)(4) | ||||||||||||||||||||||||||||
($ in millions) | Q4 2019 | Q4 2019 | Q4 2019 | Q4 2018 | Q4 2019 | Q4 2018 | Q4 2019 | Q4 2018 | Q4 2019 | Q4 2018 | |||||||||||||||||||||||
Marriott | $ | 41.2 | $ | 38.7 | $ | 41.2 | $ | 47.4 | 69.4 | % | 70.6 | % | $ | 124 | $ | 127 | $ | 86 | $ | 89 | |||||||||||||
Hilton | 9.9 | 9.3 | 9.6 | 9.5 | 75.1 | % | 75.8 | % | 125 | 127 | 94 | 96 | |||||||||||||||||||||
Other | 3.0 | 2.8 | 3.0 | 3.1 | 77.5 | % | 77.9 | % | 128 | 134 | 100 | 105 | |||||||||||||||||||||
Total/W.A. | $ | 54.1 | $ | 50.8 | $ | 53.8 | $ | 60.0 | 70.8 | % | 71.9 | % | $ | 125 | $ | 127 | $ | 88 | $ | 91 | |||||||||||||
___________________________________________________
(1) | Fourth quarter 2019 consolidated FF&E reserve was $8.1 million. |
(2) | CLNY OP Share NOI before FF&E Reserve represents fourth quarter 2019 Consolidated NOI before FF&E Reserve multiplied by CLNY OP’s ownership interest as of December 31, 2019. |
(3) | RevPAR, or revenue per available room, represents a hotel's total guestroom revenue divided by the room count and the number of days in the period being measured. |
(4) | For each metric, data represents average during the presented quarter. |
Asset Dispositions and Financing
During the fourth quarter 2019, the Hospitality Real Estate segment disposed of an unencumbered hotel resulting in net proceeds of $11 million.
During the fourth quarter 2019, the Company refinanced an aggregate $982 million, or $895 million CLNY OP share, of debt in the Hospitality Real Estate segment, significantly extending the outside maturity dates to 2026 at slightly lower interest rates on average.
8
| ||
Colony Credit Real Estate, Inc. (“CLNC”)
Colony Credit Real Estate, Inc. is a commercial real estate credit REIT externally managed by the Company with $5.6 billion in assets and $2.2 billion in GAAP book equity value as of December 31, 2019. The Company owns approximately 48.0 million shares and share equivalents, or 36%, of CLNC and earns an annual base management fee of 1.5% on stockholders’ equity (as defined in the CLNC management agreement) and an incentive fee of 20% of CLNC’s Core Earnings over a 7% hurdle rate.
Concurrent with the announcement of its third quarter 2019 earnings, CLNC announced the bifurcation of its assets into (i) a Core Portfolio consisting of senior loans, mezzanine loans, preferred equity, CRE debt securities and net lease real estate; and (ii) a portfolio of Legacy, Non-Strategic (“LNS”) investments consisting of operating real estate, real estate private equity interests and certain retail and other legacy loans originated prior to the formation of CLNC. This bifurcation plan will allow CLNC to focus on the divestment of its LNS portfolio to redeploy into and grow its Core Portfolio. In conjunction with its focus on its Core Portfolio, CLNC meaningfully reduced the undepreciated book value of its LNS assets to better reflect their market value and reset its annualized dividend from $1.74 per share to $1.20 per share, which is now fully covered by in place Core Earnings from its Core Portfolio alone. As a result of the significant reduction to CLNC’s book value, the Company amended its management agreement with CLNC to align the fee base with the newly reduced book value, which results in a decrease in annual base management fees from $45 million to $33 million effective in the beginning of the fourth quarter 2019. The liquidation of LNS investments and capital redeployment into the Core Portfolio, combined with the reduced management fee, are expected to increase CLNC’s Core Earnings and narrow the discount between CLNC’s share price and book value, of which the Company’s 36% interest represents approximately $850 million of undepreciated book value.
CLNC also amended its definition of Core Earnings to include provision for loan losses, but exclude realized and unrealized real estate gains and losses (consistent with NAREIT FFO) and earnings related to LNS assets and businesses to focus its results on the earnings of its Core Portfolio and better align comparability to the non-GAAP earnings definitions of its peers. During the fourth quarter 2019, this segment’s net income attributable to common stockholders was $11.8 million and Core FFO was $15.4 million. CLNY’s Core FFO pickup from CLNC represents a 36% share of CLNC's Core Earnings. Please refer to CLNC's earnings release and financial supplemental furnished on its Form 8-K and its Annual Report on its Form 10-K filed with the SEC for additional details.
Other Equity and Debt ("OED")
The Company owns a diversified group of strategic and non-strategic real estate and real estate-related debt and equity investments. Strategic investments include the Company’s digital balance sheet interests in digital real estate, including the 20% controlling interest in DataBank and the $250 million GP co-investment commitment to DCP, and non-digital investments for which the Company acts as a general partner and/or manager (“GP Co-Investments”) and receives various forms of investment management economics on the related third-party capital. Non-strategic investments are composed of those investments the Company does not intend to own for the long term including commercial real estate equity and debt investments and other real estate-related securities, among other holdings.
During the fourth quarter 2019, this segment’s aggregate net loss attributable to common stockholders was $(4.0) million and Core FFO was $(2.0) million. Net loss and Core FFO included a partial 12 calendar days of activity from DataBank, which was acquired in December 2019. Core FFO included an aggregate $21.4 million of impairments in unconsolidated joint ventures, provision for loan losses and other net investment losses primarily related to the sale of a U.S. multi-tenant office property and impairments to certain CRE securities.
9
| ||
As of December 31, 2019, the undepreciated carrying value of assets and equity within the OED segment were $3.1 billion and $1.8 billion, respectively.
CLNY OP Share | |||||||||||||||
Undepreciated Carrying Value | |||||||||||||||
December 31, 2019 | September 30, 2019 | ||||||||||||||
($ in millions) | Assets | Equity | Assets | Equity | |||||||||||
Strategic: | |||||||||||||||
Digital - direct investments and GP co-investments | $ | 343 | $ | 233 | $ | 53 | $ | 53 | |||||||
Other GP co-investments | 1,110 | 637 | 1,092 | 610 | |||||||||||
Strategic Subtotal | 1,453 | 870 | 1,145 | 663 | |||||||||||
Strategic % of Total Other Equity and Debt | 47 | % | 48 | % | 41 | % | 41 | % | |||||||
Non-Strategic: | |||||||||||||||
Other Real Estate Equity & Albertsons | 1,165 | 551 | 1,185 | 546 | |||||||||||
Real Estate Debt | 247 | 247 | 244 | 244 | |||||||||||
Net Lease Real Estate Equity | 187 | 83 | 184 | 80 | |||||||||||
CRE Securities and Real Estate Private Equity Funds | 60 | 60 | 65 | 65 | |||||||||||
Non-Strategic Subtotal | 1,659 | 941 | 1,678 | 935 | |||||||||||
Non-Strategic % of Total Other Equity and Debt | 53 | % | 52 | % | 59 | % | 59 | % | |||||||
Total Other Equity and Debt | $ | 3,112 | $ | 1,811 | $ | 2,823 | $ | 1,598 | |||||||
OED Segment Asset Dispositions
During the fourth quarter 2019, the Company completed the planned sales and/or monetization of $66 million of assets, with net equity proceeds of $35 million from various investments, including $27 million from the GP co-investments category and $8 million from the Other Real Estate Equity category.
Liquidity and Financing
As of February 25, 2020, the Company had significant liquidity of $1.3 billion including $520 million cash-on-hand and through availability under its revolving credit facility.
Common Stock and Operating Company Units
As of February 25, 2020, the Company had 487.4 million shares of Class A and B common stock outstanding and the Company’s operating partnership had 53.3 million operating company units outstanding held by members other than the Company or its subsidiaries, which includes 21.5 million operating company units issued on July 25, 2019 as part of the consideration for the acquisition of Digital Bridge Holdings.
As of February 25, 2020, the Company had $247 million remaining under its share repurchase program.
10
| ||
Common and Preferred Dividends
On November 6, 2019, the Company’s Board of Directors declared a quarterly cash dividend of $0.11 per share to holders of Class A and Class B common stock for the fourth quarter of 2019, which was paid on January 15, 2020 to respective stockholders of record on December 31, 2019. The Board of Directors also declared cash dividends with respect to each series of the Company’s cumulative redeemable perpetual preferred stock each in accordance with terms of such series as follows: with respect to each of the Series G stock - $0.46875 per share, Series H stock - $0.4453125 per share, Series I stock - $0.446875 per share and Series J stock - $0.4453125 per share, such dividends were paid on January 15, 2020 to the respective stockholders of record on January 10, 2020.
On January 10, 2020, the Company redeemed all of its outstanding 8.25% Series B and 8.75% Series E cumulative redeemable perpetual preferred stock for $408 million (28% of the total perpetual preferred stock outstanding), including accrued interest of $5 million, eliminating $34 million of annualized preferred dividends.
On February 19, 2020, the Company’s Board of Directors declared a quarterly cash dividend of $0.11 per share to holders of Class A and Class B common stock for the first quarter of 2020, which will be paid on April 15, 2020 to respective stockholders of record on March 31, 2020. The Board of Directors also declared cash dividends with respect to each series of the Company’s cumulative redeemable perpetual preferred stock each in accordance with terms of such series as follows: with respect to each of the Series G stock - $0.46875 per share, Series H stock - $0.4453125 per share, Series I stock - $0.446875 per share and Series J stock - $0.4453125 per share, such dividends to be paid on April 15, 2020 to the respective stockholders of record on April 10, 2020.
Non-GAAP Financial Measures and Definitions
Assets Under Management (“AUM”)
Assets for which the Company and its affiliates provide investment management services, including assets for which the Company may or may not charge management fees and/or performance allocations. AUM is based on reported gross undepreciated carrying value of managed investments as reported by each underlying vehicle at December 31, 2019. AUM further includes a) uncalled capital commitments and b) includes the Company’s pro-rata share of each affiliate non wholly-owned real estate investment management platform’s assets as presented and calculated by the affiliate. Affiliates include Alpine Energy LLC, RXR Realty LLC and American Healthcare Investors. The Company's calculations of AUM may differ materially from the calculations of other asset managers, and as a result, this measure may not be comparable to similar measures presented by other asset managers.
CLNY Operating Partnership (“CLNY OP”)
The operating partnership through which the Company conducts all of its activities and holds substantially all of its assets and liabilities. CLNY OP share excludes noncontrolling interests in investment entities.
Fee-Earning Equity Under Management (“FEEUM”)
Equity for which the Company and its affiliates provides investment management services and derives management fees and/or performance allocations. FEEUM generally represents a) the basis used to derive fees, which may be based on invested equity, stockholders’ equity, or fair value pursuant to the terms of each underlying investment management agreement and b) the Company’s pro-rata share of fee bearing equity of each affiliate as presented and calculated by the affiliate. Affiliates include Alpine Energy LLC, RXR Realty LLC and American Healthcare Investors. The Company's calculations of FEEUM may differ materially from the calculations of other asset managers, and as a result, this measure may not be comparable to similar measures presented by other asset managers.
Funds From Operations (“FFO”) and Core Funds From Operations (“Core FFO”)
The Company calculates funds from operations (“FFO”) in accordance with standards established by the Board of Governors of the National Association of Real Estate Investment Trusts, which defines FFO as net income or loss calculated in accordance with GAAP, excluding (i) extraordinary items, as defined by GAAP; (ii) gains and losses from sales of depreciable real estate; (iii) impairment write-downs associated with depreciable real estate; (iv) gains and losses from a change in control in connection with interests in depreciable real estate or in-substance real estate, plus (v) real estate-related depreciation and amortization; and (vi) including similar adjustments for equity method investments. Included in FFO are gains and losses from sales of assets which are not depreciable real estate such as loans receivable, equity method investments, as well as equity and debt securities, as applicable.
The Company computes core funds from operations (“Core FFO”) by adjusting FFO for the following items, including the Company’s share of these items recognized by its unconsolidated partnerships and joint ventures: (i) gains and losses from sales of depreciable real estate within the Other Equity and Debt segment, net of depreciation, amortization and impairment previously adjusted for FFO; (ii) gains and losses from sales of businesses within the Investment Management segment and impairment write-downs associated with the Investment Management segment; (iii) equity-based compensation expense; (iv) effects of straight-line rent revenue and expense; (v) amortization of acquired above- and below-market lease values; (vi) amortization of deferred financing costs and debt premiums and discounts; (vii) unrealized fair value gains or losses on interest rate and foreign currency hedges, and foreign currency
11
| ||
remeasurements and realized gains and losses on interest rate hedging instruments existing at the time of the January 2017 merger with remaining terms greater than one year that served as economic hedges for any financing or refinancing of the Company's real estate verticals; (viii) acquisition and merger related transaction costs; (ix) restructuring and merger integration costs; (x) amortization and impairment of finite-lived intangibles related to investment management contracts and customer relationships; (xi) gain on remeasurement of consolidated investment entities and the effect of amortization thereof; (xii) non-real estate depreciation and amortization; (xiii) change in fair value of contingent consideration; and (xiv) tax effect on certain of the foregoing adjustments. Beginning with the first quarter of 2018, the Company’s Core FFO from its interest in Colony Credit Real Estate (NYSE: CLNC) and NorthStar Realty Europe (NYSE: NRE) represented its percentage interest multiplied by CLNC’s Core Earnings and NRE’s Cash Available for Distribution (“CAD”), respectively. Refer to CLNC’s and NRE's respective filings with the SEC for the definition and calculation of Core Earnings and CAD.
FFO and Core FFO should not be considered alternatives to GAAP net income as indications of operating performance, or to cash flows from operating activities as measures of liquidity, nor as indications of the availability of funds for our cash needs, including funds available to make distributions. FFO and Core FFO should not be used as supplements to or substitutes for cash flow from operating activities computed in accordance with GAAP. The Company’s calculations of FFO and Core FFO may differ from methodologies utilized by other REITs for similar performance measurements, and, accordingly, may not be comparable to those of other REITs.
The Company uses FFO and Core FFO as supplemental performance measures because, in excluding real estate depreciation and amortization and gains and losses from property dispositions, it provides a performance measure that captures trends in occupancy rates, rental rates, and operating costs. The Company also believes that, as widely recognized measures of the performance of REITs, FFO and Core FFO will be used by investors as a basis to compare its operating performance with that of other REITs. However, because FFO and Core FFO exclude depreciation and amortization and capture neither the changes in the value of the Company’s properties that resulted from use or market conditions nor the level of capital expenditures and leasing commissions necessary to maintain the operating performance of its properties, all of which have real economic effect and could materially impact the Company’s results from operations, the utility of FFO and Core FFO as measures of the Company’s performance is limited. FFO and Core FFO should be considered only as supplements to GAAP net income as a measure of the Company’s performance. Additionally, Core FFO excludes the impact of certain fair value fluctuations, which, if they were to be realized, could have a material impact on the Company’s operating performance. The Company also presents Core FFO excluding gains and losses from sales of certain investments as well as its share of similar adjustments for CLNC. The Company believes that such a measure is useful to investors as it excludes periodic gains and losses from sales of investments that are not representative of its ongoing operations.
This release also includes certain forward-looking non-GAAP information including Core FFO. Due to the high variability and difficulty in making accurate forecasts and projections of some of the information excluded from these estimates, together with some of the excluded information not being ascertainable or accessible, the Company is unable to quantify certain amounts that would be required to be included in the most directly comparable GAAP financial measures without unreasonable efforts.
Net Operating Income (“NOI”)
NOI for our real estate segments represents total property and related income less property operating expenses, adjusted for the effects of (i) straight-line rental income adjustments; (ii) amortization of acquired above- and below-market lease adjustments to rental income; and (iii) other items such as adjustments for the Company’s share of NOI of unconsolidated ventures.
The Company believes that NOI is a useful measure of operating performance of its respective real estate portfolios as it is more closely linked to the direct results of operations at the property level. NOI also reflects actual rents received during the period after adjusting for the effects of straight-line rents and amortization of above- and below- market leases; therefore, a comparison of NOI across periods better reflects the trend in occupancy rates and rental rates of the Company’s properties.
NOI excludes historical cost depreciation and amortization, which are based on different useful life estimates depending on the age of the properties, as well as adjust for the effects of real estate impairment and gains or losses on sales of depreciated properties, which eliminate differences arising from investment and disposition decisions. This allows for comparability of operating performance of the Company’s properties period over period and also against the results of other equity REITs in the same sectors. Additionally, by excluding corporate level expenses or benefits such as interest expense, any gain or loss on early extinguishment of debt and income taxes, which are incurred by the parent entity and are not directly linked to the operating performance of the Company’s properties, NOI provides a measure of operating performance independent of the Company’s capital structure and indebtedness. However, the exclusion of these items as well as others, such as capital expenditures and leasing costs, which are necessary to maintain the operating performance of the Company’s properties, and transaction costs and administrative costs, may limit the usefulness of NOI. NOI may fail to capture significant trends in these components of U.S. GAAP net income (loss) which further limits its usefulness.
12
| ||
NOI should not be considered as an alternative to net income (loss), determined in accordance with U.S. GAAP, as an indicator of operating performance. In addition, the Company’s methodology for calculating NOI involves subjective judgment and discretion and may differ from the methodologies used by other comparable companies, including other REITs, when calculating the same or similar supplemental financial measures and may not be comparable with other companies.
NOI before Reserve for Furniture, Fixtures and Equipment Expenditures (“NOI before FF&E Reserve”)
For our hospitality real estate segment, NOI before FF&E Reserve represents NOI before the deduction of reserve contributions for the repair, replacement and refurbishment of furniture, fixtures, and equipment ("FF&E"), which are typically 4% to 5% of revenues, and required under certain debt agreements and/or franchise and brand-managed hotel agreements.
Earnings Before Interest, Tax, Depreciation, Amortization and Rent (“EBITDAR”)
Represents earnings before interest, taxes, depreciation, amortization and rent for facilities accruing to the tenant/operator of the property (not the Company) for the period presented. The Company uses EBITDAR in determining TTM Lease Coverage for triple-net lease properties in its Healthcare Real Estate segment. EBITDAR has limitations as an analytical tool. EBITDAR does not reflect historical cash expenditures or future cash requirements for facility capital expenditures or contractual commitments. In addition, EBITDAR does not represent a property's net income or cash flow from operations and should not be considered an alternative to those indicators. The Company utilizes EBITDAR as a supplemental measure of the ability of the Company's operators/tenants to generate sufficient liquidity to meet related obligations to the Company.
TTM Lease Coverage
Represents the ratio of EBITDAR to recognized cash rent for owned facilities on a trailing twelve month basis. TTM Lease Coverage is a supplemental measure of a tenant’s/operator’s ability to meet their cash rent obligations to the Company. However, its usefulness is limited by, among other things, the same factors that limit the usefulness of EBITDAR.
The information related to the Company’s tenants/operators that is provided in this press release has been provided by, or derived from information provided by, such tenants/operators. The Company has not independently verified this information and has no reason to believe that such information is inaccurate in any material respect. The Company is providing this data for informational purposes only.
Fourth Quarter 2019 Conference Call
The Company will conduct a conference call to discuss the financial results on Friday, February 28, 2020 at 7:00 a.m. PT / 10:00 a.m. ET. To participate in the event by telephone, please dial (877) 407-4018 ten minutes prior to the start time (to allow time for registration). International callers should dial (201) 689-8471. The call will also be broadcast live over the Internet and can be accessed on the Public Shareholders section of the Company’s website at www.clny.com. A webcast of the call will be available for 90 days on the Company’s website.
For those unable to participate during the live call, a replay will be available starting February 28, 2020, at 10:00 a.m. PT / 1:00 p.m. ET, through March 6, 2020, at 8:59 p.m. PT / 11:59 p.m. ET. To access the replay, dial (844) 512-2921 (U.S.), and use passcode 13698552. International callers should dial (412) 317-6671 and enter the same conference ID number.
Corporate Overview and Supplemental Financial Report
A Fourth Quarter 2019 Corporate Overview and Supplemental Financial Report is available on the Company’s website at www.clny.com. This information has also been furnished to the U.S. Securities and Exchange Commission in a Current Report on Form 8-K.
About Colony Capital, Inc.
Colony Capital, Inc. (NYSE: CLNY) is a global investment firm with a focus on building the leading digital real estate provider and funding source for the occupancy, infrastructure, equity and credit needs of the world’s mobile communications and data-driven companies. The Company has assets under management of approximately $49 billion composed of $36 billion of capital managed on behalf of third-party institutional and retail investors and $13 billion of investment interests on its own balance sheet. The Company’s owns and operates an investment management business with $14 billion in digital real estate investments and $22 billion in traditional commercial real estate debt and equity investments. With respect to investment interests on its balance sheet, the Company owns (a) a controlling 20% interest in DataBank, a leading provider of enterprise-class data center, cloud, and connectivity services (b) a 71% interest in 358 healthcare properties, (c) a 94% interest in 157 hospitality properties, (d) approximately 48 million shares of Colony Credit Real Estate, Inc. (NYSE: CLNC) and (e) interests in various other equity and debt investments including general partnership interests in funds management by the Company, commercial real estate equity and debt investments and other real estate-related securities. The Company is headquartered in Los Angeles with key offices in Boca Raton, New York, Paris and London, and has over 400 employees across 21 locations in 13 countries. For additional information regarding the Company and its management and business, please refer to www.clny.com.
13
| ||
Cautionary Statement Regarding Forward-Looking Statements
This press release may contain forward-looking statements within the meaning of the federal securities laws. Forward-looking statements relate to expectations, beliefs, projections, future plans and strategies, anticipated events or trends and similar expressions concerning matters that are not historical facts. In some cases, you can identify forward-looking statements by the use of forward-looking terminology such as “may,” “will,” “should,” “expects,” “intends,” “plans,” “anticipates,” “believes,” “estimates,” “predicts,” or “potential” or the negative of these words and phrases or similar words or phrases which are predictions of or indicate future events or trends and which do not relate solely to historical matters. You can also identify forward-looking statements by discussions of strategy, plans or intentions.
Forward-looking statements involve known and unknown risks, uncertainties, assumptions and contingencies, many of which are beyond the Company’s control, and may cause the Company’s actual results to differ significantly from those expressed in any forward-looking statement. Factors that might cause such a difference include, without limitation, the Company’s ability to become the leading platform for digital real estate and infrastructure, including whether 2020 will be a transformative, transitional year that positions the Company to take advantage of the significant global opportunities in the digital ecosystem and deliver value for shareholders, including the ability to execute on all or any of the Company’s related initiatives and whether the Company and its stockholders will realize any benefits from such initiatives, the availability of significant global opportunities in the digital ecosystem, whether the Company will continue to pivot away from certain non-digital investment management businesses and any resulting impact of such pivot on the Company’s financial condition, the Company’s ability to transition and rotate to an investment management and operating business focused on digital real estate and infrastructure, whether the Company will enter into a definitive agreement with CLNC or a third party to dispose of the Company’s management agreement with CLNC, in the form of an internalization of CLNC’s management or sale of the Company’s management agreement with CLNC or another transaction with similar effect within the timeframe contemplated or at all, whether the Company’s operations of its non-digital business units will result in maximizing cash flows and value over time, including whether cash flows will be improved for the healthcare and hospitality units, the impact of impairments, the impact of changes to the Company’s management or board of directors, employee and organizational structure, including the implementation and timing of CEO succession plans, DCP’s ability to complete the pending acquisition of Zayo Group Holdings, Inc. on the terms contemplated or at all, the Company’s financial flexibility and liquidity, including borrowing capacity under its revolving credit facility, the use of sales proceeds and available liquidity, the performance of the Company’s investment in CLNC, including the CLNC share price as compared to book value and how the Company evaluates the Company’s investment in CLNC, whether the Company’s exploration of potential opportunities to maximize value of the credit and opportunity fund investment management business will result in a definitive transaction in the form of a joint venture, sale or realignment of operational management or at all, the Company’s ability to minimize balance sheet commitments to its managed investment vehicles, the performance of the Company’s investment in DataBank and whether the Company will continue to invest in edge/colocation data center sector and support future growth opportunities through potential add-on acquisitions and greenfield edge data center developments, and whether if consummated such additional investments and growth opportunities result in any of the benefits we anticipate or at all, whether the Company will realize any anticipated benefits from the CRC strategic joint venture, including whether the related commitment will be funded in the amounts contemplated and the Company’s ability to syndicate investments to third parties through its Alpine Energy platform, the Company's portfolio composition, whether the Company will continue to generate liquidity by additional sales of assets in its Other Equity and Debt segment (other than Digital related investments) within the timeframe, in the amounts targeted or at all, the Company's expected taxable income and net cash flows, excluding the contribution of gains, whether the Company will achieve its anticipated 2020 Core FFO per share excluding gains and losses, or maintain or produce higher Core FFO per share (including or excluding gains and losses from sales of certain investments) in the near term or ever, the Company’s ability to maintain or grow the dividend at all in the future, including the Company’s expectation to maintain its common stock dividend at $0.44 per share for the full year 2020, the impact of any changes to the Company’s management agreements with NorthStar Healthcare Income, Inc., CLNC and other managed investment vehicles, whether Colony Capital will be able to maintain its qualification as a REIT for U.S. federal income tax purposes, the timing of and ability to deploy available capital, including whether any redeployment of capital will generate higher total returns, the timing of and ability to complete repurchases of Colony Capital’s stock, Colony Capital’s ability to maintain inclusion and relative performance on the RMZ, Colony Capital’s leverage, including the Company’s ability to reduce debt and the timing and amount of borrowings under its credit facility, increased interest rates and operating costs, adverse economic or real estate developments in Colony Capital’s markets, Colony Capital’s failure to successfully operate or lease acquired properties, decreased rental rates, increased vacancy rates or failure to renew or replace expiring leases, increased costs of capital expenditures, defaults on or non-renewal of leases by tenants, the impact of economic conditions on the borrowers of Colony Capital’s commercial real estate debt investments and the commercial mortgage loans underlying its commercial mortgage backed securities, adverse general and local economic conditions, an unfavorable capital market environment, decreased leasing activity or lease renewals, and other risks and uncertainties, including those detailed in our Annual Report on Form 10-K for the fiscal year ended December 31, 2018 and our Quarterly Report on Form 10-Q for the quarter ended June 30, 2019, under the heading “Risk Factors,” as such factors may be updated from time to time in our subsequent periodic filings with the U.S. Securities and Exchange Commission (“SEC”). All forward-looking statements reflect the Company’s good faith beliefs, assumptions and expectations, but they are not guarantees of future performance. Additional information about these and other factors can be found in Colony Capital’s reports filed from time to time with the SEC.
14
| ||
Colony Capital cautions investors not to unduly rely on any forward-looking statements. The forward-looking statements speak only as of the date of this press release. Colony Capital is under no duty to update any of these forward-looking statements after the date of this press release, nor to conform prior statements to actual results or revised expectations, and Colony Capital does not intend to do so.
Source: Colony Capital, Inc.
Investor Contacts:
Addo Investor Relations
Lasse Glassen
310-829-5400
(FINANCIAL TABLES FOLLOW)
15
| ||
COLONY CAPITAL, INC.
CONSOLIDATED BALANCE SHEETS
(In thousands, except per share data)
December 31, 2019 | December 31, 2018 | |||||||
Assets | ||||||||
Cash and cash equivalents | $ | 1,205,190 | $ | 461,912 | ||||
Restricted cash | 203,923 | 364,605 | ||||||
Real estate, net | 10,860,518 | 10,826,010 | ||||||
Loans receivable, net | 1,552,824 | 1,659,217 | ||||||
Equity and debt investments | 2,313,805 | 2,529,747 | ||||||
Goodwill | 1,452,891 | 1,514,561 | ||||||
Deferred leasing costs and intangible assets, net | 638,853 | 445,930 | ||||||
Assets held for sale | 870,052 | 3,969,635 | ||||||
Other assets | 682,648 | 400,143 | ||||||
Due from affiliates | 51,480 | 43,489 | ||||||
Total assets | $ | 19,832,184 | $ | 22,215,249 | ||||
Liabilities | ||||||||
Debt, net | $ | 8,983,908 | $ | 8,975,372 | ||||
Accrued and other liabilities | 1,015,898 | 634,144 | ||||||
Intangible liabilities, net | 111,484 | 147,470 | ||||||
Liabilities related to assets held for sale | 268,152 | 1,218,495 | ||||||
Due to affiliates | 34,064 | — | ||||||
Dividends and distributions payable | 83,301 | 84,013 | ||||||
Preferred stock redemptions payable | 402,855 | — | ||||||
Total liabilities | 10,899,662 | 11,059,494 | ||||||
Commitments and contingencies | ||||||||
Redeemable noncontrolling interests | 6,107 | 9,385 | ||||||
Equity | ||||||||
Stockholders’ equity: | ||||||||
Preferred stock, $0.01 par value per share; $1,033,750 and $1,436,605 liquidation preference, respectively; 250,000 shares authorized; 41,350 and 57,464 shares issued and outstanding, respectively | 999,490 | 1,407,495 | ||||||
Common stock, $0.01 par value per share | ||||||||
Class A, 949,000 shares authorized; 487,044 and 483,347 shares issued and outstanding, respectively | 4,871 | 4,834 | ||||||
Class B, 1,000 shares authorized; 734 shares issued and outstanding | 7 | 7 | ||||||
Additional paid-in capital | 7,553,599 | 7,598,019 | ||||||
Accumulated deficit | (3,389,592 | ) | (2,018,302 | ) | ||||
Accumulated other comprehensive income | 47,668 | 13,999 | ||||||
Total stockholders’ equity | 5,216,043 | 7,006,052 | ||||||
Noncontrolling interests in investment entities | 3,254,188 | 3,779,728 | ||||||
Noncontrolling interests in Operating Company | 456,184 | 360,590 | ||||||
Total equity | 8,926,415 | 11,146,370 | ||||||
Total liabilities, redeemable noncontrolling interests and equity | $ | 19,832,184 | $ | 22,215,249 | ||||
16
| ||
COLONY CAPITAL, INC.
CONSOLIDATED STATEMENTS OF OPERATIONS
(In thousands, except per share data)
Three Months Ended December 31, | Year Ended December 31, | |||||||||||||||
2019 | 2018 | 2019 | 2018 | |||||||||||||
(unaudited) | (unaudited) | |||||||||||||||
Revenues | ||||||||||||||||
Property operating income | $ | 446,568 | $ | 459,568 | $ | 1,856,409 | $ | 1,960,559 | ||||||||
Interest income | 45,409 | 47,262 | 166,771 | 214,588 | ||||||||||||
Fee income | 45,600 | 37,710 | 223,915 | 144,443 | ||||||||||||
Other income | 14,784 | 11,590 | 79,259 | 47,352 | ||||||||||||
Total revenues | 552,361 | 556,130 | 2,326,354 | 2,366,942 | ||||||||||||
Expenses | ||||||||||||||||
Property operating expense | 266,576 | 279,120 | 1,090,909 | 1,150,656 | ||||||||||||
Interest expense | 128,877 | 137,441 | 535,538 | 552,838 | ||||||||||||
Investment and servicing expense | 26,696 | 11,567 | 78,258 | 67,113 | ||||||||||||
Transaction costs | 685 | 3,681 | 3,607 | 7,266 | ||||||||||||
Placement fees | 1,429 | 1,138 | 1,802 | 7,615 | ||||||||||||
Depreciation and amortization | 110,053 | 111,321 | 489,792 | 443,302 | ||||||||||||
Provision for loan loss | 33 | 15,901 | 35,880 | 43,034 | ||||||||||||
Impairment loss | 471,227 | 288,494 | 1,146,443 | 587,275 | ||||||||||||
Compensation expense | ||||||||||||||||
Cash and equity-based compensation | 53,836 | 69,797 | 214,826 | 213,882 | ||||||||||||
Carried interest and incentive fee compensation | 3,300 | 5,950 | 16,564 | 7,485 | ||||||||||||
Administrative expenses | 25,812 | 23,041 | 90,356 | 92,431 | ||||||||||||
Total expenses | 1,088,524 | 947,451 | 3,703,975 | 3,172,897 | ||||||||||||
Other income (loss) | ||||||||||||||||
Gain on sale of real estate assets | 19,162 | 67,729 | 62,916 | 159,598 | ||||||||||||
Other gain (loss), net | (10,165 | ) | (82,025 | ) | (193,302 | ) | 51,706 | |||||||||
Equity method earnings (losses) | 38,064 | (43,939 | ) | (140,384 | ) | (9,601 | ) | |||||||||
Equity method earnings—carried interest | 5,424 | 5,688 | 11,682 | 9,525 | ||||||||||||
Loss before income taxes | (483,678 | ) | (443,868 | ) | (1,636,709 | ) | (594,727 | ) | ||||||||
Income tax benefit (expense) | (252 | ) | 24,691 | (14,003 | ) | 59,970 | ||||||||||
Loss from continuing operations | (483,930 | ) | (419,177 | ) | (1,650,712 | ) | (534,757 | ) | ||||||||
Income from discontinued operations | 1,415,658 | 11,482 | 1,501,797 | 39,582 | ||||||||||||
Net loss | 931,728 | (407,695 | ) | (148,915 | ) | (495,175 | ) | |||||||||
Net income (loss) attributable to noncontrolling interests: | ||||||||||||||||
Redeemable noncontrolling interests | 242 | (5,750 | ) | 2,559 | (3,708 | ) | ||||||||||
Investment entities | 938,616 | (6,523 | ) | 990,360 | 67,994 | |||||||||||
Operating Company | (2,867 | ) | (25,345 | ) | (93,027 | ) | (39,854 | ) | ||||||||
Net loss attributable to Colony Capital, Inc. | (4,263 | ) | (370,077 | ) | (1,048,807 | ) | (519,607 | ) | ||||||||
Preferred stock redemption | (5,150 | ) | — | (5,150 | ) | (3,995 | ) | |||||||||
Preferred stock dividends | 27,138 | 27,137 | 108,550 | 117,097 | ||||||||||||
Net loss attributable to common stockholders | $ | (26,251 | ) | $ | (397,214 | ) | $ | (1,152,207 | ) | $ | (632,709 | ) | ||||
Basic loss per share | ||||||||||||||||
Loss from continuing operations per basic common share | $ | (0.95 | ) | $ | (0.83 | ) | $ | (3.38 | ) | $ | (1.31 | ) | ||||
Net loss per basic common share | $ | (0.06 | ) | $ | (0.82 | ) | $ | (2.41 | ) | $ | (1.28 | ) | ||||
Diluted loss per share | ||||||||||||||||
Loss from continuing operations per diluted common share | $ | (0.95 | ) | $ | (0.83 | ) | $ | (3.38 | ) | $ | (1.31 | ) | ||||
Net loss per diluted common share | $ | (0.06 | ) | $ | (0.82 | ) | $ | (2.41 | ) | $ | (1.28 | ) | ||||
Weighted average number of shares | ||||||||||||||||
Basic | 479,776 | 484,754 | 479,588 | 496,993 | ||||||||||||
Diluted | 479,776 | 484,754 | 479,588 | 496,993 | ||||||||||||
17
| ||
COLONY CAPITAL, INC.
FUNDS FROM OPERATIONS AND CORE FUNDS FROM OPERATIONS
(In thousands, except per share data)
(Unaudited)
Three Months Ended December 31, 2019 | Year Ended December 31, 2019 | |||||||
Net loss attributable to common stockholders | $ | (26,251 | ) | $ | (1,152,207 | ) | ||
Adjustments for FFO attributable to common interests in Operating Company and common stockholders: | ||||||||
Net loss attributable to noncontrolling common interests in Operating Company | (2,867 | ) | (93,027 | ) | ||||
Real estate depreciation and amortization | 118,253 | 548,766 | ||||||
Impairment of real estate | 60,273 | 351,395 | ||||||
Gain from sales of real estate | (1,449,040 | ) | (1,524,290 | ) | ||||
Less: Adjustments attributable to noncontrolling interests in investment entities | 910,702 | 719,225 | ||||||
FFO attributable to common interests in Operating Company and common stockholders | (388,930 | ) | (1,150,138 | ) | ||||
Additional adjustments for Core FFO attributable to common interests in Operating Company and common stockholders: | ||||||||
Gains and losses from sales of depreciable real estate within the Other Equity and Debt segment, net of depreciation, amortization and impairment previously adjusted for FFO (1) | 637 | (47,172 | ) | |||||
Gains and losses from sales of businesses within the Investment Management segment and impairment write-downs associated with the Investment Management segment | 399,999 | 809,419 | ||||||
CLNC Core Earnings & NRE Cash Available for Distribution adjustments (2) | (5,401 | ) | 263,707 | |||||
Equity-based compensation expense | 20,154 | 48,482 | ||||||
Straight-line rent revenue and expense | (5,735 | ) | (18,462 | ) | ||||
Amortization of acquired above- and below-market lease values, net | (9,991 | ) | (20,884 | ) | ||||
Amortization of deferred financing costs and debt premiums and discounts | 49,253 | 108,409 | ||||||
Unrealized fair value losses on interest rate and foreign currency hedges, and foreign currency remeasurements and realized gains and losses on interest rate hedging instruments existing at the time of the January 2017 merger with remaining terms greater than one year that served as economic hedges for any financing or refinancing of the Company's real estate verticals | (889 | ) | 239,709 | |||||
Acquisition and merger-related transaction costs | (944 | ) | 3,335 | |||||
Restructuring and merger integration costs (3) | 16,684 | 36,406 | ||||||
Amortization and impairment of investment management intangibles | 8,640 | 89,371 | ||||||
Non-real estate depreciation and amortization | 1,922 | 6,652 | ||||||
Gain on consolidation of equity method investment | — | (51,400 | ) | |||||
Amortization of gain on remeasurement of consolidated investment entities | 6 | 3,813 | ||||||
Tax effect of Core FFO adjustments, net | (7,864 | ) | (18,231 | ) | ||||
Preferred share redemption gain | (5,150 | ) | (5,150 | ) | ||||
Less: Adjustments attributable to noncontrolling interests in investment entities | (24,801 | ) | (31,588 | ) | ||||
Core FFO attributable to common interests in Operating Company and common stockholders | $ | 47,590 | $ | 266,278 | ||||
FFO per common share / common OP unit (4) | $ | (0.72 | ) | $ | (2.18 | ) | ||
FFO per common share / common OP unit—diluted (4)(5) | $ | (0.72 | ) | $ | (2.18 | ) | ||
Core FFO per common share / common OP unit (4) | $ | 0.09 | $ | 0.50 | ||||
Core FFO per common share / common OP unit—diluted (4)(5)(6) | $ | 0.09 | $ | 0.50 | ||||
Weighted average number of common OP units outstanding used for FFO and Core FFO per common share and OP unit (4) | 541,263 | 527,691 | ||||||
Weighted average number of common OP units outstanding used for FFO per common share and OP unit—diluted (4)(5) | 541,263 | 527,691 | ||||||
Weighted average number of common OP units outstanding used for Core FFO per common share and OP unit—diluted (4)(5)(6) | 541,263 | 528,756 | ||||||
18
| ||
__________
(1) | For the three months ended December 31, 2019, net of $18.0 million consolidated or $9.6 million CLNY OP share and for the nine months ended December 31, 2019, net of $111.9 million consolidated or $70.7 million CLNY OP share of depreciation, amortization and impairment charges previously adjusted to calculate FFO. |
(2) | Represents adjustments to align the Company’s Core FFO with CLNC’s definition of Core Earnings and NRE’s definition of Cash Available for Distribution (“CAD”) to reflect the Company’s percentage interest in the respective company’s earnings. |
(3) | Restructuring and merger integration costs primarily represent costs and charges incurred as a result of the corporate restructuring and reorganization plan announced in November 2018 and the implementation of the digital evolution, including the completed sale of the Industrial business, NorthStar Realty Europe and future sales and disposition of non-digital businesses, platforms and investments. These costs and charges include severance, retention, relocation, transition and other related restructuring costs, which are not reflective of the Company’s core operating performance and the Company does not expect to incur these costs subsequent to the completion of the corporate restructuring and reorganization plan and the digital evolution. |
(4) | Calculated based on weighted average shares outstanding including participating securities and assuming the exchange of all common OP units outstanding for common shares. |
(5) | For the three and twelve months ended December 31, 2019, excluded from the calculation of diluted FFO and Core FFO per share is the effect of adding back interest expense associated with convertible senior notes and weighted average dilutive common share equivalents for the assumed conversion of the convertible senior notes as the effect of including such interest expense and common share equivalents would be antidilutive. |
(6) | For the three months ended December 31, 2019, there were no performance stock units, which were subject to both a service condition and market condition, and shares of non-participating restricted stock included in the calculation of diluted Core FFO per share. For the twelve months ended December 31, 2019, included in the calculation of diluted Core FFO per share are 990,700 weighted average performance stock units, which are subject to both a service condition and market condition, and 74,100 weighted average shares of non-participating restricted stock. |
COLONY CAPTITAL, INC.
RECONCILIATION OF NET INCOME (LOSS) TO NOI
The following tables present: (1) a reconciliation of property and other related revenues less property operating expenses for properties in our Healthcare, Industrial, and Hospitality segments to NOI and (2) a reconciliation of such segments' net income (loss) for the three months ended December 31, 2019 to NOI:
Three Months Ended December 31, 2019 | ||||||||||||
(In thousands) | Healthcare | Industrial(1) | Hospitality | |||||||||
Total revenues | $ | 154,378 | $ | 77,611 | $ | 186,450 | ||||||
Straight-line rent revenue and amortization of above- and below-market lease intangibles | (11,370 | ) | (3,196 | ) | 313 | |||||||
Interest income | (31 | ) | (486 | ) | 6 | |||||||
Other income | (300 | ) | — | 70 | ||||||||
Property operating expenses (2) | (66,106 | ) | (19,382 | ) | (132,710 | ) | ||||||
Compensation and administrative expense (2) | — | (1,386 | ) | — | ||||||||
NOI(3) | $ | 76,571 | $ | 53,161 | $ | 54,129 | ||||||
_________
(1) | Industrial financial results are classified as discontinued operations on the Company's consolidated statement of operations for the three months ended December 31, 2019. |
(2) | For healthcare and hospitality, property operating expenses include property management fees paid to third parties. For industrial, there are direct costs of managing the portfolio which are included in compensation expense. |
(3) | For hospitality, NOI is before FF&E Reserve. |
19
| ||
Three Months Ended December 31, 2019 | ||||||||||||
(In thousands) | Healthcare | Industrial(1) | Hospitality | |||||||||
Net income (loss) | $ | (38,608 | ) | $ | 1,426,219 | $ | (43,119 | ) | ||||
Adjustments: | ||||||||||||
Straight-line rent revenue and amortization of above- and below-market lease intangibles | (11,370 | ) | (3,196 | ) | 313 | |||||||
Interest income | (31 | ) | (486 | ) | 6 | |||||||
Interest expense | 41,930 | 36,381 | 45,484 | |||||||||
Transaction, investment and servicing costs | 3,137 | 66 | 1,787 | |||||||||
Depreciation and amortization | 41,208 | 9,323 | 36,035 | |||||||||
Impairment loss | 43,132 | — | 14,649 | |||||||||
Compensation and administrative expense | 2,482 | 20,265 | 2,096 | |||||||||
Gain on sale of real estate | (551 | ) | (1,429,822 | ) | — | |||||||
Other (gain) loss, net | (5,690 | ) | (1,407 | ) | (1,492 | ) | ||||||
Other income | (300 | ) | — | 70 | ||||||||
Income tax (benefit) expense | 1,232 | (4,182 | ) | (1,700 | ) | |||||||
NOI(2) | $ | 76,571 | $ | 53,161 | $ | 54,129 | ||||||
_________
(1) | Industrial financial results are classified as discontinued operations on the Company's consolidated statement of operations for the three months ended December 31, 2019. |
(2) | For hospitality, NOI is before FF&E Reserve. |
The following table summarizes fourth quarter 2019 net income (loss) by segment:
(In thousands) | Net Income (Loss) | ||||
Healthcare | $ | (38,608 | ) | ||
Industrial | 1,426,219 | ||||
Hospitality | (43,119 | ) | |||
CLNC | 13,064 | ||||
Other Equity and Debt | 27,185 | ||||
Investment Management | (400,486 | ) | |||
Amounts Not Allocated to Segments | (52,527 | ) | |||
Total Consolidated | $ | 931,728 | |||
20

Cautionary Statement Regarding Forward-Looking Statements |
This presentation may contain forward-looking statements within the meaning of the federal securities laws. Forward-looking statements relate to expectations, beliefs, projections, future plans and strategies, anticipated events or trends and similar expressions concerning matters that are not historical facts. In some cases, you can identify forward-looking statements by the use of forward-looking terminology such as “may,” “will,” “should,” “expects,” “intends,” “plans,” “anticipates,” “believes,” “estimates,” “predicts,” or “potential” or the negative of these words and phrases or similar words or phrases which are predictions of or indicate future events or trends and which do not relate solely to historical matters. You can also identify forward-looking statements by discussions of strategy, plans or intentions.
Forward-looking statements involve known and unknown risks, uncertainties, assumptions and contingencies, many of which are beyond the Company’s control, and may cause the Company’s actual results to differ significantly from those expressed in any forward-looking statement. Factors that might cause such a difference include, without limitation, the Company’s ability to build the leading digital real estate provider and funding source for the occupancy, infrastructure, equity and credit needs of the world’s mobile communications and data-driven companies, including whether the Company will be the only global REIT that owns, manages and operates assets across all major components of digital ecosystem including data centers, cell towers, fiber networks and small cells, whether our public shareholders and private limited partners will benefit from the Company’s investment management business and direct investment interests on the balance sheet, whether digital investment management will be a dominant driver of growth for the Company or at all, the ability to monetize non-strategic Other Equity and Debt assets within the time and manner the Company’s expect or at all, the availability of significant global opportunities in the digital ecosystem, whether the Company will complete a disposition of its management agreement with Colony Credit Real Estate, Inc. (CLNC) on the terms and timeframe anticipated or at all, whether the Company’s operations of its non-digital business units will result in maximizing cash flows and value over time, including whether cash flows will be improved for the healthcare and hospitality units, the impact of impairments, the impact of changes to the Company’s management or board of directors, employee and organizational structure, including the implementation and timing of CEO succession plans, Digital Colony’s ability to complete the pending acquisition of Zayo Group Holdings, Inc. on the terms contemplated or at all, Colony Capital’s financial flexibility and liquidity, including borrowing capacity under its revolving credit facility, the use of sales proceeds and available liquidity, the performance of the Company’s investment in CLNC, including the CLNC share price as compared to book value and how the Company evaluates the Company’s investment in CLNC, whether the Company’s exploration of potential opportunities to maximize value of the credit and opportunity fund investment management business will result in a definitive transaction in the form of a joint venture, sale or realignment of operational management or at all, the Company’s ability to minimize balance sheet commitments to its managed investment vehicles, the performance of the Company’s investment in DataBank and whether the Company will continue to invest in edge/colocation data center sector and support future growth opportunities through potential add-on acquisitions and greenfield edge data center developments, and whether if consummated such additional investments and growth opportunities result in any of the benefits we anticipate or at all, whether the Company will realize any anticipated benefits from the Alpine Energy joint venture, the Company's portfolio composition, the Company's expected taxable income and net cash flows, excluding the contribution of gains, whether the Company will maintain or produce higher Core FFO per share (including or excluding gains and losses from sales of certain investments) in the coming quarters, or ever, the Company’s ability to maintain or grow the dividend at all in the future, including the Company’s expectation to maintain its common stock dividend at $0.44 per share for the full year 2020, the impact of any changes to the Company’s management agreements with NorthStar Healthcare Income, Inc. and CLNC and other managed investment vehicles, whether Colony Capital will be able to maintain its qualification as a REIT for U.S. federal income tax purposes, the timing of and ability to deploy available capital, including whether any redeployment of capital will generate higher total returns, the timing of and ability to complete repurchases of Colony Capital’s stock, Colony Capital’s ability to maintain inclusion and relative performance on the RMZ, Colony Capital’s leverage, including the Company’s ability to reduce debt and the timing and amount of borrowings under its credit facility, increased interest rates and operating costs, adverse economic or real estate developments in Colony Capital’s markets, Colony Capital’s failure to successfully operate or lease acquired properties, decreased rental rates, increased vacancy rates or failure to renew or replace expiring leases, increased costs of capital expenditures, defaults on or non-renewal of leases by tenants, the impact of economic conditions on the borrowers of Colony Capital’s commercial real estate debt investments and the commercial mortgage loans underlying its commercial mortgage backed securities, adverse general and local economic conditions, an unfavorable capital market environment, decreased leasing activity or lease renewals, and other risks and uncertainties, including those detailed in the Company’s Annual Report on Form 10-K for the fiscal year ended December 31, 2018 and our Quarterly Report on Form 10-Q for the quarter ended June 30, 2019, under the heading “Risk Factors,” as such factors may be updated from time to time in our subsequent periodic filings with the U.S. Securities and Exchange Commission (“SEC”).
All forward-looking statements reflect Colony Capital’s good faith beliefs, assumptions and expectations, but they are not guarantees of future performance. Additional information about these and other factors can be found in Colony Capital’s reports filed from time to time with the SEC. Colony Capital cautions investors not to unduly rely on any forward-looking statements. The forward-looking statements speak only as of the date of this presentation. Colony Capital is under no duty to update any of these forward-looking statements after the date of this presentation, nor to conform prior statements to actual results or revised expectations, and Colony Capital does not intend to do so.
This presentation may contain statistics and other data that has been obtained or compiled from information made available by third-party service providers. Colony Capital has not independently verified such statistics or data.
This presentation is for informational purposes only and does not constitute an offer to sell or a solicitation of an offer to buy any securities of Colony Capital. This information is not intended to be indicative of future results. Actual performance of Colony Capital may vary materially.
The appendices herein contain important information that is material to an understanding of this presentation and you should read this presentation only with and in context of the appendices.
Colony Capital | Supplemental Financial Report | ||
Important Note Regarding Non-GAAP Financial Measures |
This supplemental package includes certain “non-GAAP” supplemental measures that are not defined by generally accepted accounting principles, or GAAP, including; funds from operations, or FFO; core funds from operations, or Core FFO; net operating income (“NOI”); and pro rata financial information.
FFO: The Company calculates funds from operations (“FFO”) in accordance with standards established by the Board of Governors of the National Association of Real Estate Investment Trusts, which defines FFO as net income or loss calculated in accordance with GAAP, excluding (i) extraordinary items, as defined by GAAP; (ii) gains and losses from sales of depreciable real estate; (iii) impairment write-downs associated with depreciable real estate; (iv) gains and losses from a change in control in connection with interests in depreciable real estate or in-substance real estate, plus (v) real estate-related depreciation and amortization; and (vi) including similar adjustments for equity method investments. Included in FFO are gains and losses from sales of assets which are not depreciable real estate such as loans receivable, equity method investments, as well as equity and debt securities, as applicable.
Core FFO: The Company computes core funds from operations (“Core FFO”) by adjusting FFO for the following items, including the Company’s share of these items recognized by its unconsolidated partnerships and joint ventures: (i) gains and losses from sales of depreciable real estate within the Other Equity and Debt segment, net of depreciation, amortization and impairment previously adjusted for FFO; (ii) gains and losses from sales of businesses within the Investment Management segment and impairment write-downs associated with the Investment Management segment; (iii) equity-based compensation expense; (iv) effects of straight-line rent revenue and expense; (v) amortization of acquired above- and below-market lease values; (vi) amortization of deferred financing costs and debt premiums and discounts; (vii) unrealized fair value gains or losses on interest rate and foreign currency hedges, and foreign currency remeasurements and realized gains and losses on interest rate hedging instruments existing at the time of the January 2017 merger with remaining terms greater than one year that served as economic hedges for any financing or refinancing of the Company's real estate verticals; (viii) acquisition and merger related transaction costs; (ix) restructuring and merger integration costs; (x) amortization and impairment of finite-lived intangibles related to investment management contracts and customer relationships; (xi) gain on remeasurement of consolidated investment entities and the effect of amortization thereof; (xii) non-real estate depreciation and amortization; (xiii) change in fair value of contingent consideration; and (xiv) tax effect on certain of the foregoing adjustments. Beginning with the first quarter of 2018, the Company’s Core FFO from its interest in Colony Credit Real Estate (NYSE: CLNC) and NorthStar Realty Europe (NYSE: NRE) represented its percentage interest multiplied by CLNC’s Core Earnings and NRE’s Cash Available for Distribution (“CAD”), respectively. Refer to CLNC’s and NRE's respective filings with the SEC for the definition and calculation of Core Earnings and CAD.
FFO and Core FFO should not be considered alternatives to GAAP net income as indications of operating performance, or to cash flows from operating activities as measures of liquidity, nor as indications of the availability of funds for our cash needs, including funds available to make distributions. FFO and Core FFO should not be used as supplements to or substitutes for cash flow from operating activities computed in accordance with GAAP. The Company’s calculations of FFO and Core FFO may differ from methodologies utilized by other REITs for similar performance measurements, and, accordingly, may not be comparable to those of other REITs.
The Company uses FFO and Core FFO as supplemental performance measures because, in excluding real estate depreciation and amortization and gains and losses from property dispositions, it provides a performance measure that captures trends in occupancy rates, rental rates, and operating costs. The Company also believes that, as widely recognized measures of the performance of REITs, FFO and Core FFO will be used by investors as a basis to compare its operating performance with that of other REITs. However, because FFO and Core FFO exclude depreciation and amortization and capture neither the changes in the value of the Company’s properties that resulted from use or market conditions nor the level of capital expenditures and leasing commissions necessary to maintain the operating performance of its properties, all of which have real economic effect and could materially impact the Company’s results from operations, the utility of FFO and Core FFO as measures of the Company’s performance is limited. FFO and Core FFO should be considered only as supplements to GAAP net income as a measure of the Company’s performance. Additionally, Core FFO excludes the impact of certain fair value fluctuations, which, if they were to be realized, could have a material impact on the Company’s operating performance. The Company also presents Core FFO excluding gains and losses from sales of certain investments as well as its share of similar adjustments for CLNC. The Company believes that such a measure is useful to investors as it excludes periodic gains and losses from sales of investments that are not representative of its ongoing operations.
Colony Capital | Supplemental Financial Report | ||
Important Note Regarding Non-GAAP Financial Measures |
NOI: NOI for our real estate segments represents total property and related income less property operating expenses, adjusted for the effects of (i) straight-line rental income adjustments; (ii) amortization of acquired above- and below-market lease adjustments to rental income; and (iii) other items such as adjustments for the Company’s share of NOI of unconsolidated ventures.
The Company believes that NOI is a useful measure of operating performance of its respective real estate portfolios as it is more closely linked to the direct results of operations at the property level. NOI also reflects actual rents received during the period after adjusting for the effects of straight-line rents and amortization of above- and below- market leases; therefore, a comparison of NOI across periods better reflects the trend in occupancy rates and rental rates of the Company’s properties.
NOI excludes historical cost depreciation and amortization, which are based on different useful life estimates depending on the age of the properties, as well as adjust for the effects of real estate impairment and gains or losses on sales of depreciated properties, which eliminate differences arising from investment and disposition decisions. This allows for comparability of operating performance of the Company’s properties period over period and also against the results of other equity REITs in the same sectors. Additionally, by excluding corporate level expenses or benefits such as interest expense, any gain or loss on early extinguishment of debt and income taxes, which are incurred by the parent entity and are not directly linked to the operating performance of the Company’s properties, NOI provides a measure of operating performance independent of the Company’s capital structure and indebtedness. However, the exclusion of these items as well as others, such as capital expenditures and leasing costs, which are necessary to maintain the operating performance of the Company’s properties, and transaction costs and administrative costs, may limit the usefulness of NOI. NOI may fail to capture significant trends in these components of U.S. GAAP net income (loss) which further limits its usefulness.
NOI should not be considered as an alternative to net income (loss), determined in accordance with U.S. GAAP, as an indicator of operating performance. In addition, the Company’s methodology for calculating NOI involves subjective judgment and discretion and may differ from the methodologies used by other comparable companies, including other REITs, when calculating the same or similar supplemental financial measures and may not be comparable with other companies.
NOI before Reserve for Furniture, Fixtures and Equipment Expenditures (“NOI before FF&E Reserve”): For our hospitality real estate segment, NOI before FF&E Reserve represents NOI before the deduction of reserve contributions for the repair, replacement and refurbishment of furniture, fixtures, and equipment ("FF&E"), which are typically 4% to 5% of revenues, and required under certain debt agreements and/or franchise and brand-managed hotel agreements.
Pro-rata: The Company presents pro-rata financial information, which is not, and is not intended to be, a presentation in accordance with GAAP. The Company computes pro-rata financial information by applying its economic interest to each financial statement line item on an investment-by-investment basis. Similarly, noncontrolling interests’ share of assets, liabilities, profits and losses was computed by applying noncontrolling interests’ economic interest to each financial statement line item. The Company provides pro-rata financial information because it may assist investors and analysts in estimating the Company’s economic interest in its investments. However, pro-rata financial information as an analytical tool has limitations. Other equity REITs may not calculate their pro-rata information in the same methodology, and accordingly, the Company’s pro-rata information may not be comparable to such other REITs' pro-rata information. As such, the pro-rata financial information should not be considered in isolation or as a substitute for our financial statements as reported under GAAP, but may be used as a supplement to financial information as reported under GAAP.
Tenant/operator provided information: The information related to the Company’s tenants/operators that is provided in this presentation has been provided by, or derived from information provided by, such tenants/operators. The Company has not independently verified this information and has no reason to believe that such information is inaccurate in any material respect. The Company is providing this data for informational purposes only.
Colony Capital | Supplemental Financial Report | ||
Note Regarding CLNY Reportable Segments / Consolidated and OP Share of Consolidated Amounts |
This presentation includes supplemental financial information for the following segments: Investment Management; Healthcare Real Estate; Industrial Real Estate; Hospitality Real Estate; CLNC; and Other Equity and Debt.
Investment Management
The Company’s Investment Management segment includes the management of digital real estate and infrastructure assets through Digital Colony and traditional commercial real estate investments through private real estate credit funds and related co-investment vehicles, CLNC, a public non-traded healthcare REIT and interests in other investment management platforms, among other smaller investment vehicles. This segment included the industrial investment management business, which was sold with the light industrial portfolio in December 2019, and is presented as discontinued operations on the consolidated statements of operations.
Healthcare Real Estate
As of December 31, 2019, the consolidated healthcare portfolio consisted of 358 properties: 154 senior housing properties, 106 medical office properties, 89 skilled nursing facilities and 9 hospitals. The Company’s equity interest in the consolidated Healthcare Real Estate segment was approximately 71% as of December 31, 2019. The healthcare portfolio earns rental income from our senior housing, skilled nursing facilities and hospital assets that are under net leases to single tenants/operators and from medical office buildings which are both single tenant and multi-tenant. In addition, we also earn resident fee income from senior housing properties that are managed by operators under a REIT Investment Diversification and Empowerment Act of 2007 (“RIDEA”) structure.
Industrial Real Estate
In December 2019, the Company completed the sale of its light industrial portfolio and related operating platform for an aggregate $5.7 billion, which resulted in a net cash gain and incentive fees of approximately $475 million and net cash proceeds of approximately $1.25 billion for the Company’s share. Accordingly, this segment will no longer be a reportable segment in the future and for all current and prior periods presented, the related operating results are presented as income from discontinued operations on the consolidated statement of operations. The Company continues to own the remaining bulk industrial assets, which are still held for sale with operating results presented as income from discontinued operations on the consolidated statements of operations.
As of December 31, 2019, the consolidated bulk industrial portfolio consisted of six bulk industrial buildings totaling 4.2 million rentable square feet across five major U.S. markets and was 67% leased. The Company's equity interest in the consolidated bulk industrial portfolio was approximately 51%, or $72 million, with the other 49% owned by third-party capital, which is managed by the Company.
Hospitality Real Estate
As of December 31, 2019, the consolidated hospitality portfolio consisted of 157 properties: 87 select service properties, 66 extended stay properties and four full service properties. The Company’s equity interest in the consolidated Hospitality Real Estate segment was approximately 94% as of December 31, 2019. The hospitality portfolio consists primarily of select service and extended stay hotels located mostly in major metropolitan markets in the U.S., with the majority affiliated with top hotel brands. The select service hospitality portfolio referred to as the THL Hotel Portfolio, which the Company acquired through consensual transfer during the third quarter 2017, is not included in the Hospitality Real Estate segment and is included in the Other Equity and Debt segment.
Colony Credit Real Estate, Inc. (“CLNC”)
Colony Credit Real Estate, Inc. is a commercial real estate credit REIT externally managed by the Company with $5.6 billion in assets and $2.2 billion in GAAP book equity value as of December 31, 2019. The Company owns approximately 48.0 million shares and share equivalents, or 36%, of CLNC and earns an annual base management fee of 1.5% on stockholders’ equity (as defined in the CLNC management agreement) and an incentive fee of 20% of CLNC’s Core Earnings over a 7% hurdle rate.
Other Equity and Debt
The Company owns a diversified group of strategic and non-strategic real estate and real estate-related debt and equity investments. Strategic investments include the Company’s digital balance sheet interests in digital real estate, including the 20% controlling interest in DataBank and the $250 million GP co-investment commitment to DCP, and non-digital investments for which the Company acts as a general partner and/or manager (“GP Co-Investments”) and receives various forms of investment management economics on the related third-party capital. Non-strategic investments are composed of those investments the Company does not intend to own for the long term including commercial real estate equity and debt investments and other real estate-related securities, among other holdings.
Throughout this presentation, consolidated figures represent the interest of both the Company (and its subsidiary Colony Capital Operating Company or the “CLNY OP”) and noncontrolling interests. Figures labeled as CLNY OP share represent the Company’s pro-rata share.
Colony Capital | Supplemental Financial Report | ||
Table of Contents |
Page | |||
I. | 6-13 | ||
II. | Financial Overview | ||
a. | 14 | ||
b. | 15-16 | ||
III. | Financial Results | ||
a. | 17 | ||
b. | 18 | ||
c. | 19 | ||
d. | 20 | ||
e. | 21 | ||
IV. | Capitalization | ||
a. | 22 | ||
b. | 23 | ||
c. | 24 | ||
d. | 25 | ||
e. | 26 | ||
V. | Investment Management | ||
a. | Summary Metrics | 27-28 | |
b. | Assets Under Management | 29 | |
VI. | Healthcare Real Estate | ||
a. | Summary Metrics and Operating Results | 30 | |
b. | Portfolio Overview | 31-32 | |
Page | |||
VII. | Hospitality Real Estate | ||
a. | 33 | ||
b. | 34 | ||
VIII. | CLNC | ||
a. | 35 | ||
IX. | 36 | ||
a. | 37 | ||
b. | 38 | ||
c. | 39-41 | ||
d. | 42 | ||
X. | Appendices | ||
a. | 44-45 | ||
b. | 46-47 | ||
c. | Industrial Real Estate - Discontinued Operations | 48 | |
Colony Capital | Supplemental Financial Report | 5 | ||
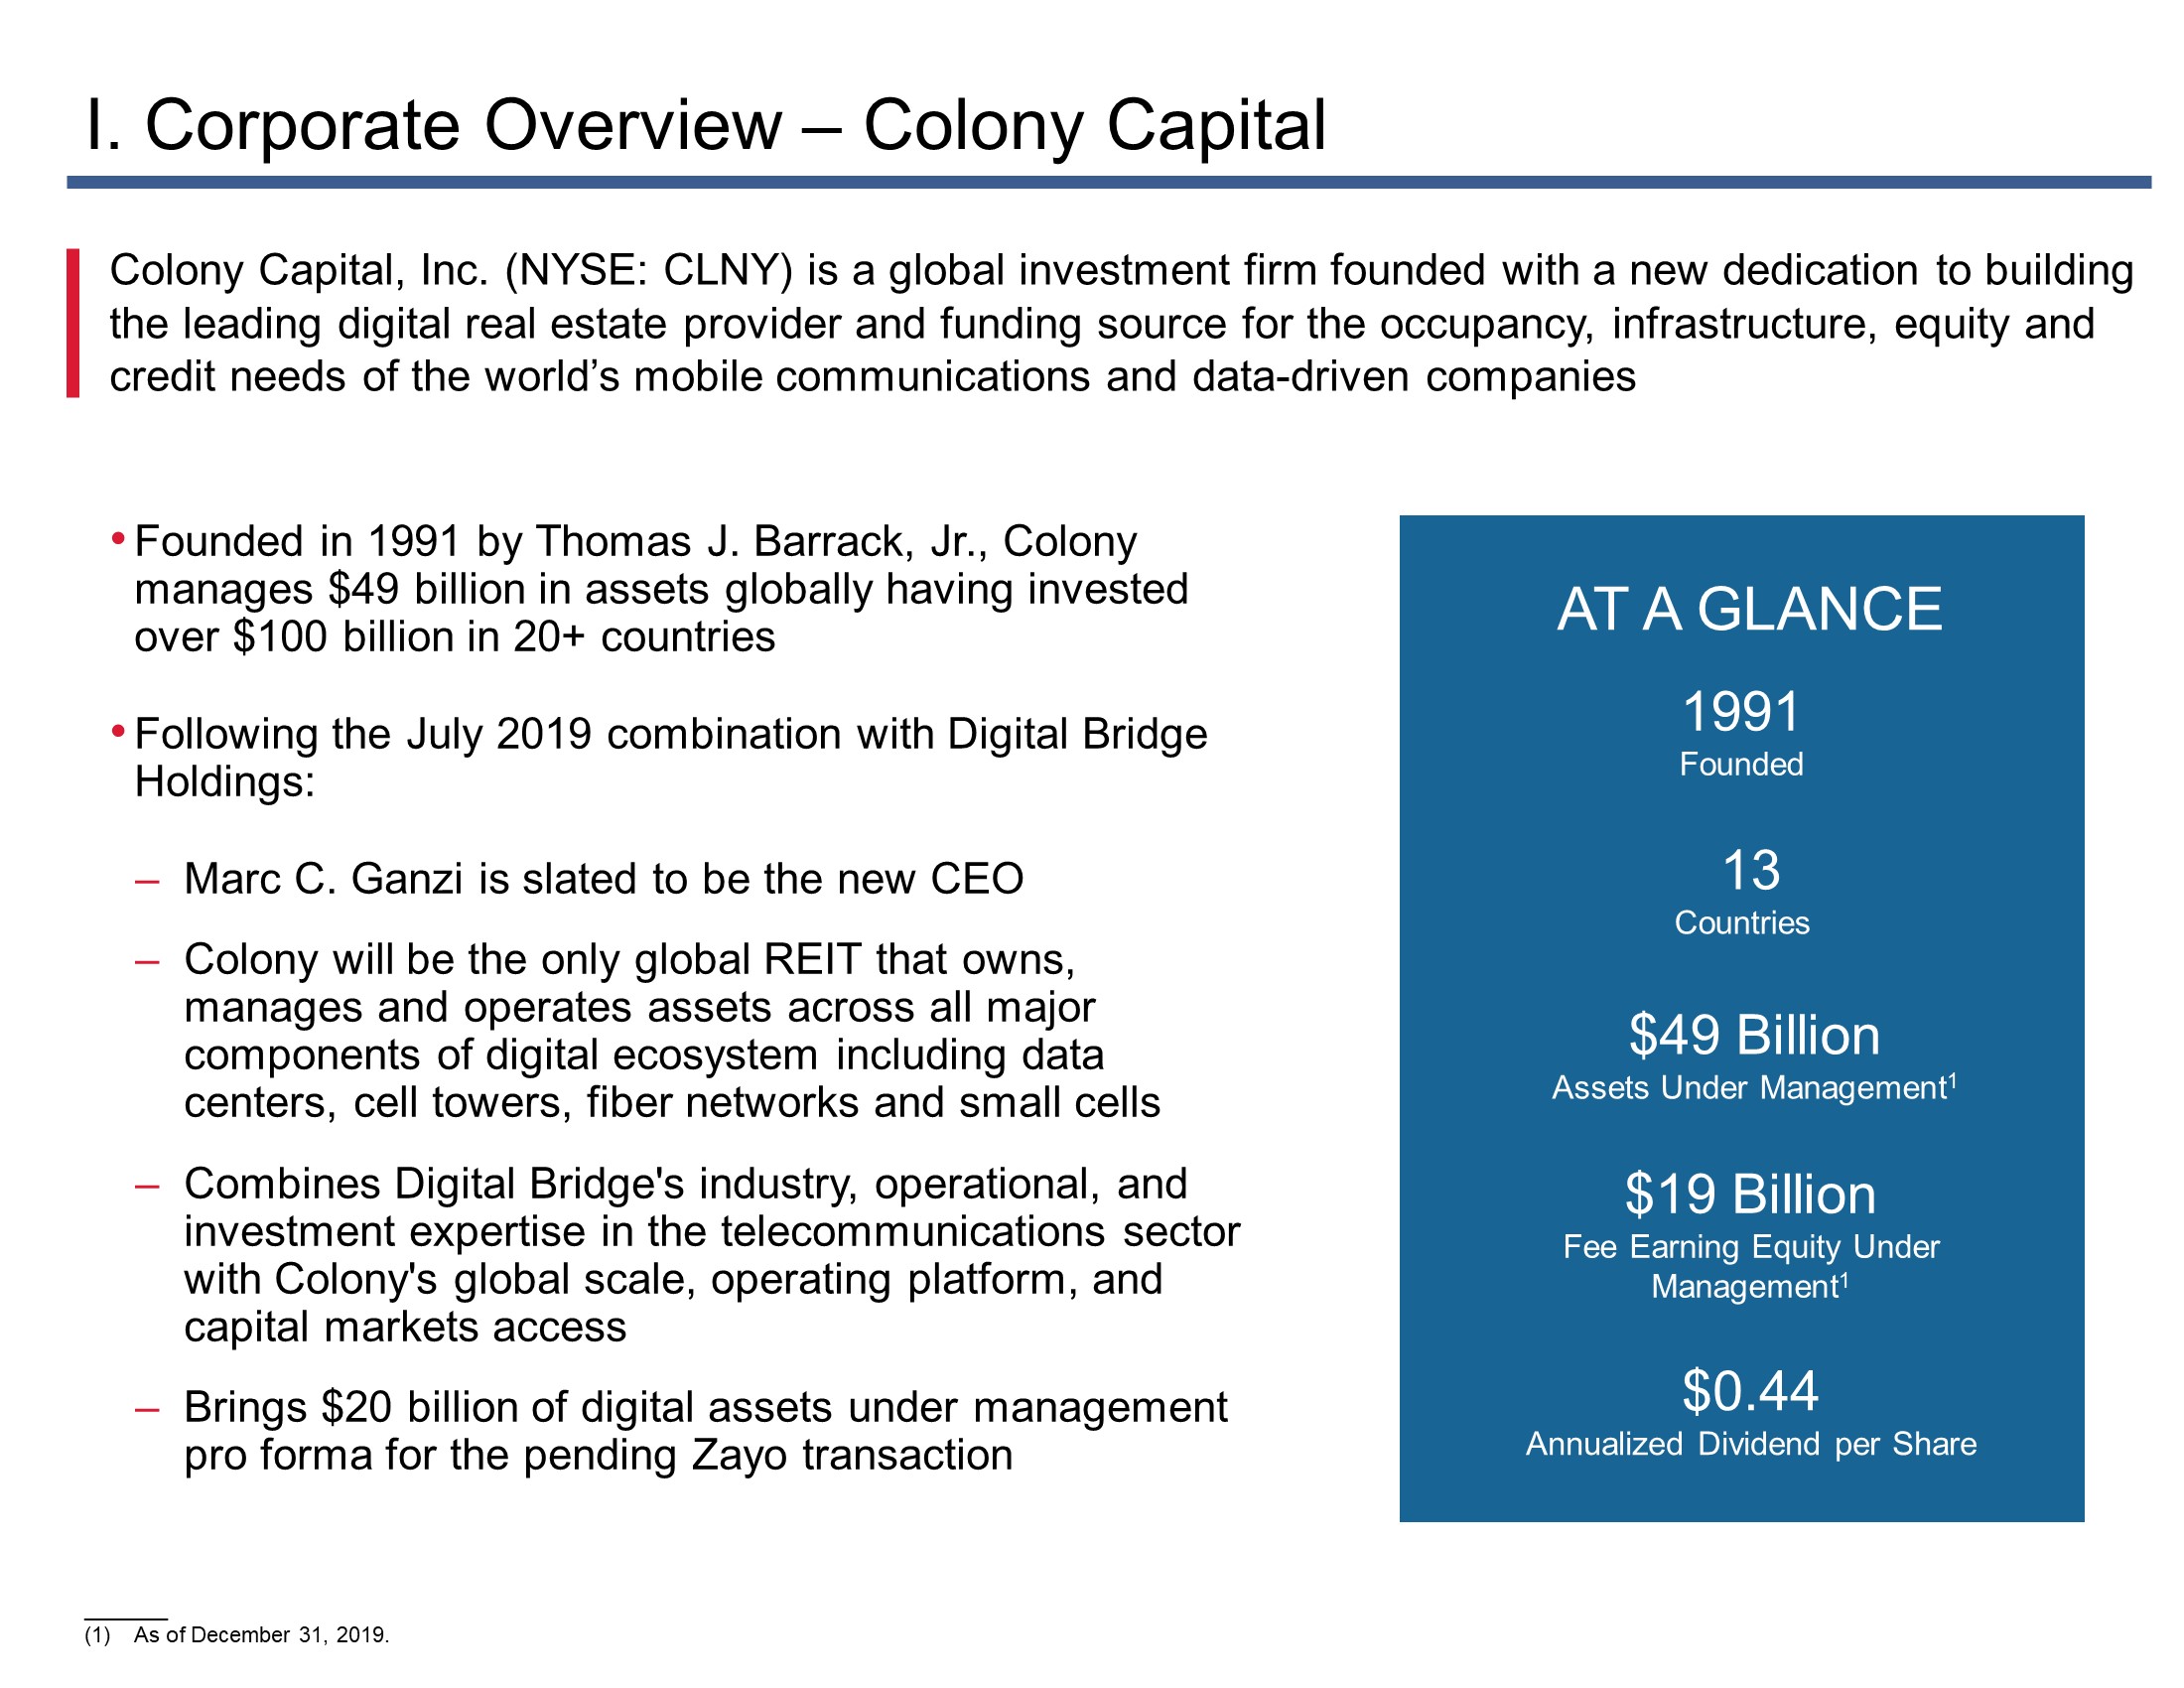
Colony Capital | Supplemental Financial Report | 6 | ||
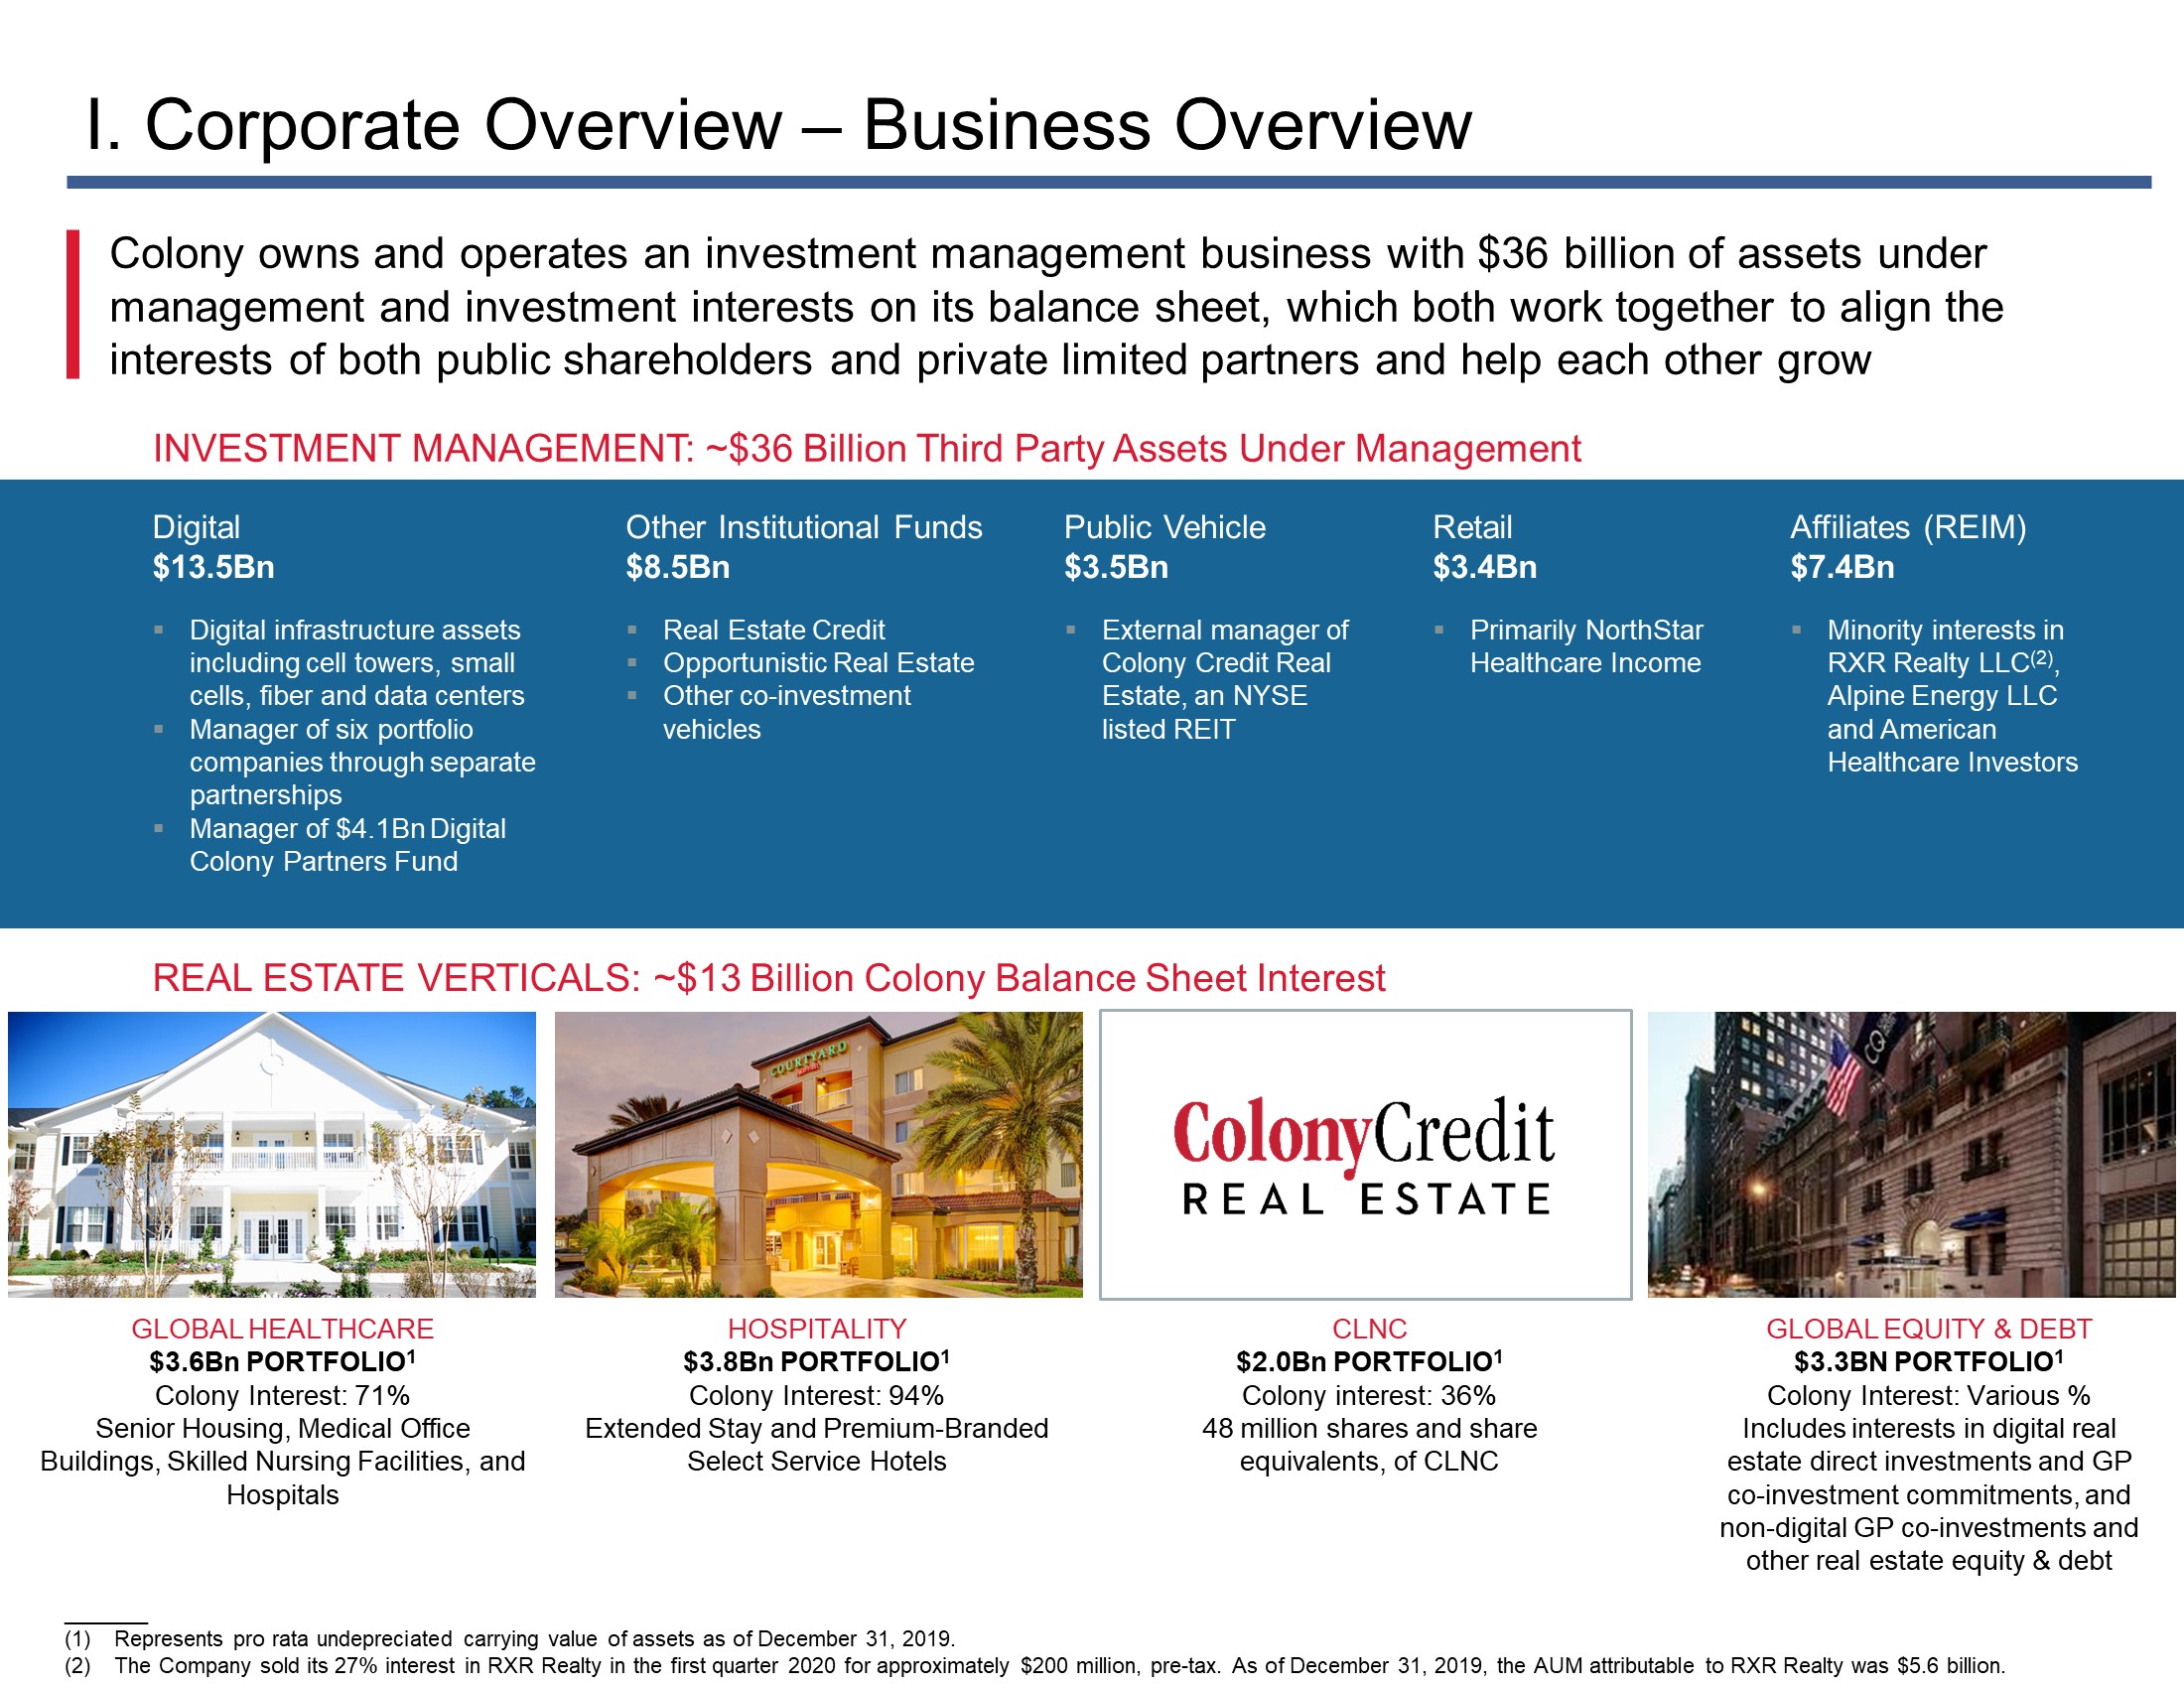
Colony Capital | Supplemental Financial Report | 7 | ||
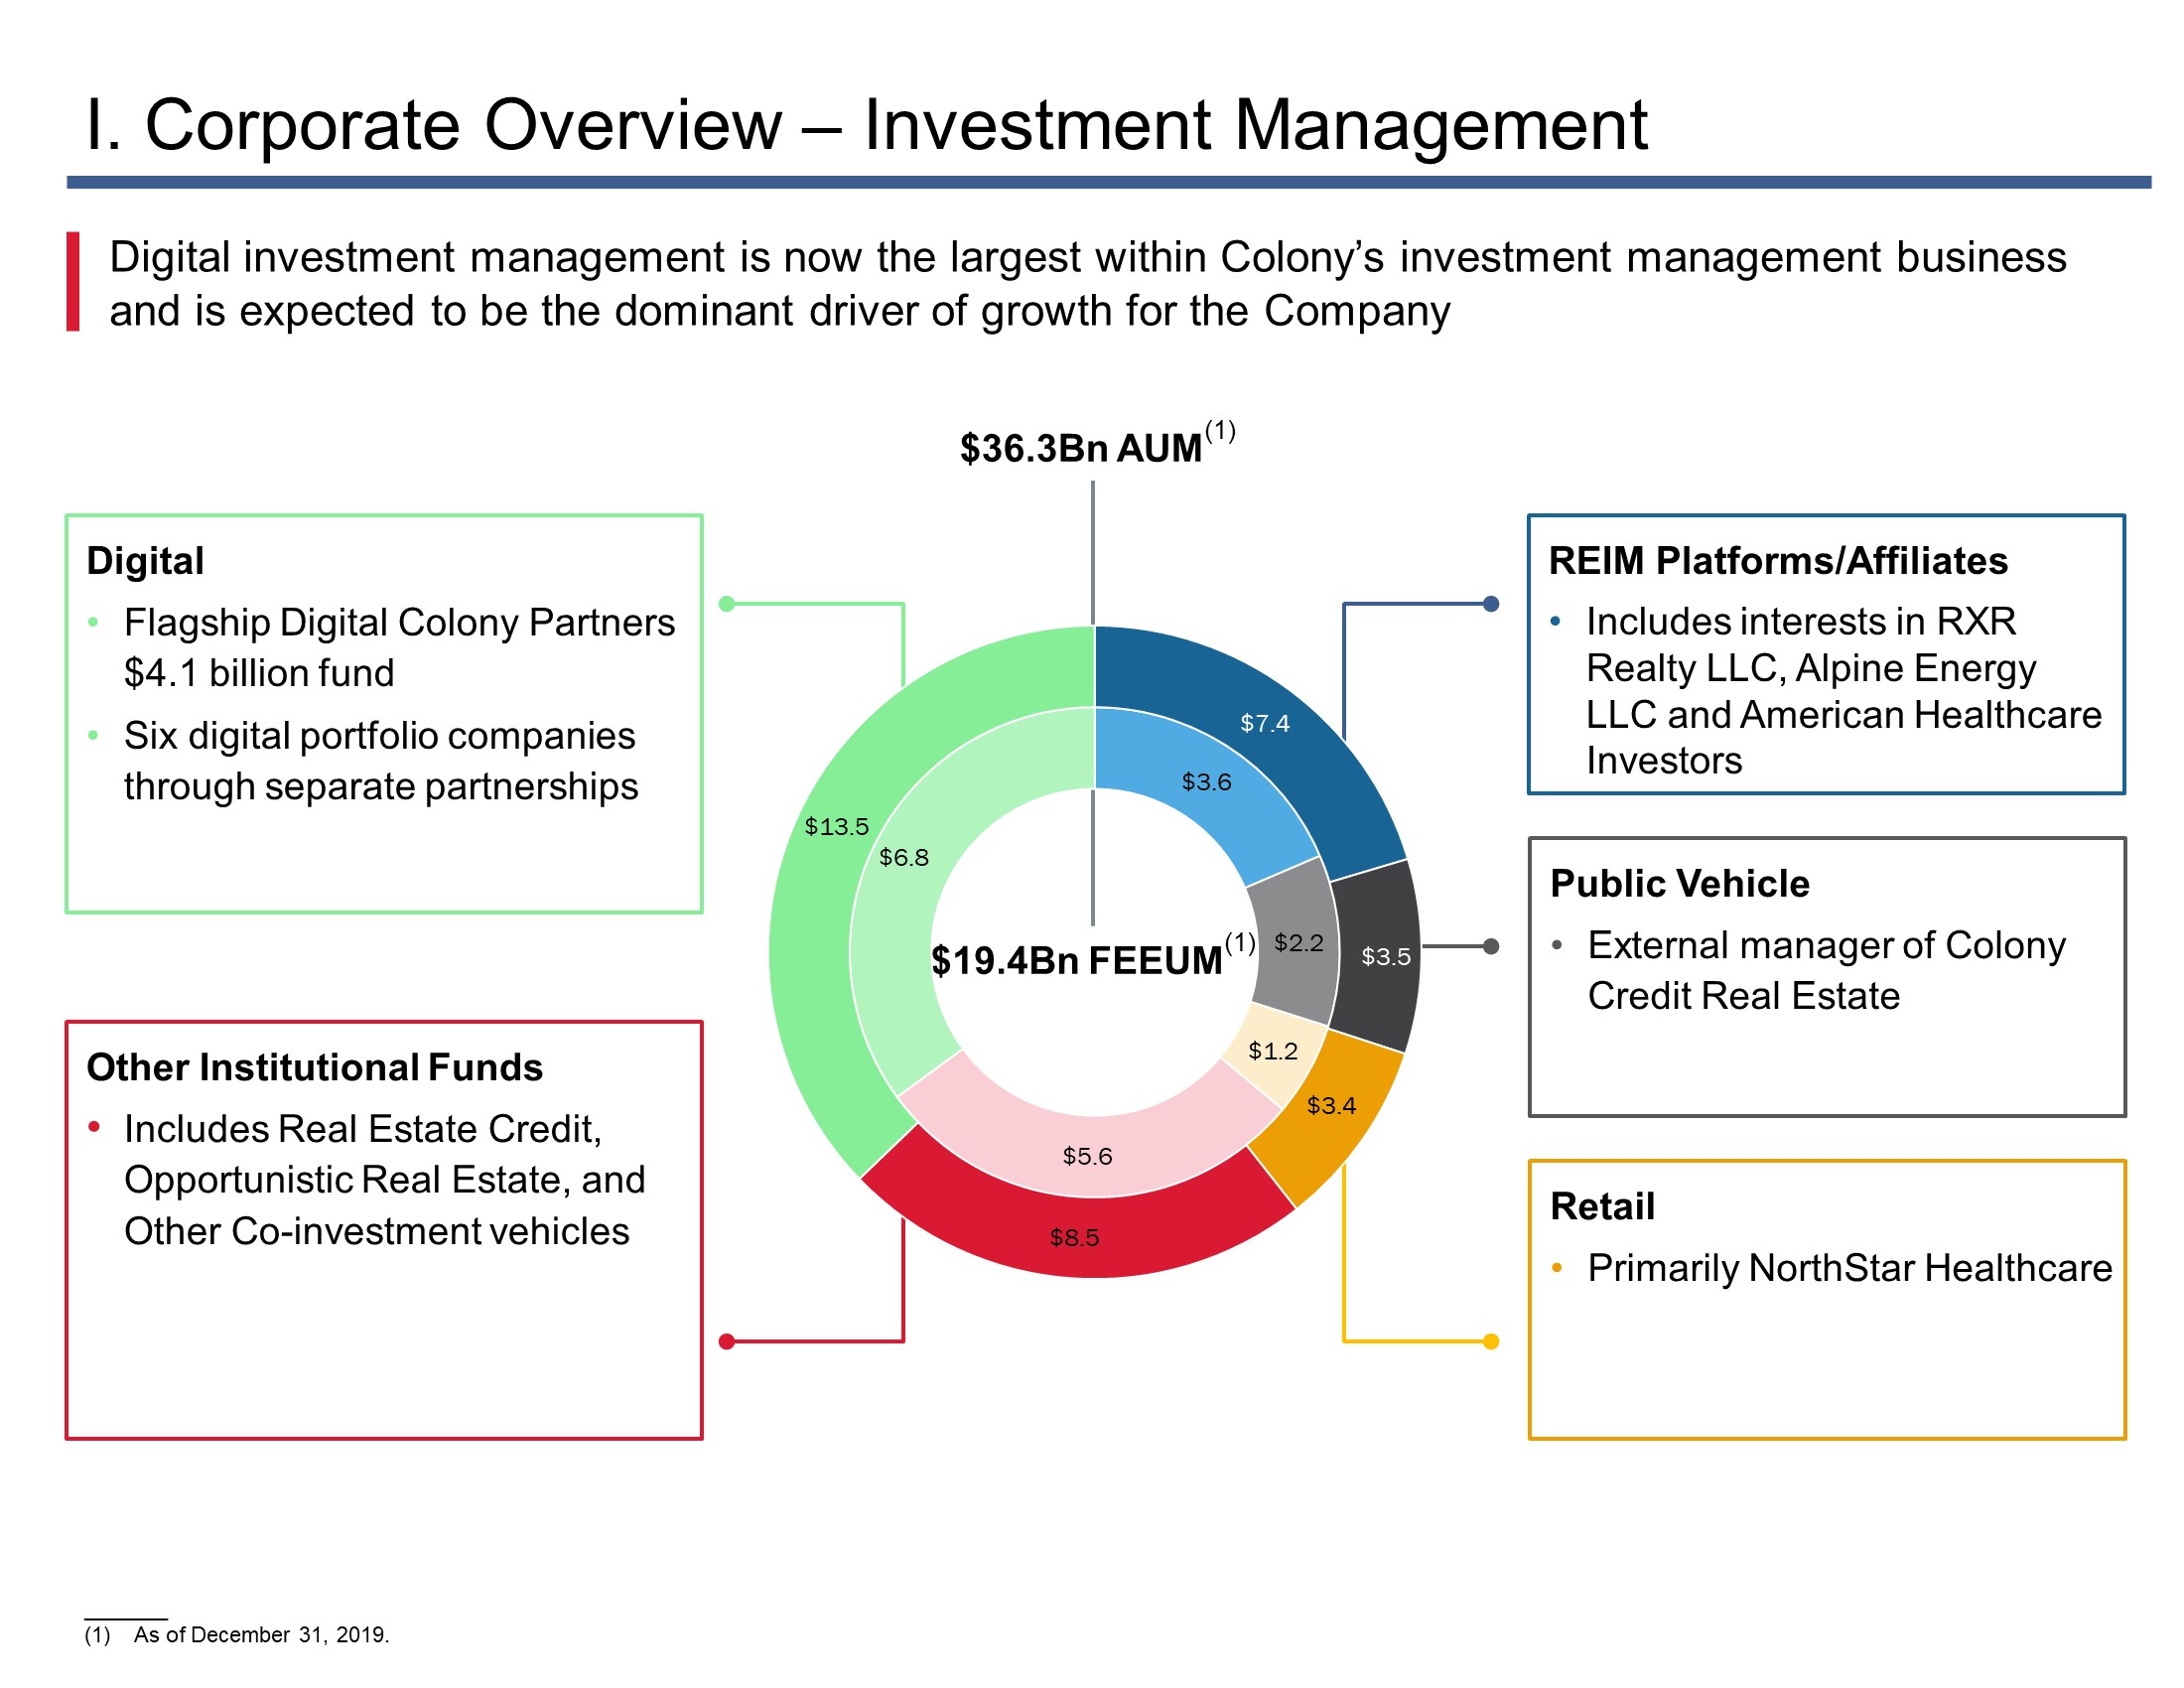
Colony Capital | Supplemental Financial Report | 8 | ||
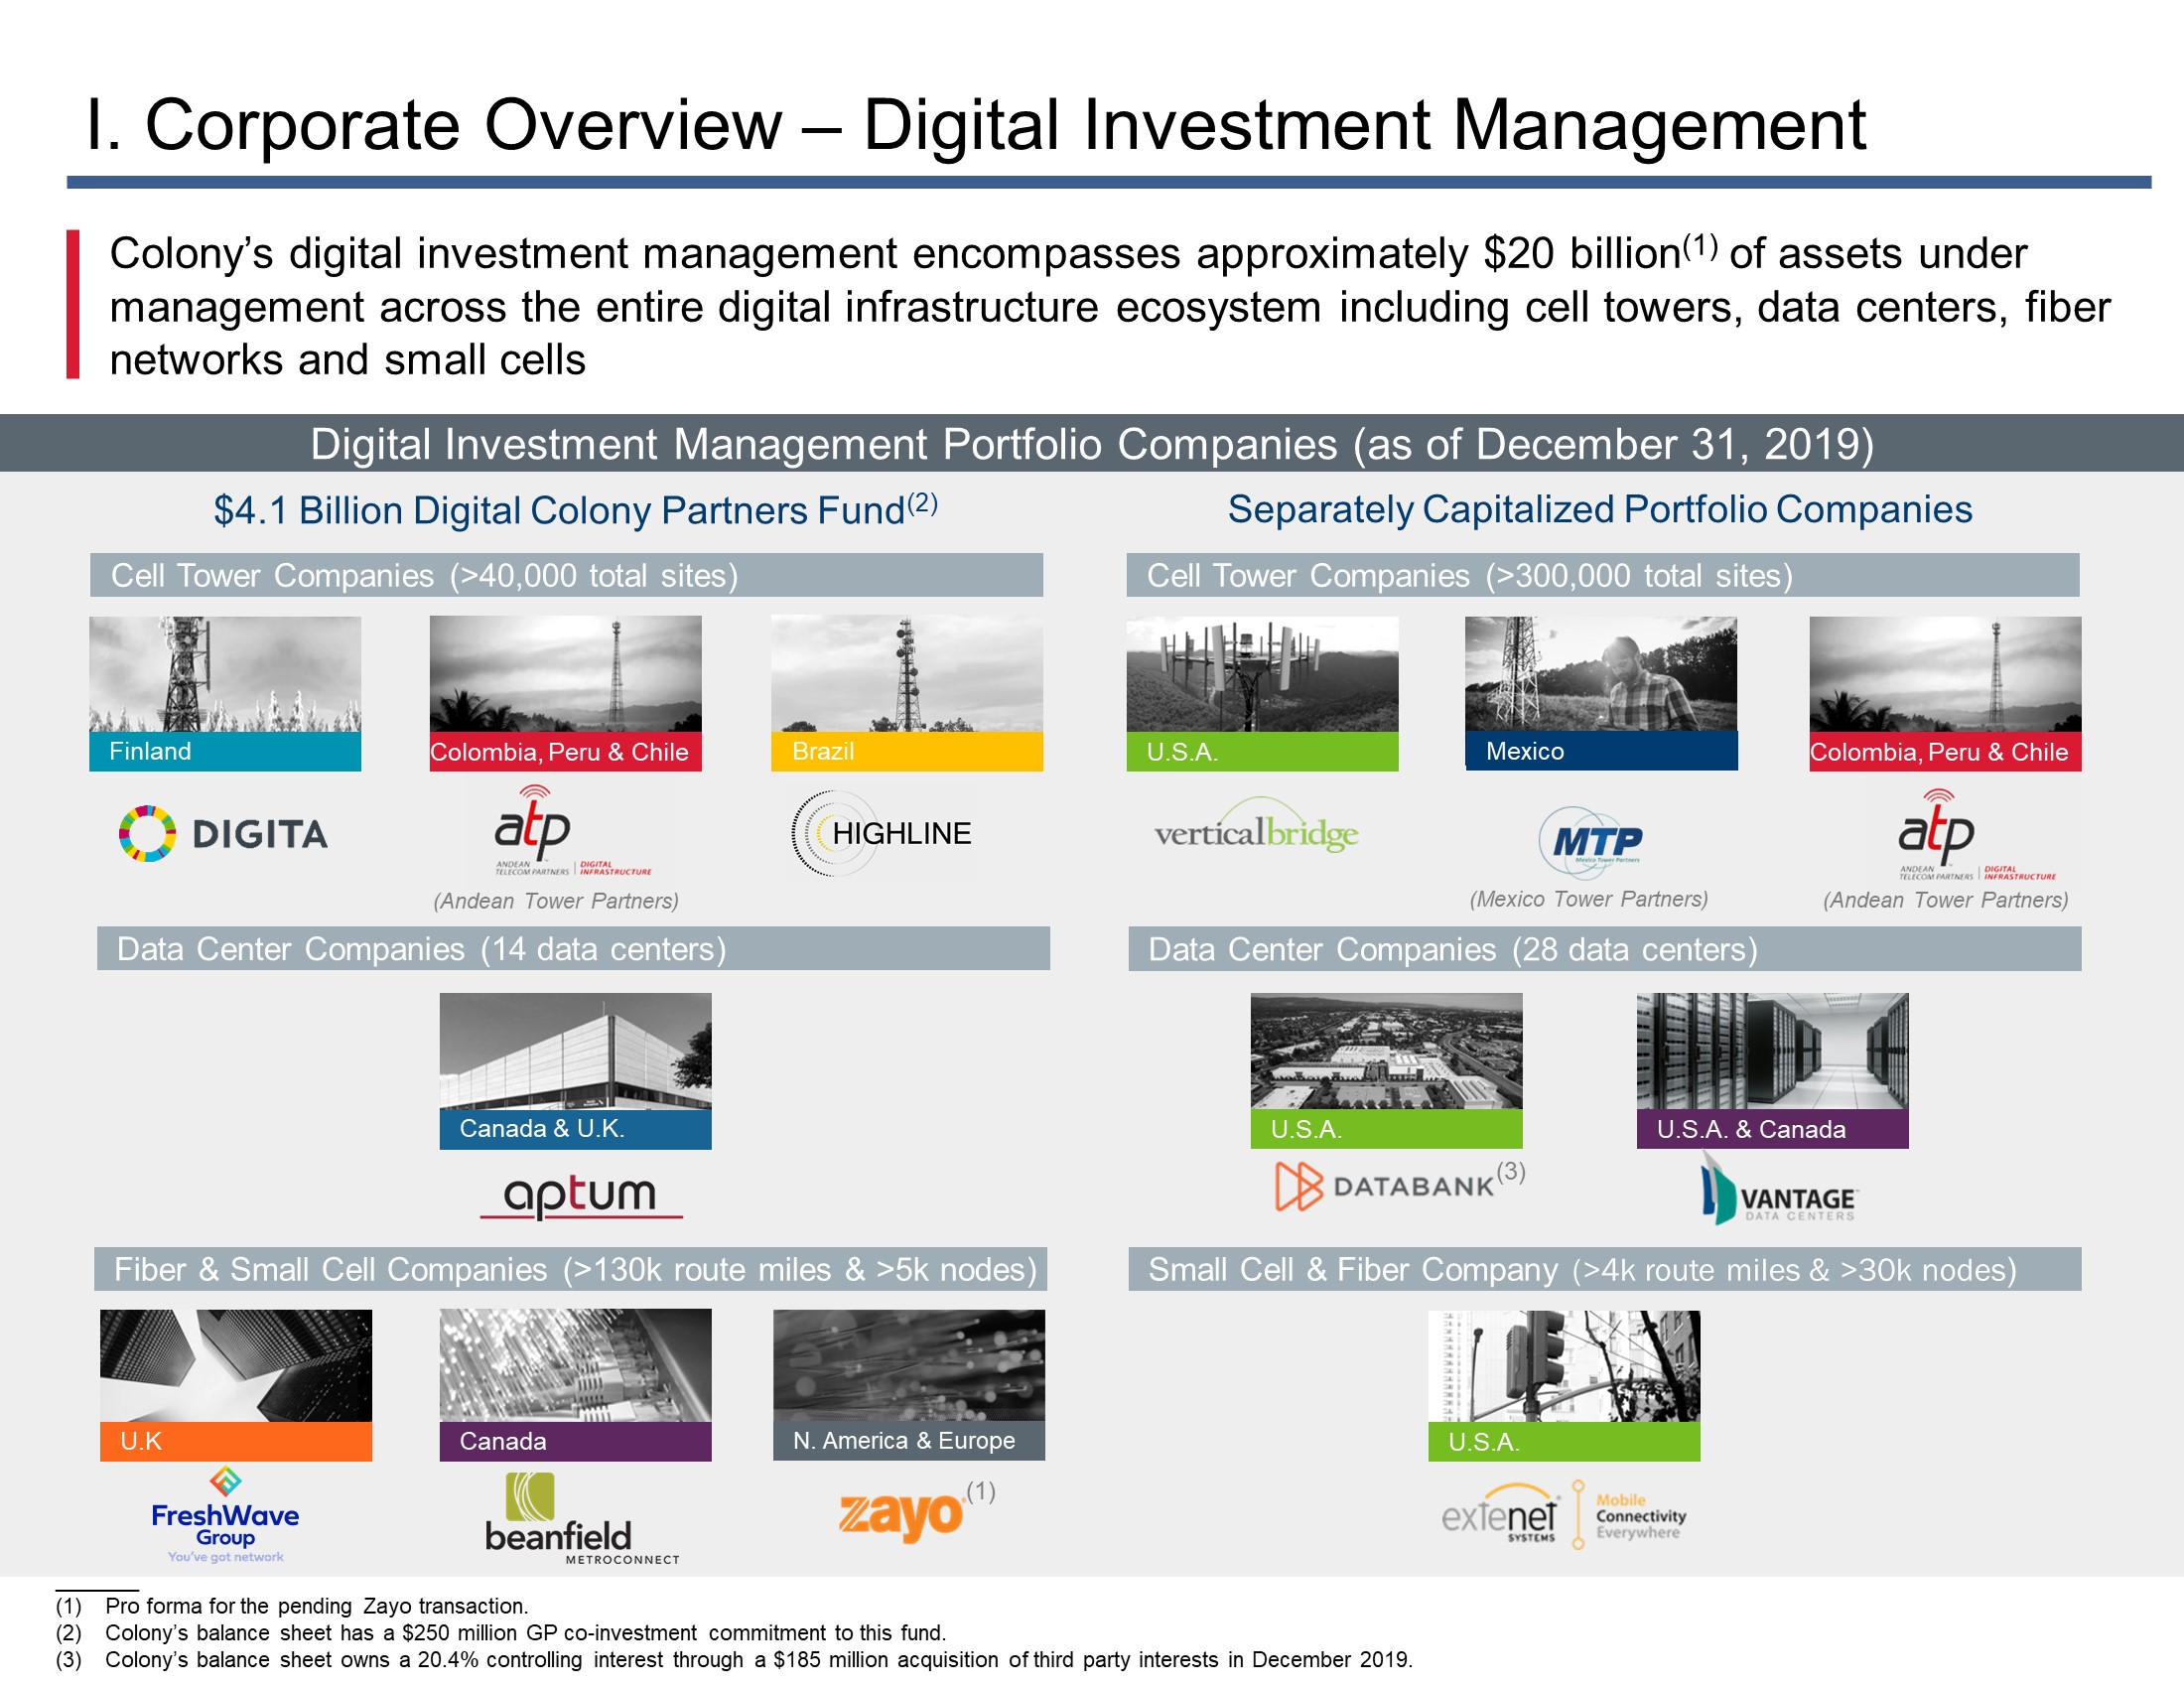
Colony Capital | Supplemental Financial Report | 9 | ||
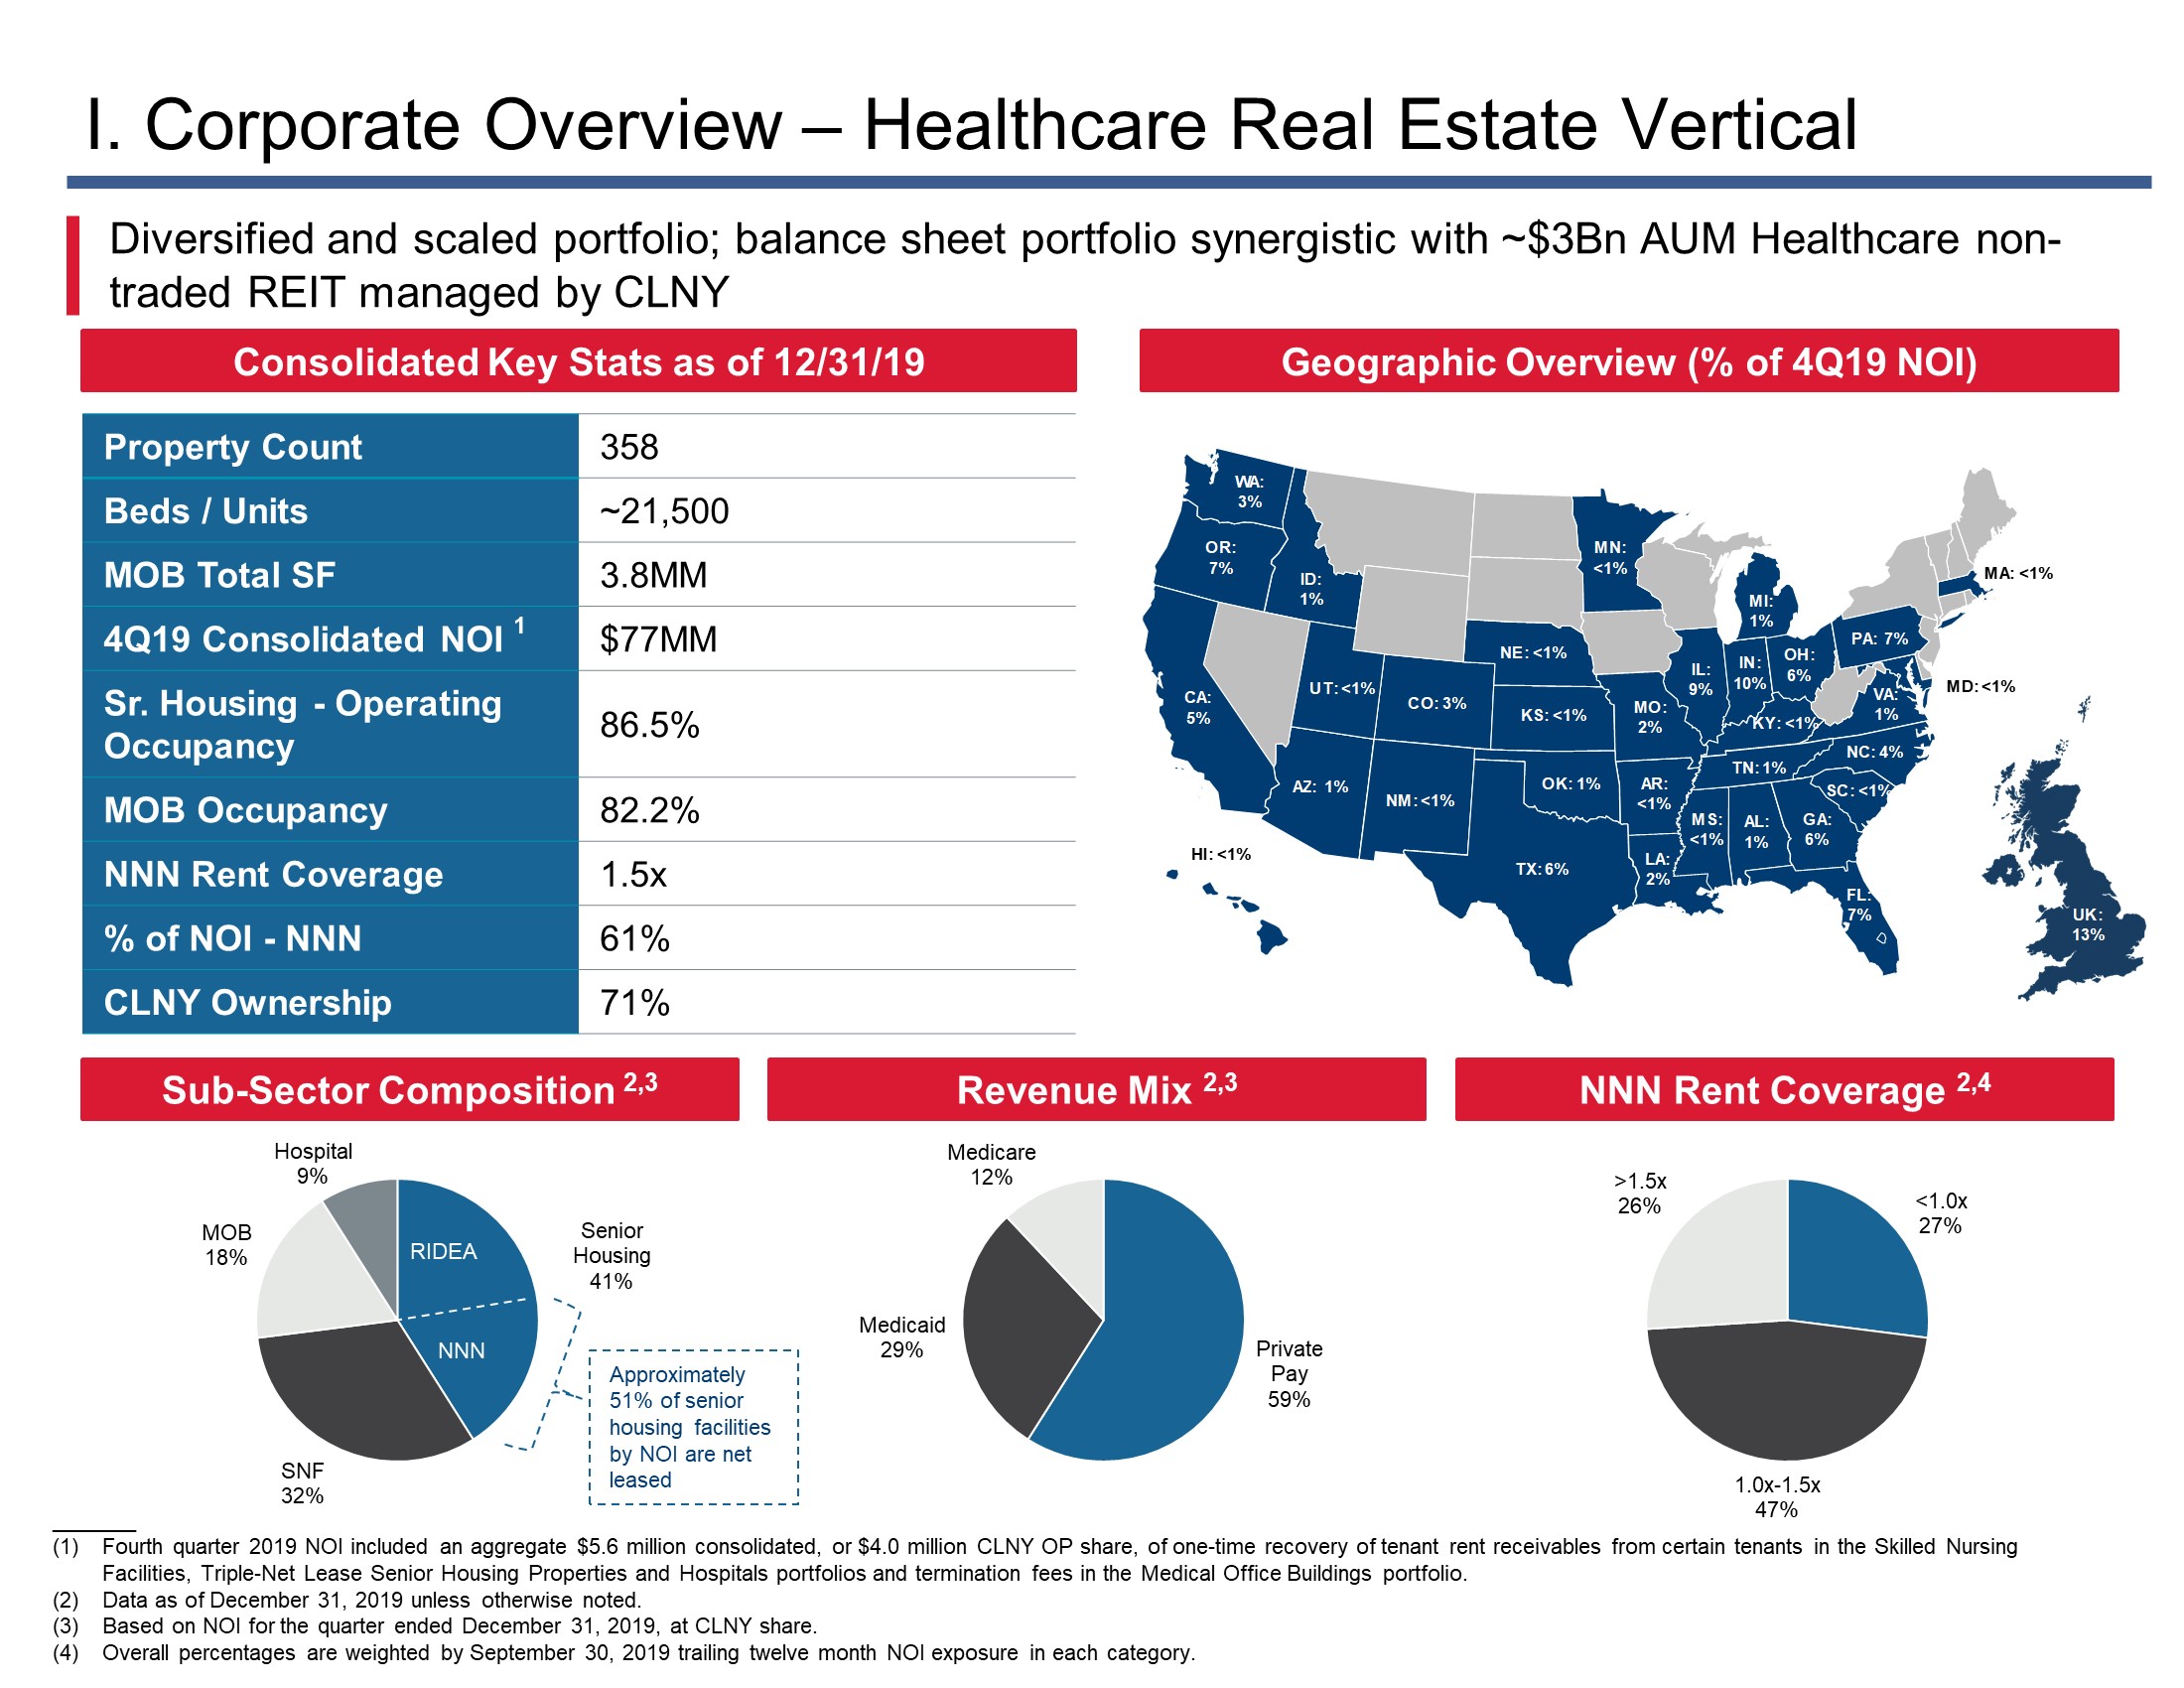
Colony Capital | Supplemental Financial Report | 10 | ||
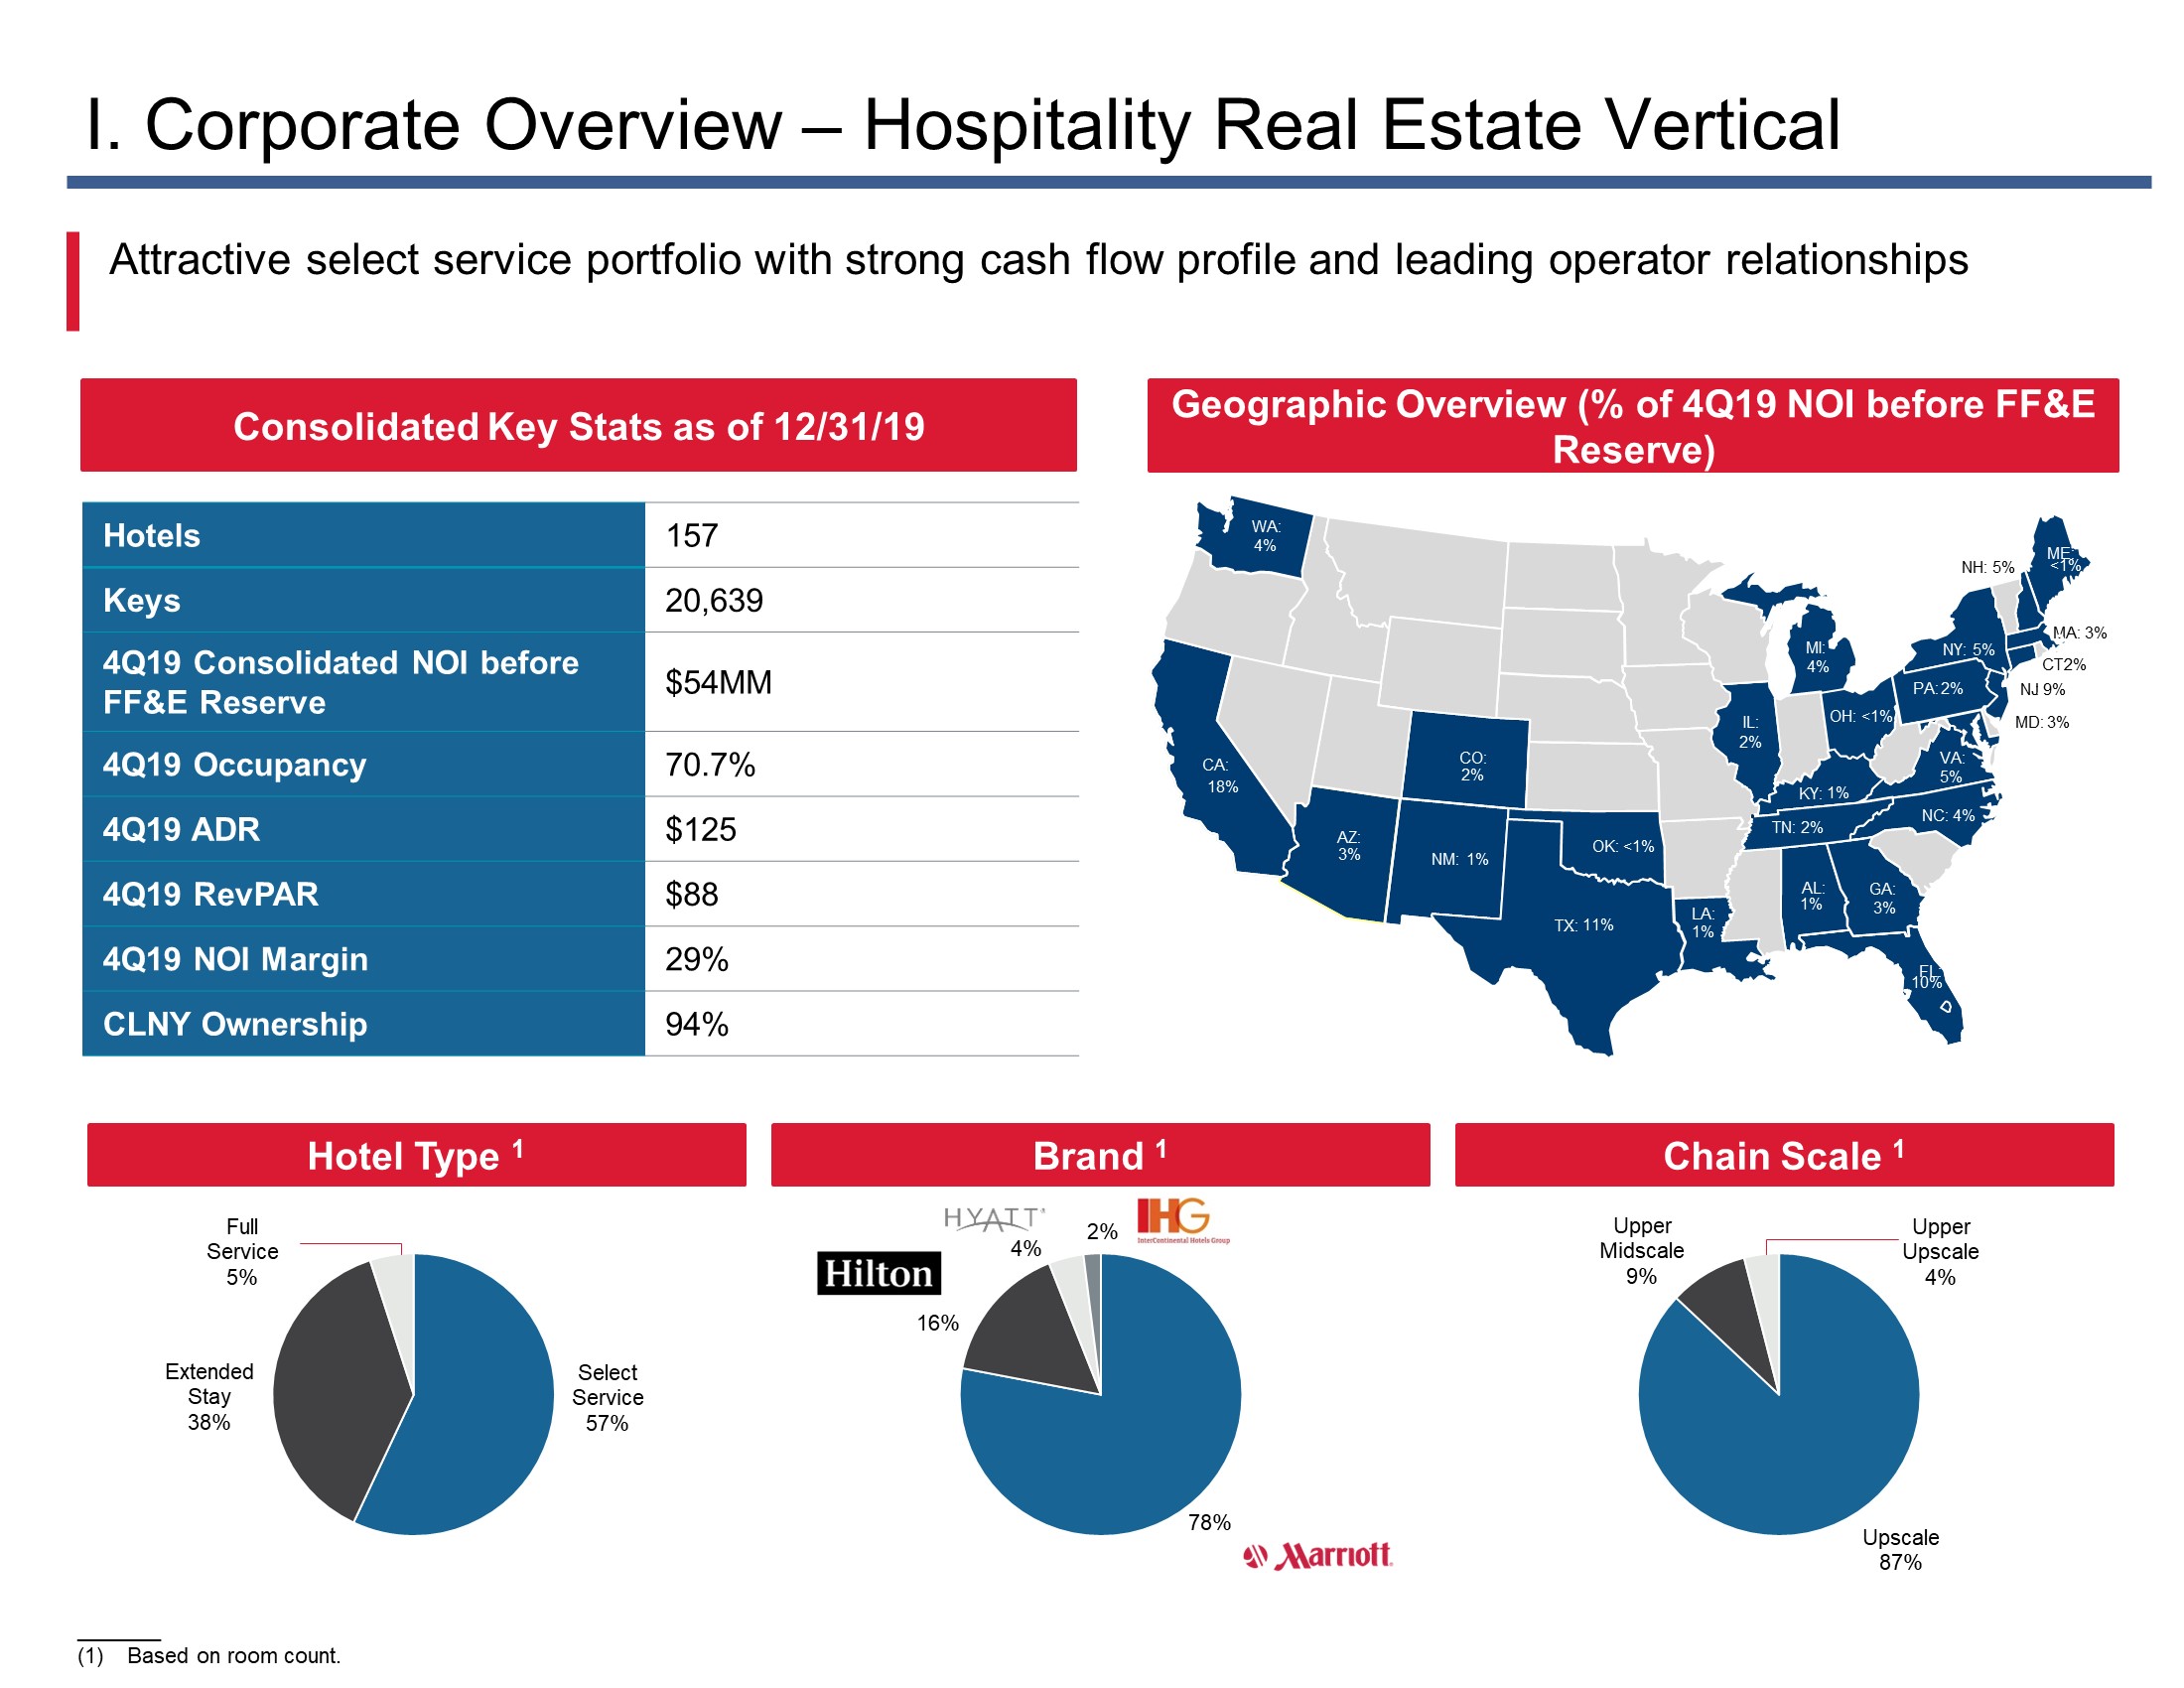
Colony Capital | Supplemental Financial Report | 11 | ||
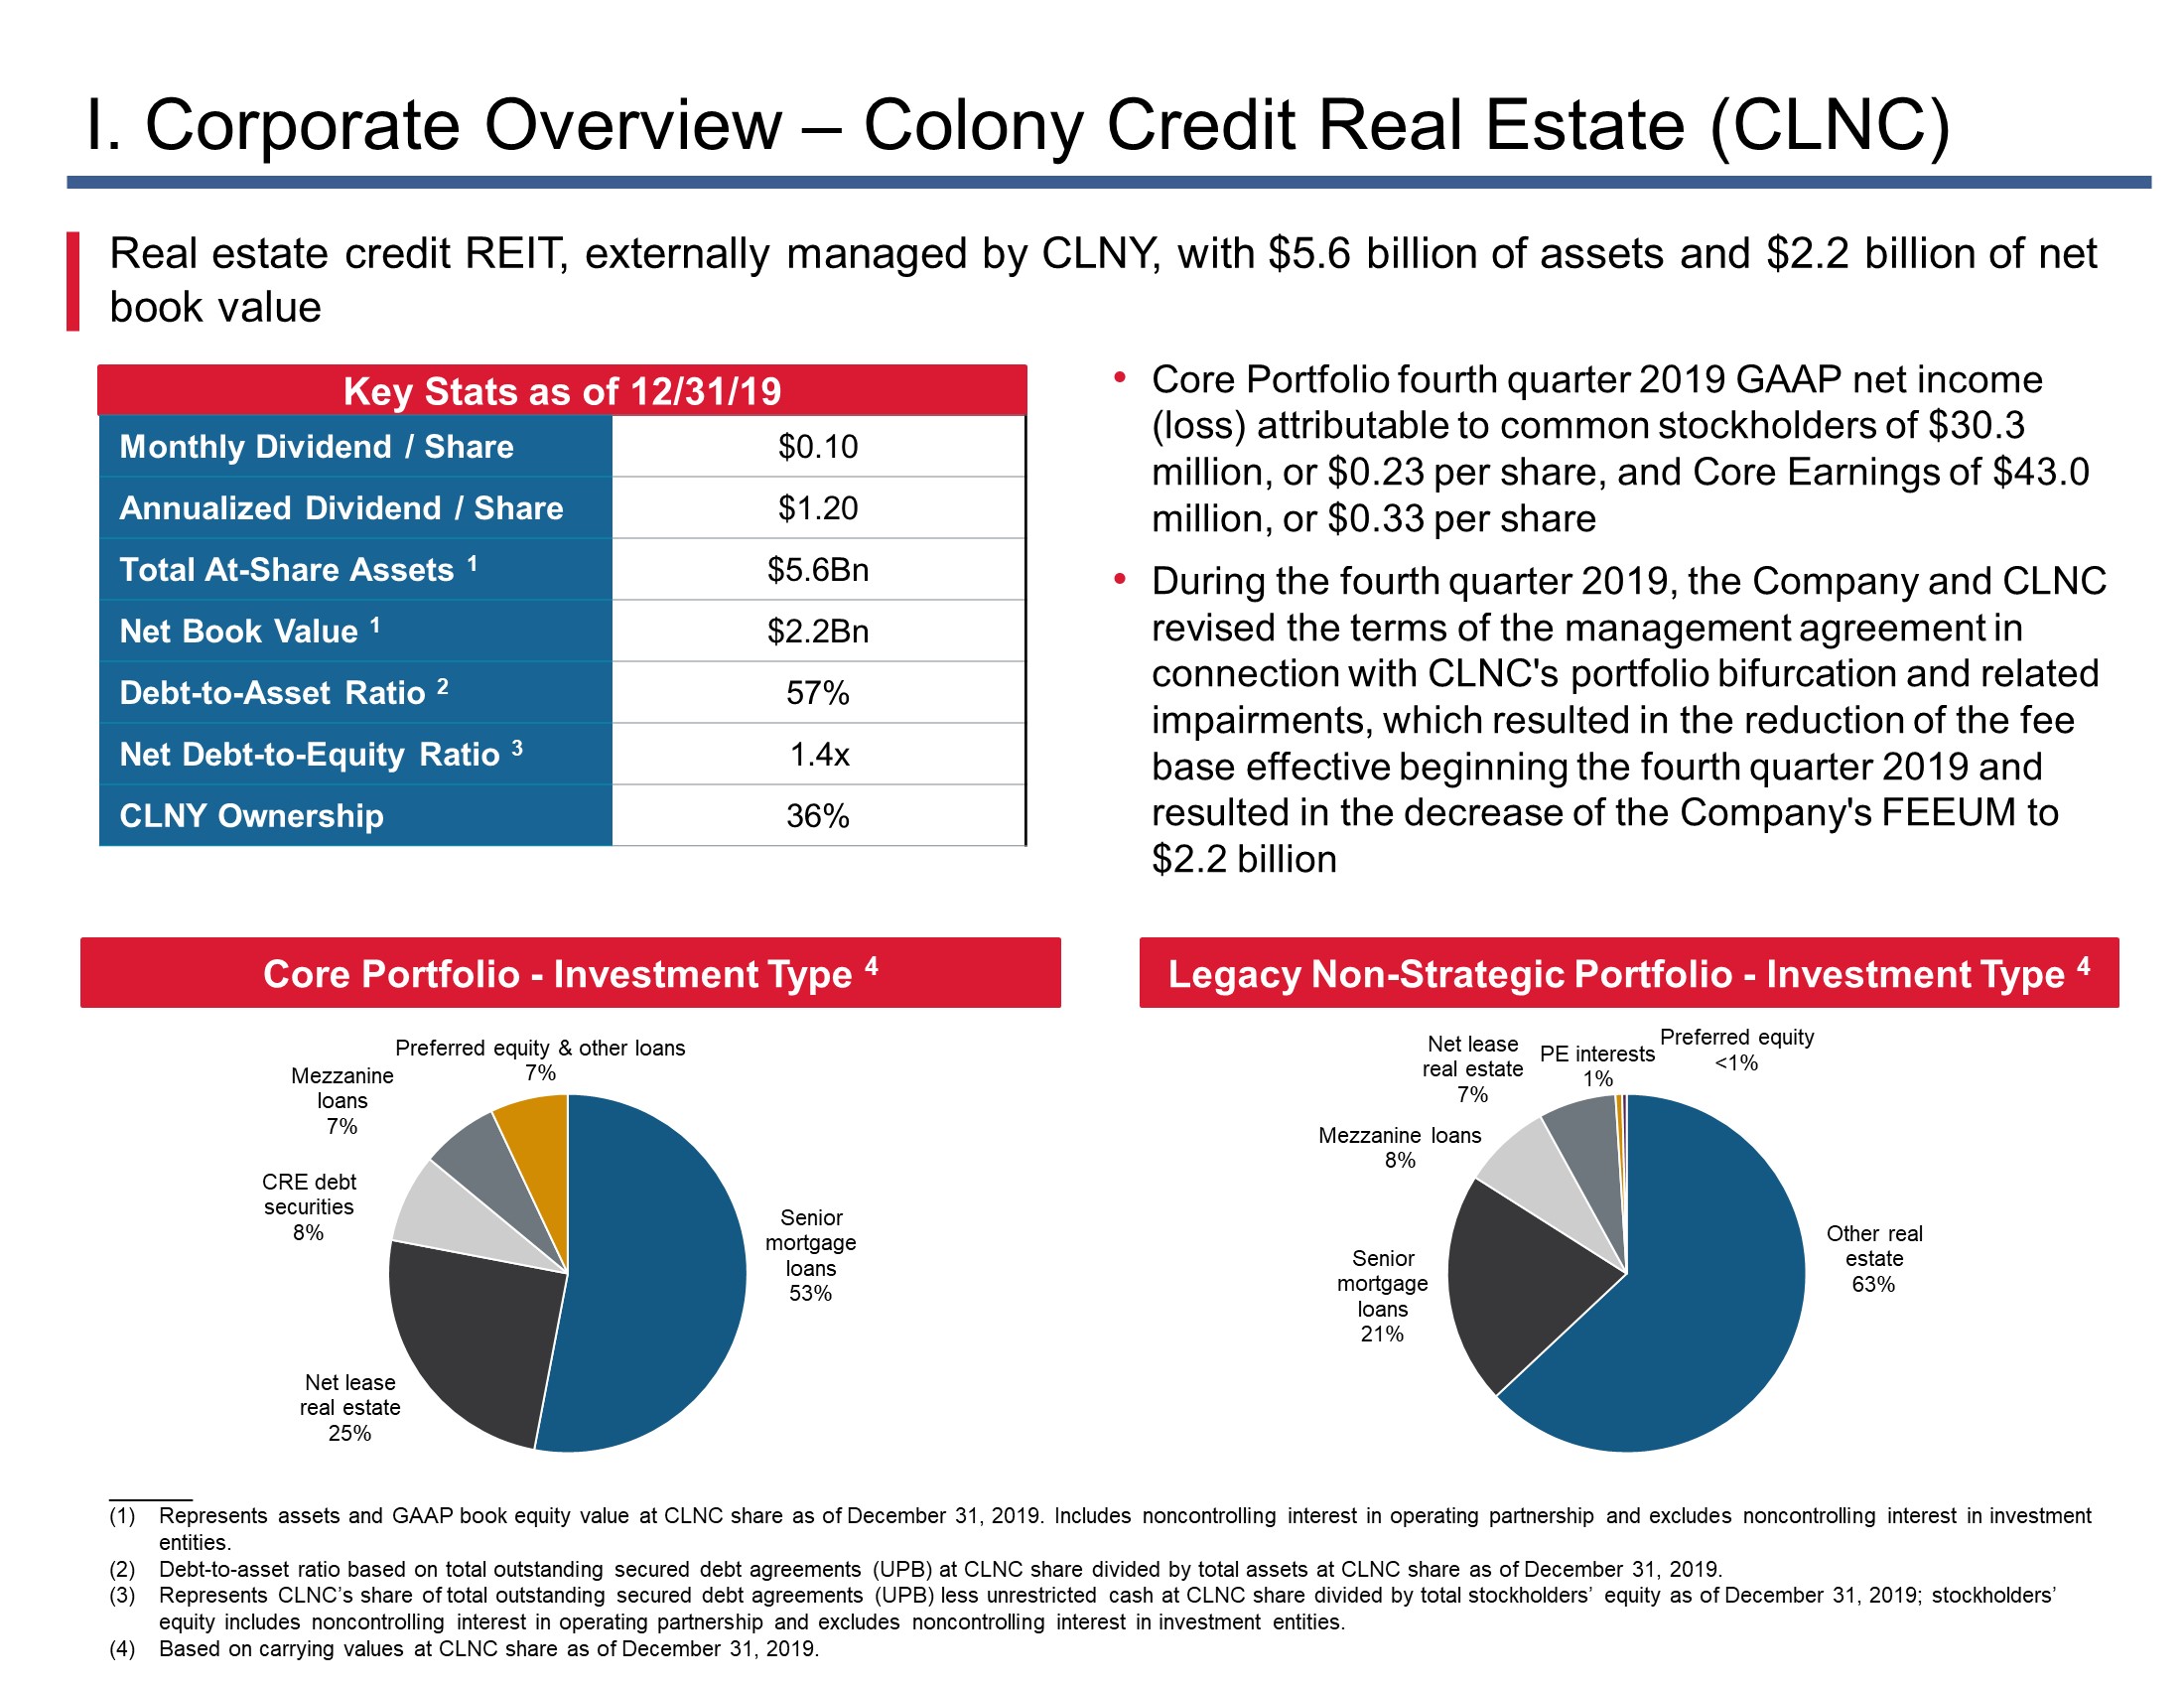
Colony Capital | Supplemental Financial Report | 12 | ||
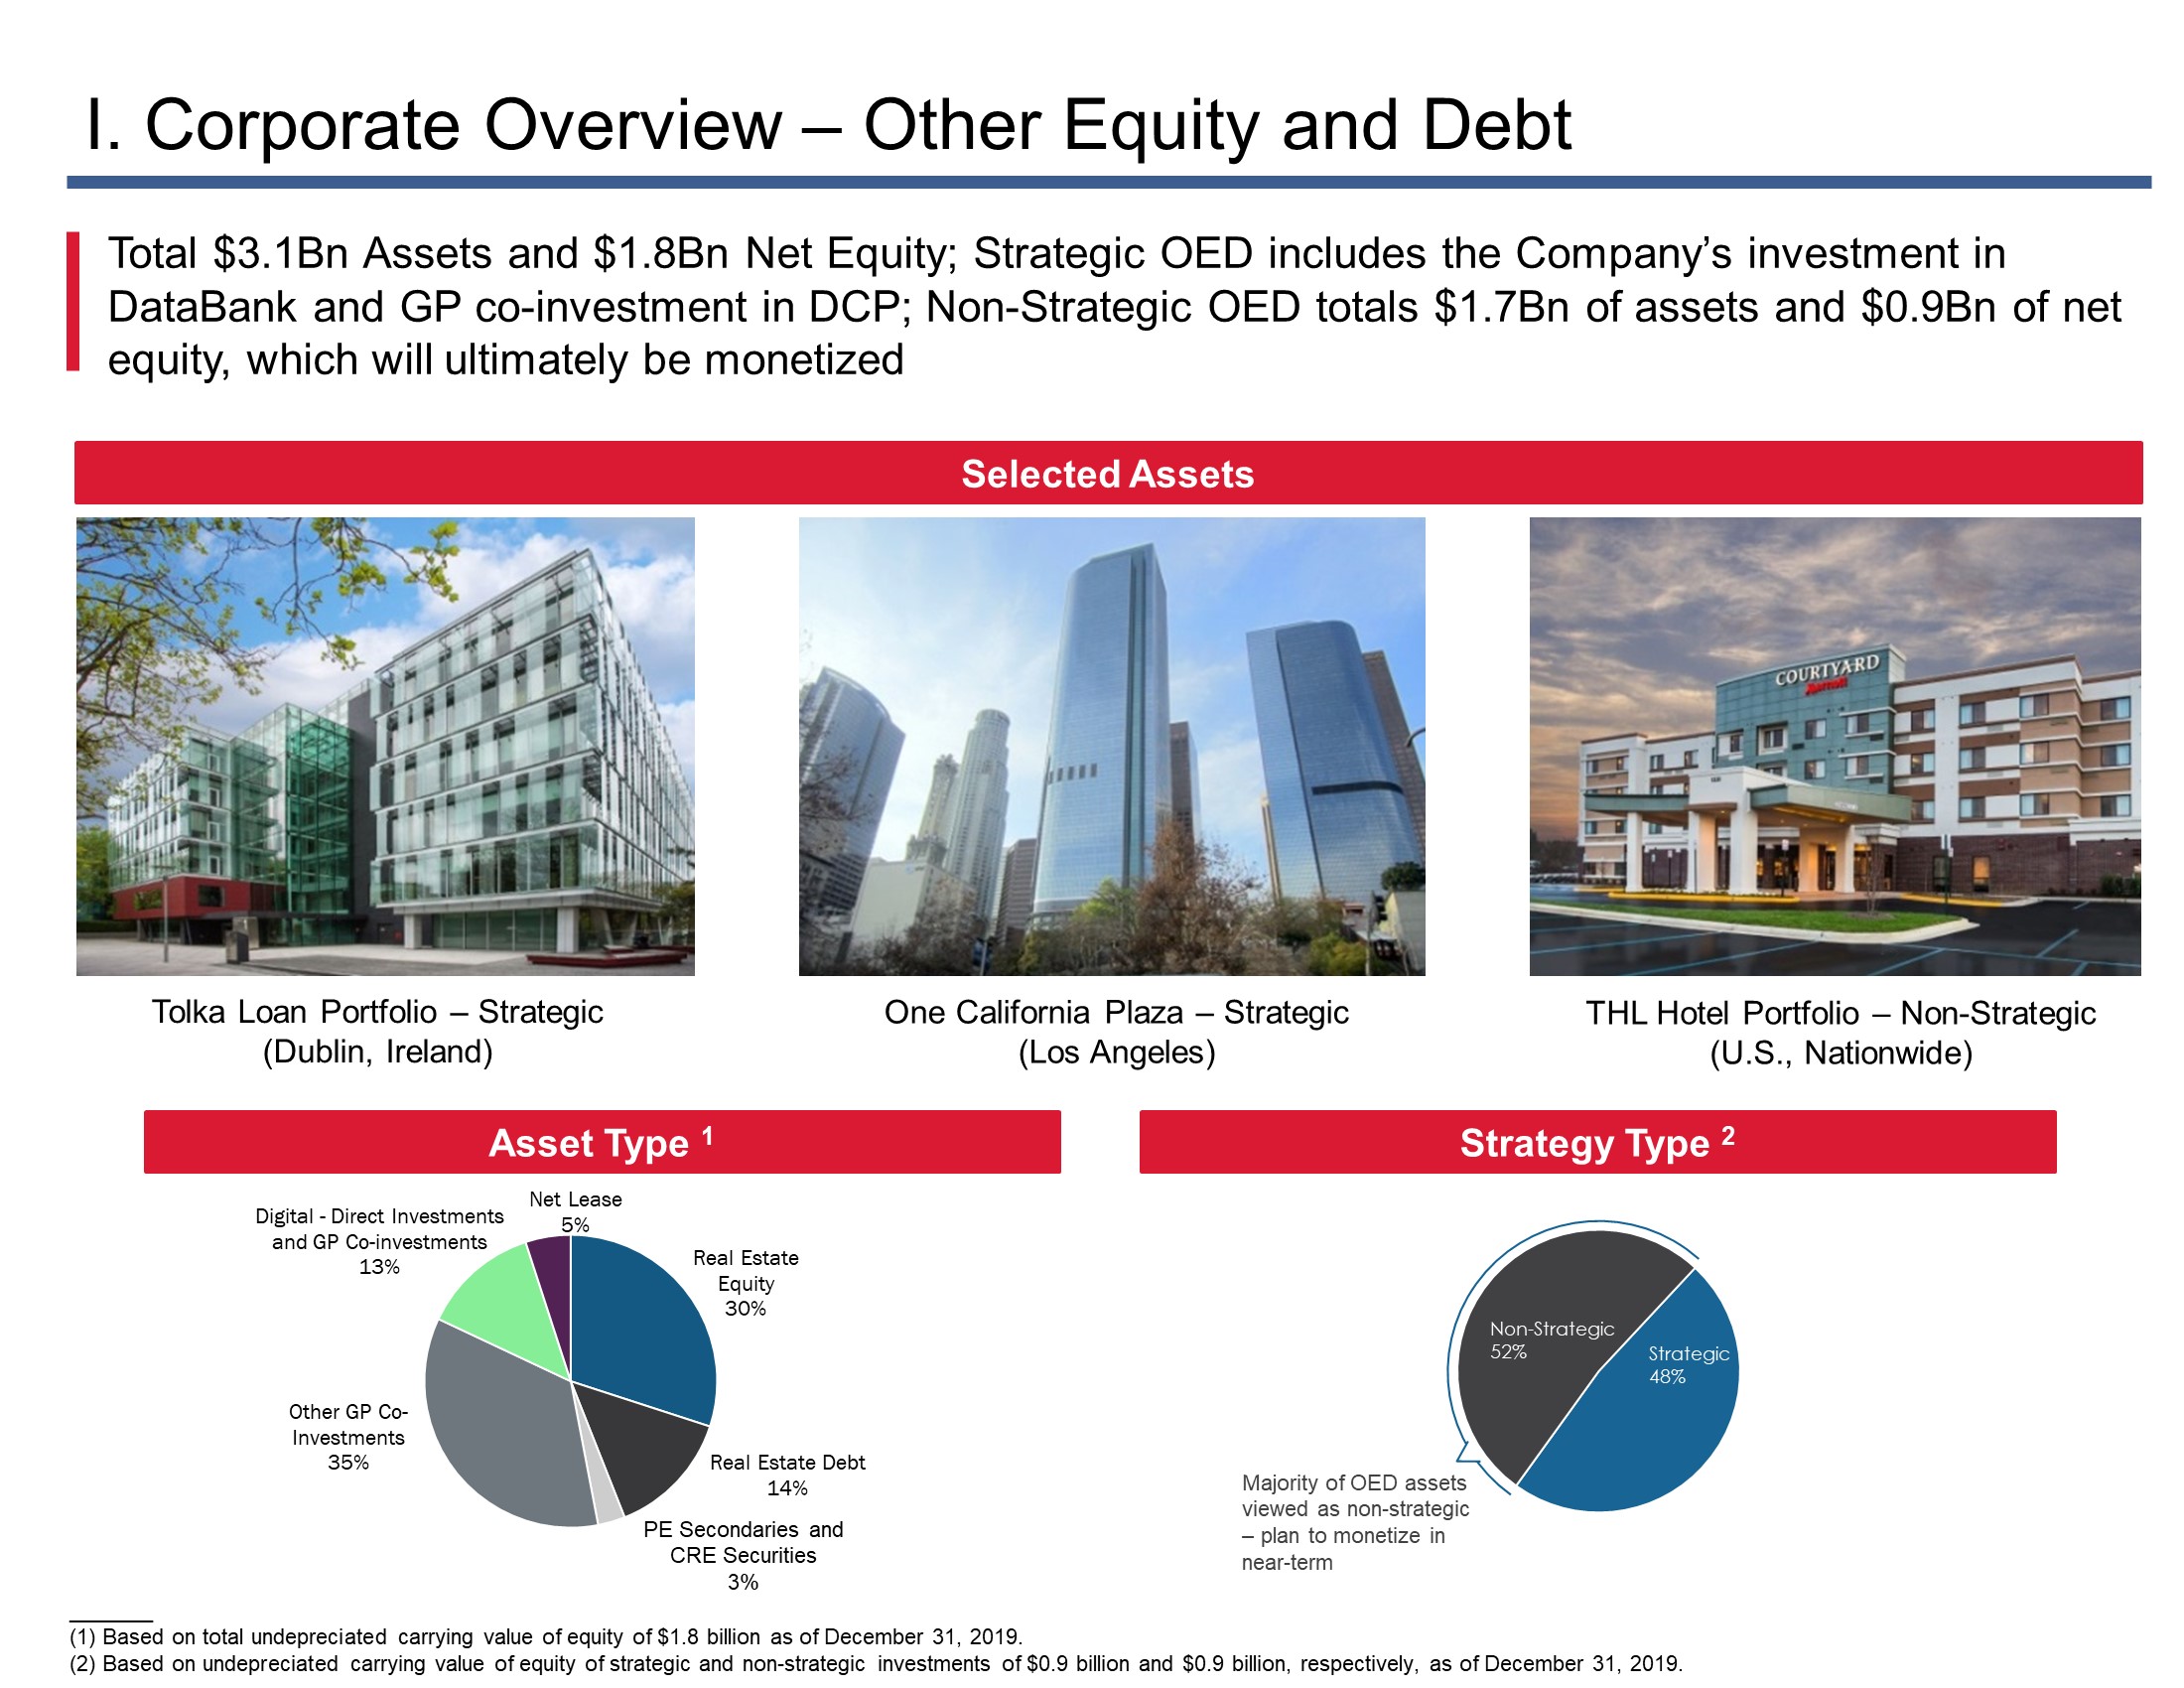
Colony Capital | Supplemental Financial Report | 13 | ||
IIa. Financial Overview - Summary Metrics |
($ and shares in thousands, except per share data and as noted; as of or for the three months ended December 31, 2019, unless otherwise noted) (Unaudited) | |||
Financial Data | |||
Net income (loss) attributable to common stockholders | $ | (26,251 | ) |
Net income (loss) attributable to common stockholders per basic share | (0.06 | ) | |
Core FFO(1) | 47,590 | ||
Core FFO per basic share | 0.09 | ||
Q1 2020 dividend per share | 0.11 | ||
Annualized Q1 2020 dividend per share | 0.44 | ||
Balance Sheet, Capitalization and Trading Statistics | |||
Total consolidated assets | $ | 19,832,184 | |
CLNY OP share of consolidated assets | 13,678,097 | ||
Total consolidated debt(2) | 9,407,842 | ||
CLNY OP share of consolidated debt(2) | 6,835,312 | ||
Shares and OP units outstanding as of December 31, 2019 | 541,039 | ||
Shares and OP units outstanding as of February 25, 2020 | 540,631 | ||
Share price as of February 25, 2020 | 4.55 | ||
Market value of common equity & OP units as of February 25, 2020 | 2,459,871 | ||
Liquidation preference of perpetual preferred equity | 1,033,750 | ||
Insider ownership of shares and OP units as of February 25, 2020 | 9.5 | % | |
Total Assets Under Management ("AUM") | $ 49.0 billion | ||
Fee Earning Equity Under Management ("FEEUM") | $ 19.4 billion | ||
Notes:
In evaluating the information presented throughout this presentation see the appendices to this presentation for definitions and reconciliations of non-GAAP financial measures to GAAP measures.
(1) | Fourth quarter 2019 Core FFO included net losses of $21.4 million. |
(2) | Represents principal balance and excludes debt issuance costs, discounts and premiums. |
Colony Capital | Supplemental Financial Report | 14 | ||
IIb. Financial Overview - Summary of Segments |
($ in thousands; as of or for the three months ended December 31, 2019, unless otherwise noted) | Consolidated amount | CLNY OP share of consolidated amount | ||||
Investment Management | ||||||
Third-party AUM ($ in millions) | $ | 36,286 | ||||
FEEUM ($ in millions)(1) | 19,440 | |||||
Q4 2019 fee revenue and REIM platform equity method earnings | 46,778 | |||||
Healthcare Real Estate | ||||||
Q4 2019 net operating income(2)(3) | 76,571 | 54,366 | ||||
Annualized net operating income(4) | 283,884 | 201,271 | ||||
Investment-level non-recourse financing(5) | 2,953,706 | 2,104,721 | ||||
Hospitality Real Estate | ||||||
Q4 2019 NOI before FF&E Reserve(3) | 54,129 | 50,827 | ||||
TTM NOI before FF&E Reserve(6) | 274,793 | 258,604 | ||||
Investment-level non-recourse financing(5) | 2,667,347 | 2,495,952 | ||||
Notes:
(1) | Subsequent to the fourth quarter 2019, the Company completed the sale of its 27.2% ownership interest in RXR Realty, which represents $1.9 billion of FEEUM. |
(2) | NOI includes $0.9 million consolidated or $0.7 million CLNY OP share of interest earned related to $43 million consolidated or $30 million CLNY OP share carrying value of healthcare real estate development loans. This interest income is in the Interest Income line item on the Company’s Statement of Operations for the three months ended December 31, 2019. |
(3) | For a reconciliation of net income/(loss) attributable to common stockholders to NOI, please refer to the appendix to this presentation. |
(4) | Annualized NOI excludes an aggregate $5.6 million consolidated, or $4.0 million CLNY OP share, of fourth quarter 2019 one-time items from the recovery of tenant rent receivables from certain tenants in the Skilled Nursing Facilities, Triple-Net Lease Senior Housing Properties and Hospitals portfolios and termination fees in the Medical Office Buildings portfolio. |
(5) | Represents unpaid principal balance. |
(6) | TTM = trailing twelve month. |
Colony Capital | Supplemental Financial Report | 15 | ||
IIb. Financial Overview - Summary of Segments (cont’d) |
($ in thousands except as noted; as of or for the three months ended December 31, 2019, unless otherwise noted) | Consolidated amount | CLNY OP share of consolidated amount | ||||||
CLNC | ||||||||
Net carrying value of 36% interest | $ | 725,443 | $ | 725,443 | ||||
Other Equity and Debt (1) | ||||||||
1) Strategic Investments | ||||||||
a) Digital - direct investments and Digital Colony Partners GP co-investments - net carrying value | 954,754 | 232,891 | ||||||
b) GP Co-investments in CDCF IV and CDCF V investments - net carrying value | 1,617,815 | 280,848 | ||||||
c) Other GP co-investments - net carrying value | 365,664 | 356,029 | ||||||
2) Net lease real estate equity | ||||||||
a) Q4 2019 net operating income | 771 | 770 | ||||||
b) Investment-level non-recourse financing(2) | 104,061 | 103,441 | ||||||
3) Other real estate equity | ||||||||
a) Undepreciated carrying value of real estate assets(3) | 1,864,369 | 927,905 | ||||||
b) Investment-level non-recourse financing(2) | 1,237,397 | 614,299 | ||||||
c) Carrying value - equity method investments (including Albertsons) | 317,010 | 237,410 | ||||||
4) Real estate debt | ||||||||
a) Carrying value - consolidated | 300,825 | 214,573 | ||||||
b) Investment-level non-recourse financing(2) | — | — | ||||||
c) Carrying value - equity method investments | 11,160 | 6,089 | ||||||
d) Carrying value - real estate assets (REO within debt portfolio) and other(3) | 45,030 | 25,841 | ||||||
5) CRE securities and real estate PE fund investments | ||||||||
a) Carrying value | 60,251 | |||||||
Net Assets | ||||||||
Cash and cash equivalents, restricted cash and other assets(4) | 2,116,008 | 1,782,074 | ||||||
Accrued and other liabilities and dividends payable(5) | 1,410,867 | 1,118,468 | ||||||
Net assets | $ | 705,141 | $ | 663,606 | ||||
Notes:
(1) | Includes assets classified as held for sale on the Company’s financial statements. |
(2) | Represents unpaid principal balance. |
(3) | Includes all components related to real estate assets, including tangible real estate and lease-related intangibles, and excludes accumulated depreciation. |
(4) | Other assets excludes $3 million consolidated and CLNY OP share of deferred financing costs and $24 million consolidated or $13 million CLNY OP share of restricted cash which is included in the undepreciated carrying value of the hotel portfolio in Other Real Estate Equity shown on page 38. |
(5) | Accrued and other liabilities exclude $8 million consolidated and CLNY OP share of deferred tax liabilities and other liabilities which are not due in cash and $117 million of derivative liability which is included in the debt of Other GP Co-investments shown on page 37. |
Colony Capital | Supplemental Financial Report | 16 | ||
IIIa. Financial Results - Consolidated Balance Sheet |
($ in thousands, except per share data) | As of December 31, 2019 | |||
Assets | ||||
Cash and cash equivalents | $ | 1,205,190 | ||
Restricted cash | 203,923 | |||
Real estate, net | 10,860,518 | |||
Loans receivable, net | 1,552,824 | |||
Equity and debt investments | 2,313,805 | |||
Goodwill | 1,452,891 | |||
Deferred leasing costs and intangible assets, net | 638,853 | |||
Assets held for sale | 870,052 | |||
Other assets | 682,648 | |||
Due from affiliates | 51,480 | |||
Total assets | $ | 19,832,184 | ||
Liabilities | ||||
Debt, net | $ | 8,983,908 | ||
Accrued and other liabilities | 1,015,898 | |||
Intangible liabilities, net | 111,484 | |||
Liabilities related to assets held for sale | 268,152 | |||
Due to affiliates | 34,064 | |||
Dividends and distributions payable | 83,301 | |||
Preferred stock redemptions payable | 402,855 | |||
Total liabilities | 10,899,662 | |||
Commitments and contingencies | ||||
Redeemable noncontrolling interests | 6,107 | |||
Equity | ||||
Stockholders’ equity: | ||||
Preferred stock, $0.01 par value per share; $1,033,750 liquidation preference; 250,000 shares authorized; 41,350 shares issued and outstanding | 999,490 | |||
Common stock, $0.01 par value per share | ||||
Class A, 949,000 shares authorized; 487,044 shares issued and outstanding | 4,871 | |||
Class B, 1,000 shares authorized; 734 shares issued and outstanding | 7 | |||
Additional paid-in capital | 7,553,599 | |||
Accumulated deficit | (3,389,592 | ) | ||
Accumulated other comprehensive income | 47,668 | |||
Total stockholders’ equity | 5,216,043 | |||
Noncontrolling interests in investment entities | 3,254,188 | |||
Noncontrolling interests in Operating Company | 456,184 | |||
Total equity | 8,926,415 | |||
Total liabilities, redeemable noncontrolling interests and equity | $ | 19,832,184 | ||
Colony Capital | Supplemental Financial Report | 17 | ||
IIIb. Financial Results - Noncontrolling Interests’ Share Balance Sheet |
($ in thousands, except per share data) (unaudited) | As of December 31, 2019 | |||
Assets | ||||
Cash and cash equivalents | $ | 114,224 | ||
Restricted cash | 35,865 | |||
Real estate, net | 3,300,115 | |||
Loans receivable, net | 779,143 | |||
Equity and debt investments | 650,980 | |||
Goodwill | 381,349 | |||
Deferred leasing costs and intangible assets, net | 247,446 | |||
Assets held for sale | 450,117 | |||
Other assets | 194,848 | |||
Total assets | $ | 6,154,087 | ||
Liabilities | ||||
Debt, net | $ | 2,419,539 | ||
Accrued and other liabilities | 292,399 | |||
Intangible liabilities, net | 47,004 | |||
Liabilities related to assets held for sale | 134,850 | |||
Total liabilities | 2,893,792 | |||
Commitments and contingencies | ||||
Redeemable noncontrolling interests | 6,107 | |||
Equity | ||||
Stockholders’ equity: | ||||
Preferred stock, $0.01 par value per share; $1,033,750 liquidation preference; 250,000 shares authorized; 41,350 shares issued and outstanding | — | |||
Common stock, $0.01 par value per share | ||||
Class A, 949,000 shares authorized; 487,044 shares issued and outstanding | — | |||
Class B, 1,000 shares authorized; 734 shares issued and outstanding | — | |||
Additional paid-in capital | — | |||
Accumulated deficit | — | |||
Accumulated other comprehensive income | — | |||
Total stockholders’ equity | — | |||
Noncontrolling interests in investment entities | 3,254,188 | |||
Noncontrolling interests in Operating Company | — | |||
Total equity | 3,254,188 | |||
Total liabilities, redeemable noncontrolling interests and equity | $ | 6,154,087 | ||
Colony Capital | Supplemental Financial Report | 18 | ||
IIIc. Financial Results - Consolidated Segment Operating Results |
Three Months Ended December 31, 2019 | ||||||||||||||||||||||||||||||||
($ in thousands) (Unaudited) | Investment Management | Healthcare | Industrial | Hospitality | CLNC | Other Equity and Debt | Amounts not allocated to segments | Total | ||||||||||||||||||||||||
Revenues | ||||||||||||||||||||||||||||||||
Property operating income | $ | — | $ | 153,099 | $ | — | $ | 186,423 | $ | — | $ | 107,046 | $ | — | $ | 446,568 | ||||||||||||||||
Interest income | 75 | 932 | — | — | — | 43,324 | 1,078 | 45,409 | ||||||||||||||||||||||||
Fee income | 45,600 | — | — | — | — | — | — | 45,600 | ||||||||||||||||||||||||
Other income | 7,182 | 347 | — | 27 | — | 4,329 | 2,899 | 14,784 | ||||||||||||||||||||||||
Total revenues | 52,857 | 154,378 | — | 186,450 | — | 154,699 | 3,977 | 552,361 | ||||||||||||||||||||||||
Expenses | ||||||||||||||||||||||||||||||||
Property operating expense | — | 66,106 | — | 132,710 | — | 67,760 | — | 266,576 | ||||||||||||||||||||||||
Interest expense | 1,645 | 41,930 | — | 45,484 | — | 26,537 | 13,281 | 128,877 | ||||||||||||||||||||||||
Investment and servicing expense | 81 | 3,137 | — | 1,787 | — | 19,967 | 1,724 | 26,696 | ||||||||||||||||||||||||
Transaction costs | 319 | — | — | — | — | 366 | — | 685 | ||||||||||||||||||||||||
Placement fees | 1,429 | — | — | — | — | — | — | 1,429 | ||||||||||||||||||||||||
Depreciation and amortization | 8,697 | 41,208 | — | 36,035 | — | 22,612 | 1,501 | 110,053 | ||||||||||||||||||||||||
Provision for loan loss | — | — | — | — | — | 33 | — | 33 | ||||||||||||||||||||||||
Impairment loss | 410,954 | 43,132 | — | 14,649 | — | 2,492 | — | 471,227 | ||||||||||||||||||||||||
Compensation expense | ||||||||||||||||||||||||||||||||
Cash and equity-based compensation | 20,382 | 1,597 | — | 1,615 | — | 4,652 | 25,590 | 53,836 | ||||||||||||||||||||||||
Carried interest and incentive compensation | 3,300 | — | — | — | — | — | — | 3,300 | ||||||||||||||||||||||||
Administrative expenses | 4,765 | 885 | — | 481 | — | 7,135 | 12,546 | 25,812 | ||||||||||||||||||||||||
Total expenses | 451,572 | 197,995 | — | 232,761 | — | 151,554 | 54,642 | 1,088,524 | ||||||||||||||||||||||||
Other income (loss) | ||||||||||||||||||||||||||||||||
Gain on sale of real estate assets | — | 551 | — | — | — | 18,611 | — | 19,162 | ||||||||||||||||||||||||
Other gain (loss), net | 738 | 5,690 | — | 1,492 | — | (16,489 | ) | (1,596 | ) | (10,165 | ) | |||||||||||||||||||||
Equity method earnings (loss) | (613 | ) | — | — | — | 13,064 | 25,613 | — | 38,064 | |||||||||||||||||||||||
Equity method earnings—carried interest | 5,424 | — | — | — | — | — | — | 5,424 | ||||||||||||||||||||||||
Income (loss) before income taxes | (393,166 | ) | (37,376 | ) | — | (44,819 | ) | 13,064 | 30,880 | (52,261 | ) | (483,678 | ) | |||||||||||||||||||
Income tax benefit (expense) | 3,241 | (1,232 | ) | — | 1,700 | — | (3,695 | ) | (266 | ) | (252 | ) | ||||||||||||||||||||
Income (loss) from continuing operations | (389,925 | ) | (38,608 | ) | — | (43,119 | ) | 13,064 | 27,185 | (52,527 | ) | (483,930 | ) | |||||||||||||||||||
Income (loss) from discontinued operations | (10,561 | ) | — | 1,426,219 | — | — | — | — | 1,415,658 | |||||||||||||||||||||||
Net income (loss) | (400,486 | ) | (38,608 | ) | 1,426,219 | (43,119 | ) | 13,064 | 27,185 | (52,527 | ) | 931,728 | ||||||||||||||||||||
Net income (loss) attributable to noncontrolling interests: | ||||||||||||||||||||||||||||||||
Redeemable noncontrolling interests | — | — | — | — | — | 242 | — | 242 | ||||||||||||||||||||||||
Investment entities | (28,531 | ) | (4,107 | ) | 943,647 | (3,816 | ) | — | 31,423 | — | 938,616 | |||||||||||||||||||||
Operating Company | (36,305 | ) | (3,366 | ) | 47,078 | (3,834 | ) | 1,275 | (438 | ) | (7,277 | ) | (2,867 | ) | ||||||||||||||||||
Net income (loss) attributable to Colony Capital, Inc. | (335,650 | ) | (31,135 | ) | 435,494 | (35,469 | ) | 11,789 | (4,042 | ) | (45,250 | ) | (4,263 | ) | ||||||||||||||||||
Preferred stock redemption | — | — | — | — | — | — | (5,150 | ) | (5,150 | ) | ||||||||||||||||||||||
Preferred stock dividends | — | — | — | — | — | — | 27,138 | 27,138 | ||||||||||||||||||||||||
Net income (loss) attributable to common stockholders | $ | (335,650 | ) | $ | (31,135 | ) | $ | 435,494 | $ | (35,469 | ) | $ | 11,789 | $ | (4,042 | ) | $ | (67,238 | ) | $ | (26,251 | ) | ||||||||||
Colony Capital | Supplemental Financial Report | 19 | ||
IIId. Financial Results - Noncontrolling Interests’ Share Segment Operating Results |
Three Months Ended December 31, 2019 | |||||||||||||||||||||||||||||||||
($ in thousands) (unaudited) | Investment Management | Healthcare | Industrial | Hospitality | CLNC | Other Equity and Debt | Amounts not allocated to segments | Total | |||||||||||||||||||||||||
Revenues | — | ||||||||||||||||||||||||||||||||
Property operating income | $ | — | $ | 43,486 | $ | — | $ | 11,673 | $ | — | $ | 56,532 | $ | — | $ | 111,691 | |||||||||||||||||
Interest income | — | 279 | — | — | — | 24,167 | — | 24,446 | |||||||||||||||||||||||||
Fee income | — | — | — | — | — | — | — | — | |||||||||||||||||||||||||
Other income | — | 71 | — | 4 | — | 1,699 | — | 1,774 | |||||||||||||||||||||||||
Total revenues | — | 43,836 | — | 11,677 | — | 82,398 | — | 137,911 | |||||||||||||||||||||||||
Expenses | |||||||||||||||||||||||||||||||||
Property operating expense | — | 18,237 | — | 8,558 | — | 33,610 | — | 60,405 | |||||||||||||||||||||||||
Interest expense | — | 11,966 | — | 3,167 | — | 12,489 | — | 27,622 | |||||||||||||||||||||||||
Investment and servicing expense | — | 854 | — | 137 | — | 9,824 | — | 10,815 | |||||||||||||||||||||||||
Transaction costs | — | — | — | — | — | — | — | — | |||||||||||||||||||||||||
Placement fees | — | — | — | — | — | — | — | — | |||||||||||||||||||||||||
Depreciation and amortization | — | 11,877 | — | 2,342 | — | 13,319 | — | 27,538 | |||||||||||||||||||||||||
Provision for loan loss | — | — | — | — | — | 27 | — | 27 | |||||||||||||||||||||||||
Impairment loss | — | 9,857 | — | 1,254 | — | 3,582 | — | 14,693 | |||||||||||||||||||||||||
Compensation expense | |||||||||||||||||||||||||||||||||
Cash and equity-based compensation | — | — | — | — | — | 2,581 | — | 2,581 | |||||||||||||||||||||||||
Carried interest and incentive compensation | — | — | — | — | — | — | — | — | |||||||||||||||||||||||||
Administrative expenses | — | 246 | — | 21 | — | 4,141 | — | 4,408 | |||||||||||||||||||||||||
Total expenses | — | 53,037 | — | 15,479 | — | 79,573 | — | 148,089 | |||||||||||||||||||||||||
Other income (loss) | |||||||||||||||||||||||||||||||||
Gain on sale of real estate assets | — | 103 | — | — | — | 14,295 | — | 14,398 | |||||||||||||||||||||||||
Other gain (loss), net | — | 1,727 | — | (14 | ) | — | (3,175 | ) | — | (1,462 | ) | ||||||||||||||||||||||
Equity method earnings (losses) | 145 | — | — | — | — | 19,845 | — | 19,990 | |||||||||||||||||||||||||
Equity method earnings—carried interest | (596 | ) | — | — | — | — | — | — | (596 | ) | |||||||||||||||||||||||
Income (loss) before income taxes | (451 | ) | (7,371 | ) | — | (3,816 | ) | — | 33,790 | — | 22,152 | ||||||||||||||||||||||
Income tax benefit (expense) | — | (439 | ) | — | — | — | (2,125 | ) | — | (2,564 | ) | ||||||||||||||||||||||
Net income (loss) | (451 | ) | (7,810 | ) | — | (3,816 | ) | — | 31,665 | — | 19,588 | ||||||||||||||||||||||
Income (loss) from discontinued operations | — | — | 943,647 | — | — | — | — | 943,647 | |||||||||||||||||||||||||
Non-pro rata allocation of income (loss) to NCI | (28,080 | ) | 3,703 | — | — | — | — | — | (24,377 | ) | |||||||||||||||||||||||
Net income (loss) attributable to noncontrolling interests | $ | (28,531 | ) | $ | (4,107 | ) | $ | 943,647 | $ | (3,816 | ) | $ | — | $ | 31,665 | $ | — | $ | 938,858 | ||||||||||||||
Colony Capital | Supplemental Financial Report | 20 | ||
IIIe. Financial Results - Segment Reconciliation of Net Income to FFO & Core FFO |
Three Months Ended December 31, 2019 | ||||||||||||||||||||||||||||||||||||||||
OP pro rata share by segment | Amounts attributable to noncontrolling interests | CLNY consolidated as reported | ||||||||||||||||||||||||||||||||||||||
($ in thousands) (Unaudited) | Investment Management | Healthcare | Industrial | Hospitality | CLNC | Other Equity and Debt | Amounts not allocated to segments | Total OP pro rata share | ||||||||||||||||||||||||||||||||
Net income (loss) attributable to common stockholders | $ | (335,650 | ) | $ | (31,135 | ) | $ | 435,494 | $ | (35,469 | ) | $ | 11,789 | $ | (4,042 | ) | $ | (67,238 | ) | $ | (26,251 | ) | $ | — | $ | (26,251 | ) | |||||||||||||
Net income (loss) attributable to noncontrolling common interests in Operating Company | (36,305 | ) | (3,366 | ) | 47,078 | (3,834 | ) | 1,275 | (438 | ) | (7,277 | ) | (2,867 | ) | — | (2,867 | ) | |||||||||||||||||||||||
Net income (loss) attributable to common interests in Operating Company and common stockholders | (371,955 | ) | (34,501 | ) | 482,572 | (39,303 | ) | 13,064 | (4,480 | ) | (74,515 | ) | (29,118 | ) | — | (29,118 | ) | |||||||||||||||||||||||
Adjustments for FFO: | ||||||||||||||||||||||||||||||||||||||||
Real estate depreciation and amortization | 1,729 | 30,807 | 3,205 | 33,693 | 7,397 | 9,471 | — | 86,302 | 31,951 | 118,253 | ||||||||||||||||||||||||||||||
Impairment of real estate | — | 33,275 | — | 13,395 | — | (1,090 | ) | — | 45,580 | 14,693 | 60,273 | |||||||||||||||||||||||||||||
Gain from sales of real estate | — | (448 | ) | (486,874 | ) | — | — | (4,372 | ) | — | (491,694 | ) | (957,346 | ) | (1,449,040 | ) | ||||||||||||||||||||||||
Less: Adjustments attributable to noncontrolling interests in investment entities | — | — | — | — | — | — | — | — | 910,702 | 910,702 | ||||||||||||||||||||||||||||||
FFO | $ | (370,226 | ) | $ | 29,133 | $ | (1,097 | ) | $ | 7,785 | $ | 20,461 | $ | (471 | ) | $ | (74,515 | ) | $ | (388,930 | ) | $ | — | $ | (388,930 | ) | ||||||||||||||
Additional adjustments for Core FFO: | ||||||||||||||||||||||||||||||||||||||||
Gains and losses from sales of depreciable real estate within the Other Equity and Debt segment, net of depreciation, amortization and impairment previously adjusted for FFO(1) | — | — | — | — | — | (5,264 | ) | — | (5,264 | ) | 5,901 | 637 | ||||||||||||||||||||||||||||
Gains and losses from sales of businesses within the Investment Management segment and impairment write-downs associated with the Investment Management segment | 409,426 | — | (9,427 | ) | — | — | — | — | 399,999 | — | 399,999 | |||||||||||||||||||||||||||||
CLNC Core Earnings adjustments(2) | — | — | — | — | (5,401 | ) | — | — | (5,401 | ) | — | (5,401 | ) | |||||||||||||||||||||||||||
Equity-based compensation expense | 2,666 | 539 | 6,035 | 545 | 1,218 | 421 | 8,730 | 20,154 | — | 20,154 | ||||||||||||||||||||||||||||||
Straight-line rent revenue and expense | 255 | (1,586 | ) | (906 | ) | 280 | — | (669 | ) | (526 | ) | (3,152 | ) | (2,583 | ) | (5,735 | ) | |||||||||||||||||||||||
Amortization of acquired above- and below-market lease values, net | — | (6,303 | ) | (268 | ) | — | (144 | ) | (29 | ) | — | (6,744 | ) | (3,247 | ) | (9,991 | ) | |||||||||||||||||||||||
Amortization of deferred financing costs and debt premiums and discounts | 102 | 1,915 | 9,275 | 10,424 | (2 | ) | 2,487 | 1,734 | 25,935 | 23,318 | 49,253 | |||||||||||||||||||||||||||||
Unrealized fair value losses on interest rate and foreign currency hedges, and foreign currency remeasurements and realized gains and losses on interest rate hedging instruments existing at the time of the January 2017 merger with remaining terms greater than one year that served as economic hedges for any financing or refinancing of the Company's real estate verticals | (15 | ) | (4,113 | ) | — | — | (716 | ) | 1,072 | 1,745 | (2,027 | ) | 1,138 | (889 | ) | |||||||||||||||||||||||||
Acquisition and merger-related transaction costs | 319 | — | — | (1,629 | ) | — | 366 | — | (944 | ) | — | (944 | ) | |||||||||||||||||||||||||||
Restructuring and merger integration costs(3) | 1,070 | — | 11,559 | — | — | — | 4,055 | 16,684 | — | 16,684 | ||||||||||||||||||||||||||||||
Amortization and impairment of investment management intangibles | 8,640 | — | — | — | — | — | — | 8,640 | — | 8,640 | ||||||||||||||||||||||||||||||
Non-real estate depreciation and amortization | 36 | — | 30 | — | — | 85 | 1,500 | 1,651 | 271 | 1,922 | ||||||||||||||||||||||||||||||
Amortization of gain on remeasurement of consolidated investment entities | — | — | — | — | — | 3 | — | 3 | 3 | 6 | ||||||||||||||||||||||||||||||
Tax effect of Core FFO adjustments, net | (3,333 | ) | — | (3,575 | ) | — | — | — | (956 | ) | (7,864 | ) | — | (7,864 | ) | |||||||||||||||||||||||||
Preferred share redemption gain | — | — | — | — | — | — | (5,150 | ) | (5,150 | ) | — | (5,150 | ) | |||||||||||||||||||||||||||
Less: Adjustments attributable to noncontrolling interests in investment entities | — | — | — | — | — | — | — | — | (24,801 | ) | (24,801 | ) | ||||||||||||||||||||||||||||
Core FFO | $ | 48,940 | $ | 19,585 | $ | 11,626 | $ | 17,405 | $ | 15,416 | $ | (1,999 | ) | $ | (63,383 | ) | $ | 47,590 | $ | — | $ | 47,590 | ||||||||||||||||||
Notes:
(1) | Net of $18.0 million consolidated or $9.6 million CLNY OP share of depreciation, amortization and impairment charges previously adjusted to calculate FFO. |
(2) | Represents adjustments to align the Company’s Core FFO with CLNC’s definition of Core Earnings to reflect the Company’s percentage interest in CLNC's earnings. |
(3) | Restructuring and merger integration costs primarily represent costs and charges incurred as a result of the corporate restructuring and reorganization plan announced in November 2018 and the implementation of the digital evolution, including the completed sale of the Industrial business, NorthStar Realty Europe and future sales and disposition of non-digital businesses, platforms and investments. These costs and charges include severance, retention, relocation, transition and other related restructuring costs, which are not reflective of the Company’s core operating performance and the Company does not expect to incur these costs subsequent to the completion of the corporate restructuring and reorganization plan and the digital evolution. |
Colony Capital | Supplemental Financial Report | 21 | ||
IVa. Capitalization - Overview |
($ in thousands; except per share data; as of December 31, 2019, unless otherwise noted) | Consolidated amount | CLNY OP share of consolidated amount | |||||||||
Debt (UPB) | |||||||||||
$750,000 Revolving credit facility | $ | — | $ | — | |||||||
Convertible/exchangeable senior notes | 616,105 | 616,105 | |||||||||
Corporate aircraft promissory note | 35,072 | 35,072 | |||||||||
Trust Preferred Securities ("TruPS") | 280,117 | 280,117 | |||||||||
Investment-level debt: | |||||||||||
Healthcare | 2,953,706 | 2,104,721 | |||||||||
Industrial | 235,000 | 119,850 | |||||||||
Hospitality | 2,667,347 | 2,495,952 | |||||||||
Other Equity and Debt(1) | 2,620,495 | 1,183,495 | |||||||||
Total investment-level debt | 8,476,548 | 5,904,018 | |||||||||
Total debt | $ | 9,407,842 | $ | 6,835,312 | |||||||
Perpetual preferred equity, redemption value | |||||||||||
Total perpetual preferred equity(2) | $ | 1,033,750 | |||||||||
Common equity as of February 25, 2020 | Price per share | Shares / Units | |||||||||
Class A and B common stock | $ | 4.55 | 487,370 | $ | 2,217,534 | ||||||
OP units | 4.55 | 53,261 | 242,338 | ||||||||
Total market value of common equity | $ | 2,459,872 | |||||||||
Total market capitalization | $ | 10,328,934 | |||||||||
Notes:
(1) | In December 2019, the Company made its inaugural direct balance sheet investment in digital real estate by acquiring a 20.4% interest in DataBank. Debt related to Databank of $539 million consolidated or $110 million CLNY OP share is included in Other Equity and Debt. |
(2) | On January 10, 2020, the Company redeemed all of its outstanding 8.25% Series B and 8.75% Series E cumulative redeemable perpetual preferred stock for $408 million, including accrued interest of $5 million, eliminating $34 million of annualized preferred dividends. |
Colony Capital | Supplemental Financial Report | 22 | ||
IVb. Capitalization - Investment-Level Debt Overview |
($ in thousands; as of or for the three months ended December 31, 2019, unless otherwise noted) | ||||||||||||||||
Non-recourse investment-level debt overview | ||||||||||||||||
Consolidated | CLNY OP share of consolidated amount | |||||||||||||||
Fixed / Floating | Unpaid principal balance | Unpaid principal balance | Wtd. avg. years remaining to maturity | Wtd. avg. interest rate(1) | ||||||||||||
Healthcare | Fixed | $ | 405,980 | $ | 285,039 | 5.1 | 4.5 | % | ||||||||
Healthcare | Floating | 2,547,726 | 1,819,682 | 4.3 | 5.2 | % | ||||||||||
Bulk Industrial | Floating | 235,000 | 119,850 | 4.2 | 3.8 | % | ||||||||||
Hospitality | Fixed | 13,494 | 13,156 | 1.6 | 12.7 | % | ||||||||||
Hospitality | Floating | 2,653,853 | 2,482,796 | 4.6 | 4.8 | % | ||||||||||
Other Equity and Debt | ||||||||||||||||
Net lease real estate equity | Fixed | 104,061 | 103,441 | 3.4 | 5.0 | % | ||||||||||
Other real estate equity | Fixed | 45,979 | 13,221 | 3.2 | 2.8 | % | ||||||||||
Other real estate equity | Floating | 1,191,418 | 601,078 | 2.8 | 4.6 | % | ||||||||||
GP Co-investments(2) | Floating | 1,277,300 | 465,409 | 2.8 | 4.5 | % | ||||||||||
GP Co-investments | Fixed | 1,737 | 346 | 3.6 | 2.4 | % | ||||||||||
Total investment-level debt | $ | 8,476,548 | $ | 5,904,018 | 4.2 | 4.9 | % | |||||||||
Fixed / Floating Summary | ||||||||||||||||
Fixed | $ | 571,251 | $ | 415,203 | ||||||||||||
Floating | 7,905,297 | 5,488,815 | ||||||||||||||
Total investment-level debt | $ | 8,476,548 | $ | 5,904,018 | ||||||||||||
Notes:
(1) | Based on 1-month LIBOR of 1.76% and 3-month LIBOR of 1.91% for floating rate debt. |
(2) | In December 2019, the Company made its inaugural direct balance sheet investment in digital real estate by acquiring a 20.4% interest in DataBank. Debt related to Databank of $539 million consolidated or $110 million CLNY OP share is included in Other Equity and Debt. |
Colony Capital | Supplemental Financial Report | 23 | ||
IVc. Capitalization - Revolving Credit Facility Overview |
($ in thousands, except as noted; as of December 31, 2019) | ||||
Revolving credit facility | ||||
Maximum principal amount | $ | 750,000 | ||
Amount outstanding | — | |||
Initial maturity | January 11, 2021 | |||
Fully-extended maturity | January 10, 2022 | |||
Interest rate | LIBOR + 2.25% | |||
Financial covenants as defined in the Credit Agreement: | Covenant level | |||
Consolidated Tangible Net Worth | Minimum $4,550 million | |||
Consolidated Fixed Charge Coverage Ratio(1) | Minimum 1.30 to 1.00 | |||
Interest Coverage Ratio(2) | Minimum 3.00 to 1.00 | |||
Consolidated Leverage Ratio | Maximum 0.65 to 1.00 | |||
Company status: As of December 31, 2019, CLNY is meeting all required covenant threshold levels | ||||
Notes:
(1) | In the event the Fixed Charge Coverage Ratio is between 1.50 and 1.30 to 1.00, the borrowing base formula will be discounted by 10%. |
(2) | Interest Coverage Ratio represents the ratio of the sum of (1) earnings from borrowing base assets and (2) certain investment management earnings divided by the greater of (a) actual interest expense on the revolving credit facility and (b) the average balance of the facility multiplied by 7.0% for the applicable quarter. |
Colony Capital | Supplemental Financial Report | 24 | ||
IVd. Capitalization - Corporate Securities Overview |
($ in thousands; except per share data; as of December 31, 2019, unless otherwise noted) | ||||||||||||||||||
Convertible/exchangeable debt | ||||||||||||||||||
Description | Outstanding principal | Final due date(1) | Interest rate | Conversion price (per share of common stock) | Conversion ratio | Conversion shares | ||||||||||||
5.0% Convertible senior notes | $ | 200,000 | April 15, 2023 | 5.00% fixed | $ | 15.76 | 63.4700 | 12,694 | ||||||||||
3.875% Convertible senior notes | 402,500 | January 15, 2021 | 3.875% fixed | 16.57 | 60.3431 | 24,288 | ||||||||||||
5.375% Exchangeable senior notes | 13,605 | June 15, 2033 | 5.375% fixed | 12.04 | 83.0837 | 1,130 | ||||||||||||
Total convertible debt | $ | 616,105 | ||||||||||||||||
TruPS | ||||||||
Description | Outstanding principal | Final due date | Interest rate | |||||
Trust I | $ | 41,240 | March 30, 2035 | 3M L + 3.25% | ||||
Trust II | 25,780 | June 30, 2035 | 3M L + 3.25% | |||||
Trust III | 41,238 | January 30, 2036 | 3M L + 2.83% | |||||
Trust IV | 50,100 | June 30, 2036 | 3M L + 2.80% | |||||
Trust V | 30,100 | September 30, 2036 | 3M L + 2.70% | |||||
Trust VI | 25,100 | December 30, 2036 | 3M L + 2.90% | |||||
Trust VII | 31,459 | April 30, 2037 | 3M L + 2.50% | |||||
Trust VIII | 35,100 | July 30, 2037 | 3M L + 2.70% | |||||
Total TruPS | $ | 280,117 | ||||||
Perpetual preferred stock | |||||||||
Description | Liquidation preference | Shares outstanding (In thousands) | Callable period | ||||||
Series G 7.5% cumulative redeemable perpetual preferred stock | 86,250 | 3,450 | Callable | ||||||
Series H 7.125% cumulative redeemable perpetual preferred stock | 287,500 | 11,500 | On or after April 13, 2020 | ||||||
Series I 7.15% cumulative redeemable perpetual preferred stock | 345,000 | 13,800 | On or after June 5, 2022 | ||||||
Series J 7.125% cumulative redeemable perpetual preferred stock | 315,000 | 12,600 | On or after September 22, 2022 | ||||||
Total preferred stock | $ | 1,033,750 | 41,350 | ||||||
Notes:
(1) | Callable at principal amount only if CLNY common stock has traded at least 130% of the conversion price for 20 of 30 consecutive trading days: on or after April 22, 2020, for the 5.0% convertible senior notes; on or after January 22, 2019, for the 3.875% convertible senior notes; and on or after on or after June 15, 2020, for the 5.375% exchangeable senior notes. |
Colony Capital | Supplemental Financial Report | 25 | ||
IVe. Capitalization - Debt Maturity and Amortization Schedules |
($ in thousands; as of December 31, 2019) | Payments due by period(1) | |||||||||||||||||||||||
Consolidated debt | Fixed / Floating | 2020 | 2021 | 2022 | 2023 | 2024 and after | Total | |||||||||||||||||
$750,000 Revolving credit facility | Floating | $ | — | $ | — | $ | — | $ | — | $ | — | $ | — | |||||||||||
Convertible/exchangeable senior notes | Fixed | — | 402,500 | — | 200,000 | 13,605 | 616,105 | |||||||||||||||||
Corporate aircraft promissory note | Fixed | 2,243 | 2,359 | 2,480 | 2,608 | 25,382 | 35,072 | |||||||||||||||||
TruPS | Floating | — | — | — | — | 280,117 | 280,117 | |||||||||||||||||
Investment-level debt: | ||||||||||||||||||||||||
Healthcare | Fixed | 6,809 | 8,083 | 9,068 | 9,510 | 372,510 | 405,980 | |||||||||||||||||
Healthcare | Floating | 53,914 | 284,059 | 7,891 | 8,129 | 2,193,733 | 2,547,726 | |||||||||||||||||
Bulk Industrial | Floating | — | — | — | — | 235,000 | 235,000 | |||||||||||||||||
Hospitality | Fixed | — | 13,494 | — | — | — | 13,494 | |||||||||||||||||
Hospitality | Floating | — | 206,802 | 780,000 | — | 1,667,051 | 2,653,853 | |||||||||||||||||
Other Equity and Debt | Fixed | 13,435 | 35,025 | 19,572 | 80,389 | 3,356 | 151,777 | |||||||||||||||||
Other Equity and Debt | Floating | 316,940 | 199,546 | 992,504 | 33,879 | 925,849 | 2,468,718 | |||||||||||||||||
Total consolidated debt | $ | 393,341 | $ | 1,151,868 | $ | 1,811,515 | $ | 334,515 | $ | 5,716,603 | $ | 9,407,842 | ||||||||||||
Pro rata debt | Fixed / Floating | 2020 | 2021 | 2022 | 2023 | 2024 and after | Total | |||||||||||||||||
$750,000 Revolving credit facility | Floating | $ | — | $ | — | $ | — | $ | — | $ | — | $ | — | |||||||||||
Convertible/exchangeable senior notes | Fixed | — | 402,500 | — | 200,000 | 13,605 | 616,105 | |||||||||||||||||
Corporate aircraft promissory note | Fixed | 2,243 | 2,359 | 2,480 | 2,608 | 25,382 | 35,072 | |||||||||||||||||
TruPS | Floating | — | — | — | — | 280,117 | 280,117 | |||||||||||||||||
Investment-level debt: | ||||||||||||||||||||||||
Healthcare | Fixed | 4,781 | 5,675 | 6,366 | 6,677 | 261,540 | 285,039 | |||||||||||||||||
Healthcare | Floating | 38,264 | 227,548 | 5,601 | 5,774 | 1,542,495 | 1,819,682 | |||||||||||||||||
Bulk Industrial | Floating | — | — | — | — | 119,850 | 119,850 | |||||||||||||||||
Hospitality | Fixed | — | 13,156 | — | — | — | 13,156 | |||||||||||||||||
Hospitality | Floating | — | 201,632 | 702,000 | — | 1,579,164 | 2,482,796 | |||||||||||||||||
Other Equity and Debt | Fixed | 4,892 | 26,438 | 6,739 | 77,820 | 1,119 | 117,008 | |||||||||||||||||
Other Equity and Debt | Floating | 105,067 | 191,303 | 513,720 | 7,148 | 249,249 | 1,066,487 | |||||||||||||||||
Total pro rata debt | $ | 155,247 | $ | 1,070,611 | $ | 1,236,906 | $ | 300,027 | $ | 4,072,521 | $ | 6,835,312 | ||||||||||||
Notes:
(1) | Based on initial maturity dates or extended maturity dates to the extent criteria are met and the extension option is at the borrower’s discretion. |
Colony Capital | Supplemental Financial Report | 26 | ||
Va. Investment Management - Summary Metrics |
($ in thousands, except as noted; as of December 31, 2019) | ||||
Fee Revenue | CLNY OP Share | |||
Digital Bridge Holdings | $ | 18,347 | ||
Institutional funds | 13,983 | |||
Colony Credit Real Estate (NYSE:CLNC) | 8,273 | |||
Retail companies | 4,997 | |||
Non-wholly owned REIM platforms (equity method earnings) | 1,178 | |||
Total reported fee revenue and REIM platform equity method earnings | $ | 46,778 | ||
Operating Results | ||||
Revenues | ||||
Total fee revenue and REIM earnings of investments in unconsolidated ventures | $ | 46,778 | ||
Interest Income and Other Income | 7,257 | |||
Expenses | ||||
Interest expense | 1,645 | |||
Investment and servicing expense | 81 | |||
Transaction costs | 319 | |||
Placement fees | 1,429 | |||
Depreciation and amortization | 8,697 | |||
(Recovery of) impairment loss(1) | 410,954 | |||
Compensation expense | ||||
Cash and equity-based compensation | 20,382 | |||
Carried interest and incentive compensation | 3,300 | |||
Administrative expenses | 4,765 | |||
Total expenses | 451,572 | |||
Other gain (loss), net | 738 | |||
Equity method earnings | (1,936 | ) | ||
Equity method earnings—carried interest | 6,020 | |||
Income tax benefit (expense) | 3,241 | |||
Income (loss) from discontinued operations(2)(3) | (10,561 | ) | ||
Non-pro rata allocation of income (loss) to NCI(3) | 28,080 | |||
Net loss attributable to common interests in OP and common stockholders | (371,955 | ) | ||
Real estate depreciation and amortization | 1,729 | |||
(Gains) and losses from sales of businesses and impairment write-downs associated with the Investment Management segment | 409,426 | |||
Equity-based compensation expense | 2,666 | |||
Straight-line rent revenue and expense | 255 | |||
Amortization of deferred financing costs and debt premiums and discounts | 102 | |||
Unrealized fair value losses on interest rate and foreign currency hedges, and foreign currency remeasurements | (15 | ) | ||
Acquisition and merger-related transaction costs | 319 | |||
Restructuring and merger integration costs | 1,070 | |||
Amortization and impairment of investment management intangibles | 8,640 | |||
Non-real estate depreciation and amortization | 36 | |||
Tax effect of Core FFO adjustments, net | (3,333 | ) | ||
Core FFO | $ | 48,940 | ||
Colony Capital | Supplemental Financial Report | 27 | ||
Va. Investment Management - Summary Metrics |
Notes:
(1) | Represents a $401 million write-down of goodwill resulting from a reduction in value of the non-digital investment management business and a $10 million write-down of contract intangibles. Reduction of goodwill and contract intangibles are added back to the Company's net loss to calculate Core FFO. |
(2) | In December 2019, the Company completed the sale of its light industrial portfolio and related operating platform. Accordingly, for all current and prior periods presented, the related operating results are presented as income from discontinued operations on the consolidated statement of operations. |
(3) | Net loss and Core FFO included $17 million of realized incentive fees, which is net of related compensation expenses, from the sale of the light industrial portfolio and related operating platform. |
Colony Capital | Supplemental Financial Report | 28 | ||
Vb. Investment Management – Assets Under Management |
($ in millions, except as noted; as of December 31, 2019, unless otherwise noted) | |||||||||||||||
Segment | Products (FEEUM) | Description | AUM CLNY OP Share | FEEUM CLNY OP Share | Fee Rate | ||||||||||
Digital | • Digital ($6.8 billion) | • Leading global investment manager of digital infrastructure assets including cell towers, small cells, fiber and data centers • Manager of six portfolio companies through separate partnerships • Manager of Digital Colony Partners Fund | $ | 13,502 | $ | 6,788 | 1.0 | % | |||||||
Other Institutional Funds | • Credit ($2.5 billion) • Opportunistic ($0.5 billion) • Other co-investment vehicles ($2.7 billion) | • 27 years of institutional investment management experience • Sponsorship of private equity funds and vehicles earning asset management fees and performance fees • More than 300 investor relationships | 8,500 | 5,654 | .8 | % | |||||||||
Public Company | • Colony Credit Real Estate, Inc. ($2.2 billion) | • NYSE-listed credit focused REIT • Contract with base management fees with potential for incentive fees | 3,523 | 2,181 | 1.5 | % | |||||||||
Retail Companies | • NorthStar Healthcare ($1.2 billion)(1) • CC Real Estate Income Funds(2)(3) | • Manage public non-traded vehicles earning asset management and performance fees | 3,432 | 1,211 | (1) | 1.5 | % | ||||||||
Non-Wholly Owned REIM Platforms | • RXR Realty • Alpine Energy • American Healthcare Investors | • CLNY recognizes at-share earnings from underlying non-wholly owned REIM platforms • 27% investment in RXR Realty, a real estate owner, developer and investment management company with $21 billion of AUM(4) • Alpine Energy, the Company's upstream energy investment management platform, jointly owned in partnership with Equity Group Investments • 43% investment in American Healthcare Investors, a healthcare investment management firm and sponsor of non-traded vehicles with $3 billion of AUM | 7,329 | 3,606 | N/A | ||||||||||
Total | $ | 36,286 | $ | 19,440 | |||||||||||
Notes:
(1) | FEEUM of NorthStar Healthcare Income represents its most recently published Net Asset Value. |
(2) | CC Real Estate Income Funds represents a master/feeder structure and pools investor capital raised through three feeder funds. |
(3) | In February 2019, the board of directors of CC Real Estate Income Fund approved a plan to dissolve, liquidate and terminate CCREIF and distribute the net proceeds of such liquidation to its shareholders. There is no assurances to the timing or completion of the liquidation. |
(4) | Subsequent to the fourth quarter 2019, the Company completed the sale of its 27.2% ownership interest in RXR Realty. |
Colony Capital | Supplemental Financial Report | 29 | ||
VIa. Healthcare Real Estate - Summary Metrics and Operating Results |
($ in thousands; as of or for the three months ended December 31, 2019, unless otherwise noted) | Consolidated amount(1) | CLNY OP share of consolidated amount(1)(2) | ||||||
Net operating income | ||||||||
Net operating income: | ||||||||
Senior Housing - Operating | $ | 15,662 | $ | 11,120 | ||||
Medical Office Buildings | 13,853 | 9,836 | ||||||
Triple-Net Lease: | ||||||||
Senior Housing(3) | 16,087 | 11,422 | ||||||
Skilled Nursing Facilities | 24,411 | 17,332 | ||||||
Hospitals | 6,558 | 4,656 | ||||||
Total net operating income | $ | 76,571 | $ | 54,366 | ||||
Portfolio overview | Total number of properties | Capacity | % Occupied(4) | TTM Lease Coverage(5) | WA Remaining Lease Term | ||||||||
Senior Housing - Operating | 83 | 6,388 units | 86.5 | % | N/A | N/A | |||||||
Medical Office Buildings | 106 | 3.8 million sq. ft. | 82.2 | % | N/A | 4.8 | |||||||
Triple-Net Lease: | |||||||||||||
Senior Housing | 71 | 4,039 units | 80.7 | % | 1.3x | 11.5 | |||||||
Skilled Nursing Facilities | 89 | 10,601 beds | 82.7 | % | 1.2x | 5.8 | |||||||
Hospitals | 9 | 456 beds | 58.0 | % | 3.0x | 5.5 | |||||||
Total | 358 | ||||||||||||
Same store financial/operating results related to the segment | ||||||||||||||||||||||
% Occupied(4) | TTM Lease Coverage(5) | NOI(1) | ||||||||||||||||||||
Q4 2019 | Q3 2019 | 9/30/2019 | 6/30/2019 | Q4 2019 | Q3 2019 | % Change | ||||||||||||||||
Senior Housing - Operating | 86.5 | % | 86.2 | % | N/A | N/A | $ | 15,662 | $ | 15,611 | 0.3 | % | ||||||||||
Medical Office Buildings | 82.2 | % | 82.2 | % | N/A | N/A | 13,853 | 12,923 | 7.2 | % | ||||||||||||
Triple-Net Lease: | ||||||||||||||||||||||
Senior Housing | 79.7 | % | 79.8 | % | 1.3x | 1.3x | 15,765 | 13,833 | 14.0 | % | ||||||||||||
Skilled Nursing Facilities | 82.7 | % | 82.5 | % | 1.2x | 1.2x | 24,411 | 23,398 | 4.3 | % | ||||||||||||
Hospitals | 65.3 | % | 61.3 | % | 1.3x | 1.3x | 4,263 | 808 | 427.6 | % | ||||||||||||
Total | $ | 73,954 | $ | 66,573 | 11.1 | % | ||||||||||||||||
Notes:
(1) | Fourth quarter 2019 NOI included an aggregate $5.6 million consolidated, or $4.0 million CLNY OP share, of one-time recovery of tenant rent receivables from certain tenants in the Skilled Nursing Facilities, Triple-Net Lease Senior Housing Properties and Hospitals portfolios and termination fees in the Medical Office Buildings portfolio. Third quarter 2019 NOI included a $1.6 million consolidated, or $1.2 million CLNY OP share, one-time write-off of a certain tenant rent receivable in the Hospitals portfolio. Excluding these one-time items from same store NOI, the healthcare same store portfolio sequential quarter to quarter comparable NOI would have been flat. |
(2) | CLNY OP Share represents Consolidated NOI multiplied by CLNY OP's interest of 71% as of December 31, 2019. |
(3) | NOI includes $0.9 million consolidated or $0.7 million CLNY OP share of interest earned related to $43 million consolidated or $30 million CLNY OP share carrying value of healthcare real estate development loans. This interest income is in the Interest Income line item on the Company’s Statement of Operations for the three months ended December 31, 2019. For a reconciliation of net income/(loss) attributable to common stockholders to NOI, please refer to the appendix to this presentation. |
(4) | Occupancy % for Senior Housing - Operating represents average of the presented quarter, MOB’s is as of last day in the quarter and for Triple-Net Lease represents average of the prior quarter. Occupancy represents real estate property operator’s patient occupancy for all types except MOB. |
(5) | Represents the ratio of the tenant's/operator's EBITDAR to cash rent payable to the Company's Healthcare Real Estate segment on a trailing twelve month basis. Refer to Important Notes Regarding Non-GAAP Financial Measures and Definitions pages in this presentation for additional information regarding the use of tenant/operator EBITDAR. |
Colony Capital | Supplemental Financial Report | 30 | ||
VIb. Healthcare Real Estate - Portfolio Overview |
(As of or for the three months ended December 31, 2019, unless otherwise noted) | |||||||||||||||
Triple-Net Lease Coverage(1) | % of Triple-Net Lease TTM NOI as of September 30, 2019 | ||||||||||||||
September 30, 2019 TTM Lease Coverage | # of Leases | Senior Housing | Skilled Nursing Facilities & Hospitals | % Triple-Net Lease NOI | WA Remaining Lease Term | ||||||||||
Less than 0.99x | 6 | 11 | % | 16 | % | 27 | % | 7 yrs | |||||||
1.00x - 1.09x | 3 | — | % | 9 | % | 9 | % | 7 yrs | |||||||
1.10x - 1.19x | — | — | % | — | % | — | % | — | |||||||
1.20x - 1.29x | 1 | — | % | 11 | % | 11 | % | 8 yrs | |||||||
1.30x - 1.39x | 2 | — | % | 7 | % | 7 | % | 4 yrs | |||||||
1.40x - 1.49x | 1 | 20 | % | — | % | 20 | % | 15 yrs | |||||||
1.50x and greater | 4 | 2 | % | 24 | % | 26 | % | 4 yrs | |||||||
Total / W.A. | 17 | 33 | % | 67 | % | 100 | % | 8 yrs | |||||||
Revenue Mix(2) | September 30, 2019 TTM | ||||||||
Private Pay | Medicare | Medicaid | |||||||
Senior Housing - Operating | 86 | % | 3 | % | 11 | % | |||
Medical Office Buildings | 100 | % | — | % | — | % | |||
Triple-Net Lease: | |||||||||
Senior Housing | 64 | % | — | % | 36 | % | |||
Skilled Nursing Facilities | 26 | % | 24 | % | 50 | % | |||
Hospitals | 15 | % | 40 | % | 45 | % | |||
W.A. | 59 | % | 12 | % | 29 | % | |||
Notes:
(1) | Represents the ratio of the tenant's/operator's EBITDAR to cash rent payable to the Company's Healthcare Real Estate segment on a trailing twelve month basis. Refer to Important Notes Regarding Non-GAAP Financial Measures and Definitions pages in this presentation for additional information regarding the use of tenant/operator EBITDAR. Represents leases with EBITDAR coverage in each listed range. Excludes interest income associated with triple-net lease senior housing and hospital types. Caring Homes (U.K.) lease (EBITDAR) coverage includes additional collateral provided by the operator. |
(2) | Revenue mix represents percentage of revenues derived from private, Medicare and Medicaid payor sources. The payor source percentages for the hospital category excludes two operating partners, who do not track or report payor source data and totals approximately one-third of NOI in the hospital category. Overall percentages are weighted by NOI exposure in each category. |
Colony Capital | Supplemental Financial Report | 31 | ||
VIb. Healthcare Real Estate - Portfolio Overview (cont’d) |
($ in thousands; as of or for the three months ended December 31, 2019, unless otherwise noted) | |||||||
Top 10 Geographic Locations by NOI | |||||||
Number of properties | NOI | ||||||
United Kingdom | 46 | $ | 10,326 | ||||
Indiana | 55 | 7,613 | |||||
Illinois | 35 | 6,703 | |||||
Florida | 25 | 5,941 | |||||
Oregon | 31 | 5,704 | |||||
Pennsylvania | 8 | 4,907 | |||||
Texas | 29 | 4,830 | |||||
Georgia | 21 | 4,750 | |||||
Ohio | 14 | 4,519 | |||||
California | 12 | 3,613 | |||||
Total | 276 | $ | 58,906 | ||||
Top 10 Operators/Tenants by NOI | ||||||||||||||||
Property Type/Primary Segment | Number of properties | NOI | % Occupied | TTM Lease Coverage | WA Remaining Lease Term | |||||||||||
Senior Lifestyle | Sr. Housing / RIDEA | 60 | $ | 12,773 | 87.1 | % | N/A | N/A | ||||||||
Caring Homes (U.K.)(1) | Sr. Housing / NNN | 46 | 10,326 | 85.2 | % | 1.5x | 15 yrs | |||||||||
Sentosa | SNF / NNN | 8 | 4,907 | 84.0 | % | 1.3x | 8 yrs | |||||||||
Millers | SNF / NNN | 28 | 3,990 | 69.9 | % | 1.6x | N/A | |||||||||
Wellington Healthcare | SNF / NNN | 10 | 3,839 | 91.0 | % | 1.0x | 7 yrs | |||||||||
Frontier | Sr. Housing / RIDEA / NNN | 20 | 3,373 | 83.9 | % | N/A | N/A | |||||||||
Landmark | Hospital | 5 | 3,015 | 65.0 | % | 0.8x | 14 yrs | |||||||||
Regency | SNF / NNN | 14 | 2,909 | 75.7 | % | 0.8x | 10 yrs | |||||||||
Opis | SNF / NNN | 11 | 2,879 | 91.5 | % | 1.3x | 4 yrs | |||||||||
Consulate | SNF / NNN | 10 | 2,393 | 87.6 | % | 1.1x | 8 yrs | |||||||||
Total | 212 | $ | 50,404 | |||||||||||||
Notes:
(1) | Caring Homes (U.K.) lease (EBITDAR) coverage includes additional collateral provided by the operator. |
Colony Capital | Supplemental Financial Report | 32 | ||
VIIa. Hospitality Real Estate - Summary Metrics and Operating Results |
($ in thousands; as of or for the three months ended December 31, 2019, unless otherwise noted) | CLNY OP share of consolidated amount(1) | |||||||
NOI before FF&E Reserve | Consolidated amount | |||||||
NOI before FF&E Reserve: | ||||||||
Select Service | $ | 28,440 | $ | 26,705 | ||||
Extended Stay | 23,554 | 22,117 | ||||||
Full Service | 2,135 | 2,005 | ||||||
Total NOI before FF&E Reserve(2) | $ | 54,129 | $ | 50,827 | ||||
Portfolio overview by type | ||||||||||||||||||||||||
Number of hotels | Number of rooms | Avg. qtr. % occupancy | Avg. daily rate (ADR) | RevPAR | NOI before FF&E Reserve | NOI before FF&E Reserve margin | ||||||||||||||||||
Select service | 87 | 11,737 | 68.4 | % | $ | 121 | $ | 83 | $ | 28,440 | 28.2 | % | ||||||||||||
Extended stay | 66 | 7,936 | 74.6 | % | 128 | 95 | 23,554 | 32.5 | % | |||||||||||||||
Full service | 4 | 966 | 66.7 | % | 143 | 96 | 2,135 | 16.2 | % | |||||||||||||||
Total / W.A. | 157 | 20,639 | 70.7 | % | $ | 125 | $ | 88 | $ | 54,129 | 29.0 | % | ||||||||||||
Same store financial/operating results related to the segment by brand | ||||||||||||||||||||||||||||||||||
Avg. qtr. % occupancy | Avg. daily rate (ADR) | RevPAR | NOI before FF&E Reserve | |||||||||||||||||||||||||||||||
Brand | Q4 2019 | Q4 2018 | Q4 2019 | Q4 2018 | Q4 2019 | Q4 2018 | Q4 2019(3) | Q4 2018(3) | % Change | |||||||||||||||||||||||||
Marriott | 69.4 | % | 70.6 | % | $ | 124 | $ | 127 | $ | 86 | $ | 89 | $ | 41,179 | $ | 47,347 | (13.0 | )% | ||||||||||||||||
Hilton | 75.1 | % | 75.8 | % | 125 | 127 | 94 | 96 | 9,607 | 9,546 | 0.6 | % | ||||||||||||||||||||||
Other | 77.5 | % | 77.9 | % | 128 | 134 | 100 | 105 | 2,956 | 3,118 | (5.2 | )% | ||||||||||||||||||||||
Total / W.A. | 70.8 | % | 71.9 | % | $ | 125 | $ | 127 | $ | 88 | $ | 91 | $ | 53,742 | $ | 60,011 | (10.4 | )% | ||||||||||||||||
Notes:
(1) | CLNY OP Share represents Consolidated NOI before FF&E Reserve multiplied by CLNY OP's interest of 94% as of December 31, 2019. |
(2) | Q4 2019 FF&E reserve was $8.1 million consolidated or $7.6 million CLNY OP share. For a reconciliation of net income/(loss) attributable to common stockholders to NOI please refer to the appendix to this presentation. |
(3) | Excluding the impact of an aggregate $1.9 million of one-time events in the fourth quarter of 2018 and room revenue displacement in the fourth quarter of 2019, fourth quarter 2019 NOI before FFE Reserve decreased (7.6)% compared to the same period last year. |
Colony Capital | Supplemental Financial Report | 33 | ||
VIIb. Hospitality Real Estate - Portfolio Overview |
($ in thousands; as of December 31, 2019, unless otherwise noted) | |||||||||||||||||||
Top 10 Geographic Locations by NOI before FF&E Reserve | Number of hotels | Number of rooms | Number of rooms-select service | Number of rooms-extended stay | Number of rooms-full service | NOI before FF&E Reserve | |||||||||||||
California | 18 | 2,254 | 1,243 | 1,011 | — | $ | 9,580 | ||||||||||||
Texas | 26 | 2,939 | 1,661 | 1,278 | — | 6,047 | |||||||||||||
Florida | 12 | 2,066 | 1,187 | 291 | 588 | 5,365 | |||||||||||||
New Jersey | 12 | 1,884 | 718 | 942 | 224 | 4,731 | |||||||||||||
New York | 8 | 1,010 | 710 | 300 | — | 2,713 | |||||||||||||
New Hampshire | 6 | 662 | 339 | 323 | — | 2,542 | |||||||||||||
Virginia | 9 | 1,183 | 920 | 263 | — | 2,526 | |||||||||||||
North Carolina | 7 | 981 | 831 | 150 | — | 2,407 | |||||||||||||
Michigan | 6 | 809 | 601 | 208 | — | 2,293 | |||||||||||||
Washington | 5 | 664 | 160 | 504 | — | 2,005 | |||||||||||||
Total / W.A. | 109 | 14,452 | 8,370 | 5,270 | 812 | $ | 40,209 | ||||||||||||
Colony Capital | Supplemental Financial Report | 34 | ||
VIIIa. CLNC |
($ in thousands, except as noted and per share data; as of December 31, 2019, unless otherwise noted) | Consolidated amount | CLNY OP share of consolidated amount | ||||||
Colony Credit Real Estate, Inc. (NYSE: CLNC) | ||||||||
CLNY OP interest in CLNC as of February 25, 2020 | 36.4 | % | 36.4 | % | ||||
CLNC shares beneficially owned by OP and common stockholders | 48.0 million | 48.0 million | ||||||
CLNC share price as of February 25, 2020 | $ | 13.05 | $ | 13.05 | ||||
Total market value of CLNC shares | $ | 625,565 | $ | 625,565 | ||||
Net carrying value - CLNC | $ | 725,443 | $ | 725,443 | ||||
Colony Capital | Supplemental Financial Report | 35 | ||
IX. Other Equity and Debt Summary |
($ in thousands; as of December 31, 2019) | Consolidated amount | CLNY OP share of consolidated amount | |||||||||||||
Assets | Equity | Assets | Equity | ||||||||||||
Strategic(1) | |||||||||||||||
Digital - Direct Investments and Digital Colony Partners GP Co-investments | 1,493,909 | 954,754 | 342,879 | 232,891 | |||||||||||
GP Co-investments in CDCF IV and CDCF V Investments | 2,129,602 | 1,617,815 | 408,520 | 280,848 | |||||||||||
Other GP Co-investments | 710,675 | 365,664 | 701,040 | 356,029 | |||||||||||
Strategic Subtotal | 4,334,186 | 2,938,233 | 1,452,439 | 869,768 | |||||||||||
Non-Strategic(1) | |||||||||||||||
Other real estate equity | 2,181,379 | 943,982 | 1,165,315 | 551,016 | |||||||||||
Net lease real estate equity | 188,060 | 83,999 | 187,015 | 83,574 | |||||||||||
Real estate debt | 357,015 | 357,015 | 246,503 | 246,503 | |||||||||||
CRE securities and real estate PE fund investments | 60,251 | 60,251 | 60,251 | 60,251 | |||||||||||
Non-Strategic Subtotal | 2,786,705 | 1,445,247 | 1,659,084 | 941,344 | |||||||||||
Other Equity and Debt Total | $ | 7,120,891 | $ | 4,383,480 | $ | 3,111,523 | $ | 1,811,112 | |||||||
Notes:
(1) | For consolidated real estate equity assets, amounts include all components related to real estate assets, including tangible real estate and lease-related intangibles, and excludes accumulated depreciation, and for all other assets, amounts represent carrying value of investments. |
Colony Capital | Supplemental Financial Report | 36 | ||
IXa. Other Equity and Debt - Strategic Investments |
($ in thousands, except as noted and per share data; as of December 31, 2019, unless otherwise noted) | Consolidated amount | CLNY OP share of consolidated amount | ||||||
Digital - Direct Investments and Digital Colony Partners GP Co-investments(1) | ||||||||
Assets - carrying value | $ | 1,493,909 | $ | 342,879 | ||||
Debt - UPB | 539,155 | 109,988 | ||||||
Net carrying value | $ | 954,754 | $ | 232,891 | ||||
CLNY's GP Co-investments in CDCF IV and CDCF V Investments | ||||||||
Assets - carrying value(2) | $ | 2,129,602 | $ | 408,520 | ||||
Debt - UPB | 511,787 | 127,672 | ||||||
Net carrying value | $ | 1,617,815 | $ | 280,848 | ||||
NBV by Geography: | ||||||||
U.S. | 28.5 | % | 19.7 | % | ||||
Europe | 71.5 | % | 80.3 | % | ||||
Total | 100.0 | % | 100.0 | % | ||||
Other GP Co-investments(3) | ||||||||
Assets - carrying value(4)(5) | $ | 710,675 | $ | 701,040 | ||||
Debt - UPB(5) | 345,011 | 345,011 | ||||||
Net carrying value | $ | 365,664 | $ | 356,029 | ||||
Notes:
(1) | In December 2019, the Company made its inaugural direct balance sheet investment in digital real estate by acquiring a 20.4% interest in DataBank. |
(2) | $821 million consolidated or $127 million CLNY OP share of assets are classified as Loans Receivable on the Company's balance sheet. |
(3) | Other GP co-investments represents: i) seed investments in certain registered investment companies sponsored by the Company, ii) investments in the general partnership of third party real estate operators primarily to seed investment commitments with their limited partners for which the Company will receive its share of earnings and incentive fees, or iii) general partnership capital in a fund or investment. |
(4) | $358 million consolidated and CLNY OP share of assets are classified as Loans Receivable on the Company's balance sheet. |
(5) | Debt includes $117 million of derivative liability with a corresponding derivative asset in Other GP Co-investments Assets above. |
Colony Capital | Supplemental Financial Report | 37 | ||
IXb. Other Equity and Debt - Net Lease and Other Real Estate Equity |
($ in thousands; as of December 31, 2019, unless otherwise noted) | ||||||||||||||||||||
Net Lease Real Estate Equity | Number of buildings | Rentable square feet (thousands) | Consolidated amount | CLNY OP share of consolidated amount | % leased at end of period | Weighted average remaining lease term | ||||||||||||||
NOI | NOI | |||||||||||||||||||
U.S. office | 3 | 674 | $ | 771 | $ | 770 | 85.7 | % | 4.9 | |||||||||||
Total / W.A. | 3 | 674 | $ | 771 | $ | 770 | 85.7 | % | 4.9 | |||||||||||
Other Real Estate Equity | Number of buildings | Rentable square feet (thousands) | Consolidated amount | CLNY OP share of consolidated amount | % leased at end of period | Weighted average remaining lease term | ||||||||||||||
Undepreciated carrying value | Undepreciated carrying value | |||||||||||||||||||
U.S.: | ||||||||||||||||||||
Office | 2 | 230 | $ | 40,378 | $ | 40,170 | 81.2 | % | 2.8 | |||||||||||
Hotel(1) | 89 | N/A | 1,224,899 | 675,164 | 66.5 | % | N/A | |||||||||||||
Europe: | ||||||||||||||||||||
Office | 14 | 472 | 70,551 | 35,276 | 74.9 | % | 14.6 | |||||||||||||
Mixed / Retail | 104 | 3,205 | 528,541 | 177,295 | 50.4 | % | 4.8 | |||||||||||||
Total / W.A. | 209 | 3,907 | $ | 1,864,369 | $ | 927,905 | 55.2 | % | 5.9 | |||||||||||
Unconsolidated joint ventures (Other RE Equity) | ||||||||||||||||||||
Preferred equity: | ||||||||||||||||||||
Multifamily | $ | 128,285 | $ | 128,285 | ||||||||||||||||
Equity & Other: | ||||||||||||||||||||
Albertsons | 89,129 | 44,565 | ||||||||||||||||||
Residential Land | 70,854 | 35,818 | ||||||||||||||||||
Other | 28,742 | 28,742 | ||||||||||||||||||
Total | $ | 317,010 | $ | 237,410 | ||||||||||||||||
Notes:
(1) | Includes $24 million consolidated or $13 million CLNY OP share of restricted cash. |
Colony Capital | Supplemental Financial Report | 38 | ||
IXc. Other Equity and Debt - Real Estate Debt |
($ in thousands, except as noted; as of December 31, 2019, unless otherwise noted) | ||||||||
Portfolio Overview(1)(2) | ||||||||
Consolidated amount | CLNY OP share of consolidated amount | |||||||
Non-PCI loans | ||||||||
Carrying value - consolidated | $ | 300,825 | $ | 214,573 | ||||
Carrying value - equity method investments | 11,160 | 6,089 | ||||||
. | ||||||||
Other | ||||||||
Carrying value - real estate assets (REO) | 45,030 | 25,841 | ||||||
Total Portfolio | ||||||||
Carrying value - consolidated | 300,825 | 214,573 | ||||||
Carrying value - equity method investments | 11,160 | 6,089 | ||||||
Carrying value - real estate assets (REO) | 45,030 | 25,841 | ||||||
Non-recourse investment-level financing (UPB) | — | — | ||||||
Notes:
(1) | Excludes $43 million consolidated or $30 million CLNY OP share carrying value of healthcare real estate development loans. These loans are included in the Company's healthcare real estate segment. |
(2) | Strategic loans that are classified as Loans Receivable on the Company's balance sheet are categorized within GP co-investments in this supplemental financial presentation. |
Colony Capital | Supplemental Financial Report | 39 | ||
IXc. Other Equity and Debt - Real Estate Debt (cont’d) |
($ in thousands; as of or for the three months ended December 31, 2019, unless otherwise noted) | ||||||||||||||
Non-strategic real estate debt by loan type(1)(2) | ||||||||||||||
Consolidated amount | CLNY OP share of consolidated amount | |||||||||||||
Net carrying amount | Net carrying amount | Weighted average yield | Weighted average maturity in years | |||||||||||
Non-PCI loans | ||||||||||||||
Fixed rate | ||||||||||||||
First mortgage loans | $ | 33,988 | $ | 16,994 | — | % | 0.4 | |||||||
Second mortgage loans / B-notes | 181,172 | 101,387 | 9.3 | % | 1.5 | |||||||||
Mezzanine loans | 64,134 | 61,387 | — | % | 1.6 | |||||||||
Corporate | 27,287 | 27,287 | 8.2 | % | 7.0 | |||||||||
Total fixed rate non-PCI loans | 306,581 | 207,055 | 5.6 | % | 2.1 | |||||||||
Variable rate | ||||||||||||||
First mortgage loans | 42,394 | 42,394 | 8.2 | % | 0.9 | |||||||||
Total variable rate non-PCI loans | 42,394 | 42,394 | 8.9 | % | 1.2 | |||||||||
Total non-PCI loans | 348,975 | 249,449 | ||||||||||||
Allowance for loan losses | (48,150 | ) | (34,876 | ) | ||||||||||
Total non-PCI loans, net of allowance for loan losses | 300,825 | 214,573 | ||||||||||||
Total loans receivable, net of allowance for loan losses | $ | 300,825 | $ | 214,573 | ||||||||||
Notes:
(1) | Excludes $43 million consolidated or $30 million CLNY OP share carrying value of healthcare real estate development loans. These loans are included in the Company's healthcare real estate segment. |
(2) | Strategic loans that are classified as Loans Receivable on the Company's balance sheet are categorized within GP co-investments in this supplemental financial presentation. |
Colony Capital | Supplemental Financial Report | 40 | ||
IXc. Other Equity and Debt - Real Estate Debt (cont’d) |
($ in thousands; as of or for the three months ended December 31, 2019, unless otherwise noted) | ||||||||||||||
Non-strategic real estate debt by collateral type(1)(2) | ||||||||||||||
Consolidated amount | CLNY OP share of consolidated amount | |||||||||||||
Net carrying amount | Net carrying amount | Weighted average yield | Weighted average maturity in years | |||||||||||
Non-PCI Loans | ||||||||||||||
Retail | $ | 106,528 | $ | 103,781 | 3.4 | % | 1.3 | |||||||
Office | 143,406 | 71,703 | 13.1 | % | 2.1 | |||||||||
Land | 23,604 | 11,802 | — | % | 0.4 | |||||||||
Corporate | 27,287 | 27,287 | 8.2 | % | 7.0 | |||||||||
Total non-PCI loans, net of allowance for loan losses | 300,825 | 214,573 | 7.1 | % | 2.2 | |||||||||
Total loans receivable, net of allowance for loan losses | $ | 300,825 | $ | 214,573 | ||||||||||
Notes:
(1) | Excludes $43 million consolidated or $30 million CLNY OP share carrying value of healthcare real estate development loans. These loans are included in the Company's healthcare real estate segment. |
(2) | Strategic loans that are classified as Loans Receivable on the Company's balance sheet are categorized within GP co-investments in this supplemental financial presentation. |
Colony Capital | Supplemental Financial Report | 41 | ||
IXd. Other Equity and Debt - CRE Securities and Real Estate PE Fund Interests |
($ in thousands; as of December 31, 2019) | |||||
Portfolio Overview | Carrying Value | ||||
Deconsolidated CDO bonds | $ | 54,860 | |||
Real estate PE fund interests | 5,391 | ||||
Colony Capital | Supplemental Financial Report | 42 | ||
APPENDICES
Colony Capital | Supplemental Financial Report | 43 | ||
Xa. Appendices - Definitions |
Assets Under Management (“AUM”)
Assets for which the Company and its affiliates provide investment management services, including assets for which the Company may or may not charge management fees and/or performance allocations. AUM is based on reported gross undepreciated carrying value of managed investments as reported by each underlying vehicle at December 31, 2019. AUM further includes a) uncalled capital commitments and b) includes the Company’s pro-rata share of each affiliate non wholly-owned real estate investment management platform’s assets as presented and calculated by the affiliate. Affiliates include Alpine Energy LLC, RXR Realty LLC and American Healthcare Investors. The Company's calculations of AUM may differ materially from the calculations of other asset managers, and as a result, this measure may not be comparable to similar measures presented by other asset managers.
CLNY Operating Partnership (“CLNY OP”)
The operating partnership through which the Company conducts all of its activities and holds substantially all of its assets and liabilities. CLNY OP share excludes noncontrolling interests in investment entities.
Fee-Earning Equity Under Management (“FEEUM”)
Equity for which the Company and its affiliates provides investment management services and derives management fees and/or performance allocations. FEEUM generally represents a) the basis used to derive fees, which may be based on invested equity, stockholders’ equity, or fair value pursuant to the terms of each underlying investment management agreement and b) the Company’s pro-rata share of fee bearing equity of each affiliate as presented and calculated by the affiliate. Affiliates include Alpine Energy LLC, RXR Realty LLC and American Healthcare Investors. The Company's calculations of FEEUM may differ materially from the calculations of other asset managers, and as a result, this measure may not be comparable to similar measures presented by other asset managers.
Healthcare same store portfolio: defined as properties in operation throughout the full periods presented under the comparison and included 358 properties in the comparisons. Properties acquired or disposed during these periods are excluded for the same store portfolio.
Hospitality same store portfolio: defined as hotels in operation throughout the full periods presented under the comparison and included 157 hotels.
NOI: Net Operating Income. NOI for the Company's real estate segments represents total property and related income less property operating expenses, adjusted for the effects of (i) straight-line rental income adjustments; (ii) amortization of acquired above- and below-market lease adjustments to rental income; and (iii) other items such as adjustments for the Company’s share of NOI of unconsolidated ventures.
NOI before FF&E Reserve: For our hospitality real estate segment, NOI before FF&E Reserve represents NOI before the deduction of reserve contributions for the repair, replacement and refurbishment of furniture, fixtures, and equipment ("FF&E"), which are typically 4% to 5% of revenues, and required under certain debt agreements and/or franchise and brand-managed hotel agreements.
Colony Capital | Supplemental Financial Report | 44 | ||
Xa. Appendices - Definitions |
Earnings Before Interest, Tax, Depreciation, Amortization and Rent (“EBITDAR”)
Represents earnings before interest, taxes, depreciation, amortization and rent for facilities accruing to the tenant/operator of the property (not the Company) for the period presented. The Company uses EBITDAR in determining TTM Lease Coverage for triple-net lease properties in its Healthcare Real Estate segment. EBITDAR has limitations as an analytical tool. EBITDAR does not reflect historical cash expenditures or future cash requirements for facility capital expenditures or contractual commitments. In addition, EBITDAR does not represent a property's net income or cash flow from operations and should not be considered an alternative to those indicators. The Company utilizes EBITDAR as a supplemental measure of the ability of the Company's operators/tenants to generate sufficient liquidity to meet related obligations to the Company.
TTM Lease Coverage
Represents the ratio of EBITDAR to recognized cash rent for owned facilities on a trailing twelve month basis. TTM Lease Coverage is a supplemental measure of a tenant’s/operator’s ability to meet their cash rent obligations to the Company. However, its usefulness is limited by, among other things, the same factors that limit the usefulness of EBITDAR.
ADR: Average Daily Rate
RevPAR: Revenue per Available Room
UPB: Unpaid Principal Balance
PCI: Purchased Credit-Impaired
REIM: Real Estate Investment Management
Colony Capital | Supplemental Financial Report | 45 | ||
Xb. Appendices - Reconciliation of Net Income (Loss) to NOI |
($ in thousands; for the three months ended December 31, 2019) | ||||||||||||||||
NOI Determined as Follows | Healthcare | Industrial | Hospitality | Other Equity and Debt—Net Lease Properties | ||||||||||||
Total revenues | $ | 154,378 | $ | 77,611 | $ | 186,450 | $ | 2,854 | ||||||||
Straight-line rent revenue and amortization of above- and below-market lease intangibles | (11,370 | ) | (3,196 | ) | 313 | (885 | ) | |||||||||
Interest income | (31 | ) | (486 | ) | 6 | — | ||||||||||
Other income | (300 | ) | — | 70 | — | |||||||||||
Property operating expenses(1) | (66,106 | ) | (19,382 | ) | (132,710 | ) | (1,198 | ) | ||||||||
Compensation and administrative expense(1) | — | (1,386 | ) | — | — | |||||||||||
NOI(2) | $ | 76,571 | $ | 53,161 | $ | 54,129 | $ | 771 | ||||||||
Reconciliation of Net Income (Loss) from Continuing Operations to NOI | ||||||||||||||||
Healthcare | Industrial | Hospitality | ||||||||||||||
Income (loss) | $ | (38,608 | ) | $ | 1,426,219 | $ | (43,119 | ) | ||||||||
Adjustments: | ||||||||||||||||
Straight-line rent revenue and amortization of above- and below-market lease intangibles | (11,370 | ) | (3,196 | ) | 313 | |||||||||||
Interest income | (31 | ) | (486 | ) | 6 | |||||||||||
Interest expense | 41,930 | 36,381 | 45,484 | |||||||||||||
Transaction, investment and servicing costs | 3,137 | 66 | 1,787 | |||||||||||||
Depreciation and amortization | 41,208 | 9,323 | 36,035 | |||||||||||||
Impairment loss | 43,132 | — | 14,649 | |||||||||||||
Compensation and administrative expense | 2,482 | 20,265 | 2,096 | |||||||||||||
Gain on sale of real estate | (551 | ) | (1,429,822 | ) | — | |||||||||||
Other (gain) loss, net | (5,690 | ) | (1,407 | ) | (1,492 | ) | ||||||||||
Other income | (300 | ) | — | 70 | ||||||||||||
Income tax (benefit) expense | 1,232 | (4,182 | ) | (1,700 | ) | |||||||||||
NOI(2) | $ | 76,571 | $ | 53,161 | $ | 54,129 | ||||||||||
Notes:
(1) | For healthcare and hospitality, property operating expenses includes property management fees paid to third parties. For industrial, there are direct costs of managing the portfolio which are included in compensation expense. |
(2) | For hospitality, NOI is before FF&E Reserve. |
Colony Capital | Supplemental Financial Report | 46 | ||
Xb. Appendices - Reconciliation of Net Income (Loss) to NOI (cont’d) |
($ in thousands; for the three months ended December 31, 2019) | ||||
Reconciliation of Net Income from Continuing Operations of Other Equity and Debt Segment to NOI of Net Lease Real Estate Equity | ||||
Other Equity and Debt | ||||
Income from continuing operations | $ | 27,185 | ||
Adjustments: | ||||
Property operating income of other real estate equity | (104,191 | ) | ||
Straight-line rent revenue and amortization of above- and below-market lease intangibles for net lease real estate equity | (885 | ) | ||
Interest income | (43,324 | ) | ||
Fee and other income | (4,329 | ) | ||
Property operating expense of other real estate equity | 66,561 | |||
Interest expense | 26,537 | |||
Transaction, investment and servicing costs | 20,333 | |||
Depreciation and amortization | 22,612 | |||
Provision for loan loss | 33 | |||
Impairment loss | 2,492 | |||
Compensation and administrative expense | 11,787 | |||
Gain on sale of real estate assets | (18,611 | ) | ||
Other loss, net | 16,489 | |||
Earnings of investments in unconsolidated ventures | (25,613 | ) | ||
Income tax expense | 3,695 | |||
NOI of net lease real estate equity | $ | 771 | ||
Colony Capital | Supplemental Financial Report | 47 | ||
Xc. Appendices - Industrial Real Estate Segment Discontinued Operations |
($ in thousands) (unaudited) | Three Months Ended December 31, 2019 | |||
Revenues | ||||
Property operating income | $ | 76,270 | ||
Interest income | 486 | |||
Other income | 855 | |||
Total revenues | 77,611 | |||
Expenses | ||||
Property operating expense | 19,382 | |||
Interest expense | 36,381 | |||
Investment and servicing expense | 64 | |||
Transaction costs | 2 | |||
Depreciation and amortization | 9,323 | |||
Compensation expense | ||||
Cash and equity-based compensation | 19,538 | |||
Administrative expenses | 2,113 | |||
Total expenses | 86,803 | |||
Other income (loss) | ||||
Gain on sale of real estate assets | 1,429,822 | |||
Other gain (loss), net | 1,407 | |||
Income (loss) before income taxes | 1,422,037 | |||
Income tax benefit (expense) | 4,182 | |||
Net income (loss) | 1,426,219 | |||
Net income (loss) attributable to noncontrolling interests: | ||||
Investment entities | 943,647 | |||
Operating Company | 47,078 | |||
Net income (loss) attributable to Colony Capital, Inc. | 435,494 | |||
Net income (loss) attributable to common stockholders | $ | 435,494 | ||
Colony Capital | Supplemental Financial Report | 48 | ||