
DDD 8-K
3D Systems Corp (DDD)
8-K
2022-05-10
For: 2022-05-09
View Original
Added on
April 09, 2026
UNITED STATES
SECURITIES AND EXCHANGE COMMISSION
Washington, D.C. 20549
FORM 8-K
CURRENT REPORT
PURSUANT TO SECTION 13 OR 15(d)
OF THE SECURITIES ACT OF 1934
Date of Report (Date of earliest event reported): May 9, 2022
(Exact name of registrant as specified in its charter)
(State or other jurisdiction of incorporation or organization) | (Commission File Number) | (I.R.S. Employer Identification No.) | ||||||||||||
(Address of Principal Executive Offices) | (Zip Code) | |||||||||||||
Registrant's telephone number, including area code: (803 ) 326-3900
N/A
(Former name or former address, if changed since last report.)
Check the appropriate box below if the Form 8-K filing is intended to simultaneously satisfy the filing obligation of the registrant under any of the following provisions (see General Instruction A.2. below):
Securities registered pursuant to Section 12(b) of the Act:
| Title of each class | Trading Symbol(s) | Name of each exchange on which registered | ||||||
Indicate by check mark whether the registrant is an emerging growth company as defined in Rule 405 of the Securities Act of 1933 (§230.405 of this chapter) or Rule 12b-2 of the Securities Exchange Act of 1934 (§240.12b-2 of this chapter).
Emerging growth company ☐
If an emerging growth company, indicate by check mark if the registrant has elected not to use the extended transition period for complying with any new or revised financial accounting standards provided pursuant to Section 13(a) of the Exchange Act.
o
Item 2.02. Results of Operations and Financial Condition.
On May 9, 2022, 3D Systems Corporation (the “Company”) issued a press release announcing the Company's results of operations for the first quarter ended March 31, 2022 (the “Press Release”). A copy of the Press Release is furnished herewith as Exhibit 99.1 and is incorporated into this Item 2.02 by reference. The information in this Item 2.02 (and in the Press Release) shall not be deemed “filed” with the SEC for purposes of the Securities Exchange Act of 1934, as amended (the “Exchange Act”), nor incorporated by reference in any registration statement filed by the Company under the Securities Act of 1933, as amended (the “Securities Act”).
Item 7.01. Regulation FD Disclosure.
Included in the Press Release is an announcement that the Company plans to hold a conference call and webcast at 8:30 a.m., Eastern Time, on Tuesday, May 10, 2022, to discuss its first quarter March 31, 2022 financial results and other matters relating to the Company’s plans and operations. A copy of the Press Release, which contains additional information regarding how to access the conference call and webcast and how to listen to a recorded playback of the call after it is completed, is furnished herewith as Exhibit 99.1 and incorporated by reference herein. The slides to be presented on the webcast are furnished herewith as Exhibit 99.2 and incorporated into this Item 7.01 by reference.
The information in this Item 7.01 (and in the Press Release) shall not be deemed “filed” with the SEC for purposes of the Exchange Act, nor incorporated by reference in any registration statement filed by the Company under the Securities Act.
Item 9.01. Financial Statements and Exhibits.
(d) Exhibits.
Press Release issued by 3D Systems Corporation, dated May 9, 2022 | ||||||||
Investor information to be presented by 3D Systems Corporation on May 10, 2022 | ||||||||
| 104 | Cover Page Interactive Data File (embedded within Inline XBRL document). | |||||||
SIGNATURES
Pursuant to the requirements of the Securities Exchange Act of 1934, the registrant has duly caused this report to be signed on its behalf by the undersigned hereunto duly authorized.
| 3D SYSTEMS CORPORATION | ||||||||
Date: May 10, 2022 | /s/ Andrew M. Johnson | |||||||
| (Signature) | ||||||||
| Name: Andrew M. Johnson | ||||||||
Title: Executive Vice President, Chief Legal Officer and Secretary | ||||||||
EXHIBIT 99.1
3D Systems Reports
First Quarter 2022 Financial Results
ROCK HILL, South Carolina - May 9, 2022 - 3D Systems Corporation (NYSE:DDD) announced today its financial results for the first quarter ended March 31, 2022.
First Quarter Financial and Operational Results
•Q1 2022 revenue of $133.0 million declined 9.0% compared to Q1 2021 driven solely by divestitures of non-core assets; adjusted for divestitures(1), revenue increased 10% compared to Q1 2021, reflecting continued strength in both the Industrial and Healthcare Solutions segments
•Adjusted EBITDA margin(1) of 1.4% reflects continued investments in growth areas of our business and product portfolio, combined with seasonally lower revenue
•Diluted GAAP loss per share of $0.21, and diluted Non-GAAP loss per share(1) of $0.06
•Cash and short-term investments on the balance sheet of $745.6 million position the company for continued investments in 2022
•Subsequent to Q1 2022, closed the previously announced acquisitions of Titan and Kumovis
| Quarter Ended March 31, | ||||||||||||||
| (in millions, expect per share data) | 2022 | 2021 | ||||||||||||
| Revenue | $ | 133.0 | $ | 146.1 | ||||||||||
| Operating loss | $ | (23.2) | $ | (2.0) | ||||||||||
| Net (loss) income | $ | (26.8) | $ | 45.2 | ||||||||||
| Net (loss) income per share - basic | $ | (0.21) | $ | 0.37 | ||||||||||
| Net (loss) income per share - diluted | $ | (0.21) | $ | 0.36 | ||||||||||
Non-GAAP measures for year-over-year comparisons (1) | ||||||||||||||
| Non-GAAP operating (loss) income | $ | (3.9) | $ | 13.1 | ||||||||||
| Non-GAAP net (loss) income | $ | (7.2) | $ | 20.9 | ||||||||||
| Non-GAAP (loss) income per share - basic | $ | (0.06) | $ | 0.17 | ||||||||||
| Non-GAAP (loss) income per share - diluted | $ | (0.06) | $ | 0.17 | ||||||||||
| Adjusted EBITDA | $ | 1.9 | $ | 19.8 | ||||||||||
(1) See “Presentation of Information in this Press Release” below for a description and the Appendix for reconciliation of non-GAAP revenue, operating income (loss), net income (loss) and basic and diluted income (loss) per share to the most closely comparable GAAP measure
Summary Comments on Results
Commenting on the results, President and CEO, Dr. Jeffrey Graves said, “I’m pleased that, despite its many challenges, including significant supply-chain pressures, heightened inflation, the ongoing pandemic and geopolitical tensions arising from the Russian invasion of Ukraine, we experienced continued strong demand for our products and services throughout the first quarter. Because we believe that this demand, driven by new production applications of additive technology will be sustained, we are continuing to invest heavily in new product development, along with improvements in our core infrastructure that are necessary to support sustained double-digit organic growth in the years ahead.”
Dr. Graves continued, “With our organization now fully centered on our two business units, Healthcare and Industrial Solutions, we are focused on offering the strongest and most complete portfolio of additive manufacturing technologies, brought together with the most knowledgeable and creative engineering teams, to solve the most valuable production application needs of our customers. The effectiveness of this approach, which differentiates us in our industry, was demonstrated in the first quarter with revenue growth in our core businesses of 10% when adjusted for divestitures. This growth was led by our Industrial Solutions business, which delivered over 15% revenue growth year-over-year when adjusted for divestitures, reflecting the increased adoption of additive solutions in production environments across the world’s manufacturing community. Additionally, we also experienced solid revenue growth within our Healthcare segment when adjusted for divestitures, albeit at a slower pace due to supply chain disruptions and the impact of a new product introduction.”
Dr. Graves summarized, “As we now move fully into 2022, there are clear challenges that all companies are facing, the duration of which is unknown. However, I am very encouraged by the resiliency of demand that we continue to see for new production applications of additive manufacturing, driven in part by these same challenges, in combination with the success customers are experiencing as they increasingly move toward full implementation in production-scale environments. With our industry-leading breadth of technology solutions and application expertise, I believe we are well positioned to meet our customers' needs and create value for all of our stakeholders."
Summary of First Quarter Results
Revenue for the first quarter of 2022 decreased 9.0% to $133.0 million, solely as a result of businesses divested during 2021. Compared to the fourth quarter of 2021, company revenue decreased 11.9% due to seasonality in the business. When excluding revenue from divestitures, the business grew 10% over the same period last year. The strong divestiture-adjusted revenue growth is primarily attributed to increased product and service demand across both business segments. Industrial revenue decreased 6.6% to $68.7 million compared to the same period last year, however, when adjusted for divestitures, Industrial revenue increased 15.7% year-over-year. Healthcare revenue decreased 11.3% year-over-year to $64.3 million, compared to the same period last year. Adjusted for divestitures, Healthcare revenue increased 4.6% year-over-year.
GAAP and Non-GAAP gross profit margin(1) in the first quarter of 2022 was 40.4% and 40.6%, respectively, compared to 44.0% for both in the same period last year. Gross profit margin decreased due to year over year product mix changes primarily as a result of divestitures and supply chain pressures.
Operating expenses increased 16.4% to $77.0 million in the first quarter of 2022, compared to the same period a year ago, primarily due to expenses from acquisitions and increased investments in product development and core infrastructure to drive future growth. On a non-GAAP basis, operating expenses(1) were $57.8 million, a 13.0% increase from the first quarter of the prior year. The higher non-GAAP operating expenses reflect spending in targeted areas to support future growth, including expenses from
acquired companies, research and development, and bad debt expense due to heightened geopolitical activity.
Updating 2022 Outlook
3D Systems is narrowing its full-year 2022 guidance. The company now expects revenue to be within a range of $580 million and $625 million. The company expects non-GAAP gross margins to be between 40% to 43%. Given the company's planned investment profile, the company now expects non-GAAP operating expenses to be between $235 million and $250 million. This 2022 guidance assumes no significant changes in macroeconomic events that could negatively impact our business, such as COVID-19, geopolitical events, or other factors that could impact either demand or disrupt our supply chain.
Financial Liquidity
At March 31, 2022, the company had cash and short-term investments on hand of $745.6 million. Cash and short-term investments have increased $613.2 million since March 31, 2021, driven primarily by net proceeds from divestitures of $366.7 million, $446.5 million of proceeds from the issuance of convertible notes, and cash generated from operations of $4.6 million, partially offset by capital expenditures and payments for 2021 acquisitions. On April 1, 2022, we completed the acquisitions of Kumovis GmbH ("Kumovis") and Titan Additive LLC ("Titan") for a combined all cash purchase price of $80 million, before customary closing adjustments. The purchase price was funded with cash on hand.
Q1 2022 Conference Call and Webcast
3D Systems will host a conference call and simultaneous webcast to discuss these results tomorrow morning, which may be accessed as follows:
Date: Tuesday, May 10, 2022
Time: 8:30 a.m. Eastern Time
Listen via webcast: www.3dsystems.com/investor
Participate via telephone: 201-689-8345
A replay of the webcast will be available approximately two hours after the live presentation at www.3dsystems.com/investor.
Forward-Looking Statements
Certain statements made in this release that are not statements of historical or current facts are forward-looking statements within the meaning of the Private Securities Litigation Reform Act of 1995. Forward-looking statements involve known and unknown risks, uncertainties and other factors that may cause the actual results, performance or achievements of the company to be materially different from historical results or from any future results or projections expressed or implied by such forward-looking statements. In many cases, forward looking statements can be identified by terms such as “believes,” “belief,” “expects,” “may,” “will,” “estimates,” “intends,” “anticipates” or “plans” or the negative of these terms or other comparable terminology. Forward-looking statements are based upon management’s beliefs, assumptions and current expectations and may include comments as to the company’s beliefs and expectations as to future events and trends affecting its business and are necessarily subject to uncertainties, many of which are outside the control of the company. The factors described under the headings “Forward-Looking Statements” and “Risk Factors” in the company’s periodic filings with the Securities and Exchange Commission, as well as other factors, could cause actual results to differ materially from those reflected or predicted in forward-looking statements. Although management believes that the expectations reflected in the forward-looking statements are reasonable, forward-looking
statements are not, and should not be relied upon as a guarantee of future performance or results, nor will they necessarily prove to be accurate indications of the times at which such performance or results will be achieved. The forward-looking statements included are made only as the date of the statement. 3D Systems undertakes no obligation to update or revise any forward-looking statements made by management or on its behalf, whether as a result of future developments, subsequent events or circumstances or otherwise, except as required by law.
Presentation of Information in this Press Release
3D Systems reports its financial results in accordance with GAAP. Management also reviews and reports certain non-GAAP measures, including: non-GAAP revenue, non-GAAP Gross profit, non-GAAP Gross profit margin, non-GAAP Operating expenses, non-GAAP Operating (loss)/income, non-GAAP Interest and other income/(expense), net, non-GAAP Net income (loss), non-GAAP Basic and Diluted Income (Loss) per Share, adjusted EBITDA and adjusted EBITDA Margin. These non-GAAP measures exclude certain special items that management does not view as part of 3D Systems’ underlying results as they may be highly variable, may be unusual or infrequent, are difficult to predict and can distort underlying business trends and results. Management believes that the non-GAAP measures provide useful additional insight into underlying business trends and results and provide a more meaningful comparison of period-over-period results. Additionally, management uses the non-GAAP measures for planning, forecasting and evaluating business and financial performance, including allocating resources and evaluating results relative to employee compensation targets. 3D Systems’ non-GAAP measures are not calculated in accordance with or as required by GAAP and may not be calculated the same as similarly titled measures used by other companies. These non-GAAP measures should thus be considered as supplemental in nature and not considered in isolation or as a substitute for the related financial information prepared in accordance with GAAP.
To calculate the non-GAAP measures, 3D Systems excludes the impact of the following items:
•amortization of intangible assets, a non-cash expense, as 3D Systems’ intangible assets were primarily acquired in connection with business combinations;
•costs incurred in connection with acquisitions and divestitures, such as legal, consulting and advisory fees;
•stock-based compensation expenses, a non-cash expense;
•restructuring charges (cost optimization plans), impairment charges, including goodwill, divestiture gains or losses, and severance charges pertaining to senior level employees;
•certain compensation expense related to the 2021 Volumetric acquisition; and
•revenue from divestitures included in comparable periods necessary to calculate revenue growth excluding the impact of divestitures
Amortization of intangibles, acquisition and divestiture related costs are excluded from non-GAAP measures as the timing and magnitude of business combination transactions are not predictable, can vary significantly from period to period and the purchase price allocated to amortizable intangible assets and the related amortization period are unique to each acquisition. Amortization of intangible assets will recur in future periods until such intangible assets have been fully amortized. While intangible assets contribute to the Company’s revenue generation, the amortization of intangible assets does not directly relate to the sale of the Company’s products or services. Additionally, intangible asset amortization expense typically fluctuates based on the size and timing of the Company’s acquisition activity. Accordingly, the Company believes excluding the amortization of intangible assets enhances the Company’s and investors’ ability to compare the Company’s past financial performance with its current performance and to analyze underlying business performance and trends. Although stock-based compensation is a key incentive offered to certain of our employees, we continue to evaluate our business performance excluding stock-based compensation; therefore, it is excluded from non-GAAP measures. Stock-based compensation expenses will recur in future periods. Restructuring charges (cost optimization plans), impairment charges, including goodwill, divestiture gains or losses, and severance charges pertaining to senior level employees, are excluded from non-GAAP measures as the frequency
and magnitude of these activities may vary widely from period to period. Additionally, impairment charges, including goodwill, are non-cash. Furthermore, 3D Systems excludes contingent consideration recorded as compensation expense related to the 2021 Volumetric acquisition from non-GAAP measures as management evaluates financial performance excluding this expense, which is viewed by management as similar to acquisition consideration.
The matters discussed above are tax effected, as applicable, in calculating non-GAAP net income and basic and diluted earnings per share.
Non-GAAP revenue as defined in this earnings release is as reported revenue less revenue from businesses divested in 2021.
Adjusted EBITDA, defined as net income, plus income tax (provision)/benefit, interest and other income/(expense), net, stock-based compensation expense, amortization of intangibles, depreciation expense and other non-recurring and/or non-cash items all as described above, is used by management to evaluate performance and helps measure financial performance period-over-period.
A reconciliation of GAAP to non-GAAP financial measures is provided in the accompanying schedules.
3D Systems does not provide forward-looking guidance for certain measures on a GAAP basis. The company is unable to provide a quantitative reconciliation of forward-looking non-GAAP gross margins and non-GAAP operating expenses to the most directly comparable forward-looking GAAP measures without unreasonable effort because certain items, including legal, acquisition expenses, stock-compensation expense, intangible amortization expense, restructuring expenses, and goodwill impairment, are difficult to predict and estimate. These items are inherently uncertain and depend on various factors, many of which are beyond the company’s control, and as such, any associated estimate and its impact on GAAP performance could vary materially.
About 3D Systems
More than 30 years ago, 3D Systems brought the innovation of 3D printing to the manufacturing industry. Today, as the leading Additive Manufacturing solutions partner, we bring innovation, performance, and reliability to every interaction - empowering our customers to create products and business models never before possible. Thanks to our unique offering of hardware, software, materials and services, each application-specific solution is powered by the expertise of our application engineers who collaborate with customers to transform how they deliver their products and services. 3D Systems’ solutions address a variety of advanced applications in Healthcare and Industrial markets such as Medical and Dental, Aerospace & Defense, Automotive and Durable Goods. More information on the company is available at www.3dsystems.com
Investor Contact: [email protected]
Media Contact: [email protected]
Tables Follow
3D Systems Corporation
Unaudited Condensed Consolidated Balance Sheets
March 31, 2022 and December 31, 2021
| (In thousands, except par value) | March 31, 2022 (unaudited) | December 31, 2021 | |||||||||
| ASSETS | |||||||||||
| Current assets: | |||||||||||
| Cash and cash equivalents | $ | 389,270 | $ | 789,657 | |||||||
| Short-term investments | 356,340 | — | |||||||||
| Accounts receivable, net of reserves — $3,464 and $2,445 | 100,341 | 106,540 | |||||||||
| Inventories | 101,647 | 92,887 | |||||||||
| Prepaid expenses and other current assets | 40,130 | 42,653 | |||||||||
| Total current assets | 987,728 | 1,031,737 | |||||||||
| Property and equipment, net | 54,827 | 57,257 | |||||||||
| Intangible assets, net | 46,205 | 45,835 | |||||||||
| Goodwill | 340,695 | 345,588 | |||||||||
| Right of use assets | 44,440 | 46,356 | |||||||||
| Deferred income tax asset | 4,548 | 5,054 | |||||||||
| Other assets | 28,120 | 17,272 | |||||||||
| Total assets | $ | 1,506,563 | $ | 1,549,099 | |||||||
| LIABILITIES AND EQUITY | |||||||||||
| Current liabilities: | |||||||||||
| Current right of use liabilities | 8,299 | 8,344 | |||||||||
| Accounts payable | 57,347 | 57,366 | |||||||||
| Accrued and other liabilities | 46,258 | 76,994 | |||||||||
| Customer deposits | 5,314 | 7,281 | |||||||||
| Deferred revenue | 33,020 | 28,027 | |||||||||
| Total current liabilities | 150,238 | 178,012 | |||||||||
| Long-term debt, net of deferred financing costs | 447,534 | 446,859 | |||||||||
| Long-term right of use liabilities | 45,283 | 47,420 | |||||||||
| Deferred income tax liability | 2,181 | 2,173 | |||||||||
| Other liabilities | 34,451 | 32,254 | |||||||||
| Total liabilities | 679,687 | 706,718 | |||||||||
| Commitments and contingencies | |||||||||||
| Stockholders’ equity: | |||||||||||
| Common stock, $0.001 par value, authorized 220,000 shares; issued 130,365 and 128,375 | 130 | 128 | |||||||||
| Additional paid-in capital | 1,519,242 | 1,501,210 | |||||||||
| Accumulated deficit | (648,050) | (621,251) | |||||||||
| Accumulated other comprehensive loss | (44,446) | (37,706) | |||||||||
| Total stockholders’ equity | 826,876 | 842,381 | |||||||||
| Total liabilities and stockholders’ equity | $ | 1,506,563 | $ | 1,549,099 | |||||||
3D Systems Corporation
Unaudited Condensed Consolidated Statements of Operations
Three Months Ended March 31, 2022 and 2021
| Quarter Ended March 31, | |||||||||||
| (in thousands, except per share amounts) | 2022 | 2021 | |||||||||
| Revenue: | |||||||||||
| Products | $ | 100,551 | $ | 93,648 | |||||||
| Services | 32,450 | 52,468 | |||||||||
| Total revenue | 133,001 | 146,116 | |||||||||
| Cost of sales: | |||||||||||
| Products | 58,472 | 53,364 | |||||||||
| Services | 20,734 | 28,512 | |||||||||
| Total cost of sales | 79,206 | 81,876 | |||||||||
| Gross profit | 53,795 | 64,240 | |||||||||
| Operating expenses: | |||||||||||
| Selling, general and administrative | 55,415 | 49,600 | |||||||||
| Research and development | 21,612 | 16,599 | |||||||||
| Total operating expenses | 77,027 | 66,199 | |||||||||
| Loss from operations | (23,232) | (1,959) | |||||||||
| Interest and other (expense) income , net | (2,283) | 38,853 | |||||||||
| (Loss) income before income taxes | (25,515) | 36,894 | |||||||||
| (Provision) benefit for income taxes | (1,284) | 8,334 | |||||||||
| Net (loss) income | $ | (26,799) | $ | 45,228 | |||||||
| Net (loss) income per common share: | |||||||||||
| Basic | $ | (0.21) | $ | 0.37 | |||||||
| Diluted | $ | (0.21) | $ | 0.36 | |||||||
| Weighted average shares outstanding: | |||||||||||
| Basic | 126,728 | 121,705 | |||||||||
| Diluted | 126,728 | 125,070 | |||||||||
3D Systems Corporation
Unaudited Condensed Consolidated Statements of Cash Flows
Three Months Ended March 31, 2022 and 2021
| Quarter Ended March 31, | |||||||||||
| (in thousands) | 2022 | 2021 | |||||||||
| Cash flows from operating activities: | |||||||||||
| Net (loss) income | $ | (26,799) | $ | 45,228 | |||||||
| Adjustments to reconcile net (loss) income to net cash (used in) provided by operating activities: | |||||||||||
| Depreciation and amortization | 9,147 | 9,102 | |||||||||
| Stock-based compensation | 12,658 | 11,050 | |||||||||
| Unrealized gain on exchange rate | (439) | — | |||||||||
| Provision for inventory obsolescence and revaluation | (517) | — | |||||||||
| Loss on hedge accounting de-designation and termination | — | 721 | |||||||||
| Provision for bad debts | 1,076 | (142) | |||||||||
| Loss (Gain) on the disposition of businesses, property, equipment and other assets | 137 | (39,401) | |||||||||
| Provision (benefit) for deferred income taxes and reserve adjustments | 466 | (8,889) | |||||||||
| Asset impairment | 40 | — | |||||||||
| Changes in operating accounts: | |||||||||||
| Accounts receivable | 3,173 | 15,941 | |||||||||
| Inventories | (8,822) | 2,699 | |||||||||
| Prepaid expenses and other current assets | 2,225 | (2,303) | |||||||||
| Accounts payable | 277 | 1,665 | |||||||||
| Deferred revenue and customer deposits | 1,901 | 1,552 | |||||||||
| Accrued and other liabilities | (8,679) | (17,491) | |||||||||
| All other operating activities | (969) | 8,721 | |||||||||
| Net cash (used in) provided by operating activities | (15,125) | 28,453 | |||||||||
| Cash flows from investing activities: | |||||||||||
| Purchases of property and equipment | (4,079) | (3,878) | |||||||||
| Purchases of short-term investments | (366,005) | — | |||||||||
| Sales and maturities of short-term investments | 6,170 | — | |||||||||
| Proceeds from sale of assets and businesses, net of cash | — | 54,747 | |||||||||
| Acquisitions and other investments, net | (9,335) | — | |||||||||
| Other investing activities | 40 | (306) | |||||||||
| Net cash (used in) provided by investing activities | (373,209) | 50,563 | |||||||||
| Cash flows from financing activities: | |||||||||||
| Repayment of borrowings/long-term debt | — | (21,392) | |||||||||
| Purchase of noncontrolling interest | (2,300) | (4,000) | |||||||||
| Payments related to net-share settlement of stock-based compensation | (10,052) | (2,749) | |||||||||
| Other financing activities | (166) | (196) | |||||||||
| Net cash used in financing activities | (12,518) | (28,337) | |||||||||
| Effect of exchange rate changes on cash, cash equivalents and restricted cash | 464 | (2,434) | |||||||||
| Net (decrease) increase in cash, cash equivalents and restricted cash | (400,388) | 48,245 | |||||||||
| Cash, cash equivalents and restricted cash at the beginning of the period | 789,970 | 84,711 | |||||||||
| Cash, cash equivalents and restricted cash at the end of the period | $ | 389,582 | $ | 132,956 | |||||||
Appendix
3D Systems Corporation
Unaudited Reconciliations of GAAP to Non-GAAP Measures
Three Months Ended March 31, 2022 and 2021
Quarter Ended March 31,(1) | |||||||||||||||||
| (in millions, except per share data) | 2022 | 2022 | |||||||||||||||
| GAAP | Amortization, stock-based compensation & other | Legal, acquisition and divestiture -related | Cost optimization plan | Non-GAAP | |||||||||||||
| Revenue | $ | 133.0 | $ | — | $ | — | $ | — | $ | 133.0 | |||||||
| Gross Profit | 53.8 | 0.1 | — | — | 53.9 | ||||||||||||
| Gross Profit Margin | 40.4% | 40.6% | |||||||||||||||
| Operating expenses | 77.0 | $ | (15.2) | (4.0) | — | 57.8 | |||||||||||
| Operating income (loss) | (23.2) | 15.3 | 4.0 | — | (3.9) | ||||||||||||
| Interest and other income (expense), net | (2.3) | — | 0.3 | — | (2.0) | ||||||||||||
| Net income (loss) | $ | (26.8) | $ | 15.3 | $ | 4.3 | $ | — | $ | (7.2) | |||||||
| Net income (loss) EPS - basic | $ | (0.21) | $ | 0.12 | $ | 0.03 | $ | — | $ | (0.06) | |||||||
| Net income (loss) EPS - diluted | $ | (0.21) | $ | 0.12 | $ | 0.03 | $ | — | $ | (0.06) | |||||||
| Weighted Average Shares - basic | 126.7 | 126.7 | |||||||||||||||
| Weighted Average Shares - diluted | 126.7 | 126.7 | |||||||||||||||
(1)Amounts in table may not foot due to rounding
Quarter Ended March 31,(1) | |||||||||||||||||
| (in millions, except per share data) | 2021 | 2021 | |||||||||||||||
| GAAP | Amortization, stock-based compensation & other | Legal, acquisition and divestiture -related | Cost optimization plan | Non-GAAP | |||||||||||||
| Revenue | $ | 146.1 | $ | — | $ | — | $ | — | $ | 146.1 | |||||||
| Gross Profit | 64.2 | 0.1 | — | — | 64.3 | ||||||||||||
| Gross Profit Margin | 44.0% | 44.0% | |||||||||||||||
| Operating expenses | 66.2 | (13.3) | (0.7) | (1.0) | 51.2 | ||||||||||||
| Operating income (loss) | (2.0) | 13.4 | 0.7 | 1.0 | 13.1 | ||||||||||||
| Interest and other income (expense), net | 38.9 | — | (39.4) | — | (0.5) | ||||||||||||
| Net income (loss) | $ | 45.2 | $ | 13.4 | $ | (37.7) | $ | — | $ | 20.9 | |||||||
| Net income (loss) EPS - basic | $ | 0.37 | $ | 0.11 | $ | (0.31) | $ | — | $ | 0.17 | |||||||
| Net income (loss) EPS - diluted | $ | 0.36 | $ | 0.11 | $ | (0.30) | $ | — | $ | 0.17 | |||||||
| Weighted Average Shares - basic | 121.7 | 121.7 | |||||||||||||||
| Weighted Average Shares - diluted | 125.1 | 125.1 | |||||||||||||||
(1)Amounts in table may not foot due to rounding
3D Systems Corporation
Non-GAAP Operating Income to Adjusted EBITDA Reconciliation
Three Months Ended March 31, 2022 and 2021
Quarter Ended March 31,(1) | |||||||||||
| (in millions) | 2022 | 2021 | |||||||||
| Revenue | $ | 133.0 | $ | 146.1 | |||||||
| Non-GAAP Operating (loss) income | (3.9) | 13.1 | |||||||||
| Depreciation | 5.8 | 6.7 | |||||||||
| Adjusted EBITDA | $ | 1.9 | $ | 19.8 | |||||||
| Adjusted EBITDA Margin | 1.4 | % | 13.6 | % | |||||||
(1)Amounts in table may not foot due to rounding
3D Systems Corporation
Reconciliation of Revenue Excluding Divestitures (Non-GAAP Measures) and Related Revenue Growth
Three Months Ended March 31, 2022 and 2021
(in Millions, unaudited)
| Quarter Ended March 31, 2022 | Quarter Ended March 31, 2021 | % Change | |||||||||||||||
Revenue, as reported | |||||||||||||||||
| Healthcare | $ | 64.3 | $ | 72.5 | (11.3) | % | |||||||||||
| Industrial | 68.7 | 73.6 | (6.7) | % | |||||||||||||
Total Revenue, as reported | $ | 133.0 | $ | 146.1 | (9.0) | % | |||||||||||
Revenue From Divestitures: | |||||||||||||||||
| Healthcare | $ | — | $ | 11.0 | |||||||||||||
| Industrial | — | 14.2 | |||||||||||||||
Total Revenue | $ | — | $ | 25.2 | |||||||||||||
Total Revenue (Excl. Divest.): | |||||||||||||||||
| Healthcare | $ | 64.3 | $ | 61.5 | 4.6 | % | |||||||||||
| Industrial | 68.7 | 59.4 | 15.7 | % | |||||||||||||
Total Revenue (Excl. Divest.): | $ | 133.0 | $ | 120.9 | 10.0 | % | |||||||||||

©2022 3D Systems, Inc. | All Rights Reserved. First Quarter 2022 Financial Results May 10, 2022 EXHIBIT 99.2

©2021 3D Systems, Inc. | All Rights Reserved.2 Welcome and Participants Dr. Jeffrey Graves President and Chief Executive Officer Jagtar Narula Executive VP and Chief Financial Officer Andrew Johnson Executive VP and Chief Legal Officer Melanie Solomon Investor Relations To participate via phone, please dial: 1-201-689-8345 2

©2022 3D Systems, Inc. | All Rights Reserved. Certain statements made in this presentation that are not statements of historical or current facts are forward-looking statements within the meaning of the Private Securities Litigation Reform Act of 1995. Forward-looking statements involve known and unknown risks, uncertainties and other factors that may cause the actual results, performance or achievements of the company to be materially different from historical results or from any future results or projections expressed or implied by such forward-looking statements. In many cases, forward looking statements can be identified by terms such as “believes,” “belief,” “expects,” “may,” “will,” “estimates,” “intends,” “anticipates” or “plans” or the negative of these terms or other comparable terminology. Forward-looking statements are based upon management’s beliefs, assumptions and current expectations and may include comments as to the company’s beliefs and expectations as to future events and trends affecting its business and are necessarily subject to uncertainties, many of which are outside the control of the company. The factors described under the headings “Forward-Looking Statements” and “Risk Factors” in the company’s periodic filings with the Securities and Exchange Commission, as well as other factors, could cause actual results to differ materially from those reflected or predicted in forward-looking statements. Although management believes that the expectations reflected in the forward-looking statements are reasonable, forward-looking statements are not, and should not be relied upon as a guarantee of future performance or results, nor will they necessarily prove to be accurate indications of the times at which such performance or results will be achieved. The forward- looking statements included are made only as the date of the statement. 3D Systems undertakes no obligation to update or revise any forward-looking statements made by management or on its behalf, whether as a result of future developments, subsequent events or circumstances or otherwise, except as required by law Further, we encourage you to review “Risk Factors” in Part 1 of our Annual Report on Form 10-K and Part II of our Quarterly Reports on Form 10-Q filed with the SEC as well as other information about us in our filings with the SEC. These are available at www.SEC.gov. 3 Forward Looking Statements

©2022 3D Systems, Inc. | All Rights Reserved. Dr. Jeffrey Graves President & Chief Executive Officer 4
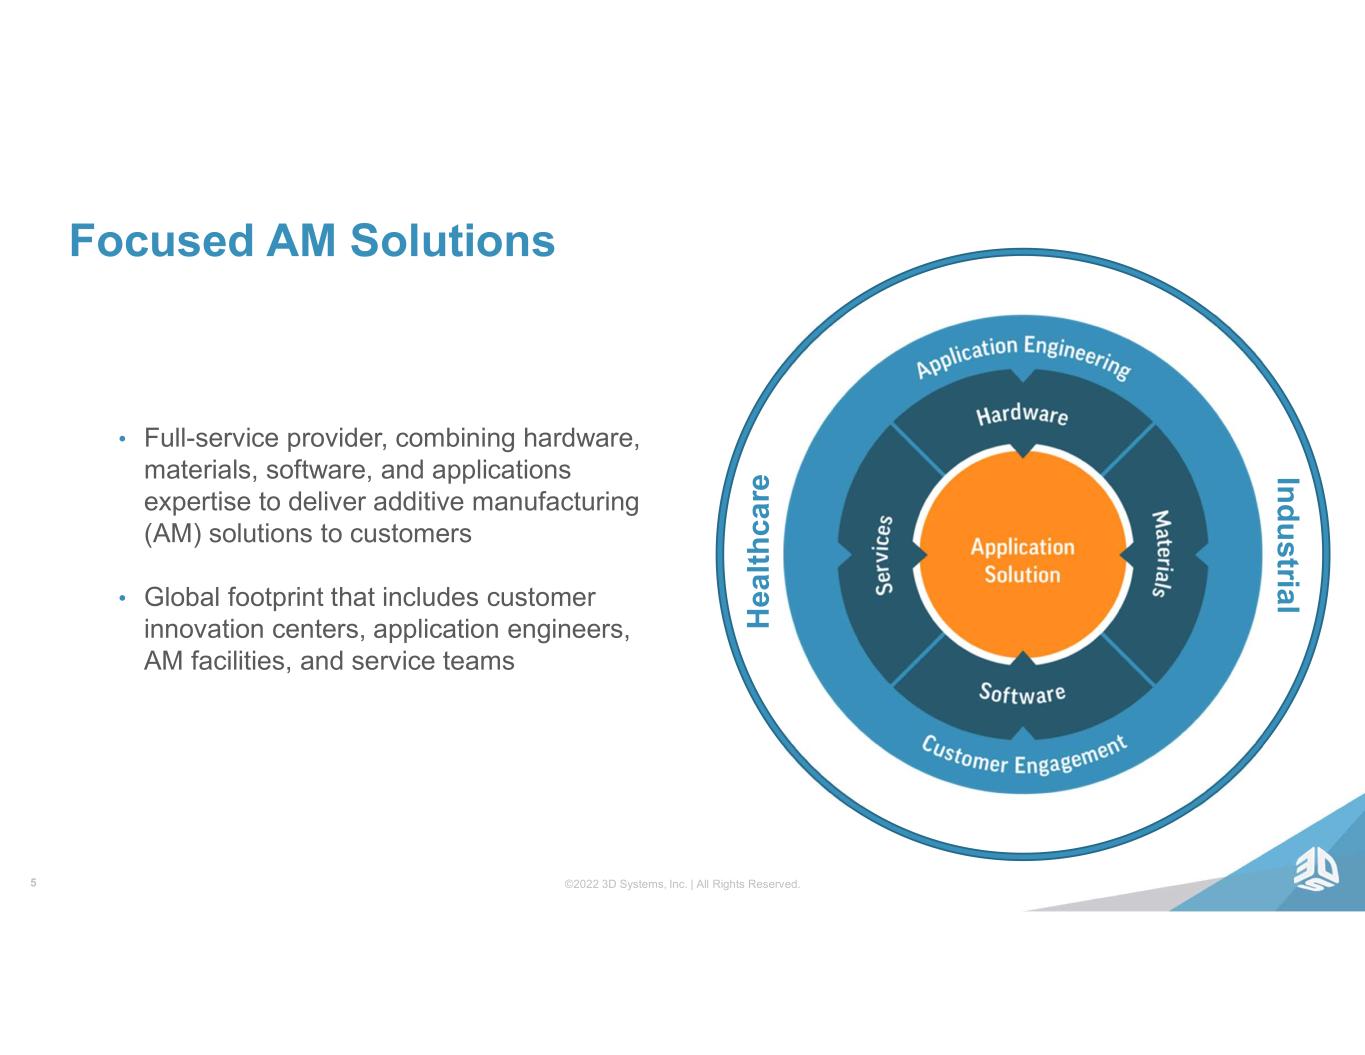
©2022 3D Systems, Inc. | All Rights Reserved. H e a lt h c a re 5 In d u stria l Focused AM Solutions • Full-service provider, combining hardware, materials, software, and applications expertise to deliver additive manufacturing (AM) solutions to customers • Global footprint that includes customer innovation centers, application engineers, AM facilities, and service teams

©2022 3D Systems, Inc. | All Rights Reserved.6 First Quarter 2022 and Recent Highlights • Delivered double-digit growth, adjusted for divestitures, with Industrial growing over 15% and Healthcare growing 5% year over year • Investing organically to expand drivers of growth and improving core infrastructure in IT, finance and accounting • Strategically investing in product portfolio and business • Enhatch for software solutions directed at the ‘personalized healthcare solutions’ market • Dussur for AM in oil and gas as well as other industrial sectors • Released the world’s first synchronous, dual-laser SLA printer
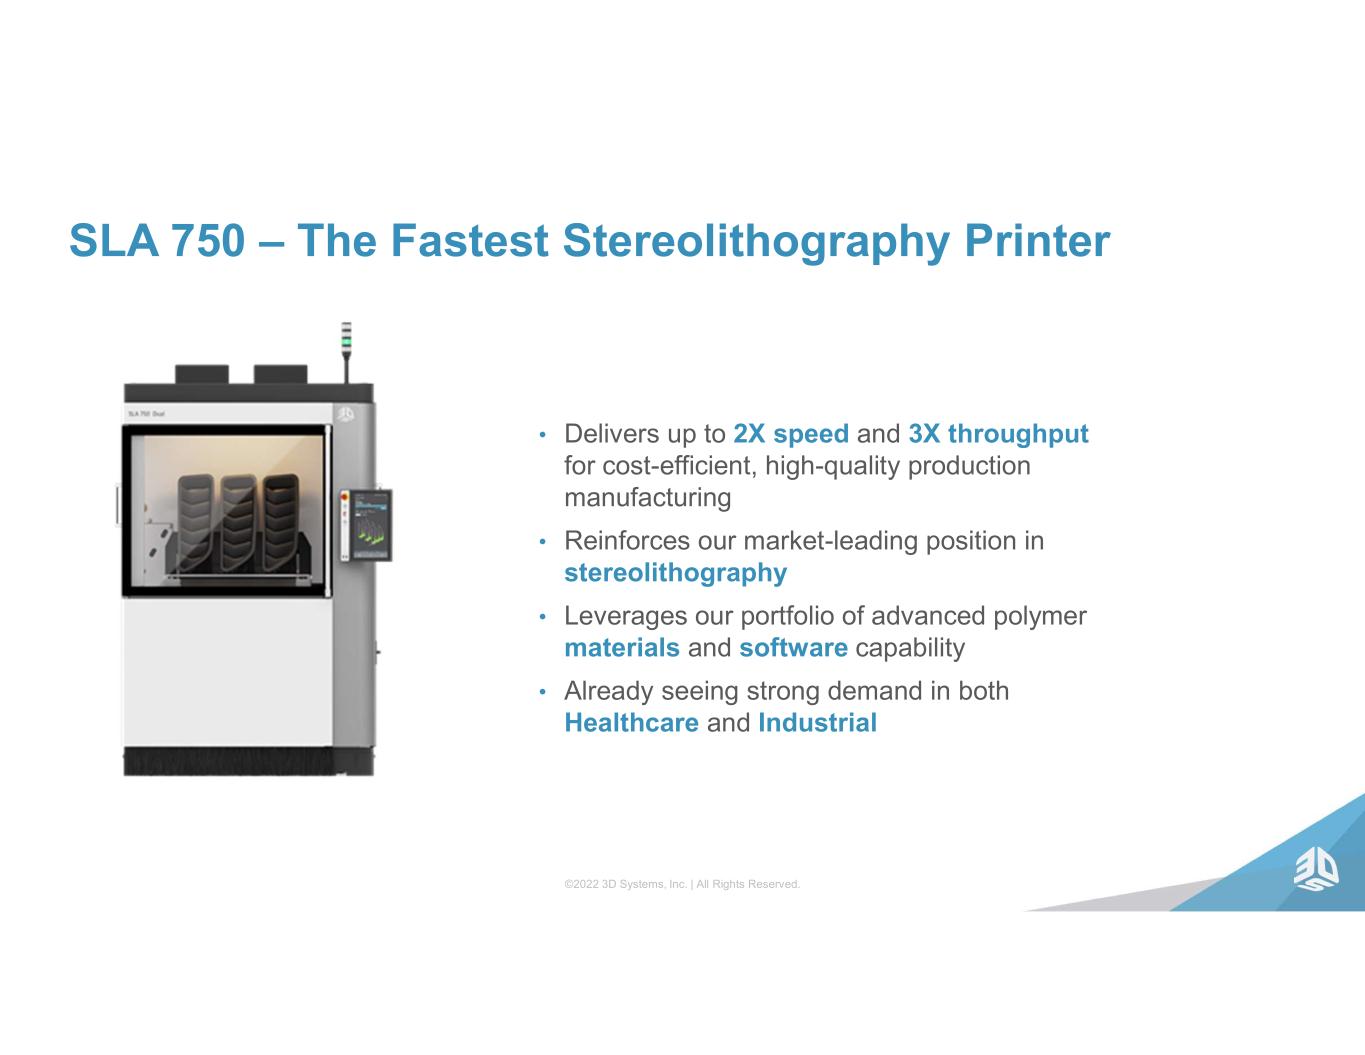
©2022 3D Systems, Inc. | All Rights Reserved. SLA 750 – The Fastest Stereolithography Printer • Delivers up to 2X speed and 3X throughput for cost-efficient, high-quality production manufacturing • Reinforces our market-leading position in stereolithography • Leverages our portfolio of advanced polymer materials and software capability • Already seeing strong demand in both Healthcare and Industrial

©2022 3D Systems, Inc. | All Rights Reserved. Healthcare Solutions Positive Regulatory Developments Received FDA 510(k) clearance of VSP® Bolus, a solution designed to deliver high- quality patient-specific radiotherapy treatment accessories Under FDA review with clearance expected in 2022

©2022 3D Systems, Inc. | All Rights Reserved.9 In Summary • Strong demand for Additive Manufacturing • Supply chain remains a headwind • Investing strategically • Focus on delivering double-digit topline growth (ex-divestitures) 1

©2022 3D Systems, Inc. | All Rights Reserved. Jagtar Narula Executive VP & Chief Financial Officer 10

©2022 3D Systems, Inc. | All Rights Reserved.11 Q1 Summary • Revenue increased 10.0% excluding divested businesses YoY • GAAP loss per share of ($0.21) decreased YoY due to the gains recognized on businesses divested in 2021 • Non-GAAP loss per share* of ($0.06) decreased YoY due to: • Divestitures in 2021 • Higher spend on core investments to support growth • Impacts from geopolitical events and FX * See Appendix for reconciliation of GAAP and non-GAAP net loss per share.

©2022 3D Systems, Inc. | All Rights Reserved.12 Revenue by Market (Adjusted for Divestitures) $ in millions $59.4 $68.7 Q1 2021 Q1 2022 Industrial Revenue Q1 YoY +15.7% $61.5 $64.3 Q1 2021 Q1 2022 Healthcare Revenue Q1 YoY +4.6% Slowdown in growth driven by supply chain disruptions and introduction of a new product Fifth consecutive quarter of year-over-year growth
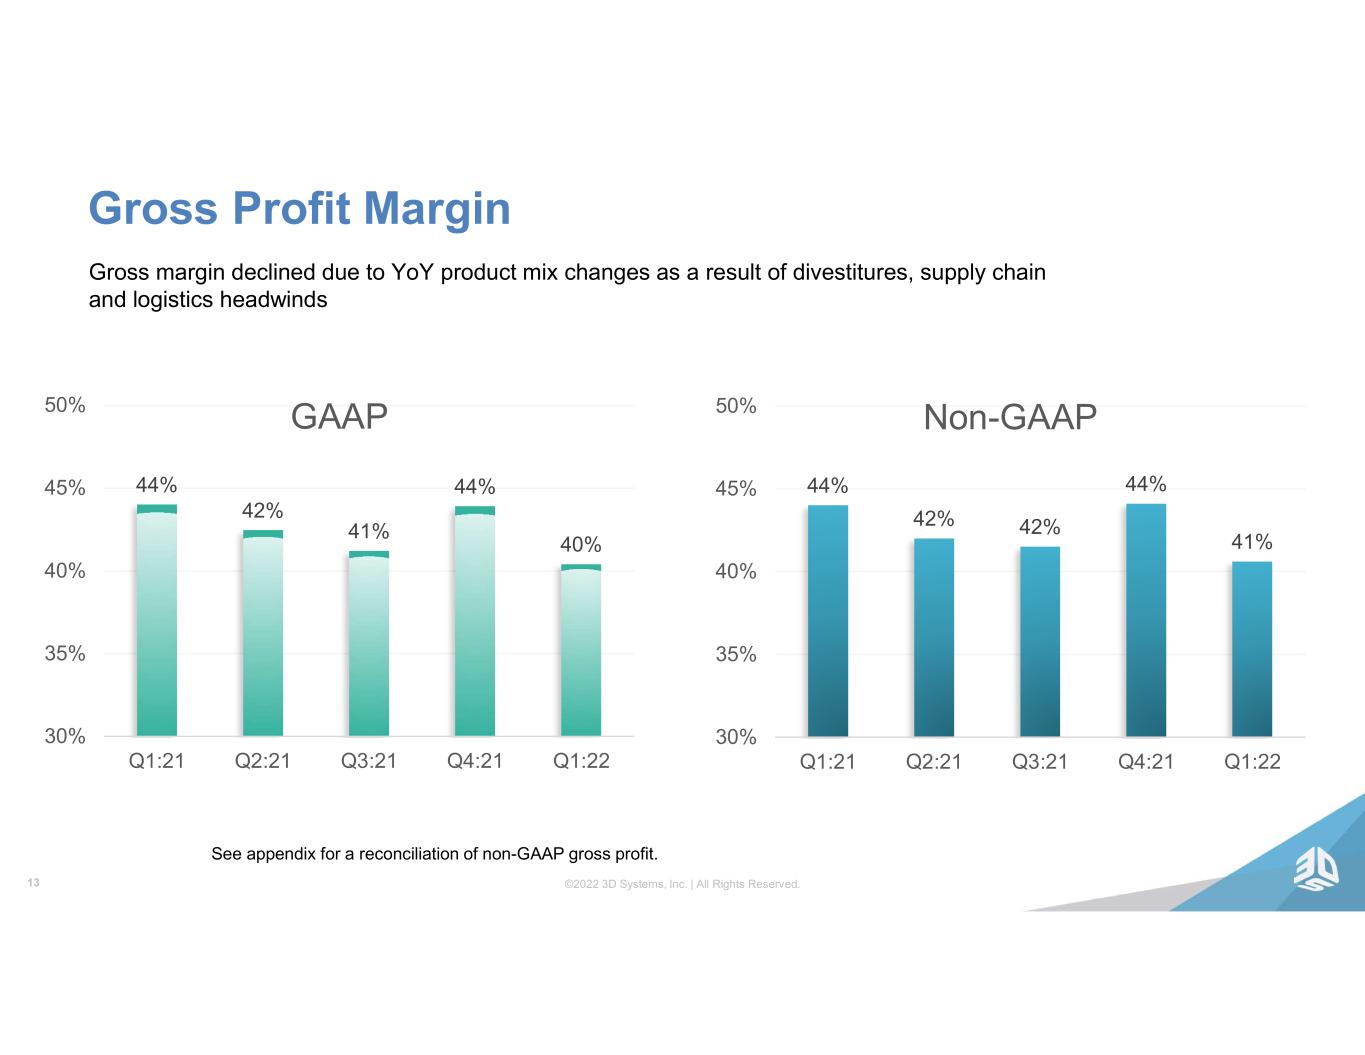
©2022 3D Systems, Inc. | All Rights Reserved.13 Gross Profit Margin See appendix for a reconciliation of non-GAAP gross profit. 44% 42% 42% 44% 41% 30% 35% 40% 45% 50% Q1:21 Q2:21 Q3:21 Q4:21 Q1:22 Non-GAAP 44% 42% 41% 44% 40% 30% 35% 40% 45% 50% Q1:21 Q2:21 Q3:21 Q4:21 Q1:22 GAAP Gross margin declined due to YoY product mix changes as a result of divestitures, supply chain and logistics headwinds

©2022 3D Systems, Inc. | All Rights Reserved.14 Operating Expenses $66.2 $79.1 $81.5 $70.1 $77.0 $0 $20 $40 $60 $80 $100 $120 Q1 2021 Q2 2021 Q3 2021 Q4 2021 Q1 2022 $ in m ill io n s GAAP R&D SG&A $51.2 $55.2 $54.1 $54.3 $57.8 $0 $20 $40 $60 Q1 2021 Q2 2021 Q3 2021 Q4 2021 Q1 2022 $ in m ill io n s Non-GAAP R&D SG&A Q1 reflects spending in targeted areas to support future growth and bad debt expense due to Russia exit See appendix for a reconciliation of non-GAAP operating expenses.

©2022 3D Systems, Inc. | All Rights Reserved.15 13.6% 12.4% 10.5% 11.8% 1.4% 0.0% 5.0% 10.0% 15.0% Q1 2021 Q2 2021 Q3 2021 Q4 2021 Q1 2022 Adjusted EBITDA Margin Defined as non-GAAP Operating Income plus Depreciation divided by Revenue See appendix for a reconciliation of Non-GAAP Operating Income and Adjusted EBITDA. Key growth and infrastructure investments + Supply chain impacts
©2022 3D Systems, Inc. | All Rights Reserved.16 Strong Balance Sheet • Ended the quarter with $745.6 million dollars of cash and short-term investments on hand • Ample cash to fund organic growth opportunities and potential acquisitions • Subsequent to quarter end, closed acquisitions of Titan Robotics and Kumovis for $80 million cash, net of closing adjustments • Well-positioned to drive recurring revenue growth and greater adoption of AM in Industrial and Healthcare

©2022 3D Systems, Inc. | All Rights Reserved. 17 Narrowed 2022 Outlook Non-GAAP Operating Expenses between $235 million and $250 million Increasing additive manufacturing opportunity driving demand Revenue between $580 million and $625 million Non-GAAP Gross Margins between 40% and 43% Supply chain and geopolitical impacts Investing in talent, hardware, materials, and software platforms to expand market leadership

©2022 3D Systems, Inc. | All Rights Reserved. Dr. Jeffrey Graves President & Chief Executive Officer 18

©2022 3D Systems, Inc. | All Rights Reserved. INVESTOR DAY May 16, 2022 Detroit, Michigan Prior to Rapid +TCT Trade Show Join us! Contact Investor Relations [email protected]

©2022 3D Systems, Inc. | All Rights Reserved.20 Q&A Session 1-201-689-8345

©2022 3D Systems, Inc. | All Rights Reserved.21 Thank You Find out more at: www.3dsystems.com

©2022 3D Systems, Inc. | All Rights Reserved. Appendix
©2022 3D Systems, Inc. | All Rights Reserved. 3D Systems reports its financial results in accordance with GAAP. Management also reviews and reports certain non-GAAP measures, including: non-GAAP revenue, non-GAAP Gross profit, non-GAAP Gross profit margin, non-GAAP Operating expenses, non-GAAP Operating (loss)/income, non-GAAP Interest and other income/(expense), net, non-GAAP Net income (loss), non-GAAP Basic and Diluted Income (Loss) per Share, adjusted EBITDA and adjusted EBITDA Margin. These non-GAAP measures exclude certain special items that management does not view as part of 3D Systems’ underlying results as they may be highly variable, may be unusual or infrequent, are difficult to predict and can distort underlying business trends and results. Management believes that the non-GAAP measures provide useful additional insight into underlying business trends and results and provide a more meaningful comparison of period-over-period results. Additionally, management uses the non-GAAP measures for planning, forecasting and evaluating business and financial performance, including allocating resources and evaluating results relative to employee compensation targets. 3D Systems’ non-GAAP measures are not calculated in accordance with or as required by GAAP and may not be calculated the same as similarly titled measures used by other companies. These non-GAAP measures should thus be considered as supplemental in nature and not considered in isolation or as a substitute for the related financial information prepared in accordance with GAAP. A reconciliation of GAAP to non-GAAP financial measures is provided in the accompanying schedules. 3D Systems does not provide forward-looking guidance for certain measures on a GAAP basis. The company is unable to provide a quantitative reconciliation of forward-looking non-GAAP gross margins and non-GAAP operating expenses to the most directly comparable forward-looking GAAP measures without unreasonable effort because certain items, including legal, acquisition expenses, stock-compensation expense, intangible amortization expense, restructuring expenses, and goodwill impairment, are difficult to predict and estimate. These items are inherently uncertain and depend on various factors, many of which are beyond the company’s control, and as such, any associated estimate and its impact on GAAP performance could vary materially. 23 Presentation of Information

©2022 3D Systems, Inc. | All Rights Reserved. Non-GAAP Reconciliation – Quarter Ended March 31, 2022 (Unaudited) 24

©2022 3D Systems, Inc. | All Rights Reserved. Non-GAAP Reconciliation – Quarter Ended March 31, 2021 (Unaudited) 25

©2022 3D Systems, Inc. | All Rights Reserved. Non-GAAP Operating Income to Adjusted EBITDA Reconciliation 26

©2022 3D Systems, Inc. | All Rights Reserved. Revenue Excluding Divestitures and Related Revenue Growth (in Millions, Unaudited) 27 Quarter Ended March 31, 2022 Quarter Ended March 31, 2021 % Change Revenue, as reported Healthcare $ 64.3 $ 72.5 (11.3) % Industrial 68.7 73.6 (6.7) % Total Revenue, as reported $ 133.0 $ 146.1 (9.0) % Revenue From Divestitures: Healthcare $ — $ 11.0 Industrial — 14.2 Total Revenue $ — $ 25.2 Total Revenue (Excl. Divest.): Healthcare $ 64.3 $ 61.5 4.6 % Industrial 68.7 59.4 15.7 % Total Revenue (Excl. Divest.): $ 133.0 $ 120.9 10.0 %