
DY 8-K
Dycom Industries Inc (DY)
8-K
2020-08-26
For: 2020-08-26
View Original
Added on
July 07, 2026
UNITED STATES
SECURITIES AND EXCHANGE COMMISSION
Washington, D.C. 20549
FORM 8-K
CURRENT REPORT
PURSUANT TO SECTION 13 OR 15(d) OF THE SECURITIES EXCHANGE ACT OF 1934
Date of Report (Date of earliest event reported): August 26, 2020
(Exact name of Registrant as specified in its charter)
| (State or other jurisdiction of incorporation) | (Commission file number) | (I.R.S. employer identification no.) | ||||||||||||||||||
| (Address of principal executive offices) (Zip Code) | ||||||||||||||||||||
Registrant’s telephone number, including area code: (561 ) 627-7171
Check the appropriate box below if the Form 8-K filing is intended to simultaneously satisfy the filing obligation of the registrant under any of the following provisions:
Securities registered pursuant to Section 12(b) of the Act:
| Title of Each Class | Trading Symbol(s) | Name of Each Exchange on Which Registered | ||||||||||||
Indicate by check mark whether the registrant is an emerging growth company as defined in as defined in Rule 405 of the Securities Act of 1933 (§230.405 of this chapter) or Rule 12b-2 of the Securities Exchange Act of 1934 (§240.12b-2 of this chapter).
If an emerging growth company, indicate by check mark if the registrant has elected not to use the extended transition period for complying with any new or revised financial accounting standards provided pursuant to Section 13(a) of the Exchange Act. ¨
Item 2.02 Results of Operations and Financial Condition.
On August 26, 2020, Dycom Industries, Inc. (the “Company”) issued a press release reporting fiscal 2021 second quarter results. The Company also provided forward guidance. Additionally, on August 26, 2020, the Company made available related materials to be discussed during the Company’s webcast and conference call referred to in such press release. A copy of the press release and related conference call materials are furnished as Exhibits 99.1, 99.2, and 99.3, respectively, to this Current Report on Form 8-K and are incorporated into Item 2.02 of this Current Report on Form 8-K by reference.
The information in the preceding paragraphs, as well as Exhibits 99.1, 99.2, and 99.3, shall not be deemed “filed” for purposes of Section 18 of the Securities Exchange Act of 1934 (the “Exchange Act”), or otherwise subject to the liabilities of that section. It may only be incorporated by reference into another filing under the Exchange Act or the Securities Act of 1933 (the “Securities Act”) if such subsequent filing specifically references this Current Report on Form 8-K.
Forward Looking Statements
This Current Report on Form 8-K, including the press release and related slide presentation and non-GAAP reconciliations that are furnished as exhibits to this Current Report on Form 8-K, contain forward-looking statements as contemplated by the 1995 Private Securities Litigation Reform Act. Forward-looking statements are based on management’s current expectations, estimates and projections. These statements are subject to risks and uncertainties that may cause actual results for completed periods and periods in the future to differ materially from the results projected or implied in any forward-looking statements contained in this Current Report on Form 8-K. The most significant of these risks and uncertainties are described in the Company’s Form 10-K, Form 10-Q and Form 8-K reports (including all amendments to those reports) and include the impact of the COVID-19 pandemic on our business operating results, cash flows and/or financial condition and the impacts of the measures we have taken in response to the COVID-19 pandemic, business and economic conditions and trends in the telecommunications industry affecting the Company’s customers, fluctuations in customer capital budgets and spending priorities, the adequacy of the Company’s insurance and other reserves and allowances for doubtful “accounts, whether the carrying value of the Company’s assets may be impaired, preliminary purchase price allocations of acquired businesses, expected benefits and synergies of acquisitions, the future impact of any acquisitions or dispositions, adjustments and cancellations related to the Company’s backlog, weather conditions, the anticipated outcome of other contingent events, including litigation, liquidity and other financial needs, the availability of financing, and the other risks and uncertainties detailed from time to time in our filings with the Securities and Exchange Commission. These filings are available on a web site maintained by the Securities and Exchange Commission at http://www.sec.gov. The Company does not undertake to update forward-looking statements except as required by law.
Item 9.01 Financial Statement and Exhibits.
(d)Exhibits
| 104 | Cover Page Interactive Data File (embedded within the Inline XBRL document) | ||||
SIGNATURES
Pursuant to the requirements of the Securities Exchange Act of 1934, the Registrant has duly caused this report to be signed on its behalf by the undersigned thereunto duly authorized.
Dated: August 26, 2020
| DYCOM INDUSTRIES, INC. (Registrant) | |||||
| By: | /s/ Ryan F. Urness | ||||
| Name: | Ryan F. Urness | ||||
| Title: | Vice President, General Counsel and Corporate Secretary | ||||
Exhibit 99.1

N E W S R E L E A S E
| FOR IMMEDIATE RELEASE | Contact: | Steven E. Nielsen, President and CEO H. Andrew DeFerrari, Senior Vice President and CFO Callie A. Tomasso, Investor Relations (561) 627-7171 | ||||||
August 26, 2020
DYCOM INDUSTRIES, INC. ANNOUNCES FISCAL 2021 SECOND QUARTER RESULTS
Palm Beach Gardens, Florida, August 26, 2020 - Dycom Industries, Inc. (NYSE: DY) announced today its results for the second quarter and six months ended July 25, 2020.
Second Quarter Fiscal 2021 Highlights
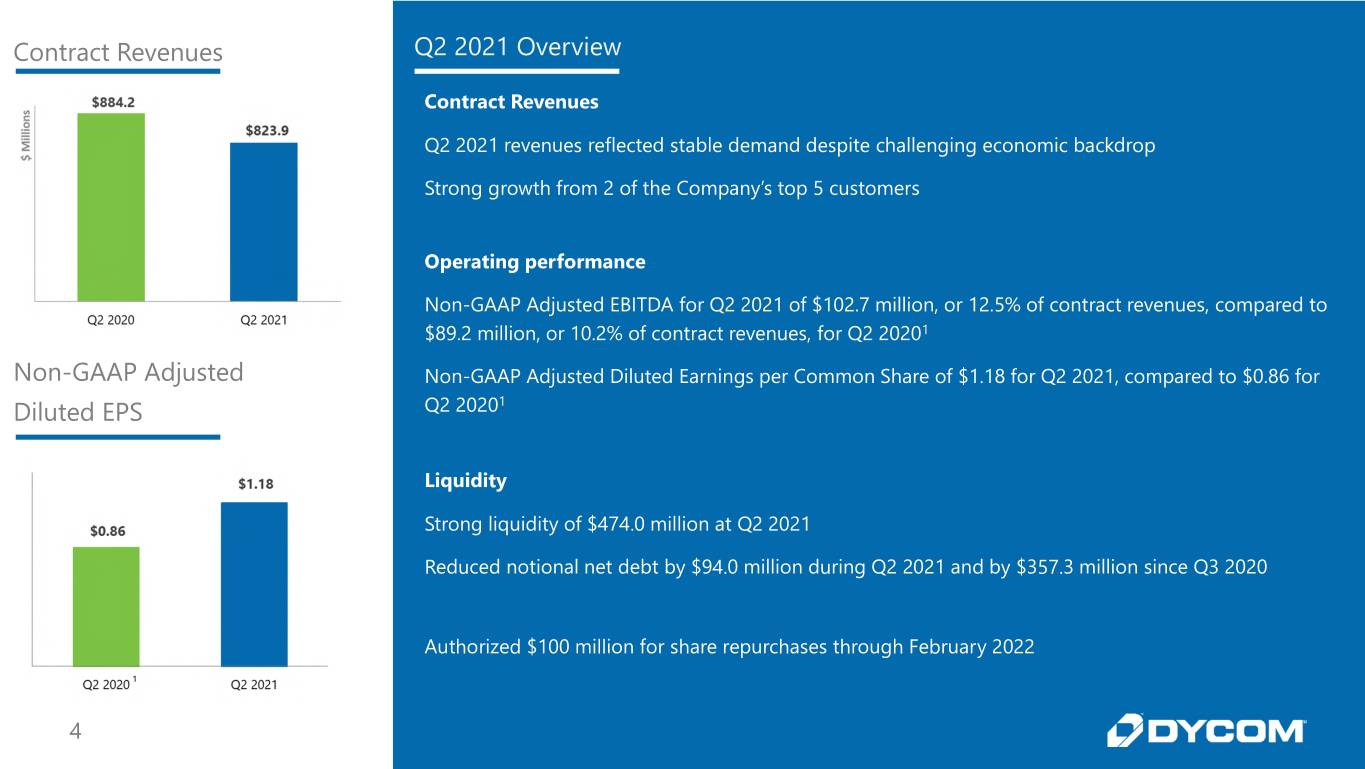
•Contract revenues of $823.9 million for the quarter ended July 25, 2020, compared to $884.2 million for the quarter ended July 27, 2019, a decrease of 6.8% on an organic basis.
•Non-GAAP Adjusted EBITDA of $102.7 million, or 12.5% of contract revenues, for the quarter ended July 25, 2020, compared to $89.2 million, or 10.2% of contract revenues, for the quarter ended July 27, 2019. Non-GAAP Adjusted EBITDA for the quarter ended July 27, 2019 excludes $11.0 million of income before taxes reflecting the net benefit of a contract modification that increased revenues for services performed in prior periods, resulting in increased performance-based compensation.
•On a GAAP basis, net income was $37.0 million, or $1.15 per common share diluted, for the quarter ended July 25, 2020, compared to $29.9 million, or $0.94 per common share diluted, for the quarter ended July 27, 2019. Non-GAAP Adjusted Net Income was $38.0 million, or $1.18 per common share diluted, for the quarter ended July 25, 2020, compared to $27.4 million, or $0.86 per common share diluted for the quarter ended July 27, 2019. Non-GAAP Adjusted Net Income for the quarter ended July 27, 2019 excludes net income of $7.3 million, or $0.23 per common share diluted, reflecting the after-tax net benefit of a contract modification that increased revenues for services performed in prior periods, resulting in increased performance-based compensation.
•During the quarter ended July 25, 2020, the Company purchased $234.7 million aggregate principal amount of 0.75% convertible senior notes due September 2021 (the “Notes”) for $224.4 million, including interest and fees. As a result, net income on a GAAP basis for the quarter ended July 25, 2020 includes a pre-tax loss of approximately $0.5 million.
•Notional net debt was reduced by $94.0 million during the quarter. As of July 25, 2020, the Company had cash and equivalents of $22.5 million, borrowings on its revolving line of credit of $200.0 million, $433.1 million of term loans outstanding and $58.3 million aggregate principal amount of Notes outstanding.
Year-to-Date Fiscal 2021 Highlights
•Contract revenues of $1.638 billion for the six months ended July 25, 2020, compared to $1.718 billion for the six months ended July 27, 2019. Contract revenues for the six months ended July 25, 2020 decreased 4.4% on an organic basis after excluding $4.7 million in contract revenues from storm restoration services for the six months ended July 27, 2019.
•Non-GAAP Adjusted EBITDA of $172.5 million, or 10.5% of contract revenues, for the six months ended July 25, 2020, compared to $162.9 million, or 9.5% of contract revenues, for the six months ended July 27, 2019. Non-GAAP Adjusted EBITDA for the six months ended July 27, 2019 excludes $11.0 million of income before taxes reflecting the net benefit of a contract modification that increased revenues for services performed in prior periods, resulting in increased performance-based compensation.

•On a GAAP basis, net income was $4.6 million, or $0.14 per common share diluted, for the six months ended July 25, 2020, compared to $44.2 million, or $1.39 per common share diluted, for the six months ended July 27, 2019. Non-GAAP Adjusted Net Income was $49.4 million, or $1.55 per common share diluted, for the six months ended July 25, 2020, compared to $44.3 million, or $1.39 per common share diluted, for the six months ended July 27, 2019. Non-GAAP Adjusted Net Income for the six months ended July 27, 2019 excludes net income of $7.3 million, or $0.23 per common share diluted, reflecting the after-tax net benefit of a contract modification that increased revenues for services performed in prior periods, resulting in increased performance-based compensation.
Net income on a GAAP basis for the six months ended July 25, 2020 includes a pre-tax goodwill impairment charge of $53.3 million recognized during the first quarter for a reporting unit that generated revenue of less than 4% of Dycom’s consolidated revenue and did not incur losses in fiscal 2020.
•During the six months ended July 25, 2020, the Company purchased $401.7 million aggregate principal amount of 0.75% convertible senior notes due September 2021 for $371.4 million, including interest and fees. As a result, net income on a GAAP basis for the six months ended July 25, 2020 includes a pre-tax gain of approximately $12.0 million.
Outlook
The Company continues to closely monitor the impact of the COVID-19 pandemic on all aspects of its business. Based on current conditions, the Company anticipates contract revenues and margins to range from in-line to modestly lower on a sequential basis for the quarter ending October 24, 2020, as compared to the quarter ended July 25, 2020. The Company believes the impact of the COVID-19 pandemic on its operating results, cash flows and financial condition is uncertain, unpredictable and may be outside of its control.
Use of Non-GAAP Financial Measures
The Company reports its financial results in accordance with U.S. generally accepted accounting principles (GAAP). In quarterly results releases, trend schedules, conference calls, slide presentations, and webcasts, the Company may use or discuss Non-GAAP financial measures, as defined by Regulation G of the Securities and Exchange Commission. See Reconciliation of Non-GAAP Financial Measures to Comparable GAAP Financial Measures in the press release tables that follow.
Conference Call Information and Other Selected Data
The Company will host a conference call to discuss fiscal 2021 second quarter results on Wednesday, August 26, 2020 at 9:00 a.m. Eastern time. A live webcast of the conference call and related materials will be available on the Company’s Investor Center website at https://ir.dycomind.com. Parties interested in participating via telephone should dial (833) 519-1313 (United States) or (914) 800-3879 (International) with the conference ID 1448697, ten minutes before the conference call begins. For those who cannot participate at the scheduled time, a replay of the live webcast and the related materials will be available at https://ir.dycomind.com until Friday, September 25, 2020.
About Dycom Industries, Inc.
Dycom is a leading provider of specialty contracting services throughout the United States. These services include program management; planning; engineering and design; aerial, underground, and wireless construction; maintenance; and fulfillment services for telecommunications providers. Additionally, Dycom provides underground facility locating services for various utilities, including telecommunications providers, and other construction and maintenance services for electric and gas utilities.
Forward Looking Information
This press release contains forward-looking statements as contemplated by the 1995 Private Securities Litigation Reform Act. These
statements include those related to the outlook for the quarter ending October 24, 2020 found under the “Outlook” section of this release. These statements are subject to change. Forward looking statements are based on management’s current expectations, estimates and projections. These statements are subject to risks and uncertainties that may cause actual results for completed periods and periods in the future to differ materially from the results projected or implied in any forward-looking statements contained in this press release. The most significant of these risks and uncertainties are described in the Company’s Form 10-K, Form 10-Q, and Form 8-K reports (including all amendments to those reports) and include the projected impact of COVID-19 on the Company’s business operating results, cash flows and/or financial condition and the impacts of the measures the Company has taken in response to COVID-19, the Company’s ability to effectively execute its business and capital plans, business and economic conditions and trends in the telecommunications industry affecting the Company’s customers, customer capital budgets and spending priorities, the
2
adequacy of the Company’s insurance and other reserves and allowances for doubtful accounts, whether the carrying value of the Company’s assets may be impaired, preliminary purchase price allocations of acquired businesses, expected benefits and synergies of acquisitions, the future impact of any acquisitions or dispositions, adjustments and cancellations of the Company’s projects, the related impact to the Company’s backlog from project cancellations, weather conditions, the anticipated outcome of other contingent events, including litigation, liquidity and other financial needs, the availability of financing, the Company’s ability to generate sufficient cash to service its indebtedness, restrictions imposed by the Company’s credit agreement, and the other risks and uncertainties detailed from time to time in the Company’s filings with the Securities and Exchange Commission. The Company does not undertake any obligation to update forward-looking statements.
---Tables Follow---
3
| DYCOM INDUSTRIES, INC. AND SUBSIDIARIES | |||||||||||
| CONDENSED CONSOLIDATED BALANCE SHEETS | |||||||||||
| (Dollars in thousands) | |||||||||||
| Unaudited | |||||||||||
| July 25, 2020 | January 25, 2020 | ||||||||||
| ASSETS | |||||||||||
| Current assets: | |||||||||||
| Cash and equivalents | $ | 22,535 | $ | 54,560 | |||||||
| Accounts receivable, net | 897,833 | 817,245 | |||||||||
| Contract assets | 257,893 | 253,005 | |||||||||
| Inventories | 77,754 | 98,324 | |||||||||
| Income tax receivable | 780 | 3,168 | |||||||||
| Other current assets | 49,840 | 31,991 | |||||||||
| Total current assets | 1,306,635 | 1,258,293 | |||||||||
| Property and equipment, net | 315,604 | 376,610 | |||||||||
| Operating lease right-of-use assets | 69,940 | 69,596 | |||||||||
| Goodwill and other intangible assets, net | 402,011 | 465,694 | |||||||||
| Other | 50,497 | 47,438 | |||||||||
| Total non-current assets | 838,052 | 959,338 | |||||||||
| Total assets | $ | 2,144,687 | $ | 2,217,631 | |||||||
| LIABILITIES AND STOCKHOLDERS’ EQUITY | |||||||||||
| Current liabilities: | |||||||||||
| Accounts payable | $ | 177,275 | $ | 119,612 | |||||||
| Current portion of debt | 22,500 | 22,500 | |||||||||
| Contract liabilities | 18,829 | 16,332 | |||||||||
| Accrued insurance claims | 43,702 | 38,881 | |||||||||
| Operating lease liabilities | 27,171 | 26,581 | |||||||||
| Income taxes payable | 13,020 | 344 | |||||||||
| Other accrued liabilities | 108,827 | 98,775 | |||||||||
| Total current liabilities | 411,324 | 323,025 | |||||||||
| Long-term debt | 665,533 | 844,401 | |||||||||
| Accrued insurance claims - non-current | 67,303 | 56,026 | |||||||||
| Operating lease liabilities - non-current | 43,418 | 43,606 | |||||||||
| Deferred tax liabilities, net - non-current | 59,945 | 75,527 | |||||||||
| Other liabilities | 23,416 | 6,442 | |||||||||
| Total liabilities | 1,270,939 | 1,349,027 | |||||||||
| Total stockholders’ equity | 873,748 | 868,604 | |||||||||
| Total liabilities and stockholders’ equity | $ | 2,144,687 | $ | 2,217,631 | |||||||
4
| DYCOM INDUSTRIES, INC. AND SUBSIDIARIES | |||||||||||||||||||||||
| CONDENSED CONSOLIDATED STATEMENTS OF OPERATIONS | |||||||||||||||||||||||
| (Dollars in thousands, except share amounts) | |||||||||||||||||||||||
| Unaudited | |||||||||||||||||||||||
| Quarter | Quarter | Six Months | Six Months | ||||||||||||||||||||
| Ended | Ended | Ended | Ended | ||||||||||||||||||||
| July 25, 2020 | July 27, 2019 | July 25, 2020 | July 27, 2019 | ||||||||||||||||||||
| Contract revenues | $ | 823,921 | $ | 884,221 | $ | 1,638,244 | $ | 1,717,964 | |||||||||||||||
Costs of earned revenues, excluding depreciation and amortization1 | 657,953 | 720,382 | 1,338,159 | 1,422,150 | |||||||||||||||||||
General and administrative2,3 | 67,357 | 65,117 | 133,243 | 123,738 | |||||||||||||||||||
| Depreciation and amortization | 44,129 | 47,244 | 90,001 | 93,586 | |||||||||||||||||||
Goodwill impairment charge4 | — | — | 53,264 | — | |||||||||||||||||||
| Total | 769,439 | 832,743 | 1,614,667 | 1,639,474 | |||||||||||||||||||
Interest expense, net5 | (7,853) | (12,878) | (20,310) | (25,111) | |||||||||||||||||||
(Loss) gain on debt extinguishment6 | (458) | — | 12,046 | — | |||||||||||||||||||
| Other income, net | 3,097 | 4,006 | 4,214 | 9,705 | |||||||||||||||||||
| Income before income taxes | 49,268 | 42,606 | 19,527 | 63,084 | |||||||||||||||||||
Provision for income taxes7 | 12,244 | 12,710 | 14,921 | 18,909 | |||||||||||||||||||
| Net income | $ | 37,024 | $ | 29,896 | $ | 4,606 | $ | 44,175 | |||||||||||||||
| Earnings per common share: | |||||||||||||||||||||||
| Basic earnings per common share | $ | 1.17 | $ | 0.95 | $ | 0.15 | $ | 1.40 | |||||||||||||||
| Diluted earnings per common share | $ | 1.15 | $ | 0.94 | $ | 0.14 | $ | 1.39 | |||||||||||||||
| Shares used in computing earnings per common share: | |||||||||||||||||||||||
| Basic | 31,750,547 | 31,487,011 | 31,677,012 | 31,469,401 | |||||||||||||||||||
| Diluted | 32,128,098 | 31,820,296 | 31,947,346 | 31,803,368 | |||||||||||||||||||
5
| DYCOM INDUSTRIES, INC. AND SUBSIDIARIES | |||||||||||||||||||||||||||||
| RECONCILIATION OF NON-GAAP FINANCIAL MEASURES TO COMPARABLE GAAP FINANCIAL MEASURES | |||||||||||||||||||||||||||||
| (Dollars in thousands) | |||||||||||||||||||||||||||||
| Unaudited | |||||||||||||||||||||||||||||
| CONTRACT REVENUES, NON-GAAP ORGANIC CONTRACT REVENUES, AND DECLINE %’s | |||||||||||||||||||||||||||||
| Contract Revenues - GAAP | Revenues from storm restoration services | Non-GAAP - Organic Contract Revenues | GAAP - Decline % | Non-GAAP - Organic Decline % | |||||||||||||||||||||||||
| Quarter Ended July 25, 2020 | $ | 823,921 | $ | — | $ | 823,921 | (6.8) | % | (6.8) | % | |||||||||||||||||||
| Quarter Ended July 27, 2019 | $ | 884,221 | $ | — | $ | 884,221 | |||||||||||||||||||||||
| Six Months Ended July 25, 2020 | $ | 1,638,244 | $ | — | $ | 1,638,244 | (4.6) | % | (4.4) | % | |||||||||||||||||||
| Six Months Ended July 27, 2019 | $ | 1,717,964 | $ | (4,716) | $ | 1,713,248 | |||||||||||||||||||||||
| NET INCOME AND NON-GAAP ADJUSTED EBITDA | |||||||||||||||||||||||
| Quarter | Quarter | Six Months | Six Months | ||||||||||||||||||||
| Ended | Ended | Ended | Ended | ||||||||||||||||||||
| July 25, 2020 | July 27, 2019 | July 25, 2020 | July 27, 2019 | ||||||||||||||||||||
| Reconciliation of net income to Non-GAAP Adjusted EBITDA: | |||||||||||||||||||||||
| Net income | $ | 37,024 | $ | 29,896 | $ | 4,606 | $ | 44,175 | |||||||||||||||
| Interest expense, net | 7,853 | 12,878 | 20,310 | 25,111 | |||||||||||||||||||
| Provision for income taxes | 12,244 | 12,710 | 14,921 | 18,909 | |||||||||||||||||||
| Depreciation and amortization | 44,129 | 47,244 | 90,001 | 93,586 | |||||||||||||||||||
| Earnings Before Interest, Taxes, Depreciation & Amortization (“EBITDA”) | 101,250 | 102,728 | 129,838 | 181,781 | |||||||||||||||||||
| Gain on sale of fixed assets | (3,418) | (4,806) | (5,206) | (11,544) | |||||||||||||||||||
| Stock-based compensation expense | 4,373 | 2,277 | 6,694 | 5,756 | |||||||||||||||||||
Goodwill impairment charge4 | — | — | 53,264 | — | |||||||||||||||||||
Loss (gain) on debt extinguishment6 | 458 | — | (12,046) | — | |||||||||||||||||||
Charge for warranty costs1 | — | — | — | 8,200 | |||||||||||||||||||
Recovery of previously reserved accounts receivable and contract assets3 | — | — | — | (10,345) | |||||||||||||||||||
| Non-GAAP Adjusted EBITDA | $ | 102,663 | $ | 100,199 | $ | 172,544 | $ | 173,848 | |||||||||||||||
| Non-GAAP Adjusted EBITDA % of contract revenues | 12.5 | % | 11.3 | % | 10.5 | % | 10.1 | % | |||||||||||||||
Non-GAAP Adjusted EBITDA, excluding contract modification8 | $ | 89,239 | $ | 162,888 | |||||||||||||||||||
Non-GAAP Adjusted EBITDA, excluding contract modification % of contract revenues8 | 10.2 | % | 9.5 | % | |||||||||||||||||||
6
| DYCOM INDUSTRIES, INC. AND SUBSIDIARIES | |||||||||||||||||||||||
| RECONCILIATION OF NON-GAAP FINANCIAL MEASURES TO COMPARABLE GAAP FINANCIAL MEASURES (CONTINUED) | |||||||||||||||||||||||
| (Dollars in thousands, except share amounts) | |||||||||||||||||||||||
| Unaudited | |||||||||||||||||||||||
| NET INCOME, NON-GAAP ADJUSTED NET INCOME, DILUTED EARNINGS PER COMMON SHARE, AND NON-GAAP ADJUSTED DILUTED EARNINGS PER COMMON SHARE | |||||||||||||||||||||||
| Quarter | Quarter | Six Months | Six Months | ||||||||||||||||||||
| Ended | Ended | Ended | Ended | ||||||||||||||||||||
| July 25, 2020 | July 27, 2019 | July 25, 2020 | July 27, 2019 | ||||||||||||||||||||
| Reconciliation of net income to Non-GAAP Adjusted Net Income: | |||||||||||||||||||||||
| Net income | $ | 37,024 | $ | 29,896 | $ | 4,606 | $ | 44,175 | |||||||||||||||
| Pre-Tax Adjustments: | |||||||||||||||||||||||
| Non-cash amortization of debt discount on Notes | 1,748 | 5,015 | 6,089 | 9,947 | |||||||||||||||||||
Loss (gain) on debt extinguishment6 | 458 | — | (12,046) | — | |||||||||||||||||||
Goodwill impairment charge4 | — | — | 53,264 | — | |||||||||||||||||||
Charge for warranty costs1 | — | — | — | 8,200 | |||||||||||||||||||
Recovery of previously reserved accounts receivable and contract assets3 | — | — | — | (10,345) | |||||||||||||||||||
| Tax Adjustments: | |||||||||||||||||||||||
| Tax impact of the vesting and exercise of share-based awards | (658) | — | (208) | 638 | |||||||||||||||||||
Tax effect from net operating loss carryback under enacted CARES Act7 | — | — | (2,631) | — | |||||||||||||||||||
| Tax impact related to previous tax year filing | — | 1,092 | — | 1,092 | |||||||||||||||||||
| Tax impact of pre-tax adjustments | (607) | (1,379) | 289 | (2,145) | |||||||||||||||||||
| Total adjustments, net of tax | 941 | 4,728 | 44,757 | 7,387 | |||||||||||||||||||
| Non-GAAP Adjusted Net Income | $ | 37,965 | $ | 34,624 | $ | 49,363 | $ | 51,562 | |||||||||||||||
Non-GAAP Adjusted Net Income, excluding contract modification8 | $ | 27,373 | $ | 44,311 | |||||||||||||||||||
| Reconciliation of diluted earnings per common share to Non-GAAP Adjusted Diluted Earnings per Common Share: | |||||||||||||||||||||||
| GAAP diluted earnings per common share | $ | 1.15 | $ | 0.94 | $ | 0.14 | $ | 1.39 | |||||||||||||||
| Total adjustments, net of tax | 0.03 | 0.15 | 1.40 | 0.23 | |||||||||||||||||||
| Non-GAAP Adjusted Diluted Earnings per Common Share | $ | 1.18 | $ | 1.09 | $ | 1.55 | $ | 1.62 | |||||||||||||||
Non-GAAP Adjusted Diluted Earnings per Common Share, excluding contract modification8 | $ | 0.86 | $ | 1.39 | |||||||||||||||||||
| Shares used in computing Non-GAAP Adjusted Diluted Earnings per Common Share | 32,128,098 | 31,820,296 | 31,947,346 | 31,803,368 | |||||||||||||||||||
| Amounts in table above may not add due to rounding. | |||||||||||||||||||||||
7
DYCOM INDUSTRIES, INC. AND SUBSIDIARIES
RECONCILIATION OF NON-GAAP FINANCIAL MEASURES
TO COMPARABLE GAAP FINANCIAL MEASURES (CONTINUED)
Explanation of Non-GAAP Financial Measures
The Company reports its financial results in accordance with U.S. generally accepted accounting principles (GAAP). In the Company’s quarterly results releases, trend schedules, conference calls, slide presentations, and webcasts, it may use or discuss Non-GAAP financial measures, as defined by Regulation G of the Securities and Exchange Commission. The Company believes that the presentation of certain Non-GAAP financial measures in these materials provides information that is useful to investors because it allows for a more direct comparison of the Company’s performance for the period reported with the Company’s performance in prior periods. The Company cautions that Non-GAAP financial measures should be considered in addition to, but not as a substitute for, the Company’s reported GAAP results. Management defines the Non-GAAP financial measures used as follows:
•Non-GAAP Organic Contract Revenues - contract revenues from businesses that are included for the entire period in both the current and prior year periods, excluding contract revenues from storm restoration services. Non-GAAP Organic Contract Revenue (decline) growth is calculated as the percentage change in Non-GAAP Organic Contract Revenues over those of the comparable prior year periods. Management believes organic (decline) growth is a helpful measure for comparing the Company’s revenue performance with prior periods.
•Non-GAAP Adjusted EBITDA - net income before interest, taxes, depreciation and amortization, gain on sale of fixed assets, stock-based compensation expense, and certain non-recurring items. Management believes Non-GAAP Adjusted EBITDA is a helpful measure for comparing the Company’s operating performance with prior periods as well as with the performance of other companies with different capital structures or tax rates.
•Non-GAAP Adjusted Net Income - GAAP net income before the non-cash amortization of the debt discount and the related tax impact, certain tax impacts resulting from vesting and exercise of share-based awards, and certain non-recurring items. Management believes Non-GAAP Adjusted Net Income is a helpful measure for comparing the Company’s operating performance with prior periods.
•Non-GAAP Adjusted Diluted Earnings per Common Share - Non-GAAP Adjusted Net Income divided by weighted average diluted shares outstanding.
•Notional Net Debt - Notional net debt is a Non-GAAP financial measure that is calculated by subtracting cash and equivalents from the aggregate face amount of outstanding long-term debt. Management believes notional net debt is a helpful measure to assess the Company’s liquidity.
Management excludes or adjusts each of the items identified below from Non-GAAP Adjusted Net Income and Non-GAAP Adjusted Diluted Earnings per Common Share:
•Non-cash amortization of debt discount on Notes - The Company’s Notes were allocated between debt and equity components. The difference between the principal amount and the carrying amount of the liability component of the Notes represents a debt discount. The debt discount is being amortized over the term of the Notes but does not result in periodic cash interest payments. The Company excludes the non-cash amortization of the debt discount from its Non-GAAP financial measures because it believes it is useful to analyze the component of interest expense for the Notes that will be paid in cash. The exclusion of the non-cash amortization from the Company’s Non-GAAP financial measures provides management with a consistent measure for assessing financial results.
•Goodwill impairment charge - The Company incurred a goodwill impairment charge of $53.3 million for a reporting unit that performs installation services inside third party premises. Management believes excluding the goodwill impairment charge from the Company’s Non-GAAP financial measures assists investors’ overall understanding of the Company’s current financial performance and provides management with a consistent measure for assessing the current and historical financial results.
•(Loss) gain on debt extinguishment - During the quarter ended July 25, 2020, the Company incurred a loss on debt extinguishment of $0.5 million in connection with its purchase of $234.7 million aggregate principal amount of 0.75% convertible senior notes due September 2021 for $224.4 million, including interest and fees. Additionally, during the quarter ended April 25, 2020, the Company recognized a gain on debt extinguishment of $12.5 million in connection with its purchase of $167.0 million aggregate principal amount of 0.75% convertible senior notes due September 2021 for $147.0 million, including interest and fees. Management believes excluding the (loss) gain on debt extinguishment from the Company’s Non-GAAP financial measures
8
assists investors’ overall understanding of the Company’s current financial performance and provides management with a consistent measure for assessing the current and historical financial results.
•Charge for warranty costs - During the six month ended July 27, 2019, the Company recorded an $8.2 million pre-tax charge in the first quarter for estimated warranty costs for work performed for a customer in prior periods. The Company excludes the impact of this charge from its Non-GAAP financial measures because the Company believes it is not indicative of its underlying results in the current period.
•Recovery of previously reserved accounts receivable and contract assets - During the six months ended July 27, 2019, the Company recognized $10.3 million of pre-tax income from the recovery of previously reserved accounts receivable and contract assets in the first quarter based on collections from a customer. The Company excludes the impact of this recovery from its Non-GAAP financial measures because the Company believes it is not indicative of its underlying results.
•Tax impact of the vesting and exercise of share-based awards - The Company excludes certain tax impacts resulting from the vesting and exercise of share-based awards as these amounts may vary significantly from period to period. Excluding these amounts from the Company’s Non-GAAP financial measures provides management with a more consistent measure for assessing financial results.
•Tax effect from a net operating loss carryback under enacted CARES Act - For the six months ended July 25, 2020, the Company recognized an income tax benefit of $2.6 million during the first quarter from a net operating loss carryback under the enacted U.S. Coronavirus Aid, Relief, and Economic Security (“CARES”) Act. The Company excludes this impact because the Company believes it is not indicative of the Company’s underlying results or ongoing operations.
•Tax impact of previous tax year filing - During the quarter and six months ended July 27, 2019, the Company recognized an income tax expense of $1.1 million on a previous tax year filing. The Company excludes this impact because the Company believes it is not indicative of the Company’s underlying results or ongoing operations.
•Tax impact of pre-tax adjustments - The tax impact of pre-tax adjustments reflects the Company’s estimated tax impact of specific adjustments and the effective tax rate used for financial planning for the applicable period.
9
Notes
1 During the six months ended July 27, 2019, the Company recorded an $8.2 million pre-tax charge in the first quarter for estimated warranty costs for work performed for a customer in prior periods.
2 Includes stock-based compensation expense of $4.4 million and $2.3 million for the quarters ended July 25, 2020 and July 27, 2019, respectively, and $6.7 million and $5.8 million for the six months ended July 25, 2020 and July 27, 2019, respectively.
3 During the six months ended July 27, 2019, the Company recognized $10.3 million of pre-tax income from the recovery of previously reserved accounts receivable and contract assets in the first quarter based on collections from a customer.
4 The Company incurred a goodwill impairment charge of $53.3 million during the six months ended July 25, 2020 for a reporting unit that performs installation services inside third party premises.
5 Includes pre-tax interest expense for non-cash amortization of the debt discount associated with the Notes of $1.7 million and $5.0 million for the quarters ended July 25, 2020 and July 27, 2019, respectively, and $6.1 million and $9.9 million for the six months ended July 25, 2020 and July 27, 2019, respectively.
6 During the quarter ended July 25, 2020, the Company purchased $234.7 million aggregate principal amount of its Notes for $224.4 million, including interest and fees. The purchase price was allocated between the debt and equity components of the Notes. Based on the net carrying amount of the Notes, the Company recognized a net loss on debt extinguishment of $0.5 million after the write-off of associated debt issuance costs. The Company also recognized the equity component of the settlement of the Notes.
During the quarter ended April 25, 2020, the Company purchased $167.0 million aggregate principal amount of its Notes for $147.0 million, including interest and fees. The purchase price was allocated between the debt and equity components of the Notes. Based on the net carrying amount of the Notes, the Company recognized a net gain on debt extinguishment of $12.5 million after the write-off of associated debt issuance costs. The Company also recognized the equity component of the settlement of the Notes.
7 For the quarter and six months ended July 25, 2020, the provision for income taxes includes $0.7 million and $0.2 million, respectively, of income tax benefit for the vesting and exercise of share-based awards. Additionally, for the six months ended July 25, 2020, the Company recognized an income tax benefit of $2.6 million during the first quarter from a net operating loss carryback under the enacted CARES Act.
For the six months ended July 27, 2019, the provision for income taxes includes $0.6 million of income tax expense for the vesting and exercise of share-based awards. Additionally, for the quarter and six months ended July 27, 2019, the provision for income taxes includes $1.1 million of income tax expense related to a previous tax year filing.
8 During the quarter ended July 27, 2019, the Company entered into a contract modification that increased revenue produced by a large customer program. As a result, the Company recognized $11.8 million of contract revenues for services performed in prior periods, $0.8 million of related performance-based compensation expense, and $1.0 million of stock-based compensation. On an after-tax basis, these items contributed approximately $7.3 million to net income, or $0.23 per common share diluted, for the quarter and six months ended July 27, 2019. These amounts are excluded from the calculations of Non-GAAP Adjusted EBITDA, Non-GAAP Adjusted Net Income and Non-GAAP Adjusted Diluted Earnings per Common Share for the quarter and six months ended July 27, 2019.
10
Exhibit 99.2 Dycom Q2 2021 Results August 26, 2020
Participants Agenda Steven E. Nielsen • Q2 2021 Overview President & Chief Executive Officer • Industry Update H. Andrew DeFerrari Chief Financial Officer • Financial & Operational Highlights Ryan F. Urness General Counsel • Outlook • Closing Remarks • Q&A 2
Important Information Caution Concerning Forward-Looking Statements This presentation contains forward-looking statements as contemplated by the 1995 Private Securities Litigation Reform Act. These statements include those related to the outlook for the quarter ending October 24, 2020 found within this presentation. These statements are subject to change. Forward looking statements are based on management’s current expectations, estimates and projections. These statements are subject to risks and uncertainties that may cause actual results for completed periods and periods in the future to differ materially from the results projected or implied in any forward-looking statements contained in this presentation. The most significant of these risks and uncertainties are described in the Company’s Form 10-K, Form 10-Q, and Form 8-K reports (including all amendments to those reports) and include the projected impact of COVID-19 on the Company’s business operating results, cash flows and/or financial condition and the impacts of the measures the Company has taken in response to COVID-19, the Company’s ability to effectively execute its business and capital plans, business and economic conditions and trends in the telecommunications industry affecting the Company’s customers, customer capital budgets and spending priorities, the adequacy of the Company’s insurance and other reserves and allowances for doubtful accounts, whether the carrying value of the Company’s assets may be impaired, preliminary purchase price allocations of acquired businesses, expected benefits and synergies of acquisitions, the future impact of any acquisitions or dispositions, adjustments and cancellations of the Company’s projects, the related impact to the Company’s backlog from project cancellations, weather conditions, the anticipated outcome of other contingent events, including litigation, liquidity and other financial needs, the availability of financing, the Company’s ability to generate sufficient cash to service its indebtedness, restrictions imposed by the Company’s credit agreement, and the other risks and uncertainties detailed from time to time in the Company’s filings with the Securities and Exchange Commission. The Company does not undertake any obligation to update forward-looking statements. Non-GAAP Financial Measures This presentation includes certain “Non-GAAP” financial measures as defined by Regulation G of the SEC. As required by the SEC, an explanation of the Non-GAAP financial measures and a reconciliation of those measures to the most directly comparable GAAP financial measures are provided in the Company’s Form 8-K filed with the SEC on August 26, 2020 and on the Company’s Investor Center website at https://ir.dycomind.com. Non-GAAP financial measures should be considered in addition to, but not as a substitute for, the Company’s reported GAAP results. 3
Contract Revenues Q2 2021 Overview Contract Revenues Q2 2021 revenues reflected stable demand despite challenging economic backdrop Strong growth from 2 of the Company’s top 5 customers Operating performance Non-GAAP Adjusted EBITDA for Q2 2021 of $102.7 million, or 12.5% of contract revenues, compared to $89.2 million, or 10.2% of contract revenues, for Q2 20201 Non-GAAP Adjusted Non-GAAP Adjusted Diluted Earnings per Common Share of $1.18 for Q2 2021, compared to $0.86 for Diluted EPS Q2 20201 Liquidity Strong liquidity of $474.0 million at Q2 2021 Reduced notional net debt by $94.0 million during Q2 2021 and by $357.3 million since Q3 2020 Authorized $100 million for share repurchases through February 2022 4
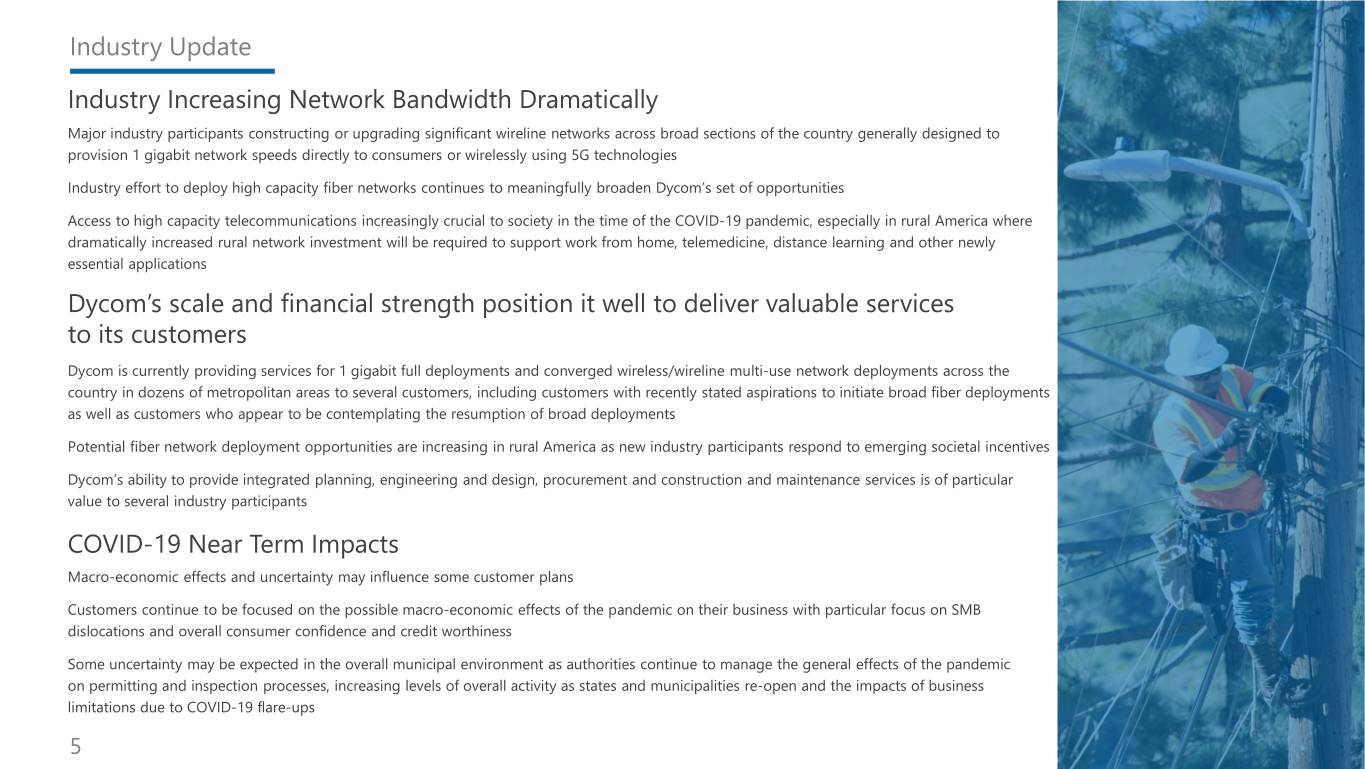
Industry Update Industry Increasing Network Bandwidth Dramatically Major industry participants constructing or upgrading significant wireline networks across broad sections of the country generally designed to provision 1 gigabit network speeds directly to consumers or wirelessly using 5G technologies Industry effort to deploy high capacity fiber networks continues to meaningfully broaden Dycom’s set of opportunities Access to high capacity telecommunications increasingly crucial to society in the time of the COVID-19 pandemic, especially in rural America where dramatically increased rural network investment will be required to support work from home, telemedicine, distance learning and other newly essential applications Dycom’s scale and financial strength position it well to deliver valuable services to its customers Dycom is currently providing services for 1 gigabit full deployments and converged wireless/wireline multi-use network deployments across the country in dozens of metropolitan areas to several customers, including customers with recently stated aspirations to initiate broad fiber deployments as well as customers who appear to be contemplating the resumption of broad deployments Potential fiber network deployment opportunities are increasing in rural America as new industry participants respond to emerging societal incentives Dycom’s ability to provide integrated planning, engineering and design, procurement and construction and maintenance services is of particular value to several industry participants COVID-19 Near Term Impacts Macro-economic effects and uncertainty may influence some customer plans Customers continue to be focused on the possible macro-economic effects of the pandemic on their business with particular focus on SMB dislocations and overall consumer confidence and credit worthiness Some uncertainty may be expected in the overall municipal environment as authorities continue to manage the general effects of the pandemic on permitting and inspection processes, increasing levels of overall activity as states and municipalities re-open and the impacts of business limitations due to COVID-19 flare-ups 5
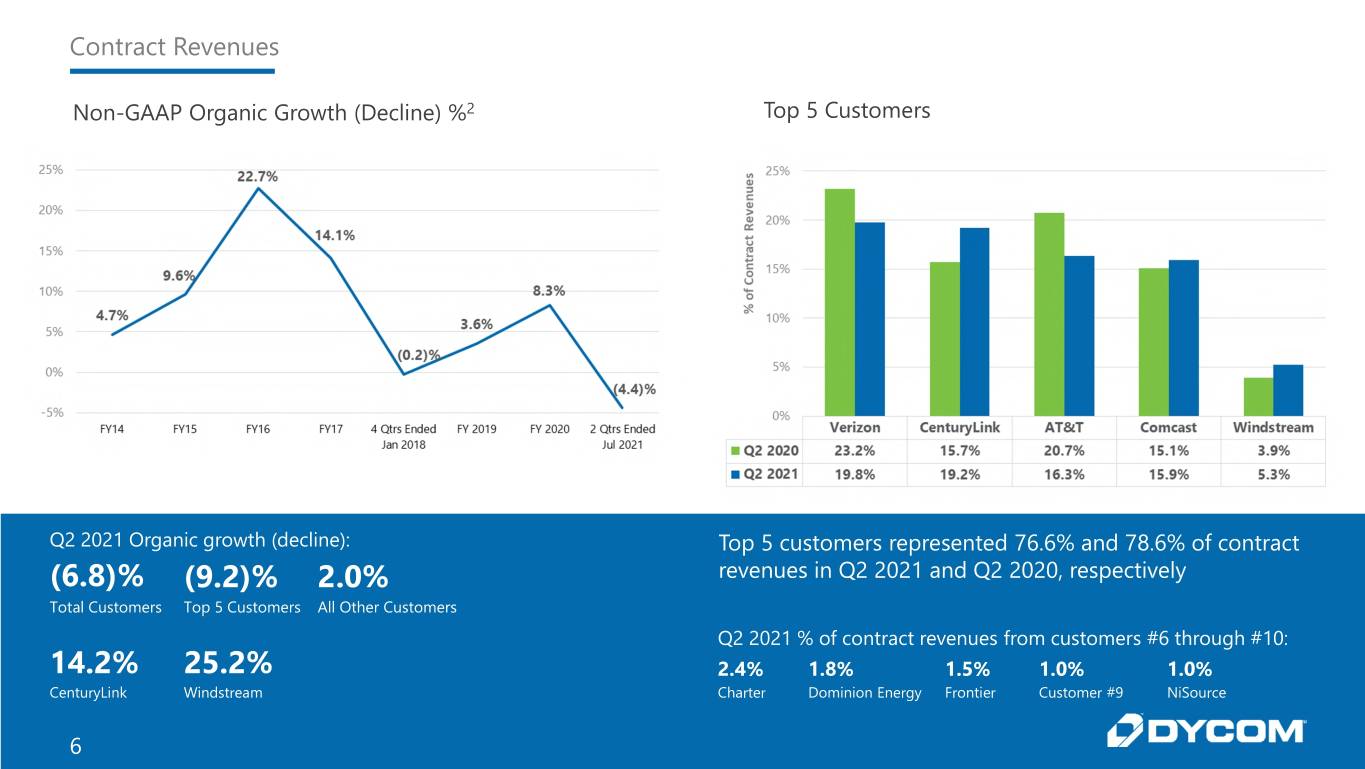
Contract Revenues Non-GAAP Organic Growth (Decline) %2 Top 5 Customers Q2 2021 Organic growth (decline): Top 5 customers represented 76.6% and 78.6% of contract (6.8)% (9.2)% 2.0% revenues in Q2 2021 and Q2 2020, respectively Total Customers Top 5 Customers All Other Customers Q2 2021 % of contract revenues from customers #6 through #10: 14.2% 25.2% 2.4% 1.8% 1.5% 1.0% 1.0% CenturyLink Windstream Charter Dominion Energy Frontier Customer #9 NiSource 6
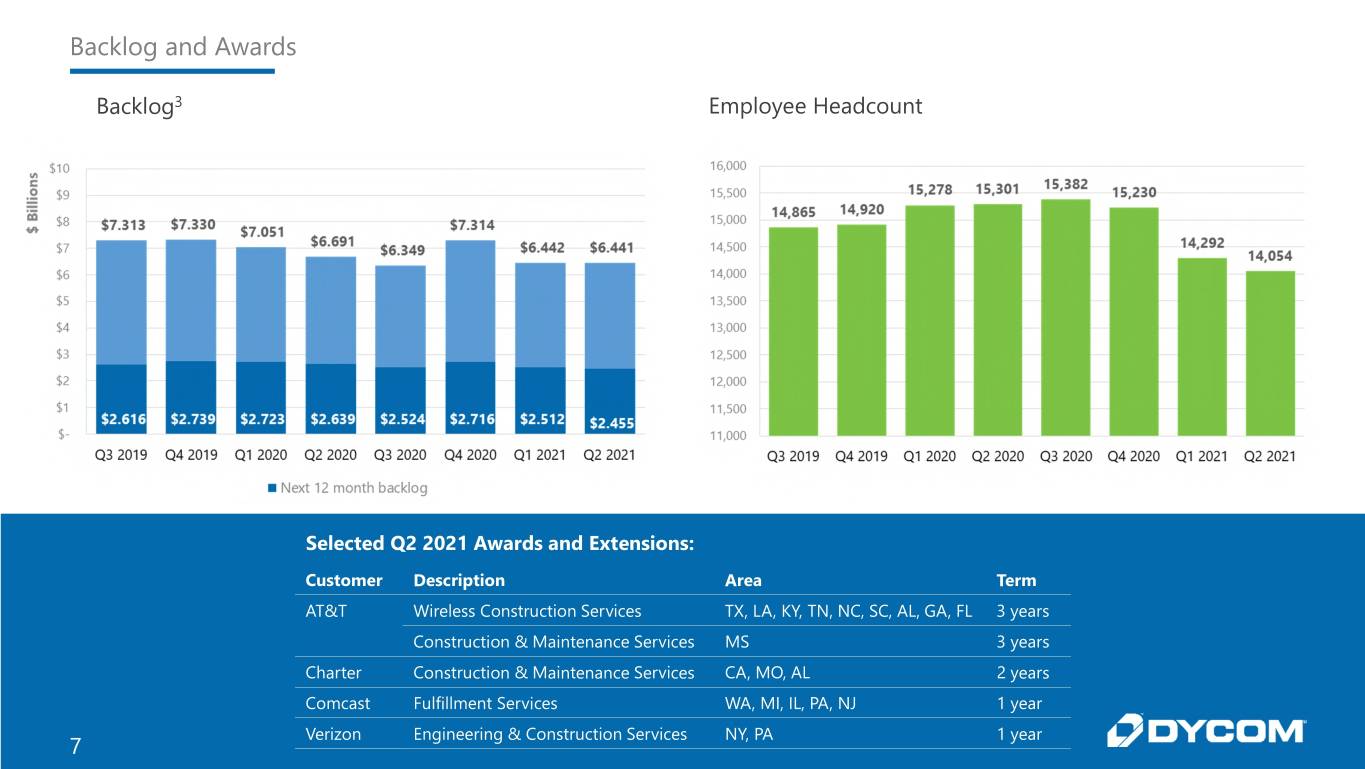
Backlog and Awards Backlog3 Employee Headcount Selected Q2 2021 Awards and Extensions: Customer Description Area Term AT&T Wireless Construction Services TX, LA, KY, TN, NC, SC, AL, GA, FL 3 years Construction & Maintenance Services MS 3 years Charter Construction & Maintenance Services CA, MO, AL 2 years Comcast Fulfillment Services WA, MI, IL, PA, NJ 1 year Verizon Engineering & Construction Services NY, PA 1 year 7
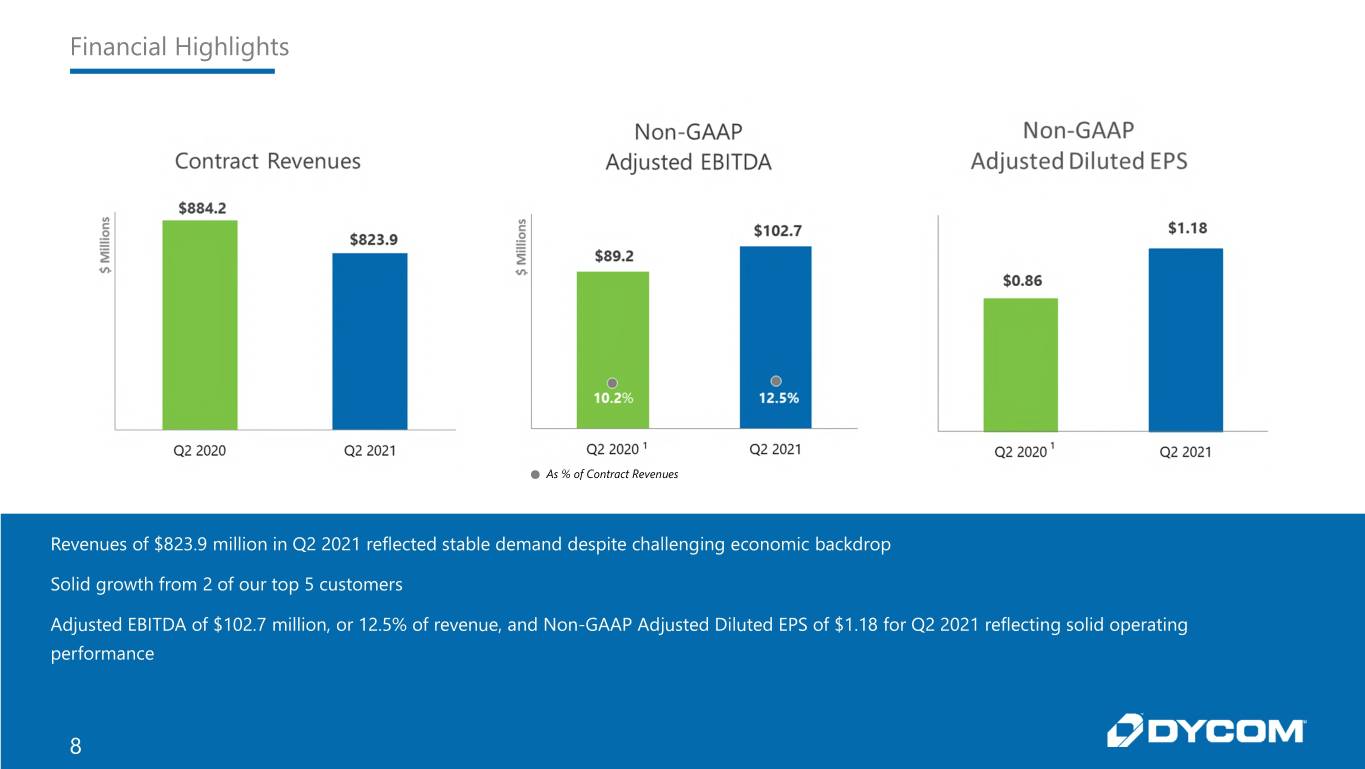
Financial Highlights As % of Contract Revenues Revenues of $823.9 million in Q2 2021 reflected stable demand despite challenging economic backdrop Solid growth from 2 of our top 5 customers Adjusted EBITDA of $102.7 million, or 12.5% of revenue, and Non-GAAP Adjusted Diluted EPS of $1.18 for Q2 2021 reflecting solid operating performance 8
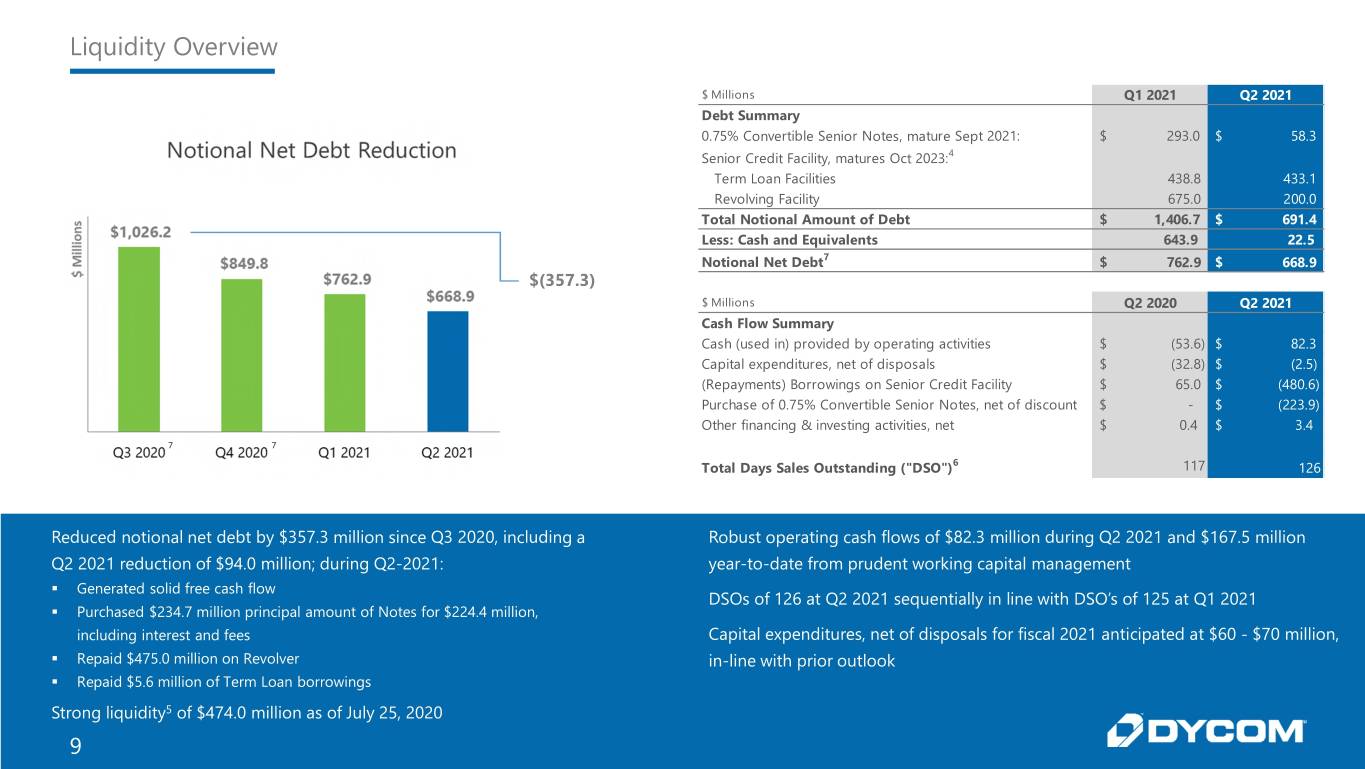
Liquidity Overview $ Millions Q1 2021 Q2 2021 Debt Summary 0.75% Convertible Senior Notes, mature Sept 2021: $ 293.0 $ 58.3 Senior Credit Facility, matures Oct 2023:4 Term Loan Facilities 438.8 433.1 Revolving Facility 675.0 200.0 Total Notional Amount of Debt $ 1,406.7 $ 691.4 Less: Cash and Equivalents 643.9 22.5 Notional Net Debt7 $ 762.9 $ 668.9 $(357.3) $ Millions Q2 2020 Q2 2021 Cash Flow Summary Cash (used in) provided by operating activities $ (53.6) $ 82.3 Capital expenditures, net of disposals $ (32.8) $ (2.5) (Repayments) Borrowings on Senior Credit Facility $ 65.0 $ (480.6) Purchase of 0.75% Convertible Senior Notes, net of discount $ - $ (223.9) Other financing & investing activities, net $ 0.4 $ 3.4 7 7 Total Days Sales Outstanding ("DSO")6 117 126 Reduced notional net debt by $357.3 million since Q3 2020, including a Robust operating cash flows of $82.3 million during Q2 2021 and $167.5 million Q2 2021 reduction of $94.0 million; during Q2-2021: year-to-date from prudent working capital management . Generated solid free cash flow DSOs of 126 at Q2 2021 sequentially in line with DSO’s of 125 at Q1 2021 . Purchased $234.7 million principal amount of Notes for $224.4 million, including interest and fees Capital expenditures, net of disposals for fiscal 2021 anticipated at $60 - $70 million, . Repaid $475.0 million on Revolver in-line with prior outlook . Repaid $5.6 million of Term Loan borrowings Strong liquidity5 of $474.0 million as of July 25, 2020 9
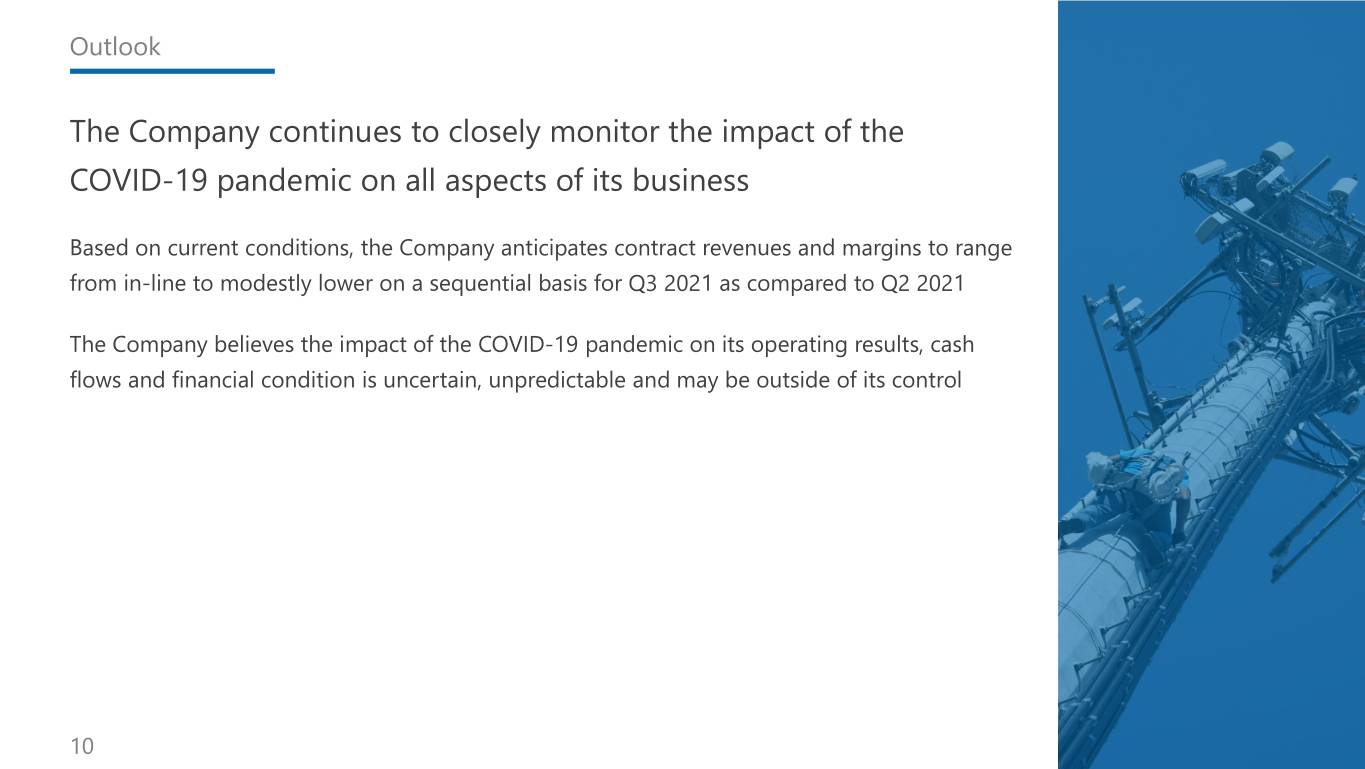
Outlook The Company continues to closely monitor the impact of the COVID-19 pandemic on all aspects of its business Based on current conditions, the Company anticipates contract revenues and margins to range from in-line to modestly lower on a sequential basis for Q3 2021 as compared to Q2 2021 The Company believes the impact of the COVID-19 pandemic on its operating results, cash flows and financial condition is uncertain, unpredictable and may be outside of its control 10
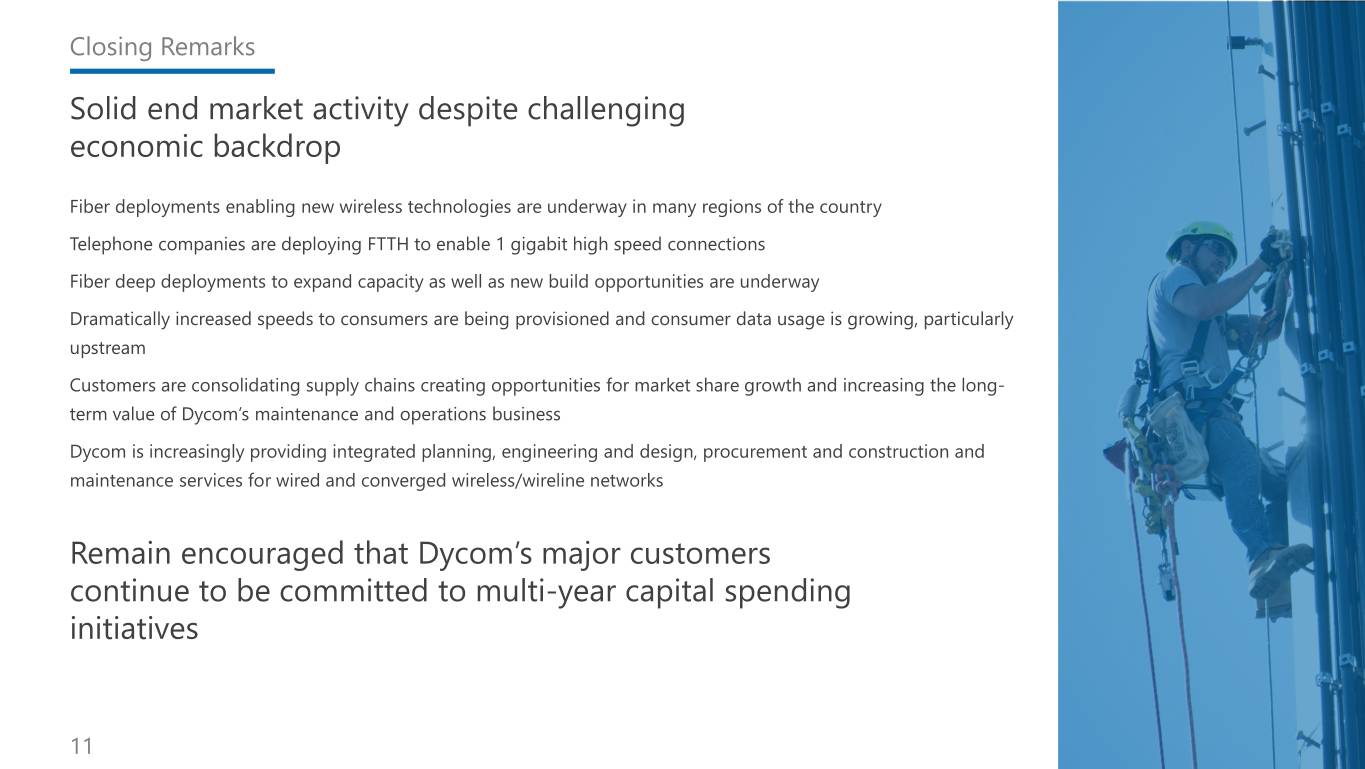
Closing Remarks Solid end market activity despite challenging economic backdrop Fiber deployments enabling new wireless technologies are underway in many regions of the country Telephone companies are deploying FTTH to enable 1 gigabit high speed connections Fiber deep deployments to expand capacity as well as new build opportunities are underway Dramatically increased speeds to consumers are being provisioned and consumer data usage is growing, particularly upstream Customers are consolidating supply chains creating opportunities for market share growth and increasing the long- term value of Dycom’s maintenance and operations business Dycom is increasingly providing integrated planning, engineering and design, procurement and construction and maintenance services for wired and converged wireless/wireline networks Remain encouraged that Dycom’s major customers continue to be committed to multi-year capital spending initiatives 11
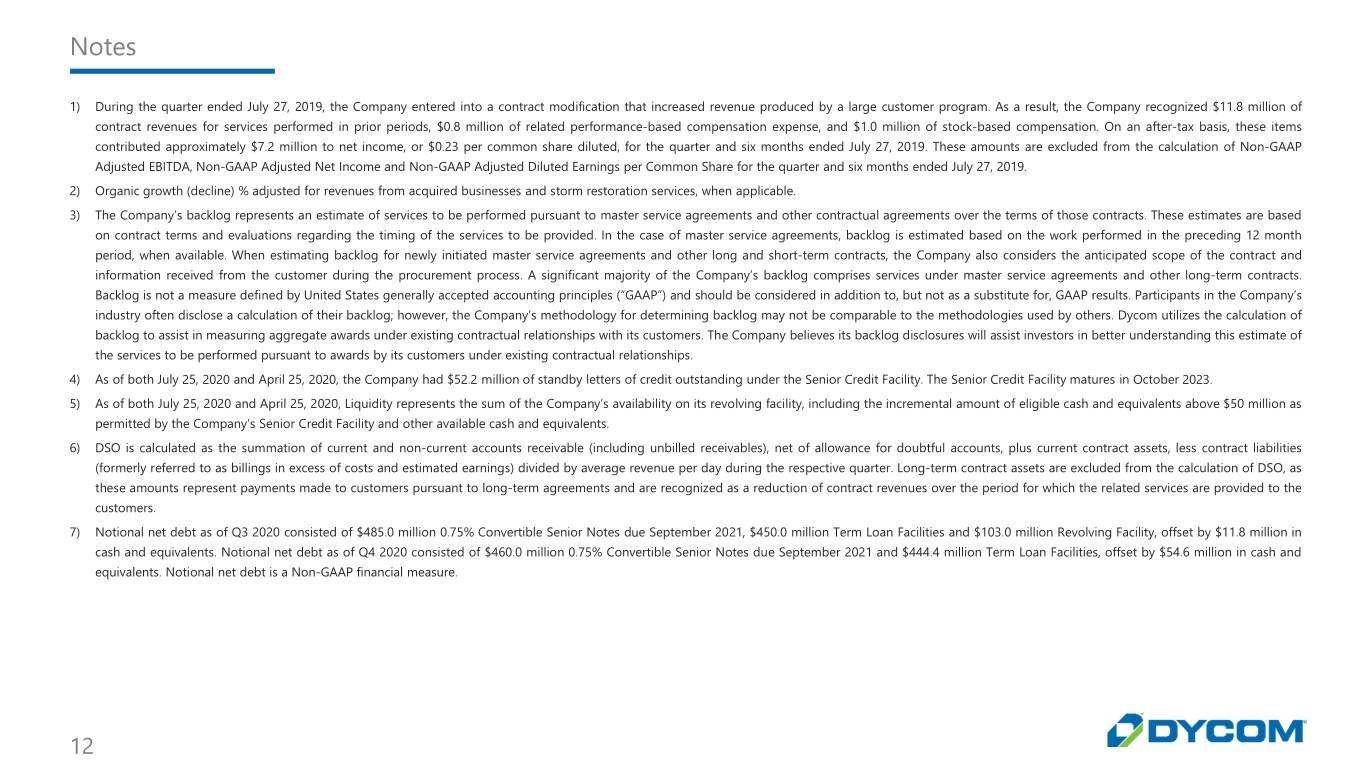
Notes 1) During the quarter ended July 27, 2019, the Company entered into a contract modification that increased revenue produced by a large customer program. As a result, the Company recognized $11.8 million of contract revenues for services performed in prior periods, $0.8 million of related performance-based compensation expense, and $1.0 million of stock-based compensation. On an after-tax basis, these items contributed approximately $7.2 million to net income, or $0.23 per common share diluted, for the quarter and six months ended July 27, 2019. These amounts are excluded from the calculation of Non-GAAP Adjusted EBITDA, Non-GAAP Adjusted Net Income and Non-GAAP Adjusted Diluted Earnings per Common Share for the quarter and six months ended July 27, 2019. 2) Organic growth (decline) % adjusted for revenues from acquired businesses and storm restoration services, when applicable. 3) The Company’s backlog represents an estimate of services to be performed pursuant to master service agreements and other contractual agreements over the terms of those contracts. These estimates are based on contract terms and evaluations regarding the timing of the services to be provided. In the case of master service agreements, backlog is estimated based on the work performed in the preceding 12 month period, when available. When estimating backlog for newly initiated master service agreements and other long and short-term contracts, the Company also considers the anticipated scope of the contract and information received from the customer during the procurement process. A significant majority of the Company’s backlog comprises services under master service agreements and other long-term contracts. Backlog is not a measure defined by United States generally accepted accounting principles (“GAAP”) and should be considered in addition to, but not as a substitute for, GAAP results. Participants in the Company’s industry often disclose a calculation of their backlog; however, the Company’s methodology for determining backlog may not be comparable to the methodologies used by others. Dycom utilizes the calculation of backlog to assist in measuring aggregate awards under existing contractual relationships with its customers. The Company believes its backlog disclosures will assist investors in better understanding this estimate of the services to be performed pursuant to awards by its customers under existing contractual relationships. 4) As of both July 25, 2020 and April 25, 2020, the Company had $52.2 million of standby letters of credit outstanding under the Senior Credit Facility. The Senior Credit Facility matures in October 2023. 5) As of both July 25, 2020 and April 25, 2020, Liquidity represents the sum of the Company’s availability on its revolving facility, including the incremental amount of eligible cash and equivalents above $50 million as permitted by the Company’s Senior Credit Facility and other available cash and equivalents. 6) DSO is calculated as the summation of current and non-current accounts receivable (including unbilled receivables), net of allowance for doubtful accounts, plus current contract assets, less contract liabilities (formerly referred to as billings in excess of costs and estimated earnings) divided by average revenue per day during the respective quarter. Long-term contract assets are excluded from the calculation of DSO, as these amounts represent payments made to customers pursuant to long-term agreements and are recognized as a reduction of contract revenues over the period for which the related services are provided to the customers. 7) Notional net debt as of Q3 2020 consisted of $485.0 million 0.75% Convertible Senior Notes due September 2021, $450.0 million Term Loan Facilities and $103.0 million Revolving Facility, offset by $11.8 million in cash and equivalents. Notional net debt as of Q4 2020 consisted of $460.0 million 0.75% Convertible Senior Notes due September 2021 and $444.4 million Term Loan Facilities, offset by $54.6 million in cash and equivalents. Notional net debt is a Non-GAAP financial measure. 12
Exhibit 99.3
Dycom Industries, Inc.
Non-GAAP Reconciliations
Q2 2021

Explanation of Non-GAAP Financial Measures
The Company reports its financial results in accordance with U.S. generally accepted accounting principles (GAAP). In the Company’s quarterly results releases, trend schedules, conference calls, slide presentations, and webcasts, it may use or discuss Non-GAAP financial measures, as defined by Regulation G of the Securities and Exchange Commission. The Company believes that the presentation of certain Non-GAAP financial measures in these materials provides information that is useful to investors because it allows for a more direct comparison of the Company’s performance for the period reported with the Company’s performance in prior periods. The Company cautions that Non-GAAP financial measures should be considered in addition to, but not as a substitute for, the Company’s reported GAAP results. Management defines the Non-GAAP financial measures used as follows:
•Non-GAAP Organic Contract Revenues - contract revenues from businesses that are included for the entire period in both the current and prior year periods, excluding contract revenues from storm restoration services, adjusted independently for each comparative period for the additional week in the fourth quarter of fiscal 2016, the quarter ended July 30, 2016, as a result of the Company’s 52/53 week fiscal year. Non-GAAP Organic Contract Revenue (decline) growth is calculated as the percentage change in Non-GAAP Organic Contract Revenues over those of the comparable prior year periods. Management believes organic (decline) growth is a helpful measure for comparing the Company’s revenue performance with prior periods.
•Non-GAAP Adjusted EBITDA - net income before interest, taxes, depreciation and amortization, gain on sale of fixed assets, stock-based compensation expense, and certain non-recurring items. Management believes Non-GAAP Adjusted EBITDA is a helpful measure for comparing the Company’s operating performance with prior periods as well as with the performance of other companies with different capital structures or tax rates.
•Non-GAAP Adjusted Net Income - GAAP net income before the non-cash amortization of the debt discount and the related tax impact, certain tax impacts resulting from vesting and exercise of share-based awards, and certain non-recurring items. Management believes Non-GAAP Adjusted Net Income is a helpful measure for comparing the Company’s operating performance with prior periods.
•Non-GAAP Adjusted Diluted Earnings per Common Share - Non-GAAP Adjusted Net Income divided by weighted average diluted shares outstanding.
•Notional Net Debt - Notional net debt is a Non-GAAP financial measure that is calculated by subtracting cash and equivalents from the aggregate face amount of outstanding long-term debt. Management believes notional net debt is a helpful measure to assess the Company’s liquidity.
Management excludes or adjusts each of the items identified below from Non-GAAP Adjusted Net Income and Non-GAAP Adjusted Diluted Earnings per Common Share:
•Non-cash amortization of debt discount on Notes - The Company’s 0.75% convertible senior notes due September 2021 (the “Notes”) were allocated between debt and equity components. The difference between the principal amount and the carrying amount of the liability component of the Notes represents a debt discount. The debt discount is being amortized over the term of the Notes but does not result in periodic cash interest payments. The Company excludes the non-cash amortization of the debt discount from its Non-GAAP financial measures because it believes it is useful to analyze the component of interest expense for the Notes that will be paid in cash. The exclusion of the non-cash amortization from the Company’s Non-GAAP financial measures provides management with a consistent measure for assessing financial results.
•Goodwill impairment charge - The Company incurred a goodwill impairment charge of $53.3 million for a reporting unit that performs installation services inside third party premises. Management believes excluding the goodwill impairment charge from the Company’s Non-GAAP financial measures assists investors’ overall understanding of the Company’s current financial performance and provides management with a consistent measure for assessing the current and historical financial results.
•(Loss) gain on debt extinguishment - During the quarter ended July 25, 2020, the Company incurred a loss on debt extinguishment of $0.5 million in connection with its purchase of $234.7 million aggregate principal amount of 0.75% convertible senior notes due September 2021 for $224.4 million, including interest and fees. Additionally, during the quarter ended April 25, 2020, the Company recognized a gain on debt extinguishment of $12.5 million in connection with its purchase of $167.0 million aggregate principal amount of 0.75% convertible senior notes due September 2021 for $147.0 million, including interest and fees. Management believes excluding the (loss) gain on debt extinguishment from the Company’s Non-GAAP financial measures assists investors’ overall understanding of the Company’s current financial performance and provides management with a consistent measure for assessing the current and historical financial results.
2
•Charge for warranty costs - During the quarter ended April 27, 2019, the Company recorded an $8.2 million pre-tax charge for estimated warranty costs for work performed for a customer in prior periods. The Company excludes the impact of this charge from its Non-GAAP financial measures because the Company believes it is not indicative of its underlying results in the current period.
•Recovery of previously reserved accounts receivable and contract assets - During the quarter ended April 27, 2019, the Company recognized $10.3 million of pre-tax income from the recovery of previously reserved accounts receivable and contract assets based on collections from a customer. The Company excludes the impact of this recovery from its Non-GAAP financial measures because the Company believes it is not indicative of its underlying results.
•Tax impact of the vesting and exercise of share-based awards - The Company excludes certain tax impacts resulting from the vesting and exercise of share-based awards as these amounts may vary significantly from period to period. Excluding these amounts from the Company’s Non-GAAP financial measures provides management with a more consistent measure for assessing financial results.
•Tax effect from a net operating loss carryback under enacted CARES Act - For the quarter ended April 25, 2020, the Company recognized an income tax benefit of $2.6 million from a net operating loss carryback under the enacted U.S. Coronavirus Aid, Relief, and Economic Security (“CARES”) Act. The Company excludes this impact because the Company believes it is not indicative of the Company’s underlying results or ongoing operations.
•Tax impact of previous tax year filing - During the quarter ended July 27, 2019, the Company recognized an income tax expense of $1.1 million on a previous tax year filing. The Company excludes this impact because the Company believes it is not indicative of the Company’s underlying results or ongoing operations.
•Tax impact of pre-tax adjustments - The tax impact of pre-tax adjustments reflects the Company’s estimated tax impact of specific adjustments and the effective tax rate used for financial planning for the applicable period.
3
| Reconciliation of Non-GAAP Financial Measures to Comparable GAAP Financial Measures | ||||||||||||||||||||||||||||||||||||||||||||
| Non-GAAP Organic Contract Revenues | ||||||||||||||||||||||||||||||||||||||||||||
| Unaudited | ||||||||||||||||||||||||||||||||||||||||||||
| (Dollars in millions) | ||||||||||||||||||||||||||||||||||||||||||||
| Contract Revenues - GAAP | Revenues from acquired businesses1 | Revenues from storm restoration services | Additional week as a result of our 52/53 week fiscal year2 | Non-GAAP - Organic Revenues | Growth (Decline)% | |||||||||||||||||||||||||||||||||||||||
| GAAP % | Non-GAAP - Organic % | |||||||||||||||||||||||||||||||||||||||||||
| Quarter Ended July 25, 2020 | $ | 823.9 | $ | — | $ | — | $ | — | $ | 823.9 | (6.8) | % | (6.8) | % | ||||||||||||||||||||||||||||||
| Quarter Ended July 27, 2019 | $ | 884.2 | $ | — | $ | — | $ | — | $ | 884.2 | ||||||||||||||||||||||||||||||||||
| Six Months Ended July 25, 2020 | $ | 1,638.2 | $ | — | $ | — | $ | — | $ | 1,638.2 | (4.6) | % | (4.4) | % | ||||||||||||||||||||||||||||||
| Six Months Ended July 27, 2019 | $ | 1,718.0 | $ | (4.7) | $ | — | $ | — | $ | 1,713.2 | ||||||||||||||||||||||||||||||||||
| Four Quarters Ended | ||||||||||||||||||||||||||||||||||||||||||||
| January 25, 2020 | $ | 3,339.7 | $ | (26.6) | $ | (4.7) | $ | — | $ | 3,308.3 | 6.8 | % | 8.3 | % | ||||||||||||||||||||||||||||||
| January 26, 2019 | $ | 3,127.7 | $ | (29.6) | $ | (42.9) | $ | — | $ | 3,055.3 | ||||||||||||||||||||||||||||||||||
| January 26, 2019 | $ | 3,127.7 | $ | (69.9) | $ | (42.9) | $ | — | $ | 3,014.9 | 5.0 | % | 3.6 | % | ||||||||||||||||||||||||||||||
January 27, 20183 | $ | 2,977.9 | $ | (32.3) | $ | (35.1) | $ | — | $ | 2,910.5 | ||||||||||||||||||||||||||||||||||
January 27, 20183 | $ | 2,977.9 | $ | (87.3) | $ | (35.1) | $ | — | $ | 2,855.5 | 0.8 | % | (0.2) | % | ||||||||||||||||||||||||||||||
January 28, 20173 | $ | 2,954.2 | $ | (37.3) | $ | — | $ | (56.0) | $ | 2,860.9 | ||||||||||||||||||||||||||||||||||
| July 29, 2017 | $ | 3,066.9 | $ | (214.9) | $ | — | $ | — | $ | 2,851.9 | 14.8 | % | 14.1 | % | ||||||||||||||||||||||||||||||
| July 30, 2016 | $ | 2,672.5 | $ | (119.8) | $ | — | $ | (53.5) | $ | 2,499.2 | ||||||||||||||||||||||||||||||||||
| July 30, 2016 | $ | 2,672.5 | $ | (159.0) | $ | — | $ | (52.9) | $ | 2,460.7 | 32.2 | % | 22.7 | % | ||||||||||||||||||||||||||||||
| July 25, 2015 | $ | 2,022.3 | $ | (17.7) | $ | — | $ | — | $ | 2,004.7 | ||||||||||||||||||||||||||||||||||
| July 25, 2015 | $ | 2,022.3 | $ | (40.4) | $ | — | $ | — | $ | 1,982.0 | 11.6 | % | 9.6 | % | ||||||||||||||||||||||||||||||
| July 26, 2014 | $ | 1,811.6 | $ | (2.8) | $ | — | $ | — | $ | 1,808.8 | ||||||||||||||||||||||||||||||||||
| July 26, 2014 | $ | 1,811.6 | $ | (499.3) | $ | — | $ | — | $ | 1,312.3 | 12.6 | % | 4.7 | % | ||||||||||||||||||||||||||||||
| July 27, 2013 | $ | 1,608.6 | $ | (337.9) | $ | (16.7) | $ | — | $ | 1,254.0 | ||||||||||||||||||||||||||||||||||
Note: Amounts above may not add due to rounding.
4
| Reconciliation of Non-GAAP Financial Measures to Comparable GAAP Financial Measures | ||||||||||||||||||||||||||||||||
| Non-GAAP Organic Contract Revenues - Certain Customers | ||||||||||||||||||||||||||||||||
| Unaudited | ||||||||||||||||||||||||||||||||
| (Dollars in millions) | ||||||||||||||||||||||||||||||||
| Contract Revenues - GAAP | Revenues from storm restoration services | Non-GAAP - Organic Revenues | Growth (Decline)% | |||||||||||||||||||||||||||||
| Quarter Ended | GAAP % | Non-GAAP - Organic % | ||||||||||||||||||||||||||||||
| CenturyLink | ||||||||||||||||||||||||||||||||
| July 25, 2020 | $ | 158.4 | $ | — | $ | 158.4 | 14.2 | % | 14.2 | % | ||||||||||||||||||||||
| July 27, 2019 | $ | 138.7 | $ | — | $ | 138.7 | ||||||||||||||||||||||||||
| Windstream | ||||||||||||||||||||||||||||||||
| July 25, 2020 | $ | 43.4 | $ | — | $ | 43.4 | 25.2 | % | 25.2 | % | ||||||||||||||||||||||
| July 27, 2019 | $ | 34.7 | $ | — | $ | 34.7 | ||||||||||||||||||||||||||
Top 5 Customers4 | ||||||||||||||||||||||||||||||||
| July 25, 2020 | $ | 630.8 | $ | — | $ | 630.8 | (9.2) | % | (9.2) | % | ||||||||||||||||||||||
| July 27, 2019 | $ | 694.8 | $ | — | $ | 694.8 | ||||||||||||||||||||||||||
| All Other Customers (excluding Top 5 Customers) | ||||||||||||||||||||||||||||||||
| July 25, 2020 | $ | 193.2 | $ | — | $ | 193.2 | 2.0 | % | 2.0 | % | ||||||||||||||||||||||
| July 27, 2019 | $ | 189.4 | $ | — | $ | 189.4 | ||||||||||||||||||||||||||
Note: Amounts above may not add due to rounding.
5
| Reconciliation of Non-GAAP Financial Measures to Comparable GAAP Financial Measures | |||||||||||
| Non-GAAP Adjusted EBITDA | |||||||||||
| Unaudited | |||||||||||
| (Dollars in thousands) | |||||||||||
| Quarter Ended | |||||||||||
| July 25, 2020 | July 27, 2019 | ||||||||||
| Net income | $ | 37,024 | $ | 29,896 | |||||||
| Interest expense, net | 7,853 | 12,878 | |||||||||
| Provision for income taxes | 12,244 | 12,710 | |||||||||
| Depreciation and amortization | 44,129 | 47,244 | |||||||||
| Earnings Before Interest, Taxes, Depreciation & Amortization (“EBITDA”) | 101,250 | 102,728 | |||||||||
| Gain on sale of fixed assets | (3,418) | (4,806) | |||||||||
| Stock-based compensation expense | 4,373 | 2,277 | |||||||||
Loss on debt extinguishment5 | 458 | — | |||||||||
| Non-GAAP Adjusted EBITDA | $ | 102,663 | $ | 100,199 | |||||||
| Non-GAAP Adjusted EBITDA % of contract revenues | 12.5 | % | 11.3 | % | |||||||
Non-GAAP Adjusted EBITDA, excluding contract modification6 | $ | 89,239 | |||||||||
Non-GAAP Adjusted EBITDA, excluding contract modification % of contract revenues6 | 10.2 | % | |||||||||
Note: Amounts above may not add due to rounding.
6
| Reconciliation of Non-GAAP Financial Measures to Comparable GAAP Financial Measures | |||||||||||||||||
| Non-GAAP Adjusted Net Income and Non-GAAP Adjusted Diluted Earnings Per Share | |||||||||||||||||
| Unaudited | |||||||||||||||||
| (Dollars and shares in thousands, except per share amounts) | |||||||||||||||||
| Quarter Ended July 25, 2020 | |||||||||||||||||
| GAAP | Reconciling Items | Non-GAAP Adjusted | |||||||||||||||
| Contract revenues | $ | 823,921 | $ | — | $ | 823,921 | |||||||||||
| Costs of earned revenues, excluding depreciation and amortization | 657,953 | — | 657,953 | ||||||||||||||
| General and administrative | 67,357 | — | 67,357 | ||||||||||||||
| Depreciation and amortization | 44,129 | — | 44,129 | ||||||||||||||
| Total | 769,439 | — | 769,439 | ||||||||||||||
Interest expense, net7 | (7,853) | 1,748 | (6,105) | ||||||||||||||
Loss on debt extinguishment5 | (458) | 458 | — | ||||||||||||||
| Other income, net | 3,097 | — | 3,097 | ||||||||||||||
| Income before income taxes | 49,268 | 2,206 | 51,474 | ||||||||||||||
Provision for income taxes8 | 12,244 | 1,265 | 13,509 | ||||||||||||||
| Net income | $ | 37,024 | $ | 941 | $ | 37,965 | |||||||||||
| Diluted earnings per common share | $ | 1.15 | $ | 0.03 | $ | 1.18 | |||||||||||
| Shares used in computing diluted earnings per common share | 32,128 | — | 32,128 | ||||||||||||||
| Quarter Ended July 27, 2019 | |||||||||||||||||
| GAAP | Reconciling Items | Non-GAAP Adjusted | |||||||||||||||
| Contract revenues | $ | 884,221 | $ | — | $ | 884,221 | |||||||||||
| Costs of earned revenues, excluding depreciation and amortization | 720,382 | — | 720,382 | ||||||||||||||
| General and administrative | 65,117 | — | 65,117 | ||||||||||||||
| Depreciation and amortization | 47,244 | — | 47,244 | ||||||||||||||
| Total | 832,743 | — | 832,743 | ||||||||||||||
Interest expense, net7 | (12,878) | 5,015 | (7,863) | ||||||||||||||
| Other income, net | 4,006 | — | 4,006 | ||||||||||||||
| Income before income taxes | 42,606 | 5,015 | 47,621 | ||||||||||||||
Provision for income taxes8 | 12,710 | 287 | 12,997 | ||||||||||||||
| Net income | $ | 29,896 | $ | 4,728 | $ | 34,624 | |||||||||||
| Diluted earnings per common share | $ | 0.94 | $ | 0.15 | $ | 1.09 | |||||||||||
| Shares used in computing diluted earnings per common share | 31,820 | — | 31,820 | ||||||||||||||
Non-GAAP Adjusted Net Income, excluding contract modification6 | $ | 27,373 | |||||||||||||||
Non-GAAP Adjusted Diluted Earnings per Common Share, excluding contract modification6 | $ | 0.86 | |||||||||||||||
Note: Amounts above may not add due to rounding.
7
Notes to Reconciliation of Non-GAAP Financial Measures to Comparable GAAP Financial Measures
1 Amounts represent contract revenues from acquired businesses that were not owned for the full period in both the current and comparable prior periods, including any contract revenues from storm restoration services for these acquired businesses.
2 The quarter ended July 30, 2016 contained 14 weeks as a result of our 52/53 week fiscal year as compared to 13 weeks in all other quarterly periods presented. The Non-GAAP adjustment is calculated independently for each comparative period as (i) contract revenues less, (ii) contract revenues from acquired businesses in each applicable period, (iii) divided by 14 weeks.
3 Due to the change in the Company’s fiscal year end, the Company’s fiscal 2018 six month transition period consisted of Q1 2018 and Q2 2018. Amounts provided for the Four Quarters Ended January 27, 2018 represent the aggregate of Q3 2017, Q4 2017, Q1 2018, and Q2 2018, and amounts provided for the Four Quarters Ended January 28, 2017 represent the aggregate of Q3 2016, Q4 2016, Q1 2017, and Q2 2017, for comparative purposes to other twelve month periods presented.
4 Top 5 Customers included Verizon, CenturyLink, AT&T, Comcast and Windstream for the quarters ended July 25, 2020 and July 27, 2019.
5 During the quarter ended July 25, 2020, the Company purchased $234.7 million aggregate principal amount of of 0.75% Convertible Senior Notes due September 2021 (the “Notes”) for $224.4 million, including interest and fees. The purchase price was allocated between the debt and equity components of the Notes. Based on the net carrying amount of the Notes, the Company recognized a net loss on debt extinguishment of $0.5 million after the write-off of associated debt issuance costs. The Company also recognized the equity component of the settlement of the Notes.
6 During the quarter ended July 27, 2019, the Company entered into a contract modification that increased revenue produced by a large customer program. As a result, the Company recognized $11.8 million of contract revenues for services performed in prior periods, $0.8 million of related performance-based compensation expense, and $1.0 million of stock-based compensation. On an after-tax basis, these items contributed approximately $7.3 million to net income, or $0.23 per common share diluted, for the quarter ended July 27, 2019. These amounts are excluded from the calculations of Non-GAAP Adjusted EBITDA, Non-GAAP Adjusted Net Income and Non-GAAP Adjusted Diluted Earnings per Common Share for the quarter ended July 27, 2019.
7 Non-GAAP Adjusted Interest expense, net excludes the non-cash amortization of the debt discount associated with the Notes.
8 Non-GAAP Adjusted Provision for income taxes reflects the tax related impact of all pre-tax adjustments as well as the tax effects of the vesting and exercise of share-based awards. Additionally, for the quarter ended July 27, 2019, the provision for income taxes includes $1.1 million of income tax expense related to a previous tax year filing.
8