
EIX 8-K
Edison International (EIX)
8-K
2020-10-27
For: 2020-10-27
View Original
Added on
April 08, 2026
UNITED STATES
SECURITIES AND EXCHANGE COMMISSION
Washington, D.C. 20549
________________________
FORM 8-K
________________________
CURRENT REPORT
Pursuant to Section 13 or 15(d) of the Securities Exchange Act of 1934
Date of Report (Date of earliest event reported): October 27, 2020
| Commission File Number | Exact Name of Registrant as specified in its charter | State or Other Jurisdiction of Incorporation or Organization | IRS Employer Identification Number | |||||||||||||||||
| SOUTHERN CALIFORNIA EDISON COMPANY | ||||||||||||||||||||
 |  | |||||||||||||||||||
| (Address of principal executive offices) | (Address of principal executive offices) | |||||||||||||||||||
(Registrant's telephone number, including area code) | (Registrant's telephone number, including area code) | |||||||||||||||||||
Check the appropriate box below if the Form 8-K filing is intended to simultaneously satisfy the filing obligation of the registrant under any of the following provisions:
[ ☐ ] Written communications pursuant to Rule 425 under the Securities Act (17 CFR 230.425)
[ ☐ ] Soliciting material pursuant to Rule 14a-12 under the Exchange Act (17 CFR 240.14a-12)
[ ☐ ] Pre-commencement communications pursuant to Rule 14d-2(b) under the Exchange Act (17 CFR 240.14d-2(b))
[ ☐ ] Pre-commencement communications pursuant to Rule 13e-4(c) under the Exchange Act (17 CFR 240.13e-4(c))
Securities registered pursuant to Section 12(b) of the Act:
Edison International:
| Title of each class | Trading Symbol(s) | Name of each exchange on which registered | |||||||||
| LLC | |||||||||||
Southern California Edison Company: None
Indicate by check mark whether the registrant is an emerging growth company as defined in Rule 405 of the Securities Act of 1933 (§230.405 of this chapter) or Rule 12b-2 of the Securities Exchange Act of 1934 (§240.12b-2 of this chapter).
| Emerging growth company | Edison International | |||||||
| Emerging growth company | Southern California Edison Company | |||||||
If an emerging growth company, indicate by check mark if the registrant has elected not to use the extended transition period for complying with any new or revised financial accounting standards provided pursuant to Section 13(a) of the Exchange Act.
| Edison International | ☐ | |||||||
| Southern California Edison Company | ☐ | |||||||
This current report and its exhibits include forward-looking statements. Edison International and Southern California Edison Company ("SCE") based these forward-looking statements on their current expectations and projections about future events in light of their knowledge of facts as of the date of this current report and their assumptions about future circumstances. These forward-looking statements are subject to various risks and uncertainties that may be outside the control of Edison International and SCE. Edison International and SCE have no obligation to publicly update or revise any forward-looking statements, whether due to new information, future events, or otherwise. This current report should be read with Edison International's and SCE's combined Annual Report on Form 10-K for the year ended December 31, 2019 and subsequent Quarterly Reports on Form 10-Q. Additionally, Edison International and SCE provide direct links to EIX and SCE presentations, documents and other information at www.edisoninvestor.com (Events and Presentations) in order to publicly disseminate such information.
Item 2.02 Results of Operations and Financial Condition
On October 27, 2020, Edison International issued a press release reporting its financial results and the financial results for its subsidiary, Southern California Edison Company, for the quarter ended September 30, 2020. A copy of the press release is attached as Exhibit 99.1. On the same day, members of Edison International's management will speak to investors via a financial teleconference. Senior management's prepared remarks and accompanying presentation are attached as Exhibit 99.2 and Exhibit 99.3 to this report. The information furnished in this Item 2.02 and Exhibits 99.1, 99.2, and 99.3 shall not be deemed to be “filed” for purposes of the Securities Exchange Act of 1934, nor shall it be deemed to be incorporated by reference in any filing under the Securities Act of 1933.
Item 7.01 Regulation FD Disclosure
Members of Edison International management will use the information in the presentation furnished as Exhibit 99.3 to this report in meetings with institutional investors and analysts and at investor conferences. The attached presentation will also be posted posted on www.edisoninvestor.com.
Item 9.01 Financial Statements and Exhibits
(d) Exhibits
EXHIBIT INDEX
| Exhibit No. | Description | ||||
| 99.1 | |||||
| 99.2 | |||||
| 99.3 | |||||
| 104 | Cover Page Interactive Data File (embedded within the Inline XBRL document) | ||||
SIGNATURES
Pursuant to the requirements of the Securities Exchange Act of 1934, the registrants have duly caused this report to be signed on its behalf by the undersigned hereunto duly authorized.
| EDISON INTERNATIONAL | |||||
| (Registrant) | |||||
| /s/ Aaron D. Moss | |||||
| Aaron D. Moss | |||||
| Vice President and Controller | |||||
Date: October 27, 2020
| SOUTHERN CALIFORNIA EDISON COMPANY | |||||
| (Registrant) | |||||
| /s/ Aaron D. Moss | |||||
| Aaron D. Moss | |||||
| Vice President and Controller | |||||
Date: October 27, 2020
Exhibit 99.1
 | NEWS | |||||||
| FOR IMMEDIATE RELEASE | Investor Relations: Sam Ramraj, (626) 302-2540 | ||||
Media Contact: Jeff Monford, (626) 476-8120 | |||||
Edison International Reports Third Quarter and Year-to-Date 2020 Results
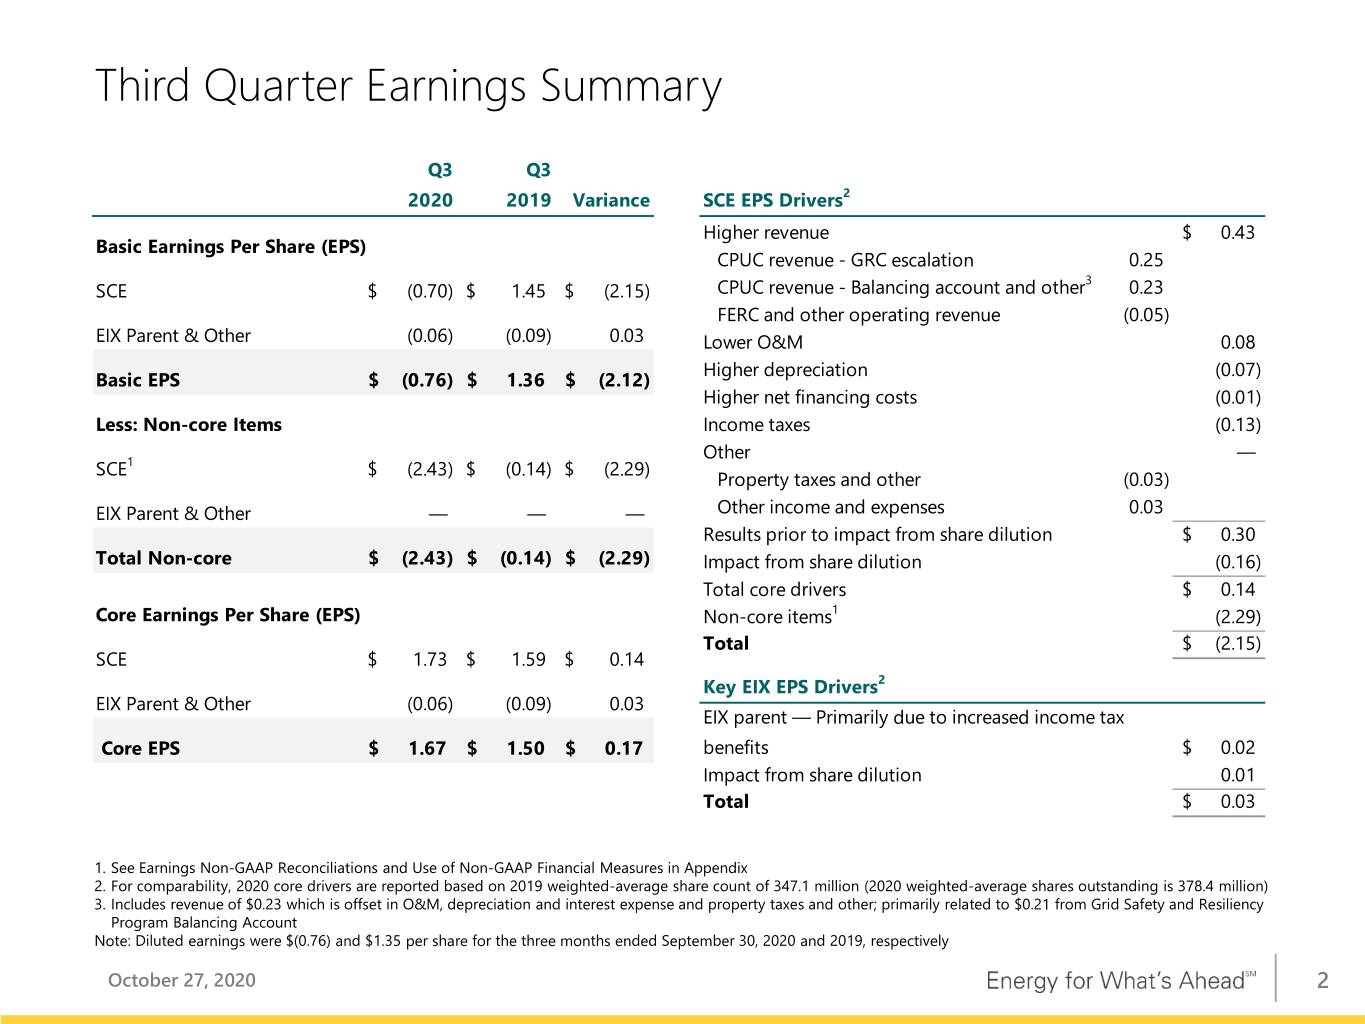
ROSEMEAD, Calif., October 27, 2020 — Edison International (NYSE: EIX) today reported third quarter 2020 net loss of $288 million, or $0.76 loss per share, compared to net income of $471 million, or $1.36 per share, in the third quarter 2019. As adjusted, third quarter 2020 core earnings were $632 million, or $1.67 per share, compared to core earnings of $519 million, or $1.50 per share, in the third quarter 2019.
Southern California Edison's (SCE) third quarter 2020 earnings per share (EPS) decreased by $2.15 from the prior year period, consisting of higher core EPS of $0.14 and higher non-core loss per share of $2.29. Higher core EPS was primarily due to higher CPUC-related revenue due to the escalation mechanism as set forth in the 2018 GRC decision and lower expenses from regulatory deferrals related to wildfire mitigation activities. These were partially offset by higher operation and maintenance expenses, including customer uncollectibles resulting from the COVID-19 pandemic and SCE's response to it, and the increase in shares outstanding related to the equity offerings in July 2019 and May 2020.
SCE's higher non-core loss per share was attributable to a charge of $2.33 for the 2017/2018 Wildfire/Mudslide Events claims and expenses, net of expected recoveries from FERC customers, and $0.02 from higher amortization of SCE's contributions to the Wildfire Insurance Fund. These were partially offset by a gain of $0.06 recorded in third quarter 2020 for SCE's sale of San Onofre nuclear fuel.
Edison International Parent and Other's third quarter 2020 loss per share decreased by $0.03 compared to third quarter 2019. The lower loss per share was primarily due to higher tax benefits.
“Edison International’s improved third quarter results were primarily due to higher CPUC-related revenue from the 2018 GRC escalation mechanism and lower expenses from regulatory deferrals related to wildfire mitigation activities, partially offset by equity share dilution,” said Pedro J. Pizarro, president and chief executive officer of Edison International. “Reflecting our strong year-to-date performance and our confidence in the outlook for the year, we are narrowing our 2020 guidance range to $4.47 to $4.62 by raising the low end.”
Pizarro added, “In preparation for this year’s wildfire season, SCE’s mitigation efforts augment those of State and local agencies. SCE has made substantial progress in implementing its wildfire mitigation plan. For instance, it is on track to meet or exceed the target of 700 miles of installed covered conductor set in the 2020 Wildfire Mitigation Plan. Further, the utility made significant enhancements over the past year to its Public Safety Power Shutoff (PSPS) program. SCE has also enhanced communication and coordination with government and communities and improved its capabilities to sectionalize circuits to reduce the number of customers impacted when a preventive de-energization is initiated.”
Edison International Reports Third Quarter and Year-to-Date 2020 Financial Results
Page 2 of 11
Year-to-Date Earnings
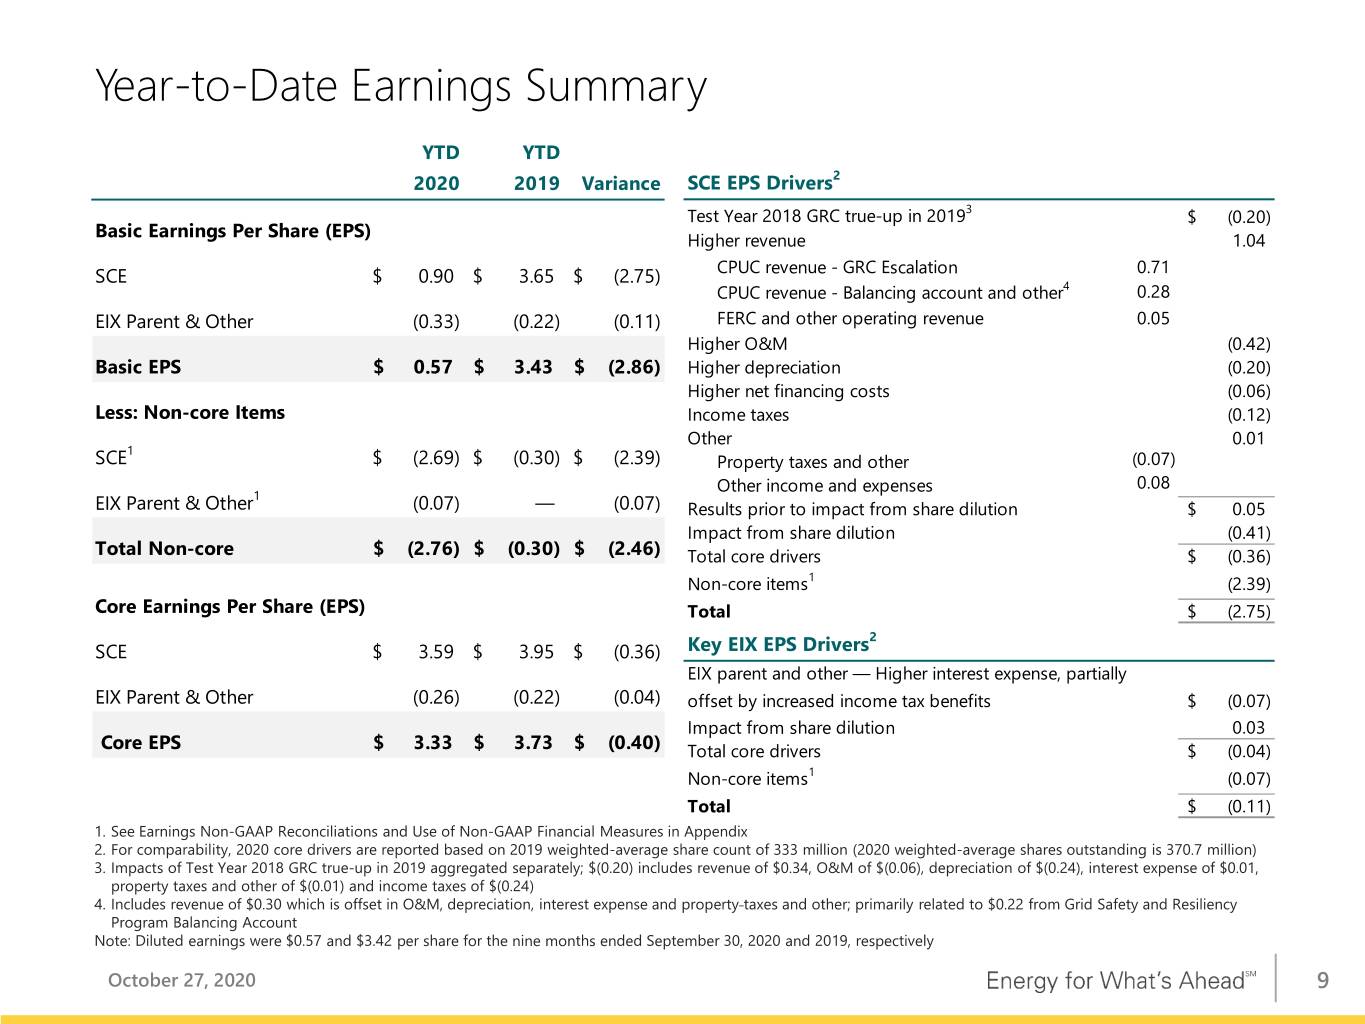
For the nine months ended September 30, 2020, Edison International reported net income of $213 million, or $0.57 per share, compared to $1,141 million, or $3.43 per share, during the same period in 2019. As adjusted, Edison International's core earnings were $1,235 million, or $3.33 per share, compared to $1,240 million, or $3.73 per share, in the year-to-date period in 2019.
SCE's year-to-date 2020 EPS decreased $2.75 from the same period prior year, consisting of lower core EPS of $0.36 per share and higher non-core loss per share of $2.39. The decrease in SCE's core EPS was due to the increase in shares outstanding related to the equity offerings in July 2019 and May 2020. Operational results were higher, primarily due to higher CPUC-related revenue due to the escalation mechanism as set forth in the 2018 GRC decision and lower expenses from regulatory deferrals related to wildfire mitigation activities, partially offset by higher operation and maintenance expenses, including customer uncollectibles resulting from the COVID-19 pandemic and SCE's response to it. SCE's higher core earnings were also partially offset by the adoption of the 2018 GRC decision in the second quarter of 2019.
SCE's higher non-core loss per share was mainly related to a charge of $2.40 for the 2017/2018 Wildfire/Mudslide Events claims and expenses, net of expected recoveries from FERC customers, $0.35 from higher amortization of SCE's contributions to the Wildfire Insurance Fund, and $0.21 lower income tax benefits related to changes in the allocation of deferred tax re-measurement between customers and shareholders as a result of a CPUC resolution issued in February 2019. These were partially offset by a $0.15 higher gain for SCE's sale of San Onofre nuclear fuel, a $0.04 tax benefit recorded in the first quarter of 2020 related to re-measurement of uncertain tax positions related to the 2010 – 2012 California state tax filings currently under audit, and the absence of a $0.38 impairment charge resulting from the disallowance of certain historical capital expenditures in SCE's 2018 GRC final decision recorded in the second quarter 2019.
Edison International Parent and Other’s year-to-date 2020 loss per share increased by $0.11 compared to the same period in 2019, consisting of higher core loss per share of $0.04 and higher non-core loss per share of $0.07. The increase in core loss per share was primarily due to higher interest expense, partially offset by increased tax benefits and the increase in shares outstanding. The higher non-core loss per share was mainly related to a goodwill impairment charge recorded in 2020 related to Edison Energy stemming from the economic impact of COVID-19.
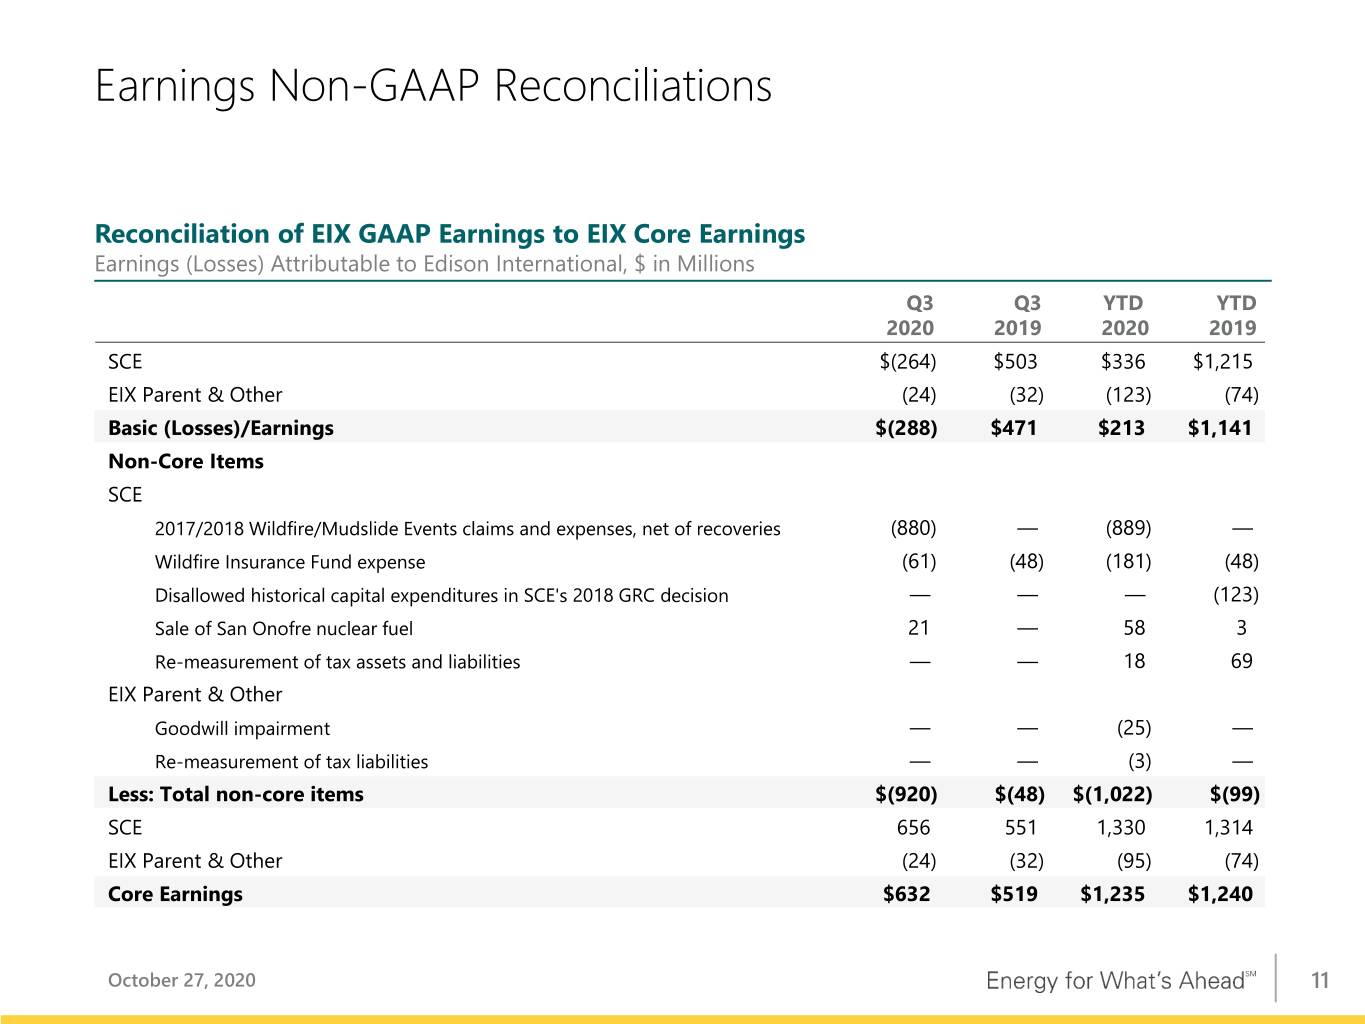
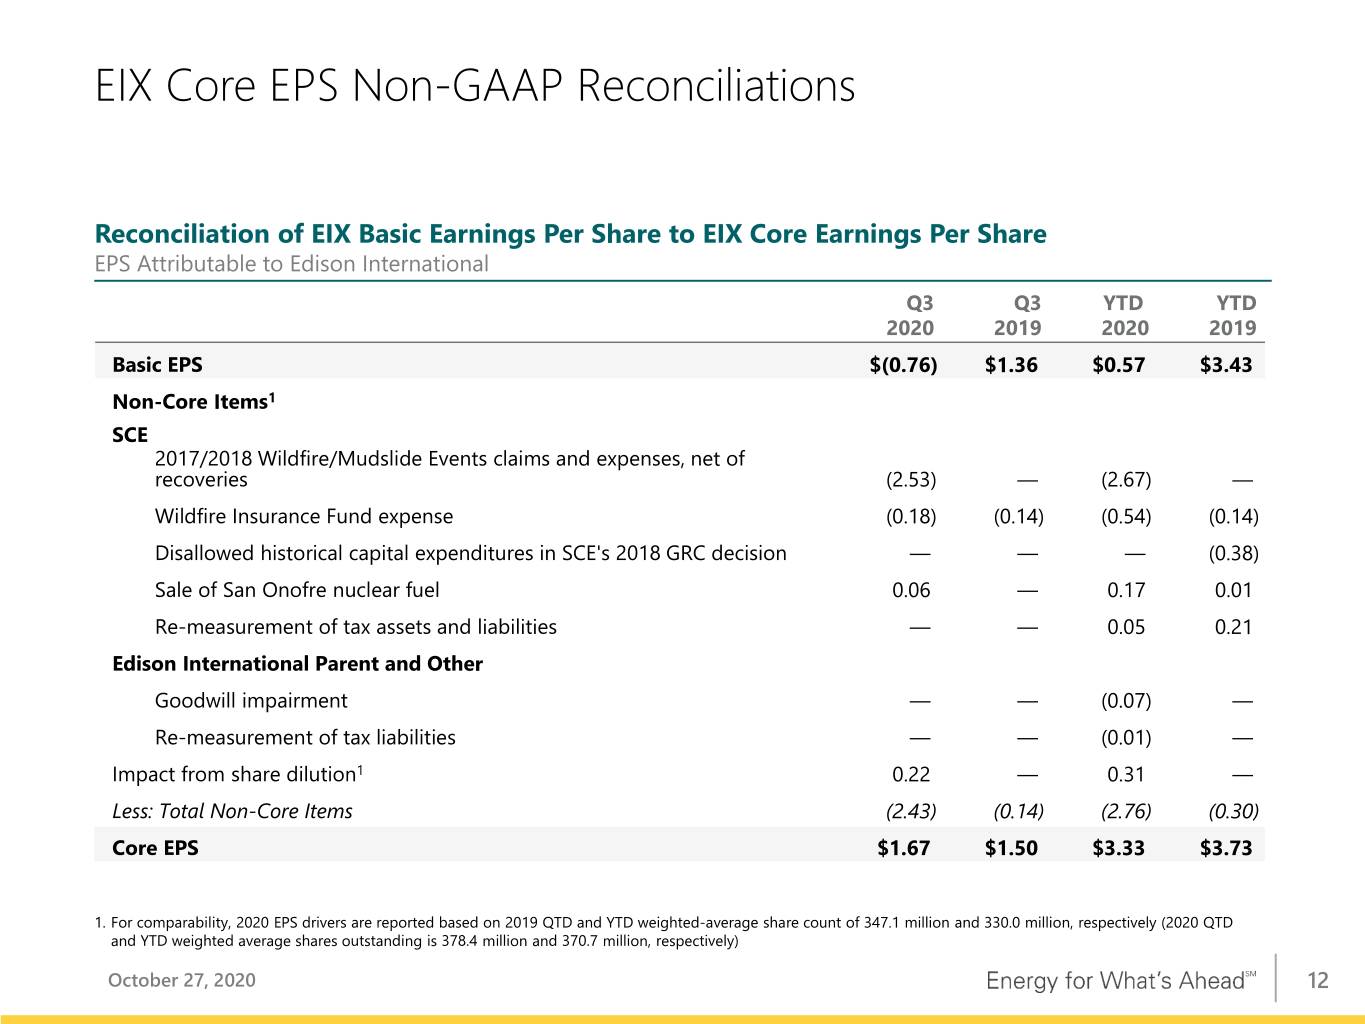
Edison International uses core earnings, which is a non-GAAP financial measure that adjusts for significant discrete items that management does not consider representative of ongoing earnings. Edison International management believes that core earnings provide more meaningful comparisons of performance from period to period. Please see the attached tables for a reconciliation of core earnings to basic GAAP earnings.
2020 Earnings Guidance
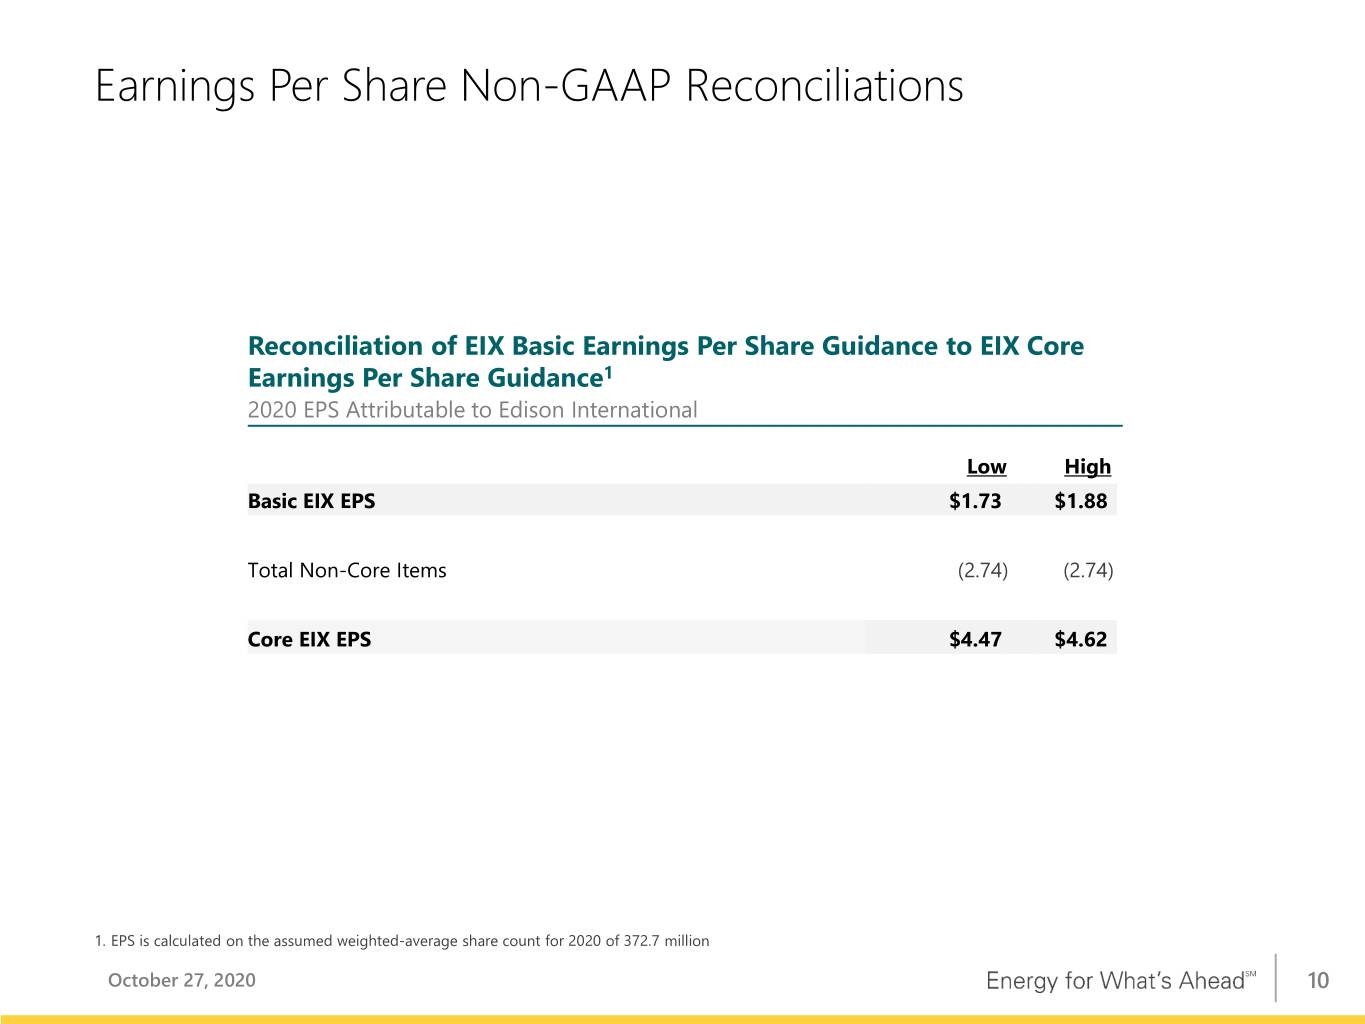
The company raised the low end of its earnings guidance range for 2020 as summarized in the following chart. See the presentation accompanying the company’s conference call for further information.
2020 Earnings Guidance
| 2020 Earnings Guidance | 2020 Earnings Guidance | ||||||||||||||||
| as of September 22, 2020 | as of October 27, 2020 | ||||||||||||||||
| Low | High | Low | High | ||||||||||||||
| EIX Basic EPS | $4.09 | $4.34 | $1.73 | $1.88 | |||||||||||||
| Less: Non-core Items* | (0.28) | (0.28) | (2.74) | (2.74) | |||||||||||||
| EIX Core EPS | $4.37 | $4.62 | $4.47 | $4.62 | |||||||||||||
* There were ($1.0) billion, or ($2.74) per share of non-core items recorded for the nine months ended September 30, 2020, calculated based on an assumed weighted average share count for 2020. The non-core items as of September 22, 2020, were based on non-core items recorded for the six months ended June 30, 2020.
Edison International Reports Third Quarter and Year-to-Date 2020 Financial Results
Page 3 of 11
Third Quarter 2020 Earnings Conference Call Materials
Edison International has posted its earnings conference call prepared remarks by the CEO and CFO, the teleconference presentation, and Form 10-Q to the company's investor relations website. These materials are available at www.edisoninvestor.com.
Reminder: Edison International Will Hold a Conference Call Today
When: Tuesday, October 27, 2020, 1:30 p.m. (Pacific Time)
Telephone Numbers: 1-888-673-9780 (US) and 1-312-470-0178 (Int'l) - Passcode: Edison
Telephone Replay: 1-866-518-0081 (US) and 1-402-220-5218 (Int’l) - Passcode: 2548
Telephone replay available through November 10, 2020
Webcast: www.edisoninvestor.com
About Edison International
Edison International (NYSE: EIX) is one of the nation’s largest electric utility holding companies, providing clean and reliable energy and energy services through its independent companies. Headquartered in Rosemead, California, Edison International is the parent company of Southern California Edison Company, a utility that delivers electricity to 15 million people across Southern, Central and Coastal California. Edison International is also the parent company of Edison Energy, a global energy advisory company delivering comprehensive, data-driven energy solutions to commercial and industrial users to meet their cost, sustainability and risk goals.
Edison International Reports Third Quarter and Year-to-Date 2020 Financial Results
Page 4 of 11
Appendix
Use of Non-GAAP Financial Measures
Edison International’s earnings are prepared in accordance with generally accepted accounting principles used in the United States and represent the company’s earnings as reported to the Securities and Exchange Commission. Our management uses core earnings and core earnings per share (EPS) internally for financial planning and for analysis of performance of Edison International and Southern California Edison. We also use core earnings and core EPS when communicating with analysts and investors regarding our earnings results to facilitate comparisons of the Company’s performance from period to period. Financial measures referred to as net income, basic EPS, core earnings, or core EPS also apply to the description of earnings or earnings per share.
Core earnings and core EPS are non-GAAP financial measures and may not be comparable to those of other companies. Core earnings and core EPS are defined as basic earnings and basic EPS excluding income or loss from discontinued operations and income or loss from significant discrete items that management does not consider representative of ongoing earnings. Basic earnings and losses refer to net income or losses attributable to Edison International shareholders. Core earnings are reconciled to basic earnings in the attached tables. The impact of participating securities (vested awards that earn dividend equivalents that may participate in undistributed earnings with common stock) for the principal operating subsidiary is not material to the principal operating subsidiary’s EPS and is therefore reflected in the results of the Edison International holding company, which is included in Edison International Parent and Other.
Safe Harbor Statement
Statements contained in this presentation about future performance, including, without limitation, operating results, capital expenditures, rate base growth, dividend policy, financial outlook, and other statements that are not purely historical, are forward-looking statements. These forward-looking statements reflect our current expectations; however, such statements involve risks and uncertainties. Actual results could differ materially from current expectations. These forward-looking statements represent our expectations only as of the date of this presentation, and Edison International assumes no duty to update them to reflect new information, events or circumstances. Important factors that could cause different results include, but are not limited to the:
•ability of SCE to recover its costs through regulated rates, including costs related to uninsured wildfire-related and mudslide-related liabilities, costs incurred to mitigate the risk of utility equipment causing future wildfires, costs incurred to implement SCE's new customer service system and costs incurred as a result of the COVID-19 pandemic;
•ability of SCE to implement its Wildfire Mitigation Plan, including effectively implementing Public Safety Power Shutoffs when appropriate;
•ability to obtain sufficient insurance at a reasonable cost, including insurance relating to SCE's nuclear facilities and wildfire-related claims, and to recover the costs of such insurance or, in the event liabilities exceed insured amounts, the ability to recover uninsured losses from customers or other parties;
•risks associated with California Assembly Bill 1054 (“AB 1054”) effectively mitigating the significant risk faced by California investor-owned utilities related to liability for damages arising from catastrophic wildfires where utility facilities are alleged to be a substantial cause, including SCE's ability to maintain a valid safety certification, SCE's ability to recover uninsured wildfire-related costs from the insurance fund established under AB 1054 (“Wildfire Insurance Fund”), the longevity of the Wildfire Insurance Fund, and the CPUC's interpretation of and actions under AB 1054, including their interpretation of the new prudency standard established under AB 1054;
•decisions and other actions by the California Public Utilities Commission, the Federal Energy Regulatory Commission, the Nuclear Regulatory Commission and other governmental authorities, including decisions and actions related to nationwide or statewide crisis, determinations of authorized rates of return or return on equity, the recoverability of wildfire-related and mudslide-related costs, issuance of SCE's wildfire safety certification, wildfire mitigation efforts, and delays in executive, regulatory and legislative actions;
Edison International Reports Third Quarter and Year-to-Date 2020 Financial Results
Page 5 of 11
•ability of Edison International or SCE to borrow funds and access bank and capital markets on reasonable terms;
•risks associated with the decommissioning of San Onofre, including those related to worker and public safety, public opposition, permitting, governmental approvals, on-site storage of spent nuclear fuel, delays, contractual disputes, and cost overruns;
•pandemics, such as COVID-19, and other events that cause regional, statewide, national or global disruption, which could impact, among other things, Edison International's and SCE's business, operations, cash flows, liquidity and/or financial results and cause Edison International and SCE to incur unanticipated costs;
•extreme weather-related incidents and other natural disasters (including earthquakes and events caused, or exacerbated, by climate change, such as wildfires and extreme heat waves), which could cause, among other things, public safety issues, property damage, operational issues (such as rotating outages) and unanticipated costs;
•physical security of Edison International's and SCE's critical assets and personnel and the cybersecurity of Edison International's and SCE's critical information technology systems for grid control, and business, employee and customer data;
•risks associated with cost allocation resulting in higher rates for utility bundled service customers because of possible customer bypass or departure for other electricity providers such as Community Choice Aggregators (“CCA,” which are cities, counties, and certain other public agencies with the authority to generate and/or purchase electricity for their local residents and businesses) and Electric Service Providers (entities that offer electric power and ancillary services to retail customers, other than electrical corporations (like SCE) and CCAs);
•risks inherent in SCE's transmission and distribution infrastructure investment program, including those related to project site identification, public opposition, environmental mitigation, construction, permitting, power curtailment costs (payments due under power contracts in the event there is insufficient transmission to enable acceptance of power delivery), changes in the California Independent System Operator’s transmission plans, and governmental approvals; and
•risks associated with the operation of transmission and distribution assets and power generating facilities, including worker and public safety issues, the risk of utility assets causing or contributing to wildfires, failure, availability, efficiency, and output of equipment and facilities, and availability and cost of spare parts.
Additional information about risks and uncertainties, including more detail about the factors described in this report, is contained throughout this report and in the 2019 Form 10-K, including the "Risk Factors" section. Readers are urged to read this entire report, including information incorporated by reference, as well as the 2019 Form 10-K, and carefully consider the risks, uncertainties, and other factors that affect Edison International's and SCE's businesses. Edison International and SCE post or provide direct links (i) to certain SCE and other parties' regulatory filings and documents with the CPUC and the FERC and certain agency rulings and notices in open proceedings in a section titled "SCE Regulatory Highlights," (ii) to certain documents and information related to Southern California wildfires which may be of interest to investors in a section titled "Southern California Wildfires," and (iii) to presentations, documents and other information that may be of interest to investors in a section title "Events and Presentations" at www.edisoninvestor.com in order to publicly disseminate such information.
These forward-looking statements represent our expectations only as of the date of this news release, and Edison International assumes no duty to update them to reflect new information, events or circumstances. Readers should review future reports filed by Edison International and SCE with the SEC.
Edison International Reports Third Quarter and Year-to-Date 2020 Financial Results
Page 6 of 11
Third Quarter Reconciliation of Basic Earnings Per Share to Core Earnings Per Share
| Three months ended September 30, | Nine months ended September 30, | ||||||||||||||||||||||||||||||||||
| 2020 | 2019 | Change | 2020 | 2019 | Change | ||||||||||||||||||||||||||||||
| (Loss) earnings per share attributable to Edison International | |||||||||||||||||||||||||||||||||||
| Continuing operations | |||||||||||||||||||||||||||||||||||
| SCE | $ | (0.70) | $ | 1.45 | $ | (2.15) | $ | 0.90 | $ | 3.65 | $ | (2.75) | |||||||||||||||||||||||
Edison International Parent and Other | (0.06) | (0.09) | 0.03 | (0.33) | (0.22) | (0.11) | |||||||||||||||||||||||||||||
| Edison International | (0.76) | 1.36 | (2.12) | 0.57 | 3.43 | (2.86) | |||||||||||||||||||||||||||||
| Less: Non-core items | |||||||||||||||||||||||||||||||||||
| SCE | (2.43) | (0.14) | (2.29) | (2.69) | (0.30) | (2.39) | |||||||||||||||||||||||||||||
Edison International Parent and Other | — | — | — | (0.07) | — | (0.07) | |||||||||||||||||||||||||||||
| Total non-core items | (2.43) | (0.14) | (2.29) | (2.76) | (0.30) | (2.46) | |||||||||||||||||||||||||||||
| Core earnings (losses) | |||||||||||||||||||||||||||||||||||
| SCE | 1.73 | 1.59 | 0.14 | 3.59 | 3.95 | (0.36) | |||||||||||||||||||||||||||||
Edison International Parent and Other | (0.06) | (0.09) | 0.03 | (0.26) | (0.22) | (0.04) | |||||||||||||||||||||||||||||
| Edison International | $ | 1.67 | $ | 1.50 | $ | 0.17 | $ | 3.33 | $ | 3.73 | $ | (0.40) | |||||||||||||||||||||||
Note: Diluted (loss) earnings were $(0.76) and $1.35 per share for the three months ended September 30, 2020 and 2019, respectively, and $0.57 and $3.42 per share for the nine months ended September 30, 2020 and 2019, respectively.
Edison International Reports Third Quarter and Year-to-Date 2020 Financial Results
Page 7 of 11
Third Quarter Reconciliation of Basic Earnings Per Share to Core Earnings (in millions)
| Three months ended September 30, | Nine months ended September 30, | ||||||||||||||||||||||||||||||||||
| (in millions) | 2020 | 2019 | Change | 2020 | 2019 | Change | |||||||||||||||||||||||||||||
| Net (loss) income attributable to Edison International | |||||||||||||||||||||||||||||||||||
| Continuing operations | |||||||||||||||||||||||||||||||||||
| SCE | $ | (264) | $ | 503 | $ | (767) | $ | 336 | $ | 1,215 | $ | (879) | |||||||||||||||||||||||
Edison International Parent and Other | (24) | (32) | 8 | (123) | (74) | (49) | |||||||||||||||||||||||||||||
| Edison International | (288) | 471 | (759) | 213 | 1,141 | (928) | |||||||||||||||||||||||||||||
| Less: Non-core items | |||||||||||||||||||||||||||||||||||
SCE1,2,3,4,5,6 | (920) | (48) | (872) | (994) | (99) | (895) | |||||||||||||||||||||||||||||
Edison International Parent and Other2,7 | — | — | — | (28) | — | (28) | |||||||||||||||||||||||||||||
| Total non-core items | (920) | (48) | (872) | (1,022) | (99) | (923) | |||||||||||||||||||||||||||||
| Core earnings (losses) | |||||||||||||||||||||||||||||||||||
| SCE | 656 | 551 | 105 | 1,330 | 1,314 | 16 | |||||||||||||||||||||||||||||
| Edison International Parent and Other | (24) | (32) | 8 | (95) | (74) | (21) | |||||||||||||||||||||||||||||
| Edison International | $ | 632 | $ | 519 | $ | 113 | $ | 1,235 | $ | 1,240 | $ | (5) | |||||||||||||||||||||||
1 Includes amortization of SCE’s Wildfire Insurance Fund expenses of $85 million ($61 million after-tax) and $252 million ($181 million after-tax) for the quarter and year-ended September 30, 2020, respectively and $67 million ($48 million after-tax) recorded in the third quarter of 2019.
2 Includes income tax benefit of $18 million and income tax expense of $3 million recorded in the first quarter of 2020 for SCE and Edison International Parent and Other, respectively, due to re-measurement of uncertain tax positions related to the 2010 – 2012 California state tax filings currently under audit.
3 Includes income tax benefits of $69 million recorded in 2019 for SCE related to changes in the allocation of deferred tax re-measurement between customers and shareholders as a result of a CPUC resolution issued in February 2019. The resolution determined that customers are only entitled to excess deferred taxes which were included when setting rates and other deferred tax re-measurement belongs to shareholders.
4 Includes gains of $80 million ($58 million after-tax) recorded in 2020 and $4 million ($3 million after-tax) recorded in 2019 for SCE's sale of San Onofre nuclear fuel.
5 Includes a charge of $1.2 billion ($889 million after-tax) recorded in 2020 for SCE's 2017/2018 Wildfire/Mudslide Events claims and expenses, net of recoveries.
6 Includes an impairment charge of $170 million ($123 million after-tax) recorded in 2019 for SCE related to disallowed historical capital expenditures in SCE's 2018 GRC decision.
7 Includes a goodwill impairment charge of $34 million ($25 million after-tax) recorded in 2020 for Edison International Parent and Other related to Edison Energy stemming from the economic impact of COVID-19.
Edison International Reports Third Quarter and Year-to-Date 2020 Financial Results
Page 8 of 11
| Consolidated Statements of Income | Edison International | ||||||||||||||||||||||
| Three months ended September 30, | Nine months ended September 30, | ||||||||||||||||||||||
(in millions, except per-share amounts, unaudited) | 2020 | 2019 | 2020 | 2019 | |||||||||||||||||||
| Total operating revenue | $ | 4,644 | $ | 3,741 | $ | 10,421 | $ | 9,377 | |||||||||||||||
| Purchased power and fuel | 1,817 | 1,708 | 3,813 | 3,848 | |||||||||||||||||||
| Operation and maintenance | 1,248 | 774 | 2,885 | 2,251 | |||||||||||||||||||
| Wildfire-related claims, net of insurance recoveries | 1,297 | — | 1,303 | — | |||||||||||||||||||
| Wildfire Insurance Fund expense | 85 | 67 | 252 | 67 | |||||||||||||||||||
| Depreciation and amortization | 490 | 459 | 1,463 | 1,260 | |||||||||||||||||||
| Property and other taxes | 114 | 99 | 328 | 302 | |||||||||||||||||||
| Impairment and other | (28) | — | (46) | 166 | |||||||||||||||||||
| Other operating income | — | (2) | — | (5) | |||||||||||||||||||
| Total operating expenses | 5,023 | 3,105 | 9,998 | 7,889 | |||||||||||||||||||
| Operating (loss) income | (379) | 636 | 423 | 1,488 | |||||||||||||||||||
| Interest expense | (222) | (214) | (676) | (619) | |||||||||||||||||||
| Other income | 84 | 58 | 217 | 151 | |||||||||||||||||||
| (Loss) income before income taxes | (517) | 480 | (36) | 1,020 | |||||||||||||||||||
| Income tax benefit | (275) | (22) | (355) | (212) | |||||||||||||||||||
| Net (loss) income | (242) | 502 | 319 | 1,232 | |||||||||||||||||||
| Preferred and preference stock dividend requirements of SCE | 46 | 31 | 106 | 91 | |||||||||||||||||||
Net (loss) income attributable to Edison International common shareholders | $ | (288) | $ | 471 | $ | 213 | $ | 1,141 | |||||||||||||||
| Basic (loss) earnings per share: | |||||||||||||||||||||||
| Weighted average shares of common stock outstanding | 378 | 347 | 371 | 333 | |||||||||||||||||||
Basic (loss) earnings per common share attributable to Edison International common shareholders: | $ | (0.76) | $ | 1.36 | $ | 0.57 | $ | 3.43 | |||||||||||||||
| Diluted (loss) earnings per share: | |||||||||||||||||||||||
Weighted average shares of common stock outstanding, including effect of dilutive securities | 378 | 349 | 372 | 334 | |||||||||||||||||||
| Diluted (loss) earnings per common share attributable to Edison International common shareholders | $ | (0.76) | $ | 1.35 | $ | 0.57 | $ | 3.42 | |||||||||||||||
Edison International Reports Third Quarter and Year-to-Date 2020 Financial Results
Page 9 of 11
| Consolidated Balance Sheets | Edison International | ||||||||||
| (in millions, unaudited) | September 30, 2020 | December 31, 2019 | |||||||||
| ASSETS | |||||||||||
| Cash and cash equivalents | $ | 92 | $ | 68 | |||||||
Receivables, less allowances of $142 and $50 for uncollectible accounts at respective dates | 1,399 | 788 | |||||||||
| Accrued unbilled revenue | 708 | 488 | |||||||||
| Insurance receivable | 843 | — | |||||||||
| Income tax receivables | 72 | 118 | |||||||||
| Inventory | 387 | 364 | |||||||||
| Prepaid expenses | 338 | 214 | |||||||||
| Regulatory assets | 1,530 | 1,009 | |||||||||
| Wildfire Insurance Fund contributions | 323 | 323 | |||||||||
| Other current assets | 163 | 188 | |||||||||
| Total current assets | 5,855 | 3,560 | |||||||||
| Nuclear decommissioning trusts | 4,650 | 4,562 | |||||||||
| Other investments | 85 | 64 | |||||||||
| Total investments | 4,735 | 4,626 | |||||||||
Utility property, plant and equipment, less accumulated depreciation and amortization of $10,561 and $9,958 at respective dates | 46,294 | 44,198 | |||||||||
Nonutility property, plant and equipment, less accumulated depreciation of $92 and $86 at respective dates | 176 | 87 | |||||||||
| Total property, plant and equipment | 46,470 | 44,285 | |||||||||
| Regulatory assets | 6,446 | 6,088 | |||||||||
| Wildfire Insurance Fund contributions | 2,525 | 2,767 | |||||||||
| Operating lease right-of-use assets | 1,112 | 693 | |||||||||
| Other long-term assets | 1,413 | 2,363 | |||||||||
| Total long-term assets | 11,496 | 11,911 | |||||||||
| Total assets | $ | 68,556 | $ | 64,382 | |||||||
Edison International Reports Third Quarter and Year-to-Date 2020 Financial Results
Page 10 of 11
| Consolidated Balance Sheets | Edison International | ||||||||||
| (in millions, except share amounts, unaudited) | September 30, 2020 | December 31, 2019 | |||||||||
| LIABILITIES AND EQUITY | |||||||||||
| Short-term debt | $ | 1,751 | $ | 550 | |||||||
| Current portion of long-term debt | 1,029 | 479 | |||||||||
| Accounts payable | 1,691 | 1,752 | |||||||||
| Customer deposits | 259 | 302 | |||||||||
| Regulatory liabilities | 801 | 972 | |||||||||
| Current portion of operating lease liabilities | 210 | 80 | |||||||||
| Wildfire-related claims | 1,192 | — | |||||||||
| Other current liabilities | 1,683 | 1,388 | |||||||||
| Total current liabilities | 8,616 | 5,523 | |||||||||
| Long-term debt | 18,958 | 17,864 | |||||||||
| Deferred income taxes and credits | 5,161 | 5,078 | |||||||||
| Pensions and benefits | 641 | 674 | |||||||||
| Asset retirement obligations | 2,988 | 3,029 | |||||||||
| Regulatory liabilities | 8,089 | 8,385 | |||||||||
| Operating lease liabilities | 902 | 613 | |||||||||
| Wildfire-related claims | 4,643 | 4,568 | |||||||||
| Other deferred credits and other long-term liabilities | 2,909 | 3,152 | |||||||||
| Total deferred credits and other liabilities | 25,333 | 25,499 | |||||||||
| Total liabilities | 52,907 | 48,886 | |||||||||
| Commitments and contingencies | |||||||||||
Common stock, no par value (800,000,000 shares authorized; 378,512,829 and 361,985,133 shares issued and outstanding at respective dates) | 5,930 | 4,990 | |||||||||
| Accumulated other comprehensive loss | (63) | (69) | |||||||||
| Retained earnings | 7,881 | 8,382 | |||||||||
| Total Edison International's common shareholders' equity | 13,748 | 13,303 | |||||||||
| Noncontrolling interests – preferred and preference stock of SCE | 1,901 | 2,193 | |||||||||
| Total equity | 15,649 | 15,496 | |||||||||
| Total liabilities and equity | $ | 68,556 | $ | 64,382 | |||||||
Edison International Reports Third Quarter and Year-to-Date 2020 Financial Results
Page 11 of 11
| Consolidated Statements of Cash Flows | Edison International | |||||||||||||
| Nine months ended September 30, | ||||||||||||||
| (in millions, unaudited) | 2020 | 2019 | ||||||||||||
| Cash flows from operating activities: | ||||||||||||||
| Net income | $ | 319 | $ | 1,232 | ||||||||||
| Adjustments to reconcile to net cash provided by operating activities: | ||||||||||||||
| Depreciation and amortization | 1,512 | 1,316 | ||||||||||||
| Allowance for equity during construction | (87) | (75) | ||||||||||||
| Impairment and other | (46) | 166 | ||||||||||||
| Deferred income taxes | (344) | (221) | ||||||||||||
| Wildfire Insurance Fund amortization expense | 252 | 67 | ||||||||||||
| Other | 31 | 21 | ||||||||||||
| Nuclear decommissioning trusts | (123) | (114) | ||||||||||||
| Contributions to Wildfire Insurance Fund | — | (2,363) | ||||||||||||
| Changes in operating assets and liabilities: | ||||||||||||||
| Receivables | (556) | (383) | ||||||||||||
| Inventory | (24) | (68) | ||||||||||||
| Accounts payable | 7 | 284 | ||||||||||||
| Tax receivables and payables | 197 | 163 | ||||||||||||
| Other current assets and liabilities | (311) | (340) | ||||||||||||
| Regulatory assets and liabilities, net | (1,074) | (470) | ||||||||||||
| Wildfire-related insurance receivable | 73 | — | ||||||||||||
| Wildfire-related claims | 1,267 | — | ||||||||||||
| Other noncurrent assets and liabilities | (22) | (32) | ||||||||||||
| Net cash provided by (used in) operating activities | 1,071 | (817) | ||||||||||||
| Cash flows from financing activities: | ||||||||||||||
Long-term debt issued, plus premium and net of discount and issuance costs of $26 and $2 for the respective periods | 2,726 | 2,902 | ||||||||||||
| Long-term debt repaid or repurchased | (1,098) | (81) | ||||||||||||
| Term loan and revolving credit facility borrowing | 1,929 | 1,750 | ||||||||||||
| Term loan repaid | (800) | (750) | ||||||||||||
| Common stock issued | 896 | 2,165 | ||||||||||||
| Preferred and preference stock redeemed | (308) | — | ||||||||||||
| Short-term debt financing, net | 73 | (722) | ||||||||||||
| Payments for stock-based compensation | (3) | (64) | ||||||||||||
| Receipts from stock option exercises | 14 | 51 | ||||||||||||
| Dividends and distribution to noncontrolling interests | (97) | (96) | ||||||||||||
| Dividends paid | (691) | (594) | ||||||||||||
| Other | 6 | (3) | ||||||||||||
| Net cash provided by financing activities | 2,647 | 4,558 | ||||||||||||
| Cash flows from investing activities: | ||||||||||||||
| Capital expenditures | (3,897) | (3,497) | ||||||||||||
| Proceeds from sale of nuclear decommissioning trust investments | 4,754 | 3,354 | ||||||||||||
| Purchases of nuclear decommissioning trust investments | (4,631) | (3,240) | ||||||||||||
| Proceeds from sale of San Onofre nuclear fuel | 86 | 4 | ||||||||||||
| Other | (6) | 34 | ||||||||||||
| Net cash used in investing activities | (3,694) | (3,345) | ||||||||||||
| Net increase in cash, cash equivalents and restricted cash | 24 | 396 | ||||||||||||
| Cash, cash equivalents and restricted cash at beginning of period | 70 | 152 | ||||||||||||
| Cash, cash equivalents and restricted cash at end of period | $ | 94 | $ | 548 | ||||||||||
Exhibit 99.2
Prepared Remarks of Edison International CEO and CFO
Third Quarter 2020 Earnings Teleconference
October 27, 2020, 1:30 p.m. (PT)
Pedro Pizarro, President and Chief Executive Officer, Edison International
Today, Edison International reported core earnings per share of $1.67 for the third quarter 2020, up 17 cents compared to the same period last year. This increase was primarily due to higher CPUC-related revenue from the 2018 GRC escalation mechanism, and lower expenses from regulatory deferrals related to wildfire mitigation activities, partially offset by equity share dilution. Reflecting our strong year-to-date performance and our confidence in the outlook for the year, we are narrowing our 2020 guidance range to $4.47 to $4.62 by raising the low end 10 cents. Maria will discuss our financial performance in detail in her report.
We continue to address the numerous impacts of COVID-19 on our operations, customers, and communities. At the same time, we recognize that climate change is driving unprecedented weather conditions and catastrophic wildfires in California, and the State is in the midst of another active wildfire season. Our thoughts are with the communities and families impacted, and we are thankful for the first responders who have worked tirelessly to contain the fires and protect the lives and property of Californians. At Edison, safety remains our first and highest priority. SCE continues implementing measures to reduce wildfire risk, working closely with local first responders and emergency managers, and communicating regularly with customers to improve awareness and promote preparedness.
On the California legislative front, this year's session was shortened due to COVID-19. The Legislature prioritized the State’s COVID-19 response and wildfire risk reduction. The Governor signed several pieces of legislation that build on the State’s investments in firefighting personnel, and technology and fuels management projects. I am also pleased that two issues advocated by SCE — clarifying the AB 1054 insurance policy year and obtaining the opportunity to securitize revenue undercollections and bad debt expense due to COVID-19 in 2020— were addressed by the Legislature through the unanimous passage of Assembly Bill 913.
1
During this wildfire season, we have seen near-record deployments of firefighters to contain major wildfires throughout the State, with over 19,000 first responders at the peak, which was the highest since 2008. Firefighters from CAL FIRE, the U.S. Forest Service, and numerous cities and counties have done a tremendous job this year despite being stretched due to significant lightning-driven wildfire complexes and having to work with COVID precautions. This reflects the work done over the past couple of years to significantly increase firefighting resources and enhance the ability to model and forecast fire progression to better position ground and aerial assets. SCE’s wildfire mitigation efforts augment those of State and local agencies. For example, SCE has improved its situational awareness and that of local fire authorities by installing 161 cameras. In late September, SCE contributed $2.2 million to the Orange County Fire Authority to secure the largest heavy lift helitanker in the world for this fire season, capable of night-time flying and making water drops of 3,000 gallons.
This helicopter was working all through last night on the Silverado fire in Orange County. As of this morning, the Orange County Fire Authority reported that this fire has burned over 11,000 acres and is 5% contained with no structure losses. Tragically, two firefighters have been seriously injured battling the blaze. SCE filed an electric safety incident report, or ESIR, yesterday on the Silverado fire.
As noted in the ESIR, there was no activity on a nearby SCE power line nor evidence of any downed power lines prior to the reported start of the fire. While SCE’s investigation is at an early stage, I would like to note that preliminary investigation suggests that a lashing wire attached to a third-party owned telecommunication line that sits beneath SCE’s power line may have contacted SCE’s power line above it, possibly igniting the fire. However, it is early to draw any definitive conclusions at this point.
I’ve mentioned before that covered conductor is the most effective and expeditious way for SCE to buy down public safety risk by preventing ignitions that can lead to catastrophic wildfires. SCE is on track to meet or exceed the target of 700 miles of installed covered conductor set in the 2020 Wildfire Mitigation Plan. Our utility made substantial enhancements over the past year to its Public Safety Power Shutoff, or PSPS, program. SCE has enhanced
2
communication and coordination with Government and communities and improved its capabilities to sectionalize circuits to reduce the number of customers impacted when a preventive de-energization is initiated.
In addition to our efforts to help reduce the risk of wildfires, the company continues to work to resolve wildfire-related litigation. As we noted on September 23rd, SCE resolved all insurance subrogation claims for the Thomas and Koenigstein fires and Montecito Mudslides. With this and other information in hand, we were able to move our accounting reserves from the low end of the estimable range to a best estimate, providing investors greater clarity on this and our related equity need.
Moving to regulatory actions at the CPUC, we are very pleased to see continued timely decisions and progress on our key filings as originally scheduled. This is a significant improvement in action and progress under the leadership of President Batjer. We commend the Commission and its staff for their continuing efforts in ensuring that proceedings are staying on schedule, despite challenges from the new remote working environment during the pandemic.
During this quarter, the CPUC issued decisions in several of SCE’s key filings. These include the 2020 Safety Certification, the Charge Ready 2 program, and the WEMA application, authorizing $505 million of wildfire insurance cost recovery and supporting continued treatment of insurance as a reasonable cost of service. We also received a proposed decision on our initial AB 1054 capex securitization application and see timely progress on track 1 of the 2021 GRC proceeding. Furthermore, SCE has reached a settlement-in-principle to resolve all issues pending in track 2 of the GRC.
SCE and numerous other parties filed their 2020 integrated resource plans. One of the principal objectives of this IRP is to help California meet its 2030 and 2045 GHG reduction targets. In SCE’s plan, we urged the Commission to adopt a 38 million metric ton target for 2030 to put California on a viable trajectory towards meeting its decarbonization goals. SCE also reiterated and highlighted a substantial CAISO system capacity need of 5,400 megawatts in the 2024 through 2026 timeframe due to planned power plant retirements. To address this, SCE has
3
recommended that the Commission update its reliability planning methodology, including increasing the planning reserve margin, to better reflect the State’s evolving electricity market and ensure system reliability. These recommendations are consistent with the conclusions found by the CAISO, the CPUC, and the California Energy Commission in their recent preliminary root cause analysis of the August rotating outages.
Last month, the Governor issued an executive order that moves up the timeframe to have all new vehicles sold in California be emission-free to 2035. The order aligns with our Pathway 2045 work, in which electric vehicles are an important element to achieve carbon neutrality. I am proud that Edison has been recognized as a thought leader on this front.
I want to underscore the importance of making necessary investments today to ensure we have a strong, safe, reliable, and resilient grid to accommodate the increasing electrification of the economy. This drives substantial investment opportunities to meet increased electricity usage and increased system complexity including more distributed energy resources, higher levels of renewable resources, and energy storage. Importantly, our analysis shows that this transition will also be affordable, since the greater efficiency of electric motors and appliances will reduce customers’ total costs across all energy commodities by one third by 2045.
Maria Rigatti, Executive Vice President and Chief Financial Officer, Edison International
Edison International reported core earnings of $1.67 per share for the third quarter 2020, an increase of 17 cents per share from the same period last year. This increase was primarily due to higher CPUC-related revenue due to the 2018 GRC escalation mechanism and lower expenses from regulatory deferrals related to wildfire mitigation activities. These were partially offset by equity share dilution. Reflecting our solid results for the first nine months of the year, we are once again narrowing our guidance range by raising the low end of our 2020 EPS estimate. I will discuss this in more detail later in my remarks.
On page 2, you can see SCE’s key EPS drivers on the right-hand side. I would like to highlight four items that accounted for much of the variance.
4
First, EPS increased by 43 cents related to higher revenue. CPUC-related revenue contributed 25 cents of this increase due to the escalation mechanism from the 2018 GRC decision. FERC and other operating revenue had a negative variance of 5 cents, largely because of the true-up for the 2018 Formula Rate case we recorded last year. There was also a positive variance of 23 cents primarily related to the balancing account for the GSRP settlement that was approved in April. However, there were offsets in expenses related to this variance.
Second, O&M had a positive variance of 8 cents, primarily due to recognizing lower wildfire mitigation expenses as a result of deferrals to regulatory assets. Third, income taxes had a negative impact of 13 cents, primarily reflecting lower tax benefits captured through our tax balancing account. Lastly, SCE’s EPS in the quarter was lower by 16 cents because of dilution from the increase in shares outstanding.
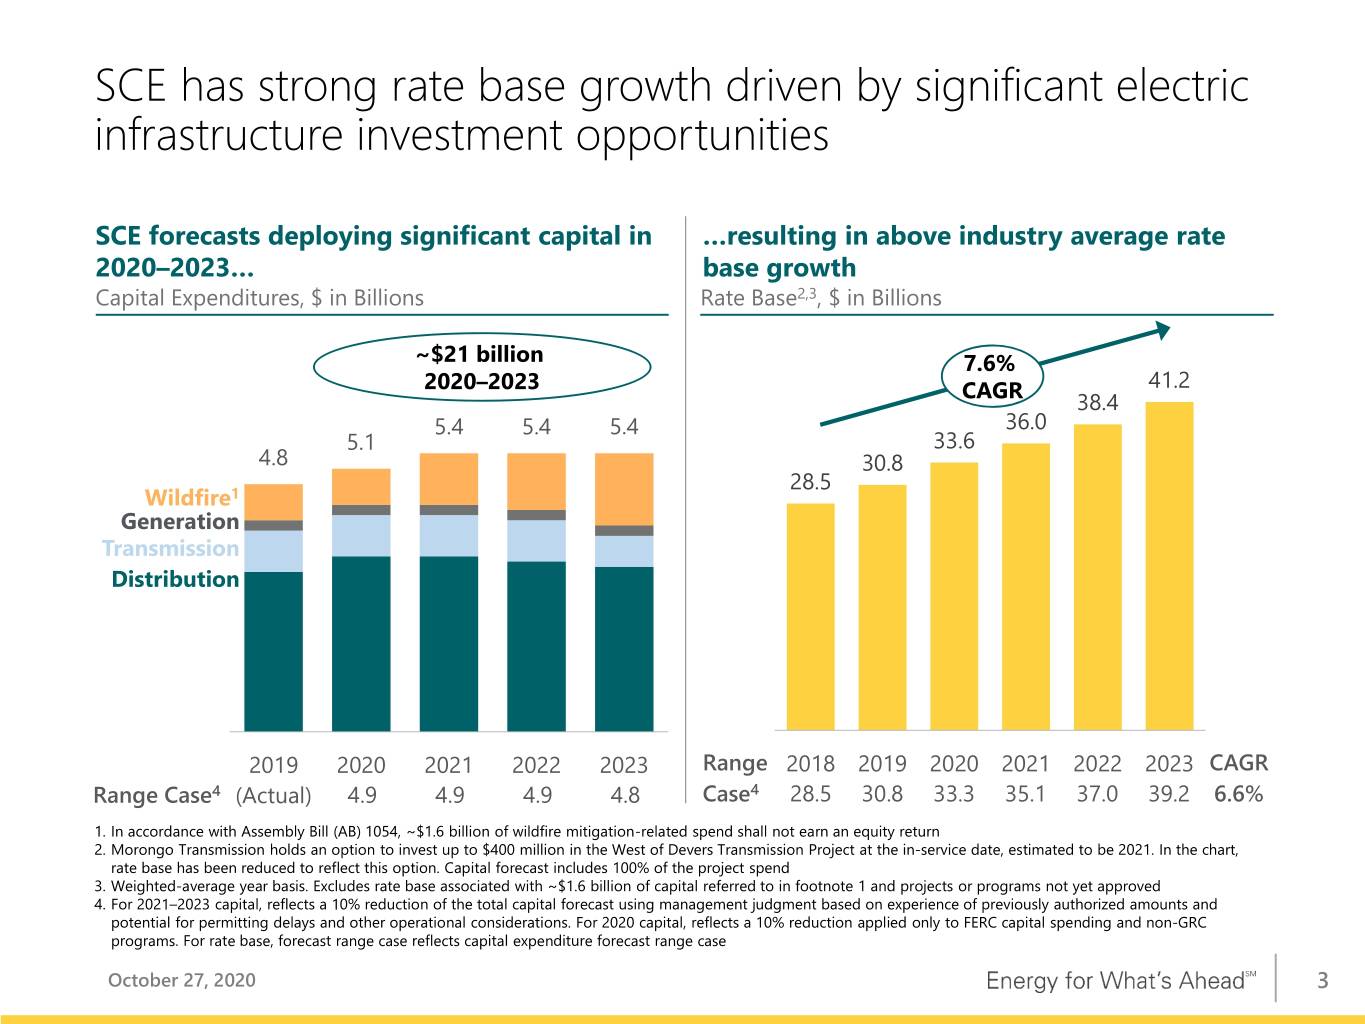
On page 3, you will see SCE’s capital expenditure and rate base forecast. Capex is consistent with last quarter’s forecast for 2021 through 2023, with a slight increase to 2020. Additionally, we updated the rate base forecast primarily for Charge Ready 2 and GRC rebuttal testimony. We continue to see significant opportunities to grow rate base over time, driven by investments in electric infrastructure, and this is reflected in our robust capital program of $20 to $21 billion over this period. This request level represents a compound annual growth rate of 7.6% in rate base over two rate case periods. After applying a 10% reduction to the total capital forecast to reflect our experience of previously authorized amounts and other operational considerations, the low end of the range still reflects strong rate base growth of 6.6%.
Please turn to page 4. Track 1 of the 2021 GRC proceeding has been on schedule and during the quarter, all related briefs were completed. We are now waiting for a decision and continue to expect that in first quarter 2021. To emphasize our previous statements, SCE’s core business will require minimal equity to fund our ongoing capital expenditures program beyond 2020. We will be able to quantify these levels after we receive the final approval of the GRC.
Page 5 summarizes our progress on SCE’s cost recovery filings for incremental 2018 and 2019 wildfire mitigation costs. In April, SCE received CPUC approval for the GSRP settlement,
5
which authorized recovery of $476 million of capital and $123 million of O&M. The decision approved a revenue requirement of $159 million, which went into rates on October 1st. The balance of the capital costs that were approved will be recovered as we securitize amounts related to wildfire mitigation, as authorized in AB 1054. In September, the WEMA application to recover $505 million of costs for wildfire insurance was approved. This is now included in rates and will be recovered over the next twenty-four months. Importantly, the CPUC noted in its decision that SCE had acted reasonably and prudently in its procurement of insurance policies. The Commission also recognized that wildfire liability insurance serves as an important protection for customers against third-party legal claims invoking the inverse condemnation doctrine and allegations of negligence. These decisions enable SCE to recover approximately $665 million of cash over the next two years and further strengthen its balance sheet and credit metrics. In addition, the CPUC recently issued a proposed decision on SCE’s application to securitize the GSRP capital noted above. When the financing is completed, it will add approximately $335 million to the cash position.
SCE and all intervenors reached a confidential settlement-in-principle regarding all issues in track 2 of the 2021 GRC. Once a definitive settlement is executed, a motion will be filed with the CPUC seeking approval. SCE expects a proposed decision on the track 2 settlement in Q1 2021. We will record the impact of the settlement once the Commission acts and do not expect a negative earnings impact.
I will highlight a number of other pending filings and future applications related to wildfire mitigation costs. First, we are due to receive a decision on our CEMA filing for certain drought and restoration costs in first quarter 2021. In the next few months, we also anticipate filing a WEMA application for excess insurance premium costs for July through December 2020. Finally, we will make our GRC track 3 filing in first quarter 2021, with a proposed decision expected a year later.
As for other regulatory actions during the quarter, the CPUC approved SCE’s Charge Ready 2 program, which supports approximately 38,000 light-duty EV charging ports. This is
6
the largest light-duty EV charging program by an investor-owned utility in the US, and will add approximately $400 million to SCE’s rate base by 2026.
Turning to guidance, pages 6 and 7 show our updated 2020 guidance and the key assumptions for modeling purposes. Let me highlight that we are once again narrowing our full year 2020 EPS guidance range to $4.47 to $4.62 per share by raising the low end of the range. This also increases the midpoint of the EPS range by 5 cents to $4.55. While most of the earnings assumptions are essentially unchanged from the last quarter, there are a couple of factors driving the majority of this upward revision. First, we now expect SCE earnings to be 4 cents higher than our previous assumption. This is driven by improvements of 1 cent in rate base earnings and 3 cents from SCE variances related to the timing of financing activities as well as operational items. Second, the EIX Parent and Other forecast has improved by 1 cent versus our previous estimate. These factors and our strong performance so far this year make us increasingly confident in our narrowed 2020 EPS guidance range.
Last month, we issued a news release about the September 2020 subrogation settlement and noted that we anticipate issuing approximately $1 billion of equity to invest in SCE, enabling the utility to debt finance wildfire claims payments. Since then, many of you have asked questions about the timing of the equity issuance. As we shared with you, we will provide an update on the fourth quarter 2020 earnings call. The timing of the equity issuance will be dependent upon the timing of future claims resolutions and payments that exceed insurance.
7
Exhibit 99.3 Third Quarter 2020 Financial Results October 27, 2020
Forward-Looking Statements Statements contained in this presentation about future performance, including, without limitation, operating results, capital expenditures, rate base growth, dividend policy, financial outlook, and other statements that are not purely historical, are forward-looking statements. These forward-looking statements reflect our current expectations; however, such statements involve risks and uncertainties. Actual results could differ materially from current expectations. These forward-looking statements represent our expectations only as of the date of this presentation, and Edison International assumes no duty to update them to reflect new information, events or circumstances. Important factors that could cause different results include, but are not limited to the: • ability of SCE to recover its costs through regulated rates, including costs related to uninsured wildfire-related and mudslide-related liabilities, costs incurred to mitigate the risk of utility equipment causing future wildfires, costs incurred to implement SCE's new customer service system and costs incurred as a result of the COVID-19 pandemic; • ability of SCE to implement its Wildfire Mitigation Plan, including effectively implementing Public Safety Power Shutoffs when appropriate; • ability to obtain sufficient insurance at a reasonable cost, including insurance relating to SCE's nuclear facilities and wildfire-related claims, and to recover the costs of such insurance or, in the event liabilities exceed insured amounts, the ability to recover uninsured losses from customers or other parties; • risks associated with California Assembly Bill 1054 (“AB 1054”) effectively mitigating the significant risk faced by California investor-owned utilities related to liability for damages arising from catastrophic wildfires where utility facilities are alleged to be a substantial cause, including SCE's ability to maintain a valid safety certification, SCE's ability to recover uninsured wildfire-related costs from the insurance fund established under AB 1054 (“Wildfire Insurance Fund”), the longevity of the Wildfire Insurance Fund, and the CPUC's interpretation of and actions under AB 1054, including their interpretation of the new prudency standard established under AB 1054; • decisions and other actions by the California Public Utilities Commission, the Federal Energy Regulatory Commission, the Nuclear Regulatory Commission and other governmental authorities, including decisions and actions related to nationwide or statewide crisis, determinations of authorized rates of return or return on equity, the recoverability of wildfire-related and mudslide-related costs, issuance of SCE's wildfire safety certification, wildfire mitigation efforts, and delays in executive, regulatory and legislative actions; • ability of Edison International or SCE to borrow funds and access bank and capital markets on reasonable terms; • risks associated with the decommissioning of San Onofre, including those related to worker and public safety, public opposition, permitting, governmental approvals, on-site storage of spent nuclear fuel, delays, contractual disputes, and cost overruns; • pandemics, such as COVID-19, and other events that cause regional, statewide, national or global disruption, which could impact, among other things, Edison International's and SCE's business, operations, cash flows, liquidity and/or financial results and cause Edison International and SCE to incur unanticipated costs; • extreme weather-related incidents and other natural disasters (including earthquakes and events caused, or exacerbated, by climate change, such as wildfires and extreme heat waves), which could cause, among other things, public safety issues, property damage, operational issues (such as rotating outages) and unanticipated costs; • physical security of Edison International's and SCE's critical assets and personnel and the cybersecurity of Edison International's and SCE's critical information technology systems for grid control, and business, employee and customer data; • risks associated with cost allocation resulting in higher rates for utility bundled service customers because of possible customer bypass or departure for other electricity providers such as Community Choice Aggregators (“CCA,” which are cities, counties, and certain other public agencies with the authority to generate and/or purchase electricity for their local residents and businesses) and Electric Service Providers (entities that offer electric power and ancillary services to retail customers, other than electrical corporations (like SCE) and CCAs); • risks inherent in SCE's transmission and distribution infrastructure investment program, including those related to project site identification, public opposition, environmental mitigation, construction, permitting, power curtailment costs (payments due under power contracts in the event there is insufficient transmission to enable acceptance of power delivery), changes in the California Independent System Operator’s transmission plans, and governmental approvals; and • risks associated with the operation of transmission and distribution assets and power generating facilities, including worker and public safety issues, the risk of utility assets causing or contributing to wildfires, failure, availability, efficiency, and output of equipment and facilities, and availability and cost of spare parts. Other important factors are discussed under the headings “Forward-Looking Statements”, “Risk Factors” and “Management’s Discussion and Analysis” in Edison International’s Form 10-K and other reports filed with the Securities and Exchange Commission, which are available on our website: www.edisoninvestor.com. These filings also provide additional information on historical and other factual data contained in this presentation. October 27, 2020 1
Third Quarter Earnings Summary Q3 Q3 2020 2019 Variance SCE EPS Drivers2 Higher revenue $ 0.43 Basic Earnings Per Share (EPS) CPUC revenue - GRC escalation 0.25 3 SCE $ (0.70) $ 1.45 $ (2.15) CPUC revenue - Balancing account and other 0.23 FERC and other operating revenue (0.05) EIX Parent & Other (0.06) (0.09) 0.03 Lower O&M 0.08 Higher depreciation (0.07) Basic EPS $ (0.76) $ 1.36 $ (2.12) Higher net financing costs (0.01) Less: Non-core Items Income taxes (0.13) Other — SCE1 $ (2.43) $ (0.14) $ (2.29) Property taxes and other (0.03) EIX Parent & Other — — — Other income and expenses 0.03 Results prior to impact from share dilution $ 0.30 Total Non-core $ (2.43) $ (0.14) $ (2.29) Impact from share dilution (0.16) Total core drivers $ 0.14 Core Earnings Per Share (EPS) Non-core items1 (2.29) Total $ (2.15) SCE $ 1.73 $ 1.59 $ 0.14 Key EIX EPS Drivers2 EIX Parent & Other (0.06) (0.09) 0.03 EIX parent — Primarily due to increased income tax Core EPS $ 1.67 $ 1.50 $ 0.17 benefits $ 0.02 Impact from share dilution 0.01 Total $ 0.03 1. See Earnings Non-GAAP Reconciliations and Use of Non-GAAP Financial Measures in Appendix 2. For comparability, 2020 core drivers are reported based on 2019 weighted-average share count of 347.1 million (2020 weighted-average shares outstanding is 378.4 million) 3. Includes revenue of $0.23 which is offset in O&M, depreciation and interest expense and property taxes and other; primarily related to $0.21 from Grid Safety and Resiliency Program Balancing Account Note: Diluted earnings were $(0.76) and $1.35 per share for the three months ended September 30, 2020 and 2019, respectively October 27, 2020 2
SCE has strong rate base growth driven by significant electric infrastructure investment opportunities SCE forecasts deploying significant capital in …resulting in above industry average rate 2020–2023… base growth Capital Expenditures, $ in Billions Rate Base2,3, $ in Billions ~$21 billion 7.6% 2020–2023 41.2 CAGR 38.4 5.4 5.4 5.4 36.0 5.1 33.6 4.8 30.8 28.5 Wildfire1 Generation Transmission Distribution 2019 2020 2021 2022 2023 Range 2018 2019 2020 2021 2022 2023 CAGR Range Case4 (Actual) 4.9 4.9 4.9 4.8 Case4 28.5 30.8 33.3 35.1 37.0 39.2 6.6% 1. In accordance with Assembly Bill (AB) 1054, ~$1.6 billion of wildfire mitigation-related spend shall not earn an equity return 2. Morongo Transmission holds an option to invest up to $400 million in the West of Devers Transmission Project at the in-service date, estimated to be 2021. In the chart, rate base has been reduced to reflect this option. Capital forecast includes 100% of the project spend 3. Weighted-average year basis. Excludes rate base associated with ~$1.6 billion of capital referred to in footnote 1 and projects or programs not yet approved 4. For 2021–2023 capital, reflects a 10% reduction of the total capital forecast using management judgment based on experience of previously authorized amounts and potential for permitting delays and other operational considerations. For 2020 capital, reflects a 10% reduction applied only to FERC capital spending and non-GRC programs. For rate base, forecast range case reflects capital expenditure forecast range case October 27, 2020 3
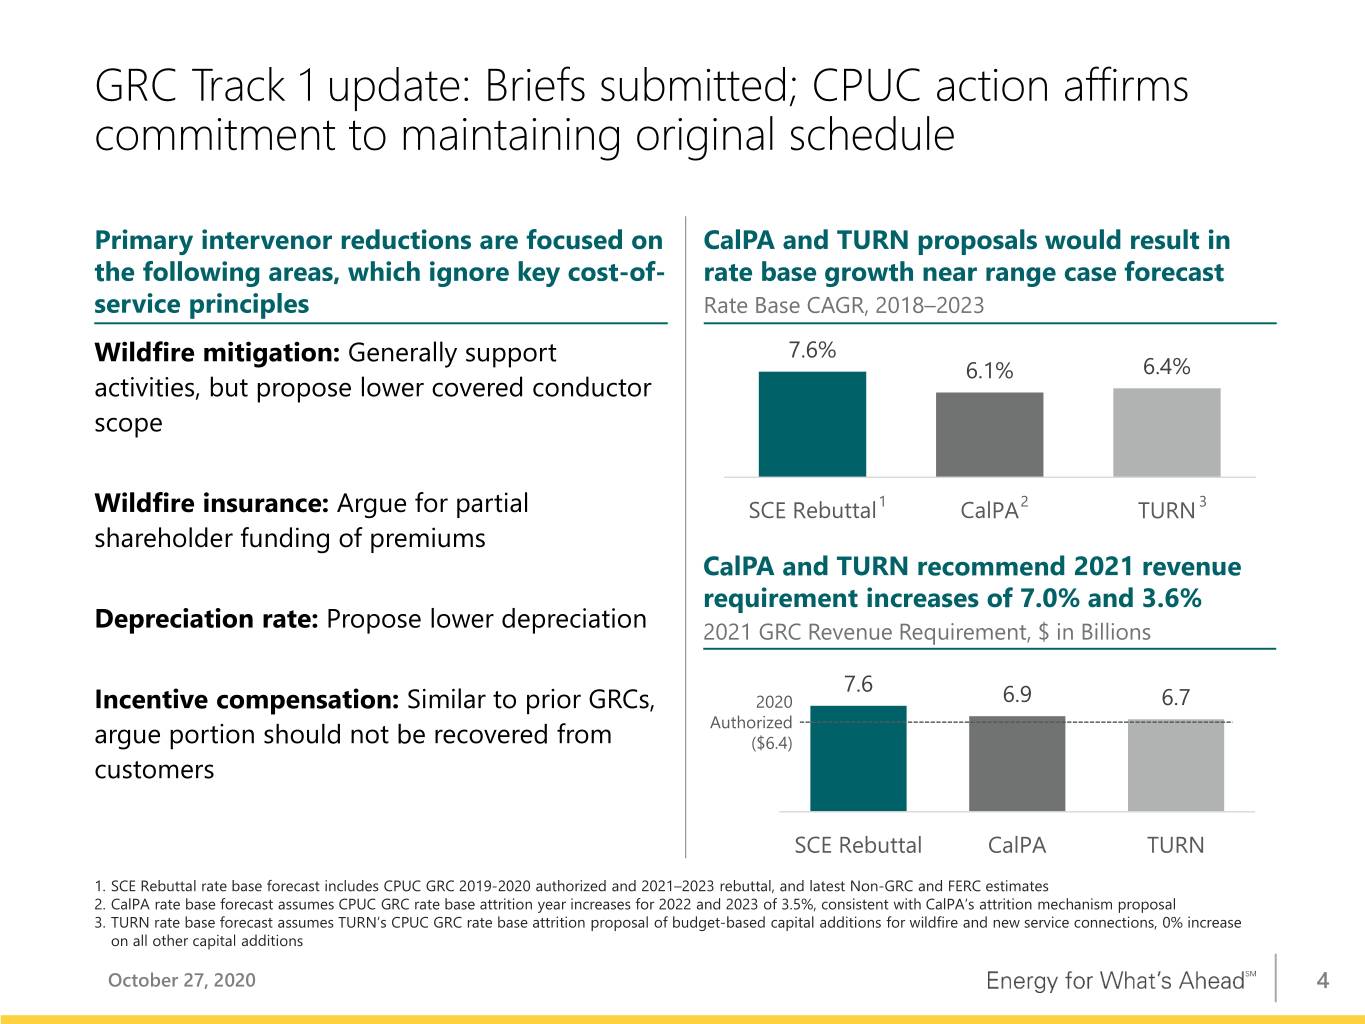
GRC Track 1 update: Briefs submitted; CPUC action affirms commitment to maintaining original schedule Primary intervenor reductions are focused on CalPA and TURN proposals would result in the following areas, which ignore key cost-of- rate base growth near range case forecast service principles Rate Base CAGR, 2018–2023 Wildfire mitigation: Generally support 7.6% 6.1% 6.4% activities, but propose lower covered conductor scope Wildfire insurance: Argue for partial SCE Rebuttal1 CalPA2 TURN 3 shareholder funding of premiums CalPA and TURN recommend 2021 revenue requirement increases of 7.0% and 3.6% Depreciation rate: Propose lower depreciation 2021 GRC Revenue Requirement, $ in Billions 7.6 Incentive compensation: Similar to prior GRCs, 2020 6.9 6.7 Authorized argue portion should not be recovered from ($6.4) customers SCE Rebuttal CalPA TURN 1. SCE Rebuttal rate base forecast includes CPUC GRC 2019-2020 authorized and 2021–2023 rebuttal, and latest Non-GRC and FERC estimates 2. CalPA rate base forecast assumes CPUC GRC rate base attrition year increases for 2022 and 2023 of 3.5%, consistent with CalPA’s attrition mechanism proposal 3. TURN rate base forecast assumes TURN’s CPUC GRC rate base attrition proposal of budget-based capital additions for wildfire and new service connections, 0% increase on all other capital additions October 27, 2020 4
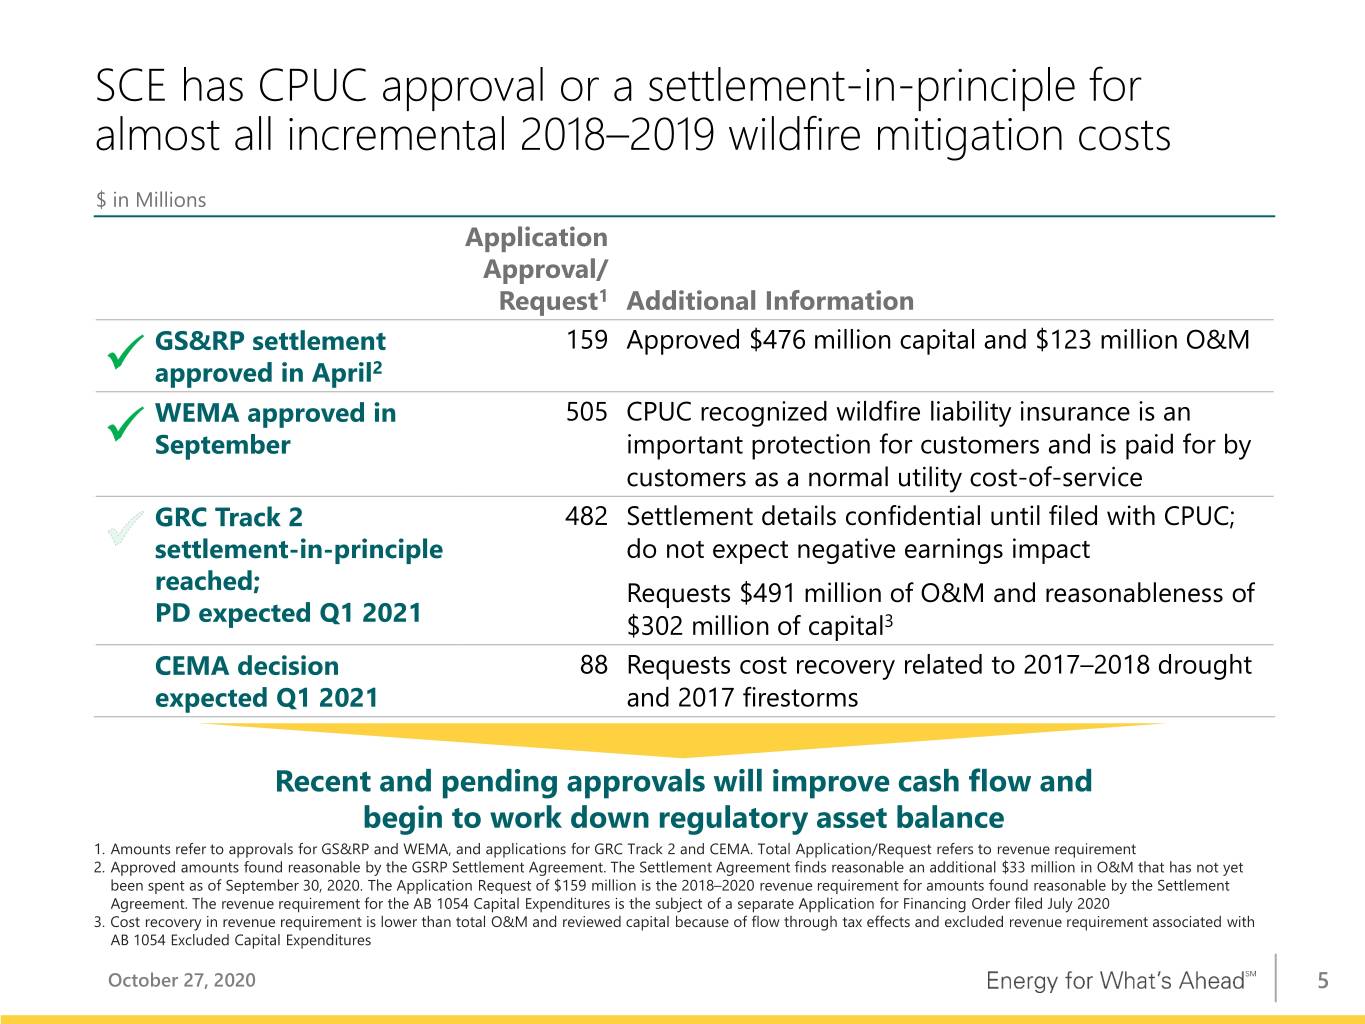
SCE has CPUC approval or a settlement-in-principle for almost all incremental 2018–2019 wildfire mitigation costs $ in Millions Application Approval/ Request1 Additional Information GS&RP settlement 159 Approved $476 million capital and $123 million O&M approved in April2 WEMA approved in 505 CPUC recognized wildfire liability insurance is an September important protection for customers and is paid for by customers as a normal utility cost-of-service GRC Track 2 482 Settlement details confidential until filed with CPUC; settlement-in-principle do not expect negative earnings impact reached; Requests $491 million of O&M and reasonableness of PD expected Q1 2021 $302 million of capital3 CEMA decision 88 Requests cost recovery related to 2017–2018 drought expected Q1 2021 and 2017 firestorms Recent and pending approvals will improve cash flow and begin to work down regulatory asset balance 1. Amounts refer to approvals for GS&RP and WEMA, and applications for GRC Track 2 and CEMA. Total Application/Request refers to revenue requirement 2. Approved amounts found reasonable by the GSRP Settlement Agreement. The Settlement Agreement finds reasonable an additional $33 million in O&M that has not yet been spent as of September 30, 2020. The Application Request of $159 million is the 2018–2020 revenue requirement for amounts found reasonable by the Settlement Agreement. The revenue requirement for the AB 1054 Capital Expenditures is the subject of a separate Application for Financing Order filed July 2020 3. Cost recovery in revenue requirement is lower than total O&M and reviewed capital because of flow through tax effects and excluded revenue requirement associated with AB 1054 Excluded Capital Expenditures October 27, 2020 5
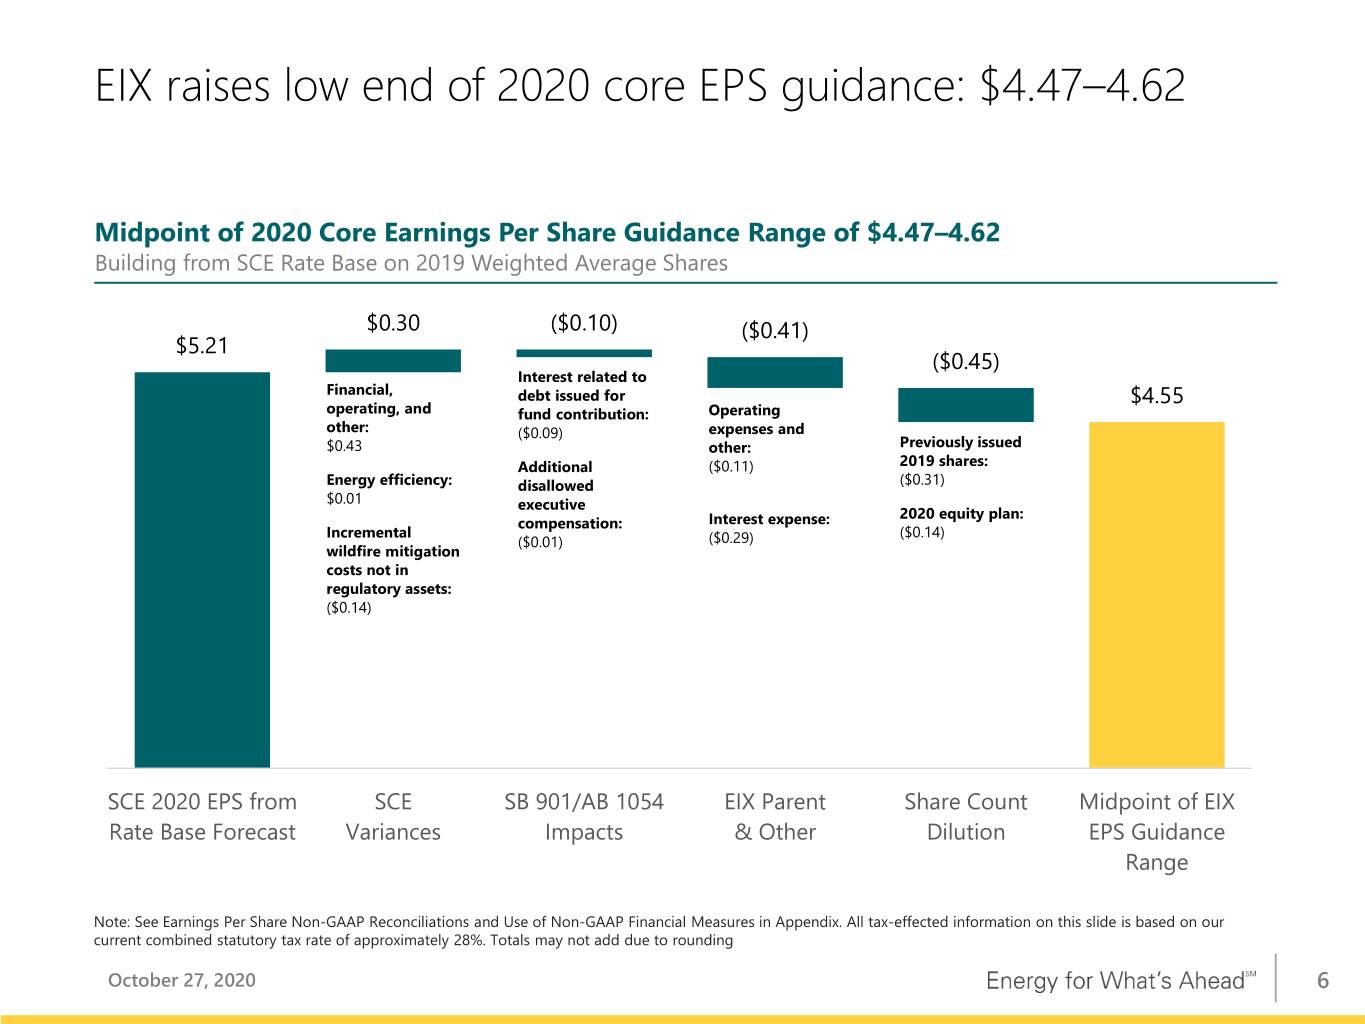
EIX raises low end of 2020 core EPS guidance: $4.47–4.62 Midpoint of 2020 Core Earnings Per Share Guidance Range of $4.47–4.62 Building from SCE Rate Base on 2019 Weighted Average Shares $0.30 ($0.10) ($0.41) $5.21 ($0.45) Interest related to Financial, debt issued for $4.55 operating, and fund contribution: Operating other: ($0.09) expenses and $0.43 other: Previously issued Additional ($0.11) 2019 shares: Energy efficiency: disallowed ($0.31) $0.01 executive 2020 equity plan: compensation: Interest expense: Incremental ($0.14) ($0.01) ($0.29) wildfire mitigation costs not in regulatory assets: ($0.14) SCE 2020 EPS from SCE SB 901/AB 1054 EIX Parent Share Count Midpoint of EIX Rate Base Forecast Variances Impacts & Other Dilution EPS Guidance Range Note: See Earnings Per Share Non-GAAP Reconciliations and Use of Non-GAAP Financial Measures in Appendix. All tax-effected information on this slide is based on our current combined statutory tax rate of approximately 28%. Totals may not add due to rounding October 27, 2020 6
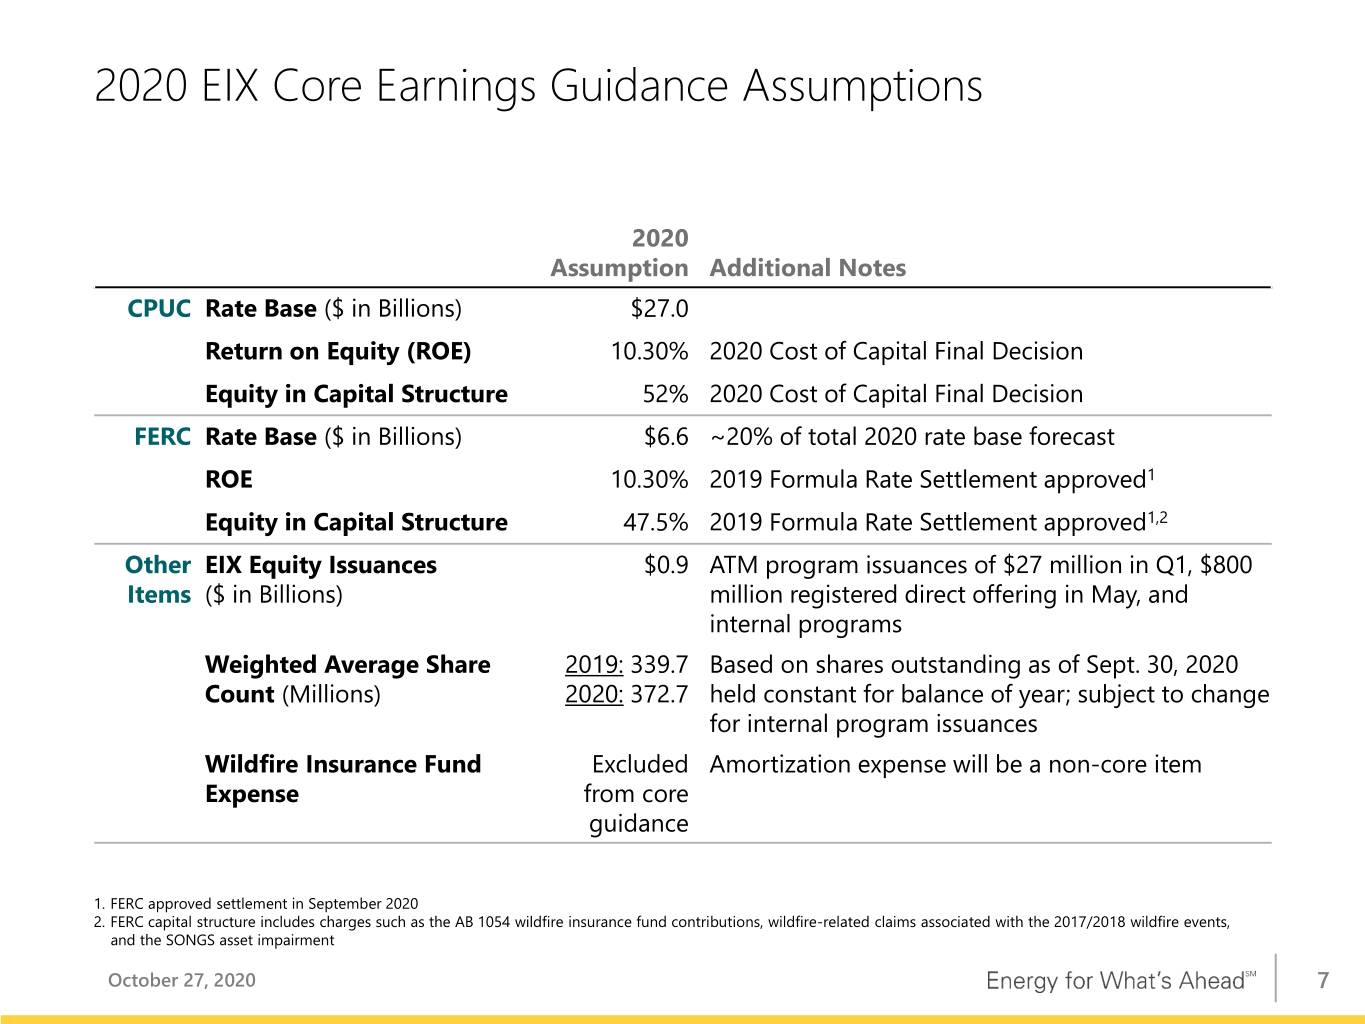
2020 EIX Core Earnings Guidance Assumptions 2020 Assumption Additional Notes CPUC Rate Base ($ in Billions) $27.0 Return on Equity (ROE) 10.30% 2020 Cost of Capital Final Decision Equity in Capital Structure 52% 2020 Cost of Capital Final Decision FERC Rate Base ($ in Billions) $6.6 ~20% of total 2020 rate base forecast ROE 10.30% 2019 Formula Rate Settlement approved1 Equity in Capital Structure 47.5% 2019 Formula Rate Settlement approved1,2 Other EIX Equity Issuances $0.9 ATM program issuances of $27 million in Q1, $800 Items ($ in Billions) million registered direct offering in May, and internal programs Weighted Average Share 2019: 339.7 Based on shares outstanding as of Sept. 30, 2020 Count (Millions) 2020: 372.7 held constant for balance of year; subject to change for internal program issuances Wildfire Insurance Fund Excluded Amortization expense will be a non-core item Expense from core guidance 1. FERC approved settlement in September 2020 2. FERC capital structure includes charges such as the AB 1054 wildfire insurance fund contributions, wildfire-related claims associated with the 2017/2018 wildfire events, and the SONGS asset impairment October 27, 2020 7

Appendix
Ye a r -to-Date Earnings Summary YTD YTD 2 2020 2019 Variance SCE EPS Drivers 3 Test Year 2018 GRC true-up in 2019 $ (0.20) Basic Earnings Per Share (EPS) Higher revenue 1.04 SCE $ 0.90 $ 3.65 $ (2.75) CPUC revenue - GRC Escalation 0.71 CPUC revenue - Balancing account and other4 0.28 EIX Parent & Other (0.33) (0.22) (0.11) FERC and other operating revenue 0.05 Higher O&M (0.42) Basic EPS $ 0.57 $ 3.43 $ (2.86) Higher depreciation (0.20) Higher net financing costs (0.06) Less: Non-core Items Income taxes (0.12) Other 0.01 1 SCE $ (2.69) $ (0.30) $ (2.39) Property taxes and other (0.07) 0.08 1 Other income and expenses EIX Parent & Other (0.07) — (0.07) Results prior to impact from share dilution $ 0.05 Impact from share dilution (0.41) Total Non-core $ (2.76) $ (0.30) $ (2.46) Total core drivers $ (0.36) Non-core items1 (2.39) Core Earnings Per Share (EPS) Total $ (2.75) 2 SCE $ 3.59 $ 3.95 $ (0.36) Key EIX EPS Drivers EIX parent and other — Higher interest expense, partially EIX Parent & Other (0.26) (0.22) (0.04) offset by increased income tax benefits $ (0.07) Impact from share dilution 0.03 Core EPS $ 3.33 $ 3.73 $ (0.40) Total core drivers $ (0.04) Non-core items1 (0.07) Total $ (0.11) 1. See Earnings Non-GAAP Reconciliations and Use of Non-GAAP Financial Measures in Appendix 2. For comparability, 2020 core drivers are reported based on 2019 weighted-average share count of 333 million (2020 weighted-average shares outstanding is 370.7 million) 3. Impacts of Test Year 2018 GRC true-up in 2019 aggregated separately; $(0.20) includes revenue of $0.34, O&M of $(0.06), depreciation of $(0.24), interest expense of $0.01, property taxes and other of $(0.01) and income taxes of $(0.24) 4. Includes revenue of $0.30 which is offset in O&M, depreciation, interest expense and property taxes and other; primarily related to $0.22 from Grid Safety and Resiliency Program Balancing Account Note: Diluted earnings were $0.57 and $3.42 per share for the nine months ended September 30, 2020 and 2019, respectively October 27, 2020 9
Earnings Per Share Non-GAAP Reconciliations Reconciliation of EIX Basic Earnings Per Share Guidance to EIX Core Earnings Per Share Guidance1 2020 EPS Attributable to Edison International Low High Basic EIX EPS $1.73 $1.88 Total Non-Core Items (2.74) (2.74) Core EIX EPS $4.47 $4.62 1. EPS is calculated on the assumed weighted-average share count for 2020 of 372.7 million October 27, 2020 10
Earnings Non-GAAP Reconciliations Reconciliation of EIX GAAP Earnings to EIX Core Earnings Earnings (Losses) Attributable to Edison International, $ in Millions Q3 Q3 YTD YTD 2020 2019 2020 2019 SCE $(264) $503 $336 $1,215 EIX Parent & Other (24) (32) (123) (74) Basic (Losses)/Earnings $(288) $471 $213 $1,141 Non-Core Items SCE 2017/2018 Wildfire/Mudslide Events claims and expenses, net of recoveries (880) — (889) — Wildfire Insurance Fund expense (61) (48) (181) (48) Disallowed historical capital expenditures in SCE's 2018 GRC decision — — — (123) Sale of San Onofre nuclear fuel 21 — 58 3 Re-measurement of tax assets and liabilities — — 18 69 EIX Parent & Other Goodwill impairment — — (25) — Re-measurement of tax liabilities — — (3) — Less: Total non-core items $(920) $(48) $(1,022) $(99) SCE 656 551 1,330 1,314 EIX Parent & Other (24) (32) (95) (74) Core Earnings $632 $519 $1,235 $1,240 October 27, 2020 11
EIX Core EPS Non-GAAP Reconciliations Reconciliation of EIX Basic Earnings Per Share to EIX Core Earnings Per Share EPS Attributable to Edison International Q3 Q3 YTD YTD 2020 2019 2020 2019 Basic EPS $(0.76) $1.36 $0.57 $3.43 Non-Core Items1 SCE 2017/2018 Wildfire/Mudslide Events claims and expenses, net of recoveries (2.53) — (2.67) — Wildfire Insurance Fund expense (0.18) (0.14) (0.54) (0.14) Disallowed historical capital expenditures in SCE's 2018 GRC decision — — — (0.38) Sale of San Onofre nuclear fuel 0.06 — 0.17 0.01 Re-measurement of tax assets and liabilities — — 0.05 0.21 Edison International Parent and Other Goodwill impairment — — (0.07) — Re-measurement of tax liabilities — — (0.01) — Impact from share dilution1 0.22 — 0.31 — Less: Total Non-Core Items (2.43) (0.14) (2.76) (0.30) Core EPS $1.67 $1.50 $3.33 $3.73 1. For comparability, 2020 EPS drivers are reported based on 2019 QTD and YTD weighted-average share count of 347.1 million and 330.0 million, respectively (2020 QTD and YTD weighted average shares outstanding is 378.4 million and 370.7 million, respectively) October 27, 2020 12
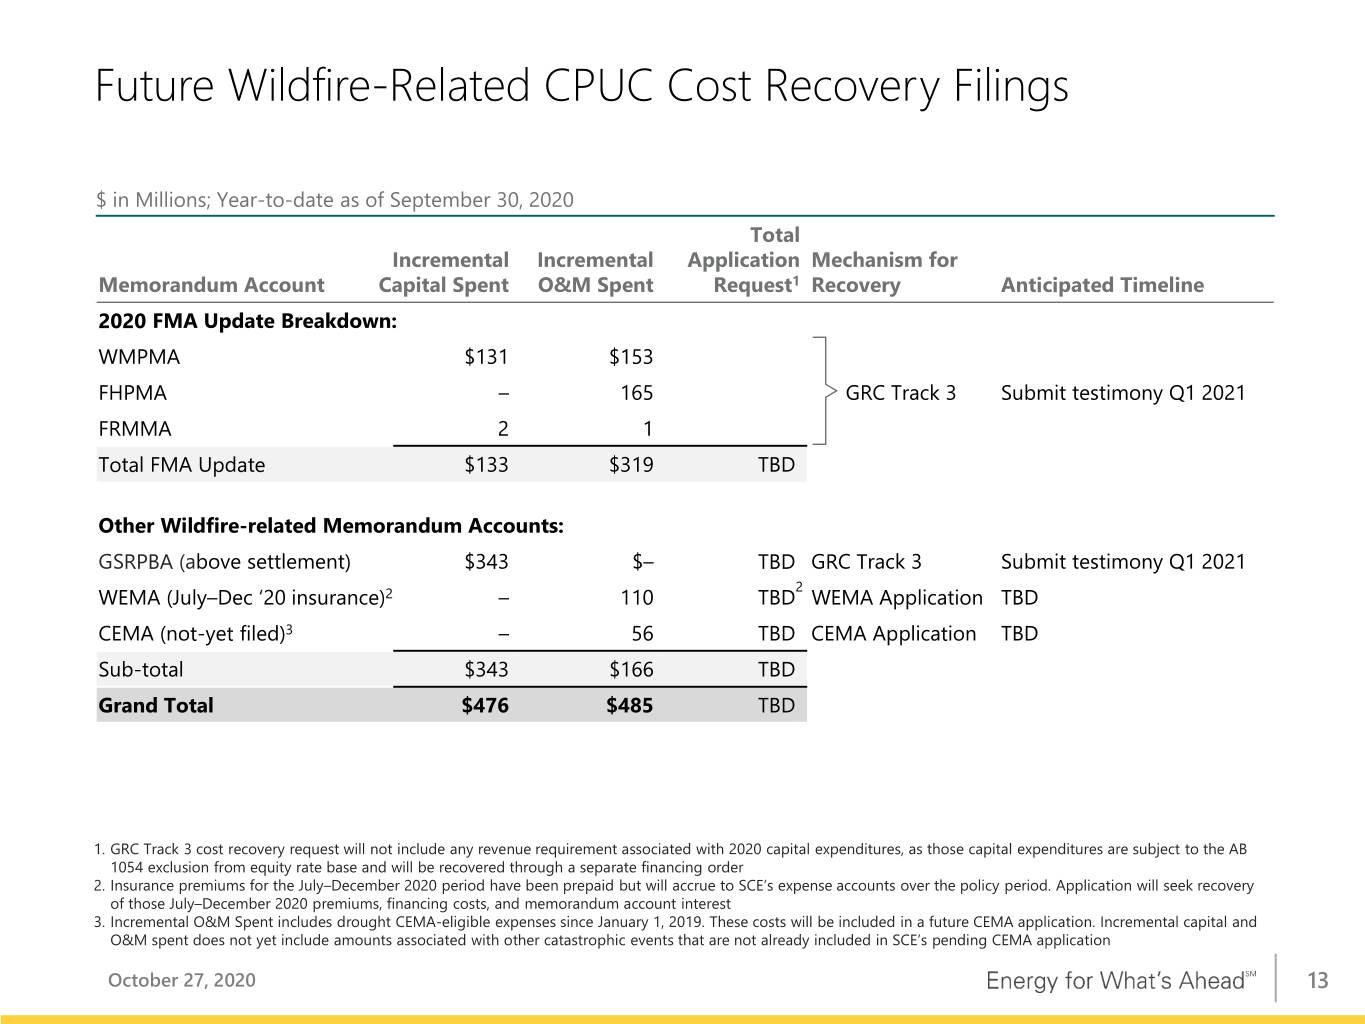
Future Wildfire-Related CPUC Cost Recovery Filings $ in Millions; Year-to-date as of September 30, 2020 Total Incremental Incremental Application Mechanism for Memorandum Account Capital Spent O&M Spent Request1 Recovery Anticipated Timeline 2020 FMA Update Breakdown: WMPMA $131 $153 FHPMA – 165 GRC Track 3 Submit testimony Q1 2021 FRMMA 2 1 Total FMA Update $133 $319 TBD Other Wildfire-related Memorandum Accounts: GSRPBA (above settlement) $343 $– TBD GRC Track 3 Submit testimony Q1 2021 2 WEMA (July–Dec ‘20 insurance)2 – 110 TBD WEMA Application TBD CEMA (not-yet filed)3 – 56 TBD CEMA Application TBD Sub-total $343 $166 TBD Grand Total $476 $485 TBD 1. GRC Track 3 cost recovery request will not include any revenue requirement associated with 2020 capital expenditures, as those capital expenditures are subject to the AB 1054 exclusion from equity rate base and will be recovered through a separate financing order 2. Insurance premiums for the July–December 2020 period have been prepaid but will accrue to SCE’s expense accounts over the policy period. Application will seek recovery of those July–December 2020 premiums, financing costs, and memorandum account interest 3. Incremental O&M Spent includes drought CEMA-eligible expenses since January 1, 2019. These costs will be included in a future CEMA application. Incremental capital and O&M spent does not yet include amounts associated with other catastrophic events that are not already included in SCE’s pending CEMA application October 27, 2020 13
Use of Non-GAAP Financial Measures Edison International's earnings are prepared in accordance with generally accepted accounting principles used in the United States. Management uses core earnings (losses) internally for financial planning and for analysis of performance. Core earnings (losses) are also used when communicating with investors and analysts regarding Edison International's earnings results to facilitate comparisons of the company's performance from period to period. Core earnings (losses) are a non-GAAP financial measure and may not be comparable to those of other companies. Core earnings (losses) are defined as earnings attributable to Edison International shareholders less non-core items. Non-core items include income or loss from discontinued operations and income or loss from significant discrete items that management does not consider representative of ongoing earnings, such as write downs, asset impairments and other income and expense related to changes in law, outcomes in tax, regulatory or legal proceedings, and exit activities, including sale of certain assets and other activities that are no longer continuing. A reconciliation of Non-GAAP information to GAAP information is included either on the slide where the information appears or on another slide referenced in this presentation. EIX Investor Relations Contact Sam Ramraj, Vice President (626) 302-2540 [email protected] October 27, 2020 14