
ENR 8-K
Energizer Holdings, Inc. (ENR)
8-K
2020-11-12
For: 2020-11-12
View Original
Added on
April 10, 2026
UNITED STATES
SECURITIES AND EXCHANGE COMMISSION
Washington, D.C. 20549
FORM 8-K
CURRENT REPORT
Pursuant to Section 13 or 15(d) of the Securities Exchange Act of 1934
Date of Report (Date of Earliest Event Reported): November 12, 2020
_____________________________________________________________________________________

(Exact Name of Registrant as Specified in its Charter)
(State or other jurisdiction of incorporation) | (Commission File Number) | (IRS Employer Identification Number) | ||||||||||||
(Address of principal executive offices)
Registrant’s telephone number, including area code: (314 ) 985-2000
Securities registered pursuant to Section 12(b) of the Act:
| Title of each class | Trading Symbol(s) | Name of each exchange on which registered | ||||||
Check the appropriate box below if the Form 8-K filing is intended to simultaneously satisfy the filing obligation of the registrant under any of the following provisions (see General Instruction A.2. below):
Indicate by check mark whether the registrant is an emerging growth company as defined in Rule 405 of the Securities Act of 1933 (17 CFR §230.405) or Rule 12b-2 of the Securities Exchange Act of 1934 (17 CFR §240.12b-2).
Emerging growth company ☐
If an emerging growth company, indicate by checkmark if the registrant has elected not to use the extended transition period for complying with any new or revised financial accounting standards provided pursuant to Section 13(a) of the Exchange Act. ☐
Item 2.02. Results of Operations and Financial Condition.
On November 12, 2020, Energizer Holdings, Inc. (the “Company”) issued a press release and made available on its website an earnings presentation announcing financial and operating results for the fourth fiscal quarter and full fiscal year ended September 30, 2020 and provided a financial outlook for fiscal 2021. A copy of the press release and earnings presentation are furnished as Exhibit 99.1 and Exhibit 99.2, respectively, hereto and incorporated herein by reference.
The information furnished pursuant to this Item 2.02, including the furnished exhibits, shall not be deemed “filed” for purposes of the Securities Exchange Act of 1934, as amended (the “Exchange Act”), or otherwise subject to the liabilities of the Exchange Act, nor shall such information or exhibits be deemed incorporated by reference into any filing by the Company with the Securities and Exchange Commission (the “SEC”) under the Securities Act of 1933, as amended (the “Securities Act”), the rules and regulations of the SEC thereunder, the Exchange Act, or the rules and regulations of the SEC thereunder, except as shall be expressly set forth by specific reference in such a filing.
Item 5.02. Departure of Directors or Certain Officers; Election of Directors; Appointment of Certain Officers; Compensatory Arrangements of Certain Officers.
Chief Executive Officer Succession
On November 12, 2020, the Board of Directors of the Company announced the appointment of Mark S. LaVigne to the role of Chief Executive Officer, which appointment was approved by the Company’s Board of Directors and will become effective on January 1, 2021. Mr. LaVigne is currently the Company’s President and Chief Operating Officer. Mr. LaVigne will succeed Alan R. Hoskins, who will retire as Chief Executive Officer of the Company effective January 1, 2021, but has agreed to remain with the Company in the capacity of Special Advisor to support the leadership transition by providing advice, guidance and assistance during the transition period.
The information regarding Mr. LaVigne required by Items 401(b), (d) and (e) of Regulation S-K has previously been disclosed by the Company in the Company’s Annual Report on Form 10-K filed with the U.S. Securities Exchange Commission (the “Commission”) on November 19, 2019. There are no arrangements or understandings pursuant to which Mr. LaVigne was selected for his position. The information regarding Mr. LaVigne required under Item 404(a) of Regulation S-K has been previously disclosed in the Company’s Definitive Proxy Statement on Schedule 14A filed with the Commission on December 17, 2019. There have been no additional related party transactions involving Mr. LaVigne (or any of his immediate family members) during the period since September 30, 2019.
The details of Mr. LaVigne’s compensation arrangements in connection with his appointment and the material terms of Mr. Hoskins’ retirement are not available as of the date hereof. Any such arrangements will be the subject of an amended Form 8-K filing.
Item 7.01. Regulation FD Disclosure.
Declaration of Dividends
On November 12, 2020, the Company announced that its Board of Directors declared a quarterly dividend of $0.30 per share on its Common Stock, payable on December 18, 2020 to all shareholders of record as of the close of business on November 30, 2020 in addition to a quarterly dividend of $1.875 per share of 7.50% Series A mandatory convertible preferred stock, payable on January 15, 2021 to all shareholders of record as of the close of business on January 1, 2021.
Stock Repurchase Program
On November 12, 2020, the Company also announced that its Board of Directors approved terminating the previously authorized share repurchase program and replace it with a new authorization for the Company to acquire up to 7.5 million shares of its Common Stock. Stock repurchases may be made periodically in open-market transactions, including in discretionary transactions and under plans complying with the provisions of Rule 10b5-1 of the Exchange Act, privately negotiated transactions or otherwise and are subject to market conditions, applicable securities laws and other factors. Such repurchases will be at times and in amounts that management deems appropriate. The Board of Directors’ authorization does not have an expiration date, does not obligate the Company to acquire any particular amount of Common Stock, and may be modified, suspended or terminated at any time.
Chief Executive Officer Succession Press Release
The Company issued a press release, dated November 12, 2020, related to the Chief Executive Officer succession described in Item 5.02 above, which is furnished as Exhibit 99.3 hereto.
The information furnished pursuant to this Item 7.01, including the furnished exhibit, shall not be deemed “filed” for purposes of the Exchange Act, or otherwise subject to the liabilities of the Exchange Act, nor shall such information or exhibit be deemed incorporated by reference into any filing by the Company with the SEC under the Securities Act, the rules and regulations of the SEC thereunder, the Exchange Act, or the rules and regulations of the SEC thereunder, except as shall be expressly set forth by specific reference in such a filing.
Item 9.01. Financial Statements and Exhibits.
(d) Exhibits.
See Exhibit Index.
EXHIBIT INDEX
| Exhibit No. | Description | |||||||
Press Release, dated November 12, 2020 | ||||||||
Earnings Presentation, dated November 12, 2020 | ||||||||
| Press Release, dated November 12, 2020, announcing Chief Executive Officer transition. | ||||||||
| 101 | Pursuant to Rule 406 of Regulation S-T, the cover page information is formatted in iXBRL (Inline eXtensible Business Reporting Language). | |||||||
| 104 | Cover Page Interactive Data File (formatted in iXBRL in Exhibit 101). | |||||||
SIGNATURES
Pursuant to the requirements of the Securities Exchange Act of 1934, the Registrant has duly caused this Current Report on Form 8-K to be signed on its behalf by the undersigned hereunto duly authorized.
ENERGIZER HOLDINGS, INC.
By: /s/ Timothy W. Gorman
Timothy W. Gorman
Executive Vice President and Chief Financial Officer
Dated: November 12, 2020
 | Exhibit 99.1 Energizer Holdings, Inc. 533 Maryville University Dr. St. Louis, MO 63141 | ||||
| FOR IMMEDIATE RELEASE | Company Contact | ||||
| November 12, 2020 | Jacqueline Burwitz Investor Relations 314-985-2169 [email protected] | ||||
Energizer Holdings, Inc. Announces Fiscal 2020 Fourth Quarter and Full Year Results, Financial Outlook for Fiscal 2021 and New Share Repurchase Authorization
•Strong top-line growth with fiscal fourth quarter reported net sales increase of 6.1% due to organic net sales growth and fiscal 2020 reported net sales increase of 10.0%, including 2.5% of organic growth.(1)
•Diluted net loss from continuing operations per common share of $0.67 in the fourth fiscal quarter, and Diluted net earnings from continuing operations per common share of $0.44 in fiscal 2020, and includes loss on debt extinguishment, impact of acquisition and integration costs and higher than expected COVID costs.
•Adjusted Diluted net earnings from continuing operations per common share of $0.59 in the fourth fiscal quarter and Adjusted Diluted net earnings from continuing operations per common share of $2.31 in fiscal 2020, inclusive of $0.28 and $0.41 of incremental COVID-19 costs, respectively.(1)
•Better than expected cash flows from operating activities of $157 million in the fourth fiscal quarter and $389 million for the fiscal year, and Adjusted free cash flow of $161 million in the fourth fiscal quarter and $405 million for the fiscal year, allowing for over $100 million in debt pay down subsequent to year-end.(1)
•Company expects to deliver 2% to 4% organic revenue growth, Adjusted EBITDA in the range of $600 to $630 million and Adjusted earnings per share in the range of $2.95 to $3.25 for fiscal 2021.(1)
•Announces Board approval of new 7.5 million share repurchase authorization.
St. Louis —November 12, 2020—Energizer Holdings, Inc. (NYSE: ENR) today announced results for the fourth fiscal quarter and full fiscal year, which ended September 30, 2020.
“The continued elevated demand for batteries and the recovery of the auto care business resulted in our fifth consecutive year of organic growth. Throughout the pandemic, our focus has continued to be on the health and safety of our colleagues and meeting the needs of our customers and consumers,” said Alan Hoskins, Chief Executive Officer. “Doing so resulted in higher costs and ultimately lower earnings. We believe that the value of our relationships with our customers far outweighs these short-term costs.”
“We have taken action to increase our agility and ability to serve our customers. We expect the increased costs related to COVID-19 will be substantially reduced by the end of the first quarter of fiscal 2021. The actions we have taken include enhancing our manufacturing network, reorganization of our global product supply structure, and acceleration of our investment in enterprise analytics to drive better, and more timely, decision-making. With these steps well underway, we believe we are back on the path of delivering meaningful growth in 2021 and beyond by improving productivity and taking costs out of the business while continuing to grow the top line through both innovation and strengthening our brands.”
__________________
1
(1) See Press Release attachments and supplemental schedules for additional information, including the GAAP to Non-GAAP reconciliations.
Top-Line Performance
For the quarter and fiscal year, top-line sales growth continued to be very strong. Net sales were $763.0 million for the fourth fiscal quarter compared to $719.0 million in the prior year period and $2,744.8 million for the fiscal year compared to $2,494.5 million for the prior fiscal year.
| Fourth Quarter | % Chg | Full Fiscal Year | % Chg | |||||||||||||||||||||||
| Net Sales - FY'19 | $ | 719.0 | $ | 2,494.5 | ||||||||||||||||||||||
| Organic | 43.8 | 6.1 | % | 61.4 | 2.5 | % | ||||||||||||||||||||
| Impact of Battery Acquisition | — | — | % | 125.5 | 5.0 | % | ||||||||||||||||||||
| Impact of Auto Care Acquisition | — | — | % | 85.1 | 3.4 | % | ||||||||||||||||||||
| Change in Argentina operations | 2.0 | 0.3 | % | 1.6 | 0.1 | % | ||||||||||||||||||||
| Impact of currency | (1.8) | (0.3) | % | (23.3) | (1.0) | % | ||||||||||||||||||||
| Net Sales - FY'20 | $ | 763.0 | 6.1 | % | $ | 2,744.8 | 10.0 | % | ||||||||||||||||||
Organic net sales increased 6.1% in the fourth fiscal quarter due to the following items:(1)
•Distribution gains across all product categories contributed 3% to the organic increase;
•Increased year-over-year replenishment volume, primarily in North America battery, contributed 3% to the increase;
•Increased volume driven by the COVID-19 pandemic, which was slightly offset by increased retailer fines and penalties due to the unprecedented demand spike and necessary actions to support our customers and consumers, contributed a net impact of 0.9% to the increase; and
•Lower year-over-year U.S. hurricane volume of 0.8% partially offset the increases.
Organic net sales increased 2.5% in the fiscal year due to the following items:(1)
•Distribution gains contributed 2.7% of the increase;
•Favorable carryover impact of the fiscal 2019 price increases, together with the net COVID-19 pandemic impact driven by North America battery, contributed 1.0% of the increase; and
•Lower replenishment volume early in the year, and the year-over-year impact of lower storm activity partially offset the increases.
Gross Margin
Gross margin percentage on a reported basis for the fourth fiscal quarter was 36.9%, versus 40.0% in the prior year quarter, and was 39.4% for fiscal 2020, versus 40.2% in the prior year. Excluding the prior year inventory step up resulting from purchase accounting and acquisition and integration costs in both years, gross margin was 38.4% for the fourth fiscal quarter, down 370 basis points from the prior year quarter, and was 40.6% for the fiscal year, down 200 basis points from prior year.(1)
| Fourth Quarter | Full Fiscal Year | |||||||||||||
Adjusted Gross Margin - FY'19 (1) | 42.1 | % | 42.6 | % | ||||||||||
| Incremental COVID-19 costs | (2.3) | % | (1.1) | % | ||||||||||
| Collective shift in customer and product mix | (1.7) | % | (0.8) | % | ||||||||||
| Unfavorable movement in foreign currencies and tariffs | (1.0) | % | (0.6) | % | ||||||||||
| Lower margin rate profile of the acquired businesses | — | % | (0.8) | % | ||||||||||
| Synergy realization | 1.3 | % | 1.3 | % | ||||||||||
Adjusted Gross Margin - FY'20 (1) | 38.4 | % | 40.6 | % | ||||||||||
Gross margin reflects the demand impact from COVID-19 that was elevated and prolonged for much of fiscal 2020 which put significant stress on our global network. This impact was compounded in the fourth quarter due to preparation for the upcoming holiday season. In order to serve our customers, we took a series of actions, including higher than normal internal
2
production, aggressively sourcing raw materials and finished goods, and increasing air freight and co-packing capacity. These efforts resulted in incremental COVID-19 costs in the fiscal fourth quarter and fiscal year.
Fiscal 2020 gross margin performance was also heavily impacted by sales mix changes, including:
•As the fiscal year unfolded, the pandemic resulted in lockdowns across the world, which drove shifts in our business from higher margin markets, which in some cases had longer and more severe lockdowns, to lower margin markets; and
•Changes in consumers’ shopping behaviors as they navigated the pandemic by migrating to different channels and products.
Selling, General and Administrative expense (SG&A)
SG&A, excluding acquisition and integration costs, for the fourth fiscal quarter was 15.6% of net sales, or $118.8 million, a decrease of $4.2 million versus the prior year. This decrease was driven by synergy realization primarily due to transition service agreement (TSA) exits.(1)
SG&A, excluding acquisition and integration costs, for fiscal 2020 was $444.5 million, or 16.2% of net sales, as compared to $433.4 million, or 17.4% of net sales, in the prior year. The changes were due to incremental SG&A of approximately $26 million due to the Battery and Auto Care Acquisitions, partially offset by synergy realization and reduced spending.(1)
Advertising and promotion expense (A&P)
A&P was 5.3% of net sales for the fourth fiscal quarter, an increase of 150 basis points, or $12.8 million. The increase was due to planned incremental investment in our branded product portfolio.
A&P was 5.4% of sales for fiscal 2020, an increase of 30 basis points, or $19.8 million. The increase over prior year is driven by incremental spending of $3.5 million due to the Battery and Auto Care Acquisitions, which was primarily for product and packaging innovation and promotional support for our auto care brands, in addition to planned incremental investment in our branded product portfolio.
| Earnings Per Share and Adjusted EBITDA | Fourth Quarter | Full Fiscal Year | ||||||||||||||||||||||||
| (In millions, except per share data) | 2020 | 2019 | 2020 | 2019 | ||||||||||||||||||||||
| Net (loss)/earnings from continuing operations | $ | (41.7) | $ | 47.0 | $ | 46.8 | $ | 64.7 | ||||||||||||||||||
| Diluted net (loss)/earnings per common share - continuing operations | $ | (0.67) | $ | 0.62 | $ | 0.44 | $ | 0.78 | ||||||||||||||||||
Adjusted net earnings from continuing operations(1) | $ | 44.7 | $ | 68.6 | $ | 176.8 | $ | 216.1 | ||||||||||||||||||
Adjusted diluted net earnings per common share - continuing operations (1) | $ | 0.59 | $ | 0.93 | $ | 2.31 | $ | 3.00 | ||||||||||||||||||
Adjusted EBITDA(1) | $ | 140.4 | $ | 156.9 | $ | 562.0 | $ | 545.5 | ||||||||||||||||||
During the quarter, the Company took advantage of favorable debt markets and refinanced its Senior Notes due 2025 and 2026, totaling $1.35 billion in principal amount, with new Senior Notes which come due in 2028 and 2029, respectively. The new Senior Notes have significantly lower interest rates and will result in approximately $17.5 million in annual interest savings, as well as an extension of the weighted average maturity of these borrowings by roughly three years.
Our fourth quarter earnings per share and Adjusted EBITDA were lower than previously provided guidance primarily due to incremental COVID-19 costs caused by elevated demand, primarily customer fines and penalties, increased product sourcing costs, including tariffs, and higher SG&A relating to factoring costs, legal fees and compensation expenses. These increased costs resulted in a decline of approximately $16 million in Adjusted EBITDA, and coupled with the increase in tax rate, approximately $0.20 of earnings per share for the year.
The Net loss from continuing operations for the fiscal fourth quarter included the loss on the extinguishment of debt of $90.7 million, or $1.01 per diluted share, and pre-tax acquisition and integration expense of $20.4 million, or $0.29 per diluted share.
The Net earnings from continuing operations for the fiscal year included the loss on extinguishment of debt of $94.9 million, or $1.05, per diluted share, and pre-tax acquisition and integration costs of $68.0 million, or $0.79 per diluted share.
3
The change in Adjusted EBITDA and Adjusted diluted net earnings per common share - continuing operations for the quarter was driven in large part by incremental COVID-19 costs, including air freight and customer fines and penalties and increased A&P, offset by the continued realization of synergies.
The impacts on Adjusted EBITDA and Adjusted diluted net earnings per common share - continuing operations for the fiscal year were largely the same as the fiscal quarter, with the addition of a full year of acquisition activity, as well as the impact of unfavorable currency. A higher tax rate, due to country mix of earnings, also impacted the year-over-year change in adjusted earnings per common share - continuing operation.
Incremental COVID-19 Costs
The table below is a summary of the incremental COVID-19 costs incurred for the fourth fiscal quarter and fiscal year in addition to the impact these costs had on our EBITDA and Earnings per share for both periods presented:
| (In millions, except per share data) | Fourth Quarter | Fiscal Year 2020 | ||||||||||||
| Gross margin | $ | 19.0 | $ | 29.0 | ||||||||||
| SG&A | 3.0 | — | ||||||||||||
| Interest expense | 3.0 | 7.0 | ||||||||||||
| Incremental COVID-19 Costs | $ | 25.0 | $ | 36.0 | ||||||||||
| Impact to EBITDA | $ | 22.0 | $ | 29.0 | ||||||||||
| Impact to Earnings per share | $ | 0.28 | $ | 0.41 | ||||||||||
Strong Free Cash Flow and Continued Return of Capital
•We generated strong cash flows from continuing operations of $157.4 million and $389.3 million for the quarter and the year, respectively, and Adjusted Free Cash Flow from continuing operations of $161.4 million and $405.1 million for the quarter and year, respectively, driven primarily by working capital improvements and certain one-time tax items realized earlier in the year. Strong cash flows allowed for the Company to pay down over $100 million of debt subsequent to year-end.(1)
•Dividend payments in the quarter were approximately $21 million, or $0.30 per common share and $4.1 million, or $1.875 per share of mandatory preferred convertible stock. Dividend payments for the year were $85.4 million, or $1.20 per common share and $16.2 million, or $7.50 per share of mandatory preferred convertible shares.
•Repurchased approximately 980,000 shares of common stock for $45.0 million in the first fiscal quarter. As noted above, the Board has approved a new share repurchase program for up to 7.5 million shares. This replaced the prior authorization that was outstanding.
•Net debt to credit defined EBITDA was 4.8 times at the end of fiscal 2020.
Financial Outlook and Assumptions for Fiscal Year 2021(1)
The Company is providing the below financial outlook and assumptions for fiscal 2021. Note that all comparisons are with actual results for fiscal year ended September 30, 2020. As we continue to navigate through the impacts of the pandemic, our assumptions for fiscal 2021 do not anticipate any significant disruptions to our global manufacturing plants, distribution centers or customers. We assume the retail environment will remain competitive and the commodity costs will be benign. Should disruption occur that is prolonged, our expected results may be significantly impacted as we may not be able to supply demand in a timely manner or at all. Looking specifically at our key metrics for fiscal 2021, we expect the following:
•Net Sales growth in the range of 2% to 4% with expected growth in batteries at the low end of the range and auto care at the high end of the range;
•Adjusted gross margin to be essentially flat with approximately $15 million of COVID-19 costs expected to be incurred in the first quarter, and an expected sequential improvement in gross margin rate as we progress through 2021;
•Adjusted earnings per share in the range of $2.95 to $3.25;
4
•Adjusted EBITDA range of $600 to $630 million;
•Adjusted free cash flow in the range of $325 to $350 million dollars, as working capital returns to more normalized levels and we lapped one-time tax items from the prior fiscal year;
•Capital spending, excluding integration, in the range of $35 to $45 million, and integration related capital in the range of $30 to $40 million.
Given the expected growth in fiscal 2021 is off lower-than-previously expected fiscal 2020 results and the uncertainty related to the pandemic, the the Company is withdrawing its pre-pandemic targets for 2022 of $700 million in adjusted EBITDA and $400 million in adjusted free cash flow. We have provided additional details on our long-term algorithm in the deck that was provided with the release.
Webcast Information
In conjunction with this announcement, the Company will hold an investor conference call beginning at 10:00 a.m. eastern time today. The call will focus on fourth quarter and fiscal 2020 financial results and the financial outlook for fiscal 2021. All interested parties may access a live webcast of this conference call at www.energizerholdings.com, under "Investors" and "Events and Presentations" tabs or by using the following link:
https://www.webcaster4.com/Webcast/Page/1192/37929
For those unable to participate during the live webcast, a replay will be available on www.energizerholdings.com, under "Investors," "Events and Presentations," and "Past Events" tabs.
# # #
Forward-Looking Statements.
This document contains both historical and forward-looking statements. Forward-looking statements are not based on historical facts but instead reflect our expectations, estimates or projections concerning future results or events, including, without limitation, the future sales, gross margins, costs, earnings, cash flows, tax rates and performance of the Company. These statements generally can be identified by the use of forward-looking words or phrases such as "believe," "expect," "expectation," "anticipate," "may," "could," "intend," "belief," "estimate," "plan," "target," "predict," "likely," "should," "forecast," "outlook," or other similar words or phrases. These statements are not guarantees of performance and are inherently subject to known and unknown risks, uncertainties and assumptions that are difficult to predict and could cause our actual results to differ materially from those indicated by those statements. We cannot assure you that any of our expectations, estimates or projections will be achieved. The forward-looking statements included in this document are only made as of the date of this document and we disclaim any obligation to publicly update any forward-looking statement to reflect subsequent events or circumstances. Numerous factors could cause our actual results and events to differ materially from those expressed or implied by forward-looking statements, including, without limitation:
•market and economic conditions;
•market trends in the categories in which we compete;
•uncertainty relating to the impacts of the COVID-19 outbreak, including but not limited to, its impacts on consumer demand, costs, product mix, the availability of our products, our strategic initiatives, our and our partners' global supply chains, operations and routes to market;
•our ability to integrate businesses, to realize the projected results of the acquired businesses, and to obtain expected cost savings, synergies and other anticipated benefits of the acquired businesses within the expected timeframe, or at all;
•the impact of the acquired businesses on our business operations;
•the success of new products and the ability to continually develop and market new products;
•our ability to attract, retain and improve distribution with key customers;
•our ability to continue planned advertising and other promotional spending;
•our ability to timely execute strategic initiatives, including restructurings, and international go-to-market changes in a manner that will positively impact our financial condition and results of operations and does not disrupt our business operations;
•the impact of strategic initiatives, including restructurings, on our relationships with employees, customers and vendors;
•our ability to maintain and improve market share in the categories in which we operate despite heightened competitive pressure;
•financial strength of distributors and suppliers;
•our ability to improve operations and realize cost savings;
5
•the impact of the United Kingdom’s future trading relationships following its exit from the European Union;
•the impact of foreign currency exchange rates and currency controls, as well as offsetting hedges;
•the impact of adverse or unexpected weather conditions;
•uncertainty from the expected discontinuance of LIBOR and the transition to any other interest rate benchmark;
•the impact of raw materials and other commodity costs;
•the impact of legislative changes or regulatory determinations or changes by federal, state and local, and foreign authorities, including customs and tariff determinations, as well as the impact of potential changes to tax laws, policies and regulations;
•costs and reputational damage associated with cyber-attacks or information security breaches or other events;
•the impact of advertising and product liability claims and other litigation; and
•compliance with debt covenants and maintenance of credit ratings as well as the impact of interest and principal repayment of our existing and any future debt.
In addition, other risks and uncertainties not presently known to us or that we consider immaterial could affect the accuracy of any such forward-looking statements. The list of factors above is illustrative, but by no means exhaustive. All forward-looking
statements should be evaluated with the understanding of their inherent uncertainty. Additional risks and uncertainties include
those detailed from time to time in our publicly filed documents, including those described under the heading “Risk Factors” in our Form 10-K filed with the Securities and Exchange Commission on November 19, 2019 as well as our Form 10-Q filed on August 5, 2020.
6
ENERGIZER HOLDINGS, INC.
CONSOLIDATED STATEMENT OF EARNINGS
(Condensed)
(In millions, except per share data - Unaudited)
| Quarter Ended September 30, | Twelve Months Ended September 30, | ||||||||||||||||||||||||||||
| 2020 | 2019 | 2020 | 2019 | ||||||||||||||||||||||||||
| Net sales | $ | 763.0 | $ | 719.0 | $ | 2,744.8 | $ | 2,494.5 | |||||||||||||||||||||
| Cost of products sold (1) | 481.2 | 431.2 | 1,662.9 | 1,490.7 | |||||||||||||||||||||||||
| Gross profit | 281.8 | 287.8 | 1,081.9 | 1,003.8 | |||||||||||||||||||||||||
| Selling, general and administrative expense (1) | 132.3 | 142.2 | 483.3 | 515.7 | |||||||||||||||||||||||||
| Advertising and promotion expense | 40.2 | 27.4 | 147.1 | 127.3 | |||||||||||||||||||||||||
| Research and development expense (1) | 9.8 | 9.1 | 35.4 | 32.8 | |||||||||||||||||||||||||
| Amortization of intangible assets | 14.2 | 13.1 | 56.5 | 43.2 | |||||||||||||||||||||||||
| Interest expense (1) (2) | 50.2 | 48.7 | 195.0 | 226.0 | |||||||||||||||||||||||||
| Loss on extinguishment of debt (3) | 90.7 | — | 94.9 | — | |||||||||||||||||||||||||
| Other items, net (1) | (3.8) | (0.4) | 2.0 | (14.3) | |||||||||||||||||||||||||
| (Loss)/Earnings before income taxes | (51.8) | 47.7 | 67.7 | 73.1 | |||||||||||||||||||||||||
| Income tax (benefit)/provision | (10.1) | 0.7 | 20.9 | 8.4 | |||||||||||||||||||||||||
| Net (loss)/earnings from continuing operations | $ | (41.7) | $ | 47.0 | $ | 46.8 | $ | 64.7 | |||||||||||||||||||||
| Net loss from discontinued operations (4) | (9.8) | (0.8) | (140.1) | (13.6) | |||||||||||||||||||||||||
| Net (loss)/earnings | (51.5) | 46.2 | (93.3) | 51.1 | |||||||||||||||||||||||||
| Mandatory preferred stock dividends | (4.1) | (4.3) | (16.2) | (12.0) | |||||||||||||||||||||||||
| Net (loss)/earnings attributable to common shareholders | $ | (55.6) | $ | 41.9 | $ | (109.5) | $ | 39.1 | |||||||||||||||||||||
| Basic net (loss)/earnings per common share - continuing operations | $ | (0.67) | $ | 0.62 | $ | 0.44 | $ | 0.79 | |||||||||||||||||||||
| Basic net loss per common share - discontinued operations | (0.14) | (0.01) | (2.03) | (0.20) | |||||||||||||||||||||||||
| Basic net (loss)/earnings per common share | $ | (0.81) | $ | 0.61 | $ | (1.59) | $ | 0.59 | |||||||||||||||||||||
| Diluted net (loss)/earnings per common share - continuing operations | $ | (0.67) | $ | 0.62 | $ | 0.44 | $ | 0.78 | |||||||||||||||||||||
| Diluted net loss per common share - discontinued operations | (0.14) | (0.01) | (2.02) | (0.20) | |||||||||||||||||||||||||
| Diluted net (loss)/earnings per common share | $ | (0.81) | $ | 0.61 | $ | (1.58) | $ | 0.58 | |||||||||||||||||||||
| Weighted average shares of common stock - Basic | 68.5 | 68.9 | 68.8 | 66.4 | |||||||||||||||||||||||||
| Weighted average shares of common stock - Diluted | 68.5 | 69.2 | 69.5 | 67.3 | |||||||||||||||||||||||||
(1) See the Supplemental Schedules - Non-GAAP Reconciliation attached which breaks out the Acquisition and integration related items included within these lines.
(2) Includes Acquisition debt commitment fees, interest, and ticking fees of $65.6 million for the twelve months ended September 30, 2019.
(3) The Loss on the extinguishment of debt for the quarter ended September 30, 2020 relates to the Company's July 2020 redemption of its $600.0 million Senior Notes due in 2025 and the redemption of the $750.0 million Senior Notes due in 2026 which were redeemed subsequent to year-end on October 16, 2020. The twelve months ended September 30, 2020 also includes the write off of deferred financing fees related to the term loan refinancing in December 2019.
(4) Included in these results is the pre-tax loss on the disposition of the Varta consumer battery business of $141.6 million in the twelve months ended September 30, 2020. The Net loss on discontinued operations is net of income tax expense of $5.4 million and a benefit of $1.2 million for the quarter and twelve months ended September 30, 2020, respectively and income tax expense of $6.5 million and $4.0 million for the quarter and twelve months ended September 30, 2019, respectively.
7
ENERGIZER HOLDINGS, INC.
CONSOLIDATED BALANCE SHEETS
(Condensed)
(In millions - Unaudited)
| SEPTEMBER 30, | ||||||||||||||
| 2020 | 2019 | |||||||||||||
| Assets | ||||||||||||||
| Current assets | ||||||||||||||
| Cash and cash equivalents | $ | 459.8 | $ | 258.5 | ||||||||||
| Restricted cash | 790.0 | — | ||||||||||||
| Trade receivables | 292.0 | 340.2 | ||||||||||||
| Inventories | 511.3 | 469.3 | ||||||||||||
| Other current assets | 157.8 | 177.1 | ||||||||||||
| Assets held for sale | — | 791.7 | ||||||||||||
| Total current assets | $ | 2,210.9 | $ | 2,036.8 | ||||||||||
| Property, plant and equipment, net | 352.1 | 362.0 | ||||||||||||
| Operating lease asset | 121.9 | — | ||||||||||||
| Goodwill | 1,016.0 | 1,004.8 | ||||||||||||
| Other intangible assets, net | 1,909.0 | 1,958.9 | ||||||||||||
| Deferred tax asset | 24.3 | 22.8 | ||||||||||||
| Other assets | 94.1 | 64.3 | ||||||||||||
| Total assets | $ | 5,728.3 | $ | 5,449.6 | ||||||||||
| Liabilities and Shareholders' Equity | ||||||||||||||
| Current liabilities | ||||||||||||||
| Current maturities of long-term debt | $ | 841.3 | $ | — | ||||||||||
| Current portion of capital leases | 1.7 | 1.6 | ||||||||||||
| Notes payable | 3.8 | 31.9 | ||||||||||||
| Accounts payable | 378.1 | 299.0 | ||||||||||||
| Current operating lease liabilities | 14.8 | — | ||||||||||||
| Other current liabilities | 408.7 | 333.6 | ||||||||||||
| Liabilities held for sale | — | 402.9 | ||||||||||||
| Total current liabilities | $ | 1,648.4 | $ | 1,069.0 | ||||||||||
| Long-term debt | 3,306.9 | 3,461.6 | ||||||||||||
| Operating lease liabilities | 111.9 | — | ||||||||||||
| Deferred tax liability | 140.4 | 170.6 | ||||||||||||
| Other liabilities | 211.6 | 204.6 | ||||||||||||
| Total liabilities | $ | 5,419.2 | $ | 4,905.8 | ||||||||||
| Shareholders' equity | ||||||||||||||
| Common stock | 0.7 | 0.7 | ||||||||||||
| Mandatory convertible preferred stock | — | — | ||||||||||||
| Additional paid-in capital | 859.2 | 870.3 | ||||||||||||
| Retained earnings | (66.2) | 129.5 | ||||||||||||
| Treasury stock | (176.9) | (158.4) | ||||||||||||
| Accumulated other comprehensive loss | (307.7) | (298.3) | ||||||||||||
| Total shareholders' equity | $ | 309.1 | $ | 543.8 | ||||||||||
| Total liabilities and shareholders' equity | $ | 5,728.3 | $ | 5,449.6 | ||||||||||
8
ENERGIZER HOLDINGS, INC.
CONSOLIDATED STATEMENT OF CASH FLOWS
(Condensed)
(In millions - Unaudited)
| FOR THE YEARS ENDED SEPTEMBER 30, | |||||||||||
| 2020 | 2019 | ||||||||||
| Cash Flow from Operating Activities | |||||||||||
| Net loss/(earnings) | $ | (93.3) | $ | 51.1 | |||||||
| Loss from discontinued operations | (140.1) | (13.6) | |||||||||
| Net earnings from continuing operations | $ | 46.8 | $ | 64.7 | |||||||
Adjustments to reconcile net earnings to net cash flow from operations: | |||||||||||
| Non-cash integration and restructuring charges | 17.8 | 3.0 | |||||||||
| Depreciation and amortization | 111.9 | 92.8 | |||||||||
| Deferred income taxes | (34.8) | (33.3) | |||||||||
| Share-based compensation expense | 24.5 | 27.1 | |||||||||
| Loss on extinguishment on debt | 94.9 | — | |||||||||
| Mandatory transition tax | — | (0.4) | |||||||||
| Inventory step up | — | 36.2 | |||||||||
| Settlement loss on pension plan terminations | — | 3.7 | |||||||||
| Non-cash items included in income, net | 23.1 | (4.2) | |||||||||
| Other, net | (7.1) | 22.1 | |||||||||
| Changes in assets and liabilities used in operations, net of acquisitions | |||||||||||
| Decrease/(increase) in accounts receivable, net | 47.8 | (24.9) | |||||||||
| Increase in inventories | (39.8) | (15.2) | |||||||||
| Decrease/(increase) in other current assets | 53.4 | (44.3) | |||||||||
| Increase in accounts payable | 76.2 | 5.2 | |||||||||
| (Decrease)/increase in other current liabilities | (25.4) | 9.6 | |||||||||
| Net cash from operating activities from continuing operations | 389.3 | 142.1 | |||||||||
| Net cash (used by)/from operating activities from discontinued operations | (12.9) | 7.4 | |||||||||
| Net cash from operating activities | 376.4 | 149.5 | |||||||||
| Cash Flow from Investing Activities | |||||||||||
| Capital expenditures | (65.3) | (55.1) | |||||||||
| Proceeds from sale of assets | 6.4 | 0.2 | |||||||||
| Acquisitions, net of cash acquired | (5.1) | (2,460.0) | |||||||||
Net cash used by investing activities from continuing operations | (64.0) | (2,514.9) | |||||||||
| Net cash from/(used by) investing activities from discontinued operations | 280.9 | (407.4) | |||||||||
| Net cash from/(used by) investing activities | 216.9 | (2,922.3) | |||||||||
| Cash Flow from Financing Activities | |||||||||||
| Cash proceeds from issuance of debt with original maturities greater than 90 days | 2,020.6 | 1,800.0 | |||||||||
| Payments on debt with maturities greater than 90 days | (1,393.5) | (529.5) | |||||||||
| Net decrease in debt with maturities 90 days or less | (30.2) | (214.1) | |||||||||
| Debt issuance costs | (26.5) | (40.1) | |||||||||
| Premiums paid on extinguishment of debt | (18.3) | — | |||||||||
| Net proceeds from issuance of mandatory convertible preferred shares | — | 199.5 | |||||||||
| Net proceeds from issuance of common stock | — | 205.3 | |||||||||
| Dividends paid on common stock | (85.4) | (83.0) | |||||||||
| Dividends paid on mandatory convertible preferred stock | (16.2) | (8.0) | |||||||||
| Common stock repurchased | (45.0) | (45.0) | |||||||||
| Taxes paid for withheld share-based payments | (11.3) | (8.3) | |||||||||
| Net cash from financing activities from continuing operations | 394.2 | 1,276.8 | |||||||||
| Net cash used by financing activities from discontinued operations | (1.1) | (4.7) | |||||||||
| Net cash from financing activities | 393.1 | 1,272.1 | |||||||||
| Effect of exchange rate changes on cash, cash equivalents and restricted cash | 4.9 | (9.1) | |||||||||
| Net increase/(decrease) in cash, cash equivalents and restricted cash from continuing operations | 724.4 | (1,105.1) | |||||||||
| Net increase/(decrease) in cash, cash equivalents, and restricted cash from discontinued operations | 266.9 | (404.7) | |||||||||
| Net increase/(decrease) in cash, cash equivalents, and restricted cash | 991.3 | (1,509.8) | |||||||||
| Cash, cash equivalents and restricted cash, beginning of period | 258.5 | 1,768.3 | |||||||||
| Cash, cash equivalents and restricted cash, end of period | $ | 1,249.8 | $ | 258.5 | |||||||
9
ENERGIZER HOLDINGS, INC.
Supplemental Schedules
Introduction to the Reconciliation of GAAP and Non-GAAP Measures
For the Quarter and Twelve Months ended September 30, 2020
The Company reports its financial results in accordance with accounting principles generally accepted in the U.S. ("GAAP"). However, management believes that certain non-GAAP financial measures provide users with additional meaningful comparisons to the corresponding historical or future period. These non-GAAP financial measures exclude items that are not reflective of the Company's on-going operating performance, such as acquisition and integration costs and related items, settlement loss on pension plan terminations, loss on extinguishment of debt, the one-time impact of the CARES Act and the December 2017 Tax Cuts and Jobs Act (2017 tax reform). In addition, these measures help investors to analyze year over year comparability when excluding currency fluctuations, acquisition activity as well as other company initiatives that are not on-going. We believe these non-GAAP financial measures are an enhancement to assist investors in understanding our business and in performing analysis consistent with financial models developed by research analysts. Investors should consider non-GAAP measures in addition to, not as a substitute for, or superior to, the comparable GAAP measures. In addition, these non-GAAP measures may not be the same as similar measures used by other companies due to possible differences in method and in the items being adjusted.
We provide the following non-GAAP measures and calculations, as well as the corresponding reconciliation to the closest GAAP measure in the following supplemental schedules:
Segment profit. This amount represents the operations of our two reportable segments including allocations for shared support functions. General corporate and other expenses, global marketing expenses, R&D expenses, amortization expense, interest expense, loss on extinguishment of debt, other items, net, and charges related to acquisition and integration and settlement loss on pension plan terminations have all been excluded from segment profit.
Adjusted net earnings from continuing operations and Adjusted Diluted net earnings per common share - continuing operations (EPS). These measures exclude the impact of the costs related to acquisition and integration, the loss on extinguishment of debt, the settlement loss on pension plan terminations and the one-time impact of the CARES ACT and 2017 tax reform.
Non-GAAP Tax Rate. This is the tax rate when excluding the pre-tax impact of acquisition and integration, the loss on extinguishment of debt, settlement loss on pension plan terminations, as well as the related tax impact for these items, calculated utilizing the statutory rate for where the costs were incurred, as well as the one-time impact of the CARES Act and 2017 tax reform.
Organic. This is the non-GAAP financial measurement of the change in revenue or segment profit that excludes or otherwise adjusts for the impact of acquisitions, operations in Argentina, and the impact of currency from the changes in foreign currency exchange rates as defined below:
Impact of acquisitions. Energizer completed the Auto Care Acquisition on January 28, 2019 and the Battery Acquisition on January 2, 2019. These adjustments include the impact the acquisitions' ongoing operations contributed to each respective income statement caption for the first year's operations directly after the acquisition date. This does not include the impact of acquisition and integration costs associated with the acquisitions.
Change in Argentina operations. The Company is presenting separately all changes in sales and segment profit from our Argentina affiliate due to the designation of the economy as highly inflationary as of July 1, 2018.
Impact of currency. The Company evaluates the operating performance of our Company on a currency neutral basis. The impact of currency is the difference between the value of current year foreign operations at the current period ending USD exchange rate, compared to the value of the current year foreign operations at the prior period ending USD exchange rate.
Adjusted Comparisons. Detail for adjusted gross profit, adjusted gross margin, adjusted SG&A, adjusted SG&A as a percent of sales, adjusted R&D, adjusted Interest expense and adjusted Other items, net are also supplemental non-GAAP measure disclosures. These measures exclude the impact of costs related to acquisition and integration.
Free Cash Flow and Adjusted Free Cash Flow. Free Cash Flow is defined as net cash provided by operating activities reduced by capital expenditures, net of the proceeds from asset sales. Adjusted Free Cash Flow is defined as Free Cash Flow excluding the cash payments for acquisition and integration expenses and integration capital expenditures. These expense cash payments are net of the statutory tax benefit associated with the payment.
EBITDA and Adjusted EBITDA. EBITDA is defined as net earnings before income tax provision, interest, Loss on extinguishment of debt and depreciation and amortization. Adjusted EBITDA further excludes the impact of the costs related to acquisition and integration and share based payments.
10
Energizer Holdings, Inc.
Supplemental Schedules - Segment Information and Supplemental Sales Data
For the Quarter and Twelve Months ended September 30, 2020
Operations for Energizer are managed via two major geographic reportable segments: Americas and International. Energizer’s operating model includes a combination of standalone and shared business functions between the geographic segments, varying by country and region of the world. Energizer applies a fully allocated cost basis, in which shared business functions are allocated between segments. Such allocations are estimates, and do not represent the costs of such services if performed on a standalone basis. Segment sales and profitability for the quarter and twelve months ended September 30, 2020 and 2019, respectively, are presented below:
| For the Quarter Ended September 30, | For the Twelve Months Ended September 30, | ||||||||||||||||||||||
| 2020 | 2019 | 2020 | 2019 | ||||||||||||||||||||
| Net Sales | |||||||||||||||||||||||
| Americas | $ | 554.9 | $ | 514.6 | $ | 1,971.2 | $ | 1,734.8 | |||||||||||||||
| International | 208.1 | 204.4 | 773.6 | 759.7 | |||||||||||||||||||
| Total net sales | $ | 763.0 | $ | 719.0 | $ | 2,744.8 | $ | 2,494.5 | |||||||||||||||
| Segment Profit | |||||||||||||||||||||||
| Americas | $ | 144.6 | $ | 148.0 | $ | 498.5 | $ | 456.6 | |||||||||||||||
| International | 28.4 | 42.9 | 155.8 | 174.9 | |||||||||||||||||||
| Total segment profit | $ | 173.0 | $ | 190.9 | $ | 654.3 | $ | 631.5 | |||||||||||||||
General corporate and other expenses (1) | (29.8) | (33.2) | (103.8) | (111.5) | |||||||||||||||||||
Global marketing expense (2) | (9.1) | (5.7) | (28.2) | (18.2) | |||||||||||||||||||
| Research and development expense (3) | (9.7) | (8.3) | (34.1) | (31.7) | |||||||||||||||||||
Amortization of intangible assets | (14.2) | (13.1) | (56.5) | (43.2) | |||||||||||||||||||
Acquisition and integration costs (4) | (20.4) | (28.5) | (68.0) | (188.4) | |||||||||||||||||||
Settlement loss on pension plan terminations (5) | — | (3.7) | — | (3.7) | |||||||||||||||||||
| Loss on extinguishment of debt | (90.7) | — | (94.9) | — | |||||||||||||||||||
| Interest expense - Adjusted (6) | (50.2) | (48.7) | (195.0) | (160.4) | |||||||||||||||||||
| Other items, net - Adjusted (7) | (0.7) | (2.0) | (6.1) | (1.3) | |||||||||||||||||||
| Total (loss)/earnings before income taxes | $ | (51.8) | $ | 47.7 | $ | 67.7 | $ | 73.1 | |||||||||||||||
(1) Of this amount, $2.9 million and $2.3 million were recorded in Cost of products sold and the remainder was recorded in SG&A in the Consolidated (Condensed) Statement of Earnings for the twelve months ended September 30, 2020 and 2019, respectively.
(2) The quarter and twelve months ended September 30, 2020 includes $3.6 million and $12.1 million recorded in SG&A respectively, and $5.5 million and $16.1 million recorded in A&P, respectively, on the Consolidated (Condensed) Statement of Earnings. The quarter and twelve months ended September 30, 2019 includes $2.3 million and $6.3 million recorded in SG&A respectively, and $3.4 million and $11.9 million recorded in A&P, respectively, on the Consolidated (Condensed) Statement of Earnings.
(3) Research and development expense for the quarter and twelve months ended September 30, 2020 included $0.1 million and $1.3 million, respectively, and included $0.8 million and $1.1 million for the quarter and twelve months ended September 30, 2019, respectively, of acquisition and integration costs which have been reclassified for purposes of the reconciliation above.
(4) See the Supplemental Schedules - Non-GAAP Reconciliation for where these charges are recorded in unaudited Consolidated (Condensed) Statement of Earnings.
(5) The prior year settlement is related to the termination of the Ireland pension plan which was recorded in Other items, net.
(6) Interest expense for the twelve months ended September 30, 2019 included $65.6 million of Acquisition debt commitment fees, interest and ticking fees which have been reclassified for purposes of the reconciliation above.
(7) See the Supplemental Non-GAAP reconciliation for the Other items, net reconciliation between the reported and adjusted balances.
Supplemental product information is presented below for revenues from external customers:
| For the Quarter Ended September 30, | For the Twelve Months Ended September 30, | ||||||||||||||||||||||
| Net Sales | 2020 | 2019 | 2020 | 2019 | |||||||||||||||||||
| Batteries | $ | 579.5 | $ | 561.4 | $ | 2,099.8 | $ | 1,959.9 | |||||||||||||||
| Auto Care | 142.7 | 119.4 | 513.0 | 409.3 | |||||||||||||||||||
| Lights and Licensing | 40.8 | 38.2 | 132.0 | 125.3 | |||||||||||||||||||
| Total Net sales | $ | 763.0 | $ | 719.0 | $ | 2,744.8 | $ | 2,494.5 | |||||||||||||||
11
Energizer Holdings, Inc.
Supplemental Schedules - GAAP EPS to Adjusted EPS Reconciliation
For the Quarter and Twelve Months ended September 30, 2020
(In millions, except for per share data- Unaudited)
The following tables provide a reconciliation of Net earnings from continuing operations and Diluted net earnings per common
share - continuing operations to Adjusted net earnings from continuing operations and Adjusted diluted net earnings per share -
continuing operations, which are non-GAAP measures.
| For the Quarter Ended September 30, | For the Twelve Months Ended September 30, | |||||||||||||||||||||||||
| 2020 | 2019 | 2020 | 2019 | |||||||||||||||||||||||
| Net (loss)/earnings attributable to common shareholders | $ | (55.6) | $ | 41.9 | $ | (109.5) | $ | 39.1 | ||||||||||||||||||
| Mandatory preferred stock dividends | (4.1) | (4.3) | (16.2) | (12.0) | ||||||||||||||||||||||
| Net (loss)/earnings | (51.5) | 46.2 | (93.3) | 51.1 | ||||||||||||||||||||||
| Net loss from discontinued operations, net of tax | (9.8) | (0.8) | (140.1) | (13.6) | ||||||||||||||||||||||
| Net (loss)/earnings from continuing operations | $ | (41.7) | $ | 47.0 | $ | 46.8 | $ | 64.7 | ||||||||||||||||||
| Pre-tax adjustments | ||||||||||||||||||||||||||
| Acquisition and integration (1) | $ | 20.4 | $ | 28.5 | $ | 68.0 | $ | 188.4 | ||||||||||||||||||
| Loss on extinguishment of debt | 90.7 | — | 94.9 | — | ||||||||||||||||||||||
| Settlement loss on pension terminations (Other items, net) | — | 3.7 | — | 3.7 | ||||||||||||||||||||||
| Total adjustments, pre-tax | $ | 111.1 | $ | 32.2 | $ | 162.9 | $ | 192.1 | ||||||||||||||||||
| After tax adjustments | ||||||||||||||||||||||||||
| Acquisition and integration | $ | 19.9 | $ | 19.0 | $ | 55.2 | $ | 148.1 | ||||||||||||||||||
| Loss on extinguishment of debt | 69.8 | — | 73.0 | — | ||||||||||||||||||||||
| Settlement loss on pension plan terminations | — | 3.7 | — | 3.7 | ||||||||||||||||||||||
| One-time impact of the CARES Act | (3.3) | — | 1.8 | — | ||||||||||||||||||||||
| One-time impact of 2017 tax reform | — | (1.1) | — | (0.4) | ||||||||||||||||||||||
| Total adjustments, after tax | $ | 86.4 | $ | 21.6 | $ | 130.0 | $ | 151.4 | ||||||||||||||||||
| Adjusted net earnings from continuing operations (2) | $ | 44.7 | $ | 68.6 | $ | 176.8 | $ | 216.1 | ||||||||||||||||||
| Diluted net (loss)/earnings per common share - continuing operations | $ | (0.67) | $ | 0.62 | $ | 0.44 | $ | 0.78 | ||||||||||||||||||
| Adjustments | ||||||||||||||||||||||||||
| Acquisition and integration | 0.29 | 0.26 | 0.79 | 2.06 | ||||||||||||||||||||||
| Loss on extinguishment of debt | 1.01 | — | 1.05 | — | ||||||||||||||||||||||
| Settlement loss on pension plan terminations | — | 0.05 | — | 0.05 | ||||||||||||||||||||||
| One-time impact of the CARES Act | (0.05) | — | 0.03 | — | ||||||||||||||||||||||
| One-time impact of 2017 tax reform | — | (0.01) | — | (0.01) | ||||||||||||||||||||||
| Impact for diluted share calculation (3) | 0.01 | 0.01 | — | 0.12 | ||||||||||||||||||||||
| Adjusted diluted net earnings per diluted common share - continuing operations | $ | 0.59 | $ | 0.93 | $ | 2.31 | $ | 3.00 | ||||||||||||||||||
| Weighted average shares of common stock - Diluted | 68.5 | 69.2 | 69.5 | 67.3 | ||||||||||||||||||||||
| Adjusted Weighted average shares of common stock - Diluted (3) | 69.4 | 73.9 | 69.5 | 72.0 | ||||||||||||||||||||||
(1) See Supplemental Schedules - Non-GAAP Reconciliation for where these costs are recorded on the unaudited Consolidated (Condensed) Statement of Earnings.
(2) The Effective tax rate for the quarters ended September 30, 2020 and 2019 for the Adjusted - Non-GAAP Net Earnings and Diluted EPS was 24.6% and 14.1%, respectively, as calculated utilizing the statutory rate for where the costs were incurred. The effective rate for the twelve months ended September 30, 2020 and 2019 for the Adjusted - Non-GAAP Net Earnings and Diluted EPS was 23.3% and 18.5%, respectively, as calculated utilizing the statutory rate for where the costs were incurred.
(3) For the quarter ended September 30, 2020, the Adjusted Weighted average shares of common stock - Diluted includes the dilutive impact of our outstanding performance shares and restricted stock as they are dilutive to the calculation. For the quarter and twelve months ended September 30, 2019, the Adjusted Weighted average shares of common stock - Diluted is assuming conversion of the preferred shares as those results are more dilutive. The shares have been adjusted for the 4.7 million share conversion and the preferred dividend has been excluded from the Adjusted net earnings.
12
Energizer Holdings, Inc.
Supplemental Schedules - Segment Sales
For the Quarter and Twelve Months Ended September 30, 2020
(In millions, except per share data - Unaudited)
| Net Sales | |||||||||||||||||||||||||||||||||||||||||||||||||||||||||||
| Americas | Q1'20 | % Chg | Q2'20 | % Chg | Q3'20 | % Chg | Q4'20 | % Chg | FY '20 | % Chg | |||||||||||||||||||||||||||||||||||||||||||||||||
| Net sales - prior year | $ | 373.5 | $ | 381.6 | $ | 465.1 | $ | 514.6 | $ | 1,734.8 | |||||||||||||||||||||||||||||||||||||||||||||||||
| Organic | (19.0) | (5.1) | % | 10.9 | 2.9 | % | 33.6 | 7.2 | % | 44.3 | 8.6 | % | 69.8 | 4.0 | % | ||||||||||||||||||||||||||||||||||||||||||||
| Impact of Battery Acquisition | 107.1 | 28.7 | % | — | — | % | — | — | % | — | — | % | 107.1 | 6.2 | % | ||||||||||||||||||||||||||||||||||||||||||||
| Impact of Auto Care Acquisition | 52.9 | 14.2 | % | 21.1 | 5.5 | % | — | — | % | — | — | % | 74.0 | 4.3 | % | ||||||||||||||||||||||||||||||||||||||||||||
| Change in Argentina operations | 0.2 | 0.1 | % | (0.7) | (0.2) | % | 0.1 | — | % | 2.0 | 0.4 | % | 1.6 | 0.1 | % | ||||||||||||||||||||||||||||||||||||||||||||
| Impact of currency | (0.2) | (0.1) | % | (3.0) | (0.8) | % | (6.9) | (1.4) | % | (6.0) | (1.2) | % | (16.1) | (1.0) | % | ||||||||||||||||||||||||||||||||||||||||||||
| Net sales - current year | $ | 514.5 | 37.8 | % | $ | 409.9 | 7.4 | % | $ | 491.9 | 5.8 | % | $ | 554.9 | 7.8 | % | $ | 1,971.2 | 13.6 | % | |||||||||||||||||||||||||||||||||||||||
| International | |||||||||||||||||||||||||||||||||||||||||||||||||||||||||||
| Net sales - prior year | $ | 198.4 | $ | 174.8 | $ | 182.1 | $ | 204.4 | $ | 759.7 | |||||||||||||||||||||||||||||||||||||||||||||||||
| Organic | (0.7) | (0.4) | % | 4.1 | 2.3 | % | (11.3) | (6.2) | % | (0.5) | (0.2) | % | (8.4) | (1.1) | % | ||||||||||||||||||||||||||||||||||||||||||||
| Impact of Battery Acquisition | 18.4 | 9.3 | % | — | — | % | — | — | % | — | — | % | 18.4 | 2.4 | % | ||||||||||||||||||||||||||||||||||||||||||||
| Impact of Auto Care Acquisition | 8.5 | 4.3 | % | 2.6 | 1.5 | % | — | — | % | — | — | % | 11.1 | 1.5 | % | ||||||||||||||||||||||||||||||||||||||||||||
| Impact of currency | (2.3) | (1.2) | % | (4.4) | (2.5) | % | (4.7) | (2.6) | % | 4.2 | 2.0 | % | (7.2) | (1.0) | % | ||||||||||||||||||||||||||||||||||||||||||||
| Net sales - current year | $ | 222.3 | 12.0 | % | $ | 177.1 | 1.3 | % | $ | 166.1 | (8.8) | % | $ | 208.1 | 1.8 | % | $ | 773.6 | 1.8 | % | |||||||||||||||||||||||||||||||||||||||
| Total Net Sales | |||||||||||||||||||||||||||||||||||||||||||||||||||||||||||
| Net sales - prior year | $ | 571.9 | $ | 556.4 | $ | 647.2 | $ | 719.0 | $ | 2,494.5 | |||||||||||||||||||||||||||||||||||||||||||||||||
| Organic | (19.7) | (3.4) | % | 15.0 | 2.7 | % | 22.3 | 3.4 | % | 43.8 | 6.1 | % | 61.4 | 2.5 | % | ||||||||||||||||||||||||||||||||||||||||||||
| Impact of Battery Acquisition | 125.5 | 21.9 | % | — | — | % | — | — | % | — | — | % | 125.5 | 5.0 | % | ||||||||||||||||||||||||||||||||||||||||||||
| Impact of Auto Care Acquisition | 61.4 | 10.7 | % | 23.7 | 4.3 | % | — | — | % | — | — | % | 85.1 | 3.4 | % | ||||||||||||||||||||||||||||||||||||||||||||
| Change in Argentina operations | 0.2 | — | % | (0.7) | (0.1) | % | 0.1 | — | % | 2.0 | 0.3 | % | 1.6 | 0.1 | % | ||||||||||||||||||||||||||||||||||||||||||||
| Impact of currency | (2.5) | (0.4) | % | (7.4) | (1.4) | % | (11.6) | (1.7) | % | (1.8) | (0.3) | % | (23.3) | (1.0) | % | ||||||||||||||||||||||||||||||||||||||||||||
| Net sales - current year | $ | 736.8 | 28.8 | % | $ | 587.0 | 5.5 | % | $ | 658.0 | 1.7 | % | $ | 763.0 | 6.1 | % | $ | 2,744.8 | 10.0 | % | |||||||||||||||||||||||||||||||||||||||
13
Energizer Holdings, Inc.
Supplemental Schedules - Segment Profit
For the Quarter and Twelve Months Ended September 30, 2020
(In millions, except per share data - Unaudited)
| Segment Profit | |||||||||||||||||||||||||||||||||||||||||||||||||||||||||||
| Americas | Q1'20 | % Chg | Q2'20 | % Chg | Q3'20 | % Chg | Q4'20 | % Chg | FY '20 | % Chg | |||||||||||||||||||||||||||||||||||||||||||||||||
| Segment Profit - prior year | $ | 116.1 | $ | 88.7 | $ | 103.8 | $ | 148.0 | $ | 456.6 | |||||||||||||||||||||||||||||||||||||||||||||||||
| Organic | (17.1) | (14.7) | % | 8.6 | 9.7 | % | 22.8 | 22.0 | % | 0.5 | 0.3 | % | 14.8 | 3.2 | % | ||||||||||||||||||||||||||||||||||||||||||||
| Impact of Battery Acquisition | 21.8 | 18.8 | % | — | — | % | — | — | % | — | — | % | 21.8 | 4.8 | % | ||||||||||||||||||||||||||||||||||||||||||||
| Impact of Auto Care Acquisition | 9.1 | 7.8 | % | 6.7 | 7.6 | % | — | — | % | — | — | % | 15.8 | 3.5 | % | ||||||||||||||||||||||||||||||||||||||||||||
| Change in Argentina operations | (0.6) | (0.5) | % | (0.3) | (0.3) | % | 0.4 | 0.4 | % | (0.1) | (0.1) | % | (0.6) | (0.1) | % | ||||||||||||||||||||||||||||||||||||||||||||
| Impact of currency | (0.1) | (0.1) | % | (1.9) | (2.2) | % | (4.1) | (4.0) | % | (3.8) | (2.5) | % | (9.9) | (2.2) | % | ||||||||||||||||||||||||||||||||||||||||||||
| Segment Profit - current year | $ | 129.2 | 11.3 | % | $ | 101.8 | 14.8 | % | $ | 122.9 | 18.4 | % | $ | 144.6 | (2.3) | % | $ | 498.5 | 9.2 | % | |||||||||||||||||||||||||||||||||||||||
| International | |||||||||||||||||||||||||||||||||||||||||||||||||||||||||||
| Segment Profit - prior year | $ | 54.6 | $ | 36.4 | $ | 41.0 | $ | 42.9 | $ | 174.9 | |||||||||||||||||||||||||||||||||||||||||||||||||
| Organic | (8.3) | (15.2) | % | 6.1 | 16.8 | % | (3.1) | (7.6) | % | (17.1) | (39.9) | % | (22.4) | (12.8) | % | ||||||||||||||||||||||||||||||||||||||||||||
| Impact of Battery Acquisition | 6.1 | 11.2 | % | — | — | % | — | — | % | — | — | % | 6.1 | 3.5 | % | ||||||||||||||||||||||||||||||||||||||||||||
| Impact of Auto Care Acquisition | 1.0 | 1.8 | % | 0.3 | 0.8 | % | — | — | % | — | — | % | 1.3 | 0.7 | % | ||||||||||||||||||||||||||||||||||||||||||||
| Impact of currency | (1.2) | (2.2) | % | (2.4) | (6.6) | % | (3.1) | (7.5) | % | 2.6 | 6.1 | % | (4.1) | (2.3) | % | ||||||||||||||||||||||||||||||||||||||||||||
| Segment Profit - current year | $ | 52.2 | (4.4) | % | $ | 40.4 | 11.0 | % | $ | 34.8 | (15.1) | % | $ | 28.4 | (33.8) | % | $ | 155.8 | (10.9) | % | |||||||||||||||||||||||||||||||||||||||
| Total Segment Profit | |||||||||||||||||||||||||||||||||||||||||||||||||||||||||||
| Segment Profit - prior year | $ | 170.7 | $ | 125.1 | $ | 144.8 | $ | 190.9 | $ | 631.5 | |||||||||||||||||||||||||||||||||||||||||||||||||
| Organic | (25.4) | (14.9) | % | 14.7 | 11.8 | % | 19.7 | 13.6 | % | (16.6) | (8.7) | % | (7.6) | (1.2) | % | ||||||||||||||||||||||||||||||||||||||||||||
| Impact of Battery Acquisition | 27.9 | 16.3 | % | — | — | % | — | — | % | — | — | % | 27.9 | 4.4 | % | ||||||||||||||||||||||||||||||||||||||||||||
| Impact of Auto Care Acquisition | 10.1 | 5.9 | % | 7.0 | 5.6 | % | — | — | % | — | — | % | 17.1 | 2.7 | % | ||||||||||||||||||||||||||||||||||||||||||||
| Change in Argentina operations | (0.6) | (0.4) | % | (0.3) | (0.2) | % | 0.4 | 0.3 | % | (0.1) | (0.1) | % | (0.6) | (0.1) | % | ||||||||||||||||||||||||||||||||||||||||||||
| Impact of currency | (1.3) | (0.6) | % | (4.3) | (3.5) | % | (7.2) | (5.0) | % | (1.2) | (0.6) | % | (14.0) | (2.2) | % | ||||||||||||||||||||||||||||||||||||||||||||
| Segment Profit - current year | $ | 181.4 | 6.3 | % | $ | 142.2 | 13.7 | % | $ | 157.7 | 8.9 | % | $ | 173.0 | (9.4) | % | $ | 654.3 | 3.6 | % | |||||||||||||||||||||||||||||||||||||||
14
Energizer Holdings, Inc.
Supplemental Schedules - Non-GAAP Reconciliations
For the Quarter and Twelve Months Ended September 30, 2020
(In millions, except per share data - Unaudited)
| Gross Profit | Q1'20 | Q2'20 | Q3'20 | Q4'20 | Q1'19 | Q2'19 | Q3'19 | Q4'19 | 2020 | 2019 | ||||||||||||||||||||||||||||
| Net Sales | $ | 736.8 | $ | 587.0 | $ | 658.0 | $ | 763.0 | $ | 571.9 | $ | 556.4 | $ | 647.2 | $ | 719.0 | $ | 2,744.8 | $ | 2,494.5 | ||||||||||||||||||
| Cost of products sold - adjusted | 428.6 | 343.1 | 389.3 | 469.9 | 296.4 | 330.5 | 388.5 | 416.6 | 1,630.9 | 1,432.0 | ||||||||||||||||||||||||||||
| Adjusted Gross Profit | $ | 308.2 | $ | 243.9 | $ | 268.7 | $ | 293.1 | $ | 275.5 | $ | 225.9 | $ | 258.7 | $ | 302.4 | $ | 1,113.9 | $ | 1,062.5 | ||||||||||||||||||
| Adjusted Gross Margin | 41.8 | % | 41.6 | % | 40.8 | % | 38.4 | % | 48.2 | % | 40.6 | % | 40.0 | % | 42.1 | % | 40.6 | % | 42.6 | % | ||||||||||||||||||
| Acquisition and integration costs | 6.9 | 8.3 | 5.5 | 11.3 | — | 4.5 | 5.9 | 12.1 | 32.0 | 22.5 | ||||||||||||||||||||||||||||
| Inventory step up | — | — | — | — | — | 27.2 | 6.5 | 2.5 | — | 36.2 | ||||||||||||||||||||||||||||
| Reported Cost of products sold | 435.5 | 351.4 | 394.8 | 481.2 | 296.4 | 362.2 | 400.9 | 431.2 | 1,662.9 | 1,490.7 | ||||||||||||||||||||||||||||
| Reported Gross Profit | $ | 301.3 | $ | 235.6 | $ | 263.2 | $ | 281.8 | $ | 275.5 | $ | 194.2 | $ | 246.3 | $ | 287.8 | $ | 1,081.9 | $ | 1,003.8 | ||||||||||||||||||
| Reported Gross Margin | 40.9 | % | 40.1 | % | 40.0 | % | 36.9 | % | 48.2 | % | 34.9 | % | 38.1 | % | 40.0 | % | 39.4 | % | 40.2 | % | ||||||||||||||||||
| SG&A | Q1'20 | Q2'20 | Q3'20 | Q4'20 | Q1'19 | Q2'19 | Q3'19 | Q4'19 | 2020 | 2019 | ||||||||||||||||||||||||||||
| Segment SG&A | $ | 84.1 | $ | 82.4 | $ | 78.5 | $ | 86.8 | $ | 65.8 | $ | 81.4 | $ | 82.8 | $ | 88.2 | $ | 331.8 | $ | 318.2 | ||||||||||||||||||
| Corporate SG&A | 24.0 | 23.0 | 25.2 | 28.4 | 18.7 | 28.6 | 29.1 | 32.5 | 100.6 | 108.9 | ||||||||||||||||||||||||||||
| Global Marketing | 2.9 | 2.6 | 3.0 | 3.6 | 1.2 | 2.2 | 0.6 | 2.3 | 12.1 | 6.3 | ||||||||||||||||||||||||||||
| SG&A Adjusted - subtotal | $ | 111.0 | $ | 108.0 | $ | 106.7 | $ | 118.8 | $ | 85.7 | $ | 112.2 | $ | 112.5 | $ | 123.0 | $ | 444.5 | $ | 433.4 | ||||||||||||||||||
| SG&A Adjusted % of Net Sales | 15.1 | % | 18.4 | % | 16.2 | % | 15.6 | % | 15.0 | % | 20.2 | % | 17.4 | % | 17.1 | % | 16.2 | % | 17.4 | % | ||||||||||||||||||
| Acquisition and integration costs | 11.1 | 8.1 | 6.1 | 13.5 | 18.9 | 29.1 | 15.1 | 19.2 | 38.8 | 82.3 | ||||||||||||||||||||||||||||
| Reported SG&A | $ | 122.1 | $ | 116.1 | $ | 112.8 | $ | 132.3 | $ | 104.6 | $ | 141.3 | $ | 127.6 | $ | 142.2 | $ | 483.3 | $ | 515.7 | ||||||||||||||||||
| Reported SG&A % of Net Sales | 16.6 | % | 19.8 | % | 17.1 | % | 17.3 | % | 18.3 | % | 25.4 | % | 19.7 | % | 19.8 | % | 17.6 | % | 20.7 | % | ||||||||||||||||||
| Other items, net | Q1'20 | Q2'20 | Q3'20 | Q4'20 | Q1'19 | Q2'19 | Q3'19 | Q4'19 | 2020 | 2019 | ||||||||||||||||||||||||||||
| Interest income | $ | (0.1) | $ | (0.1) | $ | (0.2) | $ | (0.2) | $ | (0.3) | $ | (0.7) | $ | (0.3) | $ | (6.4) | $ | (0.6) | $ | (7.7) | ||||||||||||||||||
| Foreign currency exchange (gain)/loss | (0.4) | 5.5 | 2.9 | 0.7 | (1.1) | 3.8 | (0.3) | 2.8 | 8.7 | 5.2 | ||||||||||||||||||||||||||||
| Pension benefit other than service costs | (0.5) | (0.5) | (0.5) | (0.2) | (0.7) | (0.7) | (0.7) | (0.2) | (1.7) | (2.3) | ||||||||||||||||||||||||||||
| Other | 0.1 | 0.3 | (1.1) | 0.4 | — | — | 0.3 | 5.8 | (0.3) | 6.1 | ||||||||||||||||||||||||||||
| Adjusted Other items, net | (0.9) | 5.2 | 1.1 | 0.7 | (2.1) | 2.4 | (1.0) | 2.0 | 6.1 | 1.3 | ||||||||||||||||||||||||||||
| Acquisition foreign currency loss/(gain) | 2.2 | — | — | — | (9.0) | — | 0.9 | (5.5) | 2.2 | (13.6) | ||||||||||||||||||||||||||||
| Interest income on restricted cash | — | — | — | — | (5.8) | — | — | — | — | (5.8) | ||||||||||||||||||||||||||||
| Transition services agreement income | (0.3) | (0.1) | (0.4) | (0.1) | — | (0.1) | (0.7) | (0.6) | (0.9) | (1.4) | ||||||||||||||||||||||||||||
| Gain on sale of assets | (1.0) | — | — | — | — | — | — | — | (1.0) | — | ||||||||||||||||||||||||||||
| Pre-acquisition insurance proceeds | — | — | — | (4.9) | — | — | — | — | (4.9) | — | ||||||||||||||||||||||||||||
| Other | — | — | — | 0.5 | — | 1.5 | — | — | 0.5 | 1.5 | ||||||||||||||||||||||||||||
| Acquisition and integration cost | 0.9 | (0.1) | (0.4) | (4.5) | (14.8) | 1.4 | 0.2 | (6.1) | (4.1) | (19.3) | ||||||||||||||||||||||||||||
| Settlement loss on pension plan terminations | — | — | — | — | — | — | — | 3.7 | — | 3.7 | ||||||||||||||||||||||||||||
| Total Other items, net Reported | $ | — | $ | 5.1 | $ | 0.7 | $ | (3.8) | $ | (16.9) | $ | 3.8 | $ | (0.8) | $ | (0.4) | $ | 2.0 | $ | (14.3) | ||||||||||||||||||
| Acquisition and integration | Q1'20 | Q2'20 | Q3'20 | Q4'20 | Q1'19 | Q2'19 | Q3'19 | Q4'19 | 2020 | 2019 | ||||||||||||||||||||||||||||
| Inventory step up (COGS) | $ | — | $ | — | $ | — | $ | — | $ | — | $ | 27.2 | $ | 6.5 | $ | 2.5 | $ | — | $ | 36.2 | ||||||||||||||||||
| Cost of products sold | 6.9 | 8.3 | 5.5 | 11.3 | — | 4.5 | 5.9 | 12.1 | 32.0 | 22.5 | ||||||||||||||||||||||||||||
| SG&A | 11.1 | 8.1 | 6.1 | 13.5 | 18.9 | 29.1 | 15.1 | 19.2 | 38.8 | 82.3 | ||||||||||||||||||||||||||||
| Research and development | 0.4 | 0.6 | 0.2 | 0.1 | — | — | 0.3 | 0.8 | 1.3 | 1.1 | ||||||||||||||||||||||||||||
| Interest expense | — | — | — | — | 32.4 | 33.2 | — | — | — | 65.6 | ||||||||||||||||||||||||||||
| Other items, net | 0.9 | (0.1) | (0.4) | (4.5) | (14.8) | 1.4 | 0.2 | (6.1) | (4.1) | (19.3) | ||||||||||||||||||||||||||||
| Acquisition and integration related items | $ | 19.3 | $ | 16.9 | $ | 11.4 | $ | 20.4 | $ | 36.5 | $ | 95.4 | $ | 28.0 | $ | 28.5 | $ | 68.0 | $ | 188.4 | ||||||||||||||||||
15
Energizer Holdings, Inc.
Supplemental Schedules - Non-GAAP Reconciliations cont.
For the Quarter and Twelve Months Ended September 30, 2020
(In millions, except per share data - Unaudited)
| Q1'20 | Q2'20 | Q3'20 | Q4'20 | FY 2020 | |||||||||||||||||||||||||
| Net earnings/(loss) from continuing operations | $ | 45.8 | $ | 13.7 | $ | 29.0 | $ | (41.7) | $ | 46.8 | |||||||||||||||||||
| Income tax provision/(benefit) | 12.9 | 8.2 | 9.9 | (10.1) | 20.9 | ||||||||||||||||||||||||
| Earnings/(loss) before income taxes | 58.7 | 21.9 | 38.9 | (51.8) | 67.7 | ||||||||||||||||||||||||
| Interest expense | 46.8 | 47.2 | 50.8 | 50.2 | 195.0 | ||||||||||||||||||||||||
| Loss on extinguishment of debt | 4.2 | — | — | 90.7 | 94.9 | ||||||||||||||||||||||||
| Depreciation & Amortization | 27.6 | 28.5 | 28.2 | 27.6 | 111.9 | ||||||||||||||||||||||||
| EBITDA | 137.3 | 97.6 | 117.9 | 116.7 | 469.5 | ||||||||||||||||||||||||
| Adjustments: | |||||||||||||||||||||||||||||
| Acquisition and integration costs | 19.3 | 16.9 | 11.4 | 20.4 | 68.0 | ||||||||||||||||||||||||
| Share-based payments | 7.2 | 8.7 | 5.3 | 3.3 | 24.5 | ||||||||||||||||||||||||
| Adjusted EBITDA | $ | 163.8 | $ | 123.2 | $ | 134.6 | $ | 140.4 | $ | 562.0 | |||||||||||||||||||
| Free Cash Flow | 2020 | 2019 | |||||||||
| Net cash from operating activities | $ | 389.3 | $ | 142.1 | |||||||
| Capital expenditures | (65.3) | (55.1) | |||||||||
| Proceeds from sale of assets | 6.4 | 0.2 | |||||||||
| Free Cash Flow - subtotal | $ | 330.4 | $ | 87.2 | |||||||
| Cash paid for acquisition and integration expenses (1) | 33.7 | 159.2 | |||||||||
| Cash paid for integration related capital expenditures | 41.0 | 9.8 | |||||||||
| Adjusted Free Cash Flow | $ | 405.1 | $ | 256.2 | |||||||
(1) These expenses include financing costs, success fees, consulting and legal costs incurred to complete the acquisition, as well as integration costs incurred since the acquisition.
16
Energizer Holdings, Inc.
Supplemental Schedules - Non-GAAP Reconciliations cont.
Fiscal 2021 Outlook
(In millions, except per share data - Unaudited)
| Fiscal Year 2021 Outlook Reconciliation - Adjusted earnings from continuing operations and Adjusted diluted net earnings per common share - continuing operations (EPS) | |||||||||||||||||||||||
| (in millions, except per share data) | Net earnings | EPS | |||||||||||||||||||||
| Fiscal Year 2021 - GAAP Outlook | $172 | to | $198 | $2.30 | to | $2.69 | |||||||||||||||||
| Impacts: | |||||||||||||||||||||||
| Acquisition and integration costs, net of tax benefit | 44 | to | 38 | 0.65 | to | 0.56 | |||||||||||||||||
| Fiscal Year 2021 - Adjusted Outlook | $216 | to | $236 | $2.95 | to | $3.25 | |||||||||||||||||
| Fiscal Year 2021 Outlook Reconciliation - Adjusted EBITDA | |||||||||||
| (in millions, except per share data) | |||||||||||
| Net earnings from continuing operations | $172 | to | $198 | ||||||||
| Income tax provision | 38 | to | 72 | ||||||||
| Earnings before income taxes | $210 | to | $270 | ||||||||
| Interest expense | 190 | to | 180 | ||||||||
| Amortization | 58 | to | 56 | ||||||||
| Depreciation | 57 | to | 54 | ||||||||
| EBITDA | $515 | to | $560 | ||||||||
| Adjustments: | |||||||||||
| Integration costs | 60 | to | 50 | ||||||||
| Share-based payments | 25 | to | 20 | ||||||||
| Adjusted EBITDA | $600 | to | $630 | ||||||||
| Fiscal Year 2021 Outlook Reconciliation - Adjusted Free Cash Flow | |||||||||||
| (in millions, except per share data) | |||||||||||
| Net cash from operating activities | $325 | to | $360 | ||||||||
| Capital expenditures | 80 | to | 70 | ||||||||
| Free cash flow | $245 | to | $290 | ||||||||
| Adjustments: | |||||||||||
| Integration costs | 40 | to | 30 | ||||||||
| Integration related capital expenditures | 40 | to | 30 | ||||||||
| Adjusted free cash flow | $325 | to | $350 | ||||||||
17

Exhibit 99.2 Fiscal Q4 and FY 2020 Earnings + November 12, 2020
Forward-Looking Statements and Non-GAAP Financial Measures Energizer Holdings, Inc. (the “Company”) and its management may make certain statements that constitute “forward-looking statements” within the meaning of the Private Securities Litigation Reform Act of 1995. These statements can be identified by the fact that they do not relate strictly to historical or current facts. Forward-looking statements often use words such as “anticipates,” “targets,” “expects,” “hopes,” “estimates,” “intends,” “plans,” “goals,” “believes,” “continue” and other similar expressions or future or conditional verbs such as “will,” “may,” “might,” “should,” “would” and “could.” Forward-looking statements represent the Company’s current expectations, plans or forecasts of its future results, revenues, expenses, capital measures, strategy, and future business and economic conditions more generally, and other future matters. These statements are not guarantees of future results or performance and involve certain known and unknown risks, uncertainties and assumptions that are difficult to predict and are often beyond the Company’s control. Actual outcomes and results may differ materially from those expressed in these forward looking statements. Factors that could cause actual results or events to differ materially from those anticipated include, without limitation, the matters implied by, any of these forward-looking statements. You should not place undue reliance on any forward-looking statement and should consider the following uncertainties and risks, as well as the risks and uncertainties more fully discussed under Item 1A. Risk Factors of the Company’s Annual Report on Form 10-K filed with the Securities and Exchange Commission on November 19, 2019, as well as our Form 10-Q filed with the SEC on August 5, 2020: 1) market and economic conditions; (2) market trends in the categories in which we compete; (3) uncertainty relating to the impacts of the COVID-19 outbreak, including but not limited to, its impacts on consumer demand, costs, product mix, the availability of our products, our strategic initiatives, our and our partners' global supply chains, operations and routes to market; (4) our ability to integrate businesses, to realize the projected results of the acquired businesses, and to obtain expected cost savings, synergies and other anticipated benefits of the acquired businesses within the expected timeframe, or at all; (5) the impact of the acquired businesses on our business operations; (6) the success of new products and the ability to continually develop and market new products; (7) our ability to attract, retain and improve distribution with key customers; (8) our ability to continue planned advertising and other promotional spending; (9) our ability to timely execute strategic initiatives, including restructurings, and international go-to-market changes in a manner that will positively impact our financial condition and results of operations and does not disrupt our business operations; (10) the impact of strategic initiatives, including restructurings, on our relationships with employees, customers and vendors; (11) our ability to maintain and improve market share in the categories in which we operate despite heightened competitive pressure; (12) financial strength of distributors and suppliers; (13) our ability to improve operations and realize cost savings; (14) the impact of the United Kingdom’s future trading relationships following its exit from the European Union; (15) the impact of foreign currency exchange rates and currency controls, as well as offsetting hedges; (16) the impact of adverse or unexpected weather conditions; (17) uncertainty from the expected discontinuance of LIBOR and the transition to any other interest rate benchmark; (18) the impact of raw materials and other commodity costs; (19) the impact of legislative changes or regulatory determinations or changes by federal, state and local, and foreign authorities, including customs and tariff determinations, as well as the impact of potential changes to tax laws, policies and regulations; (20) costs and reputational damage associated with cyber-attacks or information security breaches or other events; (21) the impact of advertising and product liability claims and other litigation; and (22) compliance with debt covenants and maintenance of credit ratings as well as the impact of interest and principal repayment of our existing and any future debt. 2
Forward-Looking Statements and Non-GAAP Financial Measures The information contained herein is preliminary and based on Company data available at the time of the earnings presentation. Forward- looking statements speak only as of the date they are made, and the Company undertakes no obligation to update any forward-looking statement to reflect the impact of circumstances or events that arise after the date the forward-looking statement was made. The Company reports its financial results in accordance with accounting principles generally accepted in the U.S. ("GAAP"). However, management believes that certain non-GAAP financial measures provide users with additional meaningful comparisons to the corresponding historical or future period. These non-GAAP financial measures exclude items that are not reflective of the Company's on-going operating performance, such as acquisition and integration costs and related items, settlement loss on pension plan terminations, loss on extinguishment of debt, the one-time impact of the CARES Act and the December 2017 Tax Cuts and Jobs Act (2017 tax reform). In addition, these measures help investors to analyze year over year comparability when excluding currency fluctuations, acquisition activity as well as other company initiatives that are not on-going. We believe these non-GAAP financial measures are an enhancement to assist investors in understanding our business and in performing analysis consistent with financial models developed by research analysts. Investors should consider non-GAAP measures in addition to, not as a substitute for, or superior to, the comparable GAAP measures. In addition, these non-GAAP measures may not be the same as similar measures used by other companies due to possible differences in method and in the items being adjusted. We provide the following non-GAAP measures and calculations, as well as the corresponding reconciliation to the closest GAAP measure in the following supplemental schedules: A reconciliation of all non-GAAP financial metrics used can be found in the Appendix of this presentation: ‒ Adjusted Earnings Per Share (EPS) excludes the impact of the costs related to acquisition and integration, the loss on extinguishment of debt, the prior year settlement loss on pension plan termination, the one-time impact of the CARES Act and the 2017 tax reform. ‒ EBITDA is defined as net earnings before income tax provision, interest, loss on extinguishment of debt and depreciation and amortization. Adjusted EBITDA further excludes the impact of the costs related to acquisition and integration and share based payments. ‒ Adjusted Free Cash Flow excludes the cash payments for acquisition and integration expenses and integration capital expenditures. These expense cash payments are net of the statutory tax benefit associated with the payment. ‒ Adjusted Gross Margin and Adjusted SG&A excludes any charges related to acquisition and integration charges. ‒ Organic revenue is the non-GAAP financial measurement of the change in revenue that excludes or otherwise adjusts for the impactof acquisitions, operations in Argentina, and the impact of currency from the changes in foreign currency exchange rates. References to specific quarters and years pertain to our fiscal years, and references to the legacy and/or base business relate to the Energizer 3 business prior to the completion of the Battery and Auto Care Acquisitions.
Financial Results + Fourth Quarter and Fiscal 2020
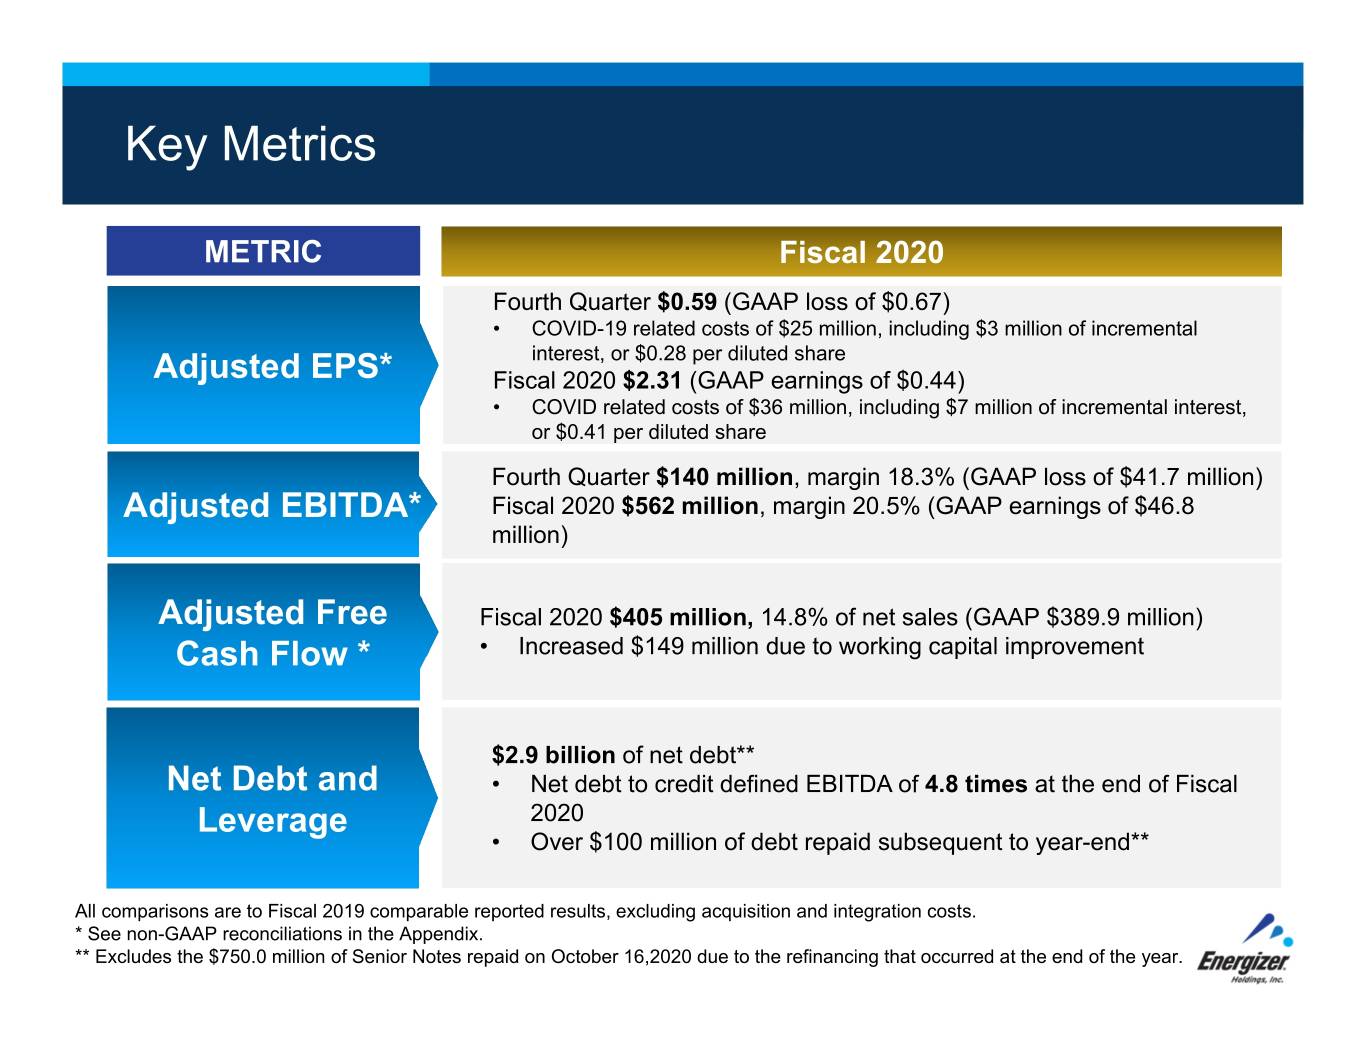
Key Metrics METRIC Fiscal 2020 Fourth Quarter $0.59 (GAAP loss of $0.67) Fourth Quarter & Fiscal• COVID-19 2020 related costs Financial of $25 million, including Headlines $3 million of incremental interest, or $0.28 per diluted share Adjusted EPS* Fiscal 2020 $2.31 (GAAP earnings of $0.44) • COVID related costs of $36 million, including $7 million of incremental interest, or $0.41 per diluted share Fourth Quarter $140 million, margin 18.3% (GAAP loss of $41.7 million) Adjusted EBITDA* Fiscal 2020 $562 million, margin 20.5% (GAAP earnings of $46.8 million) Adjusted Free Fiscal 2020 $405 million, 14.8% of net sales (GAAP $389.9 million) Cash Flow * • Increased $149 million due to working capital improvement $2.9 billion of net debt** Net Debt and • Net debt to credit defined EBITDA of 4.8 times at the end of Fiscal Leverage 2020 • Over $100 million of debt repaid subsequent to year-end** All comparisons are to Fiscal 2019 comparable reported results, excluding acquisition and integration costs. * See non-GAAP reconciliations in the Appendix. ** Excludes the $750.0 million of Senior Notes repaid on October 16,2020 due to the refinancing that occurred at the end of the year.
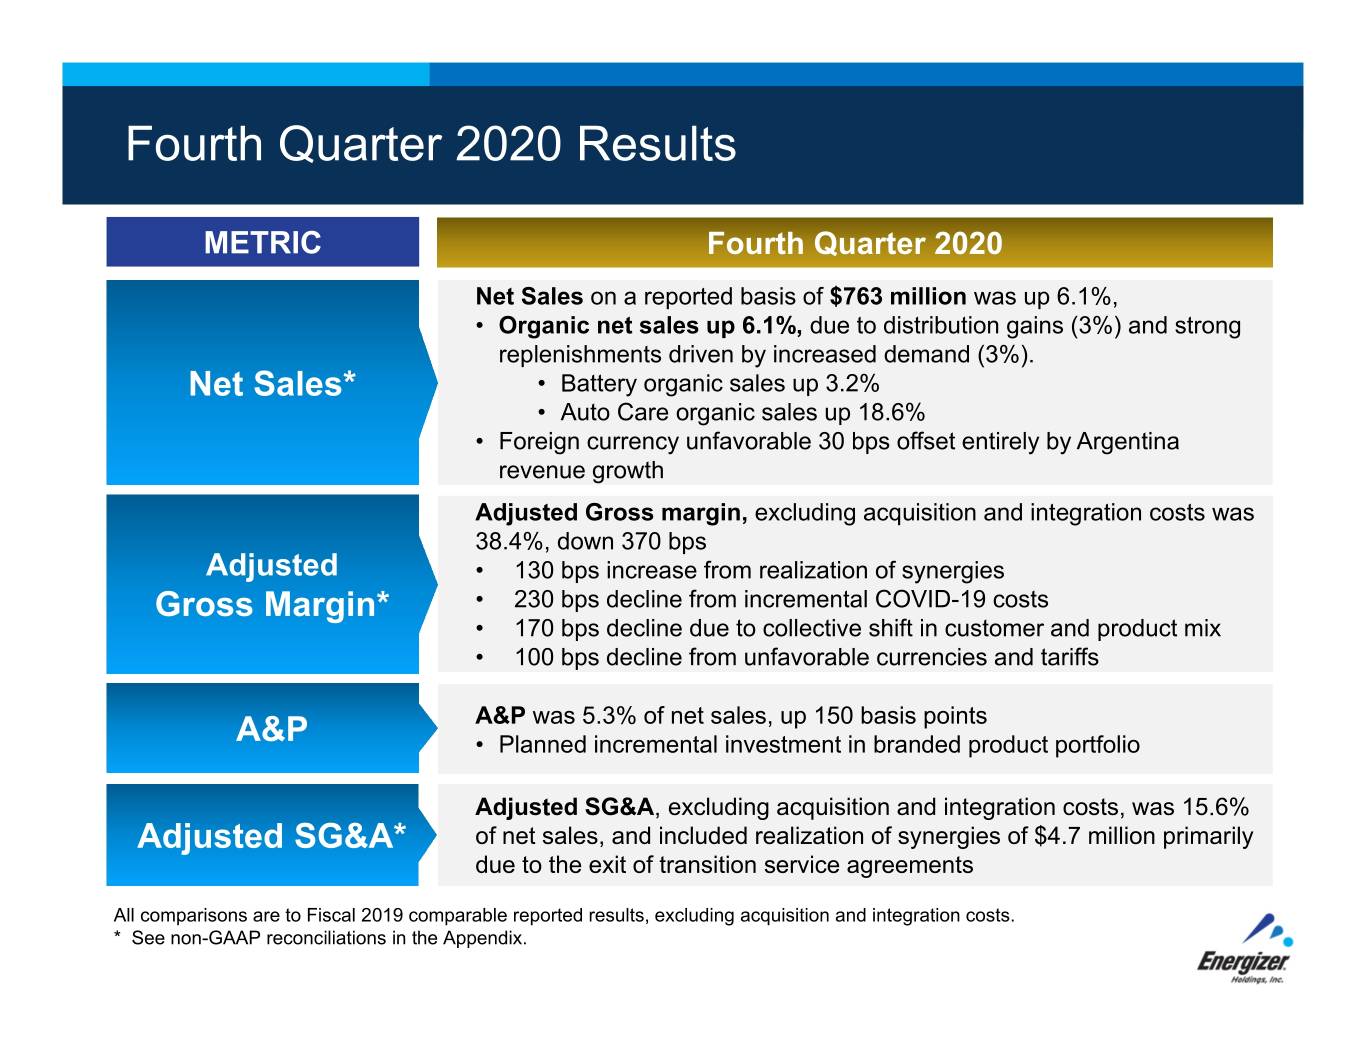
Fourth Quarter 2020 Results METRIC Fourth Quarter 2020 Net Sales on a reported basis of $763 million was up 6.1%, • Organic net sales up 6.1%, due to distribution gains (3%) and strong replenishments driven by increased demand (3%). Net Sales* • Battery organic sales up 3.2% • Auto Care organic sales up 18.6% • Foreign currency unfavorable 30 bps offset entirely by Argentina revenue growth Adjusted Gross margin, excluding acquisition and integration costs was 38.4%, down 370 bps Adjusted • 130 bps increase from realization of synergies Gross Margin* • 230 bps decline from incremental COVID-19 costs • 170 bps decline due to collective shift in customer and product mix • 100 bps decline from unfavorable currencies and tariffs A&P was 5.3% of net sales, up 150 basis points A&P • Planned incremental investment in branded product portfolio Adjusted SG&A, excluding acquisition and integration costs, was 15.6% Adjusted SG&A* of net sales, and included realization of synergies of $4.7 million primarily due to the exit of transition service agreements All comparisons are to Fiscal 2019 comparable reported results, excluding acquisition and integration costs. * See non-GAAP reconciliations in the Appendix.
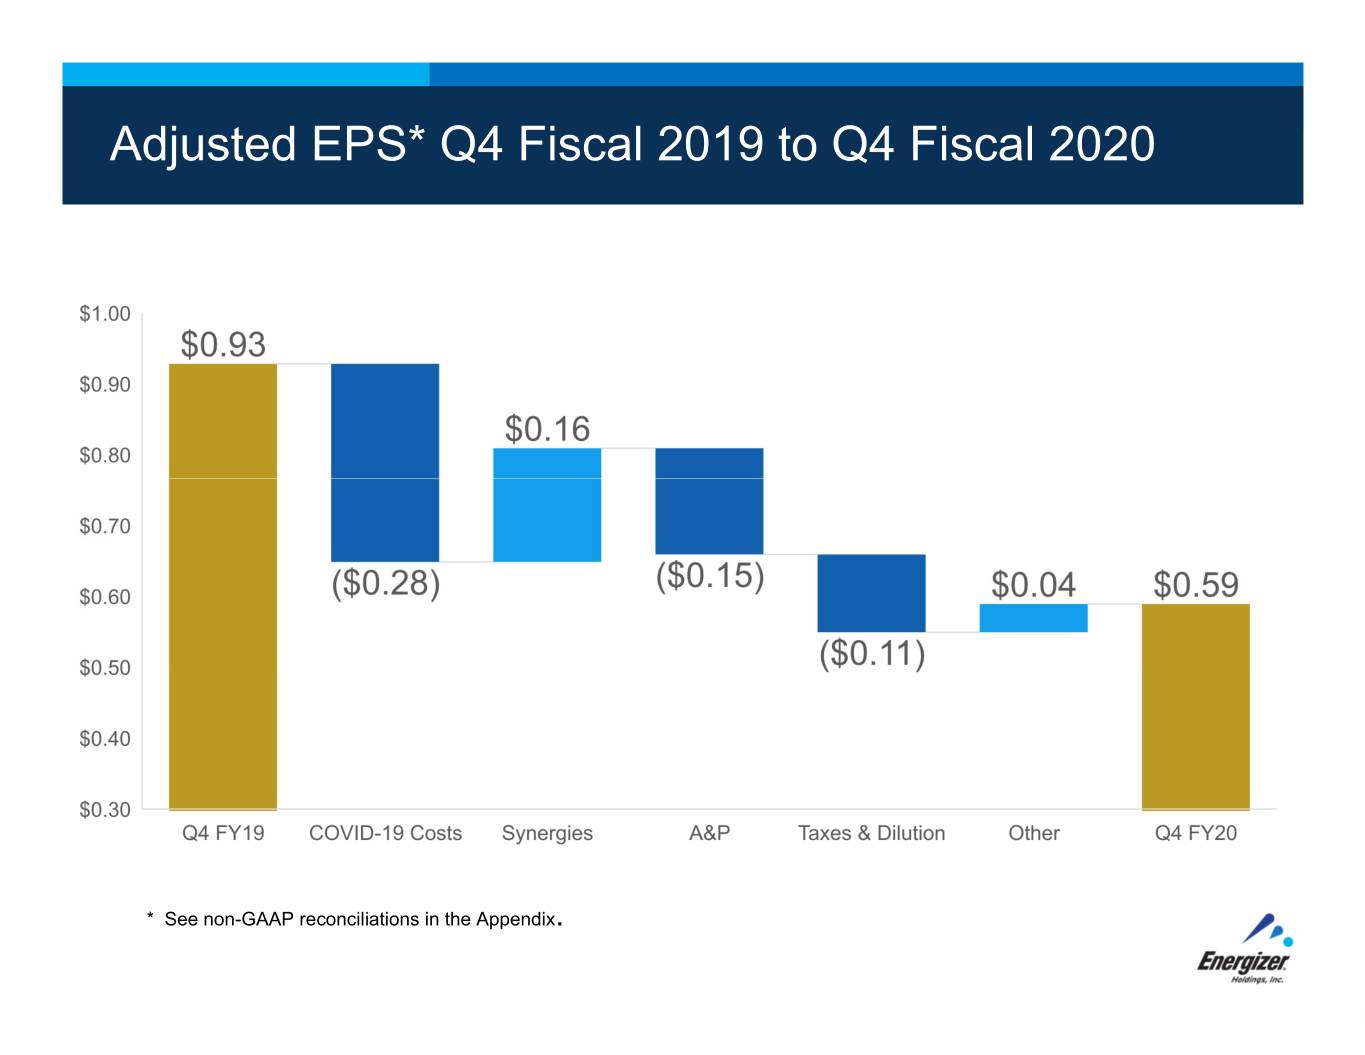
Adjusted EPS* Q4 Fiscal 2019 to Q4 Fiscal 2020 * See non-GAAP reconciliations in the Appendix.
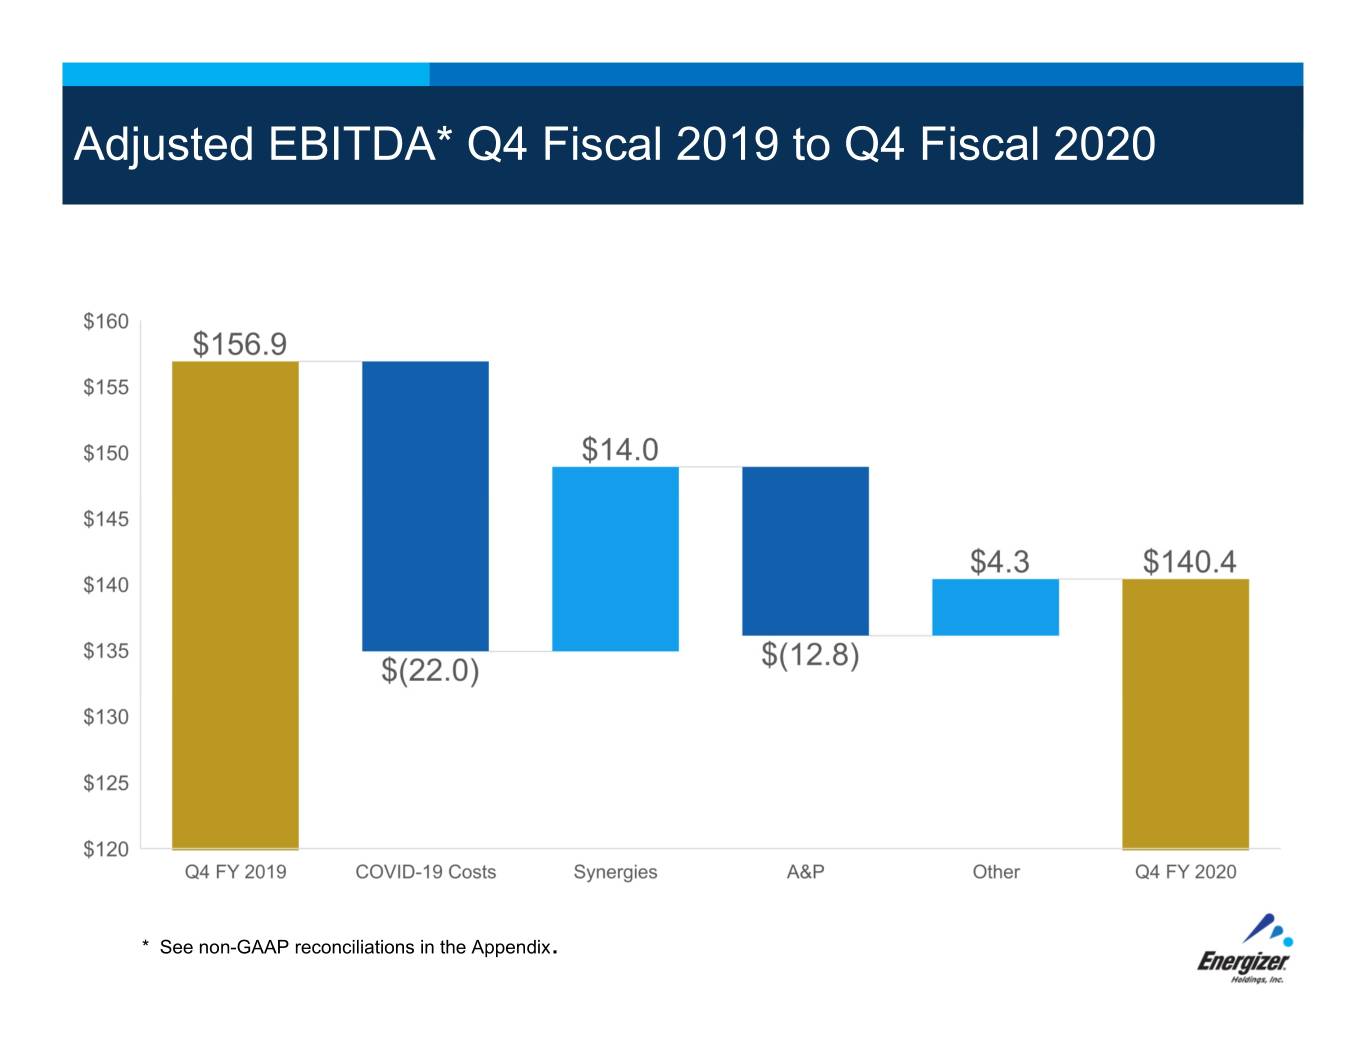
Adjusted EBITDA* Q4 Fiscal 2019 to Q4 Fiscal 2020 * See non-GAAP reconciliations in the Appendix.
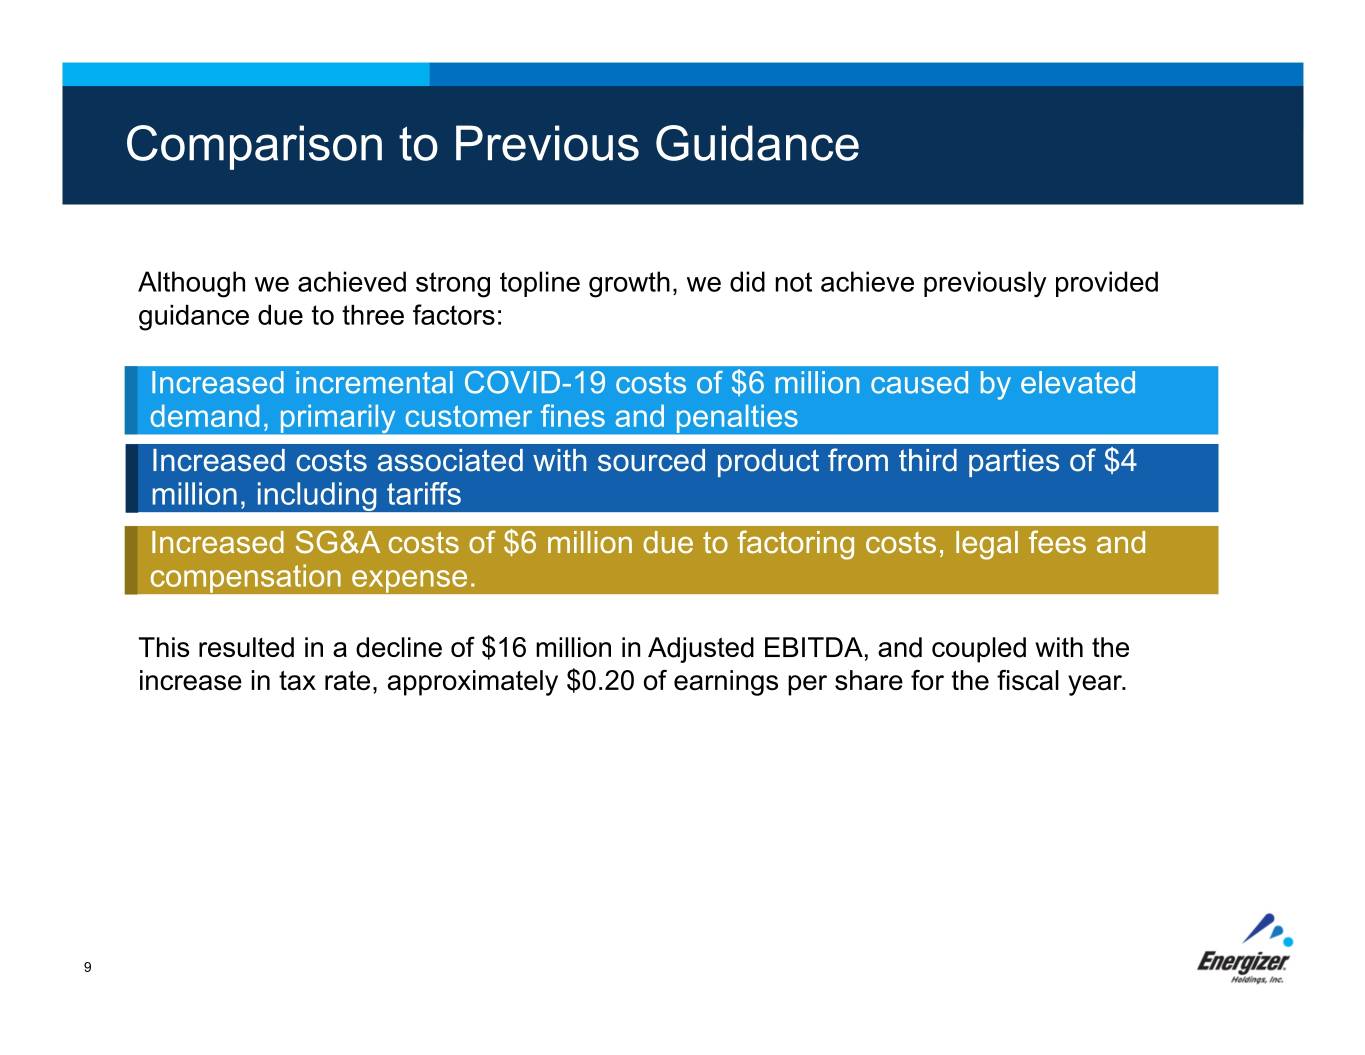
Comparison to Previous Guidance Although we achieved strong topline growth, we did not achieve previously provided guidance due to three factors: Increased incremental COVID-19 costs of $6 million caused by elevated demand, primarily customer fines and penalties Increased costs associated with sourced product from third parties of $4 million, including tariffs Increased SG&A costs of $6 million due to factoring costs, legal fees and compensation expense. This resulted in a decline of $16 million in Adjusted EBITDA, and coupled with the increase in tax rate, approximately $0.20 of earnings per share for the fiscal year. 9
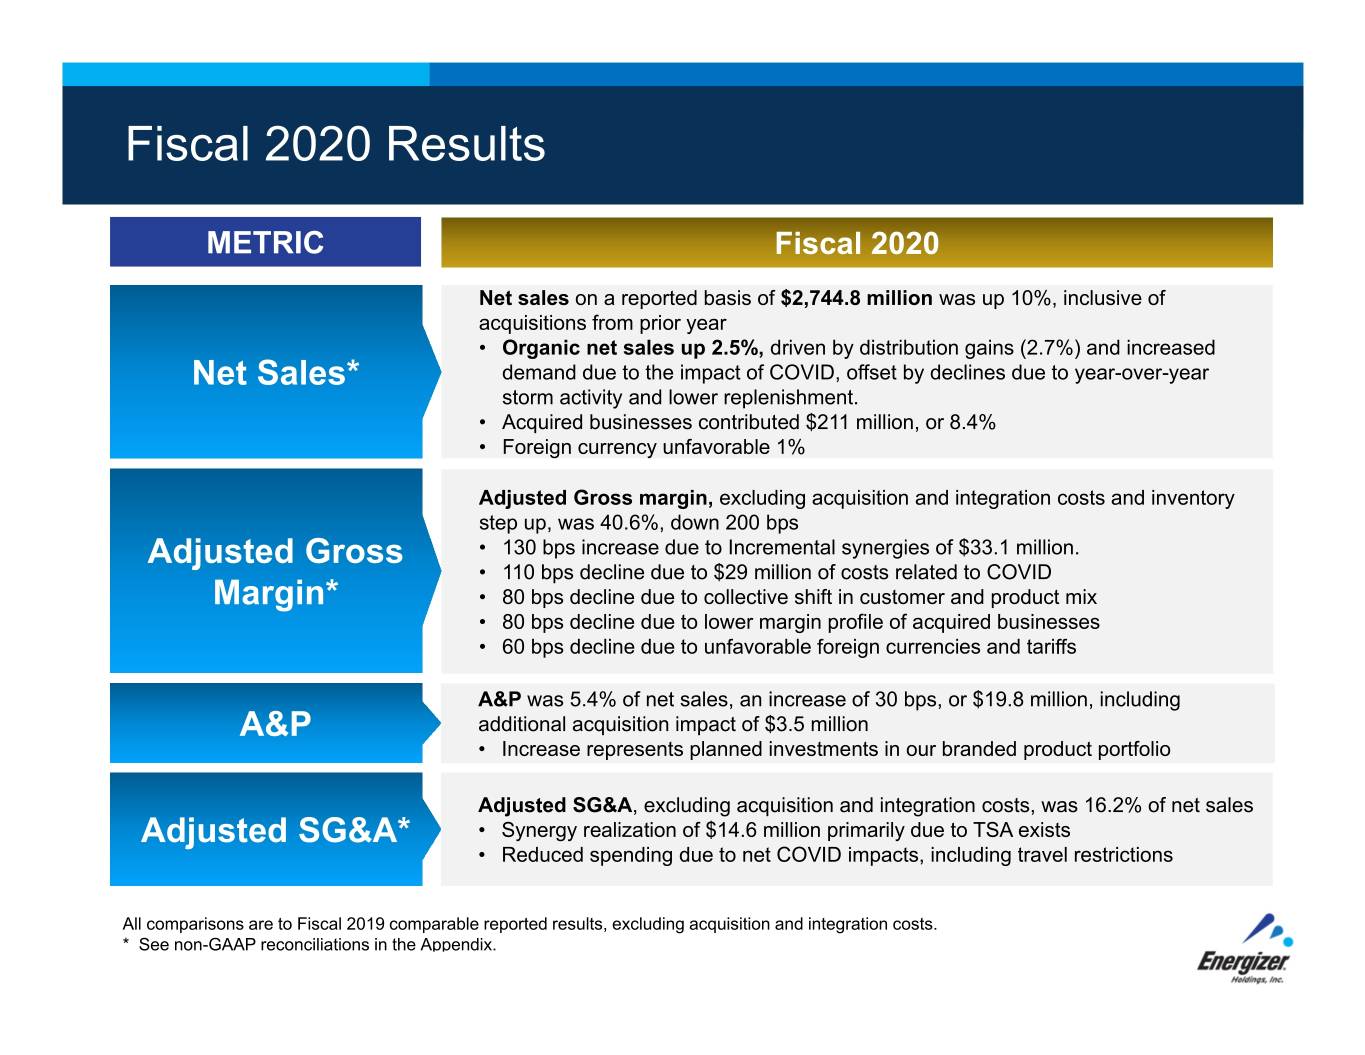
Fiscal 2020 Results METRIC Fiscal 2020 Net sales on a reported basis of $2,744.8 million was up 10%, inclusive of acquisitions from prior year • Organic net sales up 2.5%, driven by distribution gains (2.7%) and increased Net Sales* demand due to the impact of COVID, offset by declines due to year-over-year storm activity and lower replenishment. • Acquired businesses contributed $211 million, or 8.4% • Foreign currency unfavorable 1% Adjusted Gross margin, excluding acquisition and integration costs and inventory step up, was 40.6%, down 200 bps Adjusted Gross • 130 bps increase due to Incremental synergies of $33.1 million. • 110 bps decline due to $29 million of costs related to COVID Margin* • 80 bps decline due to collective shift in customer and product mix • 80 bps decline due to lower margin profile of acquired businesses • 60 bps decline due to unfavorable foreign currencies and tariffs A&P was 5.4% of net sales, an increase of 30 bps, or $19.8 million, including A&P additional acquisition impact of $3.5 million • Increase represents planned investments in our branded product portfolio Adjusted SG&A, excluding acquisition and integration costs, was 16.2% of net sales Adjusted SG&A* • Synergy realization of $14.6 million primarily due to TSA exists • Reduced spending due to net COVID impacts, including travel restrictions All comparisons are to Fiscal 2019 comparable reported results, excluding acquisition and integration costs. * See non-GAAP reconciliations in the Appendix.
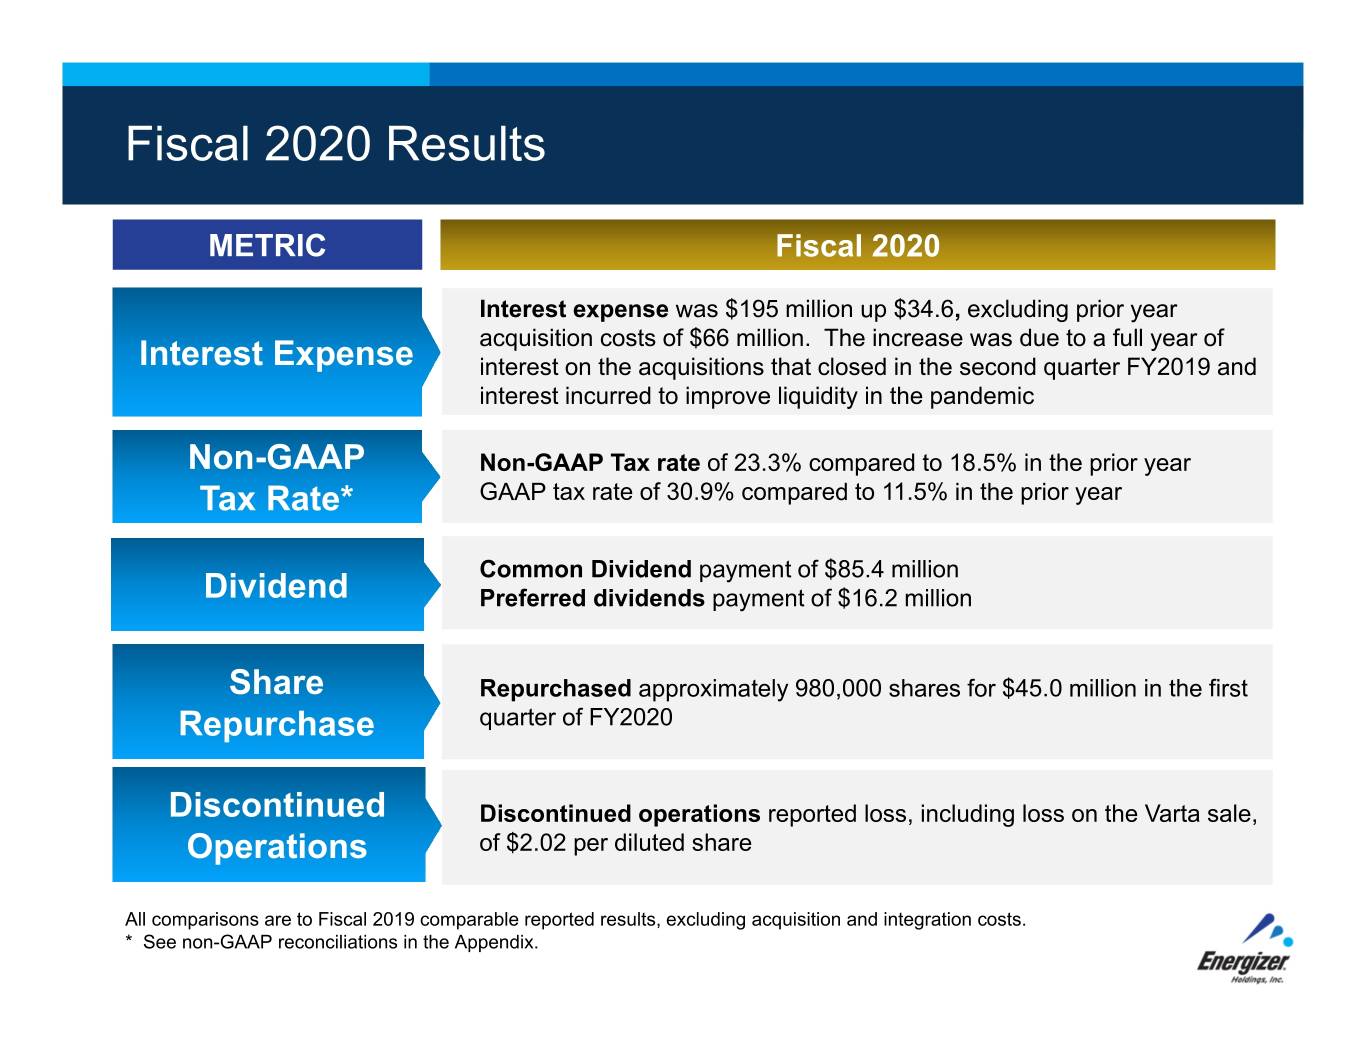
Fiscal 2020 Results METRIC Fiscal 2020 Interest expense was $195 million up $34.6, excluding prior year acquisition costs of $66 million. The increase was due to a full year of Interest Expense interest on the acquisitions that closed in the second quarter FY2019 and interest incurred to improve liquidity in the pandemic Non-GAAP Non-GAAP Tax rate of 23.3% compared to 18.5% in the prior year Tax Rate* GAAP tax rate of 30.9% compared to 11.5% in the prior year Common Dividend payment of $85.4 million Dividend Preferred dividends payment of $16.2 million Share Repurchased approximately 980,000 shares for $45.0 million in the first Repurchase quarter of FY2020 Discontinued Discontinued operations reported loss, including loss on the Varta sale, Operations of $2.02 per diluted share All comparisons are to Fiscal 2019 comparable reported results, excluding acquisition and integration costs. * See non-GAAP reconciliations in the Appendix.
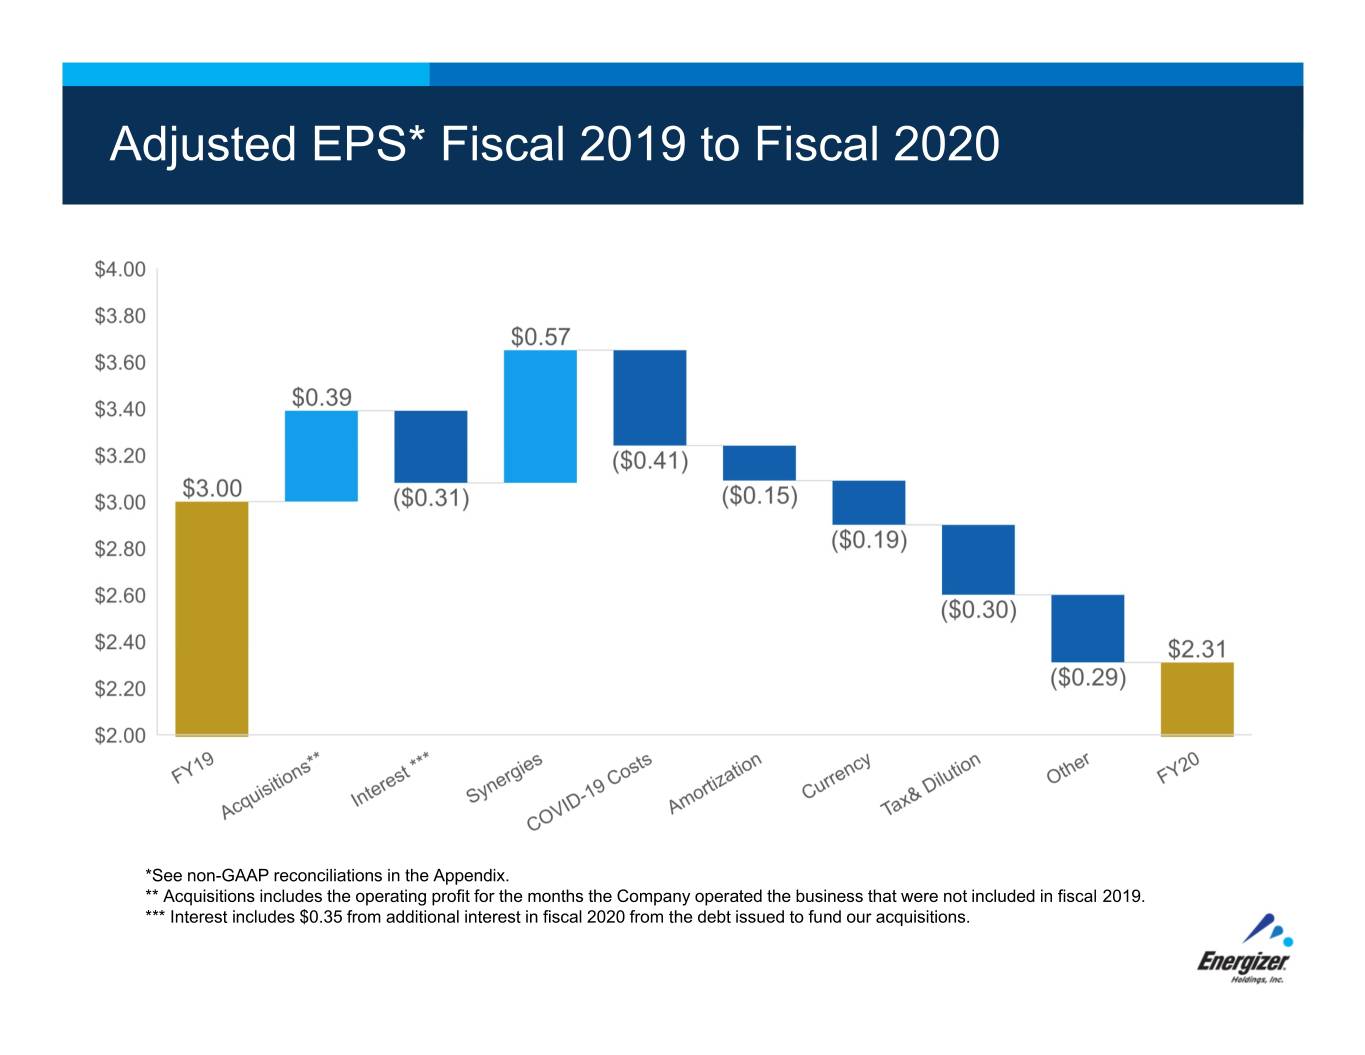
Adjusted EPS* Fiscal 2019 to Fiscal 2020 *See non-GAAP reconciliations in the Appendix. ** Acquisitions includes the operating profit for the months the Company operated the business that were not included in fiscal 2019. *** Interest includes $0.35 from additional interest in fiscal 2020 from the debt issued to fund our acquisitions.
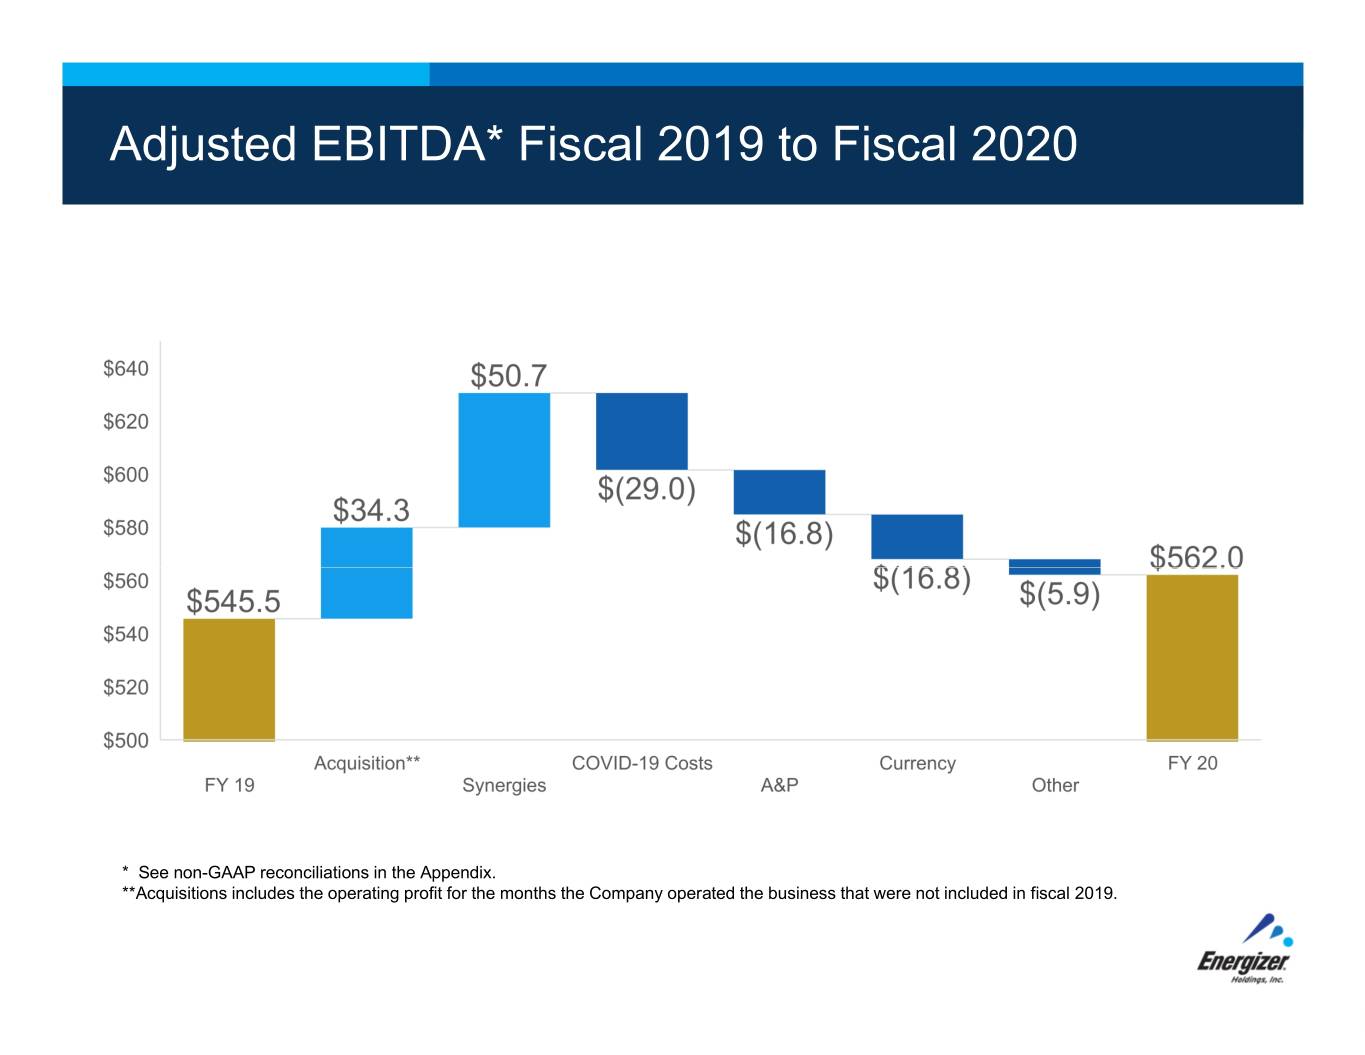
Adjusted EBITDA* Fiscal 2019 to Fiscal 2020 * See non-GAAP reconciliations in the Appendix. **Acquisitions includes the operating profit for the months the Company operated the business that were not included in fiscal 2019.

Outlook + Fiscal 2021
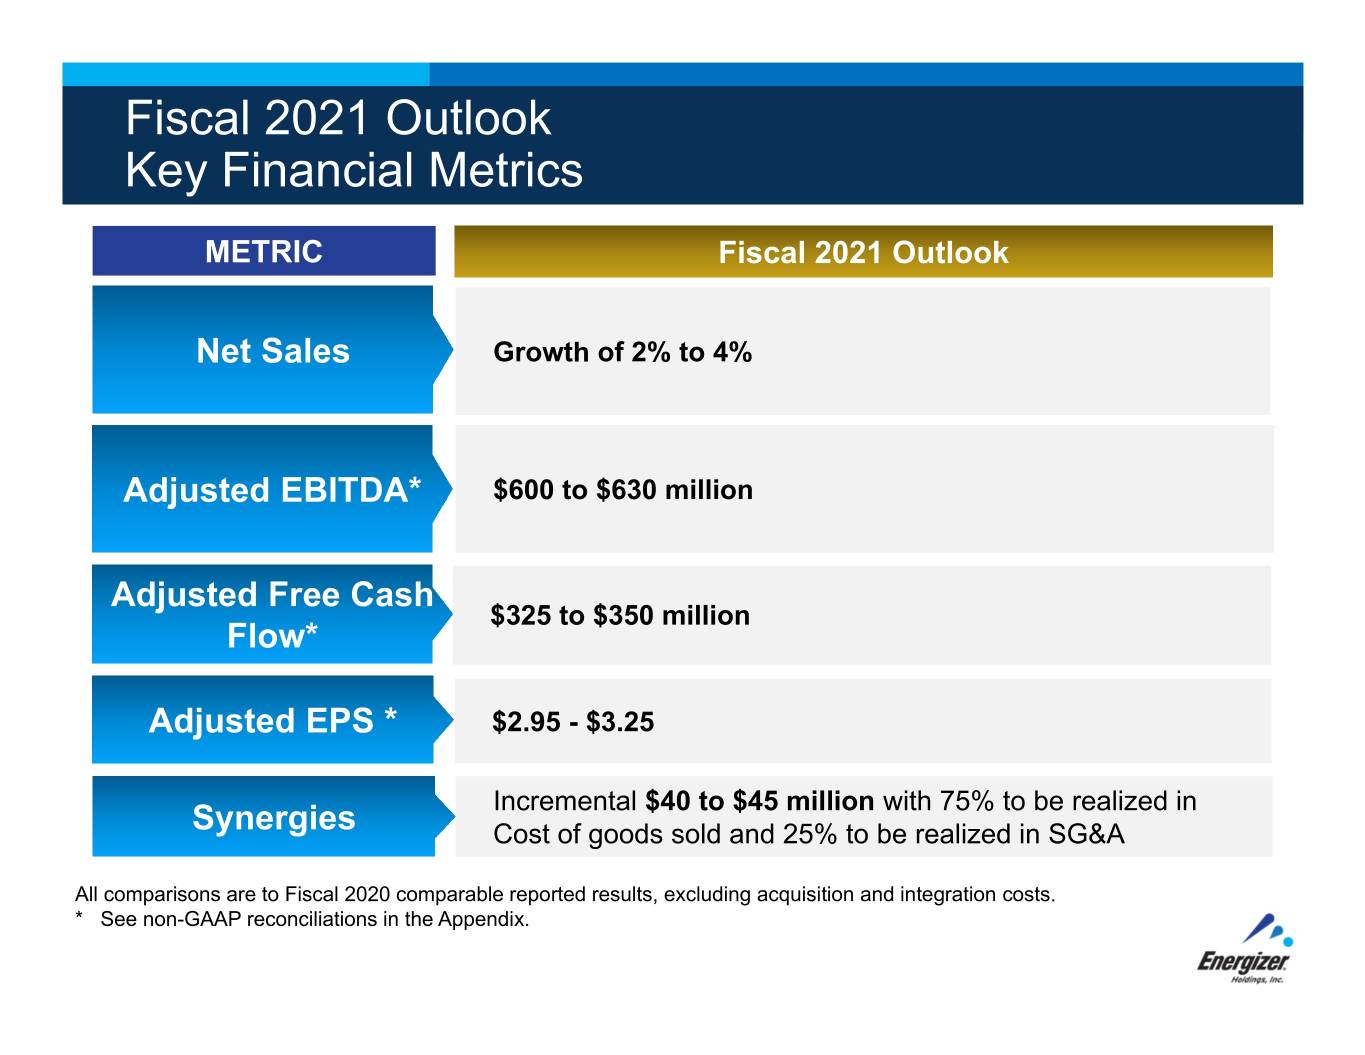
Fiscal 2021 Outlook Key Financial Metrics METRIC Fiscal 2021 Outlook Net Sales Growth of 2% to 4% Adjusted EBITDA* $600 to $630 million Adjusted Free Cash $325 to $350 million Flow* Adjusted EPS * $2.95 - $3.25 Incremental $40 to $45 million with 75% to be realized in Synergies Cost of goods sold and 25% to be realized in SG&A All comparisons are to Fiscal 2020 comparable reported results, excluding acquisition and integration costs. * See non-GAAP reconciliations in the Appendix.
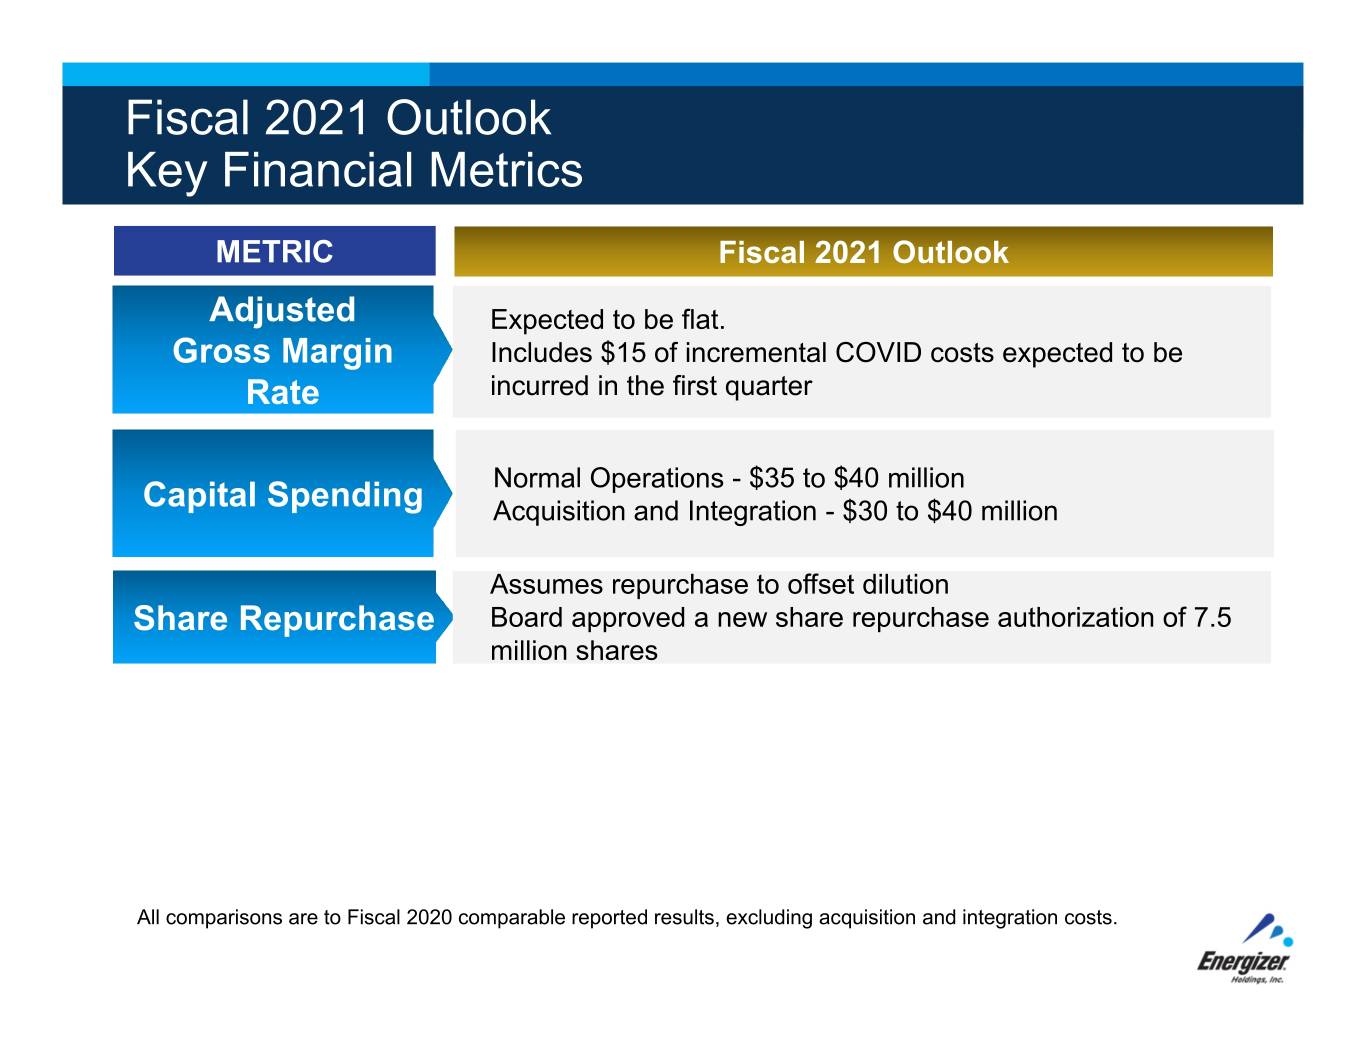
Fiscal 2021 Outlook Key Financial Metrics METRIC Fiscal 2021 Outlook Adjusted Expected to be flat. Gross Margin Includes $15 of incremental COVID costs expected to be Rate incurred in the first quarter Normal Operations - $35 to $40 million Capital Spending Acquisition and Integration - $30 to $40 million Assumes repurchase to offset dilution Share Repurchase Board approved a new share repurchase authorization of 7.5 million shares All comparisons are to Fiscal 2020 comparable reported results, excluding acquisition and integration costs.

Long-Term Financial Algorithm + Fiscal 2021
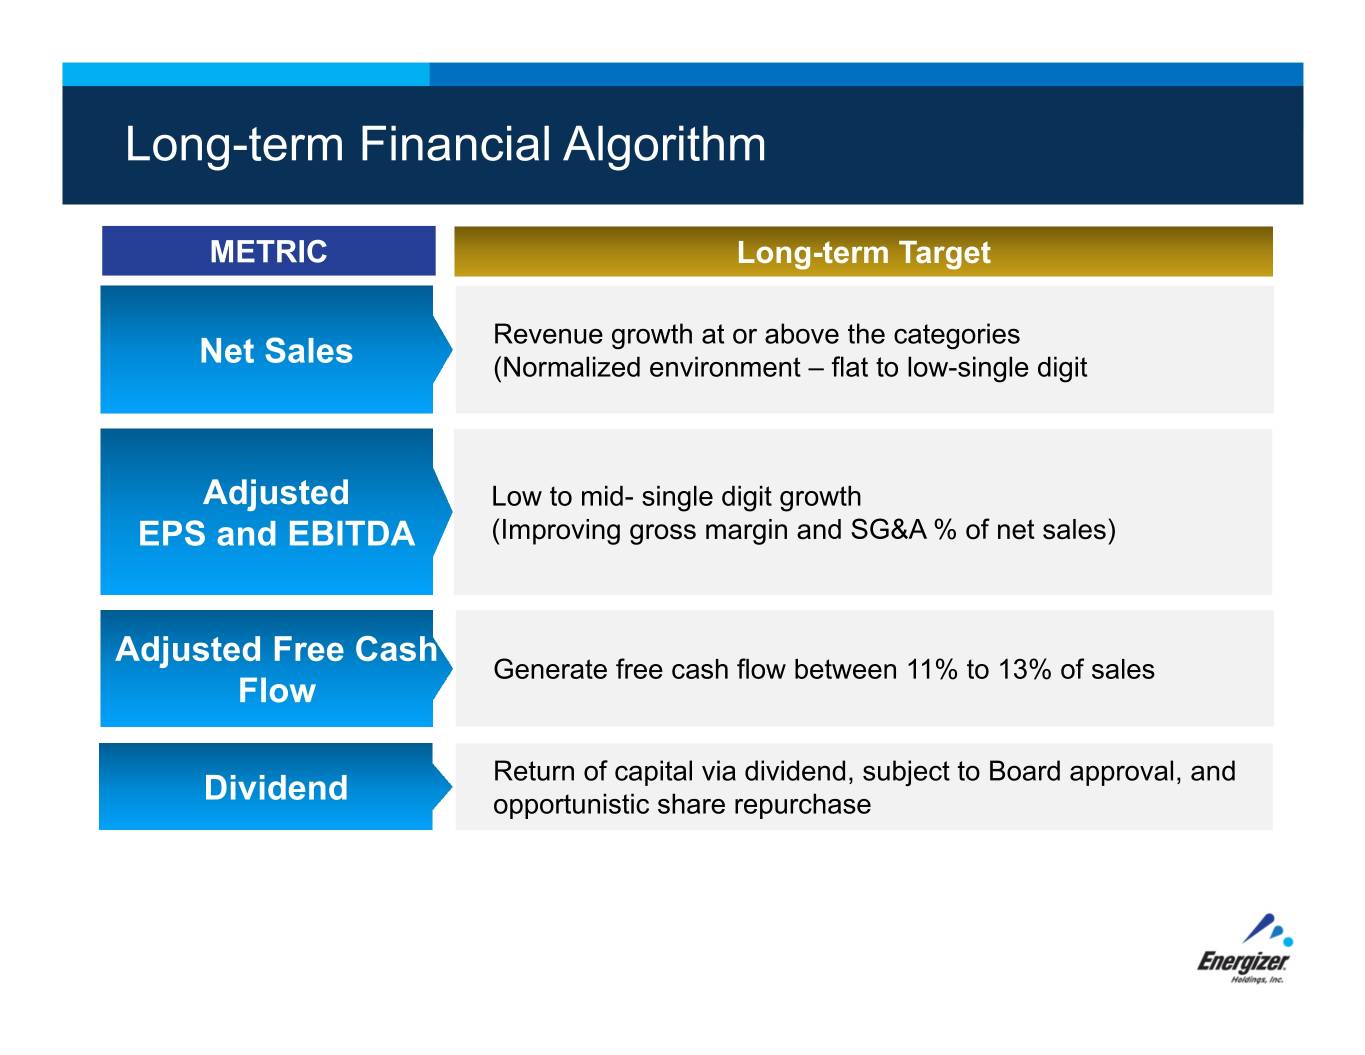
Long-term Financial Algorithm METRIC Long-term Target Revenue growth at or above the categories Net Sales (Normalized environment – flat to low-single digit Adjusted Low to mid- single digit growth EPS and EBITDA (Improving gross margin and SG&A % of net sales) Adjusted Free Cash Generate free cash flow between 11% to 13% of sales Flow Return of capital via dividend, subject to Board approval, and Dividend opportunistic share repurchase
Appendix Materials 19
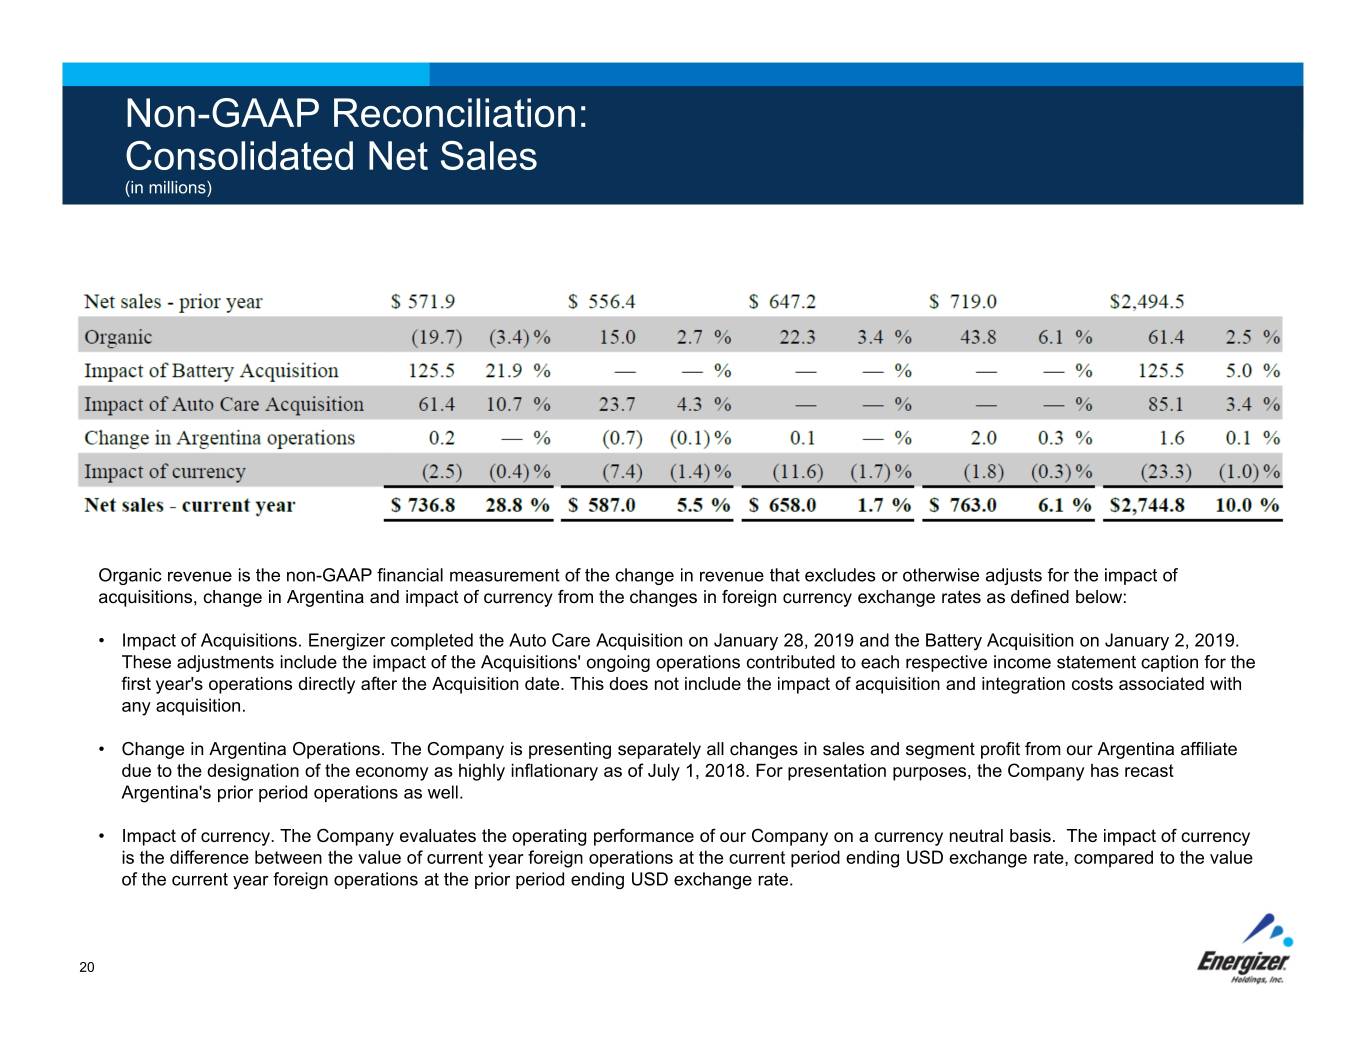
Non-GAAP Reconciliation: Consolidated Net Sales (in millions) Organic revenue is the non-GAAP financial measurement of the change in revenue that excludes or otherwise adjusts for the impactof acquisitions, change in Argentina and impact of currency from the changes in foreign currency exchange rates as defined below: • Impact of Acquisitions. Energizer completed the Auto Care Acquisition on January 28, 2019 and the Battery Acquisition on January 2, 2019. These adjustments include the impact of the Acquisitions' ongoing operations contributed to each respective income statement caption for the first year's operations directly after the Acquisition date. This does not include the impact of acquisition and integration costs associated with any acquisition. • Change in Argentina Operations. The Company is presenting separately all changes in sales and segment profit from our Argentina affiliate due to the designation of the economy as highly inflationary as of July 1, 2018. For presentation purposes, the Company has recast Argentina's prior period operations as well. • Impact of currency. The Company evaluates the operating performance of our Company on a currency neutral basis. The impact of currency is the difference between the value of current year foreign operations at the current period ending USD exchange rate, compared to the value of the current year foreign operations at the prior period ending USD exchange rate. 20
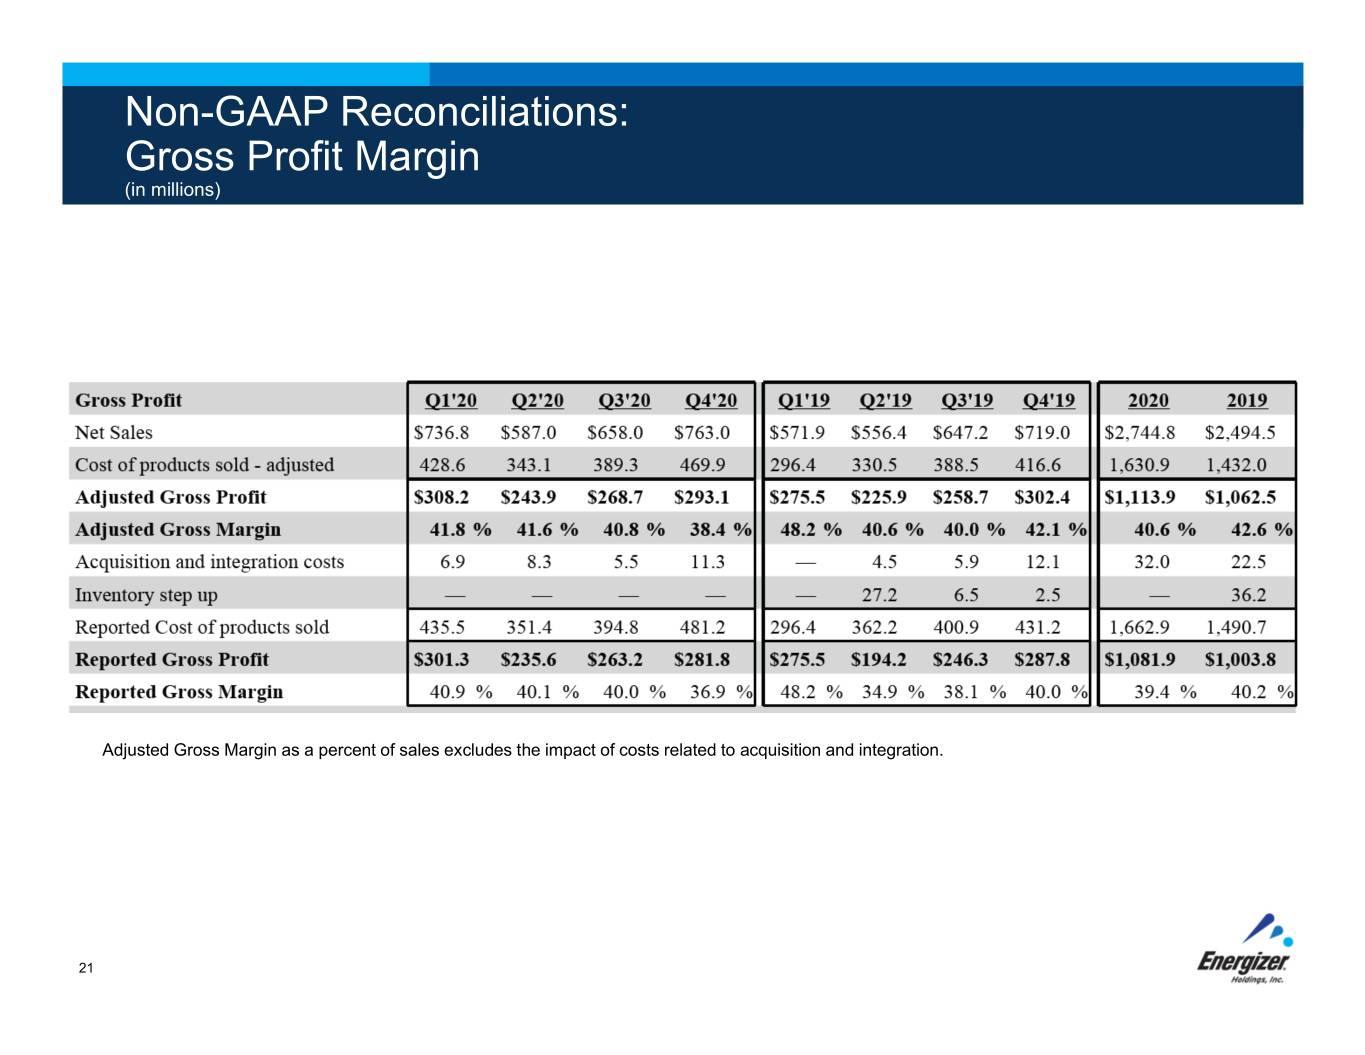
Non-GAAP Reconciliations: Gross Profit Margin (in millions) Adjusted Gross Margin as a percent of sales excludes the impact of costs related to acquisition and integration. 21
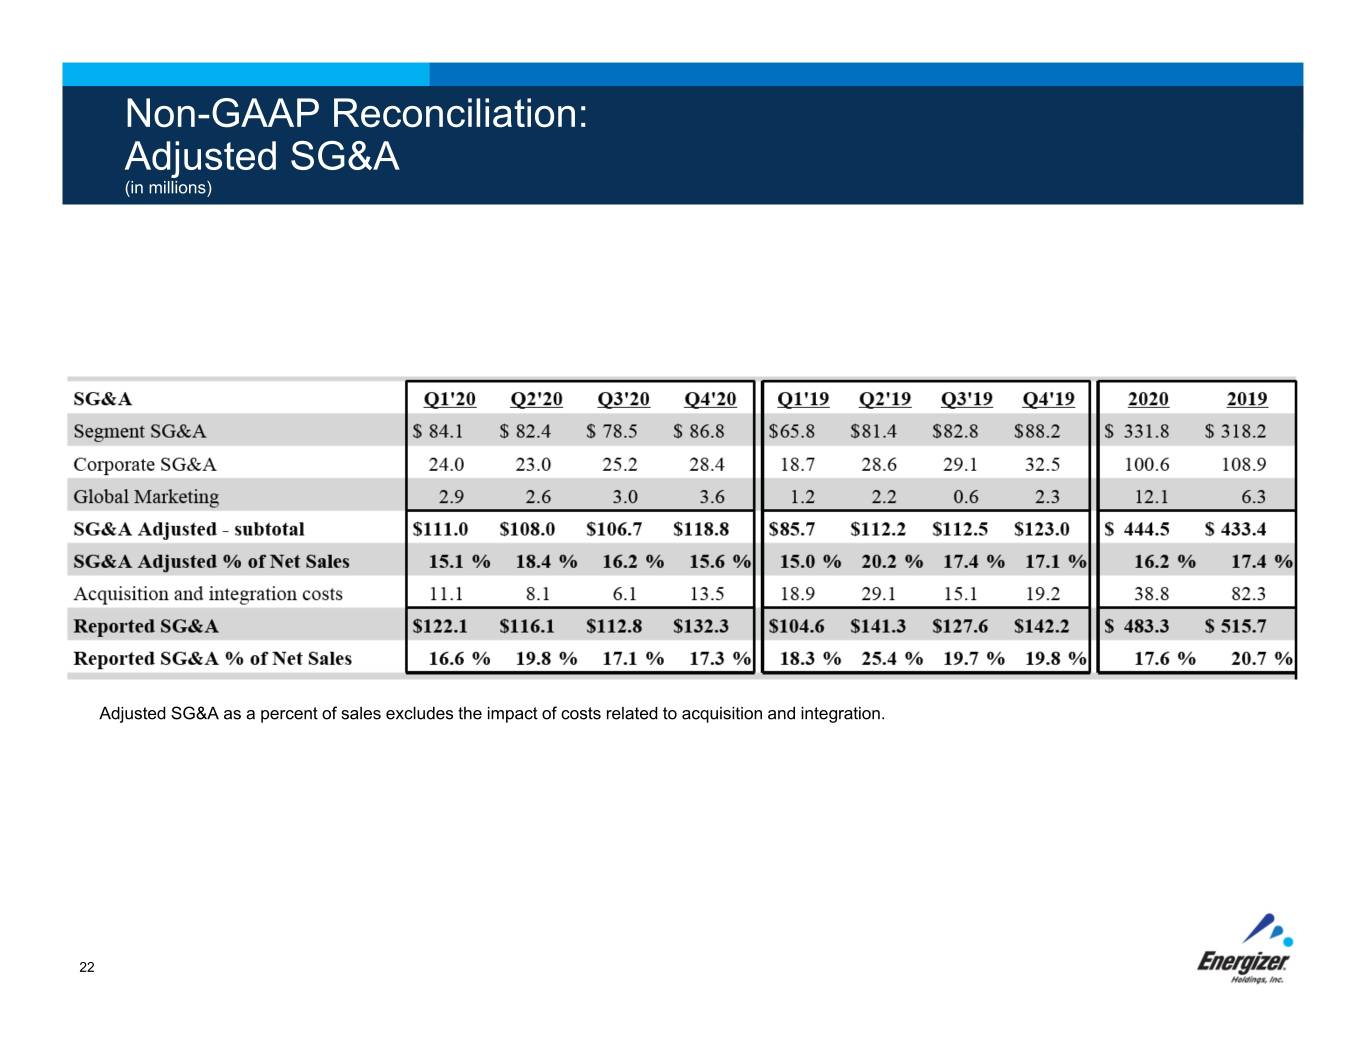
Non-GAAP Reconciliation: Adjusted SG&A (in millions) Adjusted SG&A as a percent of sales excludes the impact of costs related to acquisition and integration. 22
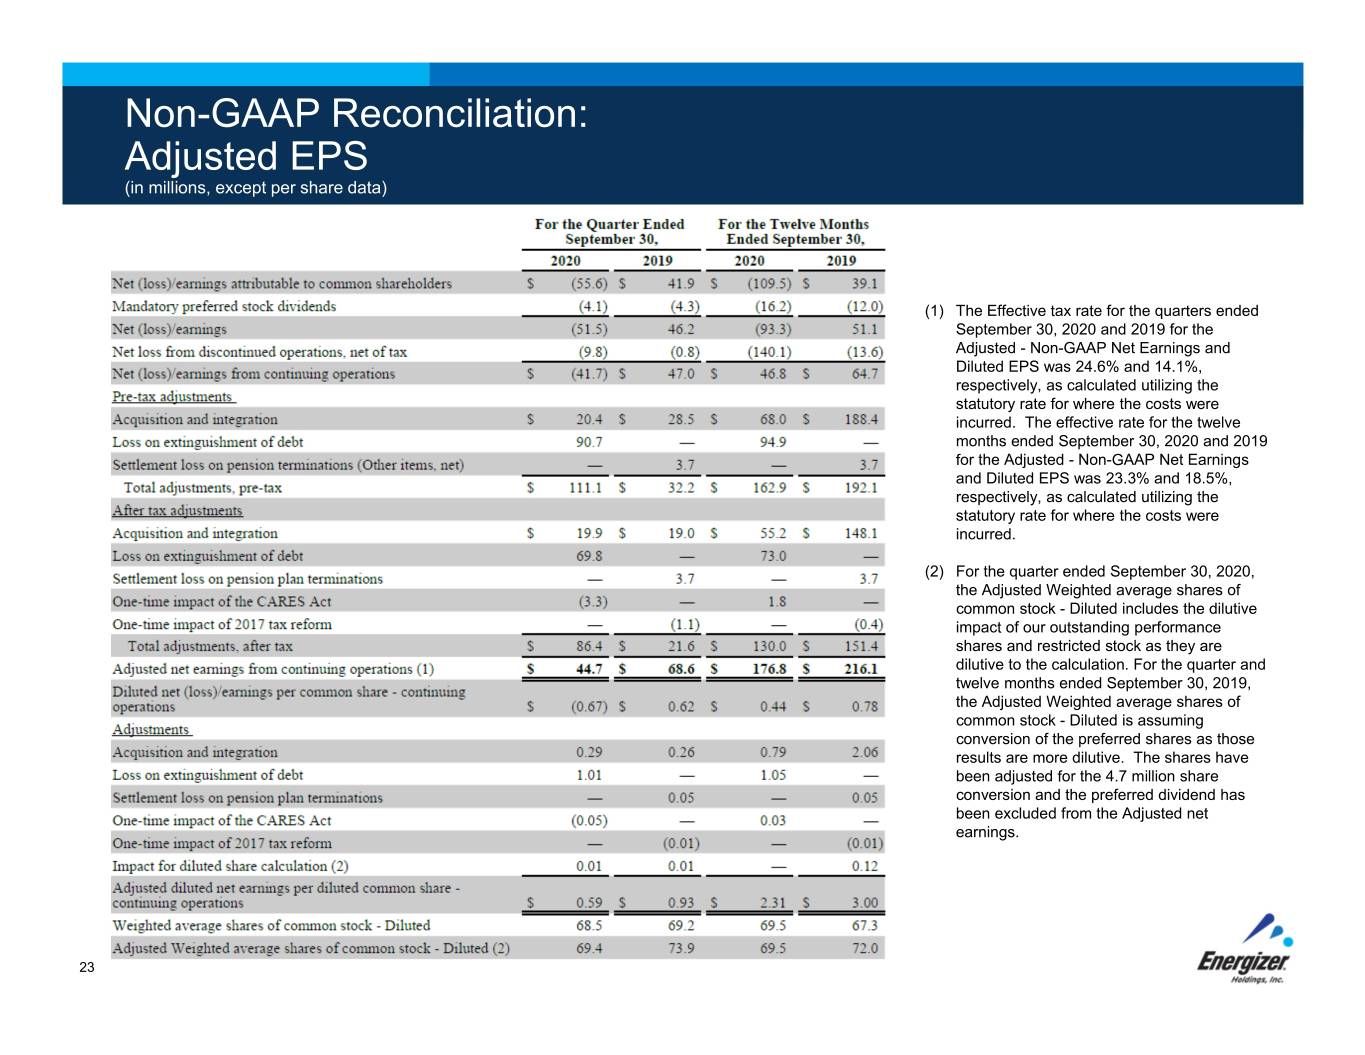
Non-GAAP Reconciliation: Adjusted EPS (in millions, except per share data) (1) The Effective tax rate for the quarters ended September 30, 2020 and 2019 for the Adjusted - Non-GAAP Net Earnings and Diluted EPS was 24.6% and 14.1%, respectively, as calculated utilizing the statutory rate for where the costs were incurred. The effective rate for the twelve months ended September 30, 2020 and 2019 for the Adjusted - Non-GAAP Net Earnings and Diluted EPS was 23.3% and 18.5%, respectively, as calculated utilizing the statutory rate for where the costs were incurred. (2) For the quarter ended September 30, 2020, the Adjusted Weighted average shares of common stock - Diluted includes the dilutive impact of our outstanding performance shares and restricted stock as they are dilutive to the calculation. For the quarter and twelve months ended September 30, 2019, the Adjusted Weighted average shares of common stock - Diluted is assuming conversion of the preferred shares as those results are more dilutive. The shares have been adjusted for the 4.7 million share conversion and the preferred dividend has been excluded from the Adjusted net earnings. 23
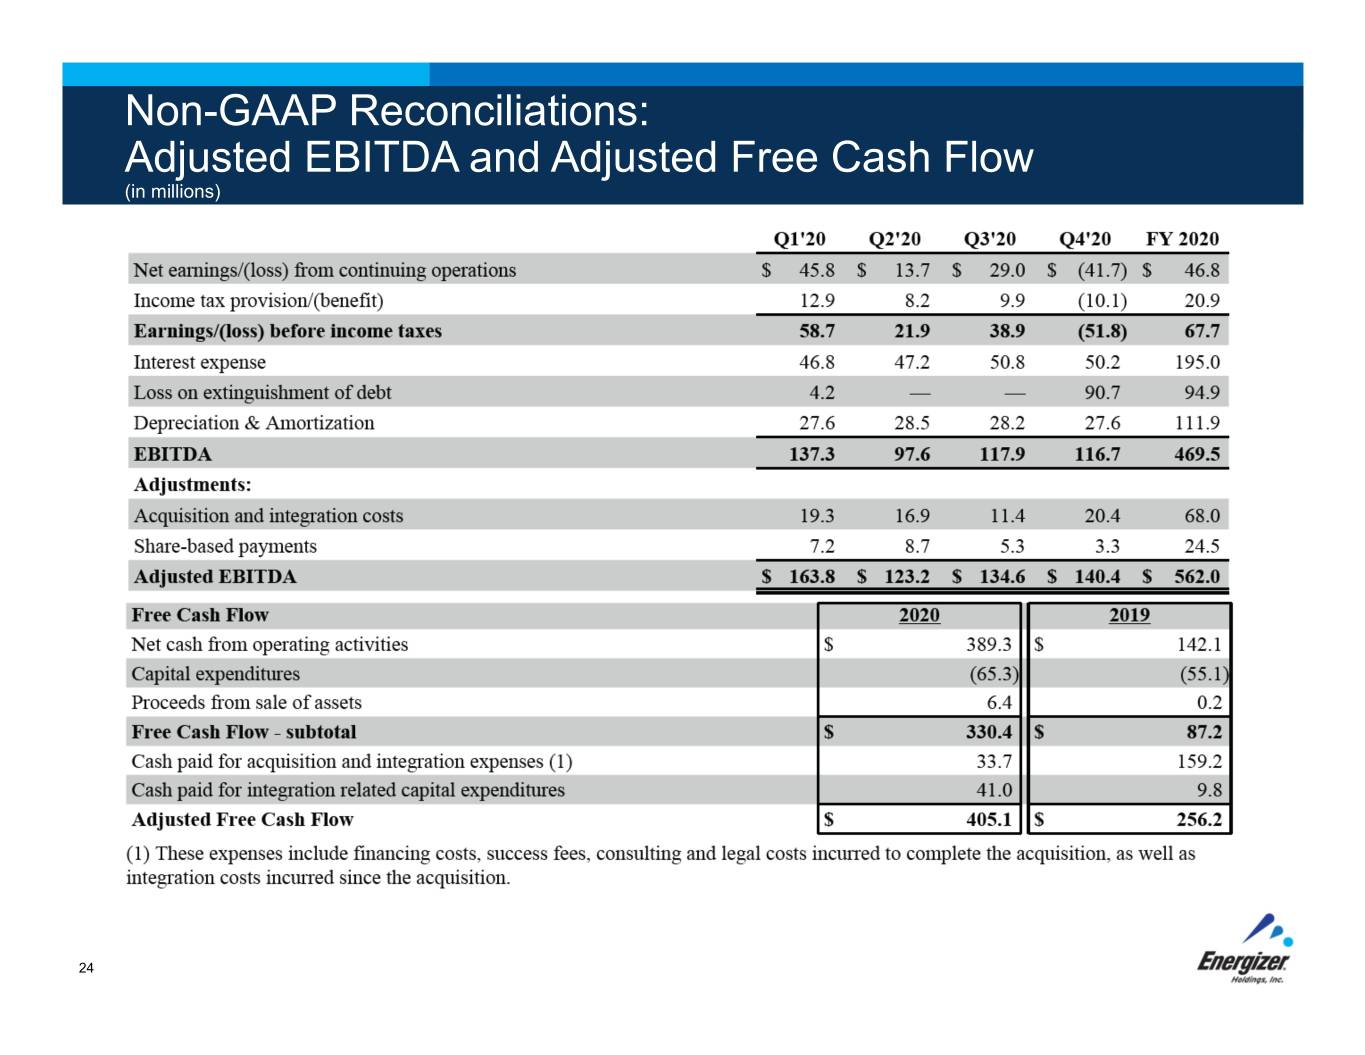
Non-GAAP Reconciliations: Adjusted EBITDA and Adjusted Free Cash Flow (in millions) 24
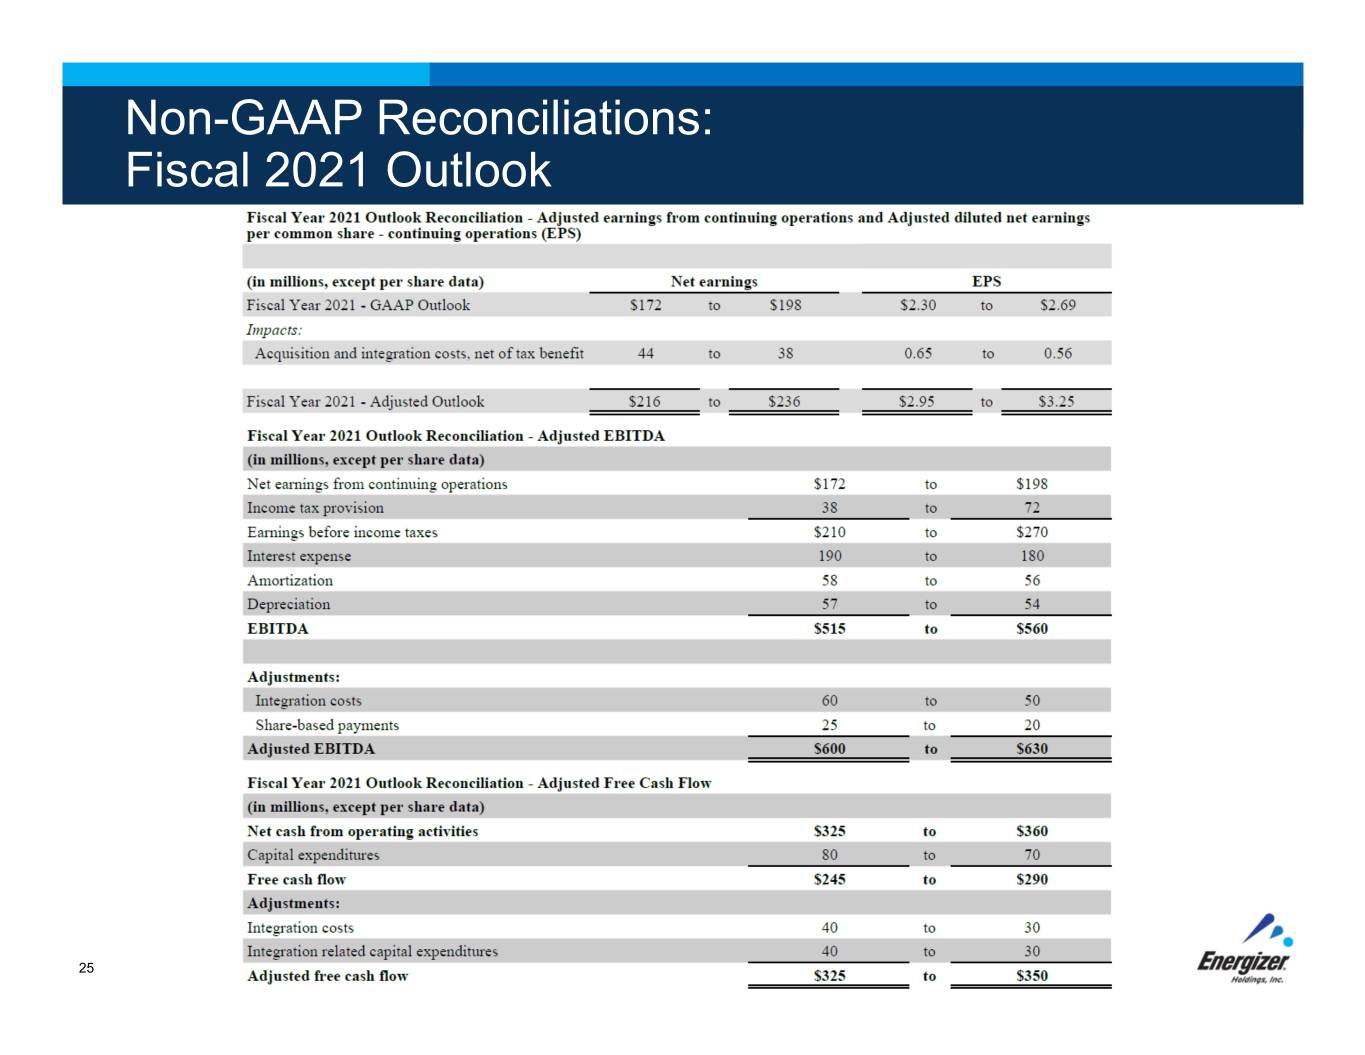
Non-GAAP Reconciliations: Fiscal 2021 Outlook 25
 | Exhibit 99.3 Energizer Holdings, Inc. 533 Maryville University Dr. St. Louis, MO 63141 | ||||
| FOR IMMEDIATE RELEASE | Company Contact | ||||
| November 12, 2020 | Jacqueline Burwitz Investor Relations 314-985-2169 [email protected] | ||||
Energizer Holdings, Inc. Announces CEO Succession
–Alan R. Hoskins to Retire as CEO in January 2021
–Board Elects Mark S. LaVigne as Successor
ST. LOUIS, November 12, 2020 — Energizer Holdings, Inc. (NYSE: ENR) (the “company”) today announced that Alan R. Hoskins has informed the company’s Board of Directors of his decision to retire as Chief Executive Officer, effective January 1, 2021. The Board has elected Mark S. LaVigne, President and Chief Operating Officer of Energizer, to succeed Mr. Hoskins as the company’s next CEO. Mr. Hoskins will continue to serve as a Director, upon election at the 2021 Annual Shareholders’ Meeting, and as an advisor to the company until September 30, 2021. The Board intends to nominate Mr. LaVigne to stand for election as a Director at the 2021 Annual Shareholders’ Meeting.
“Alan is an exceptional leader who has guided Energizer through an extraordinary transformation into a stand-alone public company and a global consumer products leader with a strong foundation for long-term success,” said Pat Moore, independent Chairman of the Board. “He has had a notable nearly four-decade-long career at our company, and during his time as CEO, has led the Energizer team through two strategic acquisitions and in building enduring brands, a global infrastructure and strong supplier and customer relationships. With his relentless focus on innovation, operations and people, Alan has helped develop a talented leadership team that is focused on delivering on Energizer’s strategic priorities. I’m pleased that he will remain as a Director and an advisor to the company through September to help ensure a smooth transition while he turns towards his personal philanthropic activities.”
Mr. Hoskins commented, “Like many people, over the past several months, I have had the opportunity to reflect on my life, my future and what is most important to me. After a fulfilling career at Energizer spanning nearly 40 years, including the last five as CEO, I determined in conjunction with the Board that now is the right time for Energizer to transition to new leadership. Mark’s capabilities and deep understanding of Energizer’s diverse markets, operations and colleagues make him uniquely qualified to lead Energizer into its next phase of growth. As I enter my next chapter, I look forward to spending more time with my family and pursuing philanthropic opportunities. I would like to thank all of our colleagues for their dedication and efforts in positioning Energizer as the leader in consumer products that it is today, especially through the recent challenges of the pandemic, and I am certain that Mark and the rest of the executive team will continue the company’s momentum for many years to come.”
Mr. Moore continued, “Mark’s appointment is the culmination of rigorous succession planning by the Board and we have great confidence that he will be an excellent CEO for Energizer. Mark is an outstanding executive who has helped define and execute Energizer’s strategic initiatives and has overseen the company’s integrated operating model with a focus on growing its platform and market positions in the Batteries, Lights and Auto Care categories. Through his time this past year serving as President and COO, along with his previous roles at Energizer and outside our organization, Mark brings strong leadership skills and expertise that will serve the company well into the future.”
“I am honored to take on the role of CEO and lead Energizer and its dedicated colleagues around the world,” said Mr. LaVigne. “Despite the unprecedented challenges of this year, our long-term strategies remain intact, and we are well-positioned to strengthen our leadership across categories and generate sustainable growth. We recognize we have hurdles to overcome, but I have complete confidence in our organization and am tremendously excited about Energizer’s future prospects. I thank Alan for his leadership and collaboration and look forward to working with him to ensure a seamless transition.”
Mr. Hoskins’ retirement concludes a remarkable, nearly four-decade-long career with Energizer, including serving as CEO since 2015. He has played a key role in the company’s growth and transformation, establishing Energizer as a standalone public company and defining its strategic priorities – leading with innovation, operating with excellence and driving productivity – as well as overseeing the company’s two transformational acquisitions of Spectrum Brands’ battery and portable lighting and global auto care businesses. Over the course of Mr. Hoskins’ tenure, Energizer has transformed into a leading global consumer products company and is now the global value share leader in the battery and auto care categories and the branded share leader in the portable lighting category. Mr. Hoskins’ focus on talent and culture as the key drivers of the company’s success has empowered colleagues to take control, drive significant change and deliver on commitments, as well as instilled diversity as a key value across the organization, with almost half of the Company’s critical roles now held by women and people of color. As a result of these efforts, Energizer has delivered strong financial results under Mr. Hoskins’ leadership, including five consecutive years of organic sales growth and significant Net Sales, Adjusted EBITDA and Adjusted Free Cash flow growth over the same timeframe, and is well positioned to generate long-term shareholder value for years to come.
Fourth Quarter and Fiscal Year 2020 Results
The company also announced today in a separate press release its fourth quarter and fiscal year 2020 results. The webcast is scheduled to begin at 10:00 a.m. ET and can be accessed at www.energizerholdings.com, under the “Investors” and “Events and Presentations” tabs. A replay of the webcast will be available on the company’s website.
About Energizer Holdings, Inc.
Energizer Holdings, Inc. (NYSE: ENR), headquartered in St. Louis, Missouri, is one of the world’s largest manufacturers and distributors of primary batteries, portable lights, and auto care appearance, performance, refrigerant, and fragrance products. Our portfolio of globally recognized brands include Energizer®, Armor All®, Eveready®, Rayovac®, STP®, Varta®, A/C Pro®, Refresh Your Car! ®, California Scents®, Driven®, Bahama & Co. ®, LEXOL®, Eagle One®, Nu Finish®, Scratch Doctor®, and Tuff Stuff®. As a global branded consumer products company, Energizer’s mission is to lead the charge to deliver value to our customers and consumers better than anyone else.
Forward-Looking Statements
Certain information contained in this news release may constitute “forward-looking statements” within the meaning of the Private Securities Litigation Reform Act of 1995. These statements are not guarantees of future results or performance and involve certain risks, uncertainties and assumptions difficult to predict or beyond our control. You should not place undue reliance on any forward-looking statement and should consider the uncertainties and risks discussed in our Annual Report on Form 10-K filed with the Securities and Exchange Commission (the “Commission”) on November 19, 2019 and subsequent Commission filings. Forward-looking statements speak only as of the date they are made, and we undertake no obligation to update any forward-looking statement to reflect the impact of circumstances or events that arise after the date the forward-looking statement was made.