EVGO 8-K
EVgo Inc. (EVGO)
UNITED STATES
SECURITIES AND EXCHANGE COMMISSION
Washington, D.C. 20549
CURRENT REPORT
Pursuant to Section 13 or 15(d) of
the Securities Exchange Act of 1934
Date of Report (Date of earliest event reported): August 11, 2021
EVgo Inc. | |||
(Exact name of registrant as specified in its charter) | |||
| |||
Delaware | 001-39572 | 85-2326098 | |
(State or other jurisdiction of | (Commission File Number) | (I.R.S. Employer | |
| | | |
11835 West Olympic Boulevard, Suite 900E | 90064 | ||
(Address of principal executive offices) | (Zip Code) | ||
| | | |
Registrant’s telephone number, including area code: (877) 494-3833 | |||
| | | |
Check the appropriate box below if the Form 8-K filing is intended to simultaneously satisfy the filing obligation to the registrant under any of the following provisions:
◻ | Written communications pursuant to Rule 425 under the Securities Act (17 CFR 230.425) |
◻ | Soliciting material pursuant to Rule 14a-12 under the Exchange Act (17 CFR 240.14a-12) |
◻ | Pre-commencement communications pursuant to Rule 14d-2(b) under the Exchange Act (17 CFR 240.14d-2(b)) |
◻ | Pre-commencement communications pursuant to Rule 13e-4(c) under the Exchange Act (17 CFR 240.13e-4(c)) |
Securities registered pursuant to Section 12(b) of the Act:
Title of each class | Trading | Name of each exchange |
EVGO | Nasdaq Global Select Market | |
EVGOW | Nasdaq Global Select Market |
Indicate by check mark whether the registrant is an emerging growth company as defined in Rule 405 of the Securities Act of 1933 or Rule 12b-2 of the Securities Exchange Act of 1934.
Emerging growth company ⌧
If an emerging growth company, indicate by check mark if the registrant has elected not to use the extended transition period for complying with any new or revised financial accounting standards provided pursuant to Section 13(a) of the Exchange Act. ◻
Item 2.02. Results of Operations and Financial Condition.
EVgo Inc. (the “Company”) issued a press release on August 11, 2021 announcing its financial results for EVgo HoldCo, LLC for the quarter ended June 30, 2021. A copy of the press release is furnished as Exhibit 99.1 to this Current Report on Form 8-K.
Item 7.01. Regulation FD Disclosure
On August 11, 2021, at 11:00 a.m. Eastern Time, the Company will host its second quarter 2021 earnings conference call and webcast. Via webcast, the Company will present portions of its Q2 Earnings Call presentation (the “Earnings Call Presentation”), which contains a summary of the Company’s financial results for the fiscal quarter ended June 30, 2021, financial estimates, and certain other financial and operating information regarding the Company. A copy of the Earnings Call Presentation is furnished as Exhibit 99.2 to this Current Report on Form 8-K.
The information furnished in this Current Report on Form 8-K (including exhibits 99.1 and 99.2) shall not be deemed “filed” for purposes of Section 18 of the Securities Exchange Act of 1934, as amended (the “Exchange Act”), or otherwise subject to the liabilities of such section, nor shall such information be deemed incorporated by reference in any filing under the Exchange Act or the Securities Act of 1933, as amended, except as shall be expressly set forth by specific reference in such a filing.
Item 9.01. Financial Statements and Exhibits.
(d) Exhibits.
Exhibit | Description |
SIGNATURES
Pursuant to the requirements of the Securities Exchange Act of 1934, the registrant has duly caused this report to be signed on its behalf by the undersigned hereunto duly authorized.
| EVgo Inc. | |
|
|
|
Date: August 11, 2021 | By: | /s/ Olga Shevorenkova |
| Name: | Olga Shevorenkova |
| Title: | Chief Financial Officer |
|
| (Principal Financial Officer) |
2
Exhibit 99.1
EVGO INC. REPORTS 2021 SECOND QUARTER RESULTS
| ● | On July 1, 2021, EVgo completed its business combination with Climate Change Crisis Real Impact I Acquisition Corporation (“CRIS”), resulting in net cash of $573 million to fund its strategic plan |
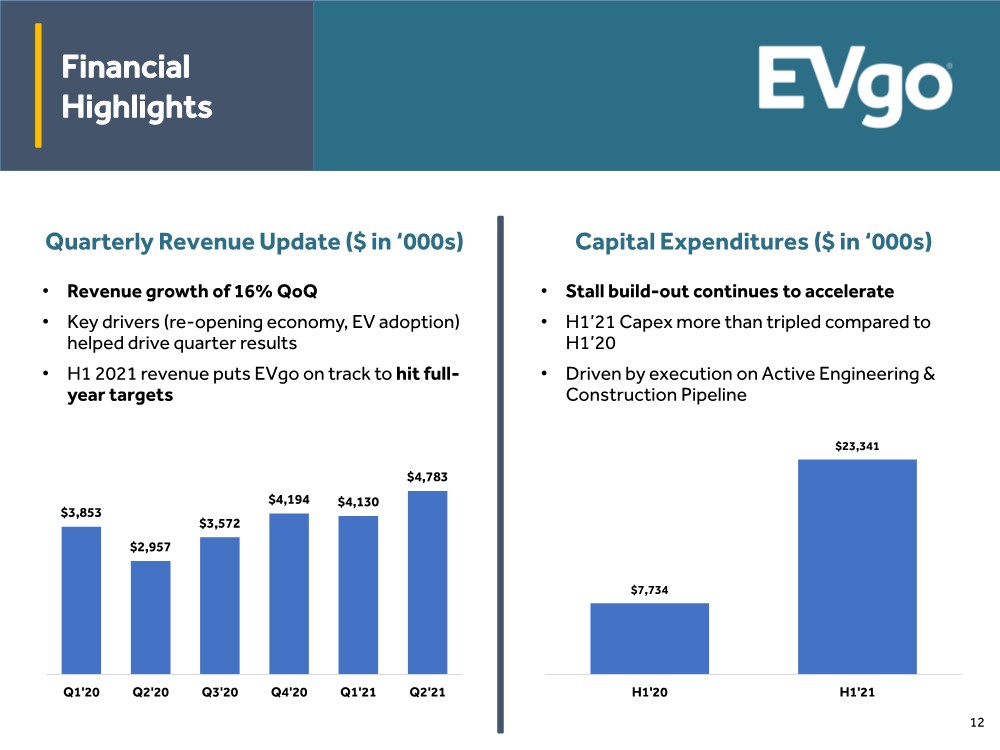
| ● | Strong revenue quarter, with a 16% increase quarter-over-quarter |
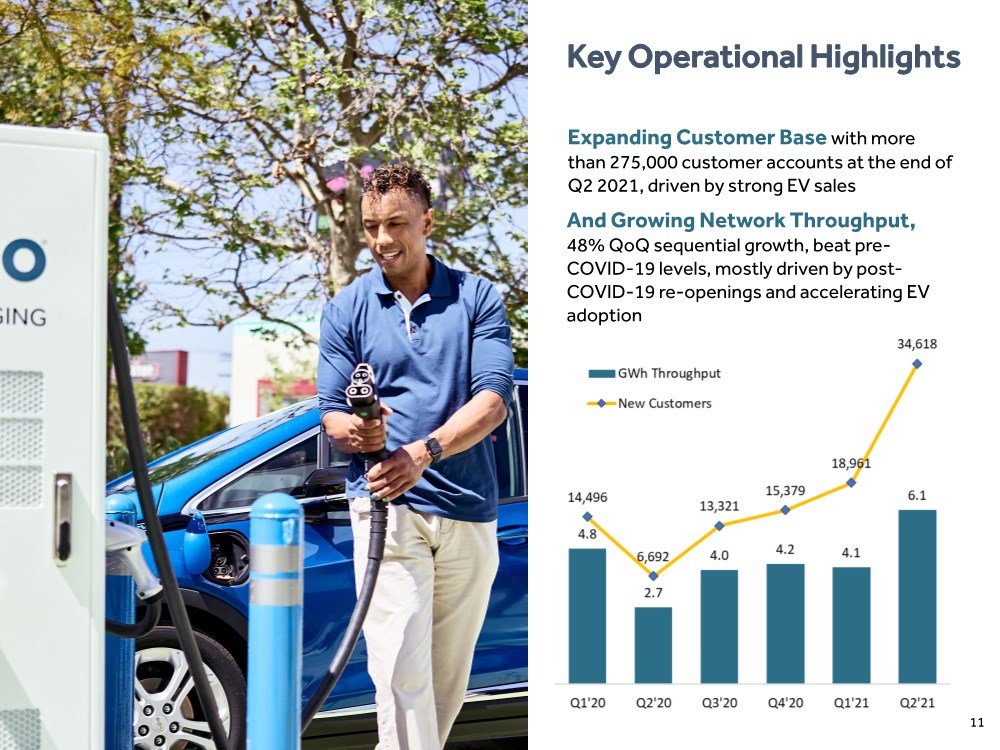
| ● | Customers topped 275,000 as electric vehicle (“EV”) adoption pace accelerates |
| ● | Charger stall count through June 30, 2021 totals 1,548, as EVgo added 104 new operational stalls in the second quarter of 2021 while continuing to execute on its active engineering and construction pipeline (the “Active E&C Pipeline”) of more than 2,000 charger stalls |
| ● | Other recent highlights include the expansion of EVgo’s commercial relationship with General Motors (NYSE: GM) (“GM”), continued kilowatt-hour (kWh) throughput growth from partnerships with autonomous vehicle (“AV”) companies, the acquisition of Recargo, Inc. (“Recargo”), and sustained focus on technological leadership, underscored by the work at the EVgo Innovation Lab |
Los Angeles, CA, August 11, 2021 – EVgo Inc. (Nasdaq: EVGO) (“EVgo” or the “Company”) today announced results for the second quarter ended June 30, 2021. Revenue increased to $4.8 million for the second quarter of 2021, compared to $4.1 million for the first quarter of 2021. The Company is seeing increased revenue due to overall increases in EV adoption, uptake of EVgo’s products and offerings, and a customer count now exceeding 275,000, all resulting in a significant growth in network throughput.
“The second quarter of 2021 witnessed growth across all of EVgo’s customer segments, deepening relationships with our core partners, new customer offerings, and cultivation of new business opportunities as the transition to electric vehicles gains momentum,” said Cathy Zoi, CEO of EVgo. “We added a record number of customers, almost doubled our quarterly stall build-out compared to last quarter, and significantly accelerated investments associated with charger stall build-out looking forward. EVgo’s mission to speed the adoption of electric vehicles through the investment in charging infrastructure is progressing at an accelerating pace. Our build-own-operate business model has equipped EVgo with the experience and insight to be a market leader and to be a provider of first resort to the rapidly expanding EV market.”
Business Highlights
During the second quarter of 2021, EVgo placed 104 new charging stalls in service, with more than 2,000 additional charger stalls in the Active Engineering and Construction (“E&C”) Pipeline. Roughly 85% of the Active E&C pipeline stalls are located within the top 20 U.S. metropolitan markets and the majority are part of EVgo’s partnership with GM to deploy over 2,700 fast charging stalls by 2025.
In July 2021, EVgo was chosen by GM to serve as a preferred charging provider for its Ultium Charge 360 Fleet service. Additionally, EVgo and Chevrolet launched a new retail program enabling buyers and lessees of new Bolt EV and Bolt EUV vehicles to elect to receive a $500 EVgo charging credit or have a home Level 2 charger installation supported by Chevrolet.
1
As of the end of second quarter of 2021, EVgo has contracted with two leading AV companies to provide each with dedicated fast charging services under contract structures which include take-or-pay arrangements for their high mileage vehicles, generating network usage and reducing risk for both parties as the self-driving market continues to expand.
Also in July 2021, EVgo announced that it acquired leading e-mobility software company Recargo. Recargo, through its platform PlugShare, offers crowdsourced reviews, photos, and data to help the EV community understand customer needs. PlugShare currently has 1.6 million users and 3.3 million global downloads of the PlugShare app, and coverage of more than 61,000 L2 and DCFC charging stations and over 163,000 charging ports in North America alone. This acquisition is a strategic and logical extension of the efforts already well underway at EVgo – accelerating overall EV adoption by improving driver experiences, enhancing the interconnectedness of the charging ecosystem, and providing data to automakers and other key stakeholders to help move the EV community forward in terms of convenience, availability, and service.
EVgo continues to expand on its technical leadership in the transportation electrification sector and, as part of this effort, launched the EVgo Innovation Lab in April 2021 to test, validate, and certify charging equipment for customer experience, performance, and safety. The EVgo team at the lab works with automobile and charger original equipment manufacturers to evaluate new products and share insights. The EVgo Innovation Lab also designs, prototypes, and tests new hardware and EVgo’s own charger management software tools and user interfaces for both public and fleet applications.
Financial & Operational Highlights
For the avoidance of doubt, these figures reflect the results for the quarter ended June 30, 2021 of EVgo HoldCo, LLC, a subsidiary of EVgo, prior to completion of the business combination with CRIS on July 1, 2021.
| ● | Revenue of $4.8 million |
| ● | Network throughput of 6.1 Gigawatt-hours (GWh) |
| ● | Customer Accounts added of 34,618 |
| ● | Charger stalls in operation: EVgo placed 104 new charger stalls into service during the second quarter, raising its total charger stalls in operation to 1,548, as of June 30, 2021 |
| ● | Gross Loss of $2.8 million |
| ● | Net Loss of $18.4 million |
| ● | Adjusted Gross Loss of $61 thousand |
| ● | Adjusted EBITDA of $(11.0) million |
| ● | Cash Flow from Operations of $(1.4) million for the six months ended June 30, 2021 |
| ● | Capital Expenditures of $23.3 million for the six months ended June 30, 2021 |
2
($’000) unless indicated otherwise
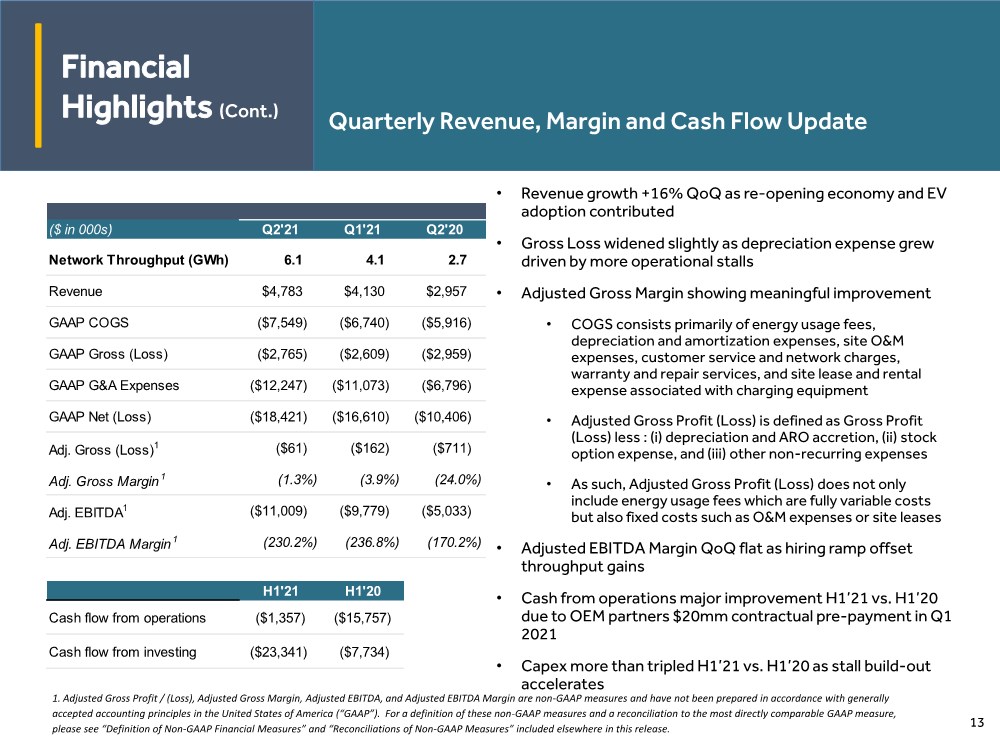
($ in 000s) | | | Q2'21 | | | Q1'21 | | | Q2'20 |
Network Throughput (GWh) | | | 6.1 | | | 4.1 | | | 2.7 |
Revenue | | $ | 4,783 | | $ | 4,130 | | $ | 2,957 |
GAAP COGS | | $ | (7,549) | | $ | (6,740) | | $ | (5,916) |
GAAP Gross (Loss) | | $ | (2,765) | | $ | (2,609) | | $ | (2,959) |
GAAP G&A Expenses | | $ | (12,247) | | $ | (11,073) | | $ | (6,796) |
GAAP Net (Loss) | | $ | (18,421) | | $ | (16,610) | | $ | (10,406) |
Adj. Gross (Loss) 1 | | $ | (61) | | $ | (162) | | $ | (711) |
Adj. Gross Margin1 | | | (1.3)% | | | (3.9)% | | | (24.0)% |
Adj. EBITDA1 | | $ | (11,009) | | $ | (9,779) | | $ | (5,033) |
Adj. EBITDA Margin1 | | | (230.2)% | | | (236.8)% | | | (170.2)% |
| | | H1'21 | | | H1'20 |
Cash flow from operations | | $ | (1,357) | | $ | (15,757) |
Cash flow from investing | | $ | (23,341) | | $ | (7,734) |
| 1. | Adjusted Gross Profit / (Loss), Adjusted Gross Margin, Adjusted EBITDA, and Adjusted EBITDA Margin are non-GAAP measures and have not been prepared in accordance with generally accepted accounting principles in the United States of America (“GAAP”). For a definition of these non-GAAP measures and a reconciliation to the most directly comparable GAAP measure, please see “Definition of Non-GAAP Financial Measures” and “Reconciliations of Non-GAAP Measures” included elsewhere in this release. COGS consists primarily of energy usage fees, depreciation and amortization expenses, site O&M expenses, customer service and network charges, warranty and repair services, and site lease and rental expense associated with charging equipment. Adjusted Gross Profit (Loss) is defined as Gross Profit (Loss) less: (i) depreciation and ARO accretion, (ii) stock option expense, and (iii) other non-recurring expenses. |
EVgo realized 48% quarter-over-quarter sequential growth in kilowatt-hour (kWh) network throughput during the second quarter of 2021 and 126% growth year-over-year.
Revenue exhibited similar growth trends, with 16% quarter-over-quarter sequential growth during the second quarter of 2021.
Adjusted Gross Margin for the second quarter of 2021 improved 260 basis points to (1.3%) from (3.9%) in the first quarter of 2021 due to lower energy costs per kWh as a result of improved leveraging of demand charges, which are part of our energy tariffs.
GAAP General & Administrative Expenses increased to $12.2 million in the second quarter of 2021 compared to $11.0 million in the first quarter of 2021 and $6.8 million in the second quarter of 2020. The increase is in line with EVgo’s expectations, and primarily driven by the Company’s ongoing growth investments.
Adjusted EBITDA Margin in the second quarter of 2021 was ($11) million compared to ($9.8) million in the first quarter of 2021.
EVgo realized an increase of $14.4 million in cash flow from operations in the first half of 2021 as compared to the first half of 2020 from $(15.8) million to $(1.4) million owing in part to a $20 million pre-payment from OEM partners in the first quarter of 2021.
3
Capital expenditures in the first half of 2021 more than tripled to $23.3 million from $7.7 million, as EVgo is actively executing on its charger stall build plan.
2021 Guidance
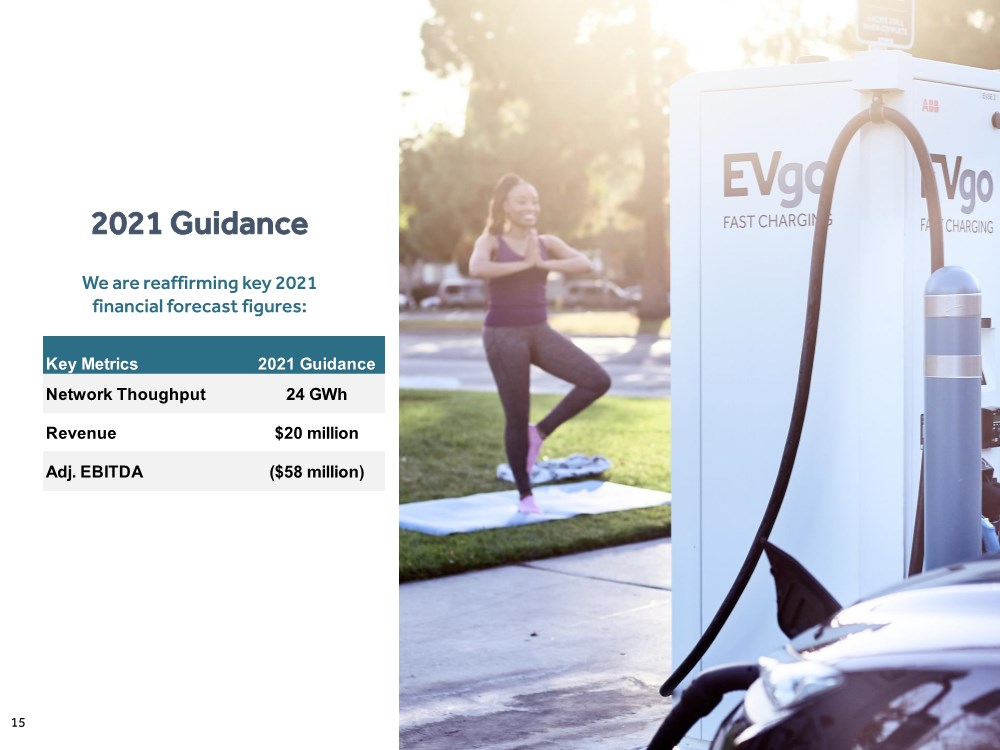
EVgo is affirming its prior financial forecast for full year 2021 of $20 million in revenues, 24 gigawatt-hours of network throughput, and ($58) million in Adjusted EBITDA.
Conference Call Information
A live audio webcast and conference call for our second quarter 2021 earnings release will be held at 11:00 AM ET / 8:00 AM PT on August 11, 2021. The webcast will be available at investors.evgo.com, and the dial-in information for those wishing to access via phone is:
Toll Free: 1-877-407-4018
Toll/International: 1-201-689-8471
Conference ID: 13722018
This press release, along with other investor materials, including a slide presentation and reconciliations of certain non-GAAP measures to their nearest GAAP measures, will also be available on that site.
About EVgo
EVgo (Nasdaq: EVGO) is the nation’s largest public fast charging network for electric vehicles, and the first to be powered by 100% renewable energy. With more than 800 fast charging locations, EVgo’s owned and operated charging network serves over 68 metropolitan areas across 35 states and more than 275,000 customers. Founded in 2010, EVgo leads the way on transportation electrification, partnering with automakers; fleet and rideshare operators; retail hosts such as hotels, shopping centers, gas stations and parking lot operators; and other stakeholders to deploy advanced charging technology to expand network availability and make it easier for drivers across the U.S. to enjoy the benefits of driving an EV. As a charging technology first mover, EVgo works closely with business and government leaders to accelerate the ubiquitous adoption of EVs by providing a reliable and convenient charging experience close to where drivers live, work and play, whether for a daily commute or a commercial fleet.
Forward-Looking Statements
This press release contains “forward-looking statements” within the meaning of the "safe harbor" provisions of the United States Private Securities Litigation Reform Act of 1995. Forward-looking statements may be identified by the use of words such as "estimate," "plan," "project," "forecast," "intend," "will," "expect," "anticipate," "believe," "seek," "target" or other similar expressions that predict or indicate future events or trends or that are not statements of historical matters. These forward-looking statements are based on management’s current expectations or beliefs and are subject to numerous assumptions, risks and uncertainties that could cause actual results to differ materially from those described in the forward-looking statements. These forward-looking statements include, but are not limited to, express or implied statements regarding EVgo’s future financial performance, revenues and capital expenditures, EVgo’s expectation of acceleration in our business due to factors including a re-opening economy and increased EV adoption; and
4
the Company’s strong liquidity position enabling effective deployment of chargers. These statements are based on various assumptions, whether or not identified in this press release, and on the current expectations of EVgo’s management and are not predictions of actual performance. There are a significant number of factors that could cause actual results to differ materially from the statements made in this press release, including: changes or developments in the broader general market; ongoing impact from COVID-19 on our business, customers, and suppliers; macro political, economic, and business conditions; our limited operating history as a public company; our dependence on widespread adoption of EVs and increased installation of charging station; mechanisms surrounding energy and non-energy costs for our charging stations; the impact of governmental support and mandates that could reduce, modify, or eliminate financial incentives, rebates, and tax credits; supply chain interruptions; impediments to our expansion plans; the need to attract additional fleet operators as customers; potential adverse effects on our revenue and gross margins if customers increasingly claim clean energy credits and, as a result, they are no longer available to be claimed by us; the effects of competition; risks related to our dependence on our intellectual property; and risks that our technology could have undetected defects or errors. Additional risks and uncertainties that could affect our financial results are included under the captions “Risk Factors” and “Management’s Discussion and Analysis of Financial Condition and Results of Operations of EVgo” in EVgo’s registration statement on Form S-1 originally filed with the Securities and Exchange Commission (the “SEC”) on July 20, 2021, as well as its other filings with the SEC, copies of which are available on EVgo’s website at investors.evgo.com, and on the SEC’s website at www.sec.gov. All forward-looking statements in this press release are based on information available to us as of the date hereof, and we do not assume any obligation to update the forward-looking statements provided to reflect events that occur or circumstances that exist after the date on which they were made, except as required by applicable law.
Use of Non-GAAP Financial Measures
To supplement EVgo’s financial information, which is prepared and presented in accordance with GAAP, EVgo uses certain non-GAAP financial measures. The presentation of non-GAAP financial measures is not intended to be considered in isolation or as a substitute for, or superior to, the financial information prepared and presented in accordance with GAAP. EVgo uses these non-GAAP financial measures for financial and operational decision-making and as a means to evaluate period-to-period comparisons. EVgo believes that these non-GAAP financial measures provide meaningful supplemental information regarding the Company’s performance by excluding certain items that may not be indicative of EVgo’s recurring core business operating results.
EVgo believes that both management and investors benefit from referring to these non-GAAP financial measures in assessing EVgo’s performance. These non-GAAP financial measures also facilitate management’s internal comparisons to the Company’s historical performance. EVgo believes these non-GAAP financial measures are useful to investors both because (1) they allow for greater transparency with respect to key metrics used by management in its financial and operational decision-making and (2) they are used by EVgo’s institutional investors and the analyst community to help them analyze the health of EVgo’s business.
For more information on these non-GAAP financial measures, including reconciliations to the most comparable GAAP measures, please see the sections titled “Definitions of Non-GAAP Financial Measures” and “Reconciliations of Non-GAAP Measures” included at the end of this release.
5
Definitions of Non-GAAP Financial Measures
This press release includes the non-GAAP financial measures: “Adjusted COGS,” “Adjusted Gross Profit (Loss),” “Adjusted Gross Margin,” “EBITDA,” “Adjusted EBITDA”. EVgo believes these measures are useful to investors in evaluating EVgo’s financial performance. In addition, EVgo uses these measures internally to establish forecasts, budgets, and operational goals to manage and monitor its business. EVgo believes that these non-GAAP financial measures help to depict a more realistic representation of the performance of the underlying business, enabling EVgo to evaluate and plan more effectively for the future. EVgo believes that investors should have access to the same set of tools that its management uses in analyzing operating results.
Adjusted COGS is defined as cost of goods sold before: (i) depreciation and ARO accretion, (ii) stock option expense, and (iii) other non-recurring expenses. Adjusted Gross Profit (Loss) is defined as Gross Profit (Loss) less (i) depreciation and ARO accretion, (ii) stock option expense, an (iii) other non-recurring expenses. Adjusted Gross Margin is defined as Adjusted Gross Profit (Loss) as a percentage of revenue. EBITDA is defined as net income (loss) before (i) interest expense, (ii) income taxes and (iii) depreciation and amortization. Adjusted EBITDA is defined as EBITDA plus other unusual or nonrecurring income (expenses) such as bad debt expense. Adjusted EBITDA Margin is defined as Adjusted EBITDA as a percentage of revenue. Adjusted COGS, Adjusted Gross Profit (Loss), Adjusted Gross Margin, EBITDA, and Adjusted EBITDA are not prepared in accordance with GAAP and that may be different from non-GAAP financial measures used by other companies. These measures should not be considered as measures of financial performance under GAAP, and the items excluded from or included in these metrics are significant components in understanding and assessing EVgo’s financial performance. These metrics should not be considered as alternatives to net income (loss) or any other performance measures derived in accordance with GAAP.
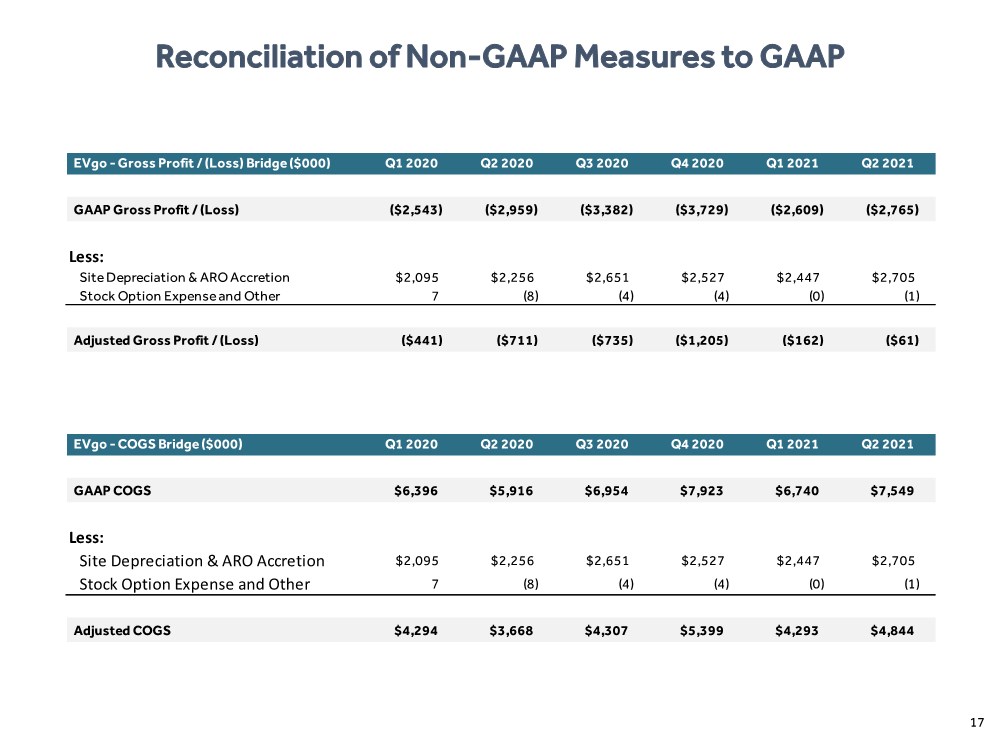
Reconciliations of Non-GAAP Measures
EVgo - Gross Profit / (Loss) Bridge ($000) | | | Q1 2020 | | | Q2 2020 | | | Q3 2020 | | | Q4 2020 | | | Q1 2021 | | | Q2 2021 |
| | | | | | | | | | | | | | | | | | |
GAAP Gross Profit / (Loss) | | $ | (2,543) | | $ | (2,959) | | $ | (3,382) | | $ | (3,729) | | $ | (2,609) | | $ | (2,765) |
| | | | | | | | | | | | | | | | | | |
Less: | | | | | | | | | | | | | | | | | | |
Site Depreciation & ARO Accretion | | $ | 2,095 | | $ | 2,256 | | $ | 2,651 | | $ | 2,527 | | $ | 2,447 | | $ | 2,705 |
Stock Option Expense and Other | | | 7 | | | (8) | | | (4) | | | (4) | | | (0) | | | (1) |
| | | | | | | | | | | | | | | | | | |
Adjusted Gross Profit / (Loss) | | $ | (441) | | $ | (711) | | $ | (735) | | $ | (1,205) | | $ | (162) | | $ | (61) |
EVgo - COGS Bridge ($000) | | | Q1 2020 | | | Q2 2020 | | | Q3 2020 | | | Q4 2020 | | | Q1 2021 | | | Q2 2021 |
| | | | | | | | | | | | | | | | | | |
GAAP COGS | | $ | 6,396 | | $ | 5,916 | | $ | 6,954 | | $ | 7,923 | | $ | 6,740 | | $ | 7,549 |
| | | | | | | | | | | | | | | | | | |
Less: | | | | | | | | | | | | | | | | | | |
Site Depreciation & ARO Accretion | | $ | 2,095 | | $ | 2,256 | | $ | 2,651 | | $ | 2,527 | | $ | 2,447 | | $ | 2,705 |
Stock Option Expense and Other | | | 7 | | | (8) | | | (4) | | | (4) | | | (0) | | | (1) |
| | | | | | | | | | | | | | | | | | |
Adjusted COGS | | $ | 4,294 | | $ | 3,668 | | $ | 4,307 | | $ | 5,399 | | $ | 4,293 | | $ | 4,844 |
6
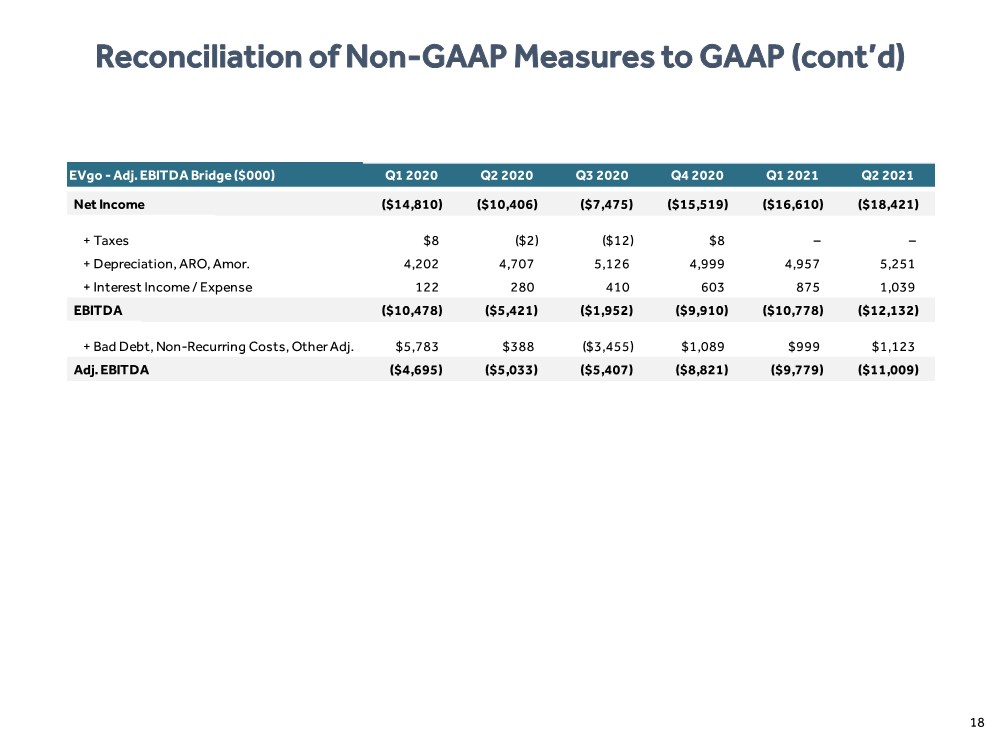
EVgo - Adj. EBITDA Bridge ($000) | | | Q1 2020 | | | Q2 2020 | | | Q3 2020 | | | Q4 2020 | | | Q1 2021 | | | Q2 2021 |
| | | | | | | | | | | | | | | | | | |
Net Income | | $ | (14,810) | | $ | (10,406) | | $ | (7,475) | | $ | (15,519) | | $ | (16,610) | | $ | (18,421) |
| | | | | | | | | | | | | | | | | | |
+ Taxes | | $ | 8 | | $ | (2) | | $ | (12) | | $ | 8 | | $ | - | | $ | - |
+ Depreciation, ARO, Amor. | | | 4,202 | | | 4,707 | | | 5,126 | | | 4,999 | | | 4,957 | | | 5,251 |
+ Interest Income / Expense | | | 122 | | | 280 | | | 410 | | | 603 | | | 875 | | | 1,039 |
EBITDA | | $ | (10,478) | | $ | (5,421) | | $ | (1,952) | | $ | (9,910) | | $ | (10,778) | | $ | (12,132) |
| | | | | | | | | | | | | | | | | | |
+ Bad Debt, Non-Recurring Costs, Other Adj. | | $ | 5,783 | | $ | 388 | | $ | (3,455) | | $ | 1,089 | | $ | 999 | | $ | 1,123 |
Adj. EBITDA | | $ | (4,695) | | $ | (5,033) | | $ | (5,407) | | $ | (8,821) | | $ | (9,779) | | $ | (11,009) |
7
Financial Statements
EVgo HoldCo, LLC (Successor) and EVgo Services, LLC (Predecessor)
Condensed Consolidated Balance Sheets
| | June 30, | | December 31, | ||
|
| 2021 |
| 2020 | ||
| | (unaudited) | | | | |
Assets |
| |
| | |
|
Current assets |
| |
| | |
|
Cash |
| $ | 1,040,046 | | $ | 7,914,150 |
Restricted cash | | | 361,030 | | | — |
Accounts receivable, net | |
| 2,157,140 | |
| 2,164,346 |
Accounts receivable, capital build | |
| 3,249,706 | |
| 3,258,724 |
Deferred offering costs | | | 7,215,869 | | | 3,071,282 |
Prepaid expenses and other current assets | |
| 2,858,797 | |
| 3,563,021 |
Total current assets | |
| 16,882,588 | |
| 19,971,523 |
Property and equipment, net | |
| 94,827,359 | |
| 71,265,503 |
Intangible assets, net | |
| 63,661,371 | |
| 67,956,371 |
Goodwill | |
| 22,111,166 | |
| 22,111,166 |
Other assets | |
| 1,839,114 | |
| 836,347 |
| | $ | 199,321,598 | | $ | 182,140,910 |
| | | | | | |
Liabilities and Members’ Equity | |
|
| |
|
|
Current liabilities | |
|
| |
|
|
Accounts payable | | $ | 3,211,032 | | $ | 2,998,448 |
Payables to related parties | |
| 1,554,400 | |
| 135,146 |
Accrued liabilities | |
| 20,315,881 | |
| 10,945,013 |
Deferred revenue, current | |
| 2,962,647 | |
| 1,653,042 |
Customer deposits | |
| 6,537,688 | |
| 7,660,378 |
Note payable, related party | |
| 59,578,994 | |
| 39,164,383 |
Capital-build, buyout liability | |
| — | |
| 627,647 |
Other current liabilities | |
| 136,635 | |
| 397,228 |
Total current liabilities | |
| 94,297,277 | |
| 63,581,285 |
Deferred revenue, noncurrent | |
| 22,200,470 | |
| 2,732,257 |
Capital-build liability, excluding buyout liability | |
| 17,086,501 | |
| 17,387,686 |
Asset retirement obligations | |
| 10,271,676 | |
| 8,801,806 |
Other liabilities | |
| — | |
| 150,903 |
Total liabilities | |
| 143,855,924 | |
| 92,653,937 |
Members’ equity | |
| 55,465,674 | |
| 89,486,973 |
| | $ | 199,321,598 | | $ | 182,140,910 |
8
EVgo HoldCo, LLC (Successor) and EVgo Services, LLC (Predecessor)
Condensed Consolidated Statements of Operations
| | | | | | | | | | | | | | | | | |
| | Successor | | | Predecessor | ||||||||||||
| | (unaudited) | | | | | |||||||||||
| | | | | | | | | | | | | | | | | |
| | | | | | | | | | January 16, | | | January 1, | ||||
| | Three months | | Three months | | | Six months | | 2020 | | | 2020 | |||||
| | ended | | ended | | | ended | | through | | | through | |||||
| | June 30, | | June 30, | | | June 30, | | June 30, | | | January 15, | |||||
| | 2021 |
| 2020 |
|
| 2021 | | 2020 |
|
| 2020 | |||||
Revenue |
| $ | 4,783,250 |
| $ | 2,956,974 |
|
| $ | 8,352,045 |
| $ | 5,283,287 |
|
| $ | 1,461,395 |
Revenue from related parties | |
| — | | | — | | |
| 561,700 | | | — | | | | 65,294 |
Total revenues | |
| 4,783,250 | | | 2,956,974 | | |
| 8,913,745 | | | 5,283,287 | | | | 1,526,689 |
Cost of sales | |
| 7,548,717 | | | 5,915,939 | | |
| 14,288,264 | | | 11,176,535 | | | | 1,135,789 |
Gross (loss) profit | |
| (2,765,467) | | | (2,958,965) | | |
| (5,374,519) | | | (5,893,248) | | | | 390,900 |
| | | | | | | | | | | | | | | | | |
General and administrative | |
| 12,246,772 | | | 6,796,485 | | |
| 23,319,765 | | | 12,572,392 | | | | 1,084,284 |
Transaction bonus | |
| — | | | — | | |
| — | | | 5,316,124 | | | | — |
Depreciation, amortization, and accretion | |
| 2,545,075 | | | 2,451,122 | | |
| 5,055,303 | | | 4,488,154 | | | | 69,435 |
Total operating expenses | |
| 14,791,847 | | | 9,247,607 | | |
| 28,375,068 | | | 22,376,670 | | | | 1,153,719 |
Operating loss | |
| (17,557,314) | | | (12,206,572) | | |
| (33,749,587) | | | (28,269,918) | | | | (762,819) |
| | | | | | | | | | | | | | | | | |
Interest expense, related party | |
| 1,038,826 | | | 279,699 | | |
| 1,914,610 | | | 401,561 | | | | — |
Interest income | | | (716) | | | (7) | | |
| (716) | | | (7) | | | | — |
Other income, related party | |
| — | | | — | | | | — | | | — | | | | (341,954) |
Other income, net | |
| (173,975) | | | (2,080,135) | | |
| (631,863) | | | (3,876,149) | | | | — |
Total other expense (income) , net | |
| 864,135 | |
| (1,800,443) | | |
| 1,282,031 | |
| (3,474,595) | | | | (341,954) |
Net loss | | $ | (18,421,449) | | $ | (10,406,129) | | | $ | (35,031,618) | | $ | (24,795,323) | | | $ | (420,865) |
9
EVgo HoldCo, LLC (Successor) and EVgo Services, LLC (Predecessor)
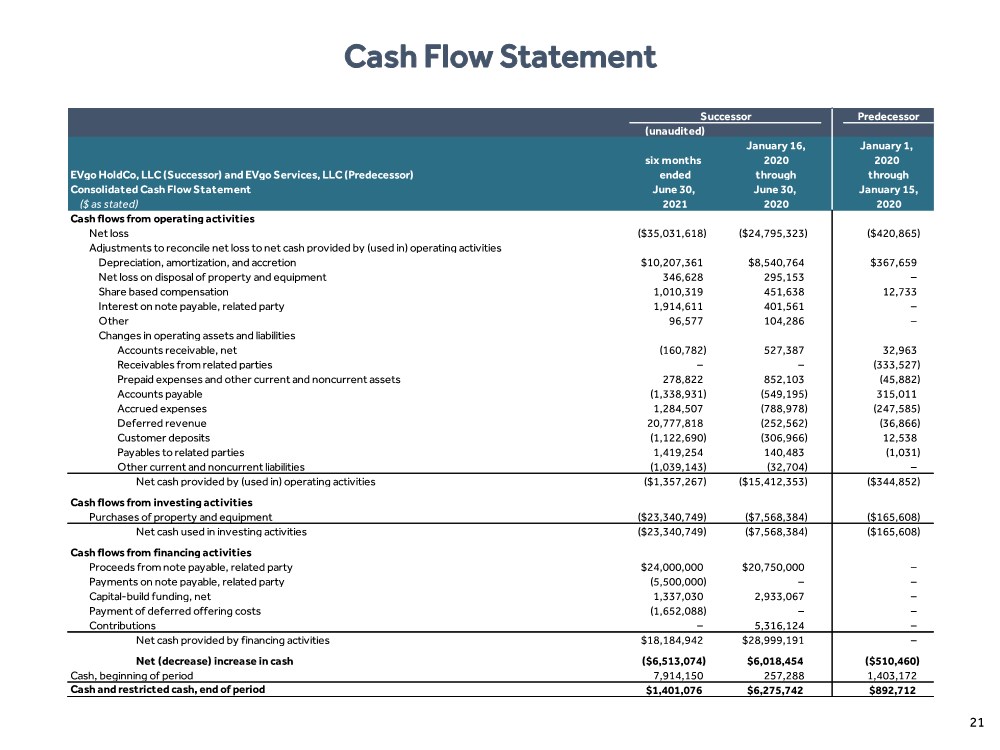
Condensed Consolidated Statements of Cash Flows
| | Successor | | | Predecessor | |||||
| | (unaudited) | | | | | ||||
| | | | January 16, | | | January 1, | |||
| | Six months | | 2020 | | | 2020 | |||
| | ended | | through | | | through | |||
| | June 30, | | June 30, | | | January 15, | |||
| | 2021 |
| 2020 |
|
| 2020 | |||
Cash flows from operating activities |
|
|
| | |
| | | |
|
Net loss | | $ | (35,031,618) | | | (24,795,323) | | | | (420,865) |
Adjustments to reconcile net loss to net cash provided by (used in) operating activities | |
| | | | | | | | |
Depreciation, amortization, and accretion | |
| 10,207,361 | | | 8,540,764 | | | | 367,659 |
Net loss on disposal of property and equipment | |
| 346,628 | | | 295,153 | | | | — |
Share based compensation | |
| 1,010,319 | | | 451,638 | | | | 12,733 |
Interest on note payable, related party | | | 1,914,611 | | | 401,561 | | | | — |
Other | | | 96,577 | | | 104,286 | | | | — |
Changes in operating assets and liabilities | |
| | | | | | | | |
Accounts receivable, net | |
| (160,782) | | | 527,387 | | | | 32,963 |
Receivables from related parties | |
| — | | | — | | | | (333,527) |
Prepaid expenses and other current and noncurrent assets | |
| 278,822 | | | 852,103 | | | | (45,882) |
Accounts payable | |
| (1,338,931) | | | (549,195) | | | | 315,011 |
Accrued expenses | |
| 1,284,507 | | | (788,978) | | | | (247,585) |
Deferred revenue | |
| 20,777,818 | | | (252,562) | | | | (36,866) |
Customer deposits | |
| (1,122,690) | | | (306,966) | | | | 12,538 |
Payables to related parties | |
| 1,419,254 | | | 140,483 | | | | (1,031) |
Other current and noncurrent liabilities | |
| (1,039,143) | | | (32,704) | | | | — |
Net cash used in operating activities | |
| (1,357,267) | | | (15,412,353) | | | | (344,852) |
Cash flows from investing activities | |
| | | | | | | | |
Purchases of property and equipment | | | (23,340,749) | | | (7,568,384) | | | | (165,608) |
Net cash used in investing activities | |
| (23,340,749) | | | (7,568,384) | | | | (165,608) |
Cash flows from financing activities | |
| | | | | | | | |
Proceeds from note payable, related party | |
| 24,000,000 | | | 20,750,000 | | | | — |
Payments on note payable, related party | | | (5,500,000) | | | — | | | | — |
Capital-build funding, net | |
| 1,337,030 | | | 2,933,067 | | | | — |
Payment of deferred offering costs | |
| (1,652,088) | | | — | | | | — |
Contributions | |
| — | | | 5,316,124 | | | | — |
Net cash provided by financing activities | |
| 18,184,942 | | | 28,999,191 | | | | — |
Net (decrease) increase in cash and restricted cash | |
| (6,513,074) | | | 6,018,454 | | | | (510,460) |
Cash and restricted cash, beginning of period | |
| 7,914,150 | | | 257,288 | | | | 1,403,172 |
Cash and restricted cash, end of period | | $ | 1,401,076 | | | 6,275,742 | | | | 892,712 |
Supplemental disclosure of noncash investing and financing activities | |
| | | | | | | | |
Asset retirement obligations incurred | | $ | 787,214 | | $ | 628,562 | | | $ | — |
Purchases of property and equipment in accounts payable and accrued liabilities | | $ | 9,076,659 | | $ | 1,604,925 | | | $ | 1,758,727 |
Accrued deferred offering costs | | $ | 4,870,103 | | $ | — | | | $ | — |
10
Exhibit 99.2
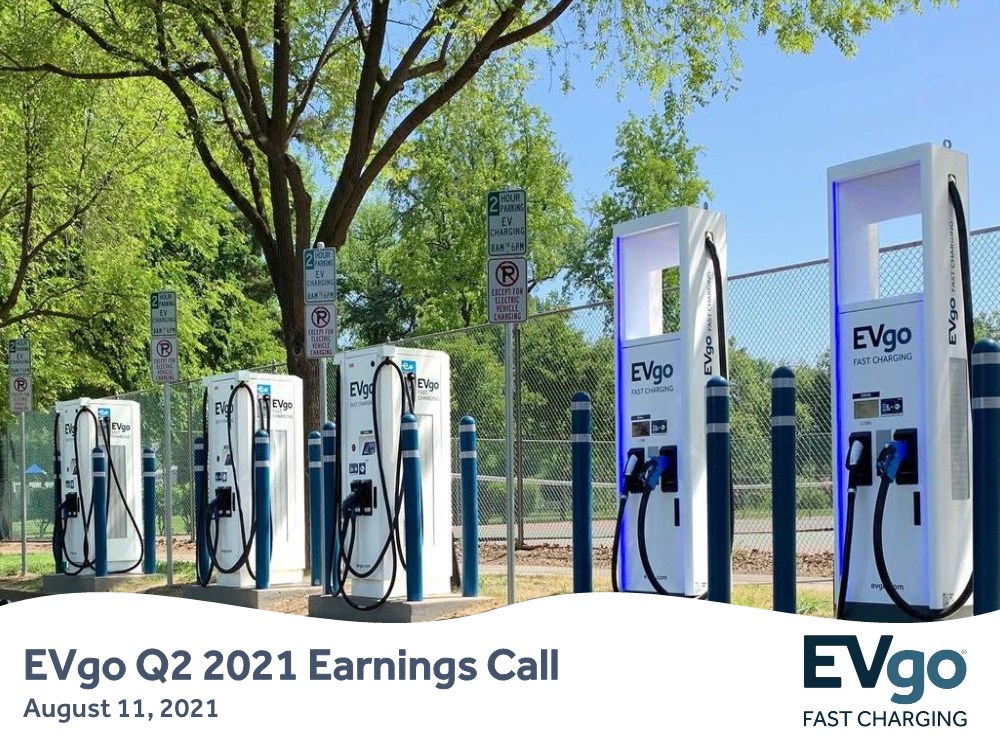
| Proprietary and Confidential - Do not Distribute 1 EVgo Q2 2021 Earnings Call August 11, 2021 |
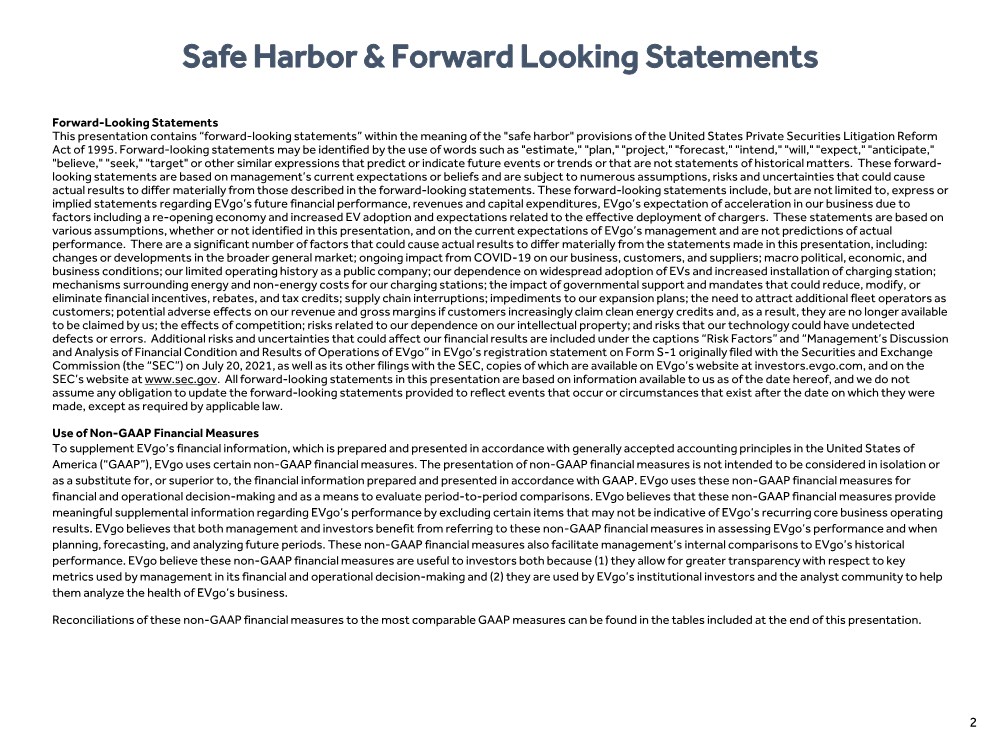
| Proprietary and Confidential - Do not Distribute 2 Safe Harbor & Forward Looking Statements Forward-Looking Statements This presentation contains “forward-looking statements” within the meaning of the "safe harbor" provisions of the United States Private Securities Litigation Reform Act of 1995. Forward-looking statements may be identified by the use of words such as "estimate," "plan," "project," "forecast," "intend," "will," "expect," "anticipate," "believe," "seek," "target" or other similar expressions that predict or indicate future events or trends or that are not statements of historical matters. These forward- looking statements are based on management’s current expectations or beliefs and are subject to numerous assumptions, risks and uncertainties that could cause actual results to differ materially from those described in the forward-looking statements. These forward-looking statements include, but are not limited to, express or implied statements regarding EVgo’s future financial performance, revenues and capital expenditures, EVgo’s expectation of acceleration in our business due to factors including a re-opening economy and increased EV adoption and expectations related to the effective deployment of chargers. These statements are based on various assumptions, whether or not identified in this presentation, and on the current expectations of EVgo’s management and are not predictions of actual performance. There are a significant number of factors that could cause actual results to differ materially from the statements made in this presentation, including: changes or developments in the broader general market; ongoing impact from COVID-19 on our business, customers, and suppliers; macro political, economic, and business conditions; our limited operating history as a public company; our dependence on widespread adoption of EVs and increased installation of charging station; mechanisms surrounding energy and non-energy costs for our charging stations; the impact of governmental support and mandates that could reduce, modify, or eliminate financial incentives, rebates, and tax credits; supply chain interruptions; impediments to our expansion plans; the need to attract additional fleet operators as customers; potential adverse effects on our revenue and gross margins if customers increasingly claim clean energy credits and, as a result, they are no longer available to be claimed by us; the effects of competition; risks related to our dependence on our intellectual property; and risks that our technology could have undetected defects or errors. Additional risks and uncertainties that could affect our financial results are included under the captions “Risk Factors” and “Management’s Discussion and Analysis of Financial Condition and Results of Operations of EVgo” in EVgo’s registration statement on Form S-1 originally filed with the Securities and Exchange Commission (the “SEC”) on July 20, 2021, as well as its other filings with the SEC, copies of which are available on EVgo’s website at investors.evgo.com, and on the SEC’s website at www.sec.gov. All forward-looking statements in this presentation are based on information available to us as of the date hereof, and we do not assume any obligation to update the forward-looking statements provided to reflect events that occur or circumstances that exist after the date on which they were made, except as required by applicable law. Use of Non-GAAP Financial Measures To supplement EVgo’s financial information, which is prepared and presented in accordance with generally accepted accounting principles in the United States of America (“GAAP”), EVgo uses certain non-GAAP financial measures. The presentation of non-GAAP financial measures is not intended to be considered in isolation or as a substitute for, or superior to, the financial information prepared and presented in accordance with GAAP. EVgo uses these non-GAAP financial measures for financial and operational decision-making and as a means to evaluate period-to-period comparisons. EVgo believes that these non-GAAP financial measures provide meaningful supplemental information regarding EVgo’s performance by excluding certain items that may not be indicative of EVgo’s recurring core business operating results. EVgo believes that both management and investors benefit from referring to these non-GAAP financial measures in assessing EVgo’s performance and when planning, forecasting, and analyzing future periods. These non-GAAP financial measures also facilitate management’s internal comparisons to EVgo’s historical performance. EVgo believe these non-GAAP financial measures are useful to investors both because (1) they allow for greater transparency with respect to key metrics used by management in its financial and operational decision-making and (2) they are used by EVgo’s institutional investors and the analyst community to help them analyze the health of EVgo’s business. Reconciliations of these non-GAAP financial measures to the most comparable GAAP measures can be found in the tables included at the end of this presentation. |
| Proprietary and Confidential - Do not Distribute Definitions of Non-GAAP Financial Measures This presentation includes the non-GAAP financial measures: “Adjusted COGS,” “Adjusted Gross Profit (Loss),” “Adjusted Gross Margin,” “EBITDA,” and “Adjusted EBITDA.” EVgo believes these measures are useful to investors in evaluating EVgo’s financial performance. In addition, EVgo uses these measures internally to establish forecasts, budgets, and operational goals to manage and monitor its business. EVgo believes that these non-GAAP financial measures help to depict a more realistic representation of the performance of the underlying business, enabling EVgo to evaluate and plan more effectively for the future. EVgo believes that investors should have access to the same set of tools that its management uses in analyzing operating results. Adjusted COGS is defined as cost of goods sold before: (i) depreciation and ARO accretion, (ii) stock option expense, and (iii) other non-recurring expenses. Adjusted Gross Profit (Loss) is defined as Gross Profit (Loss) less : (i) depreciation and ARO accretion, (ii) stock option expense, and (iii) other non-recurring expenses. Adjusted Gross Margin is defined as Adjusted Gross Profit (Loss) as a percentage of revenue. EBITDA is defined as net income (loss) before (i) interest expense, (ii) income taxes and (iii) depreciation and amortization. Adjusted EBITDA is defined as EBITDA plus other unusual or nonrecurring income (expenses) such as bad debt expense. Adjusted EBITDA Margin is defined as Adjusted EBITDA as a percentage of revenue. Adjusted Cost of Sales, Adjusted Gross Profit (Loss), Adjusted Gross Margin, EBITDA, and Adjusted EBITDA are not prepared in accordance with GAAP and that may be different from non-GAAP financial measures used by other companies. These measures should not be considered as measures of financial performance under GAAP, and the items excluded from or included in these metrics are significant components in understanding and assessing EVgo’s financial performance. These metrics should not be considered as alternatives to net income (loss) or any other performance measures derived in accordance with GAAP. 3 |
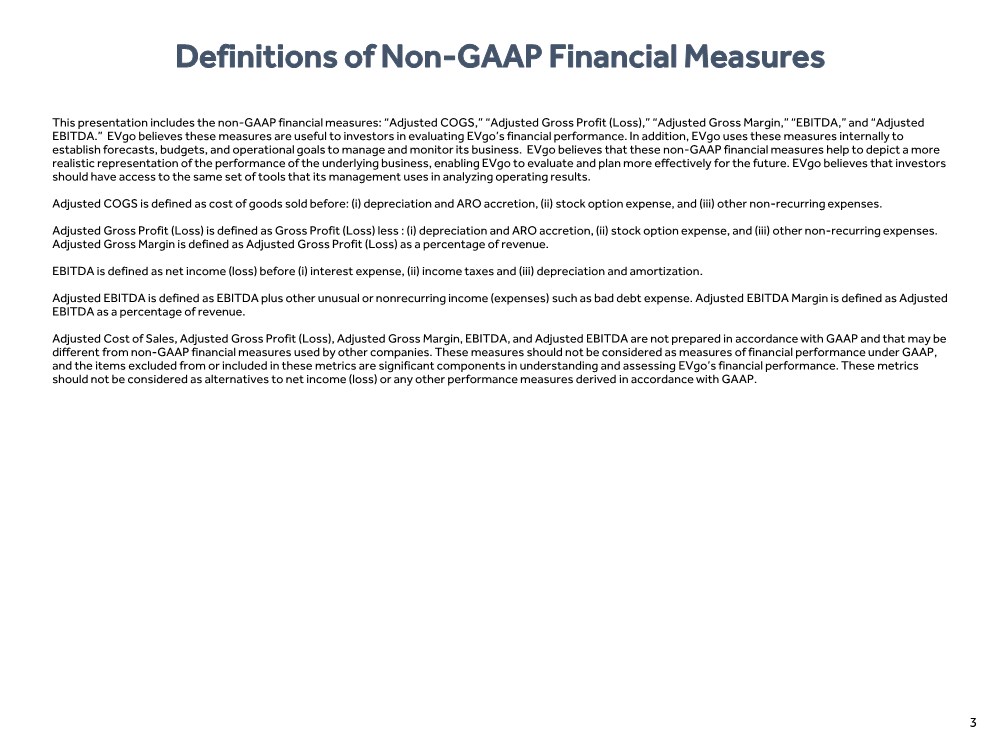
| CONFIDENTIAL | 1 Strategic Overview Cathy Zoi, CEO 4 |
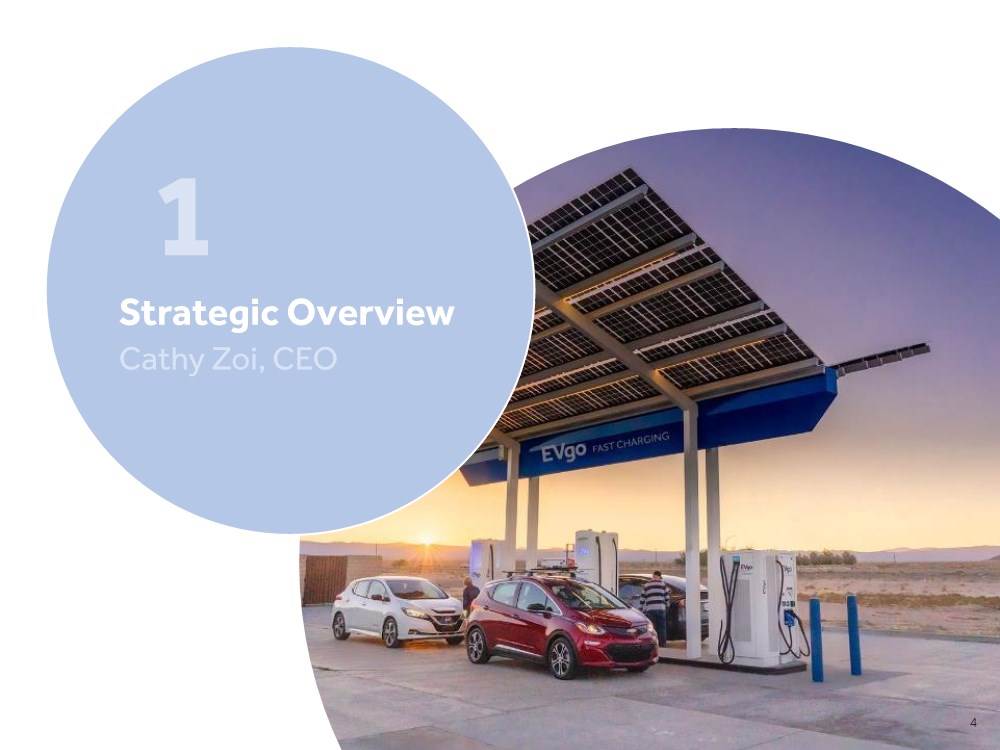
| Proprietary and Confidential - Do not Distribute Strategic Overview and Key Updates First Quarter as a Public Company, leading to new partnerships and opportunities; expansion of existing relationships Stronger than Expected H1’21 EV Sales Driving Demand for fast charging services leading to strong Network Throughput Growth of 48% Quarter over Quarter sequentially Nearly Doubled Deployments in Q2 ’21 vs Q1 ’21, with 104 New Charging Stalls Operational, with 2,067 in Active Engineering & Construction Pipeline, and 1,548 charging stalls in operation(1) (1) Stall counts as of 6/30/2021. Note: Photo copyright Nasdaq 2021. Named Preferred Charging Provider by GM for its Ultium Charge 360 Fleet Service and launched a new program with Chevrolet for EVgo charging credits Acquired Recargo, bringing the PlugShare brand, products and team under the EVgo umbrella 5 Partnership with Two Leading AV Companies with take-or-pay arrangements |
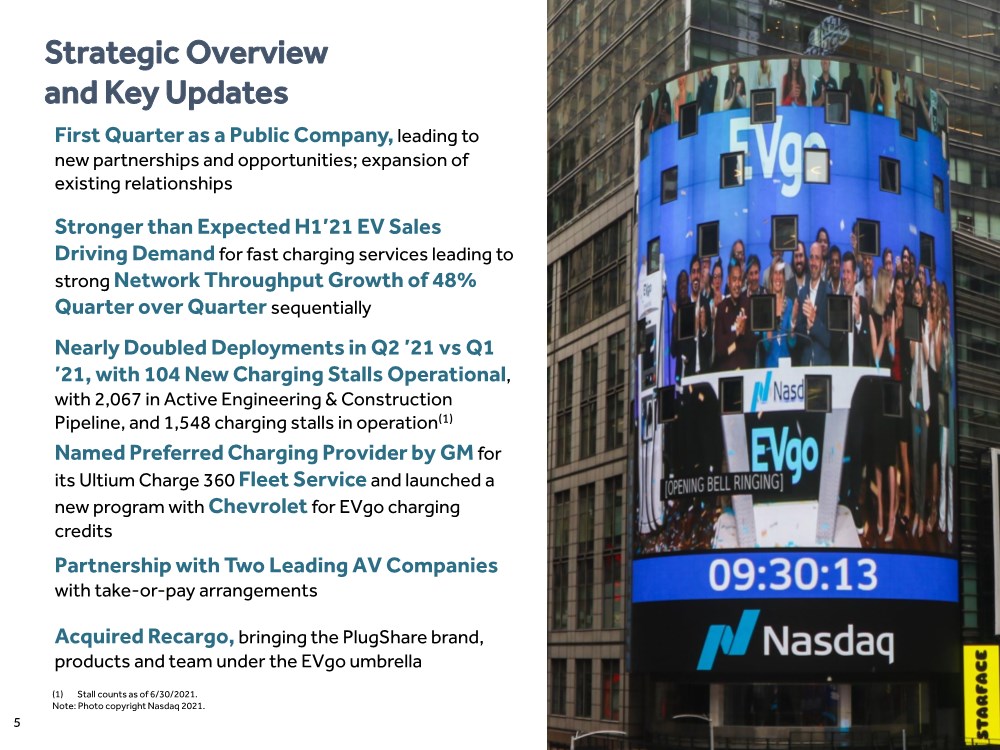
| Proprietary and Confidential - Do not Distribute Strong Pipeline with Robust Economics >2,000 Charging Stalls in Active Engineering and Construction Pipeline with ~85% of sites within a top-20 U.S. metro market and a majority part of EVgo’s partnership with GM to deploy over 2,700 fast charging stalls by 2025 Established ’Connect the Watts’ initiative: Working closely with industry stakeholders to accelerate end-to-end charging station development timetables Note: Pipeline as of 6/30/2021. 6 |
| Proprietary and Confidential - Do not Distribute 7 “Preferred Charging Provider” for GM’s Fleet Service July 2021 GM named Evgo a “Preferred Charging Provider” for its Ultium Charge 360 fleet service. Expands a key partnership and increases EVgo’s access to a key growth fleet segment Additionally, EVgo and Chevrolet launched a new program for vehicle owners to select a $500 EVgo charging credit Recent Strategic Highlights Partnership with Two Leading Autonomous Vehicle Companies EVgo contracted dedicated charging depots for AV partners, which are backed by take-or-pay arrangements These partnerships position EVgo as a leading charging provider in a high mileage segment whose dynamics continue to unfold |
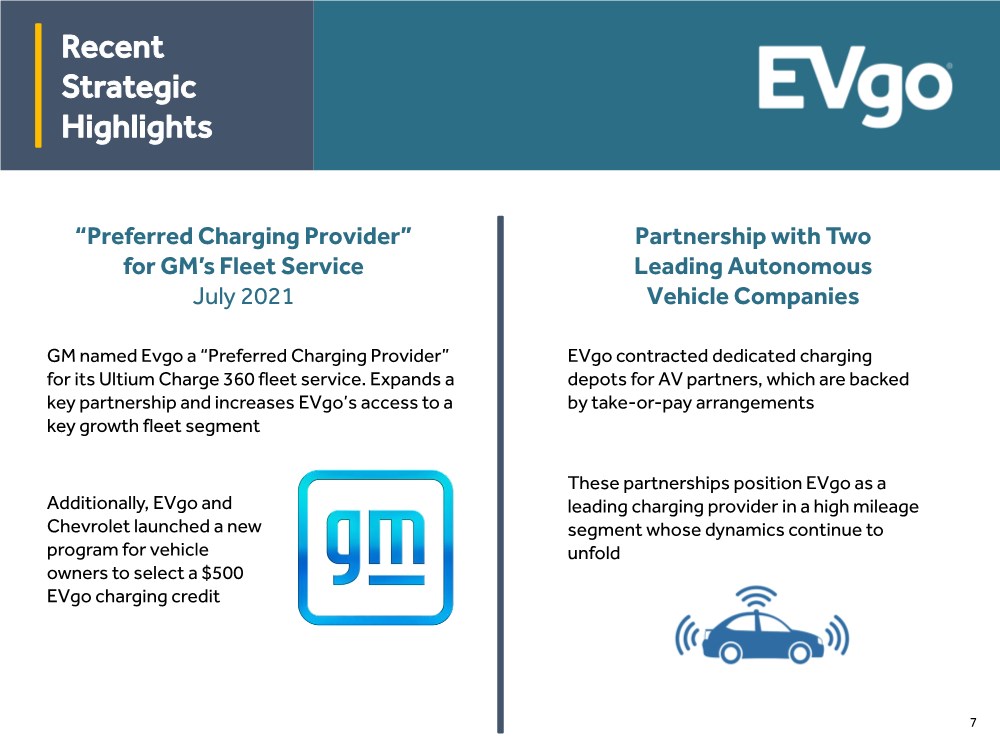
| Proprietary and Confidential - Do not Distribute 8 EVgo Innovation Lab Establishing Technical Leadership Testing, validating, and certifying charging equipment for customer experience, performance, and safety EVgo designs, prototypes, and tests new hardware and EVgo’s own new charger management software tools and user interfaces for both public and fleet uses Recent Strategic Highlights (cont’d) Acquired Recargo July 2021 Acquisition brings enhanced software offerings, customer reach, and product development pipeline into EVgo’s ecosystem PlugShare app has 1.6 million users worldwide and 3.3 million downloads, making it the largest EV community globally |
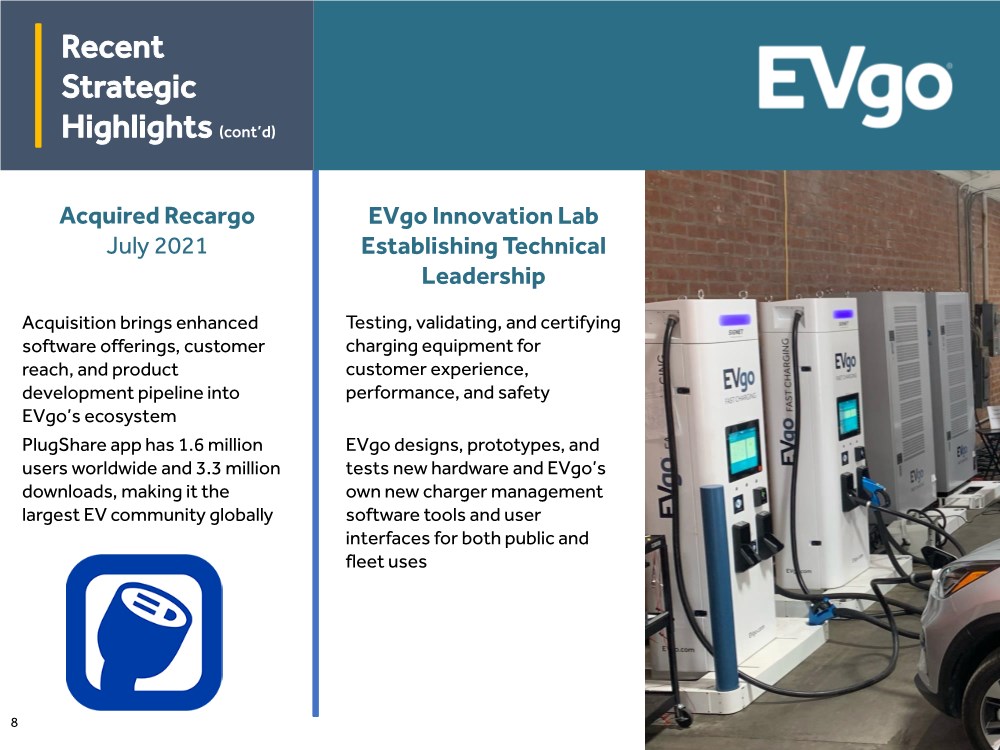
| Proprietary and Confidential - Do not Distribute Maximize Uptime Expand Customer Offerings Increase Revenues Decrease Costs and Risks Enhance Customer Experience Widen Competitive Moat Diversity, Equity and Inclusion The EVgo Business Flywheel is in Motion 9 |
| CONFIDENTIAL | 2 Financial Overview Olga Shevorenkova, CFO 10 |
| Proprietary and Confidential - Do not Distribute 11 Key Operational Highlights Expanding Customer Base with more than 275,000 customer accounts at the end of Q2 2021, driven by strong EV sales And Growing Network Throughput, 48% QoQ sequential growth, beat pre- COVID-19 levels, mostly driven by post- COVID-19 re-openings and accelerating EV adoption |
| Proprietary and Confidential - Do not Distribute 12 Quarterly Revenue Update ($ in ‘000s) • Revenue growth of 16% QoQ • Key drivers (re-opening economy, EV adoption) helped drive quarter results • H1 2021 revenue puts EVgo on track to hit full- year targets Capital Expenditures ($ in ‘000s) • Stall build-out continues to accelerate • H1’21 Capex more than tripled compared to H1’20 • Driven by execution on Active Engineering & Construction Pipeline $3,853 $2,957 $3,572 $4,194 $4,130 $4,783 Q1'20 Q2'20 Q3'20 Q4'20 Q1'21 Q2'21 $7,734 $23,341 H1'20 H1'21 Financial Highlights |
| Proprietary and Confidential - Do not Distribute 13 Quarterly Revenue, Margin and Cash Flow Update Financial Highlights (Cont.) • Revenue growth +16% QoQ as re-opening economy and EV adoption contributed • Gross Loss widened slightly as depreciation expense grew driven by more operational stalls • Adjusted Gross Margin showing meaningful improvement • COGS consists primarily of energy usage fees, depreciation and amortization expenses, site O&M expenses, customer service and network charges, warranty and repair services, and site lease and rental expense associated with charging equipment • Adjusted Gross Profit (Loss) is defined as Gross Profit (Loss) less : (i) depreciation and ARO accretion, (ii) stock option expense, and (iii) other non-recurring expenses • As such, Adjusted Gross Profit (Loss) does not only include energy usage fees which are fully variable costs but also fixed costs such as O&M expenses or site leases • Adjusted EBITDA Margin QoQ flat as hiring ramp offset throughput gains • Cash from operations major improvement H1’21 vs. H1’20 due to OEM partners $20mm contractual pre-payment in Q1 2021 • Capex more than tripled H1’21 vs. H1’20 as stall build-out accelerates 1. Adjusted Gross Profit / (Loss), Adjusted Gross Margin, Adjusted EBITDA, and Adjusted EBITDA Margin are non-GAAP measures and have not been prepared in accordance with generally accepted accounting principles in the United States of America (“GAAP”). For a definition of these non-GAAP measures and a reconciliation to the most directly comparable GAAP measure, please see “Definition of Non-GAAP Financial Measures” and “Reconciliations of Non-GAAP Measures” included elsewhere in this release. ($'000) unless indicated otherwise ($ in 000s) Q2'21 Q1'21 Q2'20 Network Throughput (GWh) 6.1 4.1 2.7 Revenue $4,783 $4,130 $2,957 GAAP COGS ($7,549) ($6,740) ($5,916) GAAP Gross (Loss) ($2,765) ($2,609) ($2,959) GAAP G&A Expenses ($12,247) ($11,073) ($6,796) GAAP Net (Loss) ($18,421) ($16,610) ($10,406) Adj. Gross (Loss)1 ($61) ($162) ($711) Adj. Gross Margin 1 (1.3%) (3.9%) (24.0%) Adj. EBITDA1 ($11,009) ($9,779) ($5,033) Adj. EBITDA Margin 1 (230.2%) (236.8%) (170.2%) H1'21 H1'20 Cash flow from operations ($1,357) ($15,757) Cash flow from investing ($23,341) ($7,734) |
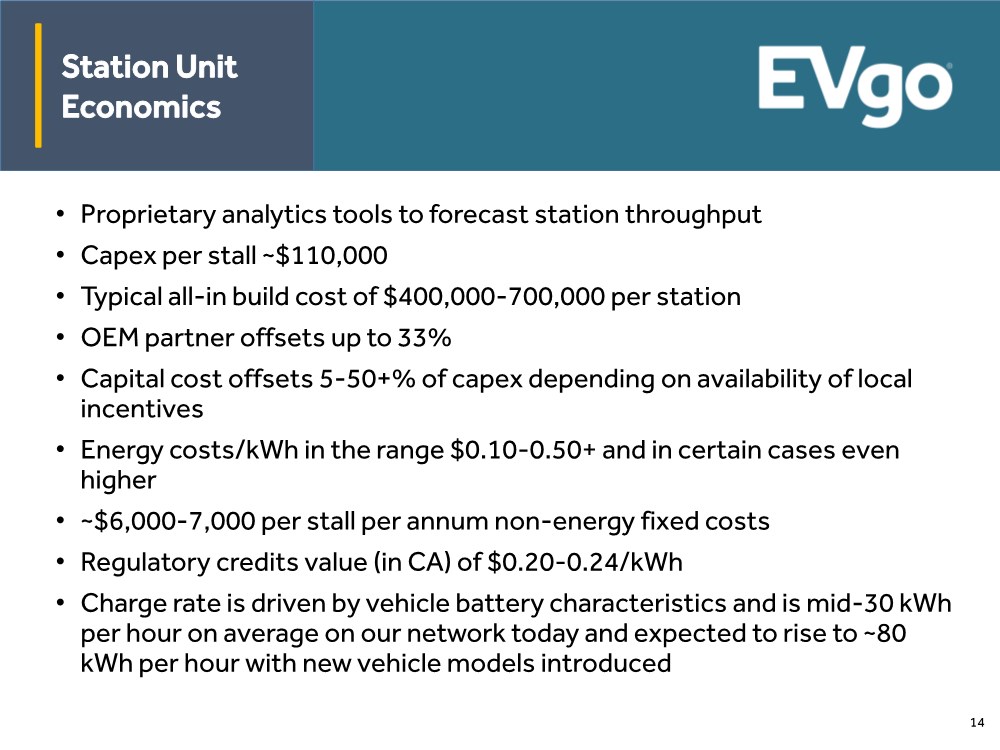
| Proprietary and Confidential - Do not Distribute 14 • Proprietary analytics tools to forecast station throughput • Capex per stall ~$110,000 • Typical all-in build cost of $400,000-700,000 per station • OEM partner offsets up to 33% • Capital cost offsets 5-50+% of capex depending on availability of local incentives • Energy costs/kWh in the range $0.10-0.50+ and in certain cases even higher • ~$6,000-7,000 per stall per annum non-energy fixed costs • Regulatory credits value (in CA) of $0.20-0.24/kWh • Charge rate is driven by vehicle battery characteristics and is mid-30 kWh per hour on average on our network today and expected to rise to ~80 kWh per hour with new vehicle models introduced Commentary Station Unit Economics |
| Proprietary and Confidential - Do not Distribute 15 2021 Guidance We are reaffirming key 2021 financial forecast figures: Key Metrics 2021 Guidance Network Thoughput 24 GWh Revenue $20 million Adj. EBITDA ($58 million) |
| Proprietary and Confidential - Do not Distribute 3 Appendix Reconciliation of Non- GAAP Measures to GAAP, Summary Financials 16 |
| Proprietary and Confidential - Do not Distribute 17 Reconciliation of Non-GAAP Measures to GAAP Actual EVgo - COGS Bridge ($000) Q1 2020 Q2 2020 Q3 2020 Q4 2020 Q1 2021 Q2 2021 GAAP COGS $6,396 $5,916 $6,954 $7,923 $6,740 $7,549 Less: Site Depreciation & ARO Accretion $2,095 $2,256 $2,651 $2,527 $2,447 $2,705 Stock Option Expense and Other 7 (8) (4) (4) (0) (1) Adjusted COGS $4,294 $3,668 $4,307 $5,399 $4,293 $4,844 Actual EVgo - Gross Profit / (Loss) Bridge ($000) Q1 2020 Q2 2020 Q3 2020 Q4 2020 Q1 2021 Q2 2021 GAAP Gross Profit / (Loss) ($2,543) ($2,959) ($3,382) ($3,729) ($2,609) ($2,765) Less: Site Depreciation & ARO Accretion $2,095 $2,256 $2,651 $2,527 $2,447 $2,705 Stock Option Expense and Other 7 (8) (4) (4) (0) (1) Adjusted Gross Profit / (Loss) ($441) ($711) ($735) ($1,205) ($162) ($61) |
| Proprietary and Confidential - Do not Distribute 18 Actual EVgo - Adj. EBITDA Bridge ($000) Q1 2020 Q2 2020 Q3 2020 Q4 2020 Q1 2021 Q2 2021 Net Income ($14,810) ($10,406) ($7,475) ($15,519) ($16,610) ($18,421) + Taxes $8 ($2) ($12) $8 –– + Depreciation, ARO, Amor. 4,202 4,707 5,126 4,999 4,957 5,251 + Interest Income / Expense 122 280 410 603 875 1,039 EBITDA ($10,478) ($5,421) ($1,952) ($9,910) ($10,778) ($12,132) + Bad Debt, Non-Recurring Costs, Other Adj. $5,783 $388 ($3,455) $1,089 $999 $1,123 Adj. EBITDA ($4,695) ($5,033) ($5,407) ($8,821) ($9,779) ($11,009) Reconciliation of Non-GAAP Measures to GAAP (cont’d) |
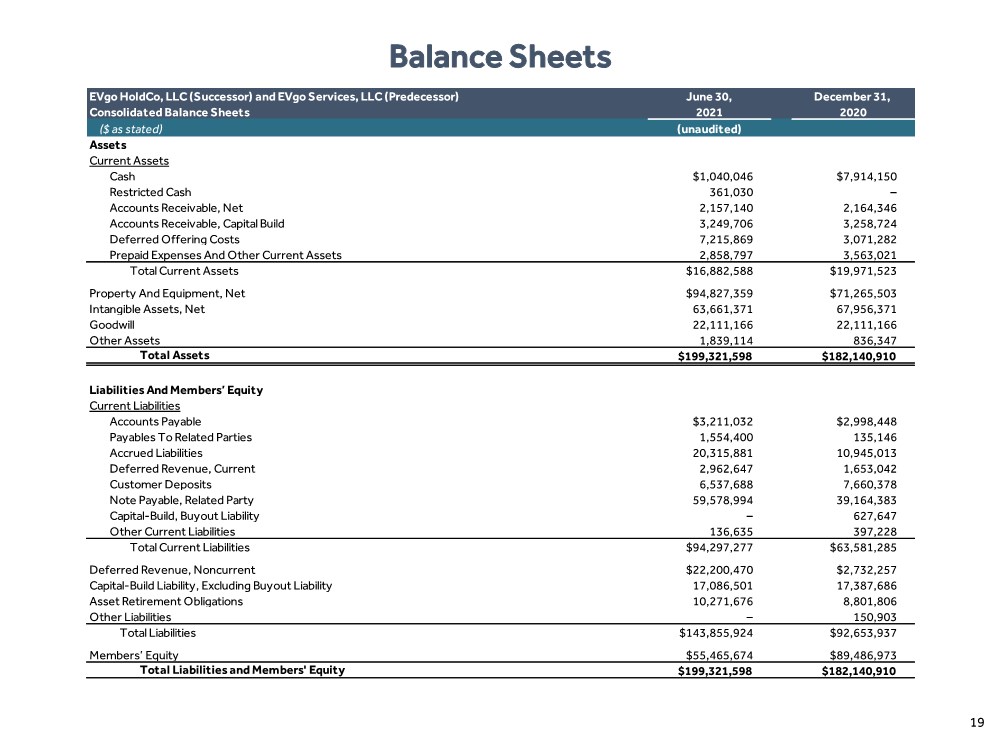
| Proprietary and Confidential - Do not Distribute 19 Balance Sheets EVgo HoldCo, LLC (Successor) and EVgo Services, LLC (Predecessor) June 30, December 31, Consolidated Balance Sheets 2021 2020 ($ as stated) (unaudited) Assets Current Assets Cash $1,040,046 $7,914,150 Restricted Cash 361,030 – Accounts Receivable, Net 2,157,140 2,164,346 Accounts Receivable, Capital Build 3,249,706 3,258,724 Deferred Offering Costs 7,215,869 3,071,282 Prepaid Expenses And Other Current Assets 2,858,797 3,563,021 Total Current Assets $16,882,588 $19,971,523 Property And Equipment, Net $94,827,359 $71,265,503 Intangible Assets, Net 63,661,371 67,956,371 Goodwill 22,111,166 22,111,166 Other Assets 1,839,114 836,347 Total Assets $199,321,598 $182,140,910 Liabilities And Members’ Equity Current Liabilities Accounts Payable $3,211,032 $2,998,448 Payables To Related Parties 1,554,400 135,146 Accrued Liabilities 20,315,881 10,945,013 Deferred Revenue, Current 2,962,647 1,653,042 Customer Deposits 6,537,688 7,660,378 Note Payable, Related Party 59,578,994 39,164,383 Capital-Build, Buyout Liability – 627,647 Other Current Liabilities 136,635 397,228 Total Current Liabilities $94,297,277 $63,581,285 Deferred Revenue, Noncurrent $22,200,470 $2,732,257 Capital-Build Liability, Excluding Buyout Liability 17,086,501 17,387,686 Asset Retirement Obligations 10,271,676 8,801,806 Other Liabilities – 150,903 Total Liabilities $143,855,924 $92,653,937 Members’ Equity $55,465,674 $89,486,973 Total Liabilities and Members' Equity $199,321,598 $182,140,910 |
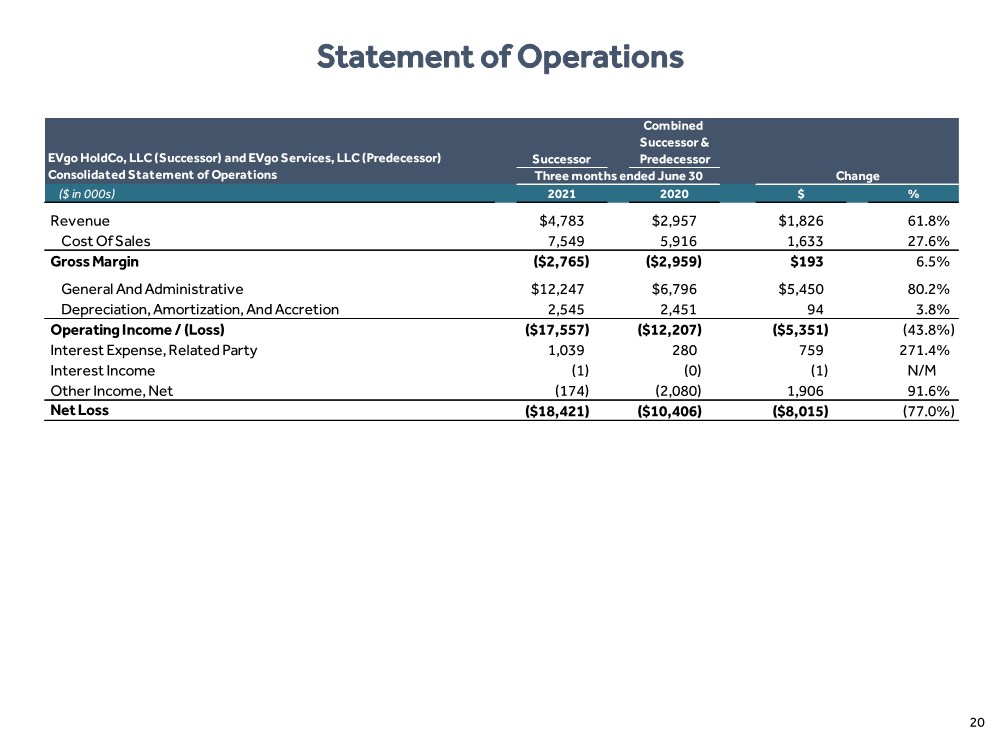
| Proprietary and Confidential - Do not Distribute 20 Statement of Operations Combined Successor & EVgo HoldCo, LLC (Successor) and EVgo Services, LLC (Predecessor) Successor Predecessor Consolidated Statement of Operations Three months ended June 30 Change ($ in 000s) 2021 2020 $ % Revenue $4,783 $2,957 $1,826 61.8% Cost Of Sales 7,549 5,916 1,633 27.6% Gross Margin ($2,765) ($2,959) $193 6.5% General And Administrative $12,247 $6,796 $5,450 80.2% Depreciation, Amortization, And Accretion 2,545 2,451 94 3.8% Operating Income / (Loss) ($17,557) ($12,207) ($5,351) (43.8%) Interest Expense, Related Party 1,039 280 759 271.4% Interest Income (1) (0) (1) N/M Other Income, Net (174) (2,080) 1,906 91.6% Net Loss ($18,421) ($10,406) ($8,015) (77.0%) |
| Proprietary and Confidential - Do not Distribute 21 Cash Flow Statement Successor Predecessor (unaudited) January 16, January 1, six months 2020 2020 EVgo HoldCo, LLC (Successor) and EVgo Services, LLC (Predecessor) ended through through Consolidated Cash Flow Statement June 30, June 30, January 15, ($ as stated) 2021 2020 2020 Cash flows from operating activities Net loss ($35,031,618) ($24,795,323) ($420,865) Adjustments to reconcile net loss to net cash provided by (used in) operating activities Depreciation, amortization, and accretion $10,207,361 $8,540,764 $367,659 Net loss on disposal of property and equipment 346,628 295,153 – Share based compensation 1,010,319 451,638 12,733 Interest on note payable, related party 1,914,611 401,561 – Other 96,577 104,286 – Changes in operating assets and liabilities Accounts receivable, net (160,782) 527,387 32,963 Receivables from related parties ––(333,527) Prepaid expenses and other current and noncurrent assets 278,822 852,103 (45,882) Accounts payable (1,338,931) (549,195) 315,011 Accrued expenses 1,284,507 (788,978) (247,585) Deferred revenue 20,777,818 (252,562) (36,866) Customer deposits (1,122,690) (306,966) 12,538 Payables to related parties 1,419,254 140,483 (1,031) Other current and noncurrent liabilities (1,039,143) (32,704) – Net cash provided by (used in) operating activities ($1,357,267) ($15,412,353) ($344,852) Cash flows from investing activities Purchases of property and equipment ($23,340,749) ($7,568,384) ($165,608) Net cash used in investing activities ($23,340,749) ($7,568,384) ($165,608) Cash flows from financing activities Proceeds from note payable, related party $24,000,000 $20,750,000 – Payments on note payable, related party (5,500,000) –– Capital-build funding, net 1,337,030 2,933,067 – Payment of deferred offering costs (1,652,088) –– Contributions – 5,316,124 – Net cash provided by financing activities $18,184,942 $28,999,191 – Net (decrease) increase in cash ($6,513,074) $6,018,454 ($510,460) Cash, beginning of period 7,914,150 257,288 1,403,172 Cash and restricted cash, end of period $1,401,076 $6,275,742 $892,712 |