
EXC 8-K
Exelon Corp (EXC)
8-K
2020-05-08
For: 2020-05-08
View Original
Added on
April 03, 2026
UNITED STATES SECURITIES AND EXCHANGE COMMISSION | |||
Washington, D.C. 20549 | |||
FORM | |||
CURRENT REPORT | ||
Pursuant to Section 13 or 15(d) of the Securities Exchange Act of 1934 | ||
Date of Report (Date of earliest event reported) | ||
Commission File Number | Name of Registrant; State or Other Jurisdiction of Incorporation; Address of Principal Executive Offices; and Telephone Number | IRS Employer Identification Number | ||
(a Pennsylvania corporation) 10 South Dearborn Street P.O. Box 805379 Chicago, Illinois 60680-5379 (800) 483-3220 | ||||
(a Pennsylvania limited liability company) 300 Exelon Way Kennett Square, Pennsylvania 19348-2473 (610) 765-5959 | ||||
(an Illinois corporation) 440 South LaSalle Street Chicago, Illinois 60605-1028 (312) 394-4321 | ||||
(a Pennsylvania corporation) P.O. Box 8699 2301 Market Street Philadelphia, Pennsylvania 19101-8699 (215) 841-4000 | ||||
(a Maryland corporation) 2 Center Plaza 110 West Fayette Street Baltimore, Maryland 21201-3708 (410) 234-5000 | ||||
(a Delaware limited liability company) 701 Ninth Street, N.W. Washington, District of Columbia 20068 (202) 872-2000 | ||||
(a District of Columbia and Virginia corporation) 701 Ninth Street, N.W. Washington, District of Columbia 20068 (202) 872-2000 | ||||
(a Delaware and Virginia corporation) 500 North Wakefield Drive Newark, Delaware 19702 (202) 872-2000 | ||||
(a New Jersey corporation) 500 North Wakefield Drive Newark, Delaware 19702 (202) 872-2000 | ||||
Check the appropriate box below if the Form 8-K filing is intended to simultaneously satisfy the filing obligation of the registrant under any of the following provisions: | |
Written communications pursuant to Rule 425 under the Securities Act (17 CFR 230.425) | |
Soliciting material pursuant to Rule 14a-12 under the Exchange Act (17 CFR 240.14a-12) | |
Pre-commencement communications pursuant to Rule 14d-2(b) under the Exchange Act (17 CFR 240.14d-2(b)) | |
Pre-commencement communications pursuant to Rule 13e-4(c) under the Exchange Act (17 CFR 240.13e-4(c)) | |
Securities registered pursuant to Section 12(b) of the Act: | ||||
Title of each class | Trading Symbol(s) | Name of each exchange on which registered | ||
EXELON CORPORATION: | ||||
Common Stock, without par value | EXC | The Nasdaq Stock Market LLC | ||
PECO ENERGY COMPANY: | ||||
Trust Receipts of PECO Energy Capital Trust III, each representing a 7.38% Cumulative Preferred Security, Series D, $25 stated value, issued by PECO Energy Capital, L.P. and unconditionally guaranteed by PECO Energy Company | EXC/28 | New York Stock Exchange | ||
Indicate by check mark whether any of the registrants are emerging growth companies as defined in Rule 405 of the Securities Act of 1933 (§230.405 of this chapter) or Rule 12b-2 of the Securities Exchange Act of 1934 (§240.12b-2 of this chapter). | |
Emerging growth company | |
If an emerging growth company, indicate by check mark if any of the registrants have elected not to use the extended transition period for complying with any new or revised financial accounting standards provided pursuant to Section 13(a) of the Exchange Act. |
☐ |
Section 2 - Financial Information
Item 2.02. Results of Operations and Financial Condition.
Section 7 - Regulation FD
Item 7.01. Regulation FD Disclosure.
On May 8, 2020, Exelon Corporation (Exelon) announced via press release its results for the first quarter ended March 31, 2020. A copy of the press release and related attachments is attached hereto as Exhibit 99.1. Also attached as Exhibit 99.2 to this Current Report on Form 8-K are the presentation slides to be used at the first quarter 2020 earnings conference call. This Form 8-K and the attached exhibits are provided under Items 2.02, 7.01 and 9.01 of Form 8-K and are furnished to, but not filed with, the Securities and Exchange Commission.
Exelon has scheduled the conference call for 9:00 AM CT (10:00 AM ET) on May 8, 2020. The call-in number in the U.S. and Canada is 855-982-8076. If requested, the conference ID number is 2969489. Media representatives are invited to participate on a listen-only basis. The call will be webcast and archived on the Investor Relations page of Exelon’s website: www.exeloncorp.com.
Section 9 - Financial Statements and Exhibits
Item 9.01. Financial Statements and Exhibits
(d) Exhibits.
Exhibit No. | Description |
101 | Cover Page Interactive Data File - the cover page XBRL tags are embedded within the Inline XBRL document. |
104 | The cover page from the Current Report on Form 8-K, formatted as Inline XBRL. |
* * * * *
This combined Current Report on Form 8-K is being furnished separately by Exelon, Exelon Generation Company, LLC, Commonwealth Edison Company, PECO Energy Company, Baltimore Gas and Electric Company, Pepco Holdings LLC, Potomac Electric Power Company, Delmarva Power & Light Company, and Atlantic City Electric Company (Registrants). Information contained herein relating to any individual Registrant has been furnished by such Registrant on its own behalf. No Registrant makes any representation as to information relating to any other Registrant.
This report contains certain forward-looking statements within the meaning of the Private Securities Litigation Reform Act of 1995 that are subject to risks and uncertainties, including, among others, statements related to the expected or potential impact of the novel coronavirus (COVID-19) pandemic, and the related responses of various governments and regulatory bodies, customers, and the company, on our business, financial condition and results of operations, and any such forward-looking statements, whether concerning the COVID-19 pandemic or otherwise, involve risks, assumptions and uncertainties. Words such as “could,” “may,” “expects,” “anticipates,” “will,” “targets,” “goals,” “projects,” “intends,” “plans,” “believes,” “seeks,” “estimates,” “predicts,” and variations on such words, and similar expressions that reflect our current views with respect to future events and operational, economic and financial performance, are intended to identify such forward-looking statements.
The factors that could cause actual results to differ materially from the forward-looking statements made by the Registrants include those factors discussed herein, as well as the items discussed in (1) the Registrants' 2019 Annual Report on Form 10-K in (a) Part I, ITEM 1A. Risk Factors, (b) Part II, ITEM 7. Management’s Discussion and Analysis of Financial Condition and Results of Operations and (c) Part II, ITEM 8. Financial Statements and Supplementary Data: Note 18, Commitments and Contingencies; (2) the Registrants' First Quarter 2020 Quarterly Report on Form 10-Q (to be filed on May 8, 2020) in (a) Part II, ITEM 1A. Risk Factors; (b) Part I, ITEM 2. Management’s Discussion
and Analysis of Financial Condition and Results of Operations and (c) Part I, ITEM 1. Financial Statements: Note 14, Commitments and Contingencies; and (3) other factors discussed in filings with the SEC by the Registrants.
Investors are cautioned not to place undue reliance on these forward-looking statements, whether written or oral, which apply only as of the date of this report. None of the Registrants undertakes any obligation to publicly release any revision to its forward-looking statements to reflect events or circumstances after the date of this report.
SIGNATURES
Pursuant to the requirements of the Securities Exchange Act of 1934, each Registrant has duly caused this report to be signed on its behalf by the undersigned hereunto duly authorized.
EXELON CORPORATION | |
/s/ Joseph Nigro | |
Joseph Nigro | |
Senior Executive Vice President and Chief Financial Officer | |
Exelon Corporation | |
EXELON GENERATION COMPANY, LLC | |
/s/ Bryan P. Wright | |
Bryan P. Wright | |
Senior Vice President and Chief Financial Officer | |
Exelon Generation Company, LLC | |
COMMONWEALTH EDISON COMPANY | |
/s/ Jeanne M. Jones | |
Jeanne M. Jones | |
Senior Vice President, Chief Financial Officer and Treasurer | |
Commonwealth Edison Company | |
PECO ENERGY COMPANY | |
/s/ Robert J. Stefani | |
Robert J. Stefani | |
Senior Vice President, Chief Financial Officer and Treasurer | |
PECO Energy Company | |
BALTIMORE GAS AND ELECTRIC COMPANY | |
/s/ David M. Vahos | |
David M. Vahos | |
Senior Vice President, Chief Financial Officer and Treasurer | |
Baltimore Gas and Electric Company | |
PEPCO HOLDINGS LLC | |
/s/ Phillip S. Barnett | |
Phillip S. Barnett | |
Senior Vice President, Chief Financial Officer and Treasurer | |
Pepco Holdings LLC | |
POTOMAC ELECTRIC POWER COMPANY | |
/s/ Phillip S. Barnett | |
Phillip S. Barnett | |
Senior Vice President, Chief Financial Officer and Treasurer | |
Potomac Electric Power Company | |
DELMARVA POWER & LIGHT COMPANY | |
/s/ Phillip S. Barnett | |
Phillip S. Barnett | |
Senior Vice President, Chief Financial Officer and Treasurer | |
Delmarva Power & Light Company | |
ATLANTIC CITY ELECTRIC COMPANY | |
/s/ Phillip S. Barnett | |
Phillip S. Barnett | |
Senior Vice President, Chief Financial Officer and Treasurer | |
Atlantic City Electric Company | |
May 8, 2020
EXHIBIT INDEX
Exhibit No. | Description |
101 | Cover Page Interactive Data File - the cover page XBRL tags are embedded within the Inline XBRL document. |
104 | The cover page from the Current Report on Form 8-K, formatted as Inline XBRL. |
Exhibit 99.1
News Release

Contact: | Paul Adams Corporate Communications 202-637-0317 Emily Duncan Investor Relations 312-394-2345 | |
EXELON REPORTS FIRST QUARTER 2020 RESULTS
Earnings Release Highlights
• | GAAP Net Income of $0.60 per share and Adjusted (non-GAAP) Operating Earnings of $0.87 per share for the first quarter of 2020 |
• | Revising range for full year 2020 adjusted (non-GAAP) operating earnings guidance to $2.80-$3.10 per share from original guidance of $3.00-$3.30 per share |
• | Strong utility reliability performance - every utility achieved top quartile in outage frequency and outage duration |
• | Generations’ nuclear fleet capacity factor was 93.9% for the quarter, ahead of the industry average of 91% (based on full year 2019) |
CHICAGO (May 8, 2020) — Exelon Corporation (Nasdaq: EXC) today reported its financial results for the first quarter of 2020.
“We had another strong quarter, with each of our utilities achieving high reliability performance and our nuclear fleet completing seven of eight refueling outages - nearly all shorter than planned,” said Christopher M. Crane, president and CEO of Exelon. “The consistent performance of our frontline employees in providing safe and reliable service has never been more evident as we all confront the global pandemic and the devastating disruption to our economy. In recognition of these extraordinary circumstances, we are supporting customers experiencing financial hardship by suspending disconnections, waiving new late charges and reconnecting customers on request. We remain on track to invest $26 billion across our utilities to further improve reliability and customer service, and we have contributed more than $5.9 million to national and local organizations to provide immediate relief to communities affected by COVID-19.”
“Despite experiencing one of the warmest winters on record and significant erosion of demand as a result of the pandemic, we reported solid adjusted (non-GAAP) earnings of 0.87 per share, coming in just below the midpoint of our guidance range,” said Joseph Nigro, senior executive vice president and CFO of Exelon. “We identified an additional $250 million in cost savings and lowered capital expenditures at Exelon Generation by $125 million. However, even with these and other actions, the unprecedented slowdown in economic activity and unpredictable nature of the recovery has led us to lower our full-year earnings guidance from $3.00-$3.30 per share to $2.80-$3.10 per share. We will continue to look for ways to improve our earnings and cash flow this year.”
1
First Quarter 2020
Exelon's GAAP Net Income for the first quarter of 2020 decreased to $0.60 per share from $0.93 per share in the first quarter of 2019. Adjusted (non-GAAP) Operating Earnings remained consistent at $0.87 per share in both the first quarter of 2020 and 2019. For the reconciliations of GAAP Net Income to Adjusted (non-GAAP) Operating Earnings, refer to the tables beginning on page 5.
Adjusted (non-GAAP) Operating Earnings in the first quarter of 2020 primarily reflect:
• | Lower utility earnings primarily due to unfavorable weather conditions at PECO and PHI and lower allowed electric distribution ROE due to a decrease in treasury rates at ComEd, partially offset by regulatory rate increases at BGE and PHI and distribution formula rate timing at ComEd; and |
• | Higher Generation earnings due to increased revenue from ZECs in New Jersey, lower operating and maintenance expense, and an income tax settlement, partially offset by lower realized energy prices, lower capacity revenues and increased nuclear outage days. |
Operating Company Results1
ComEd
ComEd's first quarter of 2020 GAAP Net Income and Adjusted (non-GAAP) Operating Earnings increased to $168 million from $157 million in the first quarter of 2019, primarily due to distribution formula rate timing partially offset by lower allowed electric distribution ROE due to a decrease in treasury rates. Due to revenue decoupling, ComEd's distribution earnings are not affected by actual weather or customer usage patterns.
PECO
PECO’s first quarter of 2020 GAAP Net Income decreased to $140 million from $168 million in the first quarter of 2019. PECO’s Adjusted (non-GAAP) Operating Earnings for the first quarter of 2020 decreased to $140 million from $169 million in the first quarter of 2019, primarily due to unfavorable weather conditions.
BGE
BGE’s first quarter of 2020 GAAP Net Income increased to $181 million from $160 million in the first quarter of 2019. BGE’s Adjusted (non-GAAP) Operating Earnings for the first quarter of 2020 increased to $182 million from $161 million compared with the first quarter of 2019, primarily due to regulatory rate increases. Due to revenue decoupling, BGE's distribution earnings are not affected by actual weather or customer usage patterns.
PHI
PHI’s first quarter of 2020 GAAP Net Income decreased to $108 million from $117 million in the first quarter of 2019. PHI’s Adjusted (non-GAAP) Operating Earnings for the first quarter of 2020 decreased to $110 million from $118 million in the first quarter of 2019, primarily due to unfavorable weather conditions in Delaware and New Jersey, partially offset by regulatory rate increases. Due to revenue decoupling, PHI's distribution earnings related to Pepco Maryland, DPL Maryland and Pepco District of Columbia are not affected by actual weather or customer usage patterns.
___________
1Exelon’s five business units include ComEd, which consists of electricity transmission and distribution operations in northern Illinois; PECO, which consists of electricity transmission and distribution operations and retail natural gas distribution operations in southeastern Pennsylvania; BGE, which consists of electricity transmission and distribution operations and retail natural gas distribution operations in central Maryland; PHI, which consists of electricity transmission and distribution operations in the District of Columbia and portions of Maryland, Delaware, and New Jersey and retail natural gas distribution operations in northern Delaware; and Generation, which consists of owned and contracted electric generating facilities and wholesale and retail customer supply of electric and natural gas products and services, including renewable energy products and risk management services.
2
Generation
Generation's first quarter of 2020 GAAP Net Income decreased to $45 million from $363 million in the first quarter of 2019. Generation’s Adjusted (non-GAAP) Operating Earnings for the first quarter of 2020 increased to $312 million from $294 million in the first quarter of 2019, primarily due to increased revenue from ZECs in New Jersey, lower operating and maintenance expense and an income tax settlement, partially offset by lower realized energy prices, lower capacity revenues and increased nuclear outage days.
As of March 31, 2020, the percentage of expected generation hedged is 89%-92% and 70%-73% for 2020 and 2021, respectively.
Recent Developments and First Quarter Highlights
• | COVID-19: Exelon is closely monitoring developments related to the global outbreak (pandemic) of the 2019 novel coronavirus (COVID-19) pandemic and is taking proactive measures to protect the health and safety of employees, contractors and customers. As a provider of critical resources, Exelon has robust plans and contingencies in place to ensure business and operational continuity across a wide range of potentially disruptive events, including extensive preparedness for major public health crises. Exelon and its operating companies are working in close coordination with designated state and local emergency preparedness and health officials, and at the federal level through the Electric Subsector Coordinating Council. All Exelon employees have access to up-to-date information and resources and are following Centers for Disease Control guidelines to ensure safety. In addition, Exelon utilities have established incident command centers to address emergent customer and employee needs in real time. |
While there was no material impact to Exelon’s financial statements for the first quarter of 2020 due to COVID-19, PECO, DPL Delaware, ACE and Generation expect a reduction in operating revenues for the nine months ending December 31, 2020 due to expected reduction in electric load. There remains significant uncertainty in the economic forecast for the remainder of the year and its impact on Exelon’s operating revenues. However, Exelon identified and is pursuing approximately $250 million in cost savings across its operating companies to offset part of the expected unfavorable impacts on operating revenues.
• | ComEd Distribution Formula Rate: On April 16, 2020, ComEd filed its annual distribution formula rate update with the Illinois Commerce Commission (ICC). The ICC approval is due by December 2020 and the rates will take effect in January 2021. The filing request includes a total decrease to the revenue requirement of $11 million, reflecting an increase of $51 million for the initial revenue requirement for 2020 and a decrease of $62 million related to the annual reconciliation for 2019. The revenue requirement for 2020 and annual reconciliation for 2019 provide for a weighted average debt and equity return on distribution rate base of 6.28% inclusive of a requested ROE of 8.38%. |
• | DPL Delaware Gas Base Rate Case: On Feb. 21, 2020, DPL Delaware filed an application with the Delaware Public Service Commission (DPSC) to increase its annual gas distribution rates by $9 million, reflecting an ROE of 10.3%. DPL currently expects a decision in the first quarter of 2021 but cannot predict if the DPSC will approve the application as filed. |
• | DPL Delaware Electric Base Rate Case: On March 6, 2020, DPL Delaware filed an application with the DPSC to increase its annual electric distribution rates by $24 million, reflecting an ROE of 10.3%. DPL currently expects a decision in the first quarter of 2021 but cannot predict if the DPSC will approve the application as filed. |
3
• | Nuclear Operations: Generation’s nuclear fleet, including its owned output from the Salem Generating Station and 100% of the CENG units, produced 42,555 gigawatt-hours (GWhs) in the first quarter of 2020, compared with 45,715 GWhs in the first quarter of 2019. Excluding Salem, the Exelon-operated nuclear plants at ownership achieved a 93.9% capacity factor for the first quarter of 2020, compared with 97.1% for the first quarter of 2019. The number of planned refueling outage days in the first quarter of 2020 totaled 94, compared with 74 in the first quarter of 2019. There were 11 non-refueling outage days in the first quarter of 2020 and none in the first quarter of 2019. |
• | Fossil and Renewables Operations: The Dispatch Match rate for Generation’s fossil and hydro fleet was 98.2% in the first quarter of 2020, compared with 97.8% in the first quarter of 2019. Energy Capture for the wind and solar fleet was 94.7% in the first quarter of 2020, compared with 96.5% in the first quarter of 2019. |
• | Financing Activities: |
◦ | On April 1, 2020, Exelon Corporate issued notes for $1.25 billion at 4.05%, which are due in 2030 and notes for $750 million at 4.70%, which are due in 2050. A portion of the net proceeds from the sale of these notes, together with available cash balances, will be used to repay Exelon Corporate notes maturing in June of 2020. The remainder of the net proceeds will be used for general corporate purposes. |
◦ | On Feb. 25, 2020, ComEd issued $350 million of its First Mortgage Bonds, 2.20% Series due March 1, 2030 and $650 million of its First Mortgage Bonds, 3.00% Series due March 1, 2050. ComEd used the proceeds to repay a portion of outstanding commercial paper obligations and for general corporate purposes. |
◦ | On Feb. 25, 2020, Pepco issued $150 million of its First Mortgage Bonds, 2.53% Series due Feb. 25, 2030. Pepco used the proceeds to repay existing indebtedness and for general corporate purposes. |
◦ | On March 19, 2020, Generation entered into a term loan agreement for $200 million. The loan agreement has an expiration of March 18, 2021. Pursuant to the loan agreement, loans made thereunder bear interest at a variable rate equal to LIBOR plus 0.50% and all indebtedness thereunder is unsecured. |
◦ | On March 31, 2020, Generation entered into a term loan agreement for $300 million. The loan agreement has an expiration of March 30, 2021. Pursuant to the loan agreement, loans made thereunder bear interest at a variable rate equal to LIBOR plus 0.75% and all indebtedness thereunder is unsecured. |
◦ | On April 8, 2020, NewEnergy Receivables LLC, a bankruptcy remote, special purpose entity, which is wholly owned by Generation, entered into an accounts receivable financing facility with a number of financial institutions and a commercial paper conduit to sell certain customer accounts receivables. Generation received approximately $500 million of cash in accordance with the initial sale of approximately $1.2 billion receivables. |
4
GAAP/Adjusted (non-GAAP) Operating Earnings Reconciliation
Adjusted (non-GAAP) Operating Earnings for the first quarter of 2020 do not include the following items (after tax) that were included in reported GAAP Net Income:
(in millions) | Exelon Earnings per Diluted Share | Exelon | ComEd | PECO | BGE | PHI | Generation | ||||||||||||||
2020 GAAP Net Income | $ | 0.60 | $ | 582 | $ | 168 | $ | 140 | $ | 181 | $ | 108 | $ | 45 | |||||||
Mark-to-Market Impact of Economic Hedging Activities (net of taxes of $32 and $33, respectively) | (0.10 | ) | (94 | ) | — | — | — | — | (97 | ) | |||||||||||
Unrealized Losses Related to Nuclear Decommissioning Trust (NDT) Fund Investments (net of taxes of $405) | 0.50 | 485 | — | — | — | — | 485 | ||||||||||||||
Asset Impairments (net of taxes of $1) | — | 2 | — | — | — | — | 2 | ||||||||||||||
Plant Retirements and Divestitures (net of taxes of $4) | 0.01 | 13 | — | — | — | — | 13 | ||||||||||||||
Cost Management Program (net of taxes of $3, $0, $1 and $3, respectively) | 0.01 | 9 | — | — | 1 | 2 | 8 | ||||||||||||||
Income Tax-Related Adjustments (entire amount represents tax expense) | — | (2 | ) | — | — | — | — | — | |||||||||||||
Noncontrolling Interests (net of taxes of $30) | (0.15 | ) | (144 | ) | — | — | — | — | (144 | ) | |||||||||||
2020 Adjusted (non-GAAP) Operating Earnings | $ | 0.87 | $ | 851 | $ | 168 | $ | 140 | $ | 182 | $ | 110 | $ | 312 | |||||||
5
Adjusted (non-GAAP) Operating Earnings for the first quarter of 2019 do not include the following items (after tax) that were included in reported GAAP Net Income:
(in millions) | Exelon Earnings per Diluted Share | Exelon | ComEd | PECO | BGE | PHI | Generation | ||||||||||||||
2019 GAAP Net Income | $ | 0.93 | $ | 907 | $ | 157 | $ | 168 | $ | 160 | $ | 117 | $ | 363 | |||||||
Mark-to-Market Impact of Economic Hedging Activities (net of taxes of $12 and $10, respectively) | 0.03 | 31 | — | — | — | — | 26 | ||||||||||||||
Unrealized Gains Related to NDT Fund Investments (net of taxes of $161) | (0.20 | ) | (193 | ) | — | — | — | — | (193 | ) | |||||||||||
Asset Impairments (net of taxes of $1) | — | 4 | — | — | — | — | 4 | ||||||||||||||
Plant Retirements and Divestitures (net of taxes of $6) | 0.02 | 19 | — | — | — | — | 19 | ||||||||||||||
Cost Management Program (net of taxes of $3, $0, $0, $0 and $3, respectively) | 0.01 | 11 | — | 1 | 1 | 1 | 8 | ||||||||||||||
Noncontrolling Interests (net of taxes of $13) | 0.07 | 67 | — | — | — | — | 67 | ||||||||||||||
2019 Adjusted (non-GAAP) Operating Earnings | $ | 0.87 | $ | 846 | $ | 157 | $ | 169 | $ | 161 | $ | 118 | $ | 294 | |||||||
Note:
Amounts may not sum due to rounding.
Unless otherwise noted, the income tax impact of each reconciling item between GAAP Net Income and Adjusted (non-GAAP) Operating Earnings is based on the marginal statutory federal and state income tax rates for each Registrant, taking into account whether the income or expense item is taxable or deductible, respectively, in whole or in part. For all items except the unrealized gains and losses related to NDT fund investments, the marginal statutory income tax rates for 2020 and 2019 ranged from 26.0% to 29.0%. Under IRS regulations, NDT fund investment returns are taxed at different rates for investments if they are in qualified or non-qualified funds. The effective tax rates for the unrealized gains and losses related to NDT fund investments were 45.5% and 45.4% for the three months ended March 31, 2020 and 2019, respectively.
Webcast Information
Exelon will discuss first quarter 2020 earnings in a one-hour conference call scheduled for today at 9 a.m. Central Time (10 a.m. Eastern Time). The webcast and associated materials can be accessed at www.exeloncorp.com/investor-relations.
6
About Exelon
Exelon Corporation (Nasdaq: EXC) is a Fortune 100 energy company with the largest number of electricity and natural gas customers in the U.S. Exelon does business in 48 states, the District of Columbia and Canada and had 2019 revenue of $34 billion. Exelon serves approximately 10 million customers in Delaware, the District of Columbia, Illinois, Maryland, New Jersey and Pennsylvania through its Atlantic City Electric, BGE, ComEd, Delmarva Power, PECO and Pepco subsidiaries. Exelon is one of the largest competitive U.S. power generators, with more than 31,000 megawatts of nuclear, gas, wind, solar and hydroelectric generating capacity comprising one of the nation’s cleanest and lowest-cost power generation fleets. The company’s Constellation business unit provides energy products and services to approximately 2 million residential, public sector and business customers, including three fourths of the Fortune 100. Follow Exelon on Twitter @Exelon.
Non-GAAP Financial Measures
In addition to net income as determined under generally accepted accounting principles in the United States (GAAP), Exelon evaluates its operating performance using the measure of Adjusted (non-GAAP) Operating Earnings because management believes it represents earnings directly related to the ongoing operations of the business. Adjusted (non-GAAP) Operating Earnings exclude certain costs, expenses, gains and losses and other specified items. This measure is intended to enhance an investor’s overall understanding of period over period operating results and provide an indication of Exelon’s baseline operating performance excluding items that are considered by management to be not directly related to the ongoing operations of the business. In addition, this measure is among the primary indicators management uses as a basis for evaluating performance, allocating resources, setting incentive compensation targets and planning and forecasting of future periods. Adjusted (non-GAAP) Operating Earnings is not a presentation defined under GAAP and may not be comparable to other companies’ presentation. The Company has provided the non-GAAP financial measure as supplemental information and in addition to the financial measures that are calculated and presented in accordance with GAAP. Adjusted (non-GAAP) Operating Earnings should not be deemed more useful than, a substitute for, or an alternative to the most comparable GAAP Net Income measures provided in this earnings release and attachments. This press release and earnings release attachments provide reconciliations of Adjusted (non-GAAP) Operating Earnings to the most directly comparable financial measures calculated and presented in accordance with GAAP, are posted on Exelon’s website: www.exeloncorp.com, and have been furnished to the Securities and Exchange Commission on Form 8-K on May 8, 2020.
Cautionary Statements Regarding Forward-Looking Information
This press release contains certain forward-looking statements within the meaning of the Private Securities Litigation Reform Act of 1995 that are subject to risks and uncertainties including among others those related to the expected or potential impact of the novel coronavirus (COVID-19) pandemic, and the related responses of various governments and regulatory bodies, our customers, and the company, on our business, financial condition and results of operations; any such forward-looking statements, whether concerning the COVID-19 pandemic or otherwise, involve risks, assumptions and uncertainties. Words such as “could,” “may,” “expects,” “anticipates,” “will,” “targets,” “goals,” “projects,” “intends,” “plans,” “believes,” “seeks,” “estimates,” “predicts,” and variations on such words, and similar expressions that reflect our current views with respect to future events and operational, economic and financial performance, are intended to identify such forward-looking statements.
The factors that could cause actual results to differ materially from the forward-looking statements made by Exelon Corporation, Exelon Generation Company, LLC, Commonwealth Edison Company, PECO Energy Company, Baltimore Gas and Electric Company, Pepco Holdings LLC, Potomac Electric Power Company, Delmarva Power & Light Company, and Atlantic City Electric Company (Registrants) include those factors
7
discussed herein, as well as the items discussed in (1) the Registrants' 2019 Annual Report on Form 10-K in (a) Part I, ITEM 1A. Risk Factors, (b) Part II, ITEM 7. Management’s Discussion and Analysis of Financial Condition and Results of Operations and (c) Part II, ITEM 8. Financial Statements and Supplementary Data: Note 18, Commitments and Contingencies; (2) the Registrants' First Quarter 2020 Quarterly Report on Form 10-Q (to be filed on May 8, 2020) in (a) Part II, ITEM 1A. Risk Factors; (b) Part I, ITEM 2. Management’s Discussion and Analysis of Financial Condition and Results of Operations and (c) Part I, ITEM 1. Financial Statements: Note 14, Commitments and Contingencies; and (3) other factors discussed in filings with the SEC by the Registrants.
Investors are cautioned not to place undue reliance on these forward-looking statements, whether written or oral, which apply only as of the date of this press release. None of the Registrants undertakes any obligation to publicly release any revision to its forward-looking statements to reflect events or circumstances after the date of this press release.
8
Earnings Release Attachments
Table of Contents
Consolidating Statements of Operations
(unaudited)
(in millions)
ComEd | PECO | BGE | PHI | Generation | Other (a) | Exelon Consolidated | |||||||||||||||||||||
Three Months Ended March 31, 2020 | |||||||||||||||||||||||||||
Operating revenues | $ | 1,439 | $ | 813 | $ | 937 | $ | 1,171 | $ | 4,733 | $ | (346 | ) | $ | 8,747 | ||||||||||||
Operating expenses | |||||||||||||||||||||||||||
Purchased power and fuel | 486 | 283 | 288 | 435 | 2,704 | (329 | ) | 3,867 | |||||||||||||||||||
Operating and maintenance | 317 | 217 | 188 | 257 | 1,263 | (38 | ) | 2,204 | |||||||||||||||||||
Depreciation and amortization | 273 | 86 | 143 | 194 | 304 | 21 | 1,021 | ||||||||||||||||||||
Taxes other than income | 75 | 39 | 69 | 114 | 129 | 11 | 437 | ||||||||||||||||||||
Total operating expenses | 1,151 | 625 | 688 | 1,000 | 4,400 | (335 | ) | 7,529 | |||||||||||||||||||
Gain on sales of assets and businesses | — | — | — | 2 | — | — | 2 | ||||||||||||||||||||
Operating income | 288 | 188 | 249 | 173 | 333 | (11 | ) | 1,220 | |||||||||||||||||||
Other income and (deductions) | |||||||||||||||||||||||||||
Interest expense, net | (94 | ) | (36 | ) | (32 | ) | (67 | ) | (109 | ) | (72 | ) | (410 | ) | |||||||||||||
Other, net | 10 | 3 | 5 | 13 | (771 | ) | 15 | (725 | ) | ||||||||||||||||||
Total other income and (deductions) | (84 | ) | (33 | ) | (27 | ) | (54 | ) | (880 | ) | (57 | ) | (1,135 | ) | |||||||||||||
Income (loss) before income taxes | 204 | 155 | 222 | 119 | (547 | ) | (68 | ) | 85 | ||||||||||||||||||
Income taxes | 36 | 15 | 41 | 11 | (389 | ) | (8 | ) | (294 | ) | |||||||||||||||||
Equity in earnings (losses) of unconsolidated affiliates | — | — | — | — | (3 | ) | — | (3 | ) | ||||||||||||||||||
Net income (loss) | 168 | 140 | 181 | 108 | (161 | ) | (60 | ) | 376 | ||||||||||||||||||
Net income attributable to noncontrolling interests | — | — | — | — | (206 | ) | — | (206 | ) | ||||||||||||||||||
Net income (loss) attributable to common shareholders | $ | 168 | $ | 140 | $ | 181 | $ | 108 | $ | 45 | $ | (60 | ) | $ | 582 | ||||||||||||
Three Months Ended March 31, 2019 | |||||||||||||||||||||||||||
Operating revenues | $ | 1,408 | $ | 900 | $ | 976 | $ | 1,228 | $ | 5,296 | $ | (331 | ) | $ | 9,477 | ||||||||||||
Operating expenses | |||||||||||||||||||||||||||
Purchased power and fuel | 485 | 331 | 360 | 490 | 3,205 | (318 | ) | 4,553 | |||||||||||||||||||
Operating and maintenance | 321 | 225 | 192 | 272 | 1,218 | (39 | ) | 2,189 | |||||||||||||||||||
Depreciation and amortization | 251 | 81 | 136 | 180 | 405 | 22 | 1,075 | ||||||||||||||||||||
Taxes other than income | 78 | 41 | 68 | 111 | 135 | 12 | 445 | ||||||||||||||||||||
Total operating expenses | 1,135 | 678 | 756 | 1,053 | 4,963 | (323 | ) | 8,262 | |||||||||||||||||||
Gain on sales of assets and businesses | 3 | — | — | — | — | — | 3 | ||||||||||||||||||||
Operating income | 276 | 222 | 220 | 175 | 333 | (8 | ) | 1,218 | |||||||||||||||||||
Other income and (deductions) | |||||||||||||||||||||||||||
Interest expense, net | (87 | ) | (33 | ) | (29 | ) | (65 | ) | (111 | ) | (78 | ) | (403 | ) | |||||||||||||
Other, net | 8 | 4 | 5 | 12 | 430 | 8 | 467 | ||||||||||||||||||||
Total other income and (deductions) | (79 | ) | (29 | ) | (24 | ) | (53 | ) | 319 | (70 | ) | 64 | |||||||||||||||
Income (loss) before income taxes | 197 | 193 | 196 | 122 | 652 | (78 | ) | 1,282 | |||||||||||||||||||
Income taxes | 40 | 25 | 36 | 5 | 224 | (20 | ) | 310 | |||||||||||||||||||
Equity in earnings (losses) of unconsolidated affiliates | — | — | — | — | (6 | ) | — | (6 | ) | ||||||||||||||||||
Net income (loss) | 157 | 168 | 160 | 117 | 422 | (58 | ) | 966 | |||||||||||||||||||
Net income attributable to noncontrolling interests | — | — | — | — | 59 | — | 59 | ||||||||||||||||||||
Net income (loss) attributable to common shareholders | $ | 157 | $ | 168 | $ | 160 | $ | 117 | $ | 363 | $ | (58 | ) | $ | 907 | ||||||||||||
Change in Net Income from 2019 to 2020 | $ | 11 | $ | (28 | ) | $ | 21 | $ | (9 | ) | $ | (318 | ) | $ | (2 | ) | $ | (325 | ) | ||||||||
__________
(a) | Other primarily includes eliminating and consolidating adjustments, Exelon’s corporate operations, shared service entities and other financing and investment activities. |
2
Exelon
Consolidated Balance Sheets
(unaudited)
(in millions)
March 31, 2020 | December 31, 2019 | |||||||
Assets | ||||||||
Current assets | ||||||||
Cash and cash equivalents | $ | 1,457 | $ | 587 | ||||
Restricted cash and cash equivalents | 414 | 358 | ||||||
Accounts receivable | ||||||||
Customer accounts receivable | 4,320 | 4,835 | ||||||
Customer allowance for credit losses | (278) | (243) | ||||||
Customer accounts receivable, net | 4,042 | 4,592 | ||||||
Other accounts receivable | 1,391 | 1,631 | ||||||
Other allowance for credit losses | (52) | (48) | ||||||
Other accounts receivable, net | 1,339 | 1,583 | ||||||
Mark-to-market derivative assets | 656 | 679 | ||||||
Unamortized energy contract assets | 47 | 47 | ||||||
Inventories, net | ||||||||
Fossil fuel and emission allowances | 224 | 312 | ||||||
Materials and supplies | 1,463 | 1,456 | ||||||
Regulatory assets | 1,205 | 1,170 | ||||||
Other | 1,629 | 1,253 | ||||||
Total current assets | 12,476 | 12,037 | ||||||
Property, plant and equipment, net | 81,017 | 80,233 | ||||||
Deferred debits and other assets | ||||||||
Regulatory assets | 8,360 | 8,335 | ||||||
Nuclear decommissioning trust funds | 11,611 | 13,190 | ||||||
Investments | 418 | 464 | ||||||
Goodwill | 6,677 | 6,677 | ||||||
Mark-to-market derivative assets | 625 | 508 | ||||||
Unamortized energy contract assets | 329 | 336 | ||||||
Other | 3,164 | 3,197 | ||||||
Total deferred debits and other assets | 31,184 | 32,707 | ||||||
Total assets | $ | 124,677 | $ | 124,977 | ||||
3
March 31, 2020 | December 31, 2019 | |||||||
Liabilities and shareholders’ equity | ||||||||
Current liabilities | ||||||||
Short-term borrowings | $ | 1,979 | $ | 1,370 | ||||
Long-term debt due within one year | 2,848 | 4,710 | ||||||
Accounts payable | 2,883 | 3,560 | ||||||
Accrued expenses | 1,535 | 1,981 | ||||||
Payables to affiliates | 5 | 5 | ||||||
Regulatory liabilities | 412 | 406 | ||||||
Mark-to-market derivative liabilities | 264 | 247 | ||||||
Unamortized energy contract liabilities | 121 | 132 | ||||||
Renewable energy credit obligation | 451 | 443 | ||||||
Other | 1,276 | 1,331 | ||||||
Total current liabilities | 11,774 | 14,185 | ||||||
Long-term debt | 34,808 | 31,329 | ||||||
Long-term debt to financing trusts | 390 | 390 | ||||||
Deferred credits and other liabilities | ||||||||
Deferred income taxes and unamortized investment tax credits | 12,242 | 12,351 | ||||||
Asset retirement obligations | 10,951 | 10,846 | ||||||
Pension obligations | 3,705 | 4,247 | ||||||
Non-pension postretirement benefit obligations | 2,112 | 2,076 | ||||||
Spent nuclear fuel obligation | 1,204 | 1,199 | ||||||
Regulatory liabilities | 9,105 | 9,986 | ||||||
Mark-to-market derivative liabilities | 436 | 393 | ||||||
Unamortized energy contract liabilities | 317 | 338 | ||||||
Other | 3,017 | 3,064 | ||||||
Total deferred credits and other liabilities | 43,089 | 44,500 | ||||||
Total liabilities | 90,061 | 90,404 | ||||||
Commitments and contingencies | ||||||||
Shareholders’ equity | ||||||||
Common stock | 19,303 | 19,274 | ||||||
Treasury stock, at cost | (123 | ) | (123 | ) | ||||
Retained earnings | 16,475 | 16,267 | ||||||
Accumulated other comprehensive loss, net | (3,173 | ) | (3,194 | ) | ||||
Total shareholders’ equity | 32,482 | 32,224 | ||||||
Noncontrolling interests | 2,134 | 2,349 | ||||||
Total equity | 34,616 | 34,573 | ||||||
Total liabilities and shareholders’ equity | $ | 124,677 | $ | 124,977 | ||||
4
Exelon
Consolidated Statements of Cash Flows
(unaudited)
(in millions)
Three Months Ended March 31, | ||||||||
2020 | 2019 | |||||||
Cash flows from operating activities | ||||||||
Net income | $ | 376 | $ | 966 | ||||
Adjustments to reconcile net income to net cash flows provided by operating activities: | ||||||||
Depreciation, amortization and accretion, including nuclear fuel and energy contract amortization | 1,378 | 1,460 | ||||||
Asset impairments | 8 | 7 | ||||||
Deferred income taxes and amortization of investment tax credits | (245 | ) | 187 | |||||
Net fair value changes related to derivatives | (132 | ) | 31 | |||||
Net realized and unrealized (gains) losses on NDT funds | 651 | (308 | ) | |||||
Other non-cash operating activities | 273 | 127 | ||||||
Changes in assets and liabilities: | ||||||||
Accounts receivable | 800 | 79 | ||||||
Inventories | 81 | 128 | ||||||
Accounts payable and accrued expenses | (976 | ) | (764 | ) | ||||
Option premiums (paid) received, net | (38 | ) | 6 | |||||
Collateral posted, net | (21 | ) | (101 | ) | ||||
Income taxes | (56 | ) | 141 | |||||
Pension and non-pension postretirement benefit contributions | (531 | ) | (328 | ) | ||||
Other assets and liabilities | (488 | ) | (587 | ) | ||||
Net cash flows provided by operating activities | 1,080 | 1,044 | ||||||
Cash flows from investing activities | ||||||||
Capital expenditures | (2,016 | ) | (1,873 | ) | ||||
Proceeds from NDT fund sales | 1,183 | 3,713 | ||||||
Investment in NDT funds | (1,234 | ) | (3,666 | ) | ||||
Proceeds from sales of assets and businesses | — | 8 | ||||||
Other investing activities | (8 | ) | 32 | |||||
Net cash flows used in investing activities | (2,075 | ) | (1,786 | ) | ||||
Cash flows from financing activities | ||||||||
Changes in short-term borrowings | 109 | 540 | ||||||
Proceeds from short-term borrowings with maturities greater than 90 days | 500 | — | ||||||
Issuance of long-term debt | 2,652 | 402 | ||||||
Retirement of long-term debt | (1,032 | ) | (352 | ) | ||||
Dividends paid on common stock | (373 | ) | (352 | ) | ||||
Proceeds from employee stock plans | 30 | 51 | ||||||
Other financing activities | (21 | ) | (14 | ) | ||||
Net cash flows provided by financing activities | 1,865 | 275 | ||||||
Increase in cash, cash equivalents and restricted cash | 870 | (467 | ) | |||||
Cash, cash equivalents and restricted cash at beginning of period | 1,122 | 1,781 | ||||||
Cash, cash equivalents and restricted cash at end of period | $ | 1,992 | $ | 1,314 | ||||
5
Exelon
Reconciliation of GAAP Net Income to Adjusted (non-GAAP) Operating Earnings and Analysis of Earnings
Three Months Ended March 31, 2020 and 2019
(unaudited)
(in millions, except per share data)
Exelon Earnings per Diluted Share | ComEd | PECO | BGE | PHI | Generation | Other (a) | Exelon | ||||||||||||||||||||||||
2019 GAAP Net Income (Loss) | $ | 0.93 | $ | 157 | $ | 168 | $ | 160 | $ | 117 | $ | 363 | $ | (58 | ) | $ | 907 | ||||||||||||||
Mark-to-Market Impact of Economic Hedging Activities (net of taxes of $10, $2 and $12, respectively) | 0.03 | — | — | — | — | 26 | 5 | 31 | |||||||||||||||||||||||
Unrealized Gains Related to NDT Fund Investments (net of taxes of $161) (1) | (0.20 | ) | — | — | — | — | (193 | ) | — | (193 | ) | ||||||||||||||||||||
Asset Impairments (net of taxes of $1) | — | — | — | — | — | 4 | — | 4 | |||||||||||||||||||||||
Plant Retirements and Divestitures (net of taxes of $6) (2) | 0.02 | — | — | — | — | 19 | — | 19 | |||||||||||||||||||||||
Cost Management Program (net of taxes of $0, $0, $0, $3 and $3, respectively) (3) | 0.01 | — | 1 | 1 | 1 | 8 | — | 11 | |||||||||||||||||||||||
Noncontrolling Interests (net of taxes of $13) (4) | 0.07 | — | — | — | — | 67 | — | 67 | |||||||||||||||||||||||
2019 Adjusted (non-GAAP) Operating Earnings (Loss) | 0.87 | 157 | 169 | 161 | 118 | 294 | (53 | ) | 846 | ||||||||||||||||||||||
Year Over Year Effects on Adjusted (non-GAAP) Operating Earnings: | |||||||||||||||||||||||||||||||
ComEd, PECO, BGE and PHI: | |||||||||||||||||||||||||||||||
Weather | (0.05 | ) | — | (b) | (34 | ) | — | (b) | (12 | ) | (b) | — | — | (46 | ) | ||||||||||||||||
Load | — | — | (b) | (4 | ) | — | (b) | — | (b) | — | — | (4 | ) | ||||||||||||||||||
Other Energy Delivery (5) | 0.07 | 21 | (c) | 10 | (c) | 24 | (c) | 11 | (c) | — | — | 66 | |||||||||||||||||||
Generation, Excluding Mark-to-Market: | |||||||||||||||||||||||||||||||
Nuclear Volume (6) | (0.07 | ) | — | — | — | — | (68 | ) | — | (68 | ) | ||||||||||||||||||||
Nuclear Fuel Cost (7) | 0.02 | — | — | — | — | 18 | — | 18 | |||||||||||||||||||||||
Capacity Revenue (8) | (0.11 | ) | — | — | — | — | (110 | ) | — | (110 | ) | ||||||||||||||||||||
Zero Emission Credit Revenue (9) | 0.02 | — | — | — | — | 16 | — | 16 | |||||||||||||||||||||||
Market and Portfolio Conditions (10) | (0.03 | ) | — | — | — | — | (26 | ) | — | (26 | ) | ||||||||||||||||||||
Operating and Maintenance Expense: | |||||||||||||||||||||||||||||||
Labor, Contracting and Materials (11) | 0.06 | 7 | 4 | (1 | ) | 2 | 42 | — | 54 | ||||||||||||||||||||||
Planned Nuclear Refueling Outages (12) | (0.03 | ) | — | — | — | — | (31 | ) | — | (31 | ) | ||||||||||||||||||||
Pension and Non-Pension Postretirement Benefits | — | (2 | ) | 1 | — | 1 | 4 | — | 4 | ||||||||||||||||||||||
Other Operating and Maintenance | 0.02 | (2 | ) | 1 | 4 | 9 | 11 | (1 | ) | 22 | |||||||||||||||||||||
Depreciation and Amortization Expense (13) | (0.03 | ) | (16 | ) | (4 | ) | (5 | ) | (10 | ) | 7 | 1 | (27 | ) | |||||||||||||||||
Interest Expense, Net (14) | — | (4 | ) | (3 | ) | (2 | ) | (1 | ) | 8 | 4 | 2 | |||||||||||||||||||
Income Taxes (15) | 0.05 | 6 | (1 | ) | 2 | (8 | ) | 62 | (9 | ) | 52 | ||||||||||||||||||||
Noncontrolling Interests (16) | 0.05 | — | — | — | — | 45 | — | 45 | |||||||||||||||||||||||
Other (17) | 0.04 | 1 | 1 | (1 | ) | — | 40 | (3 | ) | 38 | |||||||||||||||||||||
Total Year Over Year Effects on Adjusted (non-GAAP) Operating Earnings | — | 11 | (29 | ) | 21 | (8 | ) | 18 | (8 | ) | 5 | ||||||||||||||||||||
2020 GAAP Net Income (Loss) | 0.60 | 168 | 140 | 181 | 108 | 45 | (60 | ) | 582 | ||||||||||||||||||||||
Mark-to-Market Impact of Economic Hedging Activities (net of taxes of $33, $1 and $32, respectively) | (0.10 | ) | — | — | — | — | (97 | ) | 3 | (94 | ) | ||||||||||||||||||||
Unrealized Losses Related to NDT Fund Investments (net of taxes of $405) (1) | 0.50 | — | — | — | — | 485 | — | 485 | |||||||||||||||||||||||
Asset Impairments (net of taxes of $1) | — | — | — | — | — | 2 | — | 2 | |||||||||||||||||||||||
Plant Retirements and Divestitures (net of taxes of $4) (2) | 0.01 | — | — | — | — | 13 | — | 13 | |||||||||||||||||||||||
Cost Management Program (net of taxes of $0, $1, $3, $1, and $3, respectively) (3) | 0.01 | — | — | 1 | 2 | 8 | (2 | ) | 9 | ||||||||||||||||||||||
Income Tax-Related Adjustments (entire amount represents tax expense) | — | — | — | — | — | — | (2 | ) | (2 | ) | |||||||||||||||||||||
Noncontrolling Interests (net of taxes of $30) (4) | (0.15 | ) | — | — | — | — | (144 | ) | — | (144 | ) | ||||||||||||||||||||
2020 Adjusted (non-GAAP) Operating Earnings (Loss) | $ | 0.87 | $ | 168 | $ | 140 | $ | 182 | $ | 110 | $ | 312 | $ | (61 | ) | $ | 851 | ||||||||||||||
6
Note:
Amounts may not sum due to rounding.
Unless otherwise noted, the income tax impact of each reconciling item between GAAP Net Income and Adjusted (non-GAAP) Operating Earnings is based on the marginal statutory federal and state income tax rates for each Registrant, taking into account whether the income or expense item is taxable or deductible, respectively, in whole or in part. For all items except the unrealized gains and losses related to NDT fund investments, the marginal statutory income tax rates for 2020 and 2019 ranged from 26.0% to 29.0%. Under IRS regulations, NDT fund investment returns are taxed at different rates for investments if they are in qualified or non-qualified funds. The effective tax rates for the unrealized gains and losses related to NDT fund investments were 45.5% and 45.4% for the three months ended March 31, 2020 and 2019, respectively.
(a) | Other primarily includes eliminating and consolidating adjustments, Exelon’s corporate operations, shared service entities and other financing and investment activities. |
(b) | For ComEd, BGE, Pepco and DPL Maryland, customer rates are adjusted to eliminate the impacts of weather and customer usage on distribution volumes. |
(c) | For regulatory recovery mechanisms, including ComEd’s distribution formula rate, ComEd, PECO, BGE and PHI utilities transmission formula rates, and riders across all utilities, revenues increase and decrease i) as fully recoverable costs fluctuate (with no impact on net earnings), and ii) pursuant to changes in rate base, capital structure and ROE (which impact net earnings). |
(1) | Reflects the impact of net unrealized gains and losses on Generation’s NDT fund investments for Non-Regulatory and Regulatory Agreement Units. The impacts of the Regulatory Agreement Units, including the associated income taxes, are contractually eliminated, resulting in no earnings impact. |
(2) | In 2019, primarily reflects accelerated depreciation and amortization expenses associated with the early retirement of the TMI nuclear facility and a benefit associated with a remeasurement of the TMI ARO. In 2020, primarily reflects accelerated depreciation and amortization expenses associated with the early retirement of certain fossil sites. |
(3) | Primarily represents reorganization costs related to cost management programs. |
(4) | Represents elimination from Generation’s results of the noncontrolling interests related to certain exclusion items, primarily related to unrealized gains and losses on NDT fund investments for CENG units. |
(5) | For ComEd, reflects increased electric distribution and energy efficiency revenues (due to higher rate base, higher fully recoverable costs and distribution formula rate timing, partially offset by lower electric distribution ROE due to decreased treasury rates). For BGE, and PHI, reflects increased revenue as a result of rate increases. |
(6) | Primarily reflects the permanent cease of generation operations at TMI in September 2019 and an increase in nuclear outage days. |
(7) | Primarily reflects a decrease in fuel prices and decreased nuclear output as a result of the permanent cease of generation operations at TMI. |
(8) | Reflects decreased capacity revenues in the Mid-Atlantic, Midwest, New York, and Other Power Regions. |
(9) | Primarily reflects the approval of the New Jersey ZEC Program in the second quarter of 2019. |
(10) | Primarily reflects lower realized energy prices. |
(11) | For Generation, primarily reflects decreased costs related to the permanent cease of generation operations at TMI and lower labor costs resulting from previous cost management programs. |
(12) | Primarily reflects an increase in the number of nuclear outage days in 2020. |
(13) | Reflects ongoing capital expenditures across all utilities. For ComEd, also reflects increased amortization of deferred energy efficiency costs pursuant to FEJA. For Generation, reflects a decrease primarily due to the extension of the Peach Bottom license. |
(14) | For Generation, includes an interest benefit related to a one-time income tax settlement. |
(15) | For Generation, primarily reflects a one-time income tax settlement partially offset by a reduction in renewable tax credits. |
(16) | Reflects elimination from Generation’s results of activity attributable to noncontrolling interests, primarily for CENG. |
(17) | For Generation, primarily reflects higher realized NDT fund gains. |
7
Exelon
GAAP Consolidated Statements of Operations and
Adjusted (non-GAAP) Operating Earnings Reconciling Adjustments
(unaudited)
(in millions, except per share data)
Three Months Ended March 31, 2020 | Three Months Ended March 31, 2019 | ||||||||||||||||||
GAAP (a) | Non-GAAP Adjustments | GAAP (a) | Non-GAAP Adjustments | ||||||||||||||||
Operating revenues | $ | 8,747 | $ | (179 | ) | (b) | $ | 9,477 | $ | 52 | (b) | ||||||||
Operating expenses | |||||||||||||||||||
Purchased power and fuel | 3,867 | (48 | ) | (b) | 4,553 | 20 | (b),(c) | ||||||||||||
Operating and maintenance | 2,204 | (21 | ) | (c),(d),(e) | 2,189 | 56 | (c),(d),(e) | ||||||||||||
Depreciation and amortization | 1,021 | (10 | ) | (c) | 1,075 | (100 | ) | (c) | |||||||||||
Taxes other than income | 437 | — | 445 | — | |||||||||||||||
Total operating expenses | 7,529 | 8,262 | |||||||||||||||||
Gain on sales of assets and businesses | 2 | — | 3 | — | |||||||||||||||
Operating income | 1,220 | 1,218 | |||||||||||||||||
Other income and (deductions) | |||||||||||||||||||
Interest expense, net | (410 | ) | 16 | (b) | (403 | ) | 15 | (b) | |||||||||||
Other, net | (725 | ) | 879 | (b),(f) | 467 | (358 | ) | (c),(f) | |||||||||||
Total other income and (deductions) | (1,135 | ) | 64 | ||||||||||||||||
Income before income taxes | 85 | 1,282 | |||||||||||||||||
Income taxes | (294 | ) | 382 | (b),(c),(d),(e),(f),(g) | 310 | (139 | ) | (b),(c),(d),(e),(f),(g) | |||||||||||
Equity in losses of unconsolidated affiliates | (3 | ) | — | (6 | ) | — | |||||||||||||
Net income | 376 | 966 | |||||||||||||||||
Net income attributable to noncontrolling interests | (206 | ) | 144 | (h) | 59 | (67 | ) | (h) | |||||||||||
Net income attributable to common shareholders | $ | 582 | $ | 907 | |||||||||||||||
Effective tax rate(h) | (345.9 | )% | 24.2 | % | |||||||||||||||
Earnings per average common share | |||||||||||||||||||
Basic | $ | 0.60 | $ | 0.93 | |||||||||||||||
Diluted | $ | 0.60 | $ | 0.93 | |||||||||||||||
Average common shares outstanding | |||||||||||||||||||
Basic | 975 | 971 | |||||||||||||||||
Diluted | 976 | 972 | |||||||||||||||||
__________
(a) | Results reported in accordance with accounting principles generally accepted in the United States (GAAP). |
(b) | Adjustment to exclude the mark-to-market impact of Exelon’s economic hedging activities, net of intercompany eliminations. |
(c) | In 2020, adjustment to primarily exclude accelerated depreciation and amortization expenses associated with the early retirement of certain fossil sites. In 2019, adjustment to primarily exclude accelerated depreciation and amortization expenses associated with the early retirement of the TMI nuclear facility and a benefit associated with a remeasurement of the TMI ARO. |
(d) | Adjustment to exclude certain asset impairments. |
(e) | Adjustment to exclude reorganization costs related to cost management programs. |
(f) | Adjustment to exclude the impact of net unrealized gains and losses on Generation’s NDT fund investments for Non-Regulatory and Regulatory Agreement Units. The impacts of the Regulatory Agreement Units, including the associated income taxes, are contractually eliminated, resulting in no earnings impact. |
(g) | The effective tax rate related to Adjusted (non-GAAP) Operating Earnings is 10.0% and 16.8% for the three months ended March 31, 2020 and March 31, 2019, respectively. |
(h) | Adjustment to exclude elimination from Generation’s results of the noncontrolling interests related to certain exclusion items, primarily related to the impact of unrealized gains and losses on NDT fund investments at CENG. |
8
ComEd
GAAP Consolidated Statements of Operations and
Adjusted (non-GAAP) Operating Earnings Reconciling Adjustments
(unaudited)
(in millions)
Three Months Ended March 31, 2020 | Three Months Ended March 31, 2019 | ||||||||||||||||||
GAAP (a) | Non-GAAP Adjustments | GAAP (a) | Non-GAAP Adjustments | ||||||||||||||||
Operating revenues | $ | 1,439 | $ | — | $ | 1,408 | $ | — | |||||||||||
Operating expenses | |||||||||||||||||||
Purchased power and fuel | 486 | — | 485 | — | |||||||||||||||
Operating and maintenance | 317 | — | 321 | — | |||||||||||||||
Depreciation and amortization | 273 | — | 251 | — | |||||||||||||||
Taxes other than income | 75 | — | 78 | — | |||||||||||||||
Total operating expenses | 1,151 | 1,135 | |||||||||||||||||
Gain on sales of assets | — | — | 3 | — | |||||||||||||||
Operating income | 288 | 276 | |||||||||||||||||
Other income and (deductions) | |||||||||||||||||||
Interest expense, net | (94 | ) | — | (87 | ) | — | |||||||||||||
Other, net | 10 | — | 8 | — | |||||||||||||||
Total other income and (deductions) | (84 | ) | (79 | ) | |||||||||||||||
Income before income taxes | 204 | 197 | |||||||||||||||||
Income taxes | 36 | — | 40 | — | |||||||||||||||
Net income | $ | 168 | $ | 157 | |||||||||||||||
__________
(a) | Results reported in accordance with accounting principles generally accepted in the United States (GAAP). |
9
PECO
GAAP Consolidated Statements of Operations and
Adjusted (non-GAAP) Operating Earnings Reconciling Adjustments
(unaudited)
(in millions)
Three Months Ended March 31, 2020 | Three Months Ended March 31, 2019 | ||||||||||||||||||
GAAP (a) | Non-GAAP Adjustments | GAAP (a) | Non-GAAP Adjustments | ||||||||||||||||
Operating revenues | $ | 813 | $ | — | $ | 900 | $ | — | |||||||||||
Operating expenses | |||||||||||||||||||
Purchased power and fuel | 283 | — | 331 | — | |||||||||||||||
Operating and maintenance | 217 | — | 225 | (1 | ) | (b) | |||||||||||||
Depreciation and amortization | 86 | — | 81 | — | |||||||||||||||
Taxes other than income | 39 | — | 41 | — | |||||||||||||||
Total operating expenses | 625 | 678 | |||||||||||||||||
Operating income | 188 | 222 | |||||||||||||||||
Other income and (deductions) | |||||||||||||||||||
Interest expense, net | (36 | ) | — | (33 | ) | — | |||||||||||||
Other, net | 3 | — | 4 | — | |||||||||||||||
Total other income and (deductions) | (33 | ) | (29 | ) | |||||||||||||||
Income before income taxes | 155 | 193 | |||||||||||||||||
Income taxes | 15 | — | 25 | — | |||||||||||||||
Net income | $ | 140 | $ | 168 | |||||||||||||||
__________
(a) | Results reported in accordance with accounting principles generally accepted in the United States (GAAP). |
(b) | Adjustment to exclude reorganization costs related to cost management programs. |
10
BGE
GAAP Consolidated Statements of Operations and
Adjusted (non-GAAP) Operating Earnings Reconciling Adjustments
(unaudited)
(in millions)
Three Months Ended March 31, 2020 | Three Months Ended March 31, 2019 | ||||||||||||||||||
GAAP (a) | Non-GAAP Adjustments | GAAP (a) | Non-GAAP Adjustments | ||||||||||||||||
Operating revenues | $ | 937 | $ | — | $ | 976 | $ | — | |||||||||||
Operating expenses | |||||||||||||||||||
Purchased power and fuel | 288 | — | 360 | — | |||||||||||||||
Operating and maintenance | 188 | (1 | ) | (b) | 192 | (1 | ) | (b) | |||||||||||
Depreciation and amortization | 143 | — | 136 | — | |||||||||||||||
Taxes other than income | 69 | — | 68 | — | |||||||||||||||
Total operating expenses | 688 | 756 | |||||||||||||||||
Operating income | 249 | 220 | |||||||||||||||||
Other income and (deductions) | |||||||||||||||||||
Interest expense, net | (32 | ) | — | (29 | ) | — | |||||||||||||
Other, net | 5 | — | 5 | — | |||||||||||||||
Total other income and (deductions) | (27 | ) | (24 | ) | |||||||||||||||
Income before income taxes | 222 | 196 | |||||||||||||||||
Income taxes | 41 | — | 36 | — | |||||||||||||||
Net income | $ | 181 | $ | 160 | |||||||||||||||
__________
(a) | Results reported in accordance with accounting principles generally accepted in the United States (GAAP). |
(b) | Adjustment to exclude reorganization costs related to cost management programs. |
11
PHI
GAAP Consolidated Statements of Operations and
Adjusted (non-GAAP) Operating Earnings Reconciling Adjustments
(unaudited)
(in millions)
Three Months Ended March 31, 2020 | Three Months Ended March 31, 2019 | ||||||||||||||||||
GAAP (a) | Non-GAAP Adjustments | GAAP (a) | Non-GAAP Adjustments | ||||||||||||||||
Operating revenues | $ | 1,171 | $ | — | $ | 1,228 | $ | — | |||||||||||
Operating expenses | |||||||||||||||||||
Purchased power and fuel | 435 | — | 490 | — | |||||||||||||||
Operating and maintenance | 257 | (3 | ) | (b) | 272 | (1 | ) | (b) | |||||||||||
Depreciation and amortization | 194 | — | 180 | — | |||||||||||||||
Taxes other than income | 114 | — | 111 | — | |||||||||||||||
Total operating expenses | 1,000 | 1,053 | |||||||||||||||||
Gain on sales of assets | 2 | — | — | — | |||||||||||||||
Operating income | 173 | 175 | |||||||||||||||||
Other income and (deductions) | |||||||||||||||||||
Interest expense, net | (67 | ) | — | (65 | ) | — | |||||||||||||
Other, net | 13 | — | 12 | — | |||||||||||||||
Total other income and (deductions) | (54 | ) | (53 | ) | |||||||||||||||
Income before income taxes | 119 | 122 | |||||||||||||||||
Income taxes | 11 | 1 | (b) | 5 | — | ||||||||||||||
Net income | $ | 108 | $ | 117 | |||||||||||||||
__________
(a) | Results reported in accordance with accounting principles generally accepted in the United States (GAAP). |
(b) | Adjustment to exclude reorganization costs related to cost management programs. |
12
Generation
GAAP Consolidated Statements of Operations and
Adjusted (non-GAAP) Operating Earnings Reconciling Adjustments
(unaudited)
(in millions)
Three Months Ended March 31, 2020 | Three Months Ended March 31, 2019 | ||||||||||||||||||
GAAP (a) | Non-GAAP Adjustments | GAAP (a) | Non-GAAP Adjustments | ||||||||||||||||
Operating revenues | $ | 4,733 | $ | (179 | ) | (b) | $ | 5,296 | $ | 52 | (b) | ||||||||
Operating expenses | |||||||||||||||||||
Purchased power and fuel | 2,704 | (48 | ) | (b) | 3,205 | 20 | (b),(e) | ||||||||||||
Operating and maintenance | 1,263 | (20 | ) | (c),(d),(e) | 1,218 | 59 | (c),(d),(e) | ||||||||||||
Depreciation and amortization | 304 | (10 | ) | (e) | 405 | (100 | ) | (e) | |||||||||||
Taxes other than income | 129 | — | 135 | — | |||||||||||||||
Total operating expenses | 4,400 | 4,963 | |||||||||||||||||
Operating income | 333 | 333 | |||||||||||||||||
Other income and (deductions) | |||||||||||||||||||
Interest expense, net | (109 | ) | 12 | (b) | (111 | ) | 8 | (b) | |||||||||||
Other, net | (771 | ) | 879 | (b),(f) | 430 | (358 | ) | (e),(f) | |||||||||||
Total other income and (deductions) | (880 | ) | 319 | ||||||||||||||||
Income before income taxes | (547 | ) | 652 | ||||||||||||||||
Income taxes | (389 | ) | 379 | (b),(c),(d),(e),(f) | 224 | (141 | ) | (b),(c),(d),(e),(f) | |||||||||||
Equity in losses of unconsolidated affiliates | (3 | ) | — | (6 | ) | — | |||||||||||||
Net income | (161 | ) | 422 | ||||||||||||||||
Net income attributable to noncontrolling interests | (206 | ) | 144 | (g) | 59 | (67 | ) | (g) | |||||||||||
Net income attributable to membership interest | $ | 45 | $ | 363 | |||||||||||||||
__________
(a) | Results reported in accordance with accounting principles generally accepted in the United States (GAAP). |
(b) | Adjustment to exclude the mark-to-market impact of Exelon’s economic hedging activities, net of intercompany eliminations. |
(c) | Adjustment to exclude reorganization costs related to cost management programs. |
(d) | Adjustment to exclude certain asset impairments. |
(e) | In 2020, adjustment to primarily exclude accelerated depreciation and amortization expenses associated with the early retirement of certain fossil sites. In 2019, adjustment to primarily exclude accelerated depreciation and amortization expenses associated with the early retirement of the TMI nuclear facility and a benefit associated with a remeasurement of the TMI ARO. |
(f) | Adjustment to exclude the impact of net unrealized gains and losses on Generation’s NDT fund investments for Non-Regulatory and Regulatory Agreement Units. The impacts of the Regulatory Agreement Units, including the associated income taxes, are contractually eliminated, resulting in no earnings impact. |
(g) | Adjustment to exclude elimination from Generation’s results of the noncontrolling interests related to certain exclusion items, primarily related to the impact of unrealized gains and losses on NDT fund investments at CENG. |
13
Other (a)
GAAP Consolidated Statements of Operations and
Adjusted (non-GAAP) Operating Earnings Reconciling Adjustments
(unaudited)
(in millions)
Three Months Ended March 31, 2020 | Three Months Ended March 31, 2019 | ||||||||||||||||||
GAAP (b) | Non-GAAP Adjustments | GAAP (b) | Non-GAAP Adjustments | ||||||||||||||||
Operating revenues | $ | (346 | ) | $ | — | $ | (331 | ) | $ | — | |||||||||
Operating expenses | |||||||||||||||||||
Purchased power and fuel | (329 | ) | — | (318 | ) | — | |||||||||||||
Operating and maintenance | (38 | ) | 3 | (c) | (39 | ) | — | ||||||||||||
Depreciation and amortization | 21 | — | 22 | — | |||||||||||||||
Taxes other than income | 11 | — | 12 | — | |||||||||||||||
Total operating expenses | (335 | ) | (323 | ) | |||||||||||||||
Operating income | (11 | ) | (8 | ) | |||||||||||||||
Other income and (deductions) | |||||||||||||||||||
Interest expense, net | (72 | ) | 4 | (d) | (78 | ) | 7 | (d) | |||||||||||
Other, net | 15 | — | 8 | — | |||||||||||||||
Total other income and (deductions) | (57 | ) | (70 | ) | |||||||||||||||
Loss before income taxes | (68 | ) | (78 | ) | |||||||||||||||
Income taxes | (8 | ) | 2 | (c),(d),(e) | (20 | ) | 2 | (d) | |||||||||||
Net (loss) income | (60 | ) | (58 | ) | |||||||||||||||
Net (loss) income attributable to common shareholders | $ | (60 | ) | $ | (58 | ) | |||||||||||||
__________
(a) | Other primarily includes eliminating and consolidating adjustments, Exelon’s corporate operations, shared service entities and other financing and investment activities. |
(b) | Results reported in accordance with accounting principles generally accepted in the United States (GAAP). |
(c) | Adjustment to exclude reorganization costs related to cost management programs. |
(d) | Adjustment to exclude the mark-to-market impact of Exelon’s economic hedging activities, net of intercompany eliminations. |
(e) | Adjustment to exclude income tax-related adjustments. |
14
ComEd Statistics
Three Months Ended March 31, 2020 and 2019
Electric Deliveries (in GWhs) | Revenue (in millions) | |||||||||||||||||||||
2020 | 2019 | % Change | Weather - Normal % Change | 2020 | 2019 | % Change | ||||||||||||||||
Rate-Regulated Deliveries and Revenues(a) | ||||||||||||||||||||||
Residential | 6,237 | 6,763 | (7.8 | )% | (0.9 | )% | $ | 701 | $ | 710 | (1.3 | )% | ||||||||||
Small commercial & industrial | 7,570 | 7,810 | (3.1 | )% | 0.3 | % | 362 | 360 | 0.6 | % | ||||||||||||
Large commercial & industrial | 6,723 | 6,963 | (3.4 | )% | (0.9 | )% | 134 | 132 | 1.5 | % | ||||||||||||
Public authorities & electric railroads | 294 | 367 | (19.9 | )% | (19.4 | )% | 13 | 13 | — | % | ||||||||||||
Other(b) | — | — | n/a | n/a | 211 | 217 | (2.8 | )% | ||||||||||||||
Total rate-regulated electric revenues(c) | 20,824 | 21,903 | (4.9 | )% | (0.8 | )% | 1,421 | 1,432 | (0.8 | )% | ||||||||||||
Other Rate-Regulated Revenues(d) | 18 | (24 | ) | (175.0 | )% | |||||||||||||||||
Total Electric Revenues | $ | 1,439 | $ | 1,408 | 2.2 | % | ||||||||||||||||
Purchased Power | $ | 486 | $ | 485 | 0.2 | % | ||||||||||||||||
% Change | ||||||||||||||
Heating and Cooling Degree-Days | 2020 | 2019 | Normal | From 2019 | From Normal | |||||||||
Heating Degree-Days | 2,758 | 3,391 | 3,141 | (18.7 | )% | (12.2 | )% | |||||||
Cooling Degree-Days | — | — | — | — | % | — | % | |||||||
Number of Electric Customers | 2020 | 2019 | |||
Residential | 3,676,312 | 3,654,899 | |||
Small Commercial & Industrial | 386,012 | 382,743 | |||
Large Commercial & Industrial | 1,954 | 1,973 | |||
Public Authorities & Electric Railroads | 4,857 | 4,814 | |||
Total | 4,069,135 | 4,044,429 | |||
__________
(a) | Reflects revenues from customers purchasing electricity directly from ComEd and customers purchasing electricity from a competitive electric generation supplier, as all customers are assessed delivery charges. For customers purchasing electricity from ComEd, revenues also reflect the cost of energy and transmission. |
(b) | Includes transmission revenue from PJM, wholesale electric revenue and mutual assistance revenue. |
(c) | Includes operating revenues from affiliates totaling $5 million and $4 million for the three months ended March 31, 2020 and 2019, respectively. |
(d) | Includes alternative revenue programs and late payment charges. |
15
PECO Statistics
Three Months Ended March 31, 2020 and 2019
Electric and Natural Gas Deliveries | Revenue (in millions) | |||||||||||||||||||||
2020 | 2019 | % Change | Weather- Normal % Change | 2020 | 2019 | % Change | ||||||||||||||||
Electric (in GWhs) | ||||||||||||||||||||||
Rate-Regulated Electric Deliveries and Revenues(a) | ||||||||||||||||||||||
Residential | 3,254 | 3,641 | (10.6 | )% | (0.7 | )% | $ | 382 | $ | 409 | (6.6 | )% | ||||||||||
Small commercial & industrial | 1,905 | 2,066 | (7.8 | )% | (3.2 | )% | 99 | 96 | 3.1 | % | ||||||||||||
Large commercial & industrial | 3,421 | 3,571 | (4.2 | )% | (3.4 | )% | 53 | 48 | 10.4 | % | ||||||||||||
Public authorities & electric railroads | 151 | 195 | (22.6 | )% | (22.7 | )% | 7 | 7 | — | % | ||||||||||||
Other(b) | — | — | n/a | n/a | 58 | 62 | (6.5 | )% | ||||||||||||||
Total rate-regulated electric revenues(c) | 8,731 | 9,473 | (7.8 | )% | (2.7 | )% | 599 | 622 | (3.7 | )% | ||||||||||||
Other Rate-Regulated Revenues(d) | 5 | (2 | ) | (350.0 | )% | |||||||||||||||||
Total Electric Revenues | 604 | 620 | (2.6 | )% | ||||||||||||||||||
Natural Gas (in mmcfs) | ||||||||||||||||||||||
Rate-Regulated Gas Deliveries and Revenues(e) | ||||||||||||||||||||||
Residential | 17,282 | 21,218 | (18.6 | )% | (0.9 | )% | 150 | 198 | (24.2 | )% | ||||||||||||
Small commercial & industrial | 8,809 | 10,644 | (17.2 | )% | — | % | 51 | 72 | (29.2 | )% | ||||||||||||
Large commercial & industrial | 9 | 19 | (52.6 | )% | (6.3 | )% | — | 1 | (100.0 | )% | ||||||||||||
Transportation | 7,135 | 7,973 | (10.5 | )% | (1.9 | )% | 6 | 7 | (14.3 | )% | ||||||||||||
Other(f) | — | — | n/a | n/a | 1 | 2 | (50.0 | )% | ||||||||||||||
Total rate-regulated natural gas revenues(g) | 33,235 | 39,854 | (16.6 | )% | (0.9 | )% | 208 | 280 | (25.7 | )% | ||||||||||||
Other Rate-Regulated Revenues(d) | 1 | — | 100.0 | % | ||||||||||||||||||
Total Natural Gas Revenues | 209 | 280 | (25.4 | )% | ||||||||||||||||||
Total Electric and Natural Gas Revenues | $ | 813 | $ | 900 | (9.7 | )% | ||||||||||||||||
Purchased Power and Fuel | $ | 283 | $ | 331 | (14.5 | )% | ||||||||||||||||
% Change | ||||||||||||||
Heating and Cooling Degree-Days | 2020 | 2019 | Normal | From 2019 | From Normal | |||||||||
Heating Degree-Days | 1,989 | 2,432 | 2,419 | (18.2 | )% | (17.8 | )% | |||||||
Cooling Degree-Days | — | 2 | 1 | (100.0 | )% | (100.0 | )% | |||||||
Number of Electric Customers | 2020 | 2019 | Number of Natural Gas Customers | 2020 | 2019 | |||||||
Residential | 1,499,019 | 1,485,698 | Residential | 489,063 | 483,560 | |||||||
Small Commercial & Industrial | 154,056 | 153,042 | Small Commercial & Industrial | 44,509 | 44,274 | |||||||
Large Commercial & Industrial | 3,093 | 3,107 | Large Commercial & Industrial | 5 | 1 | |||||||
Public Authorities & Electric Railroads | 10,096 | 9,638 | Transportation | 727 | 744 | |||||||
Total | 1,666,264 | 1,651,485 | Total | 534,304 | 528,579 | |||||||
__________
(a) | Reflects delivery volumes and revenues from customers purchasing electricity directly from PECO and customers purchasing electricity from a competitive electric generation supplier as all customers are assessed distribution charges. For customers purchasing electricity from PECO, revenues also reflect the cost of energy and transmission. |
(b) | Includes transmission revenue from PJM, wholesale electric revenue and mutual assistance revenue. |
(c) | Includes operating revenues from affiliates totaling $2 million and $1 million for the three months ended March 31, 2020 and 2019, respectively. |
(d) | Includes alternative revenue programs and late payment charges. |
(e) | Reflects delivery volumes and revenues from customers purchasing natural gas directly from PECO and customers purchasing natural gas from a competitive natural gas supplier as all customers are assessed distribution charges. For customers purchasing natural gas from PECO, revenue also reflects the cost of natural gas. |
(f) | Includes revenues primarily from off-system sales. |
(g) | Includes operating revenues from affiliates totaling less than $1 million for both the three months ended March 31, 2020 and 2019. |
16
BGE Statistics
Three Months Ended March 31, 2020 and 2019
Electric and Natural Gas Deliveries | Revenue (in millions) | |||||||||||||||||||||
2020 | 2019 | % Change | Weather- Normal % Change | 2020 | 2019 | % Change | ||||||||||||||||
Electric (in GWhs) | ||||||||||||||||||||||
Rate-Regulated Electric Deliveries and Revenues(a) | ||||||||||||||||||||||
Residential | 3,118 | 3,550 | (12.2 | )% | 3.3 | % | $ | 339 | $ | 385 | (11.9 | )% | ||||||||||
Small commercial & industrial | 707 | 773 | (8.5 | )% | (0.3 | )% | 67 | 70 | (4.3 | )% | ||||||||||||
Large commercial & industrial | 3,122 | 3,232 | (3.4 | )% | (2.2 | )% | 103 | 110 | (6.4 | )% | ||||||||||||
Public authorities & electric railroads | 60 | 62 | (3.2 | )% | (7.0 | )% | 7 | 7 | — | % | ||||||||||||
Other(b) | — | — | n/a | n/a | 79 | 80 | (1.3 | )% | ||||||||||||||
Total rate-regulated electric revenues(c) | 7,007 | 7,617 | (8.0 | )% | 0.5 | % | 595 | 652 | (8.7 | )% | ||||||||||||
Other Rate-Regulated Revenues(d) | 18 | 6 | 200.0 | % | ||||||||||||||||||
Total Electric Revenues | 613 | 658 | (6.8 | )% | ||||||||||||||||||
Natural Gas (in mmcfs) | ||||||||||||||||||||||
Rate-Regulated Gas Deliveries and Revenues(e) | ||||||||||||||||||||||
Residential | 18,610 | 22,029 | (15.5 | )% | 10.3 | % | 206 | 219 | (5.9 | )% | ||||||||||||
Small commercial & industrial | 4,147 | 4,573 | (9.3 | )% | 12.9 | % | 34 | 35 | (2.9 | )% | ||||||||||||
Large commercial & industrial | 12,323 | 15,782 | (21.9 | )% | (8.8 | )% | 51 | 50 | 2.0 | % | ||||||||||||
Other(f) | 3,301 | 1,097 | 200.9 | % | n/a | 9 | 4 | 125.0 | % | |||||||||||||
Total rate-regulated natural gas revenues(g) | 38,381 | 43,481 | (11.7 | )% | 3.5 | % | 300 | 308 | (2.6 | )% | ||||||||||||
Other Rate-Regulated Revenues(d) | 24 | 10 | 140.0 | % | ||||||||||||||||||
Total Natural Gas Revenues | 324 | 318 | 1.9 | % | ||||||||||||||||||
Total Electric and Natural Gas Revenues | $ | 937 | $ | 976 | (4.0 | )% | ||||||||||||||||
Purchased Power and Fuel | $ | 288 | $ | 360 | (20.0 | )% | ||||||||||||||||
% Change | ||||||||||||||
Heating Degree-Days | 2020 | 2019 | Normal | From 2019 | From Normal | |||||||||
Heating Degree-Days | 1,879 | 2,403 | 2,390 | (21.8 | )% | (21.4 | )% | |||||||
Number of Electric Customers | 2020 | 2019 | Number of Natural Gas Customers | 2020 | 2019 | |||||||
Residential | 1,181,329 | 1,171,027 | Residential | 641,608 | 635,241 | |||||||
Small Commercial & Industrial | 114,697 | 113,976 | Small Commercial & Industrial | 38,381 | 38,322 | |||||||
Large Commercial & Industrial | 12,376 | 12,278 | Large Commercial & Industrial | 6,078 | 5,981 | |||||||
Public Authorities & Electric Railroads | 265 | 266 | Total | 686,067 | 679,544 | |||||||
Total | 1,308,667 | 1,297,547 | ||||||||||
__________
(a) | Reflects revenues from customers purchasing electricity directly from BGE and customers purchasing electricity from a competitive electric generation supplier as all customers are assessed distribution charges. For customers purchasing electricity from BGE, revenues also reflect the cost of energy and transmission. |
(b) | Includes revenues from transmission revenue from PJM, wholesale electric revenue and mutual assistance revenue. |
(c) | Includes operating revenues from affiliates totaling $3 million and $2 million for the three months ended March 31, 2020 and 2019, respectively. |
(d) | Includes alternative revenue programs and late payment charges. |
(e) | Reflects delivery volumes and revenues from customers purchasing natural gas directly from BGE and customers purchasing natural gas from a competitive natural gas supplier as all customers are assessed distribution charges. For customers purchasing natural gas from BGE, revenue also reflects the cost of natural gas. |
(f) | Includes revenues primarily from off-system sales. |
(g) | Includes operating revenues from affiliates totaling $3 million and $4 million for the three months ended March 31, 2020 and 2019, respectively. |
17
Pepco Statistics
Three Months Ended March 31, 2020 and 2019
Electric Deliveries (in GWhs) | Revenue (in millions) | |||||||||||||||||||||
2020 | 2019 | % Change | Weather- Normal % Change | 2020 | 2019 | % Change | ||||||||||||||||
Rate-Regulated Deliveries and Revenues(a) | ||||||||||||||||||||||
Residential | 1,946 | 2,224 | (12.5 | )% | (3.1 | )% | $ | 236 | $ | 256 | (7.8 | )% | ||||||||||
Small commercial & industrial | 315 | 346 | (9.0 | )% | (4.6 | )% | 35 | 38 | (7.9 | )% | ||||||||||||
Large commercial & industrial | 3,272 | 3,491 | (6.3 | )% | (4.3 | )% | 188 | 204 | (7.8 | )% | ||||||||||||
Public authorities & electric railroads | 204 | 187 | 9.1 | % | 10.2 | % | 9 | 8 | 12.5 | % | ||||||||||||
Other(b) | — | — | n/a | n/a | 60 | 53 | 13.2 | % | ||||||||||||||
Total rate-regulated electric revenues(c) | 5,737 | 6,248 | (8.2 | )% | (3.5 | )% | 528 | 559 | (5.5 | )% | ||||||||||||
Other Rate-Regulated Revenues(d) | 16 | 16 | — | % | ||||||||||||||||||
Total Electric Revenues | $ | 544 | $ | 575 | (5.4 | )% | ||||||||||||||||
Purchased Power | $ | 164 | $ | 187 | (12.3 | )% | ||||||||||||||||
% Change | ||||||||||||||
Heating Degree-Days | 2020 | 2019 | Normal | From 2019 | From Normal | |||||||||
Heating Degree-Days | 1,679 | 2,067 | 2,139 | (18.8 | )% | (21.5 | )% | |||||||
Cooling Degree-Days | 5 | 5 | 2 | — | % | 150.0 | % | |||||||
Number of Electric Customers | 2020 | 2019 | |||
Residential | 820,283 | 809,845 | |||
Small Commercial & Industrial | 54,304 | 54,295 | |||
Large Commercial & Industrial | 22,248 | 22,030 | |||
Public Authorities & Electric Railroads | 169 | 153 | |||
Total | 897,004 | 886,323 | |||
__________
(a) | Reflects revenues from customers purchasing electricity directly from Pepco and customers purchasing electricity from a competitive electric generation supplier as all customers are assessed distribution charges. For customers purchasing electricity from Pepco, revenues also reflect the cost of energy and transmission. |
(b) | Includes transmission revenue from PJM, wholesale electric revenue and mutual assistance revenue. |
(c) | Includes operating revenues from affiliates totaling $1 million and $2 million for the three months ended March 31, 2020 and 2019, respectively.. |
(d) | Includes alternative revenue programs and late payment charge revenues. |
18
DPL Statistics
Three Months Ended March 31, 2020 and 2019
Electric and Natural Gas Deliveries | Revenue (in millions) | |||||||||||||||||||||
2020 | 2019 | % Change | Weather - Normal % Change | 2020 | 2019 | % Change | ||||||||||||||||
Electric (in GWhs) | ||||||||||||||||||||||
Rate-Regulated Electric Deliveries and Revenues(a) | ||||||||||||||||||||||
Residential | 1,310 | 1,504 | (12.9 | )% | (1.0)% | $ | 161 | $ | 185 | (13.0 | )% | |||||||||||
Small Commercial & industrial | 507 | 554 | (8.5 | )% | (3.7)% | 43 | 48 | (10.4 | )% | |||||||||||||
Large Commercial & industrial | 1,069 | 1,056 | 1.2 | % | 3.2% | 23 | 24 | (4.2 | )% | |||||||||||||
Public authorities & electric railroads | 11 | 11 | — | % | (0.2)% | 3 | 3 | — | % | |||||||||||||
Other(b) | — | — | n/a | n/a | 54 | 47 | 14.9 | % | ||||||||||||||
Total rate-regulated electric revenues(c) | 2,897 | 3,125 | (7.3 | )% | (0.1)% | 284 | 307 | (7.5 | )% | |||||||||||||
Other Rate-Regulated Revenues(d) | 2 | 3 | (33.3 | )% | ||||||||||||||||||
Total Electric Revenues | 286 | 310 | (7.7 | )% | ||||||||||||||||||
Natural Gas (in mmcfs) | ||||||||||||||||||||||
Rate-Regulated Gas Deliveries and Revenues(e) | ||||||||||||||||||||||
Residential | 3,647 | 4,607 | (20.8 | )% | (0.7 | )% | 40 | 44 | (9.1 | )% | ||||||||||||
Small commercial & industrial | 1,671 | 2,020 | (17.3 | )% | 2.5 | % | 17 | 19 | (10.5 | )% | ||||||||||||
Large commercial & industrial | 452 | 523 | (13.6 | )% | (13.6 | )% | 1 | 1 | — | % | ||||||||||||
Transportation | 2,108 | 2,218 | (5.0 | )% | 4.1 | % | 4 | 4 | — | % | ||||||||||||
Other(g) | — | — | n/a | n/a | 2 | 3 | (33.3 | )% | ||||||||||||||
Total rate-regulated natural gas revenues | 7,878 | 9,368 | (15.9 | )% | 0.4 | % | 64 | 71 | (9.9 | )% | ||||||||||||
Other Rate-Regulated Revenues(f) | — | (1 | ) | n/a | ||||||||||||||||||
Total Natural Gas Revenues | 64 | 70 | (8.6 | )% | ||||||||||||||||||
Total Electric and Natural Gas Revenues | $ | 350 | $ | 380 | (7.9 | )% | ||||||||||||||||
Purchased Power and Fuel | $ | 141 | $ | 164 | (14.0 | )% | ||||||||||||||||
Electric Service Territory | % Change | |||||||||||||
Heating and Cooling Degree-Days | 2020 | 2019 | Normal | From 2019 | From Normal | |||||||||
Heating Degree-Days | 1,928 | 2,425 | 2,432 | (20.5 | )% | (20.7 | )% | |||||||
Cooling Degree-Days | 2 | 1 | 1 | 100.0 | % | 100.0 | % | |||||||
Natural Gas Service Territory | % Change | |||||||||||||
Heating Degree-Days | 2020 | 2019 | Normal | From 2019 | From Normal | |||||||||
Heating Degree-Days | 2,003 | 2,522 | 2,498 | (20.6 | )% | (19.8 | )% | |||||||
Number of Electric Customers | 2020 | 2019 | Number of Natural Gas Customers | 2020 | 2019 | |||||||
Residential | 469,082 | 464,638 | Residential | 126,209 | 124,575 | |||||||
Small Commercial & Industrial | 61,769 | 61,391 | Small Commercial & Industrial | 10,004 | 10,023 | |||||||
Large Commercial & Industrial | 1,414 | 1,400 | Large Commercial & Industrial | 17 | 18 | |||||||
Public Authorities & Electric Railroads | 612 | 620 | Transportation | 159 | 157 | |||||||
Total | 532,877 | 528,049 | Total | 136,389 | 134,773 | |||||||
__________
(a) | Reflects delivery volumes and revenues from customers purchasing electricity directly from DPL and customers purchasing electricity from a competitive electric generation supplier as all customers are assessed distribution charges. For customers purchasing electricity from DPL, revenues also reflect the cost of energy and transmission. |
(b) | Includes transmission revenue from PJM, wholesale electric revenue and mutual assistance revenue. |
(c) | Includes operating revenues from affiliates totaling $2 million for both the three months ended March 31, 2020 and 2019. |
(d) | Includes alternative revenue programs and late payment charges. |
(e) | Reflects delivery volumes and revenues from customers purchasing natural gas directly from DPL and customers purchasing natural gas from a competitive natural gas supplier as all customers are assessed distribution charges. For customers purchasing natural gas from DPL, revenue also reflects the cost of natural gas. |
(f) | Includes revenues primarily from off-system sales. |
19
ACE Statistics
Three Months Ended March 31, 2020 and 2019
Electric Deliveries (in GWhs) | Revenue (in millions) | |||||||||||||||||||||
2020 | 2019 | % Change | Weather - Normal % Change | 2020 | 2019 | % Change | ||||||||||||||||
Rate-Regulated Deliveries and Revenues(a) | ||||||||||||||||||||||
Residential | 810 | 908 | (10.8 | )% | (3.2 | )% | $ | 137 | $ | 138 | (0.7 | )% | ||||||||||
Small Commercial & industrial | 294 | 310 | (5.2 | )% | (0.1 | )% | 37 | 34 | 8.8 | % | ||||||||||||
Large Commercial & industrial | 735 | 791 | (7.1 | )% | (5.5 | )% | 42 | 39 | 7.7 | % | ||||||||||||
Public Authorities & Electric Railroads | 13 | 13 | — | % | (3.9 | )% | 3 | 3 | — | % | ||||||||||||
Other(b) | — | — | n/a | n/a | 55 | 57 | (3.5 | )% | ||||||||||||||
Total rate-regulated electric revenues(c) | 1,852 | 2,022 | (8.4 | )% | (3.6 | )% | 274 | 271 | 1.1 | % | ||||||||||||
Other Rate-Regulated Revenues(d) | 2 | 2 | — | % | ||||||||||||||||||
Total Electric Revenues | $ | 276 | $ | 273 | 1.1 | % | ||||||||||||||||
Purchased Power | $ | 128 | $ | 139 | (7.9 | )% | ||||||||||||||||
% Change | |||||||||||||||
Heating Degree-Days | 2020 | 2019 | Normal | From 2019 | From Normal | ||||||||||
Heating Degree-Days | 1,948 | 2,506 | 2,492 | (22.3 | )% | (21.8 | )% | ||||||||
Number of Electric Customers | 2020 | 2019 | ||||
Residential | 495,444 | 491,935 | ||||
Small Commercial & Industrial | 61,470 | 61,377 | ||||
Large Commercial & Industrial | 3,355 | 3,494 | ||||
Public Authorities & Electric Railroads | 684 | 661 | ||||
Total | 560,953 | 557,467 | ||||
__________
(a) | Reflects delivery volumes and revenues from customers purchasing electricity directly from ACE and customers purchasing electricity from a competitive electric generation supplier as all customers are assessed distribution charges. For customers purchasing electricity from ACE, revenues also reflect the cost of energy and transmission. |
(b) | Includes transmission revenue from PJM, wholesale electric revenue and mutual assistance revenue. |
(c) | Includes operating revenues from affiliates totaling $1 million for both the three months ended March 31, 2020 and 2019. |
(d) | Includes alternative revenue programs and late payment charge revenues. |
20
Generation Statistics
Three Months Ended | |||||
March 31, 2020 | March 31, 2019 | ||||
Supply (in GWhs) | |||||
Nuclear Generation(a) | |||||
Mid-Atlantic | 12,784 | 15,080 | |||
Midwest | 23,598 | 23,733 | |||
New York | 6,173 | 6,902 | |||
Total Nuclear Generation | 42,555 | 45,715 | |||
Fossil and Renewables | |||||
Mid-Atlantic | 853 | 951 | |||
Midwest | 388 | 392 | |||
New York | 1 | 1 | |||
ERCOT | 3,012 | 3,078 | |||
Other Power Regions(b) | 3,508 | 3,141 | |||
Total Fossil and Renewables | 7,762 | 7,563 | |||
Purchased Power | |||||
Mid-Atlantic | 5,943 | 2,566 | |||
Midwest | 288 | 288 | |||
ERCOT | 991 | 1,042 | |||
Other Power Regions(b) | 12,167 | 12,569 | |||
Total Purchased Power | 19,389 | 16,465 | |||
Total Supply/Sales by Region | |||||
Mid-Atlantic(c) | 19,580 | 18,597 | |||
Midwest(c) | 24,274 | 24,413 | |||
New York | 6,174 | 6,903 | |||
ERCOT | 4,003 | 4,120 | |||
Other Power Regions(b) | 15,675 | 15,710 | |||
Total Supply/Sales by Region | 69,706 | 69,743 | |||
Three Months Ended | |||||
March 31, 2020 | March 31, 2019 | ||||
Outage Days(d) | |||||
Refueling | 94 | 74 | |||
Non-refueling | 11 | — | |||
Total Outage Days | 105 | 74 | |||
__________
(a) | Includes the proportionate share of output where Generation has an undivided ownership interest in jointly-owned generating plants and includes the total output of plants that are fully consolidated (e.g. CENG). |
(b) | Other Power Regions includes New England, South, West and Canada. |
(c) | Includes affiliate sales to PECO, BGE, Pepco, DPL and ACE in the Mid-Atlantic region and affiliate sales to ComEd in the Midwest region. |
(d) | Outage days exclude Salem. |
21

Earnings Conference Call First Quarter 2020 May 8, 2020
Cautionary Statements Regarding Forward-Looking Information This presentation contains certain written and oral forward-looking statements within the meaning of the Private Securities Litigation Reform Act of 1995 that are subject to risks and uncertainties including among others those related to the expected or potential impact of the novel coronavirus (COVID-19) pandemic, and the related responses of various governments and regulatory bodies, our customers, and the company, on our business, financial condition and results of operations; any such forward-looking statements, whether concerning the COVID-19 pandemic or otherwise, involve risks, assumptions and uncertainties. Words such as “could,” “may,” “expects,” “anticipates,” “will,” “targets,” “goals,” “projects,” “intends,” “plans,” “believes,” “seeks,” “estimates,” “predicts,” and variations on such words, and similar expressions that reflect our current views with respect to future events and operational, economic and financial performance, are intended to identify such forward- looking statements. The factors that could cause actual results to differ materially from the forward-looking statements made by Exelon Corporation, Exelon Generation Company, LLC, Commonwealth Edison Company, PECO Energy Company, Baltimore Gas and Electric Company, Pepco Holdings LLC, Potomac Electric Power Company, Delmarva Power & Light Company, and Atlantic City Electric Company (Registrants) include those factors discussed herein, as well as the items discussed in (1) Exelon’s 2019 Annual Report on Form 10-K in (a) ITEM 1A. Risk Factors, (b) ITEM 7. Management’s Discussion and Analysis of Financial Condition and Results of Operations and (c) ITEM 8. Financial Statements and Supplementary Data: Note 18, Commitments and Contingencies; (2) the Registrants’ First Quarter 2020 Quarterly Report on Form 10-Q (to be filed on May 8, 2020) in (a) Part II, ITEM 1A. Risk Factors; (b) Part I, ITEM 2. Management’s Discussion and Analysis of Financial Condition and Results of Operations and (c) Part I, ITEM 1. Financial Statements: Note 14, Commitments and Contingencies; and (3) other factors discussed in filings with the SEC by the Registrants. Investors are cautioned not to place undue reliance on these forward-looking statements, whether written or oral, which apply only as of the date of this presentation. None of the Registrants undertakes any obligation to publicly release any revision to its forward-looking statements to reflect events or circumstances after the date of this presentation. 2 Q1 2020 Earnings Release Slides
Non-GAAP Financial Measures Exelon reports its financial results in accordance with accounting principles generally accepted in the United States (GAAP). Exelon supplements the reporting of financial information determined in accordance with GAAP with certain non-GAAP financial measures, including: • Adjusted operating earnings exclude certain costs, expenses, gains and losses and other specified items, including mark-to- market adjustments from economic hedging activities, unrealized gains and losses from nuclear decommissioning trust fund investments, asset impairments, certain amounts associated with plant retirements and divestitures, costs related to cost management programs, asset retirement obligations and other items as set forth in the reconciliation in the Appendix • Adjusted operating and maintenance expense excludes regulatory operating and maintenance costs for the utility businesses and direct cost of sales for certain Constellation and Power businesses, decommissioning costs that do not affect profit and loss, the impact from operating and maintenance expense related to variable interest entities at Generation, EDF’s ownership of O&M expenses, and other items as set forth in the reconciliation in the Appendix • Total gross margin is defined as operating revenues less purchased power and fuel expense, excluding revenue related to decommissioning, gross receipts tax, JExel Nuclear JV, variable interest entities, and net of direct cost of sales for certain Constellation and Power businesses • Adjusted cash flow from operations primarily includes net cash flows from operating activities and net cash flows from investing activities excluding capital expenditures, net merger and acquisitions, and equity investments • Free cash flow primarily includes net cash flows from operating activities and net cash flows from investing activities excluding certain capital expenditures, net merger and acquisitions, and equity investments • Operating ROE is calculated using operating net income divided by average equity for the period. The operating income reflects all lines of business for the utility business (Electric Distribution, Gas Distribution, Transmission). • EBITDA is defined as earnings before interest, taxes, depreciation and amortization. Includes nuclear fuel amortization expense. • Revenue net of purchased power and fuel expense is calculated as the GAAP measure of operating revenue less the GAAP measure of purchased power and fuel expense Due to the forward-looking nature of some forecasted non-GAAP measures, information to reconcile the forecasted adjusted (non-GAAP) measures to the most directly comparable GAAP measure may not be currently available, as management is unable to project all of these items for future periods 3 Q1 2020 Earnings Release Slides
Non-GAAP Financial Measures Continued This information is intended to enhance an investor’s overall understanding of period over period financial results and provide an indication of Exelon’s baseline operating performance by excluding items that are considered by management to be not directly related to the ongoing operations of the business. In addition, this information is among the primary indicators management uses as a basis for evaluating performance, allocating resources, setting incentive compensation targets and planning and forecasting of future periods. These non-GAAP financial measures are not a presentation defined under GAAP and may not be comparable to other companies’ presentations. Exelon has provided these non-GAAP financial measures as supplemental information and in addition to the financial measures that are calculated and presented in accordance with GAAP. These non-GAAP measures should not be deemed more useful than, a substitute for, or an alternative to the most comparable GAAP measures provided in the materials presented. Non-GAAP financial measures are identified by the phrase “non-GAAP” or an asterisk (*). Reconciliations of these non-GAAP measures to the most comparable GAAP measures are provided in the appendices and attachments to this presentation, except for the reconciliation for total gross margin, which appears on slide 44 of this presentation. 4 Q1 2020 Earnings Release Slides
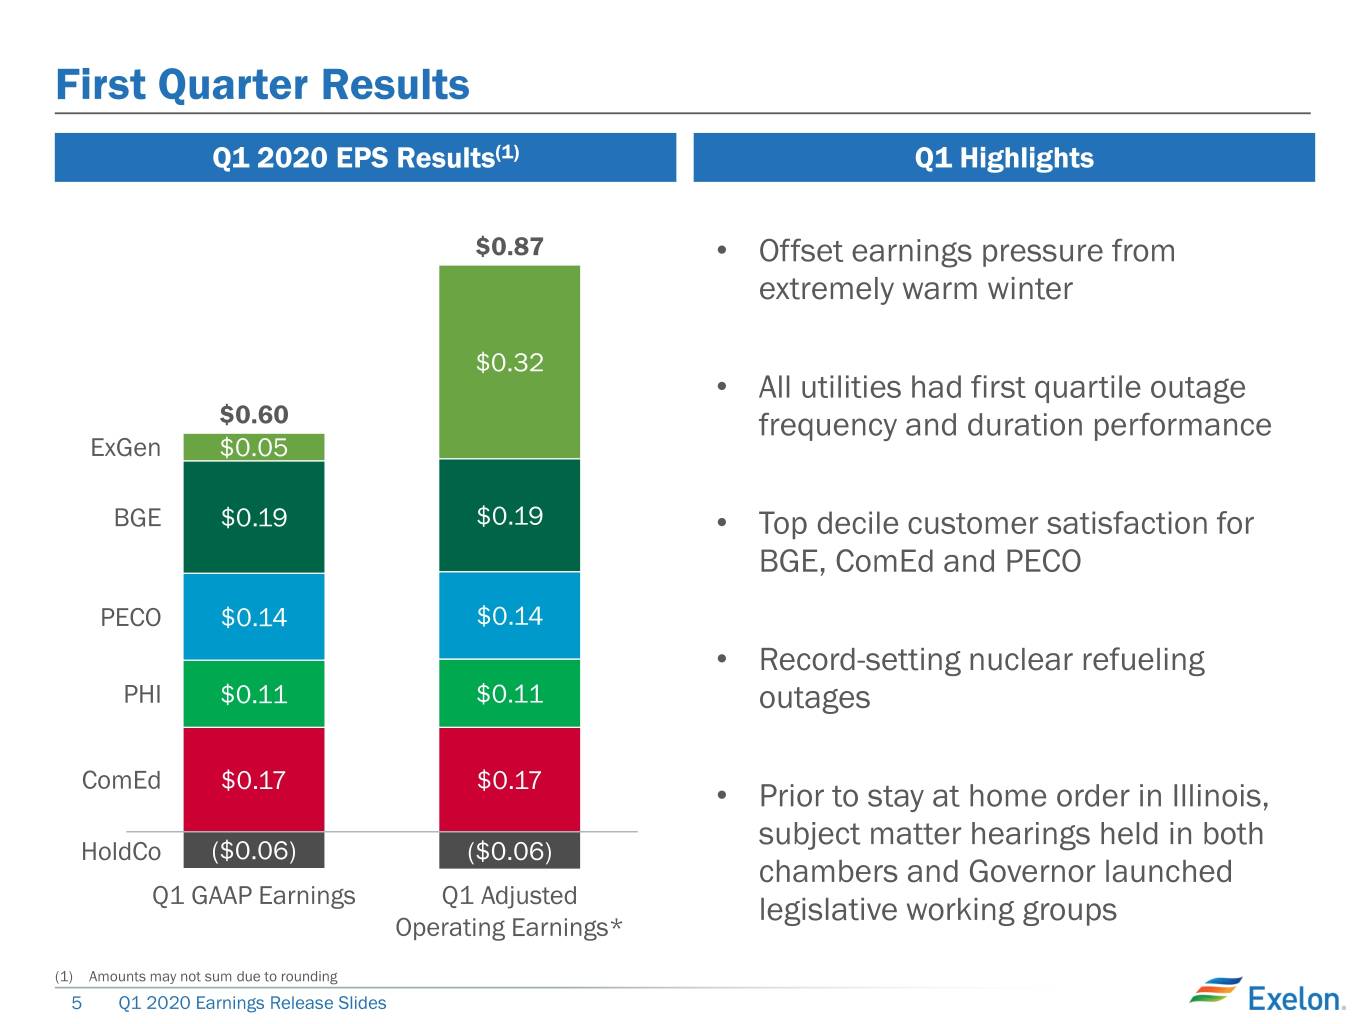
First Quarter Results Q1 2020 EPS Results(1) Q1 Highlights $0.87 • Offset earnings pressure from extremely warm winter $0.32 • All utilities had first quartile outage $0.60 frequency and duration performance ExGen $0.05 BGE $0.19 $0.19 • Top decile customer satisfaction for BGE, ComEd and PECO PECO $0.14 $0.14 • Record-setting nuclear refueling PHI $0.11 $0.11 outages ComEd $0.17 $0.17 • Prior to stay at home order in Illinois, subject matter hearings held in both HoldCo ($0.06) ($0.06) chambers and Governor launched Q1 GAAP Earnings Q1 Adjusted legislative working groups Operating Earnings* (1) Amounts may not sum due to rounding 5 Q1 2020 Earnings Release Slides
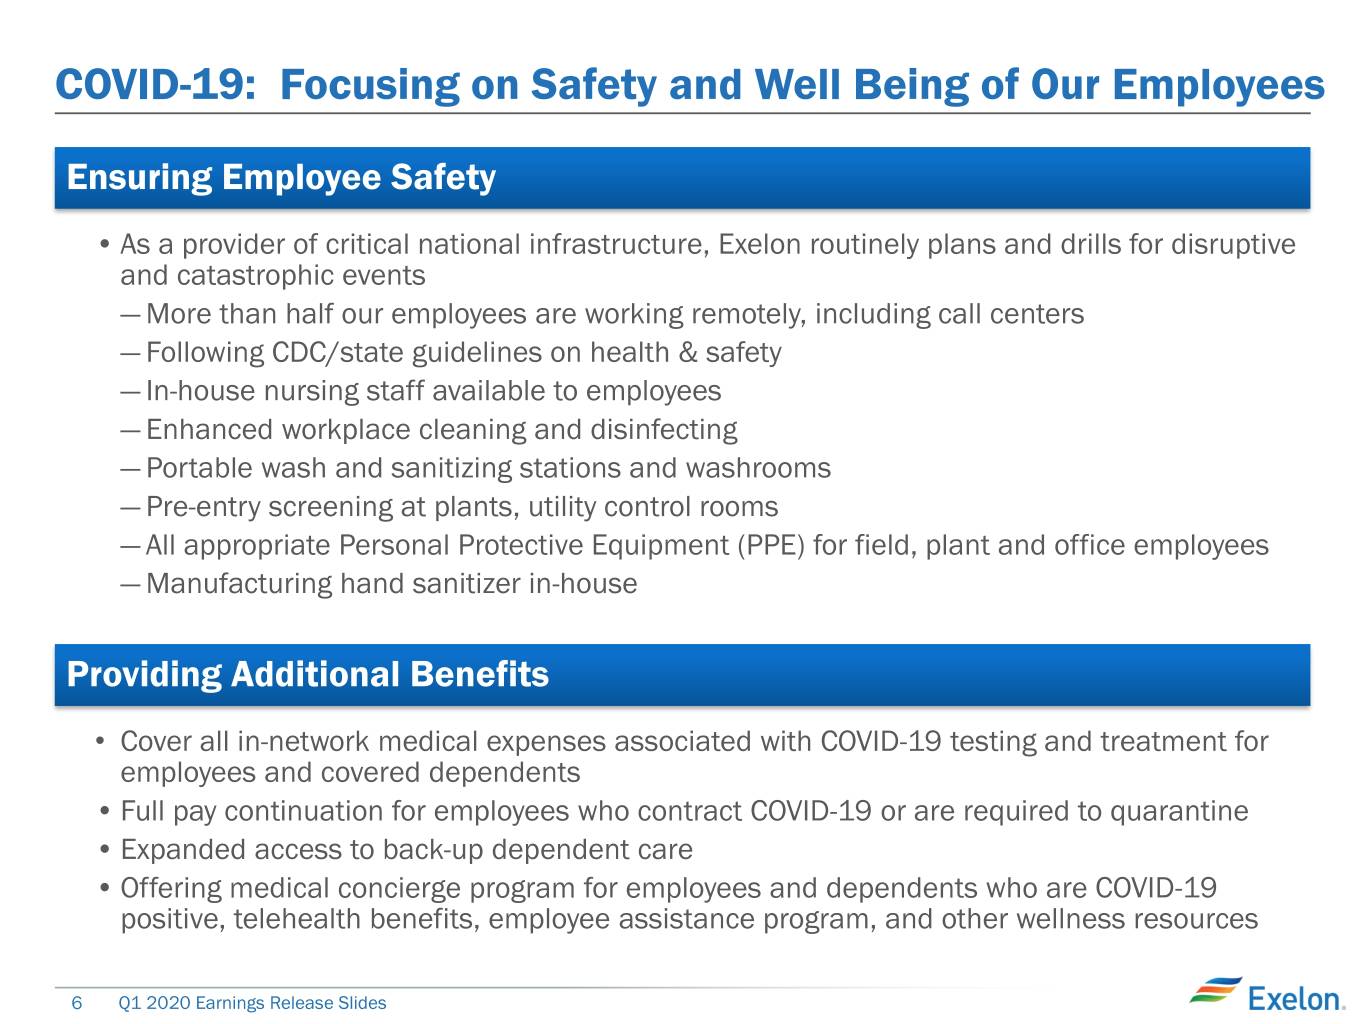
COVID-19: Focusing on Safety and Well Being of Our Employees Ensuring Employee Safety • As a provider of critical national infrastructure, Exelon routinely plans and drills for disruptive and catastrophic events ― More than half our employees are working remotely, including call centers ― Following CDC/state guidelines on health & safety ― In-house nursing staff available to employees ― Enhanced workplace cleaning and disinfecting ― Portable wash and sanitizing stations and washrooms ― Pre-entry screening at plants, utility control rooms ― All appropriate Personal Protective Equipment (PPE) for field, plant and office employees ― Manufacturing hand sanitizer in-house Providing Additional Benefits • Cover all in-network medical expenses associated with COVID-19 testing and treatment for employees and covered dependents • Full pay continuation for employees who contract COVID-19 or are required to quarantine • Expanded access to back-up dependent care • Offering medical concierge program for employees and dependents who are COVID-19 positive, telehealth benefits, employee assistance program, and other wellness resources 6 Q1 2020 Earnings Release Slides
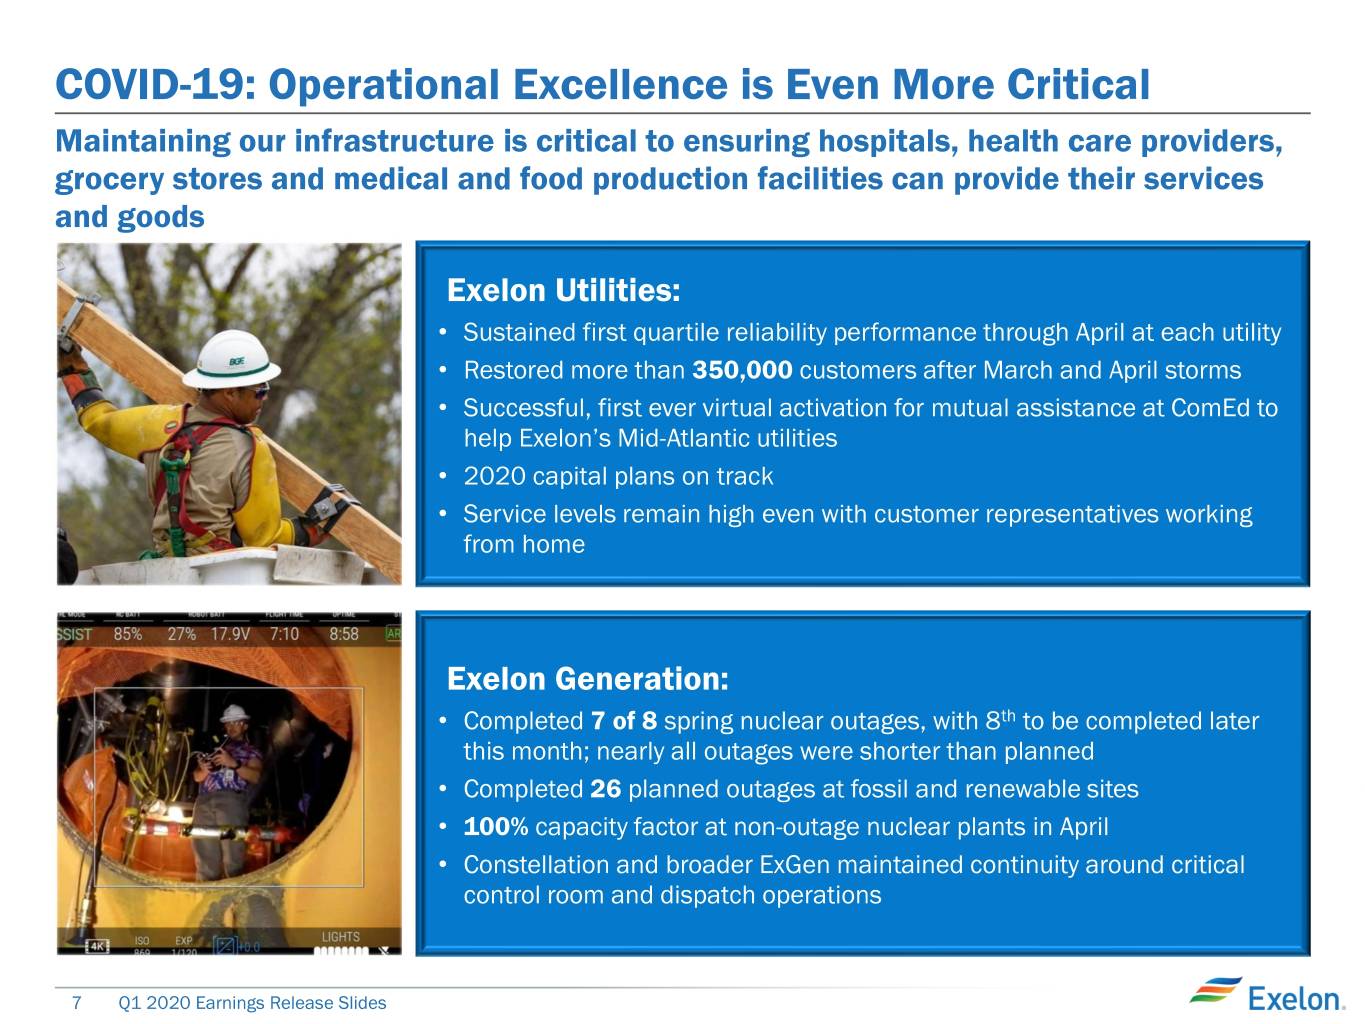
COVID-19: Operational Excellence is Even More Critical Maintaining our infrastructure is critical to ensuring hospitals, health care providers, grocery stores and medical and food production facilities can provide their services and goods Exelon Utilities: • Sustained first quartile reliability performance through April at each utility • Restored more than 350,000 customers after March and April storms • Successful, first ever virtual activation for mutual assistance at ComEd to help Exelon’s Mid-Atlantic utilities • 2020 capital plans on track • Service levels remain high even with customer representatives working from home Exelon Generation: • Completed 7 of 8 spring nuclear outages, with 8th to be completed later this month; nearly all outages were shorter than planned • Completed 26 planned outages at fossil and renewable sites • 100% capacity factor at non-outage nuclear plants in April • Constellation and broader ExGen maintained continuity around critical control room and dispatch operations 7 Q1 2020 Earnings Release Slides
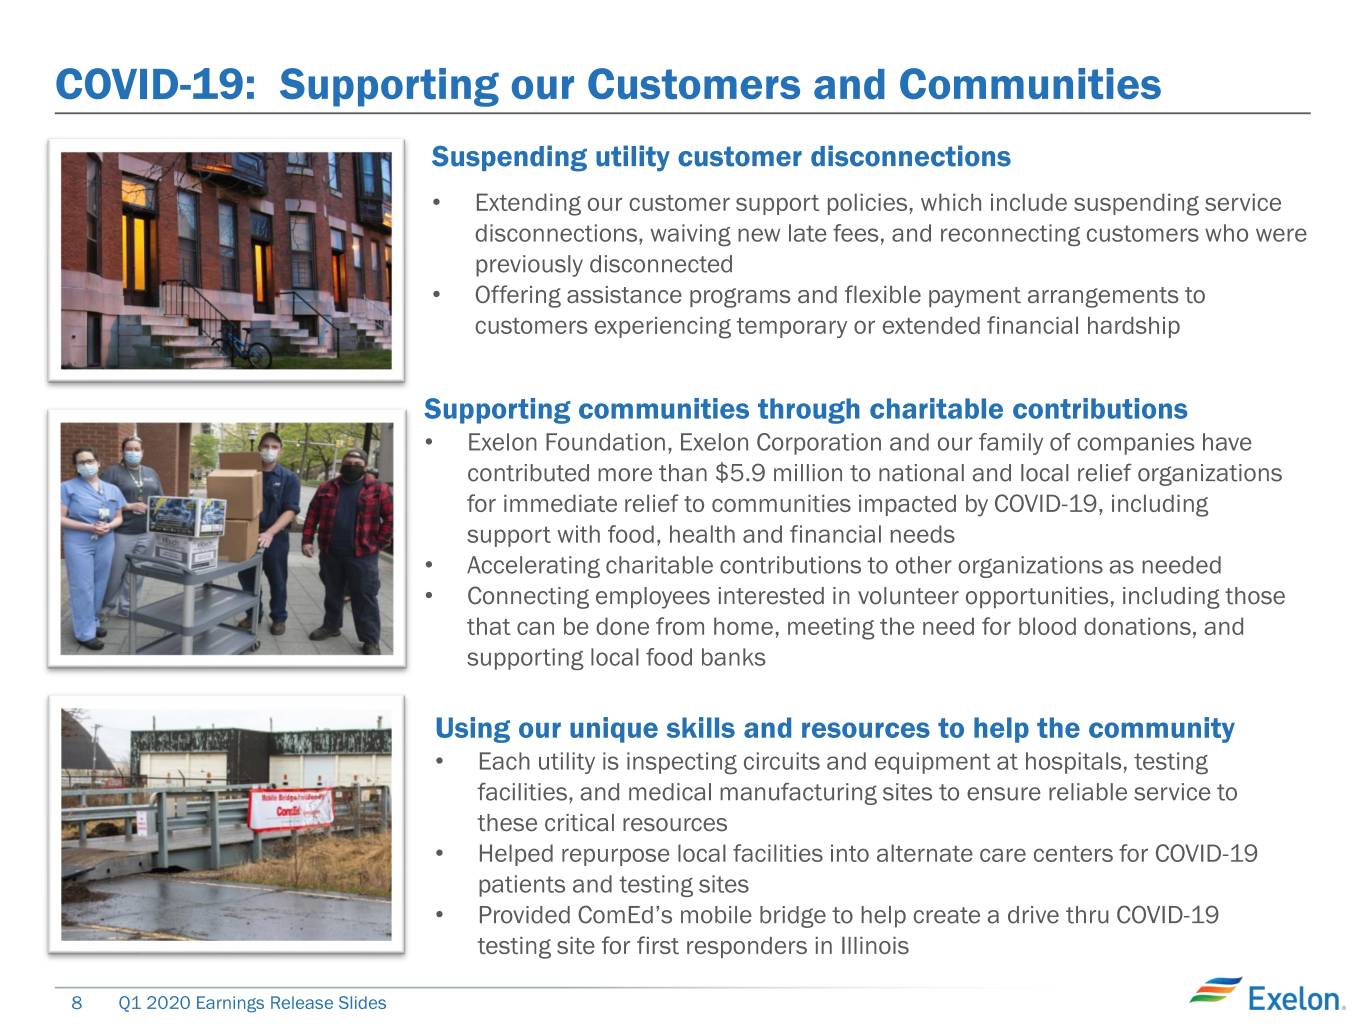
COVID-19: Supporting our Customers and Communities Suspending utility customer disconnections • Extending our customer support policies, which include suspending service disconnections, waiving new late fees, and reconnecting customers who were previously disconnected • Offering assistance programs and flexible payment arrangements to customers experiencing temporary or extended financial hardship Supporting communities through charitable contributions • Exelon Foundation, Exelon Corporation and our family of companies have contributed more than $5.9 million to national and local relief organizations for immediate relief to communities impacted by COVID-19, including support with food, health and financial needs • Accelerating charitable contributions to other organizations as needed • Connecting employees interested in volunteer opportunities, including those that can be done from home, meeting the need for blood donations, and supporting local food banks Using our unique skills and resources to help the community • Each utility is inspecting circuits and equipment at hospitals, testing facilities, and medical manufacturing sites to ensure reliable service to these critical resources • Helped repurpose local facilities into alternate care centers for COVID-19 patients and testing sites • Provided ComEd’s mobile bridge to help create a drive thru COVID-19 testing site for first responders in Illinois 8 Q1 2020 Earnings Release Slides
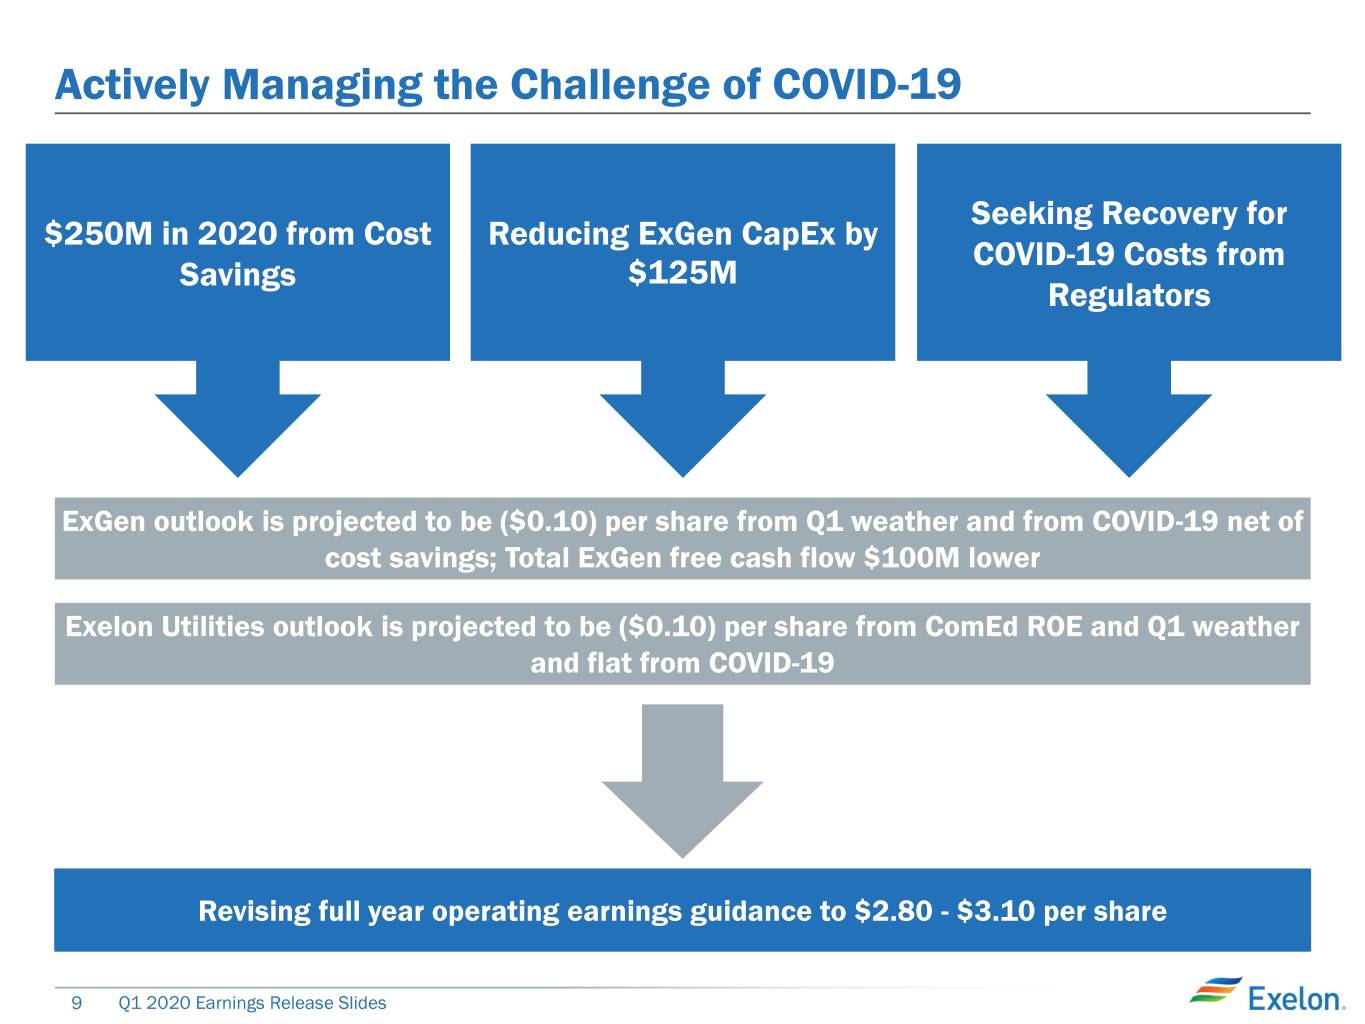
Actively Managing the Challenge of COVID-19 Seeking Recovery for $250M in 2020 from Cost Reducing ExGen CapEx by COVID-19 Costs from Savings $125M Regulators ExGen outlook is projected to be ($0.10) per share from Q1 weather and from COVID-19 net of cost savings; Total ExGen free cash flow $100M lower Exelon Utilities outlook is projected to be ($0.10) per share from ComEd ROE and Q1 weather and flat from COVID-19 Revising full year operating earnings guidance to $2.80 - $3.10 per share 9 Q1 2020 Earnings Release Slides
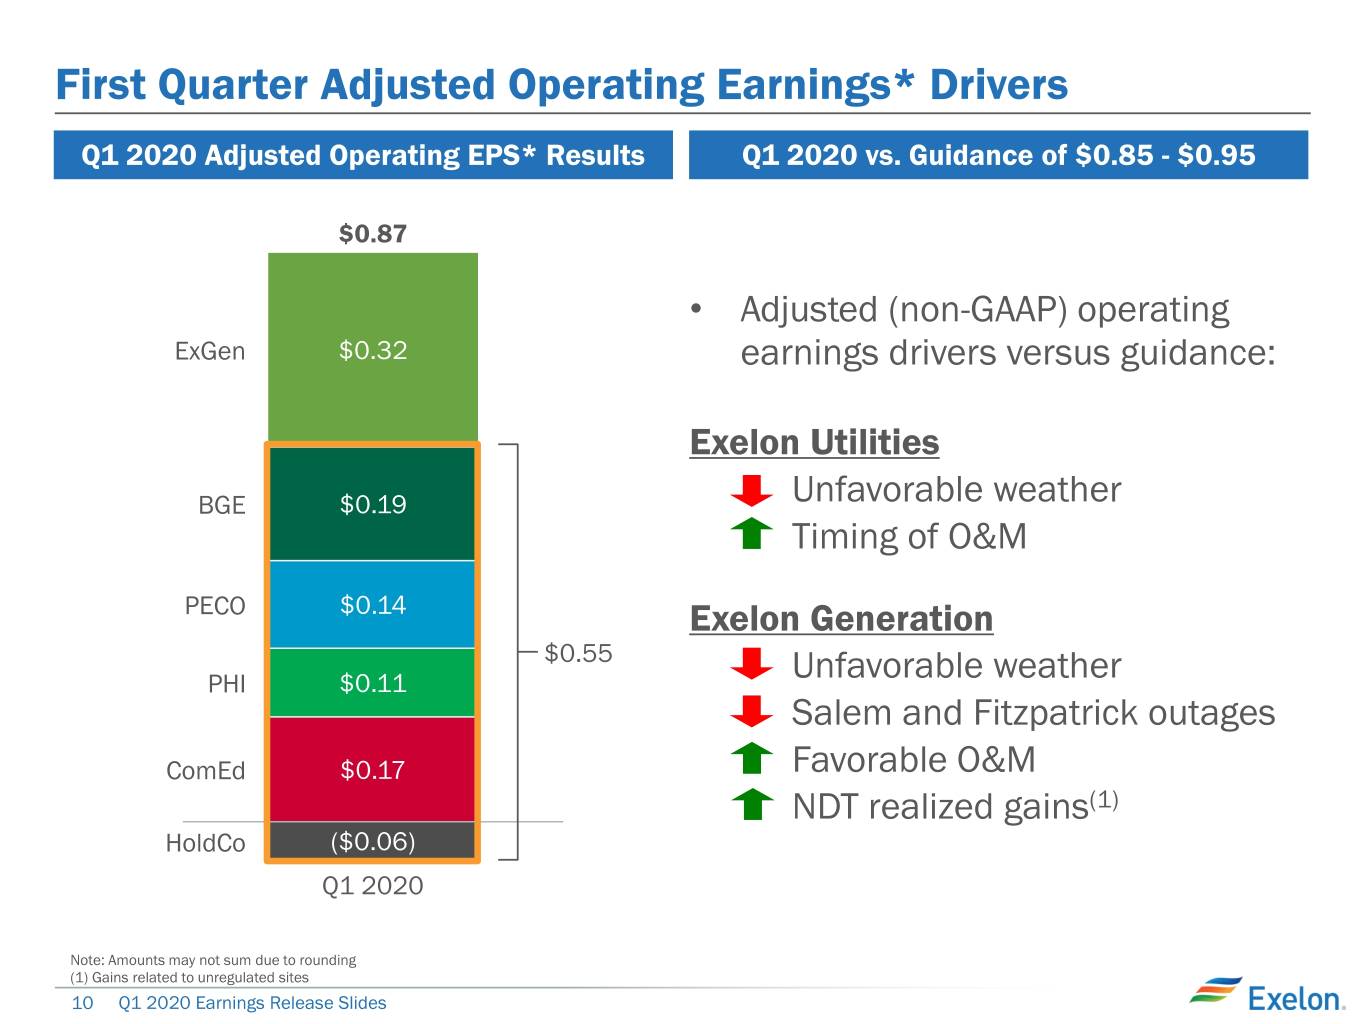
First Quarter Adjusted Operating Earnings* Drivers Q1 2020 Adjusted Operating EPS* Results Q1 2020 vs. Guidance of $0.85 - $0.95 $0.87 • Adjusted (non-GAAP) operating ExGen $0.32 earnings drivers versus guidance: Exelon Utilities BGE $0.19 – Unfavorable weather – Timing of O&M PECO $0.14 Exelon Generation $0.55 PHI $0.11 – Unfavorable weather – Salem and Fitzpatrick outages ComEd $0.17 – Favorable O&M – NDT realized gains(1) HoldCo ($0.06) Q1 2020 Note: Amounts may not sum due to rounding (1) Gains related to unregulated sites 10 Q1 2020 Earnings Release Slides
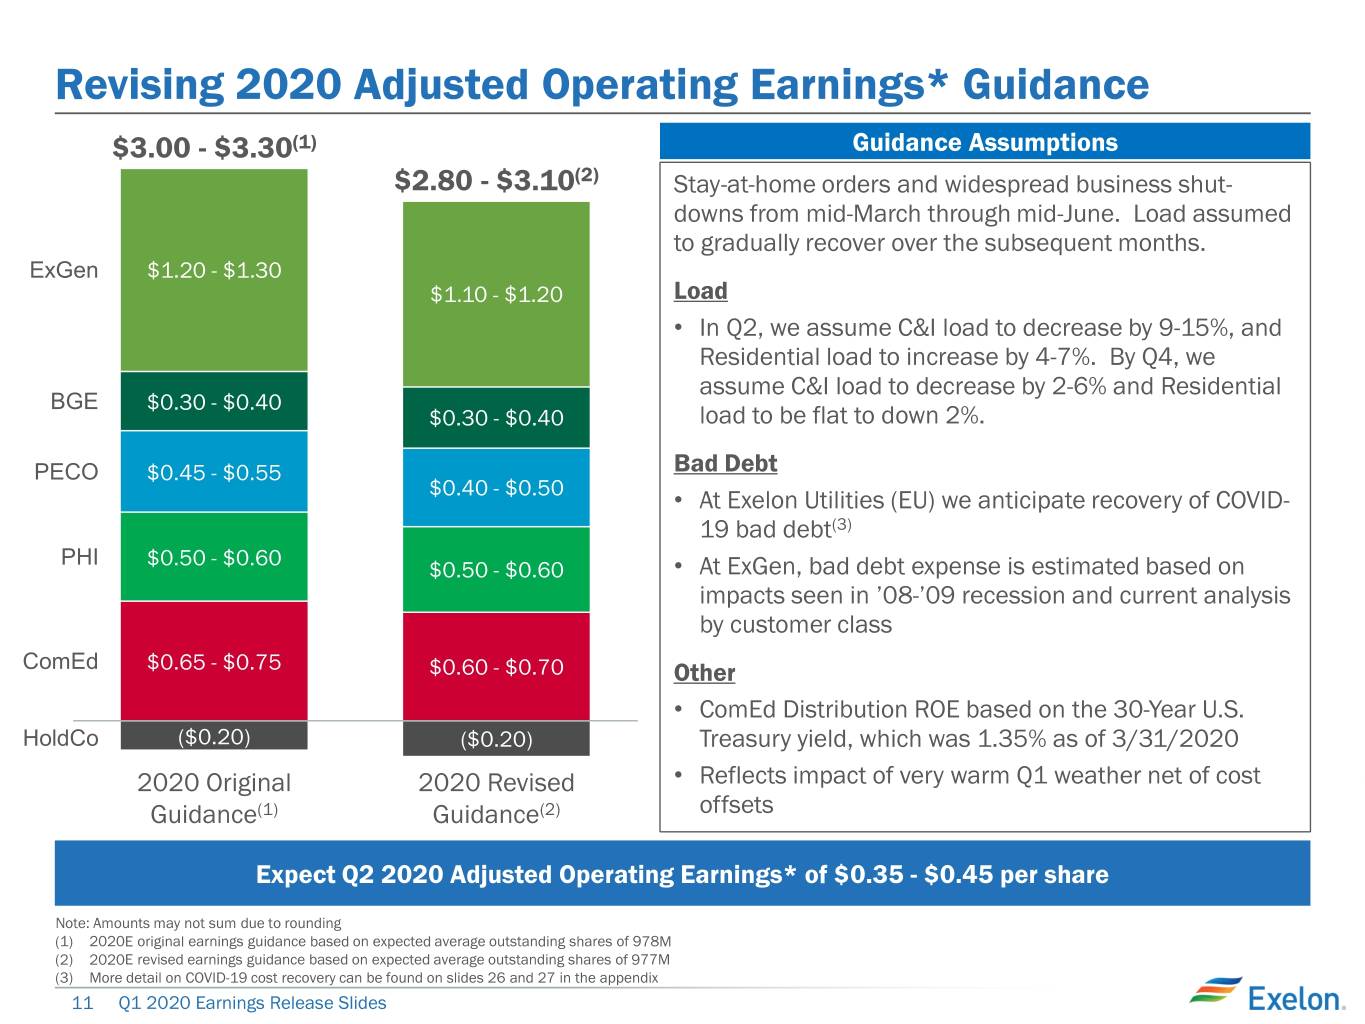
Revising 2020 Adjusted Operating Earnings* Guidance $3.00 - $3.30(1) Guidance Assumptions $2.80 - $3.10(2) Stay-at-home orders and widespread business shut- downs from mid-March through mid-June. Load assumed to gradually recover over the subsequent months. ExGen $1.20 - $1.30 $1.10 - $1.20 Load • In Q2, we assume C&I load to decrease by 9-15%, and Residential load to increase by 4-7%. By Q4, we assume C&I load to decrease by 2-6% and Residential BGE $0.30 - $0.40 $0.30 - $0.40 load to be flat to down 2%. PECO $0.45 - $0.55 Bad Debt $0.40 - $0.50 • At Exelon Utilities (EU) we anticipate recovery of COVID- 19 bad debt(3) PHI $0.50 - $0.60 $0.50 - $0.60 • At ExGen, bad debt expense is estimated based on impacts seen in ’08-’09 recession and current analysis by customer class ComEd $0.65 - $0.75 $0.60 - $0.70 Other • ComEd Distribution ROE based on the 30-Year U.S. HoldCo ($0.20) ($0.20) Treasury yield, which was 1.35% as of 3/31/2020 2020 Original 2020 Revised • Reflects impact of very warm Q1 weather net of cost Guidance(1) Guidance(2) offsets Expect Q2 2020 Adjusted Operating Earnings* of $0.35 - $0.45 per share Note: Amounts may not sum due to rounding (1) 2020E original earnings guidance based on expected average outstanding shares of 978M (2) 2020E revised earnings guidance based on expected average outstanding shares of 977M (3) More detail on COVID-19 cost recovery can be found on slides 26 and 27 in the appendix 11 Q1 2020 Earnings Release Slides
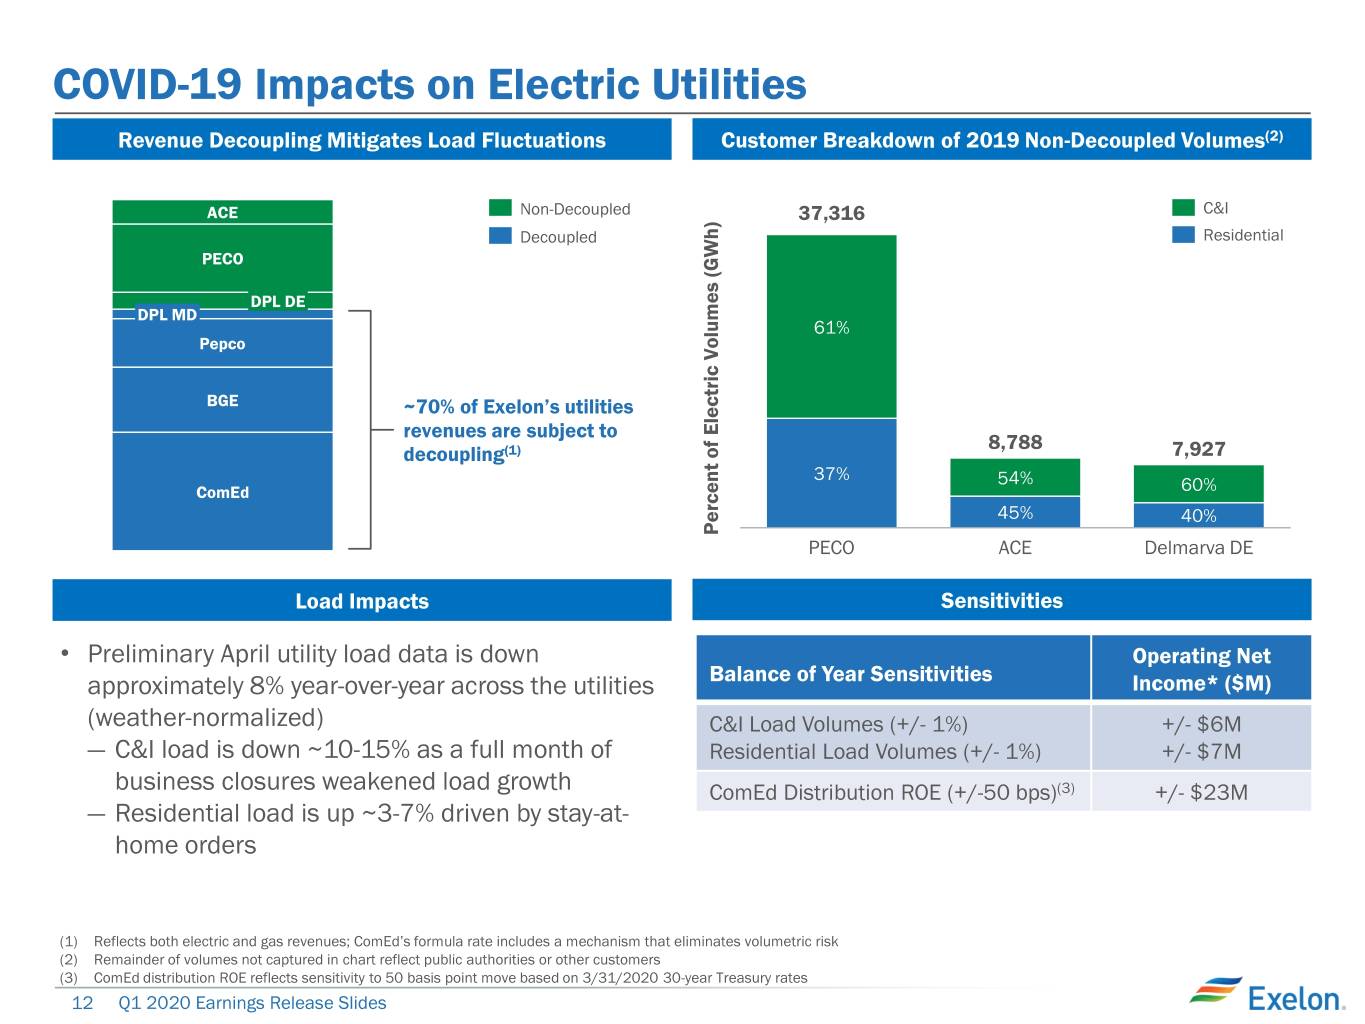
COVID-19 Impacts on Electric Utilities Revenue Decoupling Mitigates Load Fluctuations Customer Breakdown of 2019 Non-Decoupled Volumes(2) ACE Non-Decoupled 37,316 C&I Decoupled Residential PECO DPL DE DPL MD 61% Pepco BGE ~70% of Exelon’s utilities revenues are subject to 8,788 decoupling(1) 7,927 37% 54% ComEd 60% 45% 40% Percent of Electric Volumes (GWh) Volumes of Electric Percent PECO ACE Delmarva DE Load Impacts Sensitivities • Preliminary April utility load data is down Operating Net approximately 8% year-over-year across the utilities Balance of Year Sensitivities Income* ($M) (weather-normalized) C&I Load Volumes (+/- 1%) +/- $6M ― C&I load is down ~10-15% as a full month of Residential Load Volumes (+/- 1%) +/- $7M business closures weakened load growth ComEd Distribution ROE (+/-50 bps)(3) +/- $23M ― Residential load is up ~3-7% driven by stay-at- home orders (1) Reflects both electric and gas revenues; ComEd’s formula rate includes a mechanism that eliminates volumetric risk (2) Remainder of volumes not captured in chart reflect public authorities or other customers (3) ComEd distribution ROE reflects sensitivity to 50 basis point move based on 3/31/2020 30-year Treasury rates 12 Q1 2020 Earnings Release Slides
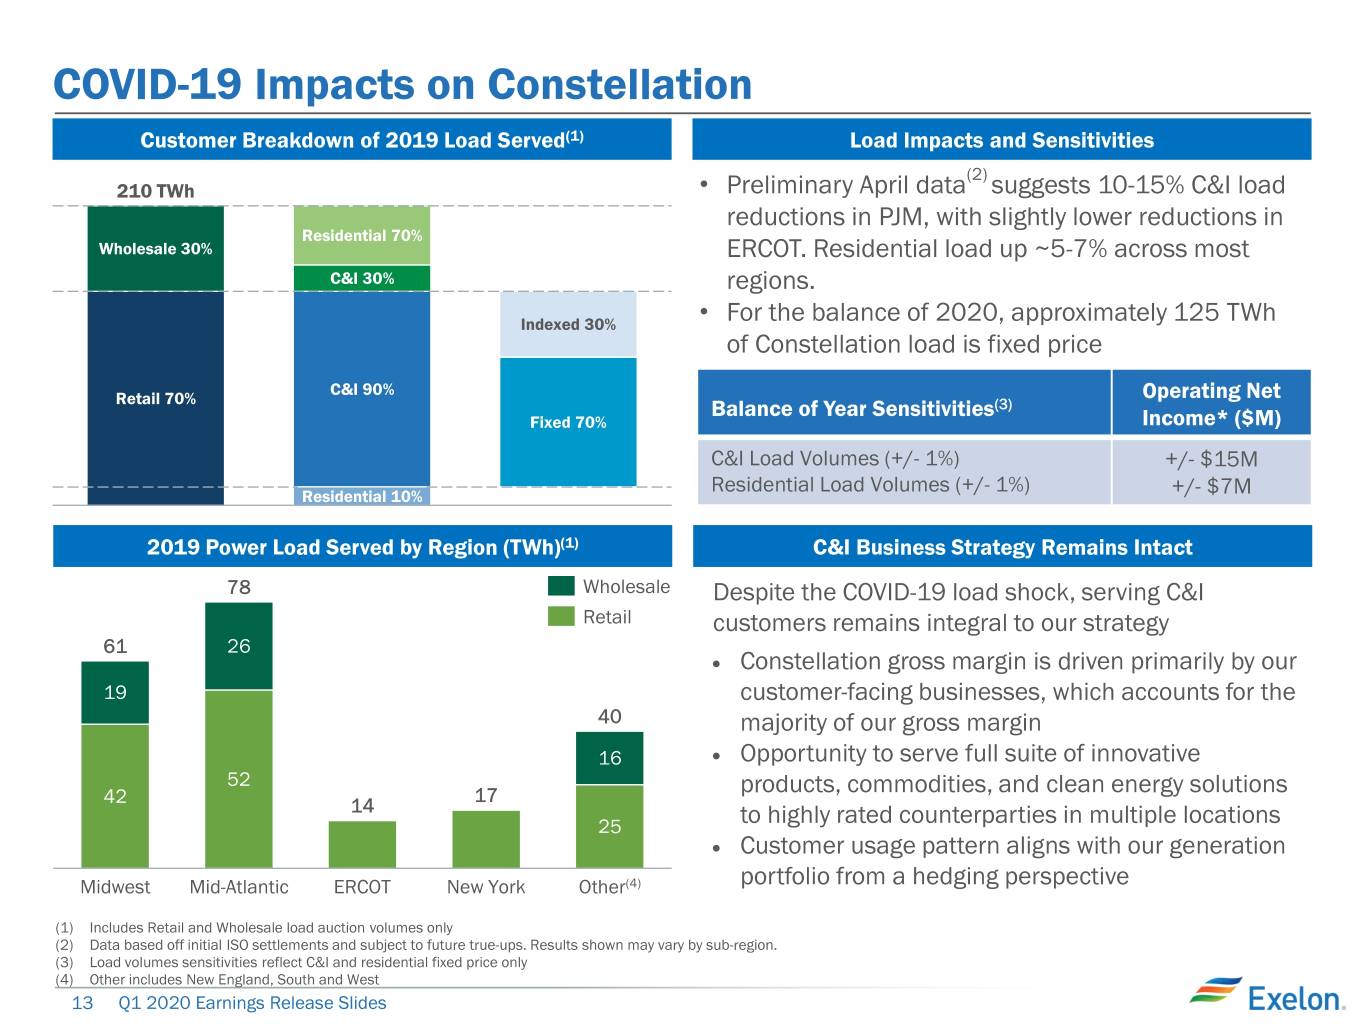
COVID-19 Impacts on Constellation Customer Breakdown of 2019 Load Served(1) Load Impacts and Sensitivities (2) 210 TWh • Preliminary April data suggests 10-15% C&I load reductions in PJM, with slightly lower reductions in Residential 70% Wholesale 30% ERCOT. Residential load up ~5-7% across most C&I 30% regions. Indexed 30% • For the balance of 2020, approximately 125 TWh of Constellation load is fixed price C&I 90% Operating Net Retail 70% Balance of Year Sensitivities(3) Fixed 70% Income* ($M) C&I Load Volumes (+/- 1%) +/- $15M Residential Load Volumes (+/- 1%) Residential 10% +/- $7M 2019 Power Load Served by Region (TWh)(1) C&I Business Strategy Remains Intact 78 Wholesale Despite the COVID-19 load shock, serving C&I Retail customers remains integral to our strategy 61 26 • Constellation gross margin is driven primarily by our 19 customer-facing businesses, which accounts for the 40 majority of our gross margin 16 • Opportunity to serve full suite of innovative 52 17 products, commodities, and clean energy solutions 42 14 25 to highly rated counterparties in multiple locations • Customer usage pattern aligns with our generation Midwest Mid-Atlantic ERCOT New York Other(4) portfolio from a hedging perspective (1) Includes Retail and Wholesale load auction volumes only (2) Data based off initial ISO settlements and subject to future true-ups. Results shown may vary by sub-region. (3) Load volumes sensitivities reflect C&I and residential fixed price only (4) Other includes New England, South and West 13 Q1 2020 Earnings Release Slides
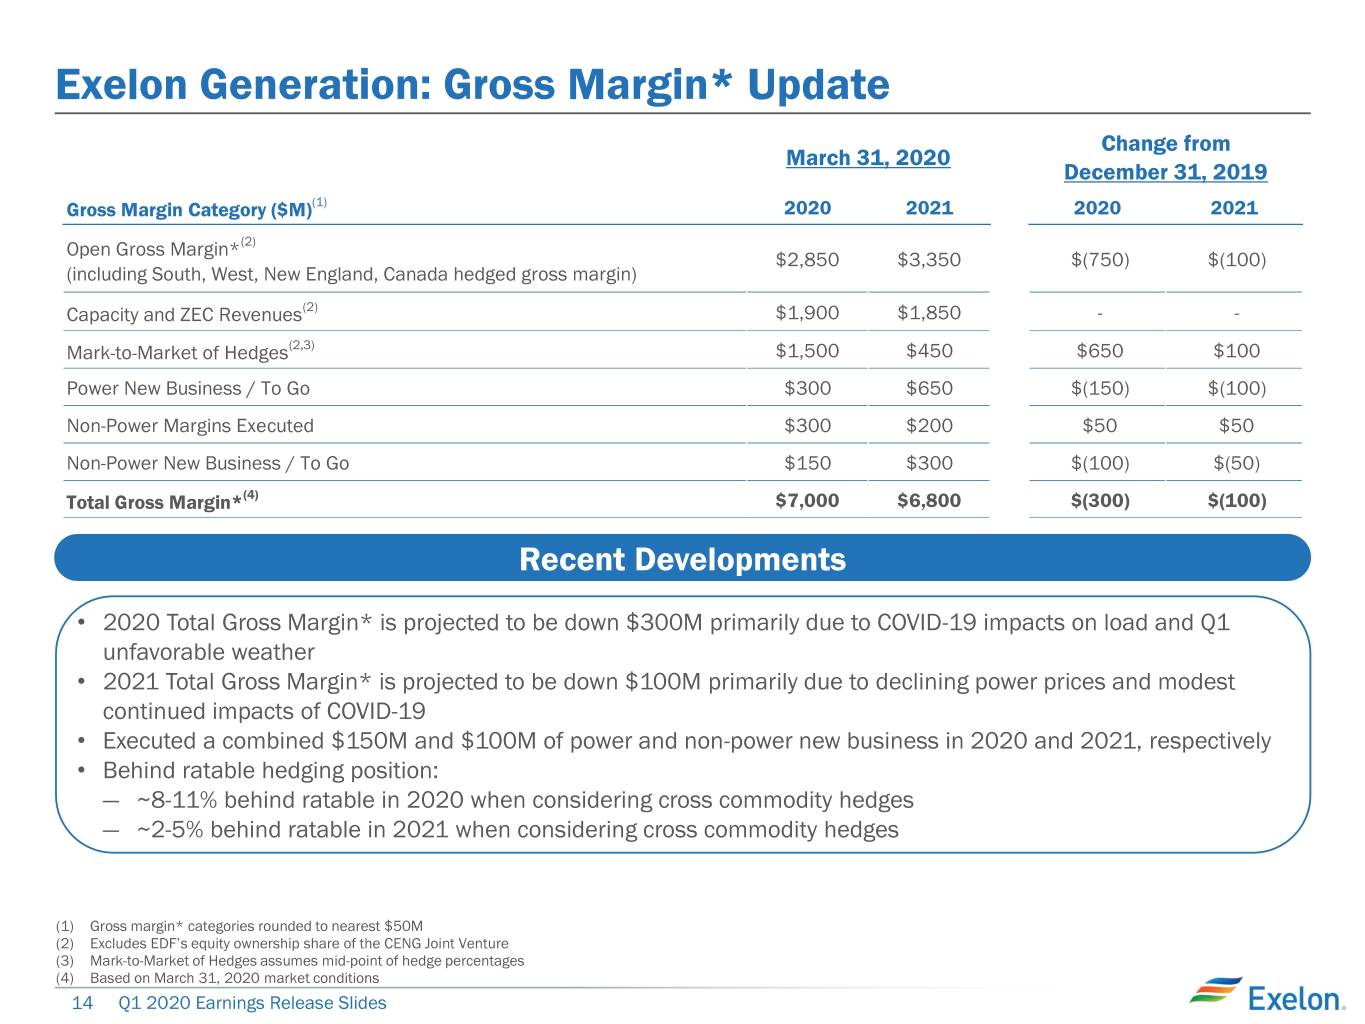
Exelon Generation: Gross Margin* Update Change from March 31, 2020 December 31, 2019 Gross Margin Category ($M)(1) 2020 2021 2020 2021 Open Gross Margin*(2) $2,850 $3,350 $(750) $(100) (including South, West, New England, Canada hedged gross margin) Capacity and ZEC Revenues(2) $1,900 $1,850 - - Mark-to-Market of Hedges(2,3) $1,500 $450 $650 $100 Power New Business / To Go $300 $650 $(150) $(100) Non-Power Margins Executed $300 $200 $50 $50 Non-Power New Business / To Go $150 $300 $(100) $(50) Total Gross Margin*(4) $7,000 $6,800 $(300) $(100) Recent Developments • 2020 Total Gross Margin* is projected to be down $300M primarily due to COVID-19 impacts on load and Q1 unfavorable weather • 2021 Total Gross Margin* is projected to be down $100M primarily due to declining power prices and modest continued impacts of COVID-19 • Executed a combined $150M and $100M of power and non-power new business in 2020 and 2021, respectively • Behind ratable hedging position: ― ~8-11% behind ratable in 2020 when considering cross commodity hedges ― ~2-5% behind ratable in 2021 when considering cross commodity hedges (1) Gross margin* categories rounded to nearest $50M (2) Excludes EDF’s equity ownership share of the CENG Joint Venture (3) Mark-to-Market of Hedges assumes mid-point of hedge percentages (4) Based on March 31, 2020 market conditions 14 Q1 2020 Earnings Release Slides
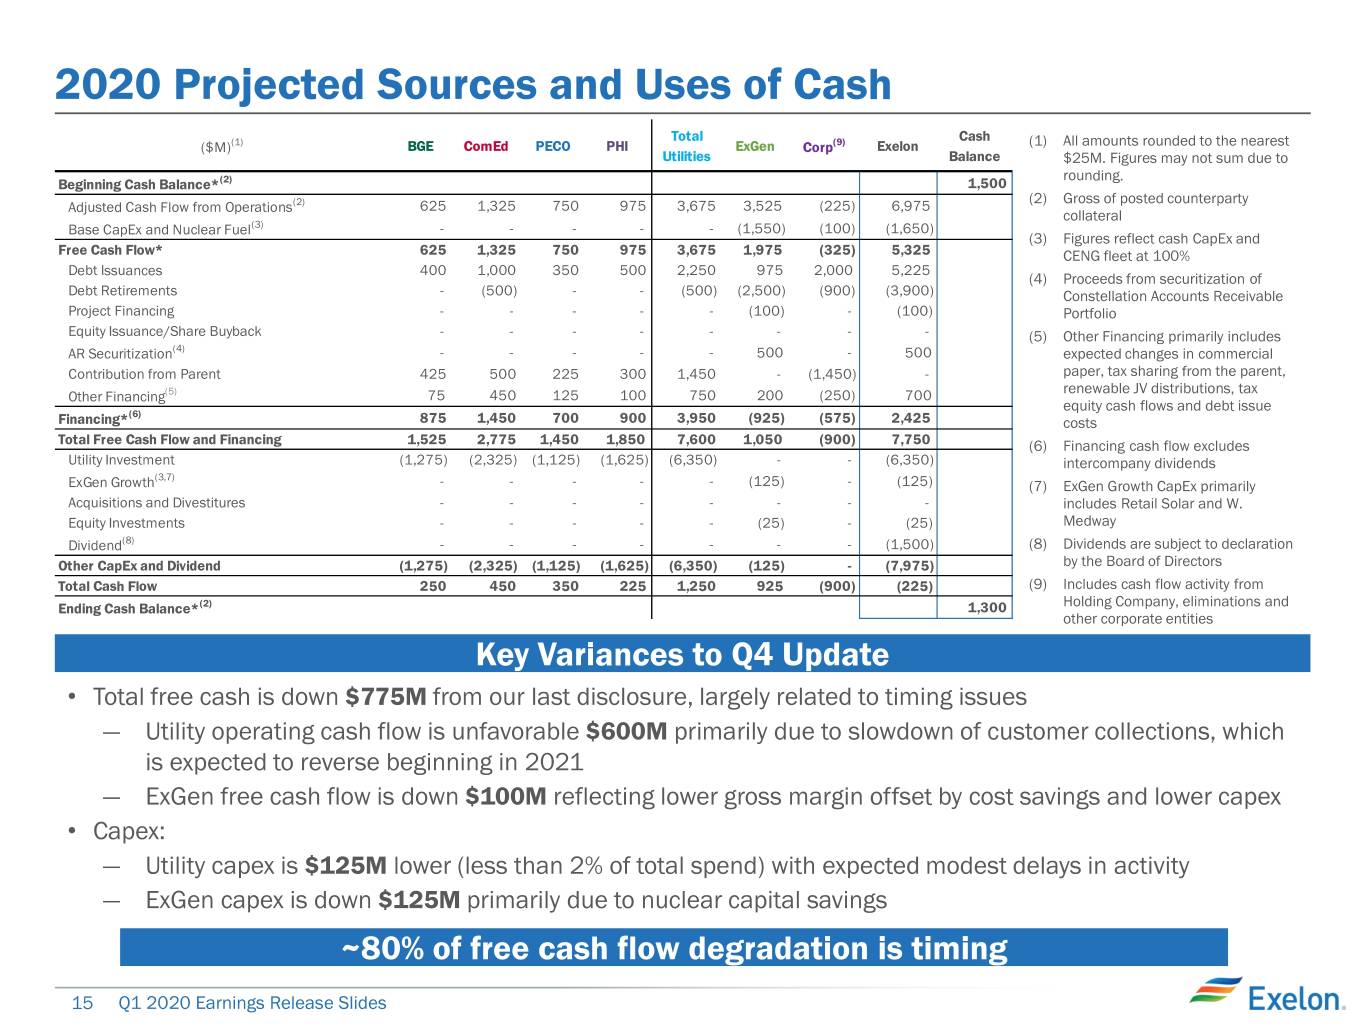
2020 Projected Sources and Uses of Cash Total Cash ($M)(1) BGE ComEd PECO PHI ExGen Corp(9) Exelon (1) All amounts rounded to the nearest Utilities Balance $25M. Figures may not sum due to rounding. Beginning Cash Balance*(2) 1,500 (2) Gross of posted counterparty Adjusted Cash Flow from Operations(2) 625 1,325 750 975 3,675 3,525 (225) 6,975 collateral Base CapEx and Nuclear Fuel(3) - - - - - (1,550) (100) (1,650) (3) Figures reflect cash CapEx and Free Cash Flow* 625 1,325 750 975 3,675 1,975 (325) 5,325 CENG fleet at 100% Debt Issuances 400 1,000 350 500 2,250 975 2,000 5,225 (4) Proceeds from securitization of Debt Retirements - (500) - - (500) (2,500) (900) (3,900) Constellation Accounts Receivable Project Financing - - - - - (100) - (100) Portfolio Equity Issuance/Share Buyback - - - - - - - - (5) Other Financing primarily includes AR Securitization(4) - - - - - 500 - 500 expected changes in commercial Contribution from Parent 425 500 225 300 1,450 - (1,450) - paper, tax sharing from the parent, renewable JV distributions, tax Other Financing(5) 75 450 125 100 750 200 (250) 700 equity cash flows and debt issue (6) Financing* 875 1,450 700 900 3,950 (925) (575) 2,425 costs Total Free Cash Flow and Financing 1,525 2,775 1,450 1,850 7,600 1,050 (900) 7,750 (6) Financing cash flow excludes Utility Investment (1,275) (2,325) (1,125) (1,625) (6,350) - - (6,350) intercompany dividends (3,7) ExGen Growth - - - - - (125) - (125) (7) ExGen Growth CapEx primarily Acquisitions and Divestitures - - - - - - - - includes Retail Solar and W. Equity Investments - - - - - (25) - (25) Medway Dividend(8) - - - - - - - (1,500) (8) Dividends are subject to declaration Other CapEx and Dividend (1,275) (2,325) (1,125) (1,625) (6,350) (125) - (7,975) by the Board of Directors Total Cash Flow 250 450 350 225 1,250 925 (900) (225) (9) Includes cash flow activity from Ending Cash Balance*(2) 1,300 Holding Company, eliminations and other corporate entities Key Variances to Q4 Update • Total free cash is down $775M from our last disclosure, largely related to timing issues ― Utility operating cash flow is unfavorable $600M primarily due to slowdown of customer collections, which is expected to reverse beginning in 2021 ― ExGen free cash flow is down $100M reflecting lower gross margin offset by cost savings and lower capex • Capex: ― Utility capex is $125M lower (less than 2% of total spend) with expected modest delays in activity ― ExGen capex is down $125M primarily due to nuclear capital savings ~80% of free cash flow degradation is timing 15 Q1 2020 Earnings Release Slides
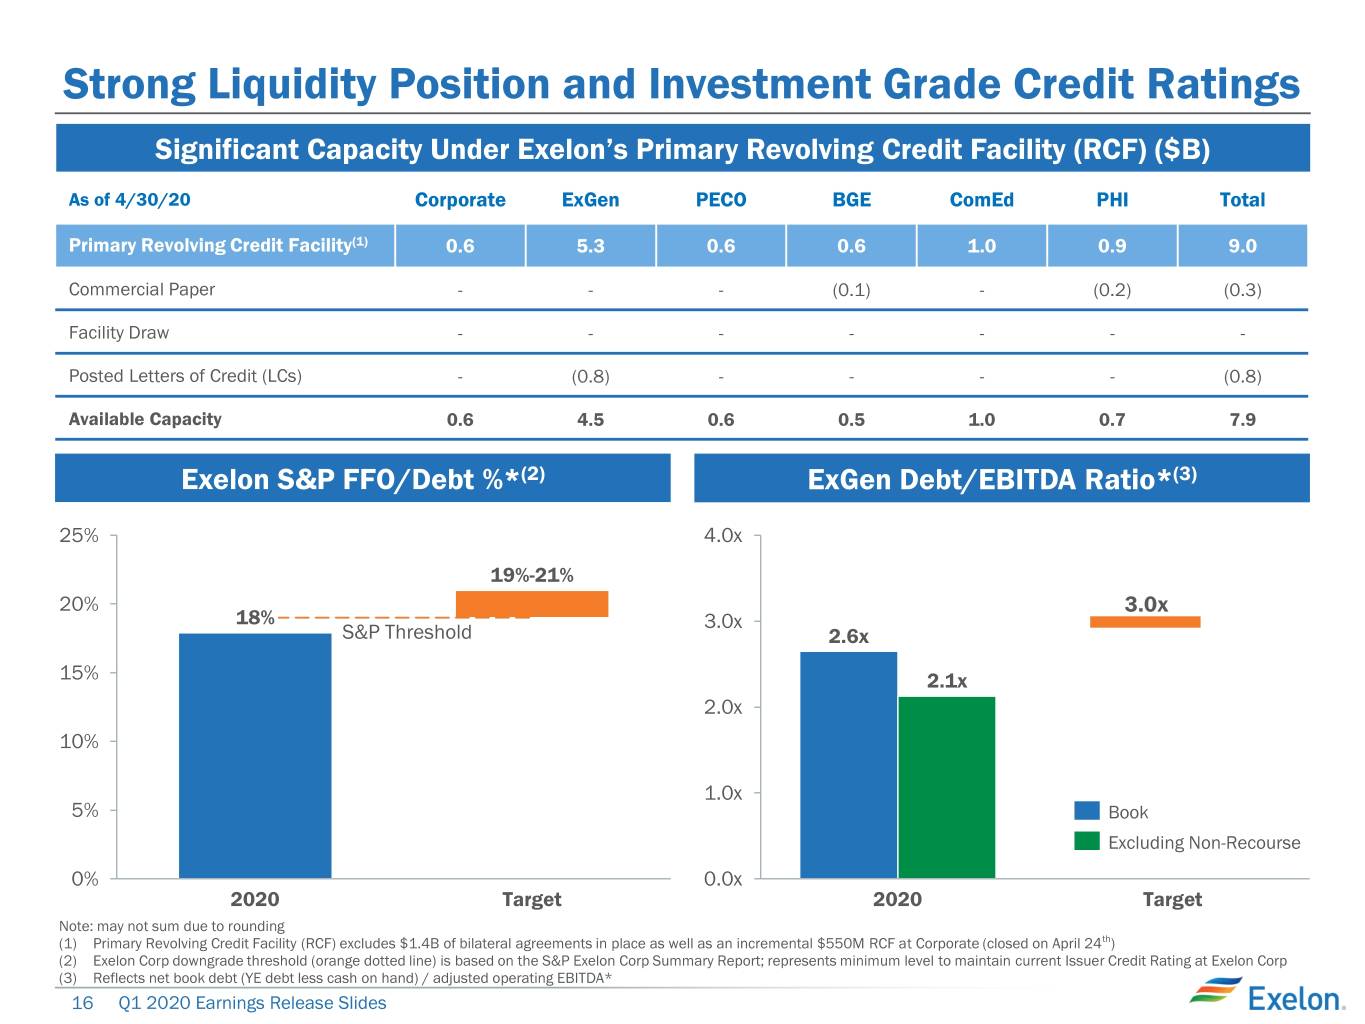
Strong Liquidity Position and Investment Grade Credit Ratings Significant Capacity Under Exelon’s Primary Revolving Credit Facility (RCF) ($B) As of 4/30/20 Corporate ExGen PECO BGE ComEd PHI Total Primary Revolving Credit Facility(1) 0.6 5.3 0.6 0.6 1.0 0.9 9.0 Commercial Paper - - - (0.1) - (0.2) (0.3) Facility Draw - - - - - - - Posted Letters of Credit (LCs) - (0.8) - - - - (0.8) Available Capacity 0.6 4.5 0.6 0.5 1.0 0.7 7.9 Exelon S&P FFO/Debt %*(2) ExGen Debt/EBITDA Ratio*(3) 25% 4.0x 19%-21% 20% 3.0x 18% 3.0x S&P Threshold 2.6x 15% 2.1x 2.0x 10% 1.0x 5% Book Excluding Non-Recourse 0% 0.0x 2020 Target 2020 Target Note: may not sum due to rounding (1) Primary Revolving Credit Facility (RCF) excludes $1.4B of bilateral agreements in place as well as an incremental $550M RCF at Corporate (closed on April 24th) (2) Exelon Corp downgrade threshold (orange dotted line) is based on the S&P Exelon Corp Summary Report; represents minimum level to maintain current Issuer Credit Rating at Exelon Corp (3) Reflects net book debt (YE debt less cash on hand) / adjusted operating EBITDA* 16 Q1 2020 Earnings Release Slides
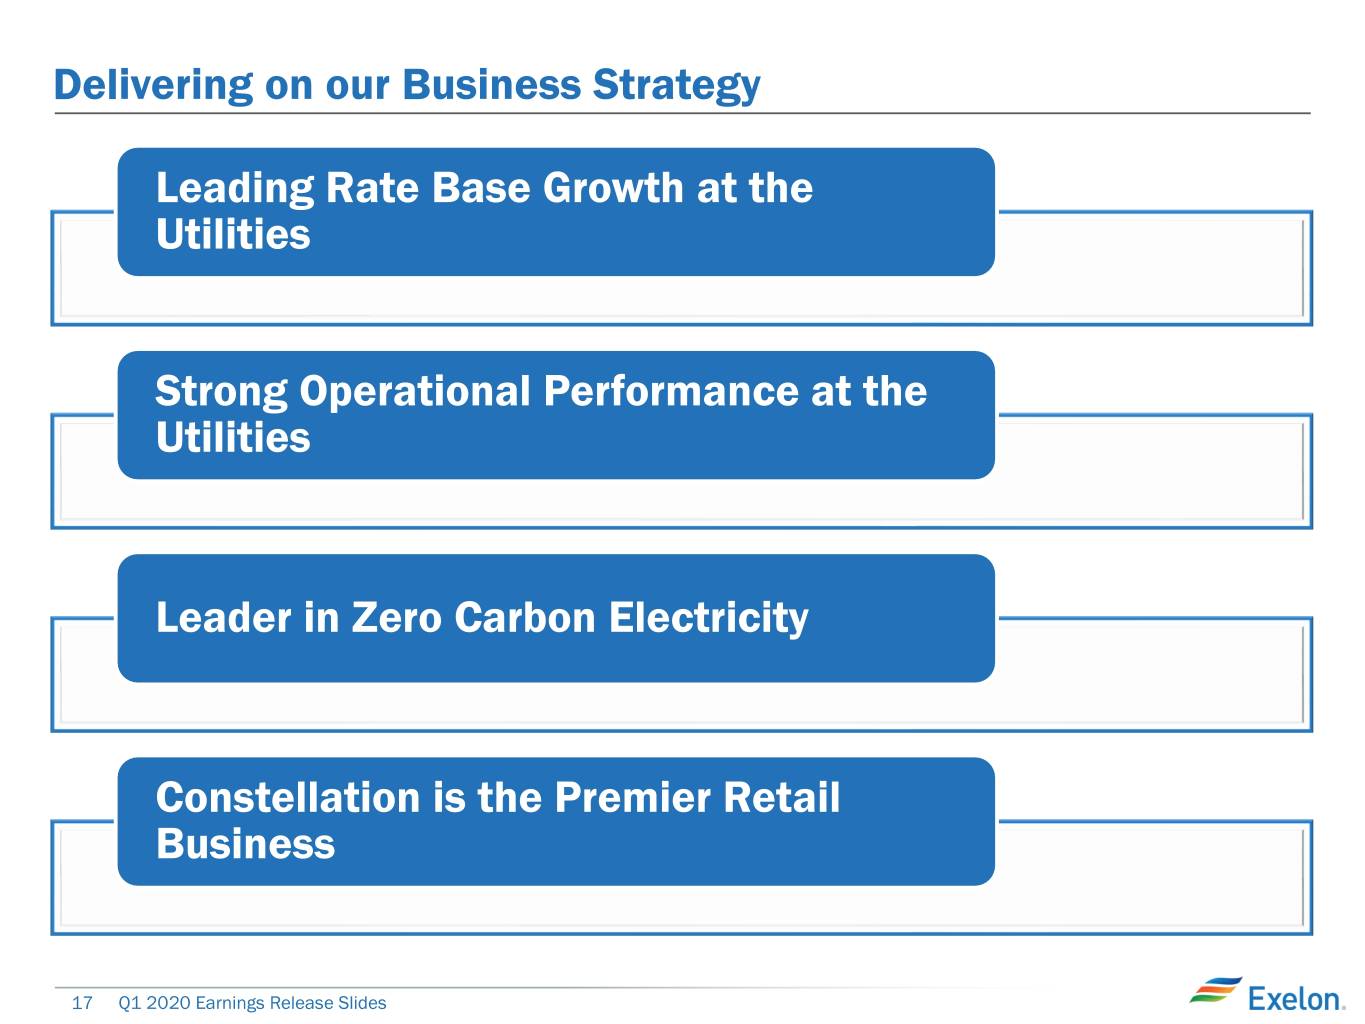
Delivering on our Business Strategy Leading Rate Base Growth at the Utilities Strong Operational Performance at the Utilities Leader in Zero Carbon Electricity Constellation is the Premier Retail Business 17 Q1 2020 Earnings Release Slides
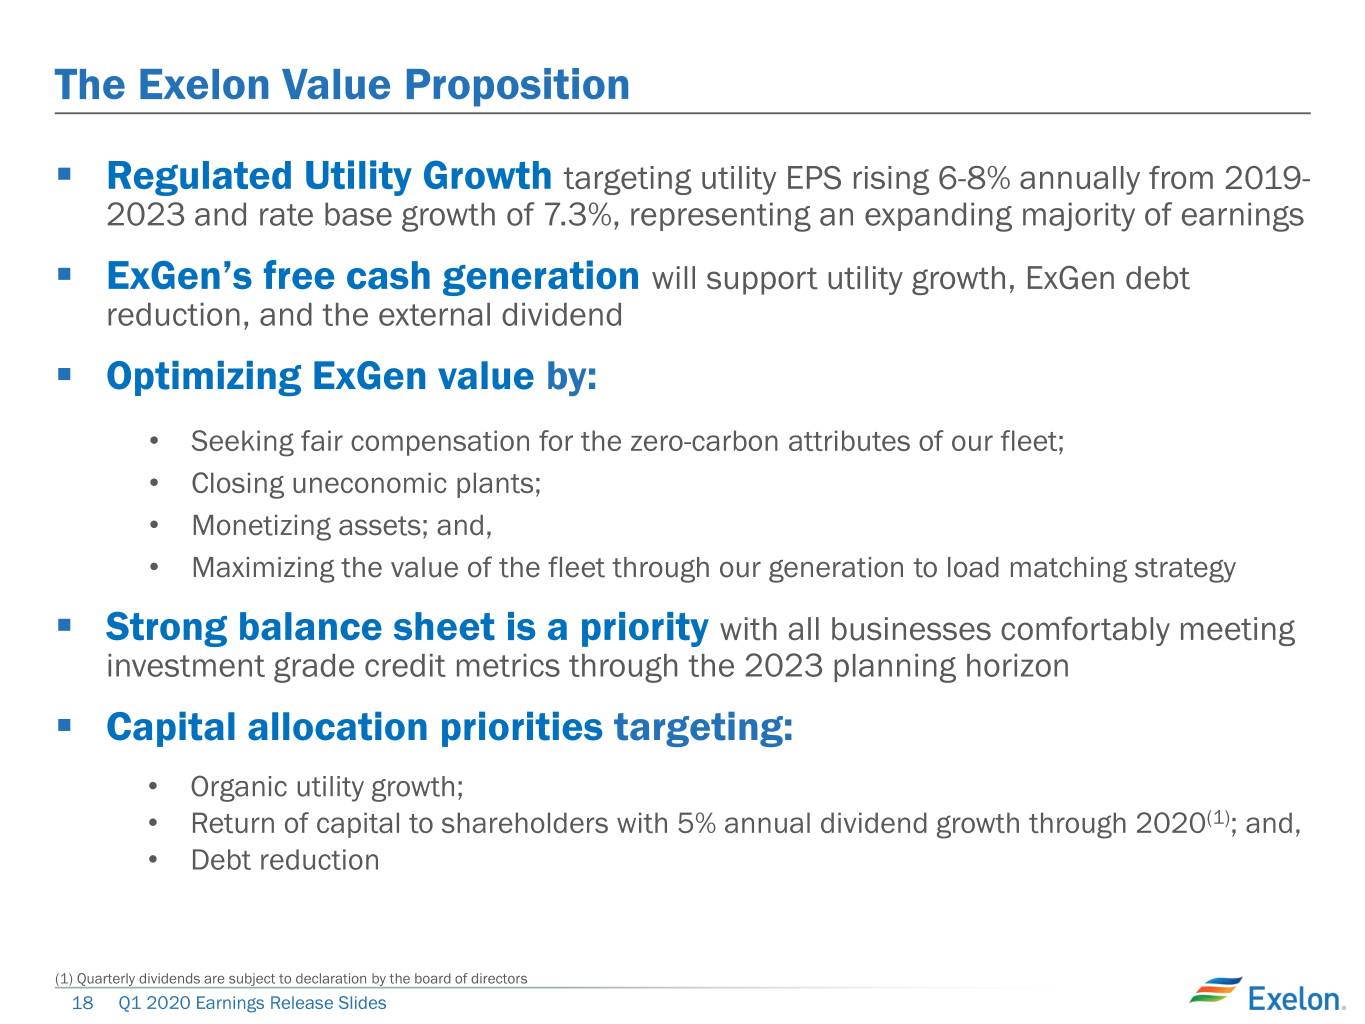
The Exelon Value Proposition ▪ Regulated Utility Growth targeting utility EPS rising 6-8% annually from 2019- 2023 and rate base growth of 7.3%, representing an expanding majority of earnings ▪ ExGen’s free cash generation will support utility growth, ExGen debt reduction, and the external dividend ▪ Optimizing ExGen value by: • Seeking fair compensation for the zero-carbon attributes of our fleet; • Closing uneconomic plants; • Monetizing assets; and, • Maximizing the value of the fleet through our generation to load matching strategy ▪ Strong balance sheet is a priority with all businesses comfortably meeting investment grade credit metrics through the 2023 planning horizon ▪ Capital allocation priorities targeting: • Organic utility growth; • Return of capital to shareholders with 5% annual dividend growth through 2020(1); and, • Debt reduction (1) Quarterly dividends are subject to declaration by the board of directors 18 Q1 2020 Earnings Release Slides
Additional Disclosures 19 Q1 2020 Earnings Release Slides
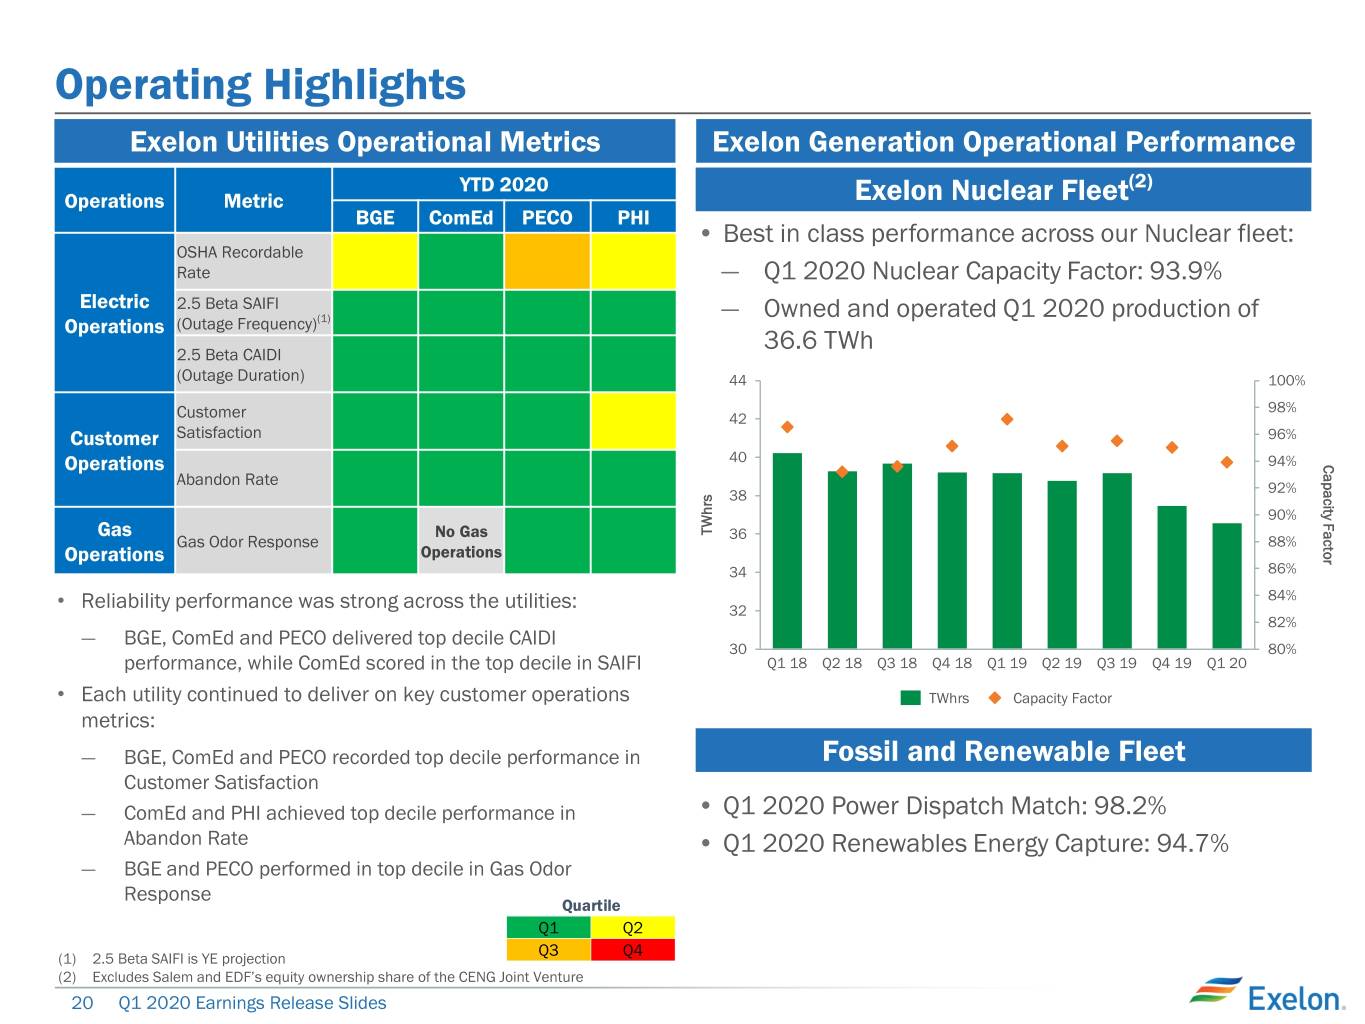
Operating Highlights Exelon Utilities Operational Metrics Exelon Generation Operational Performance YTD 2020 (2) Operations Metric Exelon Nuclear Fleet BGE ComEd PECO PHI • Best in class performance across our Nuclear fleet: OSHA Recordable Rate ― Q1 2020 Nuclear Capacity Factor: 93.9% Electric 2.5 Beta SAIFI ― Owned and operated Q1 2020 production of Operations (Outage Frequency)(1) 36.6 TWh 2.5 Beta CAIDI (Outage Duration) 44 100% 98% Customer 42 Customer Satisfaction 96% Operations 40 94% Capacity Factor Abandon Rate 92% 38 90% Gas No Gas TWhrs 36 Gas Odor Response 88% Operations Operations 34 86% 84% • Reliability performance was strong across the utilities: 32 82% ― BGE, ComEd and PECO delivered top decile CAIDI 30 80% performance, while ComEd scored in the top decile in SAIFI Q1 18 Q2 18 Q3 18 Q4 18 Q1 19 Q2 19 Q3 19 Q4 19 Q1 20 • Each utility continued to deliver on key customer operations TWhrs Capacity Factor metrics: ― BGE, ComEd and PECO recorded top decile performance in Fossil and Renewable Fleet Customer Satisfaction ― ComEd and PHI achieved top decile performance in • Q1 2020 Power Dispatch Match: 98.2% Abandon Rate • Q1 2020 Renewables Energy Capture: 94.7% ― BGE and PECO performed in top decile in Gas Odor Response Quartile Q1 Q2 Q3 Q4 (1) 2.5 Beta SAIFI is YE projection (2) Excludes Salem and EDF’s equity ownership share of the CENG Joint Venture 20 Q1 2020 Earnings Release Slides
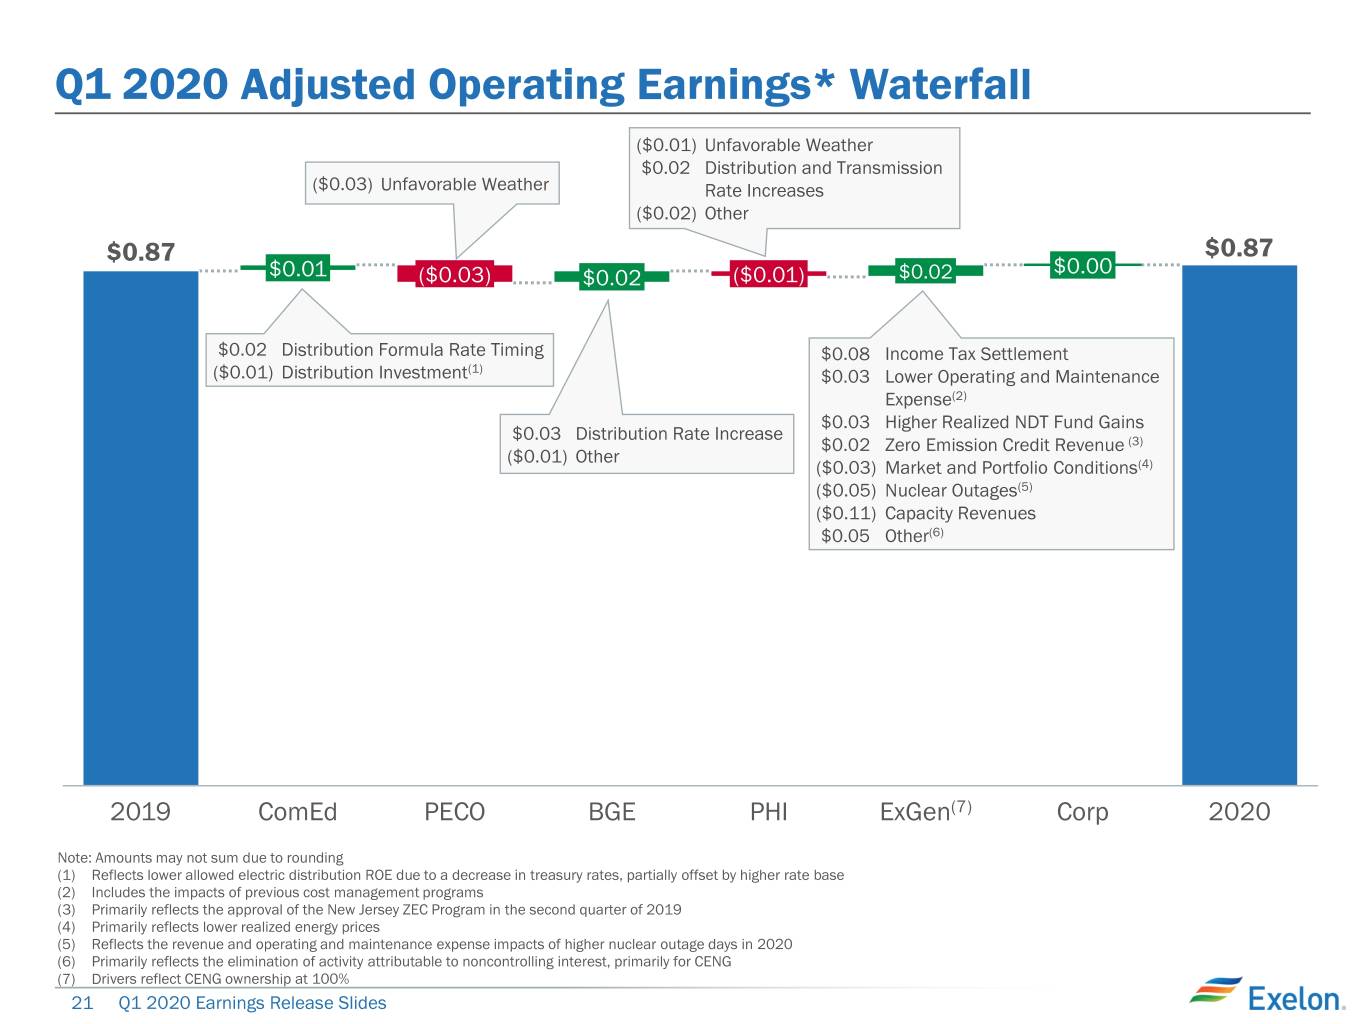
Q1 2020 Adjusted Operating Earnings* Waterfall ($0.01) Unfavorable Weather $0.02 Distribution and Transmission ($0.03) Unfavorable Weather Rate Increases ($0.02) Other $0.87 $0.87 $0.00 $0.01 ($0.03) $0.02 ($0.01) $0.02 $0.02 Distribution Formula Rate Timing $0.08 Income Tax Settlement ($0.01) Distribution Investment(1) $0.03 Lower Operating and Maintenance Expense(2) $0.03 Higher Realized NDT Fund Gains $0.03 Distribution Rate Increase $0.02 Zero Emission Credit Revenue (3) ($0.01) Other ($0.03) Market and Portfolio Conditions(4) ($0.05) Nuclear Outages(5) ($0.11) Capacity Revenues $0.05 Other(6) 2019 ComEd PECO BGE PHI ExGen(7) Corp 2020 Note: Amounts may not sum due to rounding (1) Reflects lower allowed electric distribution ROE due to a decrease in treasury rates, partially offset by higher rate base (2) Includes the impacts of previous cost management programs (3) Primarily reflects the approval of the New Jersey ZEC Program in the second quarter of 2019 (4) Primarily reflects lower realized energy prices (5) Reflects the revenue and operating and maintenance expense impacts of higher nuclear outage days in 2020 (6) Primarily reflects the elimination of activity attributable to noncontrolling interest, primarily for CENG (7) Drivers reflect CENG ownership at 100% 21 Q1 2020 Earnings Release Slides
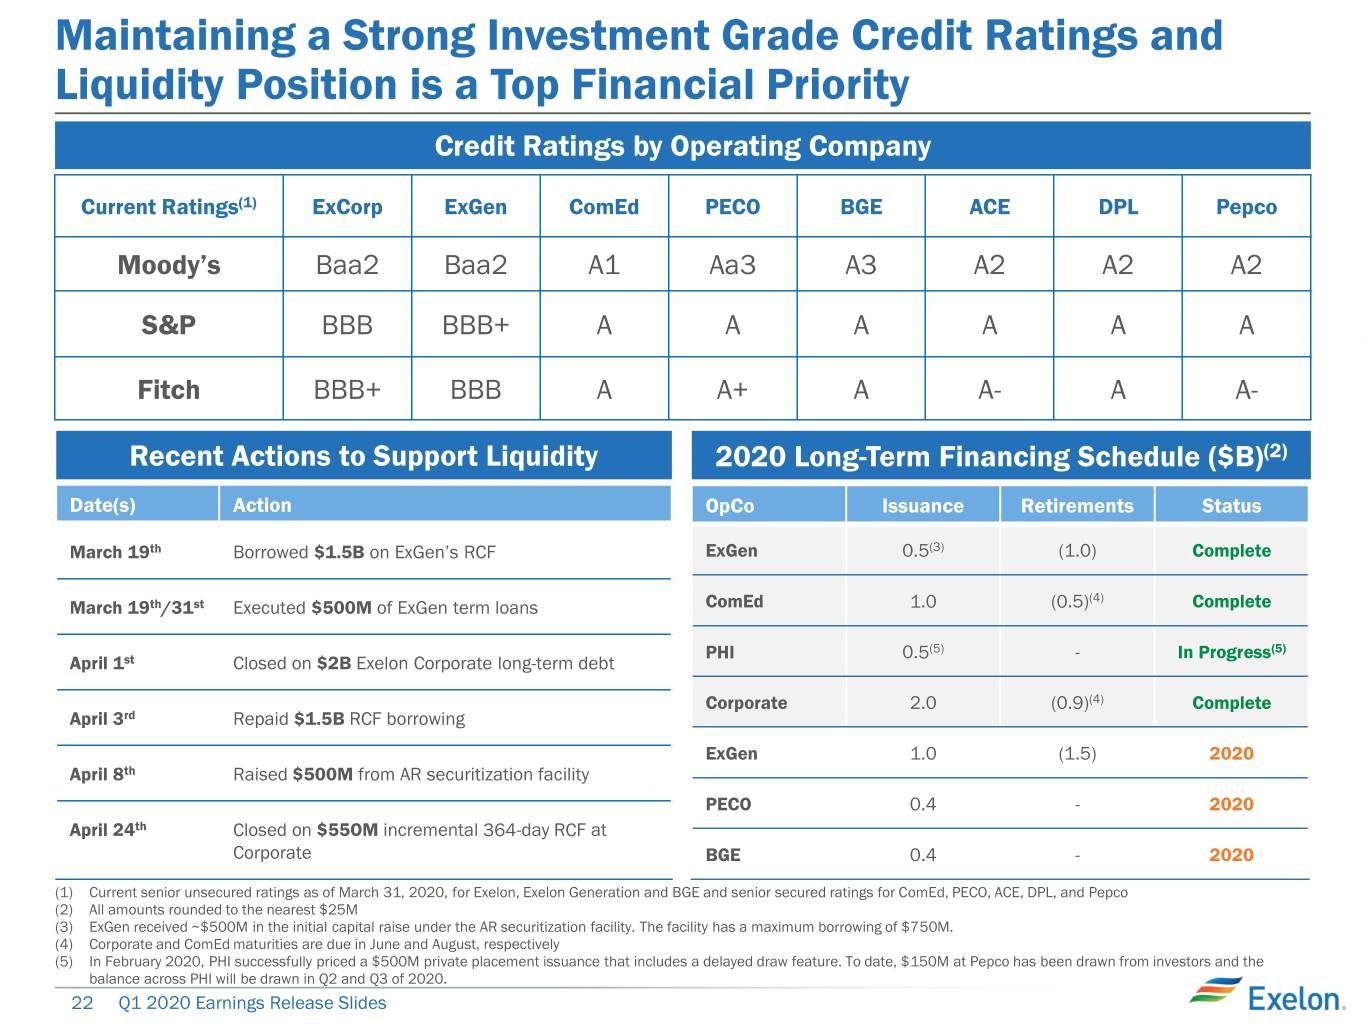
Maintaining a Strong Investment Grade Credit Ratings and Liquidity Position is a Top Financial Priority Credit Ratings by Operating Company Current Ratings(1) ExCorp ExGen ComEd PECO BGE ACE DPL Pepco Moody’s Baa2 Baa2 A1 Aa3 A3 A2 A2 A2 S&P BBB BBB+ A A A A A A Fitch BBB+ BBB A A+ A A- A A- Recent Actions to Support Liquidity 2020 Long-Term Financing Schedule ($B)(2) Date(s) Action OpCo Issuance Retirements Status March 19th Borrowed $1.5B on ExGen’s RCF ExGen 0.5(3) (1.0) Complete (4) March 19th/31st Executed $500M of ExGen term loans ComEd 1.0 (0.5) Complete PHI 0.5(5) - In Progress(5) April 1st Closed on $2B Exelon Corporate long-term debt Corporate 2.0 (0.9)(4) Complete April 3rd Repaid $1.5B RCF borrowing ExGen 1.0 (1.5) 2020 April 8th Raised $500M from AR securitization facility PECO 0.4 - 2020 April 24th Closed on $55OM incremental 364-day RCF at Corporate BGE 0.4 - 2020 (1) Current senior unsecured ratings as of March 31, 2020, for Exelon, Exelon Generation and BGE and senior secured ratings for ComEd, PECO, ACE, DPL, and Pepco (2) All amounts rounded to the nearest $25M (3) ExGen received ~$500M in the initial capital raise under the AR securitization facility. The facility has a maximum borrowing of $750M. (4) Corporate and ComEd maturities are due in June and August, respectively (5) In February 2020, PHI successfully priced a $500M private placement issuance that includes a delayed draw feature. To date, $150M at Pepco has been drawn from investors and the balance across PHI will be drawn in Q2 and Q3 of 2020. 22 Q1 2020 Earnings Release Slides
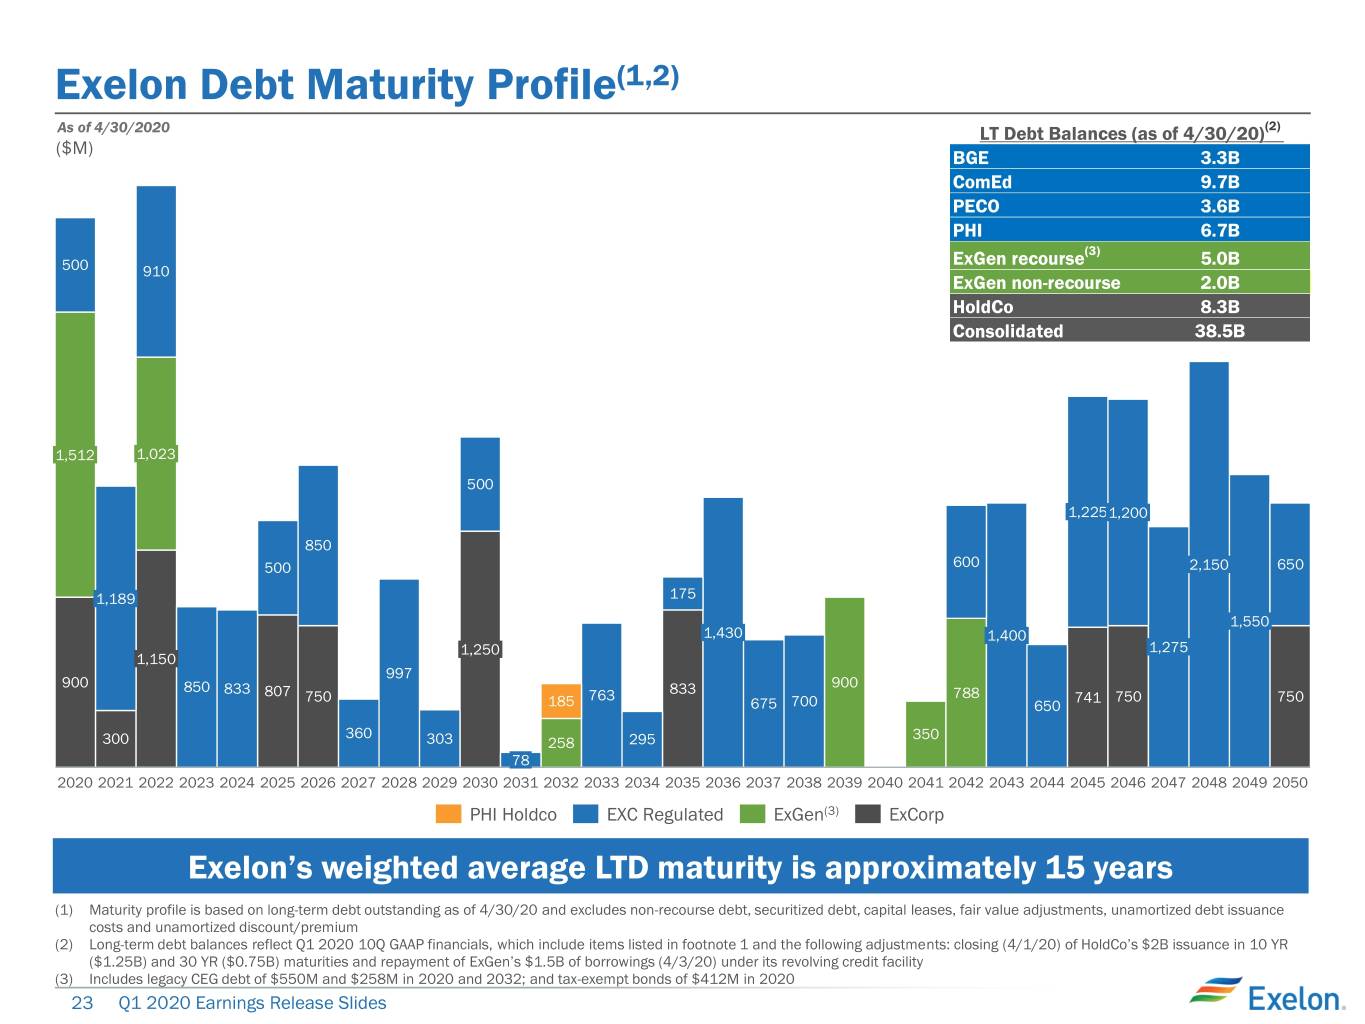
Exelon Debt Maturity Profile(1,2) As of 4/30/2020 LT Debt Balances (as of 4/30/20)(2) ($M) BGE 3.3B ComEd 9.7B PECO 3.6B PHI 6.7B ExGen recourse(3) 5.0B 500 910 ExGen non-recourse 2.0B HoldCo 8.3B Consolidated 38.5B 1,512 1,023 500 1,2251,200 850 500 600 2,150 650 1,189 175 1,550 1,430 1,400 1,250 1,275 1,150 997 900 850 833 833 900 807 750 763 788 741 750 750 185 675 700 650 360 350 300 303 258 295 78 2020 2021 2022 2023 2024 2025 2026 2027 2028 2029 2030 2031 2032 2033 2034 2035 2036 2037 2038 2039 2040 2041 2042 2043 2044 2045 2046 2047 2048 2049 2050 PHI Holdco EXC Regulated ExGen(3) ExCorp Exelon’s weighted average LTD maturity is approximately 15 years (1) Maturity profile is based on long-term debt outstanding as of 4/30/20 and excludes non-recourse debt, securitized debt, capital leases, fair value adjustments, unamortized debt issuance costs and unamortized discount/premium (2) Long-term debt balances reflect Q1 2020 10Q GAAP financials, which include items listed in footnote 1 and the following adjustments: closing (4/1/20) of HoldCo’s $2B issuance in 10 YR ($1.25B) and 30 YR ($0.75B) maturities and repayment of ExGen’s $1.5B of borrowings (4/3/20) under its revolving credit facility (3) Includes legacy CEG debt of $550M and $258M in 2020 and 2032; and tax-exempt bonds of $412M in 2020 23 Q1 2020 Earnings Release Slides
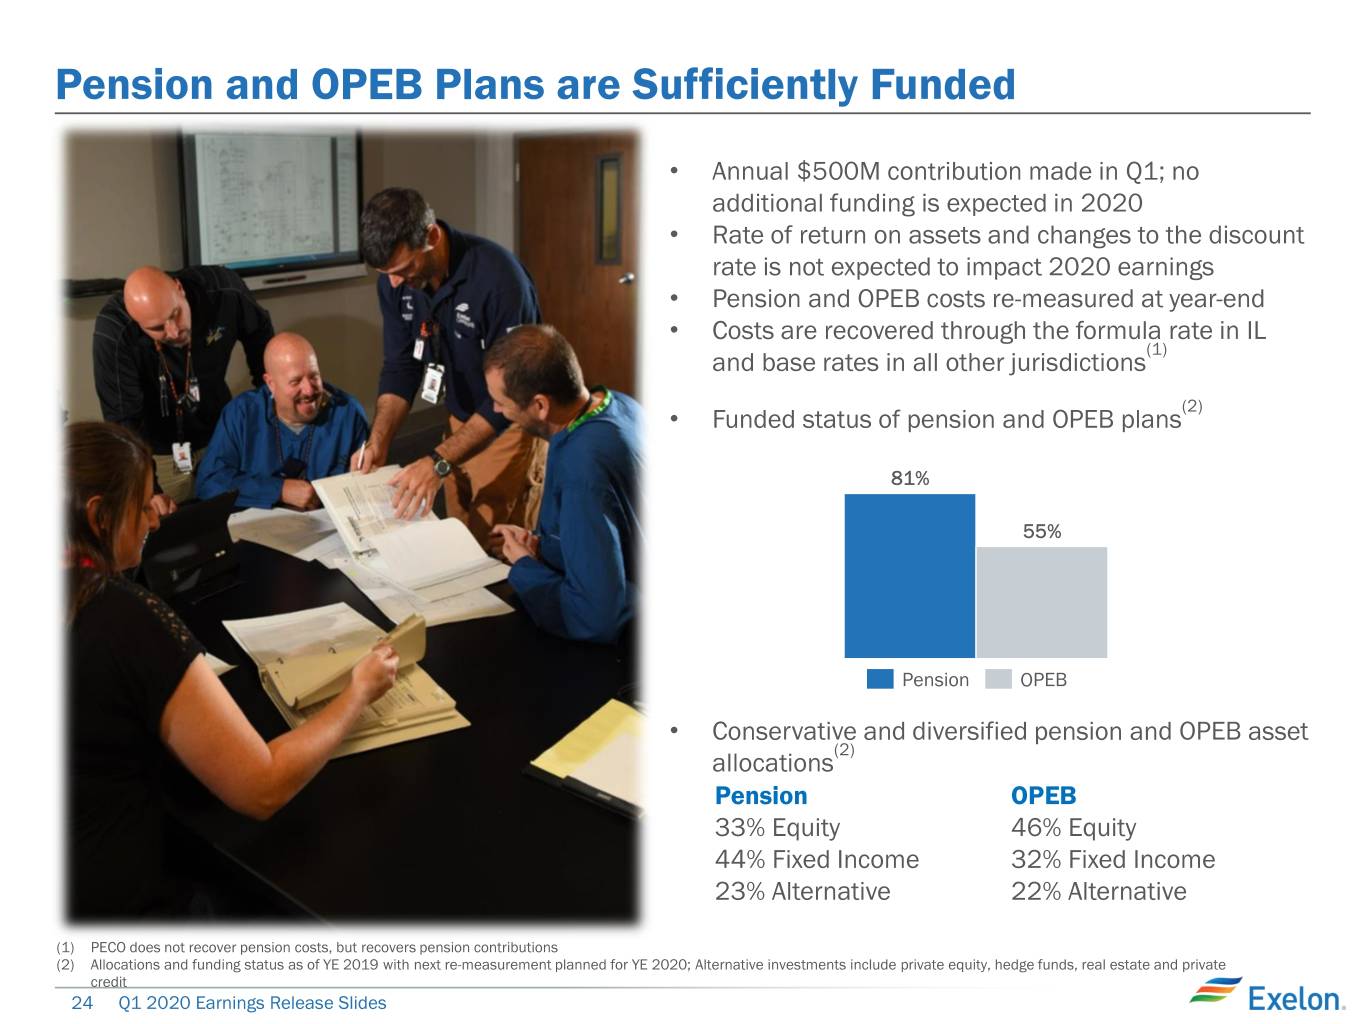
Pension and OPEB Plans are Sufficiently Funded • Annual $500M contribution made in Q1; no additional funding is expected in 2020 • Rate of return on assets and changes to the discount rate is not expected to impact 2020 earnings • Pension and OPEB costs re-measured at year-end • Costs are recovered through the formula rate in IL (1) and base rates in all other jurisdictions (2) • Funded status of pension and OPEB plans 81% 55% Alternative Fixed Income Equity 23% 22% Pension OPEB 44% 32% • Conservative and diversified pension and OPEB asset (2) 33% 46% allocations Pension OPEB Pension OPEB 33% Equity 46% Equity 44% Fixed Income 32% Fixed Income 23% Alternative 22% Alternative (1) PECO does not recover pension costs, but recovers pension contributions (2) Allocations and funding status as of YE 2019 with next re-measurement planned for YE 2020; Alternative investments include private equity, hedge funds, real estate and private credit 24 Q1 2020 Earnings Release Slides
Exelon Utilities 25 Q1 2020 Earnings Release Slides
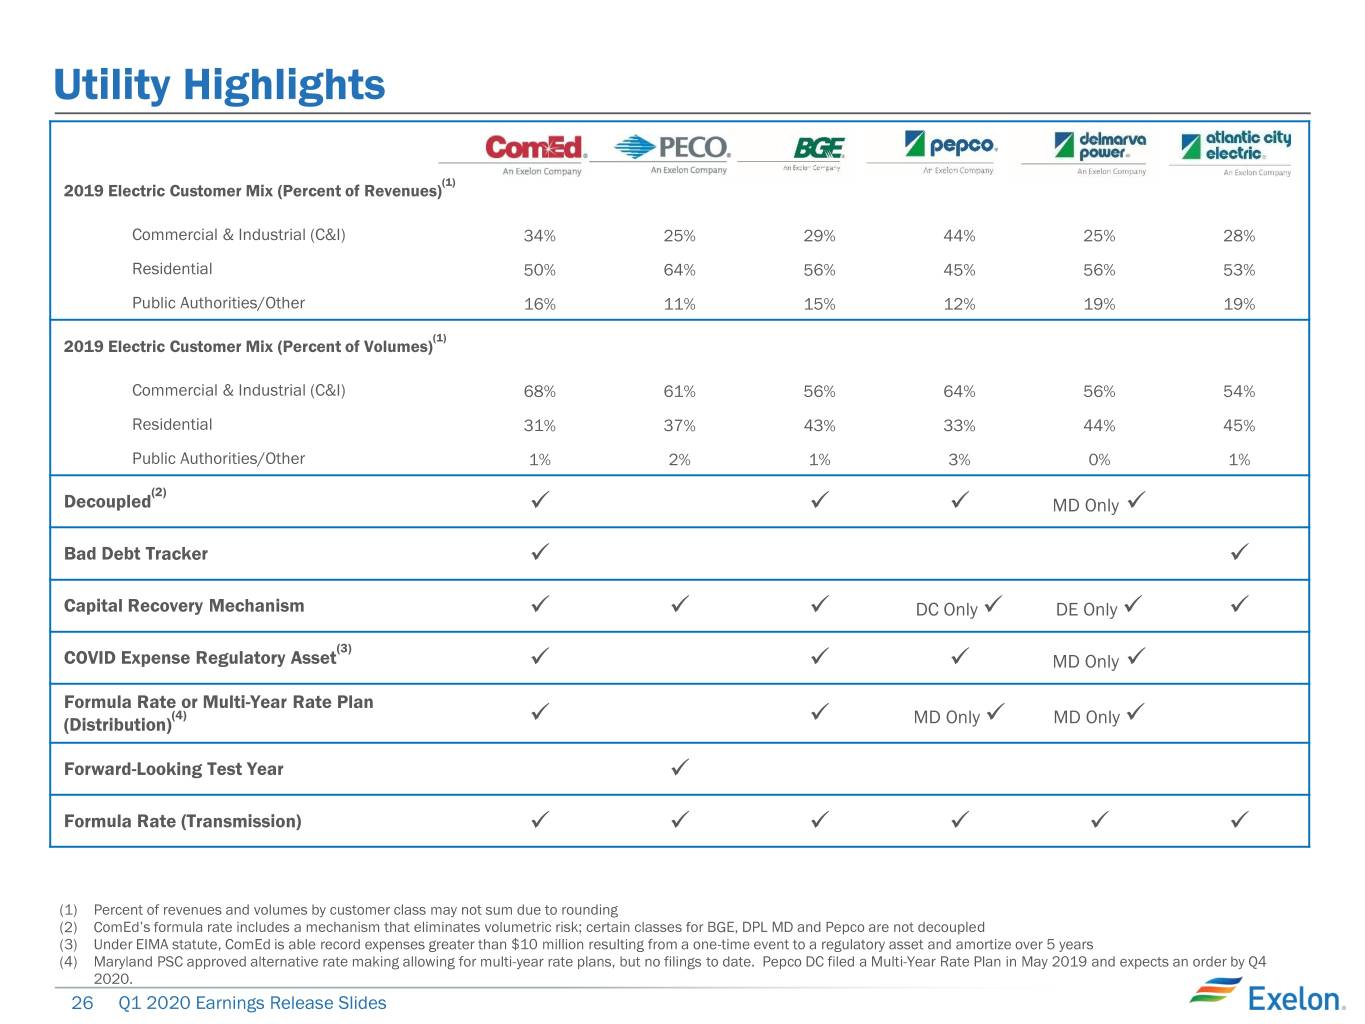
Utility Highlights ComEd PECO BGE Pepco Delmarva ACE (1) 2019 Electric Customer Mix (Percent of Revenues) Commercial & Industrial (C&I) 34% 25% 29% 44% 25% 28% Residential 50% 64% 56% 45% 56% 53% Public Authorities/Other 16% 11% 15% 12% 19% 19% (1) 2019 Electric Customer Mix (Percent of Volumes) Commercial & Industrial (C&I) 68% 61% 56% 64% 56% 54% Residential 31% 37% 43% 33% 44% 45% Public Authorities/Other 1% 2% 1% 3% 0% 1% (2) Decoupled ✓ ✓ ✓ MD Only ✓ Bad Debt Tracker ✓ ✓ Capital Recovery Mechanism ✓ ✓ ✓ DC Only ✓ DE Only ✓ ✓ (3) COVID Expense Regulatory Asset ✓ ✓ ✓ MD Only ✓ Formula Rate or Multi-Year Rate Plan (4) (Distribution) ✓ ✓ MD Only ✓ MD Only ✓ Forward-Looking Test Year ✓ Formula Rate (Transmission) ✓ ✓ ✓ ✓ ✓ ✓ (1) Percent of revenues and volumes by customer class may not sum due to rounding (2) ComEd’s formula rate includes a mechanism that eliminates volumetric risk; certain classes for BGE, DPL MD and Pepco are not decoupled (3) Under EIMA statute, ComEd is able record expenses greater than $10 million resulting from a one-time event to a regulatory asset and amortize over 5 years (4) Maryland PSC approved alternative rate making allowing for multi-year rate plans, but no filings to date. Pepco DC filed a Multi-Year Rate Plan in May 2019 and expects an order by Q4 2020. 26 Q1 2020 Earnings Release Slides
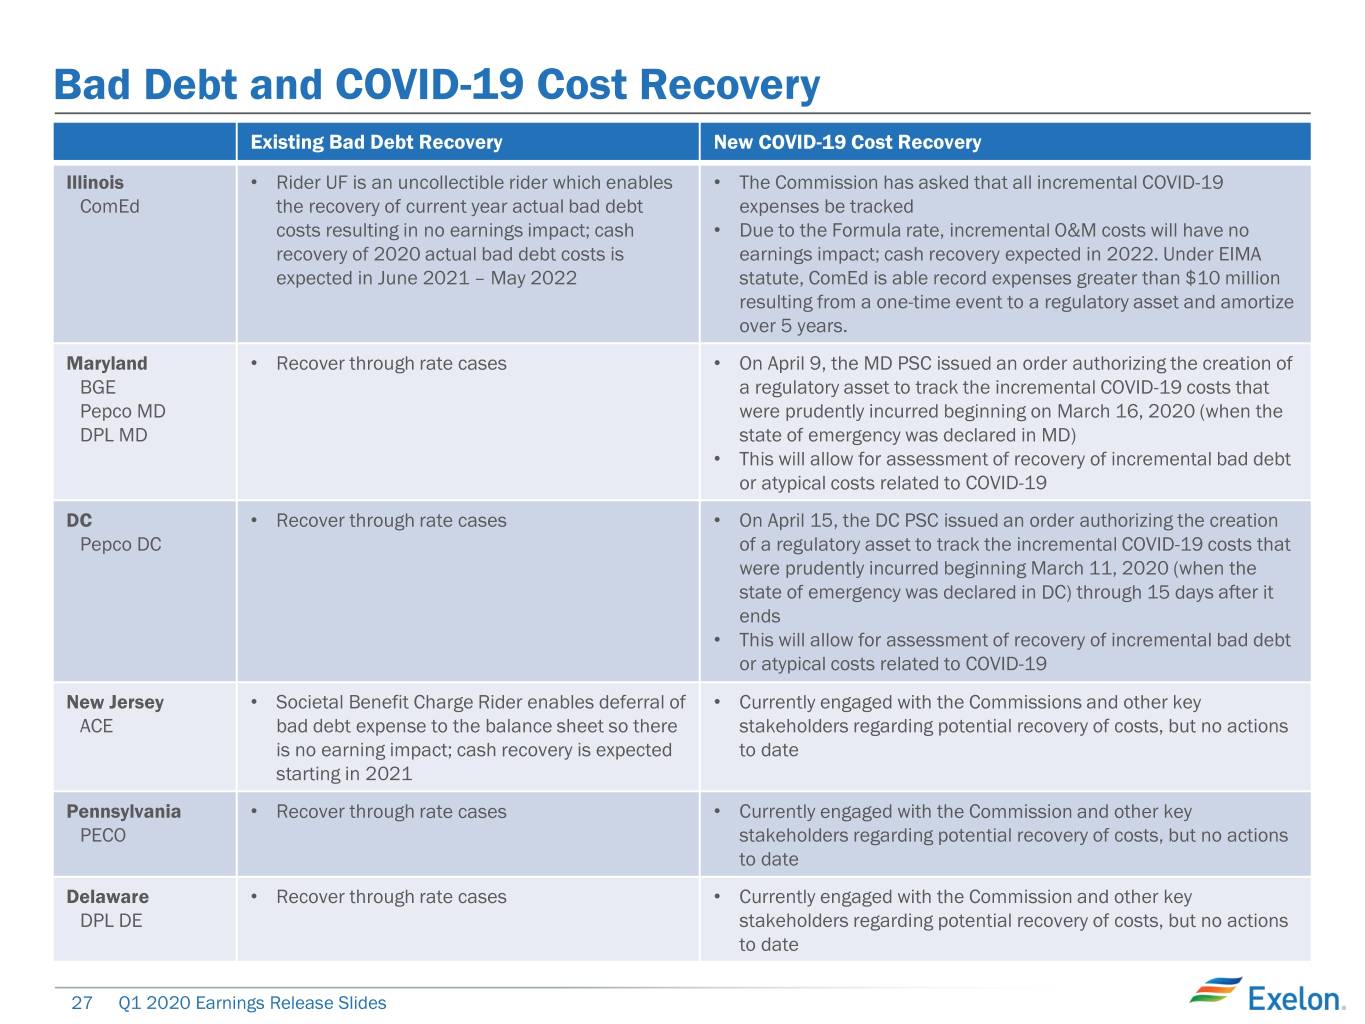
Bad Debt and COVID-19 Cost Recovery Existing Bad Debt Recovery New COVID-19 Cost Recovery Illinois • Rider UF is an uncollectible rider which enables • The Commission has asked that all incremental COVID-19 ComEd the recovery of current year actual bad debt expenses be tracked costs resulting in no earnings impact; cash • Due to the Formula rate, incremental O&M costs will have no recovery of 2020 actual bad debt costs is earnings impact; cash recovery expected in 2022. Under EIMA expected in June 2021 – May 2022 statute, ComEd is able record expenses greater than $10 million resulting from a one-time event to a regulatory asset and amortize over 5 years. Maryland • Recover through rate cases • On April 9, the MD PSC issued an order authorizing the creation of BGE a regulatory asset to track the incremental COVID-19 costs that Pepco MD were prudently incurred beginning on March 16, 2020 (when the DPL MD state of emergency was declared in MD) • This will allow for assessment of recovery of incremental bad debt or atypical costs related to COVID-19 DC • Recover through rate cases • On April 15, the DC PSC issued an order authorizing the creation Pepco DC of a regulatory asset to track the incremental COVID-19 costs that were prudently incurred beginning March 11, 2020 (when the state of emergency was declared in DC) through 15 days after it ends • This will allow for assessment of recovery of incremental bad debt or atypical costs related to COVID-19 New Jersey • Societal Benefit Charge Rider enables deferral of • Currently engaged with the Commissions and other key ACE bad debt expense to the balance sheet so there stakeholders regarding potential recovery of costs, but no actions is no earning impact; cash recovery is expected to date starting in 2021 Pennsylvania • Recover through rate cases • Currently engaged with the Commission and other key PECO stakeholders regarding potential recovery of costs, but no actions to date Delaware • Recover through rate cases • Currently engaged with the Commission and other key DPL DE stakeholders regarding potential recovery of costs, but no actions to date 27 Q1 2020 Earnings Release Slides
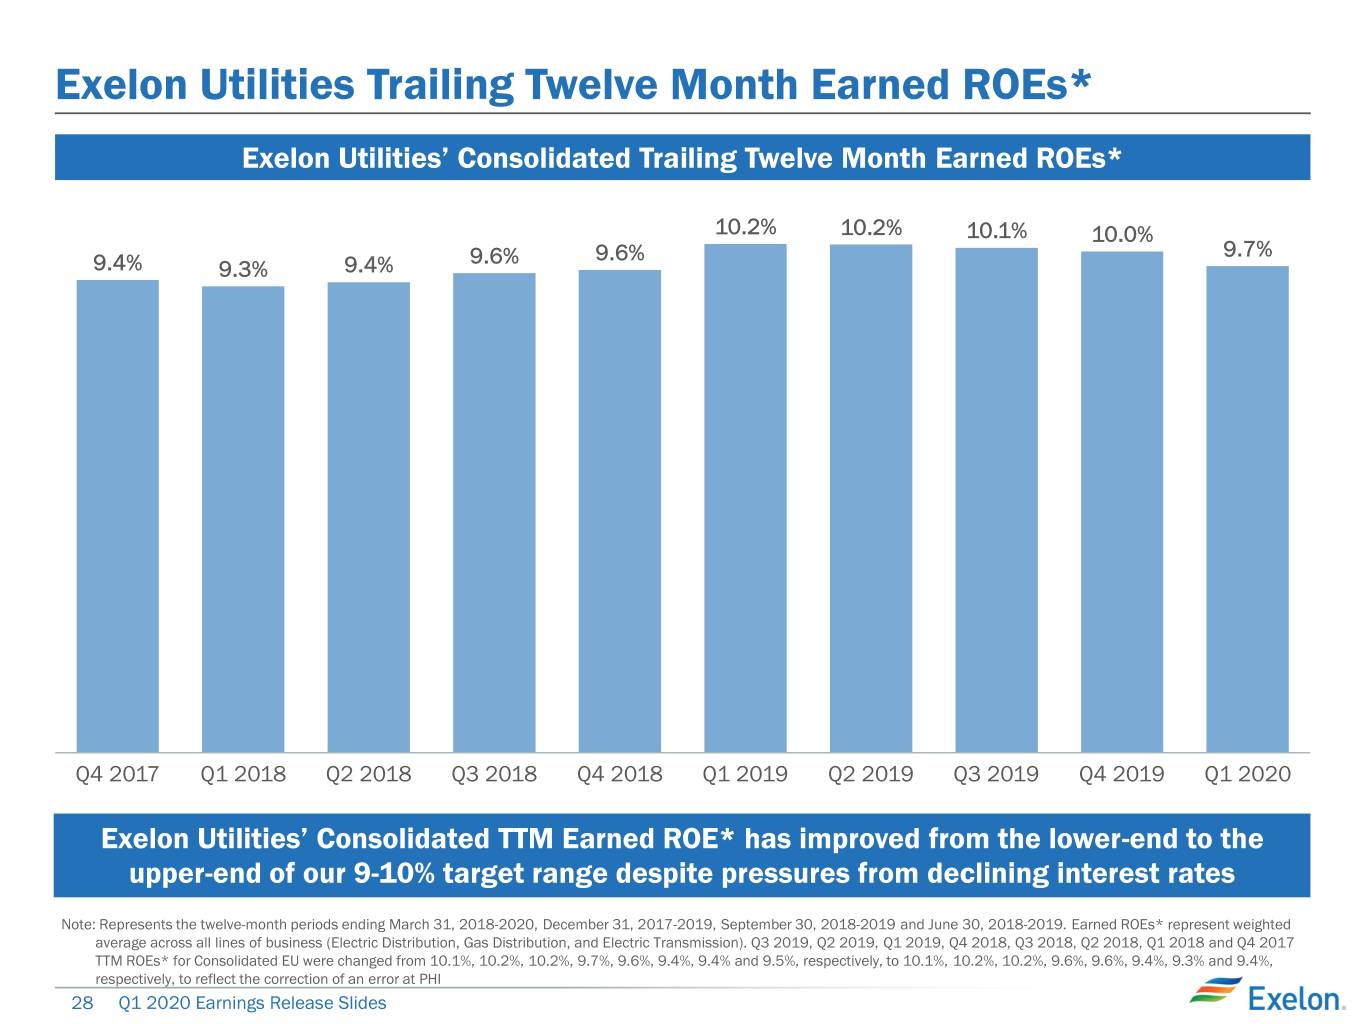
Exelon Utilities Trailing Twelve Month Earned ROEs* Exelon Utilities’ Consolidated Trailing Twelve Month Earned ROEs* 10.2% 10.2% 10.1% 10.0% 9.6% 9.6% 9.7% 9.4% 9.3% 9.4% Q4 2017 Q1 2018 Q2 2018 Q3 2018 Q4 2018 Q1 2019 Q2 2019 Q3 2019 Q4 2019 Q1 2020 Exelon Utilities’ Consolidated TTM Earned ROE* has improved from the lower-end to the upper-end of our 9-10% target range despite pressures from declining interest rates Note: Represents the twelve-month periods ending March 31, 2018-2020, December 31, 2017-2019, September 30, 2018-2019 and June 30, 2018-2019. Earned ROEs* represent weighted average across all lines of business (Electric Distribution, Gas Distribution, and Electric Transmission). Q3 2019, Q2 2019, Q1 2019, Q4 2018, Q3 2018, Q2 2018, Q1 2018 and Q4 2017 TTM ROEs* for Consolidated EU were changed from 10.1%, 10.2%, 10.2%, 9.7%, 9.6%, 9.4%, 9.4% and 9.5%, respectively, to 10.1%, 10.2%, 10.2%, 9.6%, 9.6%, 9.4%, 9.3% and 9.4%, respectively, to reflect the correction of an error at PHI 28 Q1 2020 Earnings Release Slides
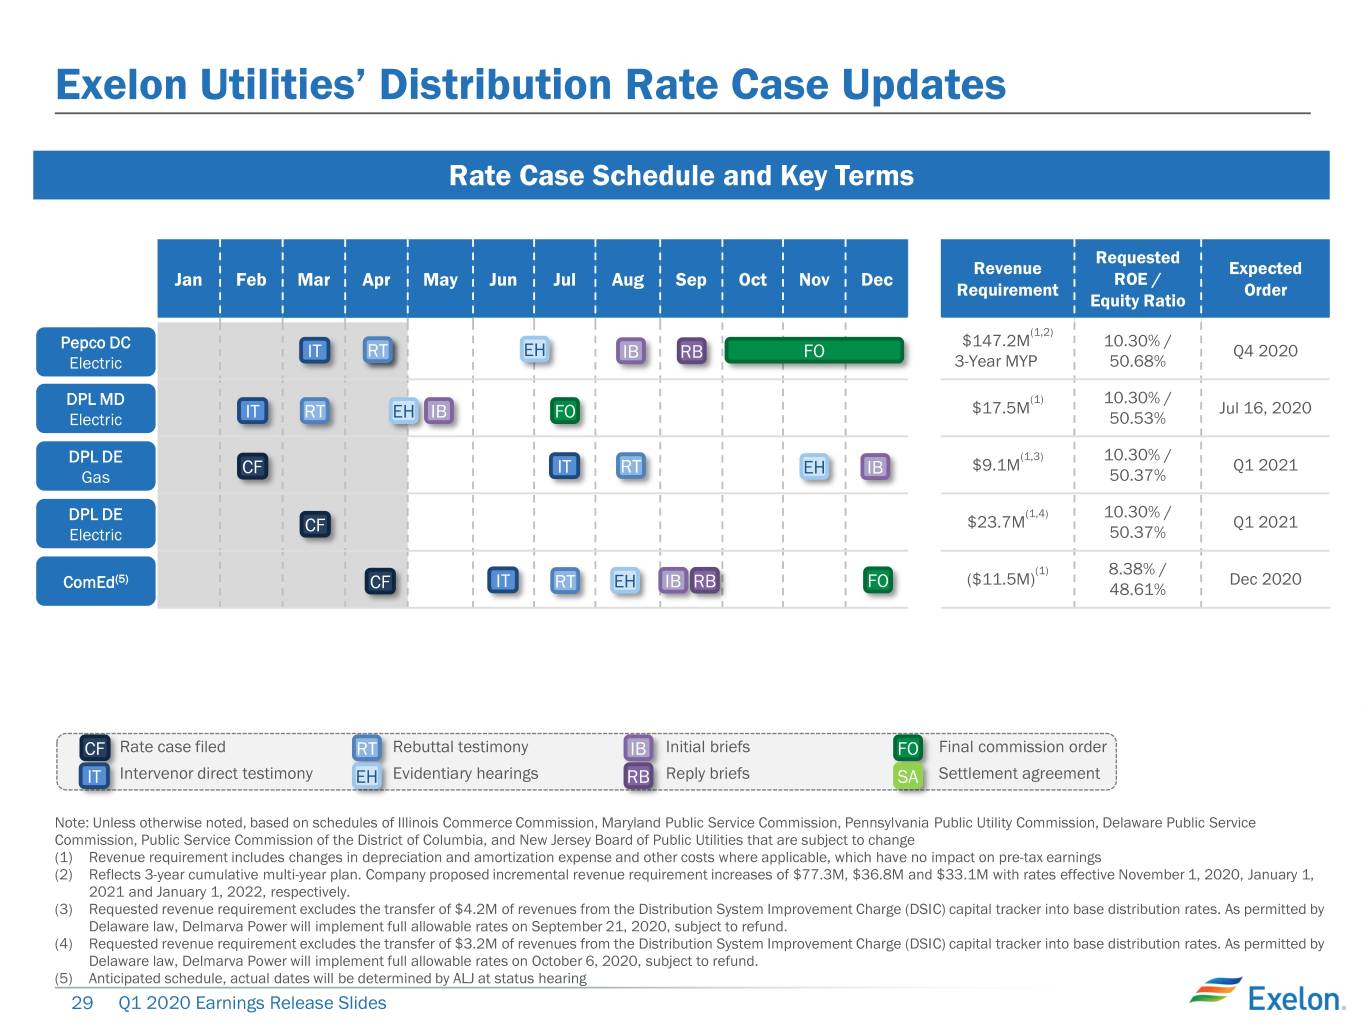
Exelon Utilities’ Distribution Rate Case Updates Rate Case Schedule and Key Terms Requested Revenue Expected Jan Feb Mar Apr May Jun Jul Aug Sep Oct Nov Dec ROE / Requirement Order Equity Ratio (1,2) $147.2M 10.30% / Pepco DC IT RT EH IB RB FO Q4 2020 Electric 3-Year MYP 50.68% DPL MD (1) 10.30% / $17.5M Jul 16, 2020 Electric IT RT EH IB FO 50.53% DPL DE (1,3) 10.30% / CF IT RT EH IB $9.1M Q1 2021 Gas 50.37% DPL DE (1,4) 10.30% / CF $23.7M Q1 2021 Electric 50.37% (1) 8.38% / (5) ($11.5M) Dec 2020 ComEd CF IT RT EH IB RB FO 48.61% CF Rate case filed RT Rebuttal testimony IB Initial briefs FO Final commission order IT Intervenor direct testimony EH Evidentiary hearings RB Reply briefs SA Settlement agreement Note: Unless otherwise noted, based on schedules of Illinois Commerce Commission, Maryland Public Service Commission, Pennsylvania Public Utility Commission, Delaware Public Service Commission, Public Service Commission of the District of Columbia, and New Jersey Board of Public Utilities that are subject to change (1) Revenue requirement includes changes in depreciation and amortization expense and other costs where applicable, which have no impact on pre-tax earnings (2) Reflects 3-year cumulative multi-year plan. Company proposed incremental revenue requirement increases of $77.3M, $36.8M and $33.1M with rates effective November 1, 2020, January 1, 2021 and January 1, 2022, respectively. (3) Requested revenue requirement excludes the transfer of $4.2M of revenues from the Distribution System Improvement Charge (DSIC) capital tracker into base distribution rates. As permitted by Delaware law, Delmarva Power will implement full allowable rates on September 21, 2020, subject to refund. (4) Requested revenue requirement excludes the transfer of $3.2M of revenues from the Distribution System Improvement Charge (DSIC) capital tracker into base distribution rates. As permitted by Delaware law, Delmarva Power will implement full allowable rates on October 6, 2020, subject to refund. (5) Anticipated schedule, actual dates will be determined by ALJ at status hearing 29 Q1 2020 Earnings Release Slides
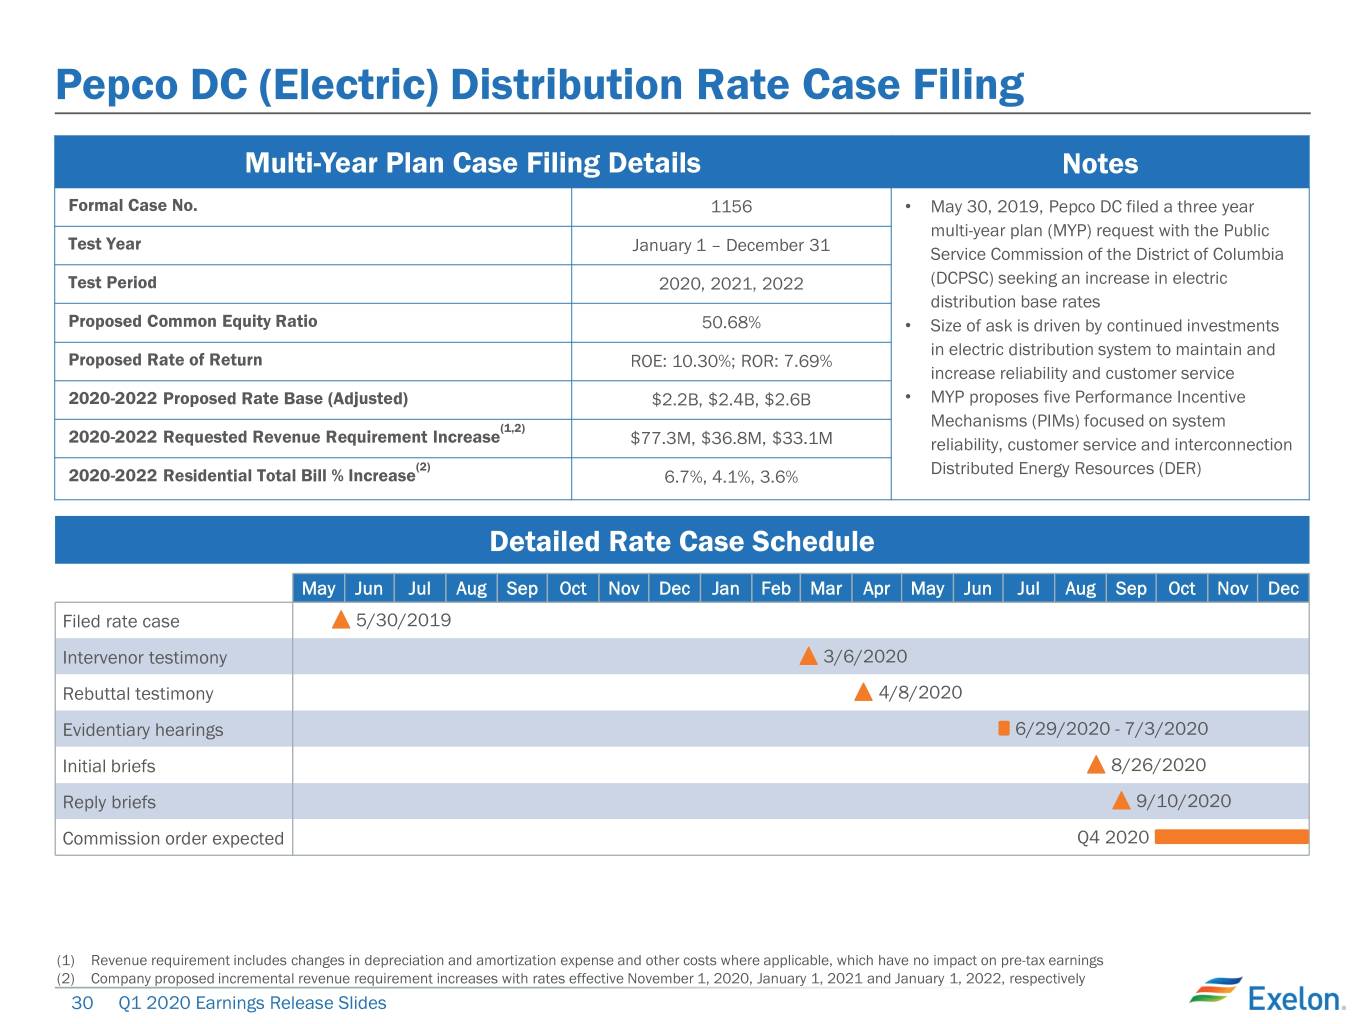
Pepco DC (Electric) Distribution Rate Case Filing Multi-Year Plan Case Filing Details Notes Formal Case No. 1156 • May 30, 2019, Pepco DC filed a three year multi-year plan (MYP) request with the Public Test Year January 1 – December 31 Service Commission of the District of Columbia Test Period 2020, 2021, 2022 (DCPSC) seeking an increase in electric distribution base rates Proposed Common Equity Ratio 50.68% • Size of ask is driven by continued investments in electric distribution system to maintain and Proposed Rate of Return ROE: 10.30%; ROR: 7.69% increase reliability and customer service 2020-2022 Proposed Rate Base (Adjusted) $2.2B, $2.4B, $2.6B • MYP proposes five Performance Incentive (1,2) Mechanisms (PIMs) focused on system 2020-2022 Requested Revenue Requirement Increase $77.3M, $36.8M, $33.1M reliability, customer service and interconnection (2) 2020-2022 Residential Total Bill % Increase 6.7%, 4.1%, 3.6% Distributed Energy Resources (DER) Detailed Rate Case Schedule May Jun Jul Aug Sep Oct Nov Dec Jan Feb Mar Apr May Jun Jul Aug Sep Oct Nov Dec Filed rate case 5/30/2019 Intervenor testimony 3/6/2020 Rebuttal testimony 4/8/2020 Evidentiary hearings 6/29/2020 - 7/3/2020 Initial briefs 8/26/2020 Reply briefs 9/10/2020 Commission order expected Q4 2020 (1) Revenue requirement includes changes in depreciation and amortization expense and other costs where applicable, which have no impact on pre-tax earnings (2) Company proposed incremental revenue requirement increases with rates effective November 1, 2020, January 1, 2021 and January 1, 2022, respectively 30 Q1 2020 Earnings Release Slides
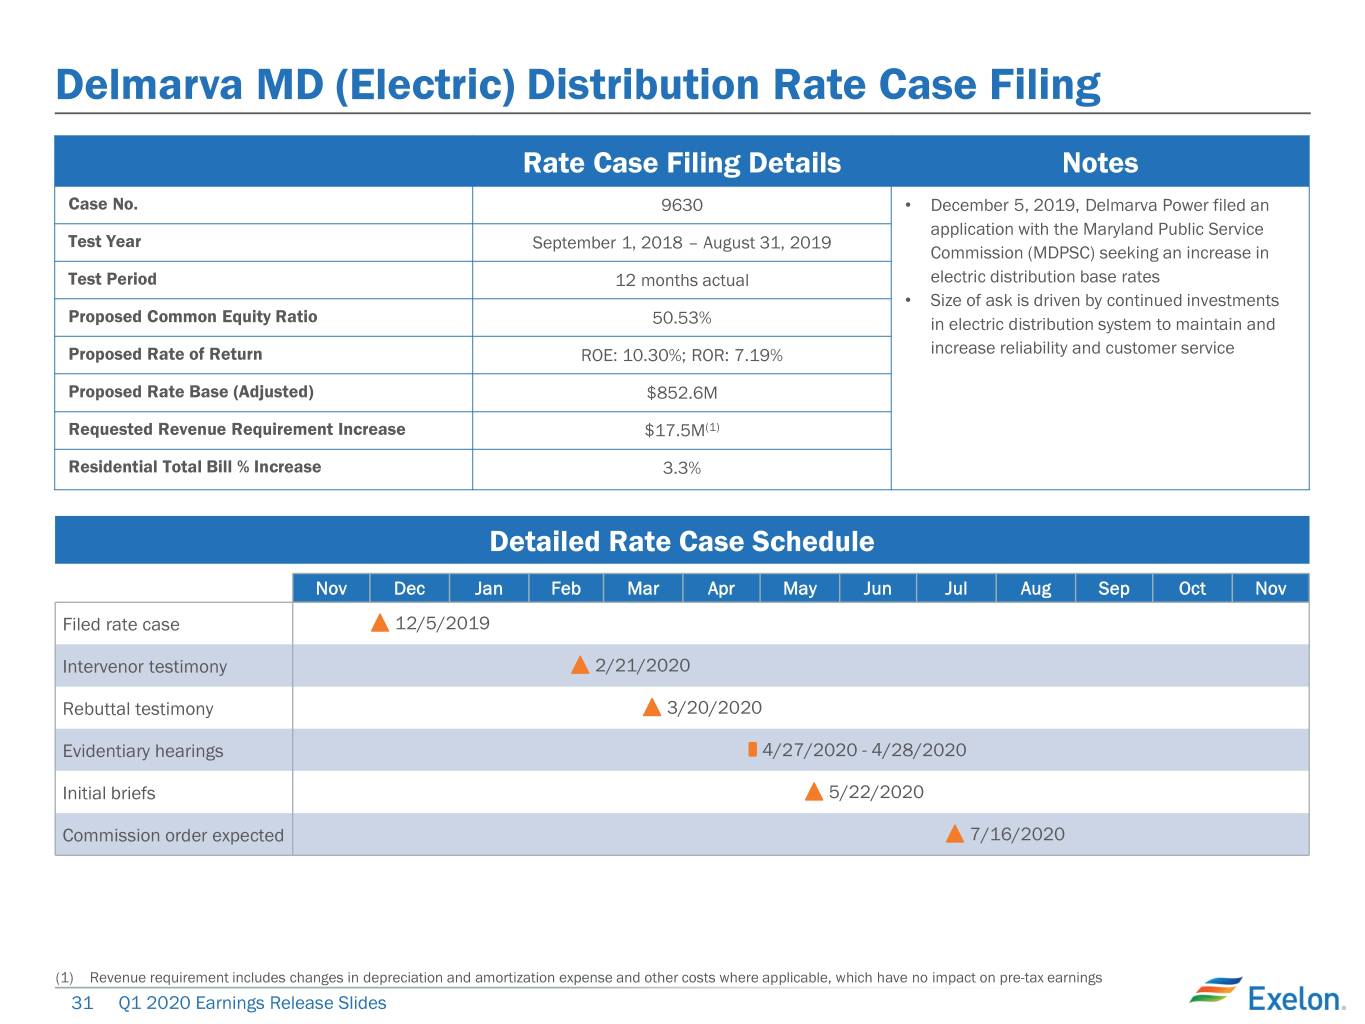
Delmarva MD (Electric) Distribution Rate Case Filing Rate Case Filing Details Notes Case No. 9630 • December 5, 2019, Delmarva Power filed an application with the Maryland Public Service Test Year September 1, 2018 – August 31, 2019 Commission (MDPSC) seeking an increase in Test Period 12 months actual electric distribution base rates • Size of ask is driven by continued investments Proposed Common Equity Ratio 50.53% in electric distribution system to maintain and Proposed Rate of Return ROE: 10.30%; ROR: 7.19% increase reliability and customer service Proposed Rate Base (Adjusted) $852.6M Requested Revenue Requirement Increase $17.5M(1) Residential Total Bill % Increase 3.3% Detailed Rate Case Schedule Nov Dec Jan Feb Mar Apr May Jun Jul Aug Sep Oct Nov Filed rate case 12/5/2019 Intervenor testimony 2/21/2020 Rebuttal testimony 3/20/2020 Evidentiary hearings 4/27/2020 - 4/28/2020 Initial briefs 5/22/2020 Commission order expected 7/16/2020 (1) Revenue requirement includes changes in depreciation and amortization expense and other costs where applicable, which have no impact on pre-tax earnings 31 Q1 2020 Earnings Release Slides
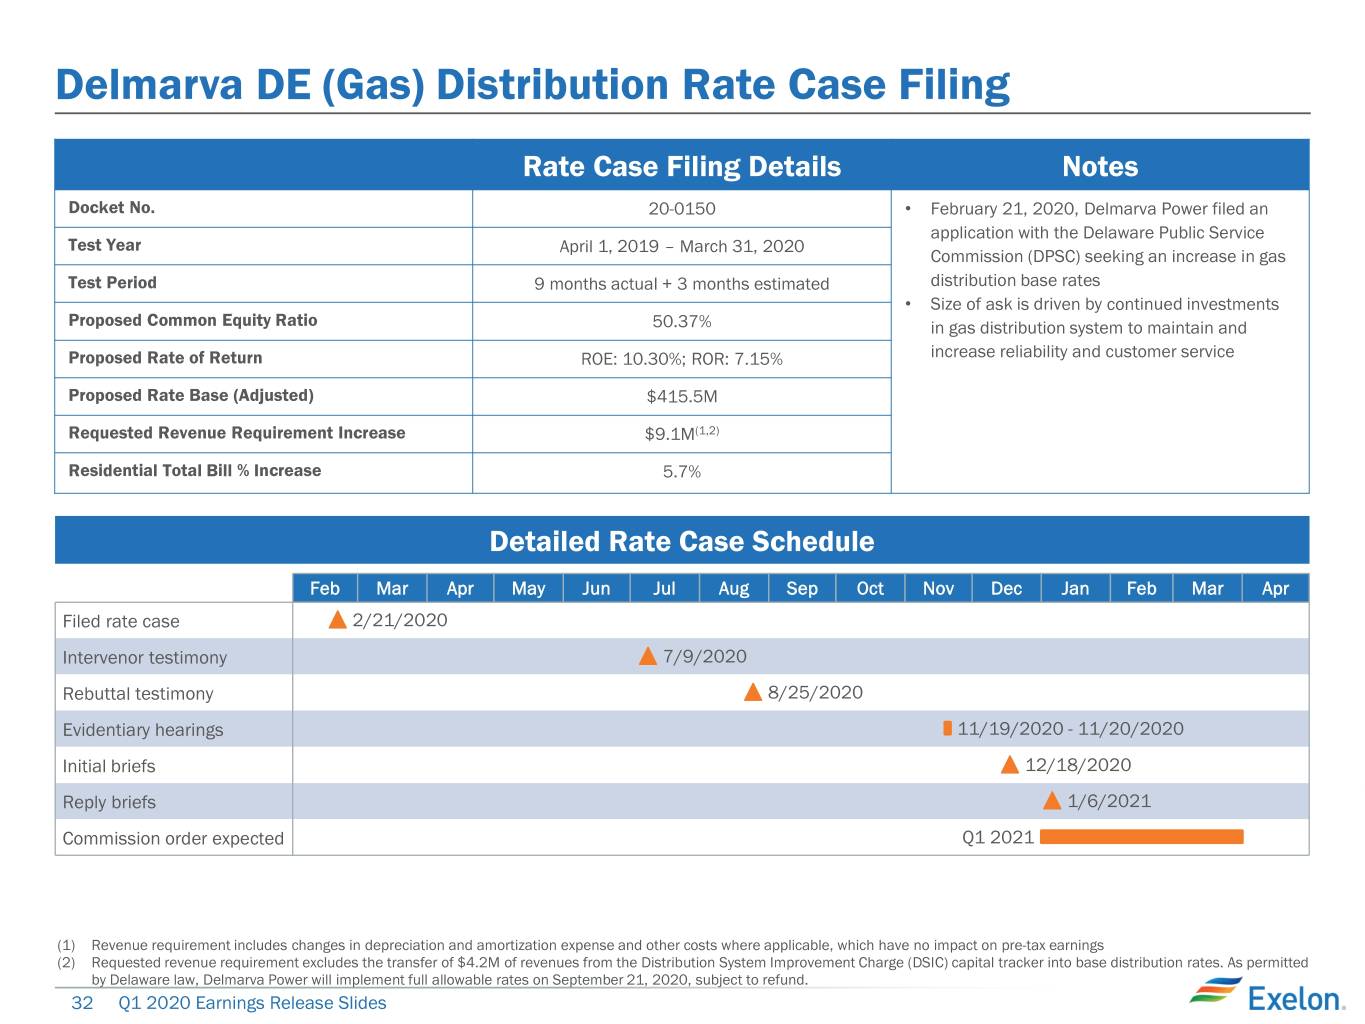
Delmarva DE (Gas) Distribution Rate Case Filing Rate Case Filing Details Notes Docket No. 20-0150 • February 21, 2020, Delmarva Power filed an application with the Delaware Public Service Test Year April 1, 2019 – March 31, 2020 Commission (DPSC) seeking an increase in gas Test Period 9 months actual + 3 months estimated distribution base rates • Size of ask is driven by continued investments Proposed Common Equity Ratio 50.37% in gas distribution system to maintain and Proposed Rate of Return ROE: 10.30%; ROR: 7.15% increase reliability and customer service Proposed Rate Base (Adjusted) $415.5M Requested Revenue Requirement Increase $9.1M(1,2) Residential Total Bill % Increase 5.7% Detailed Rate Case Schedule Feb Mar Apr May Jun Jul Aug Sep Oct Nov Dec Jan Feb Mar Apr Filed rate case 2/21/2020 Intervenor testimony 7/9/2020 Rebuttal testimony 8/25/2020 Evidentiary hearings 11/19/2020 - 11/20/2020 Initial briefs 12/18/2020 Reply briefs 1/6/2021 Commission order expected Q1 2021 (1) Revenue requirement includes changes in depreciation and amortization expense and other costs where applicable, which have no impact on pre-tax earnings (2) Requested revenue requirement excludes the transfer of $4.2M of revenues from the Distribution System Improvement Charge (DSIC) capital tracker into base distribution rates. As permitted by Delaware law, Delmarva Power will implement full allowable rates on September 21, 2020, subject to refund. 32 Q1 2020 Earnings Release Slides
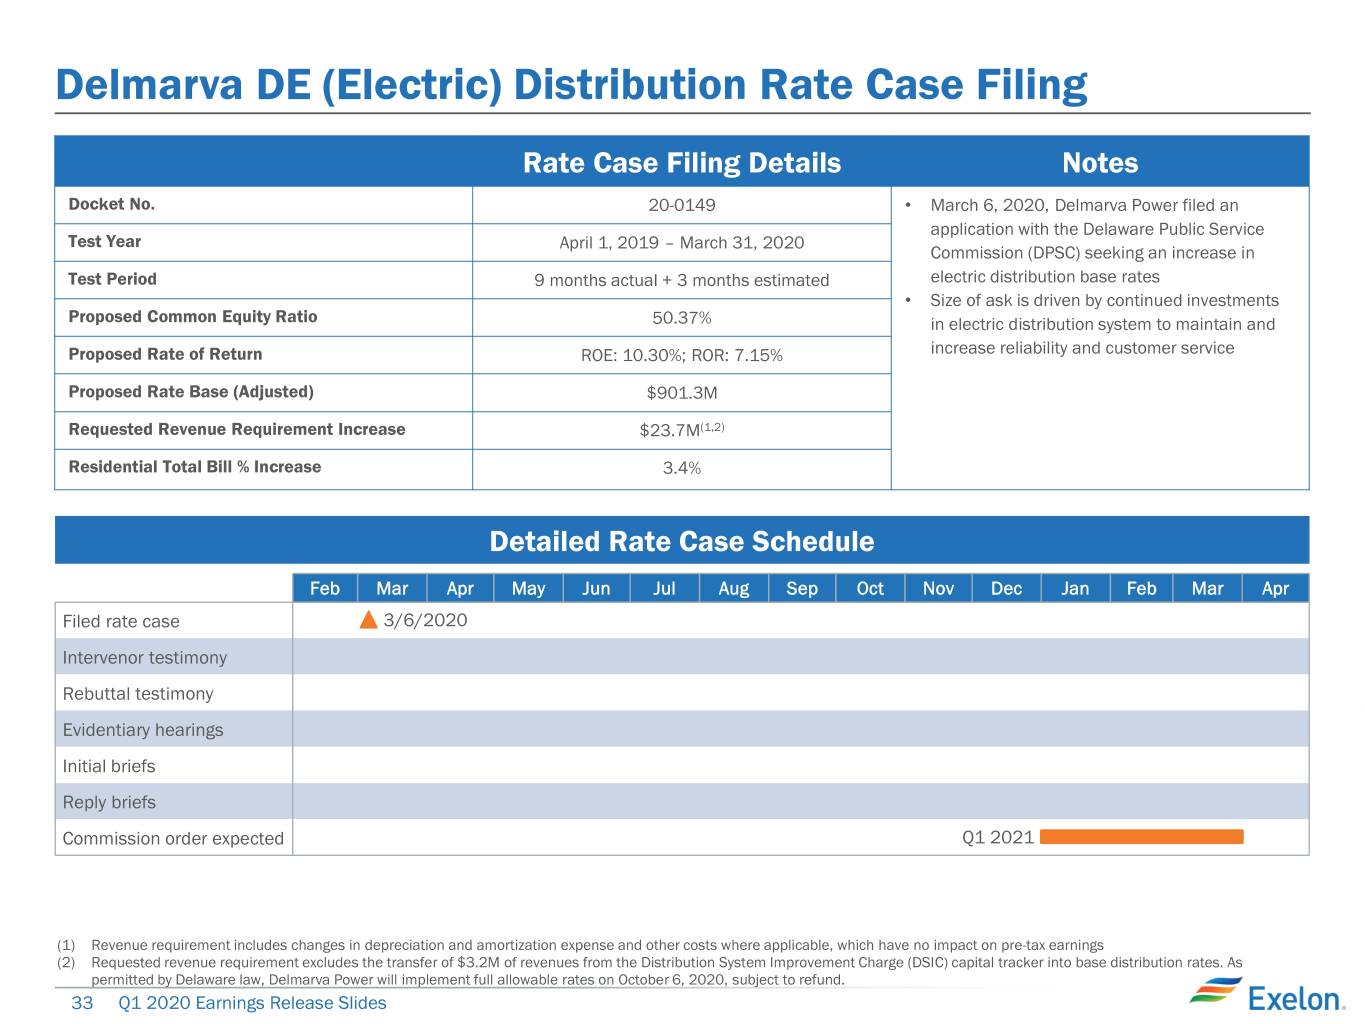
Delmarva DE (Electric) Distribution Rate Case Filing Rate Case Filing Details Notes Docket No. 20-0149 • March 6, 2020, Delmarva Power filed an application with the Delaware Public Service Test Year April 1, 2019 – March 31, 2020 Commission (DPSC) seeking an increase in Test Period 9 months actual + 3 months estimated electric distribution base rates • Size of ask is driven by continued investments Proposed Common Equity Ratio 50.37% in electric distribution system to maintain and Proposed Rate of Return ROE: 10.30%; ROR: 7.15% increase reliability and customer service Proposed Rate Base (Adjusted) $901.3M Requested Revenue Requirement Increase $23.7M(1,2) Residential Total Bill % Increase 3.4% Detailed Rate Case Schedule Feb Mar Apr May Jun Jul Aug Sep Oct Nov Dec Jan Feb Mar Apr Filed rate case 3/6/2020 Intervenor testimony Rebuttal testimony Evidentiary hearings Initial briefs Reply briefs Commission order expected Q1 2021 (1) Revenue requirement includes changes in depreciation and amortization expense and other costs where applicable, which have no impact on pre-tax earnings (2) Requested revenue requirement excludes the transfer of $3.2M of revenues from the Distribution System Improvement Charge (DSIC) capital tracker into base distribution rates. As permitted by Delaware law, Delmarva Power will implement full allowable rates on October 6, 2020, subject to refund. 33 Q1 2020 Earnings Release Slides
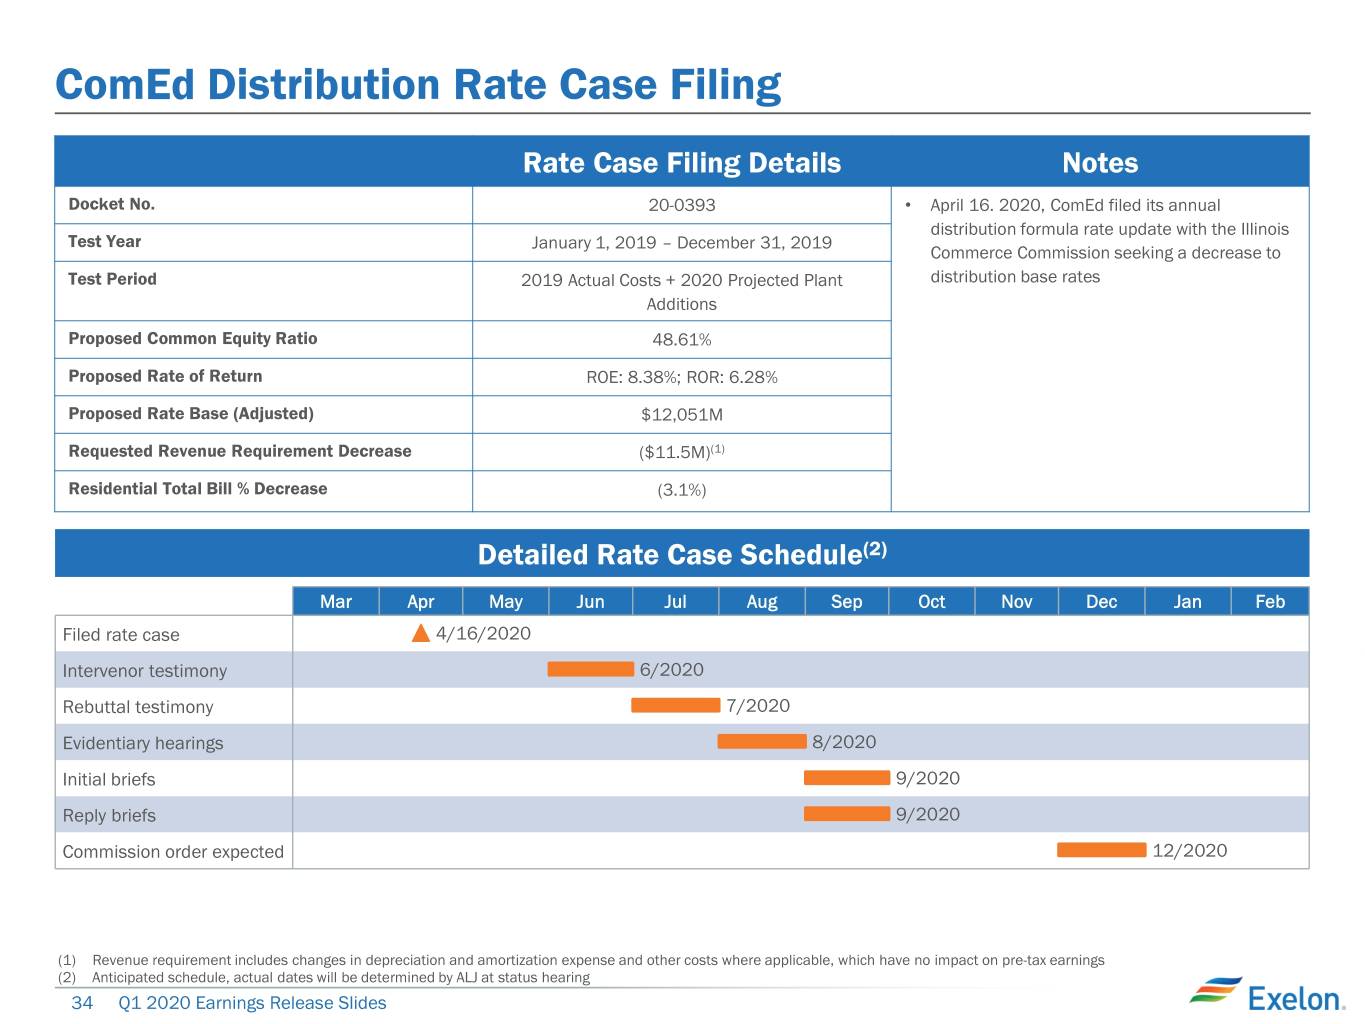
ComEd Distribution Rate Case Filing Rate Case Filing Details Notes Docket No. 20-0393 • April 16. 2020, ComEd filed its annual distribution formula rate update with the Illinois Test Year January 1, 2019 – December 31, 2019 Commerce Commission seeking a decrease to Test Period 2019 Actual Costs + 2020 Projected Plant distribution base rates Additions Proposed Common Equity Ratio 48.61% Proposed Rate of Return ROE: 8.38%; ROR: 6.28% Proposed Rate Base (Adjusted) $12,051M Requested Revenue Requirement Decrease ($11.5M)(1) Residential Total Bill % Decrease (3.1%) Detailed Rate Case Schedule(2) Mar Apr May Jun Jul Aug Sep Oct Nov Dec Jan Feb Filed rate case 4/16/2020 Intervenor testimony 6/2020 Rebuttal testimony 7/2020 Evidentiary hearings 8/2020 Initial briefs 9/2020 Reply briefs 9/2020 Commission order expected 12/2020 (1) Revenue requirement includes changes in depreciation and amortization expense and other costs where applicable, which have no impact on pre-tax earnings (2) Anticipated schedule, actual dates will be determined by ALJ at status hearing 34 Q1 2020 Earnings Release Slides
Exelon Generation Disclosures March 31, 2020 35 Q1 2020 Earnings Release Slides
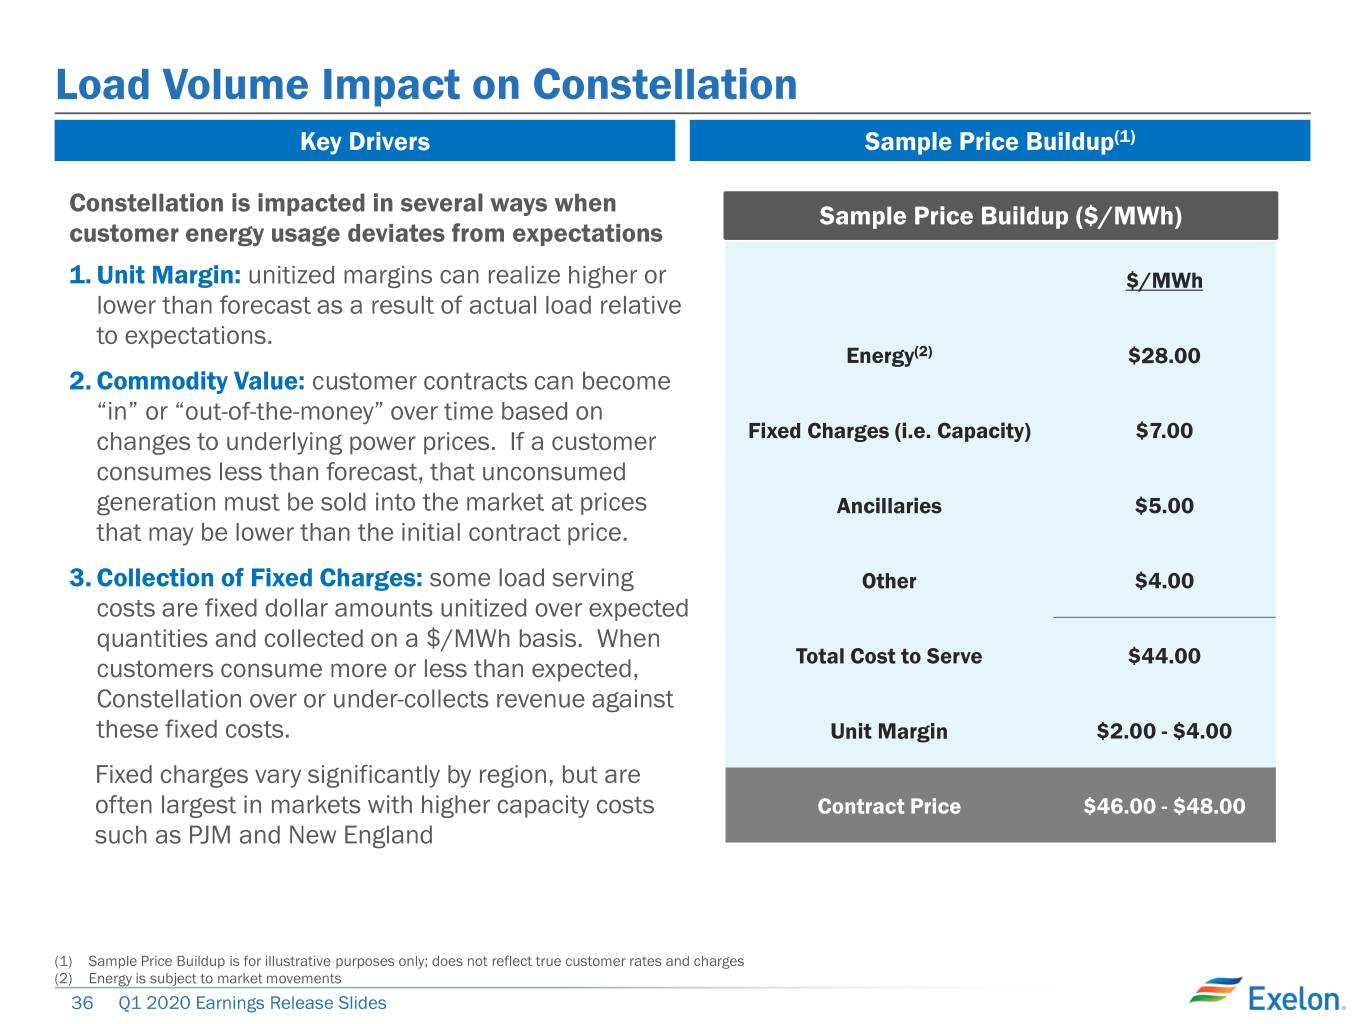
Load Volume Impact on Constellation Key Drivers Sample Price Buildup(1) Constellation is impacted in several ways when Sample Price Buildup ($/MWh) customer energy usage deviates from expectations 1. Unit Margin: unitized margins can realize higher or $/MWh lower than forecast as a result of actual load relative to expectations. Energy(2) $28.00 2. Commodity Value: customer contracts can become “in” or “out-of-the-money” over time based on changes to underlying power prices. If a customer Fixed Charges (i.e. Capacity) $7.00 consumes less than forecast, that unconsumed generation must be sold into the market at prices Ancillaries $5.00 that may be lower than the initial contract price. 3. Collection of Fixed Charges: some load serving Other $4.00 costs are fixed dollar amounts unitized over expected quantities and collected on a $/MWh basis. When customers consume more or less than expected, Total Cost to Serve $44.00 Constellation over or under-collects revenue against these fixed costs. Unit Margin $2.00 - $4.00 Fixed charges vary significantly by region, but are often largest in markets with higher capacity costs Contract Price $46.00 - $48.00 such as PJM and New England (1) Sample Price Buildup is for illustrative purposes only; does not reflect true customer rates and charges (2) Energy is subject to market movements 36 Q1 2020 Earnings Release Slides
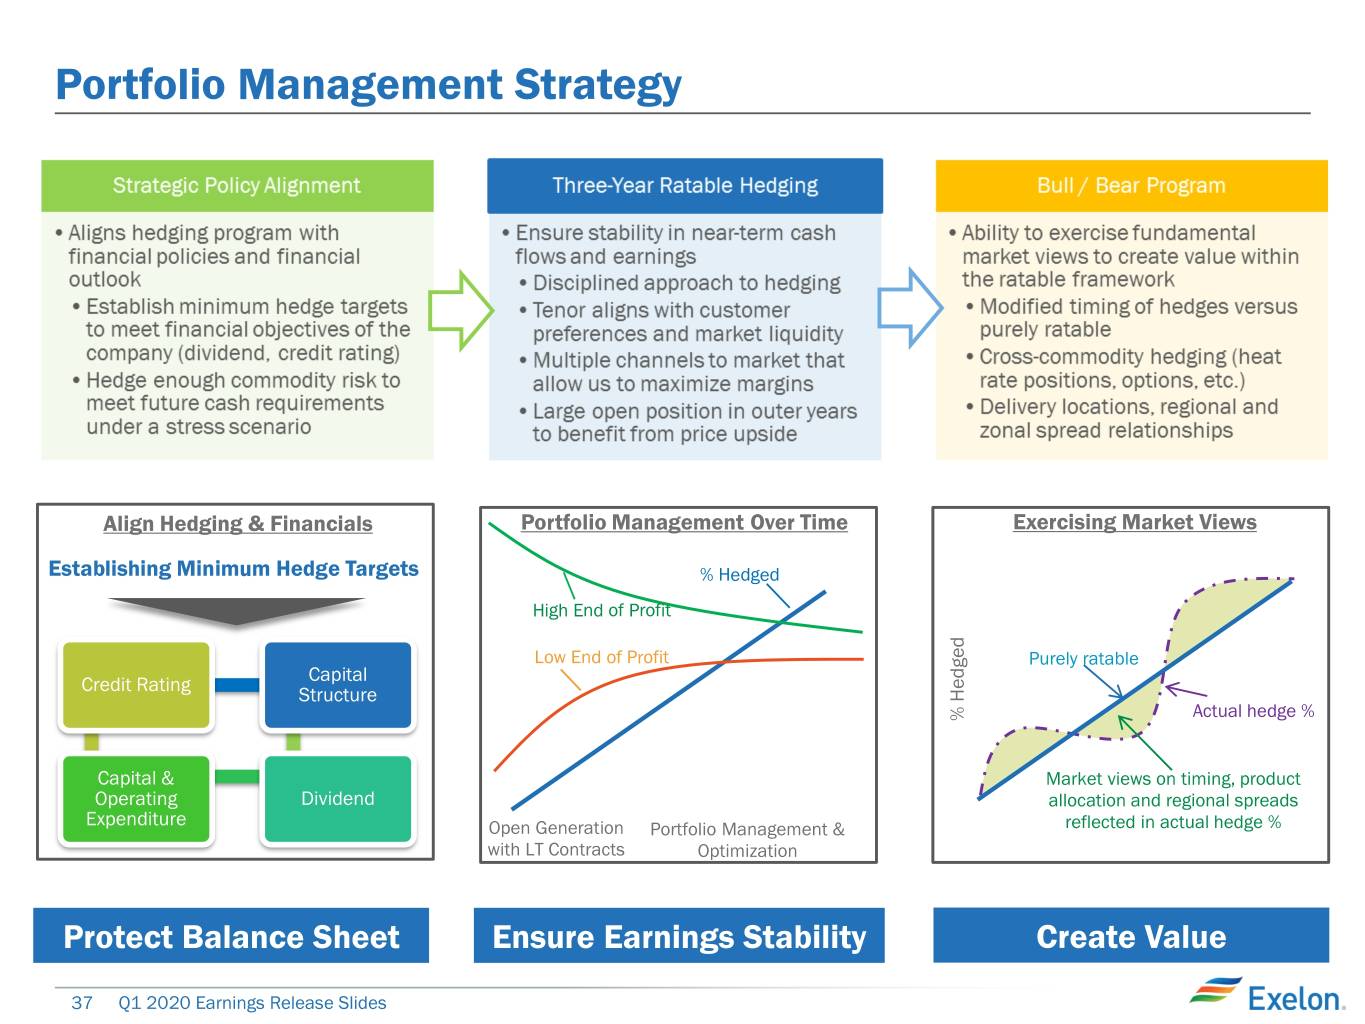
Portfolio Management Strategy Align Hedging & Financials Portfolio Management Over Time Exercising Market Views Establishing Minimum Hedge Targets % Hedged High End of Profit Low End of Profit Purely ratable Capital Credit Rating Structure Actual hedge % % Hedged % Capital & Market views on timing, product Operating Dividend allocation and regional spreads Expenditure Open Generation Portfolio Management & reflected in actual hedge % with LT Contracts Optimization Protect Balance Sheet Ensure Earnings Stability Create Value 37 Q1 2020 Earnings Release Slides
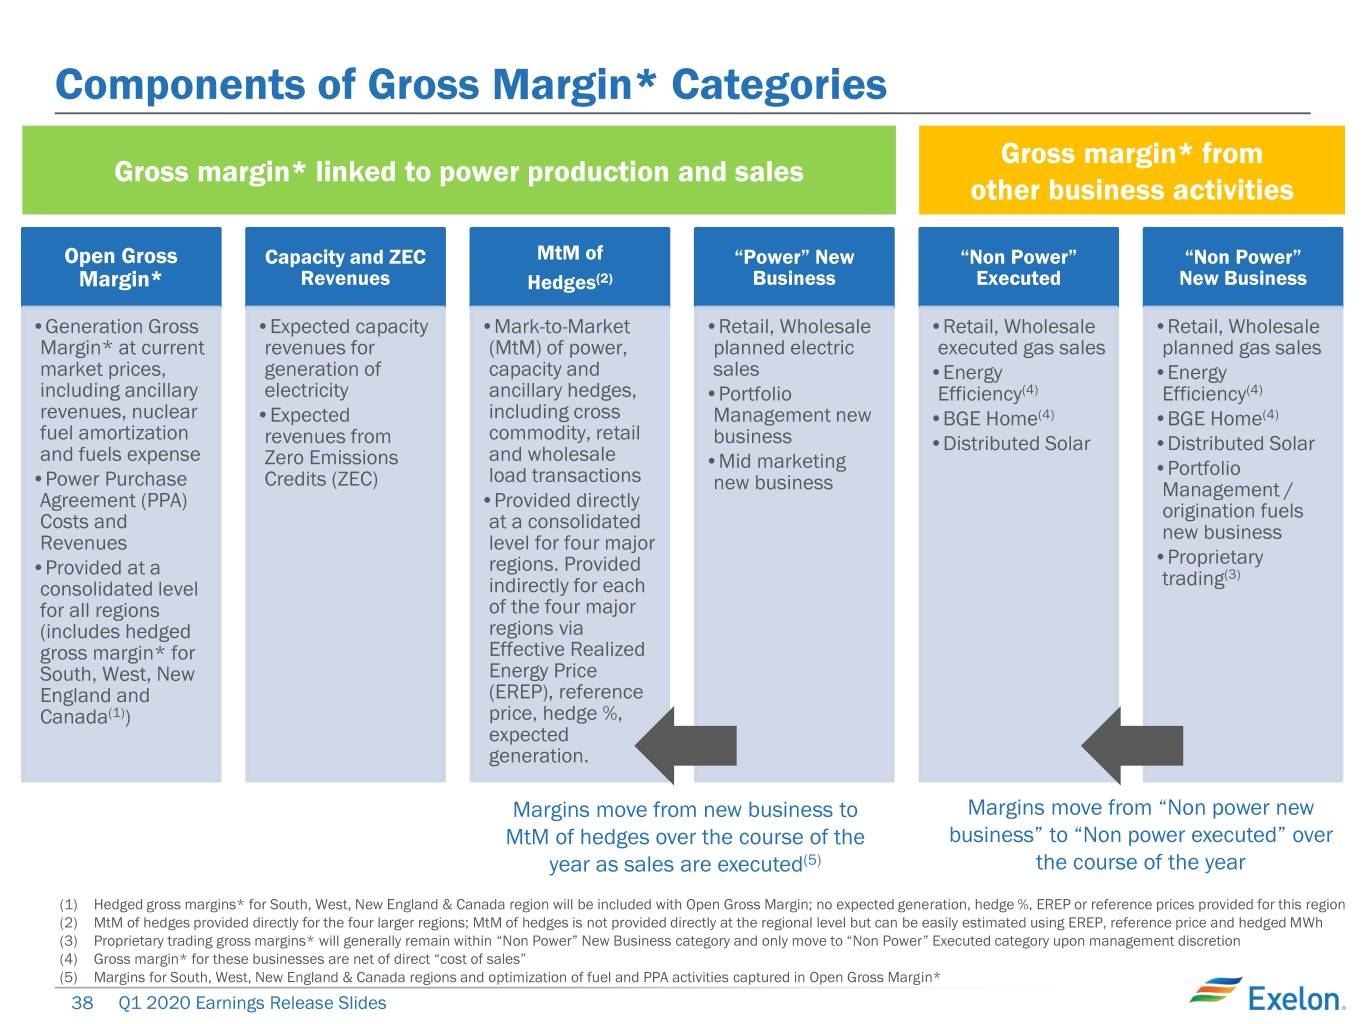
Components of Gross Margin* Categories Gross margin* from Gross margin* linked to power production and sales other business activities Open Gross Capacity and ZEC MtM of “Power” New “Non Power” “Non Power” Margin* Revenues Hedges(2) Business Executed New Business •Generation Gross •Expected capacity •Mark-to-Market •Retail, Wholesale •Retail, Wholesale •Retail, Wholesale Margin* at current revenues for (MtM) of power, planned electric executed gas sales planned gas sales market prices, generation of capacity and sales •Energy •Energy including ancillary electricity ancillary hedges, •Portfolio Efficiency(4) Efficiency(4) revenues, nuclear •Expected including cross Management new •BGE Home(4) •BGE Home(4) fuel amortization commodity, retail revenues from business •Distributed Solar •Distributed Solar and fuels expense Zero Emissions and wholesale •Mid marketing •Portfolio •Power Purchase Credits (ZEC) load transactions new business Management / Agreement (PPA) •Provided directly origination fuels Costs and at a consolidated new business Revenues level for four major •Proprietary •Provided at a regions. Provided trading(3) consolidated level indirectly for each for all regions of the four major (includes hedged regions via gross margin* for Effective Realized South, West, New Energy Price England and (EREP), reference Canada(1)) price, hedge %, expected generation. Margins move from new business to Margins move from “Non power new MtM of hedges over the course of the business” to “Non power executed” over year as sales are executed(5) the course of the year (1) Hedged gross margins* for South, West, New England & Canada region will be included with Open Gross Margin; no expected generation, hedge %, EREP or reference prices provided for this region (2) MtM of hedges provided directly for the four larger regions; MtM of hedges is not provided directly at the regional level but can be easily estimated using EREP, reference price and hedged MWh (3) Proprietary trading gross margins* will generally remain within “Non Power” New Business category and only move to “Non Power” Executed category upon management discretion (4) Gross margin* for these businesses are net of direct “cost of sales” (5) Margins for South, West, New England & Canada regions and optimization of fuel and PPA activities captured in Open Gross Margin* 38 Q1 2020 Earnings Release Slides
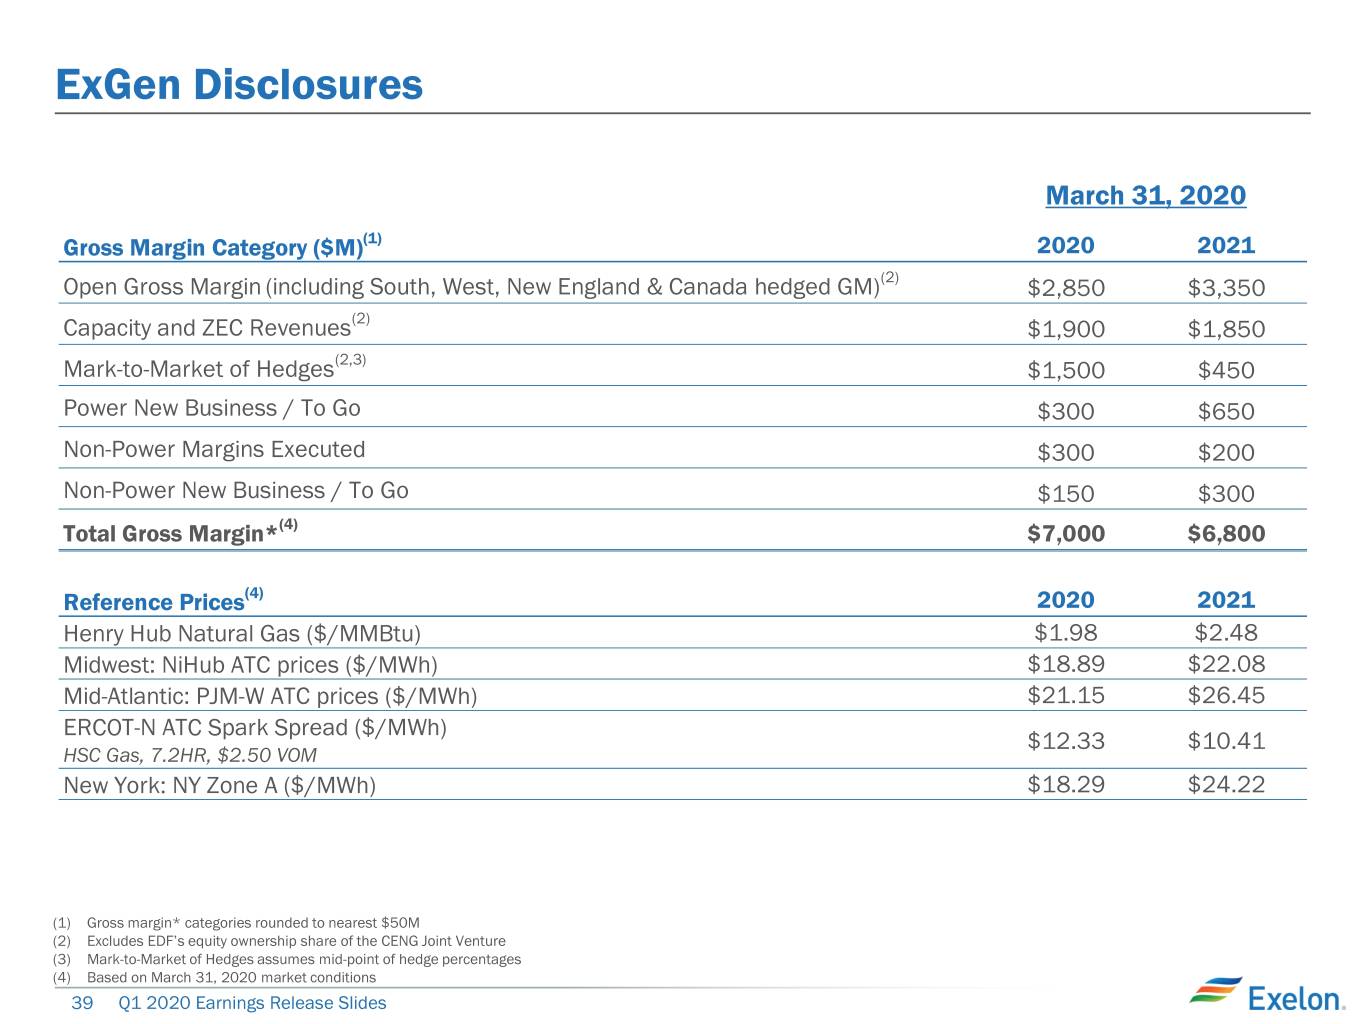
ExGen Disclosures March 31, 2020 Gross Margin Category ($M)(1) 2020 2021 Open Gross Margin (including South, West, New England & Canada hedged GM)(2) $2,850 $3,350 Capacity and ZEC Revenues(2) $1,900 $1,850 Mark-to-Market of Hedges(2,3) $1,500 $450 Power New Business / To Go $300 $650 Non-Power Margins Executed $300 $200 Non-Power New Business / To Go $150 $300 Total Gross Margin*(4) $7,000 $6,800 Reference Prices(4) 2020 2021 Henry Hub Natural Gas ($/MMBtu) $1.98 $2.48 Midwest: NiHub ATC prices ($/MWh) $18.89 $22.08 Mid-Atlantic: PJM-W ATC prices ($/MWh) $21.15 $26.45 ERCOT-N ATC Spark Spread ($/MWh) $12.33 $10.41 HSC Gas, 7.2HR, $2.50 VOM New York: NY Zone A ($/MWh) $18.29 $24.22 (1) Gross margin* categories rounded to nearest $50M (2) Excludes EDF’s equity ownership share of the CENG Joint Venture (3) Mark-to-Market of Hedges assumes mid-point of hedge percentages (4) Based on March 31, 2020 market conditions 39 Q1 2020 Earnings Release Slides
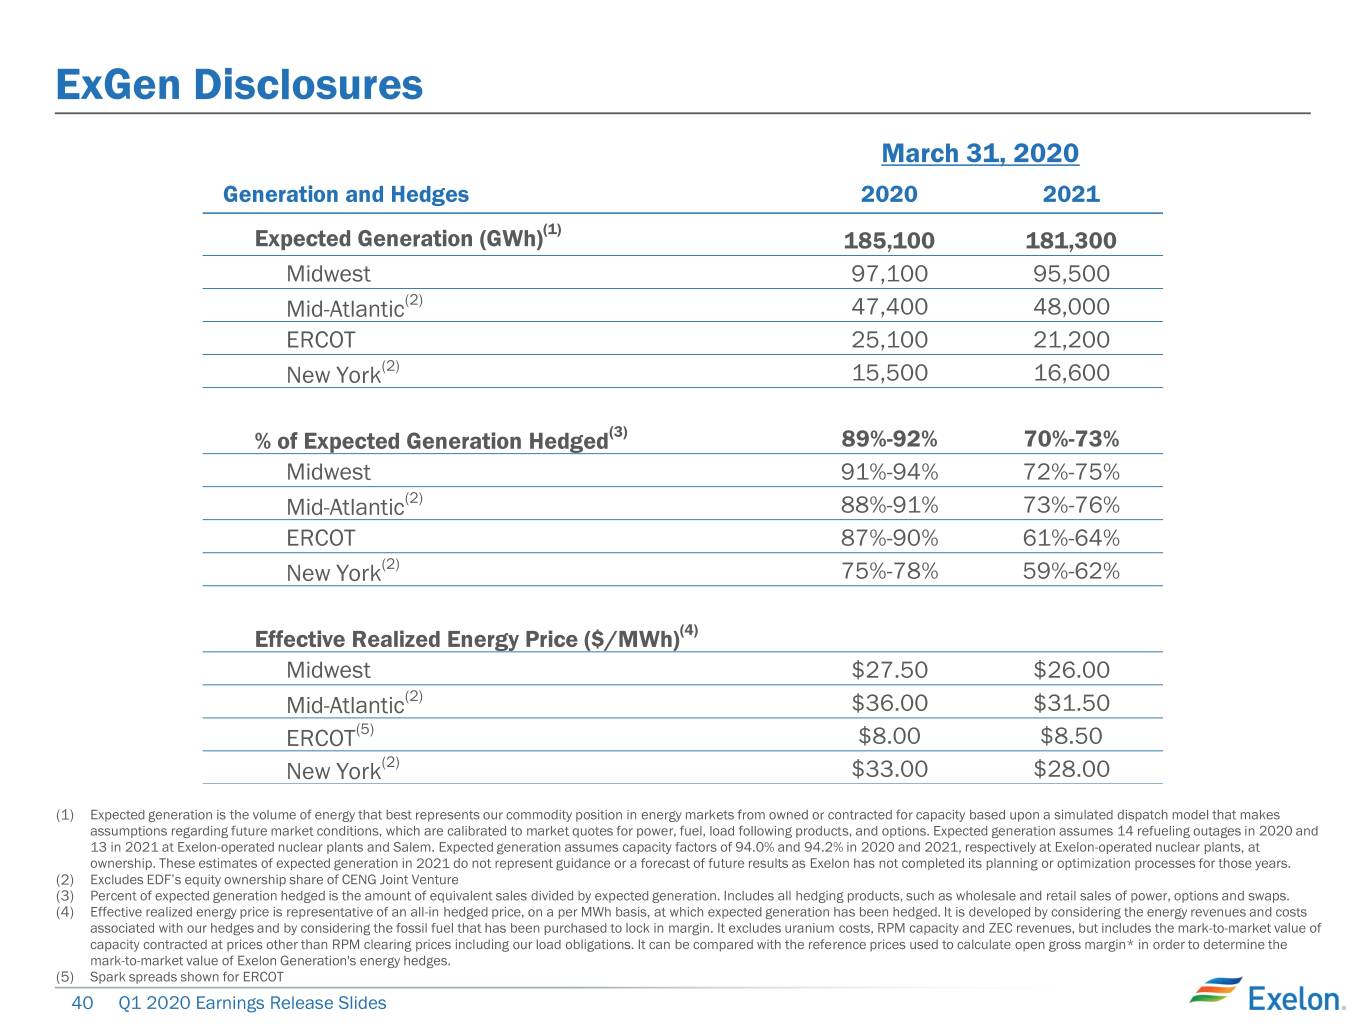
ExGen Disclosures March 31, 2020 Generation and Hedges 2020 2021 Expected Generation (GWh)(1) 185,100 181,300 Midwest 97,100 95,500 Mid-Atlantic(2) 47,400 48,000 ERCOT 25,100 21,200 New York(2) 15,500 16,600 % of Expected Generation Hedged(3) 89%-92% 70%-73% Midwest 91%-94% 72%-75% Mid-Atlantic(2) 88%-91% 73%-76% ERCOT 87%-90% 61%-64% New York(2) 75%-78% 59%-62% Effective Realized Energy Price ($/MWh)(4) Midwest $27.50 $26.00 Mid-Atlantic(2) $36.00 $31.50 ERCOT(5) $8.00 $8.50 New York(2) $33.00 $28.00 (1) Expected generation is the volume of energy that best represents our commodity position in energy markets from owned or contracted for capacity based upon a simulated dispatch model that makes assumptions regarding future market conditions, which are calibrated to market quotes for power, fuel, load following products, and options. Expected generation assumes 14 refueling outages in 2020 and 13 in 2021 at Exelon-operated nuclear plants and Salem. Expected generation assumes capacity factors of 94.0% and 94.2% in 2020 and 2021, respectively at Exelon-operated nuclear plants, at ownership. These estimates of expected generation in 2021 do not represent guidance or a forecast of future results as Exelon has not completed its planning or optimization processes for those years. (2) Excludes EDF’s equity ownership share of CENG Joint Venture (3) Percent of expected generation hedged is the amount of equivalent sales divided by expected generation. Includes all hedging products, such as wholesale and retail sales of power, options and swaps. (4) Effective realized energy price is representative of an all-in hedged price, on a per MWh basis, at which expected generation has been hedged. It is developed by considering the energy revenues and costs associated with our hedges and by considering the fossil fuel that has been purchased to lock in margin. It excludes uranium costs, RPM capacity and ZEC revenues, but includes the mark-to-market value of capacity contracted at prices other than RPM clearing prices including our load obligations. It can be compared with the reference prices used to calculate open gross margin* in order to determine the mark-to-market value of Exelon Generation's energy hedges. (5) Spark spreads shown for ERCOT 40 Q1 2020 Earnings Release Slides
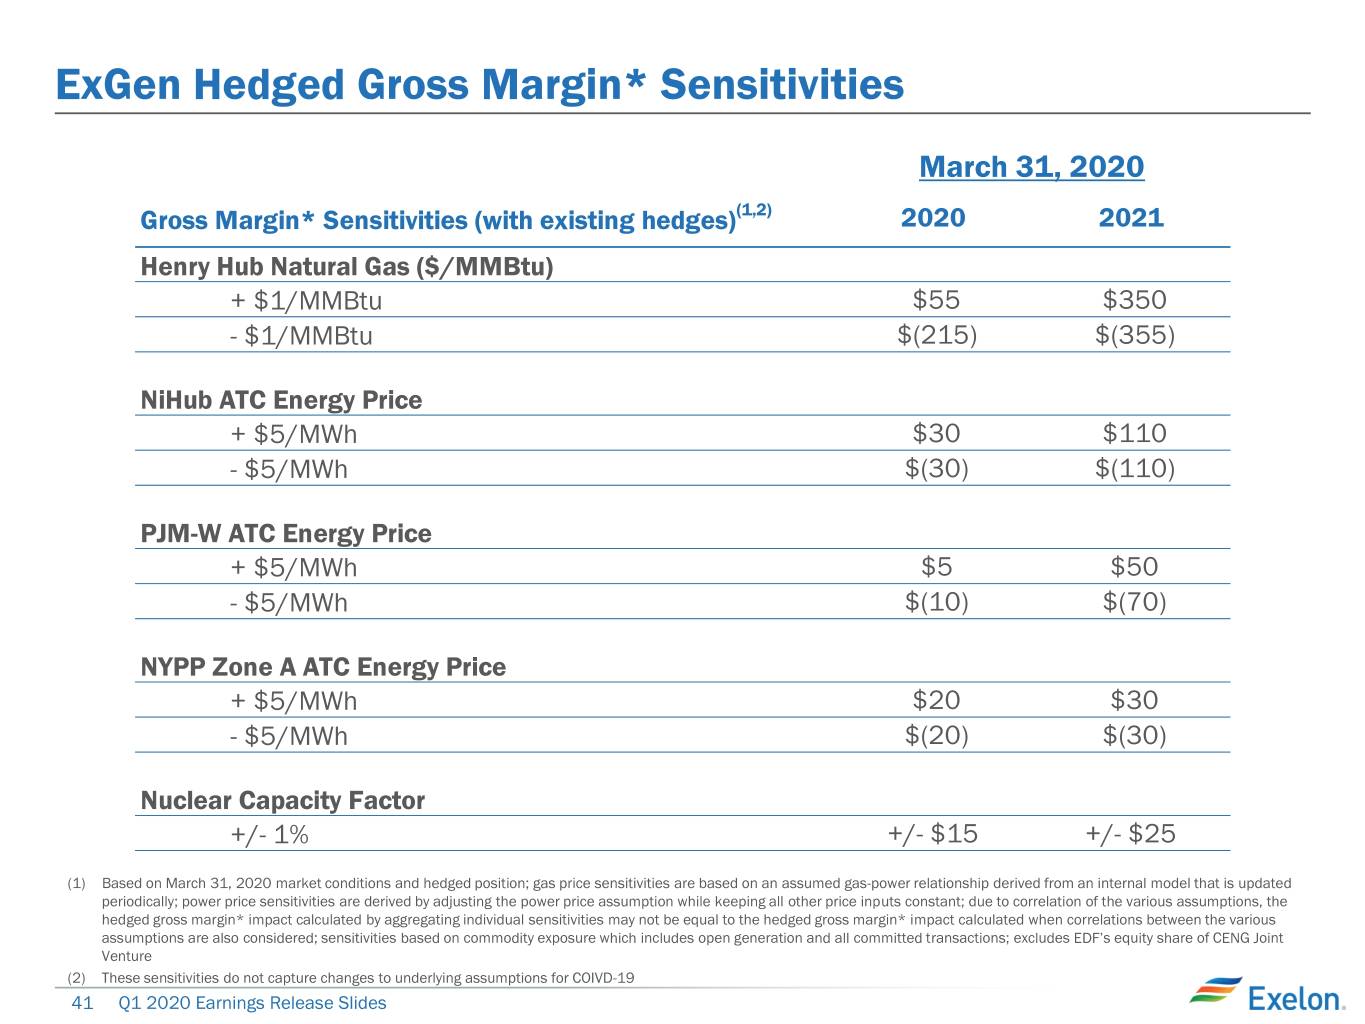
ExGen Hedged Gross Margin* Sensitivities March 31, 2020 Gross Margin* Sensitivities (with existing hedges)(1,2) 2020 2021 Henry Hub Natural Gas ($/MMBtu) + $1/MMBtu $55 $350 - $1/MMBtu $(215) $(355) NiHub ATC Energy Price + $5/MWh $30 $110 - $5/MWh $(30) $(110) PJM-W ATC Energy Price + $5/MWh $5 $50 - $5/MWh $(10) $(70) NYPP Zone A ATC Energy Price + $5/MWh $20 $30 - $5/MWh $(20) $(30) Nuclear Capacity Factor +/- 1% +/- $15 +/- $25 (1) Based on March 31, 2020 market conditions and hedged position; gas price sensitivities are based on an assumed gas-power relationship derived from an internal model that is updated periodically; power price sensitivities are derived by adjusting the power price assumption while keeping all other price inputs constant; due to correlation of the various assumptions, the hedged gross margin* impact calculated by aggregating individual sensitivities may not be equal to the hedged gross margin* impact calculated when correlations between the various assumptions are also considered; sensitivities based on commodity exposure which includes open generation and all committed transactions; excludes EDF’s equity share of CENG Joint Venture (2) These sensitivities do not capture changes to underlying assumptions for COIVD-19 41 Q1 2020 Earnings Release Slides
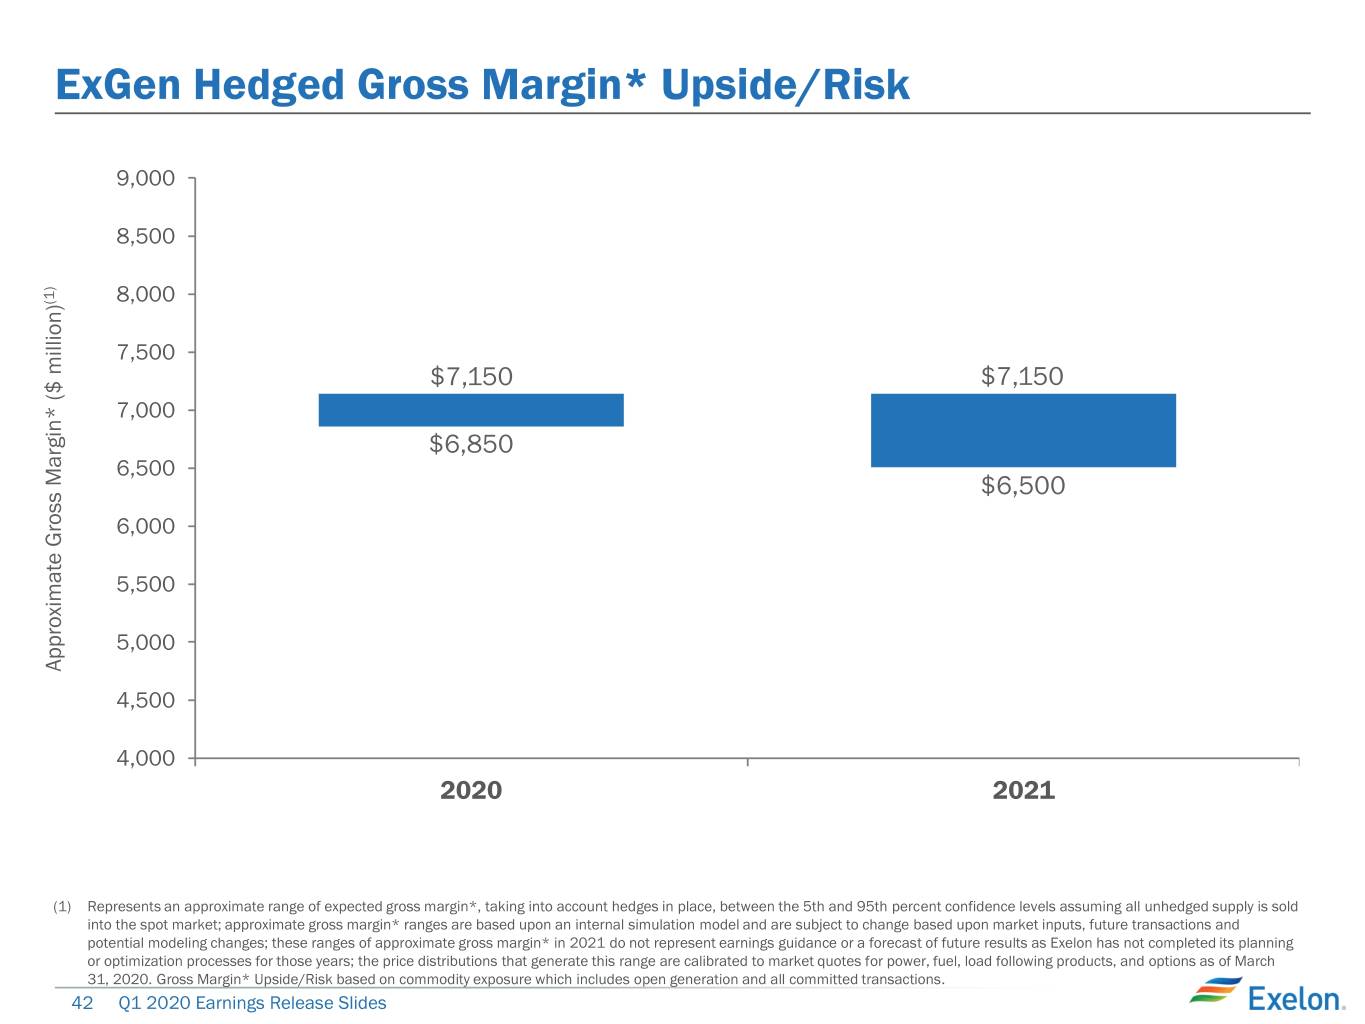
ExGen Hedged Gross Margin* Upside/Risk 9,000 8,500 (1) 8,000 7,500 $7,150 $7,150 7,000 $6,850 6,500 $6,500 6,000 5,500 5,000 Approximate Gross ($ Margin* million) Gross Approximate 4,500 4,000 2020 2021 (1) Represents an approximate range of expected gross margin*, taking into account hedges in place, between the 5th and 95th percent confidence levels assuming all unhedged supply is sold into the spot market; approximate gross margin* ranges are based upon an internal simulation model and are subject to change based upon market inputs, future transactions and potential modeling changes; these ranges of approximate gross margin* in 2021 do not represent earnings guidance or a forecast of future results as Exelon has not completed its planning or optimization processes for those years; the price distributions that generate this range are calibrated to market quotes for power, fuel, load following products, and options as of March 31, 2020. Gross Margin* Upside/Risk based on commodity exposure which includes open generation and all committed transactions. 42 Q1 2020 Earnings Release Slides
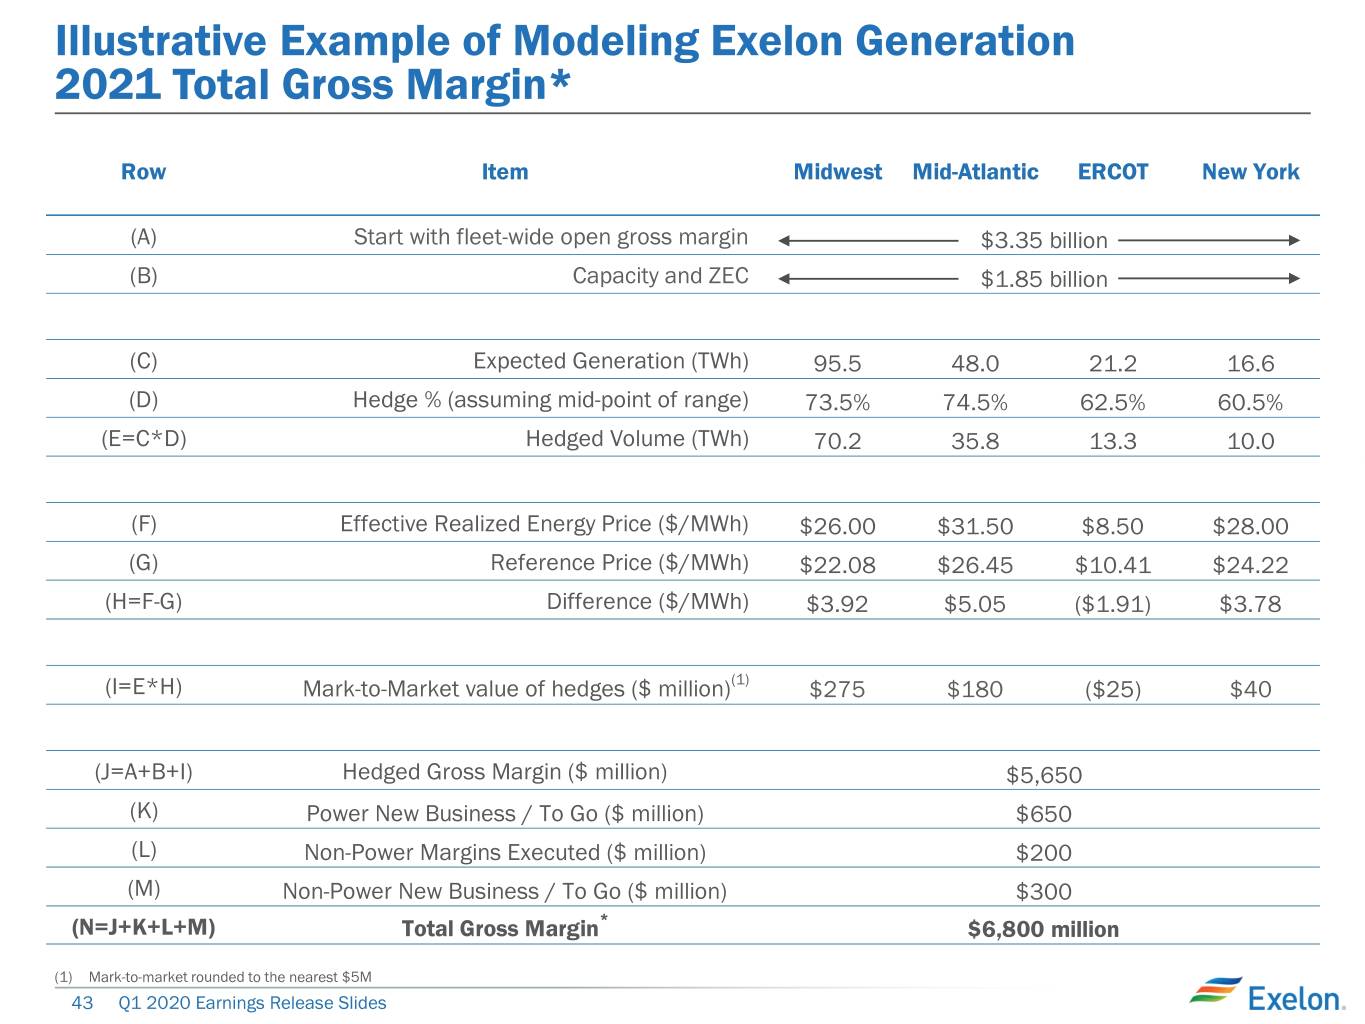
Illustrative Example of Modeling Exelon Generation 2021 Total Gross Margin* Row Item Midwest Mid-Atlantic ERCOT New York (A) Start with fleet-wide open gross margin $3.35 billion (B) Capacity and ZEC $1.85 billion (C) Expected Generation (TWh) 95.5 48.0 21.2 16.6 (D) Hedge % (assuming mid-point of range) 73.5% 74.5% 62.5% 60.5% (E=C*D) Hedged Volume (TWh) 70.2 35.8 13.3 10.0 (F) Effective Realized Energy Price ($/MWh) $26.00 $31.50 $8.50 $28.00 (G) Reference Price ($/MWh) $22.08 $26.45 $10.41 $24.22 (H=F-G) Difference ($/MWh) $3.92 $5.05 ($1.91) $3.78 (I=E*H) Mark-to-Market value of hedges ($ million)(1) $275 $180 ($25) $40 (J=A+B+I) Hedged Gross Margin ($ million) $5,650 (K) Power New Business / To Go ($ million) $650 (L) Non-Power Margins Executed ($ million) $200 (M) Non-Power New Business / To Go ($ million) $300 (N=J+K+L+M) Total Gross Margin* $6,800 million (1) Mark-to-market rounded to the nearest $5M 43 Q1 2020 Earnings Release Slides
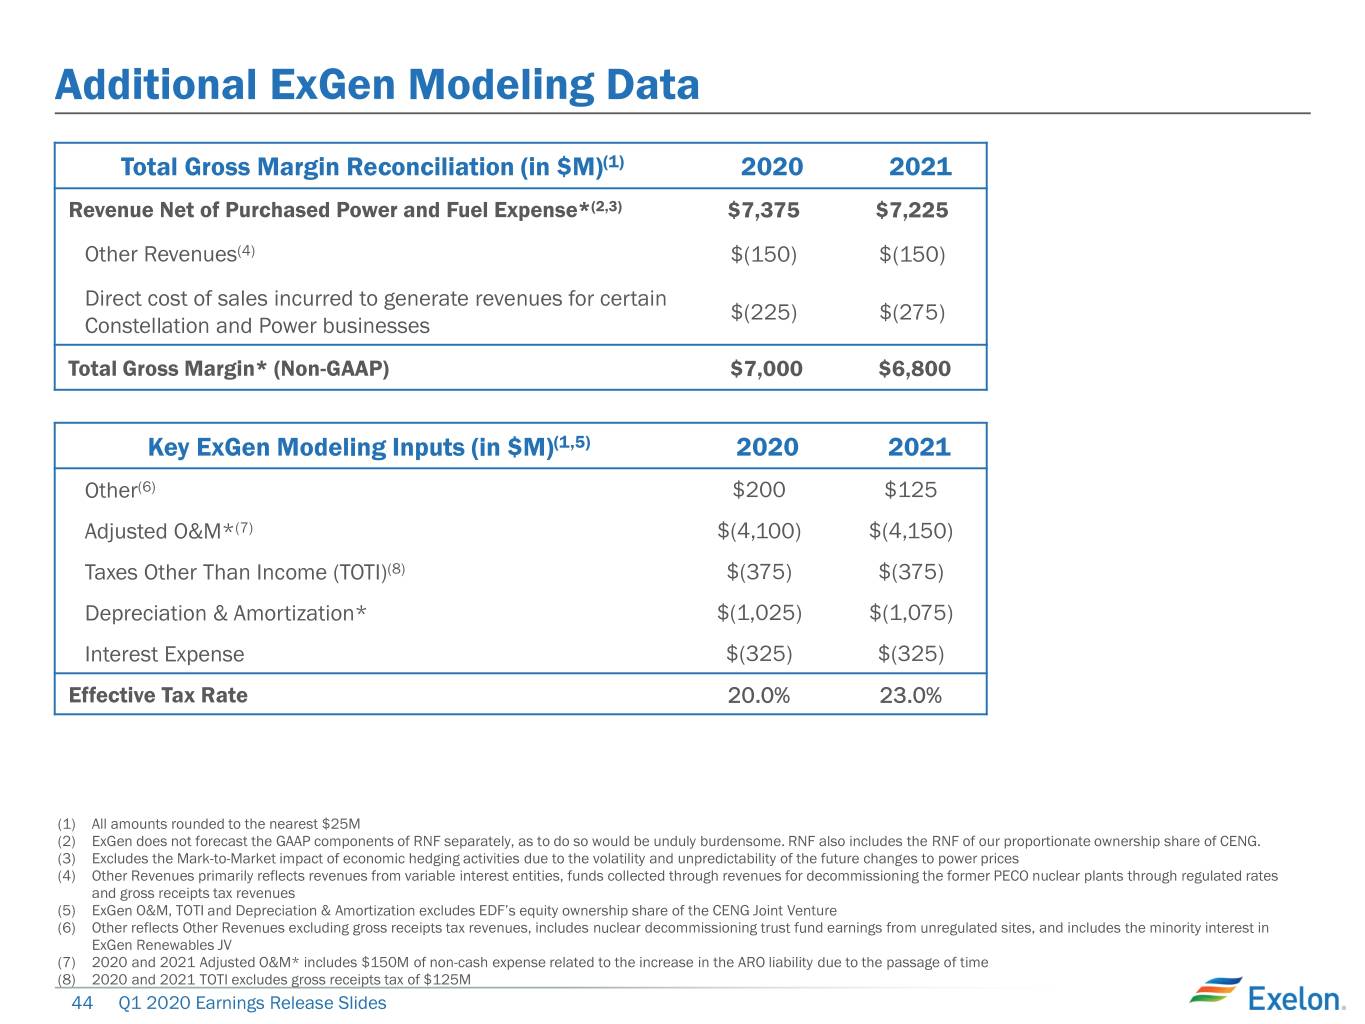
Additional ExGen Modeling Data Total Gross Margin Reconciliation (in $M)(1) 2020 2021 Revenue Net of Purchased Power and Fuel Expense*(2,3) $7,375 $7,225 Other Revenues(4) $(150) $(150) Direct cost of sales incurred to generate revenues for certain $(225) $(275) Constellation and Power businesses Total Gross Margin* (Non-GAAP) $7,000 $6,800 Key ExGen Modeling Inputs (in $M)(1,5) 2020 2021 Other(6) $200 $125 Adjusted O&M*(7) $(4,100) $(4,150) Taxes Other Than Income (TOTI)(8) $(375) $(375) Depreciation & Amortization* $(1,025) $(1,075) Interest Expense $(325) $(325) Effective Tax Rate 20.0% 23.0% (1) All amounts rounded to the nearest $25M (2) ExGen does not forecast the GAAP components of RNF separately, as to do so would be unduly burdensome. RNF also includes the RNF of our proportionate ownership share of CENG. (3) Excludes the Mark-to-Market impact of economic hedging activities due to the volatility and unpredictability of the future changes to power prices (4) Other Revenues primarily reflects revenues from variable interest entities, funds collected through revenues for decommissioning the former PECO nuclear plants through regulated rates and gross receipts tax revenues (5) ExGen O&M, TOTI and Depreciation & Amortization excludes EDF’s equity ownership share of the CENG Joint Venture (6) Other reflects Other Revenues excluding gross receipts tax revenues, includes nuclear decommissioning trust fund earnings from unregulated sites, and includes the minority interest in ExGen Renewables JV (7) 2020 and 2021 Adjusted O&M* includes $150M of non-cash expense related to the increase in the ARO liability due to the passage of time (8) 2020 and 2021 TOTI excludes gross receipts tax of $125M 44 Q1 2020 Earnings Release Slides
Appendix Reconciliation of Non-GAAP Measures 45 Q1 2020 Earnings Release Slides
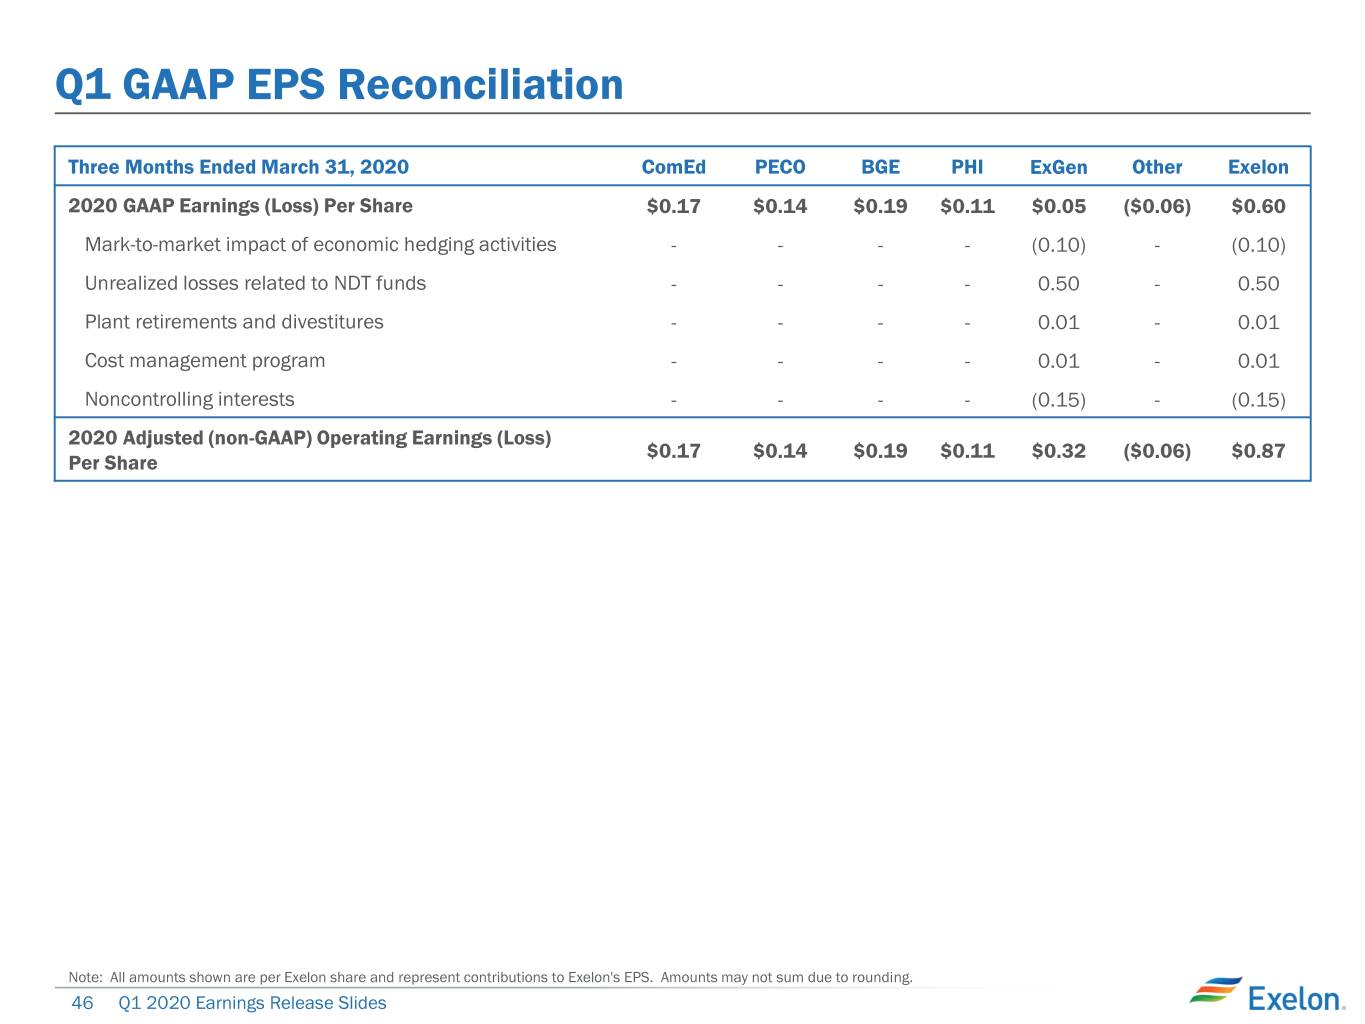
Q1 GAAP EPS Reconciliation Three Months Ended March 31, 2020 ComEd PECO BGE PHI ExGen Other Exelon 2020 GAAP Earnings (Loss) Per Share $0.17 $0.14 $0.19 $0.11 $0.05 ($0.06) $0.60 Mark-to-market impact of economic hedging activities - - - - (0.10) - (0.10) Unrealized losses related to NDT funds - - - - 0.50 - 0.50 Plant retirements and divestitures - - - - 0.01 - 0.01 Cost management program - - - - 0.01 - 0.01 Noncontrolling interests - - - - (0.15) - (0.15) 2020 Adjusted (non-GAAP) Operating Earnings (Loss) $0.17 $0.14 $0.19 $0.11 $0.32 ($0.06) $0.87 Per Share Note: All amounts shown are per Exelon share and represent contributions to Exelon's EPS. Amounts may not sum due to rounding. 46 Q1 2020 Earnings Release Slides
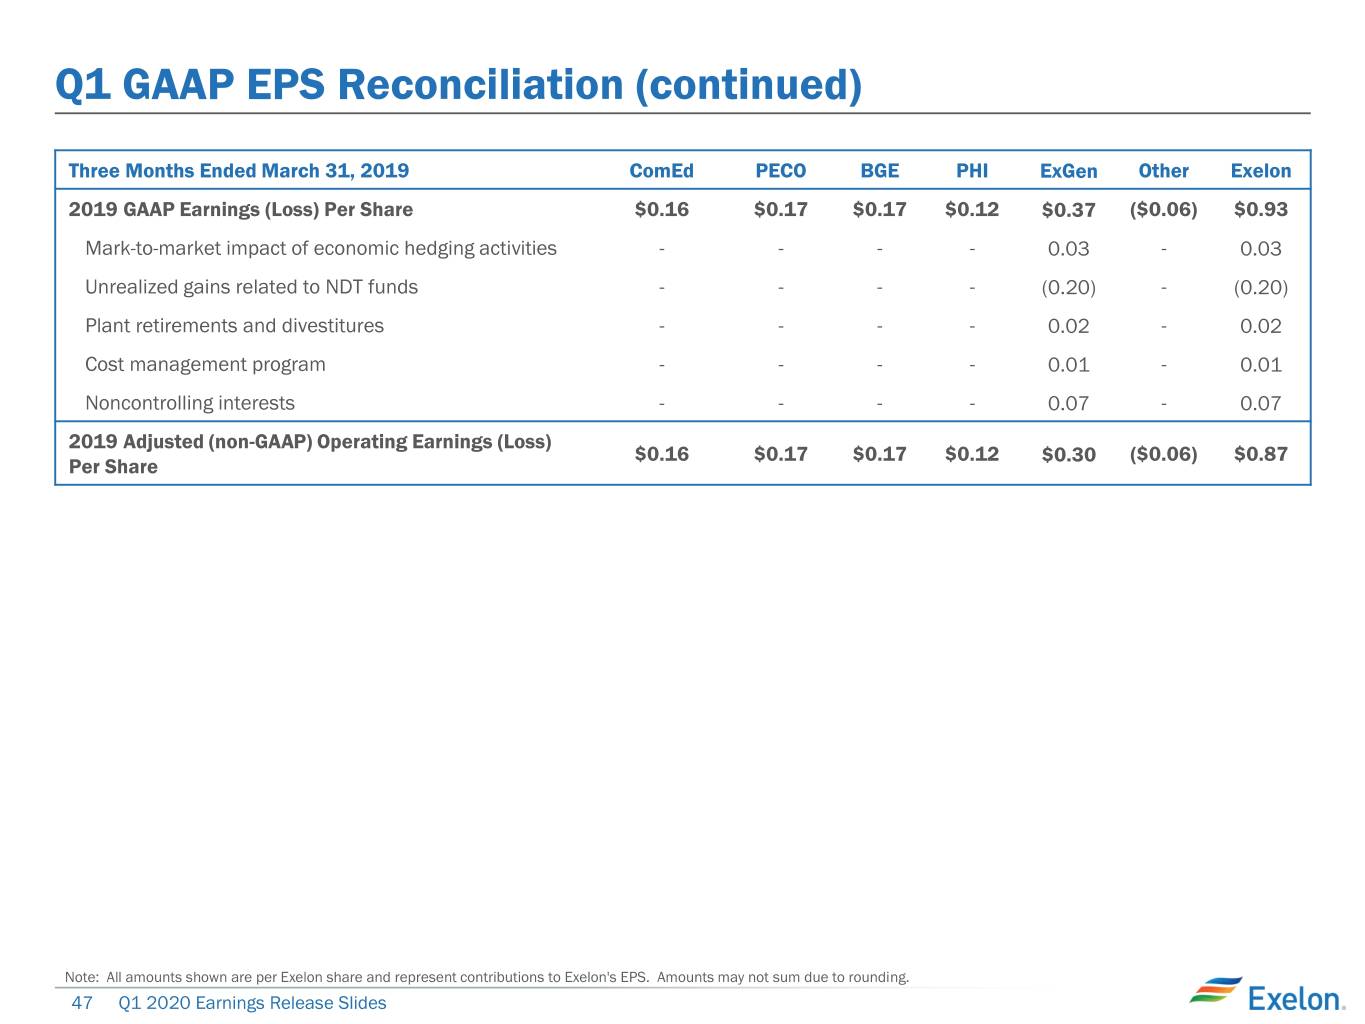
Q1 GAAP EPS Reconciliation (continued) Three Months Ended March 31, 2019 ComEd PECO BGE PHI ExGen Other Exelon 2019 GAAP Earnings (Loss) Per Share $0.16 $0.17 $0.17 $0.12 $0.37 ($0.06) $0.93 Mark-to-market impact of economic hedging activities - - - - 0.03 - 0.03 Unrealized gains related to NDT funds - - - - (0.20) - (0.20) Plant retirements and divestitures - - - - 0.02 - 0.02 Cost management program - - - - 0.01 - 0.01 Noncontrolling interests - - - - 0.07 - 0.07 2019 Adjusted (non-GAAP) Operating Earnings (Loss) $0.16 $0.17 $0.17 $0.12 $0.30 ($0.06) $0.87 Per Share Note: All amounts shown are per Exelon share and represent contributions to Exelon's EPS. Amounts may not sum due to rounding. 47 Q1 2020 Earnings Release Slides
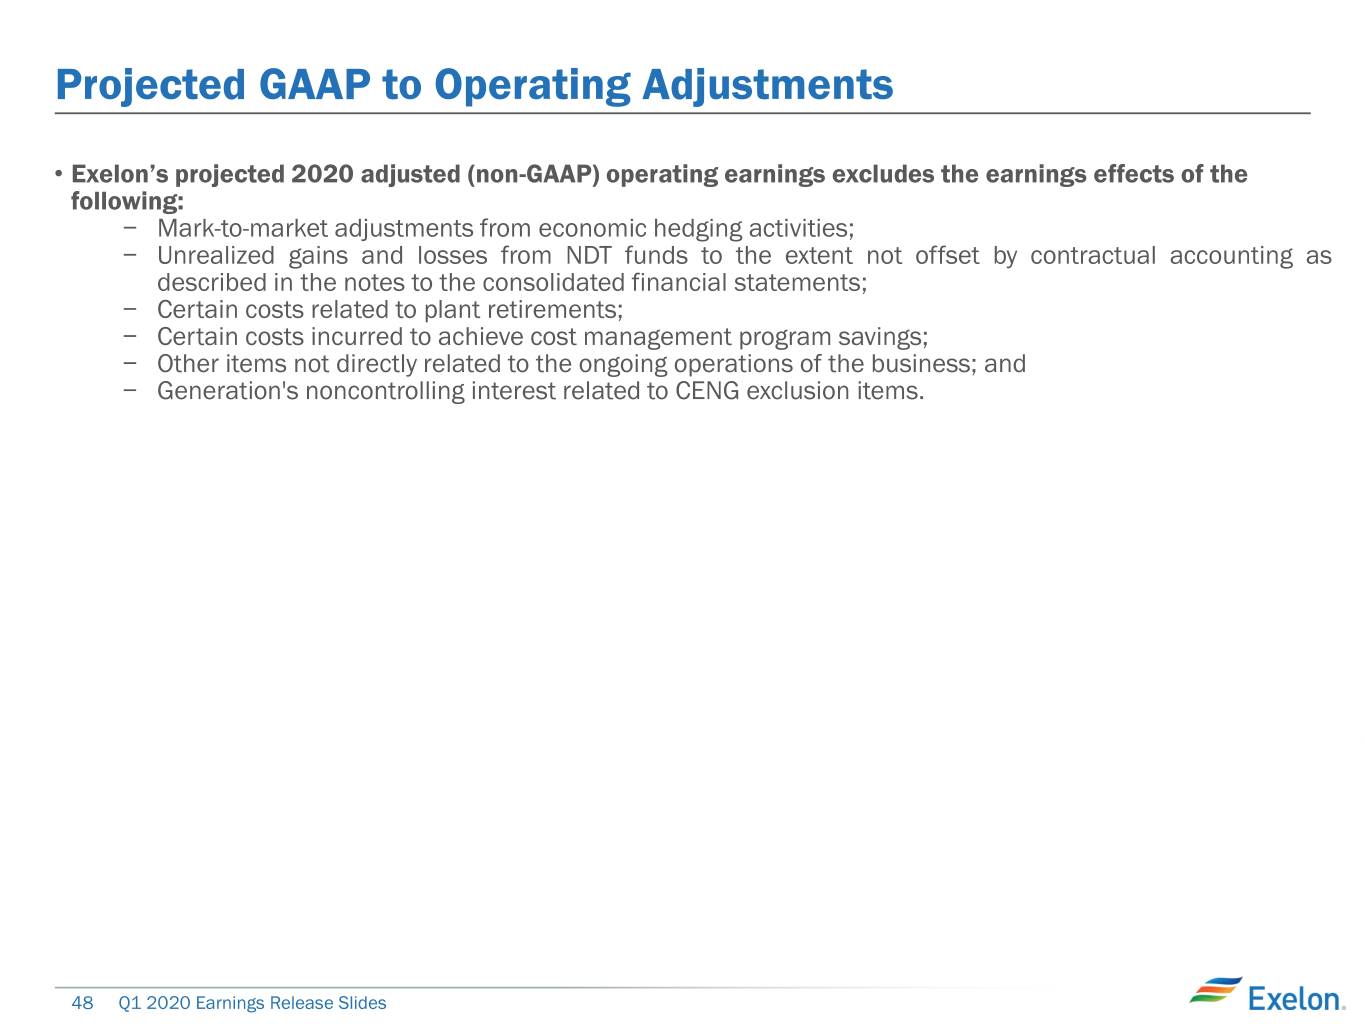
Projected GAAP to Operating Adjustments • Exelon’s projected 2020 adjusted (non-GAAP) operating earnings excludes the earnings effects of the following: − Mark-to-market adjustments from economic hedging activities; − Unrealized gains and losses from NDT funds to the extent not offset by contractual accounting as described in the notes to the consolidated financial statements; − Certain costs related to plant retirements; − Certain costs incurred to achieve cost management program savings; − Other items not directly related to the ongoing operations of the business; and − Generation's noncontrolling interest related to CENG exclusion items. 48 Q1 2020 Earnings Release Slides
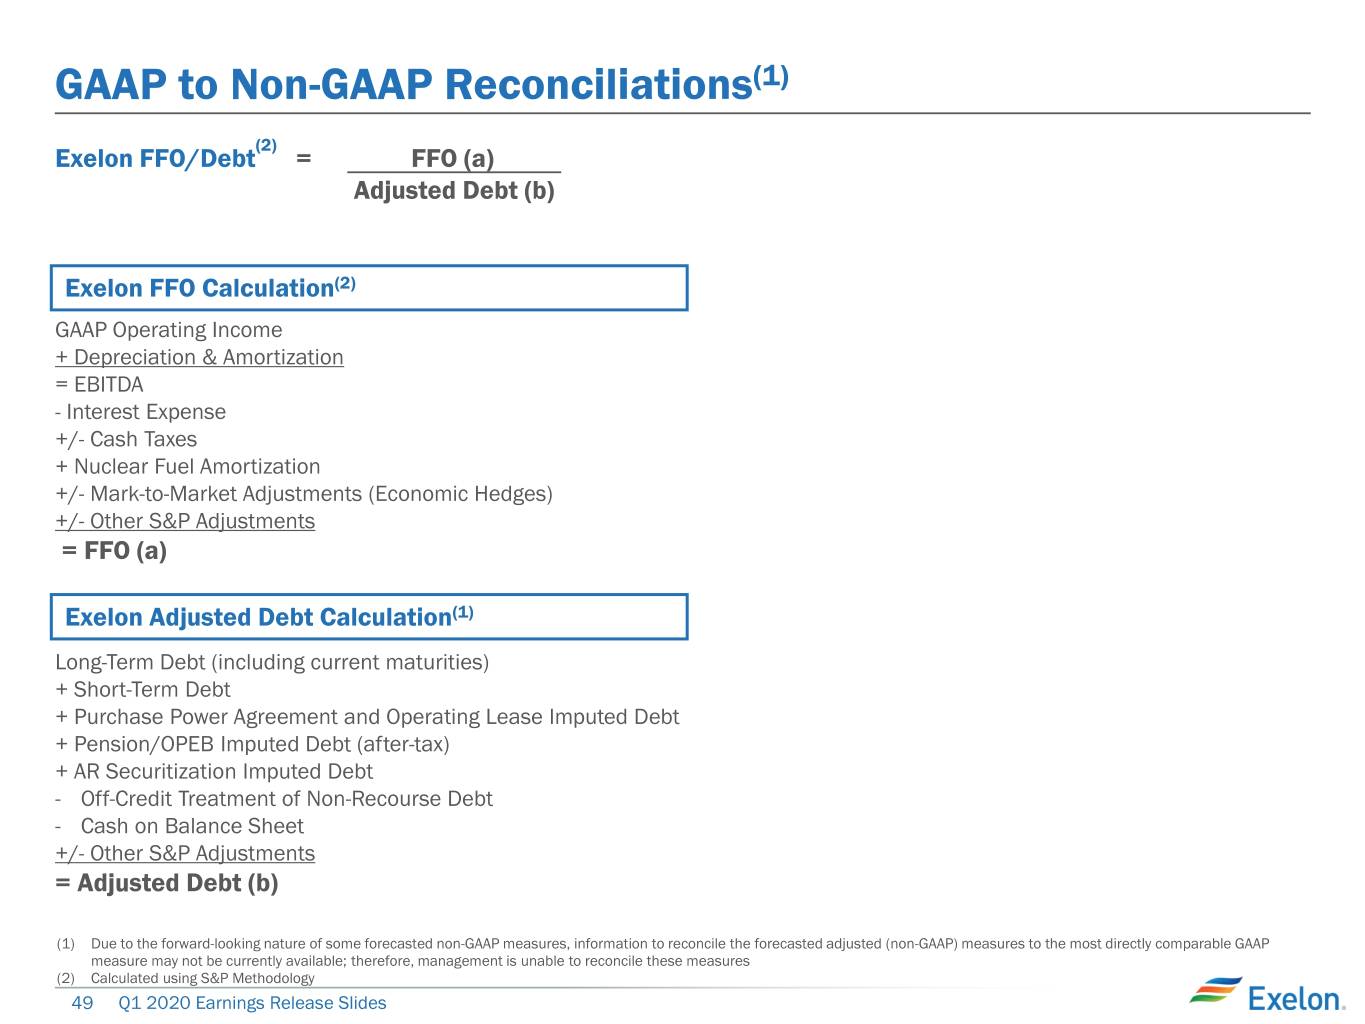
GAAP to Non-GAAP Reconciliations(1) (2) Exelon FFO/Debt = FFO (a) Adjusted Debt (b) Exelon FFO Calculation(2) GAAP Operating Income + Depreciation & Amortization = EBITDA - Interest Expense +/- Cash Taxes + Nuclear Fuel Amortization +/- Mark-to-Market Adjustments (Economic Hedges) +/- Other S&P Adjustments = FFO (a) Exelon Adjusted Debt Calculation(1) Long-Term Debt (including current maturities) + Short-Term Debt + Purchase Power Agreement and Operating Lease Imputed Debt + Pension/OPEB Imputed Debt (after-tax) + AR Securitization Imputed Debt - Off-Credit Treatment of Non-Recourse Debt - Cash on Balance Sheet +/- Other S&P Adjustments = Adjusted Debt (b) (1) Due to the forward-looking nature of some forecasted non-GAAP measures, information to reconcile the forecasted adjusted (non-GAAP) measures to the most directly comparable GAAP measure may not be currently available; therefore, management is unable to reconcile these measures (2) Calculated using S&P Methodology 49 Q1 2020 Earnings Release Slides
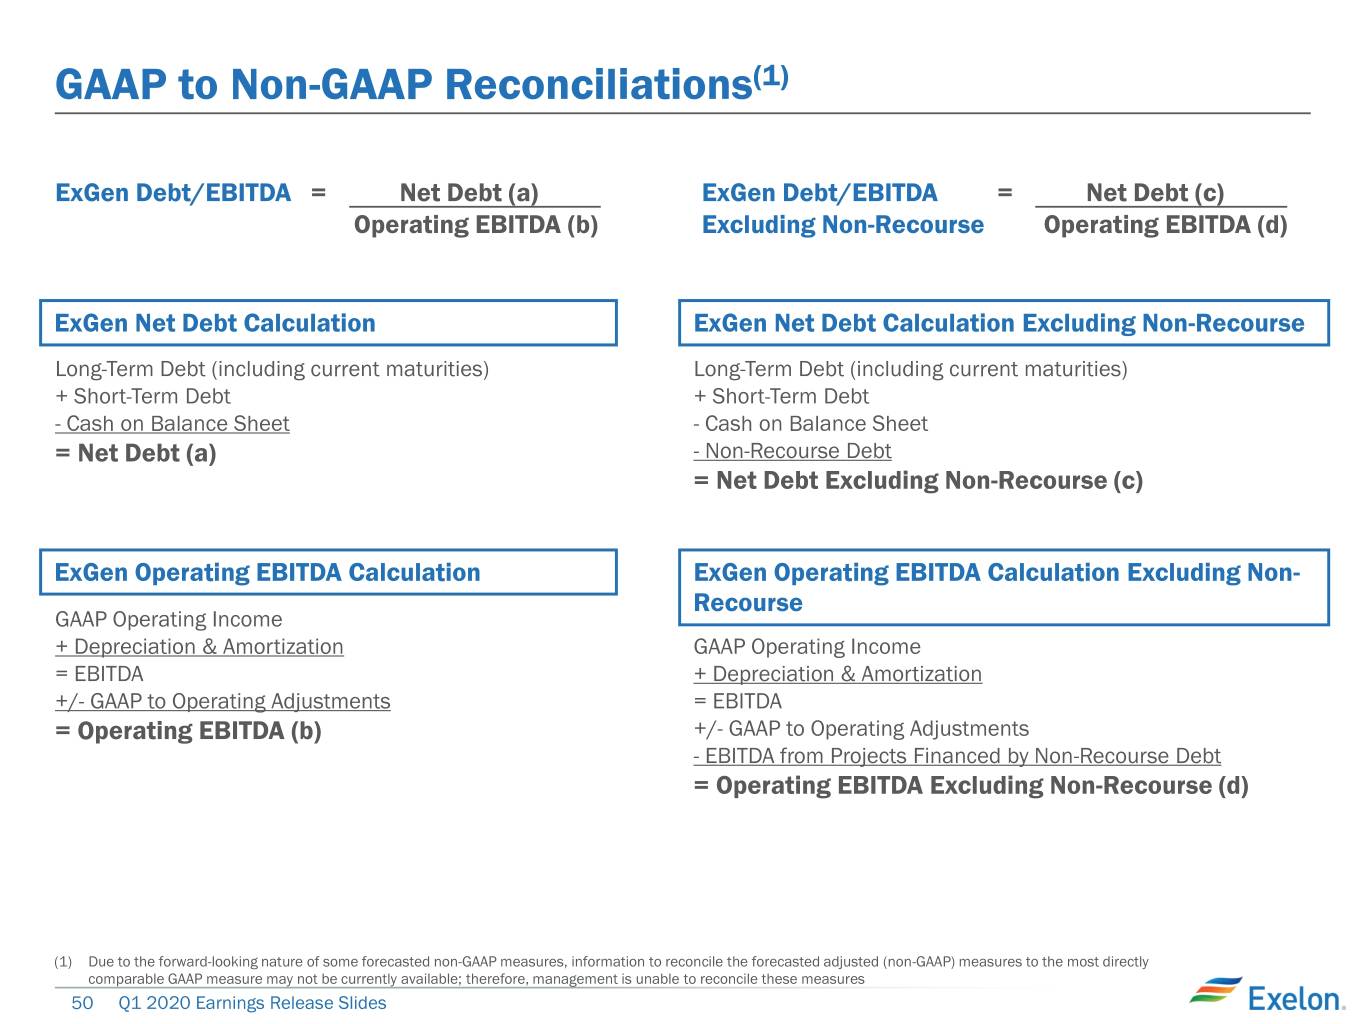
GAAP to Non-GAAP Reconciliations(1) ExGen Debt/EBITDA = Net Debt (a) ExGen Debt/EBITDA = Net Debt (c) Operating EBITDA (b) Excluding Non-Recourse Operating EBITDA (d) ExGen Net Debt Calculation ExGen Net Debt Calculation Excluding Non-Recourse Long-Term Debt (including current maturities) Long-Term Debt (including current maturities) + Short-Term Debt + Short-Term Debt - Cash on Balance Sheet - Cash on Balance Sheet = Net Debt (a) - Non-Recourse Debt = Net Debt Excluding Non-Recourse (c) ExGen Operating EBITDA Calculation ExGen Operating EBITDA Calculation Excluding Non- Recourse GAAP Operating Income + Depreciation & Amortization GAAP Operating Income = EBITDA + Depreciation & Amortization +/- GAAP to Operating Adjustments = EBITDA = Operating EBITDA (b) +/- GAAP to Operating Adjustments - EBITDA from Projects Financed by Non-Recourse Debt = Operating EBITDA Excluding Non-Recourse (d) (1) Due to the forward-looking nature of some forecasted non-GAAP measures, information to reconcile the forecasted adjusted (non-GAAP) measures to the most directly comparable GAAP measure may not be currently available; therefore, management is unable to reconcile these measures 50 Q1 2020 Earnings Release Slides
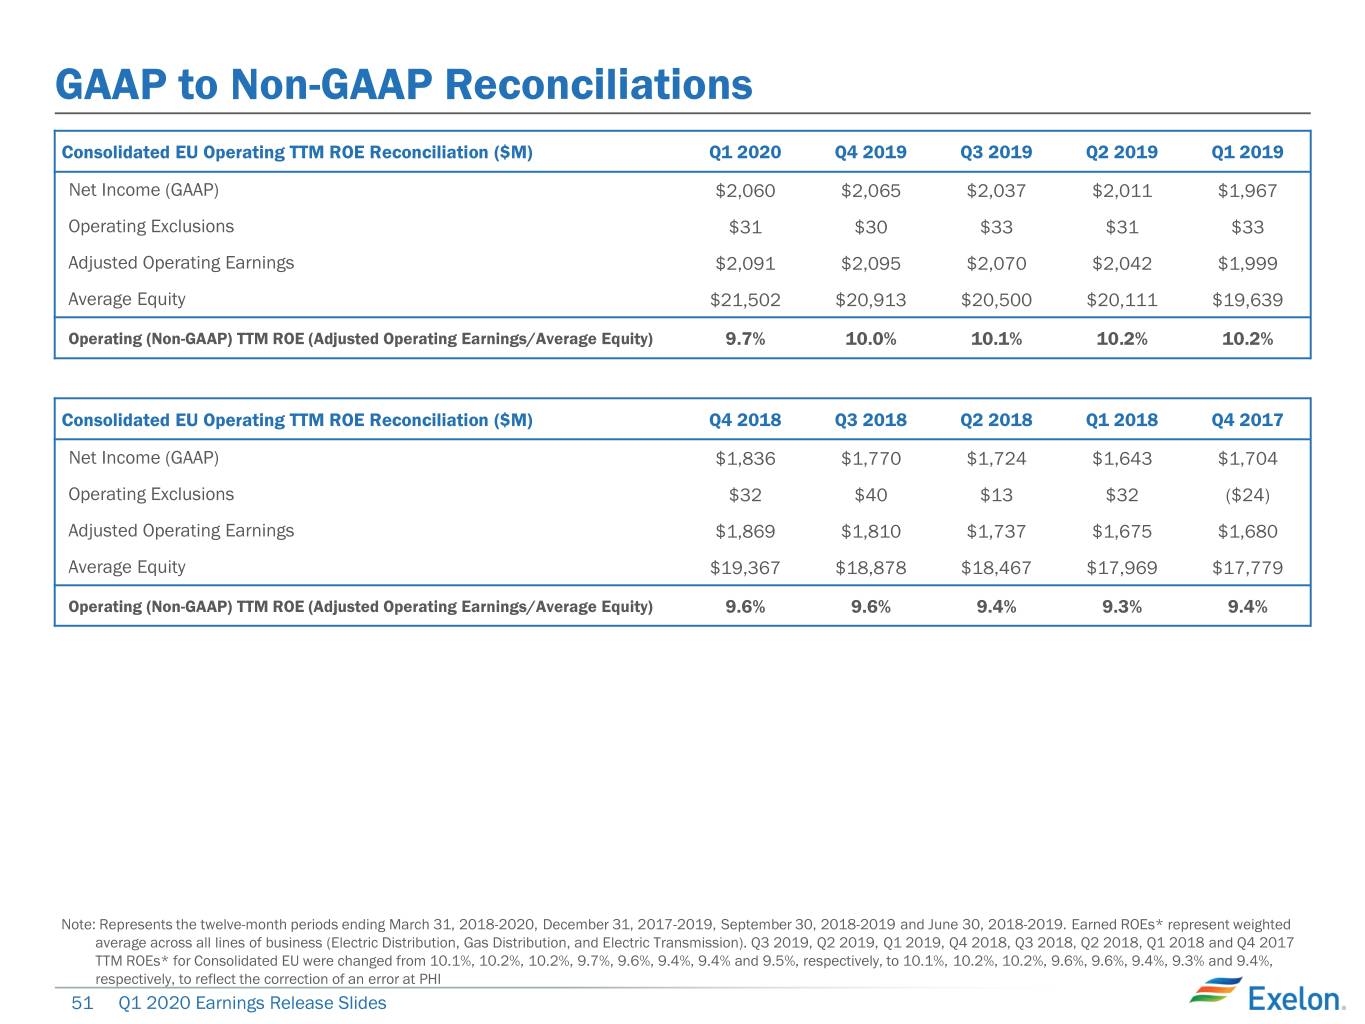
GAAP to Non-GAAP Reconciliations Consolidated EU Operating TTM ROE Reconciliation ($M) Q1 2020 Q4 2019 Q3 2019 Q2 2019 Q1 2019 Net Income (GAAP) $2,060 $2,065 $2,037 $2,011 $1,967 Operating Exclusions $31 $30 $33 $31 $33 Adjusted Operating Earnings $2,091 $2,095 $2,070 $2,042 $1,999 Average Equity $21,502 $20,913 $20,500 $20,111 $19,639 Operating (Non-GAAP) TTM ROE (Adjusted Operating Earnings/Average Equity) 9.7% 10.0% 10.1% 10.2% 10.2% Consolidated EU Operating TTM ROE Reconciliation ($M) Q4 2018 Q3 2018 Q2 2018 Q1 2018 Q4 2017 Net Income (GAAP) $1,836 $1,770 $1,724 $1,643 $1,704 Operating Exclusions $32 $40 $13 $32 ($24) Adjusted Operating Earnings $1,869 $1,810 $1,737 $1,675 $1,680 Average Equity $19,367 $18,878 $18,467 $17,969 $17,779 Operating (Non-GAAP) TTM ROE (Adjusted Operating Earnings/Average Equity) 9.6% 9.6% 9.4% 9.3% 9.4% Note: Represents the twelve-month periods ending March 31, 2018-2020, December 31, 2017-2019, September 30, 2018-2019 and June 30, 2018-2019. Earned ROEs* represent weighted average across all lines of business (Electric Distribution, Gas Distribution, and Electric Transmission). Q3 2019, Q2 2019, Q1 2019, Q4 2018, Q3 2018, Q2 2018, Q1 2018 and Q4 2017 TTM ROEs* for Consolidated EU were changed from 10.1%, 10.2%, 10.2%, 9.7%, 9.6%, 9.4%, 9.4% and 9.5%, respectively, to 10.1%, 10.2%, 10.2%, 9.6%, 9.6%, 9.4%, 9.3% and 9.4%, respectively, to reflect the correction of an error at PHI 51 Q1 2020 Earnings Release Slides
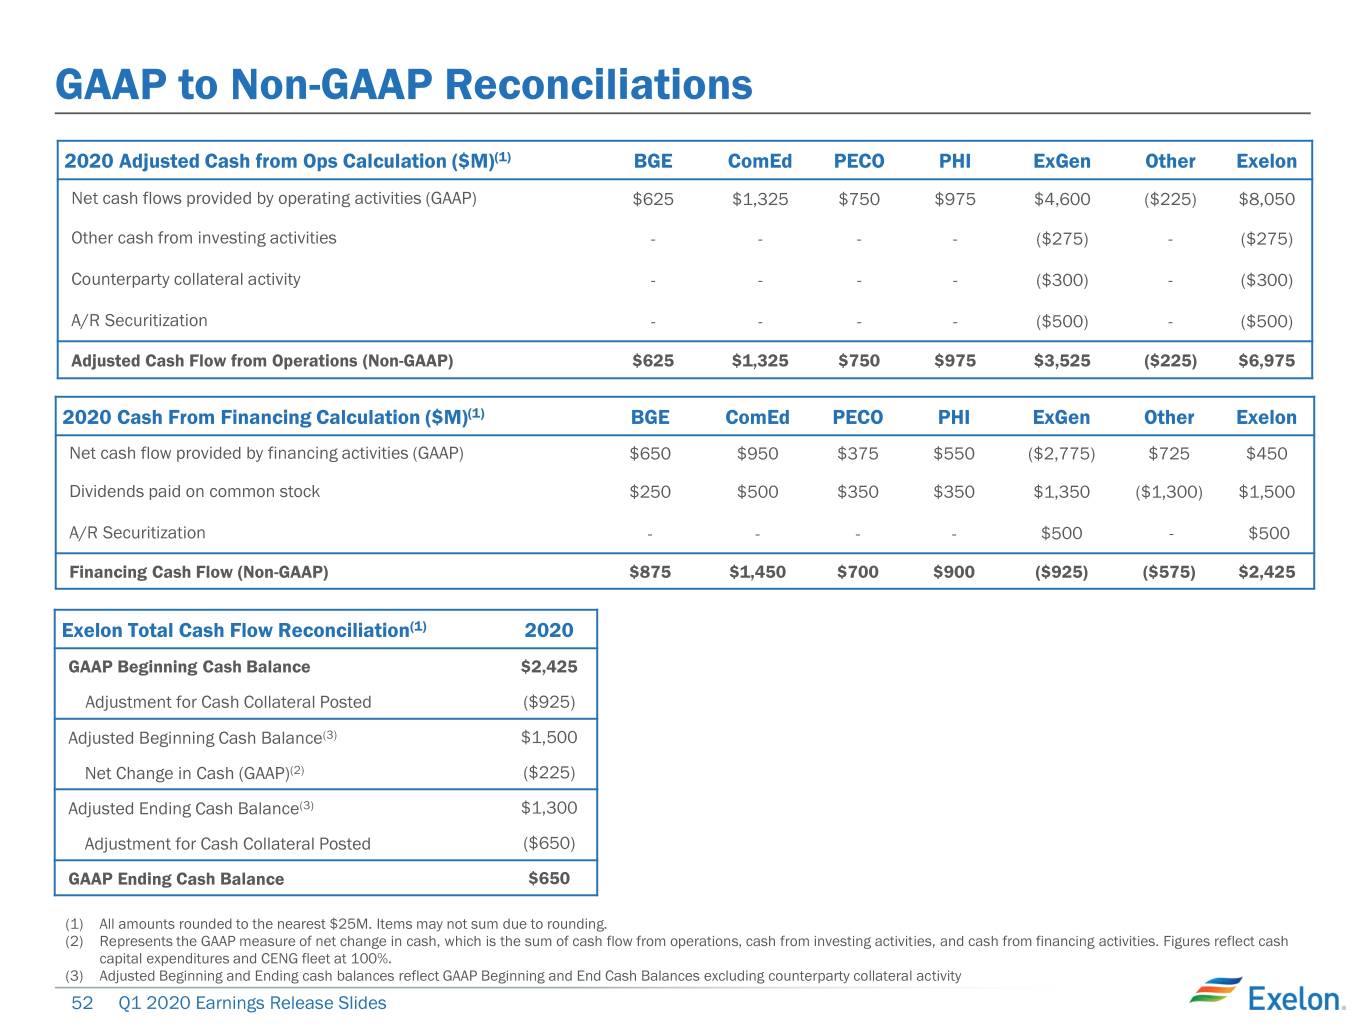
GAAP to Non-GAAP Reconciliations 2020 Adjusted Cash from Ops Calculation ($M)(1) BGE ComEd PECO PHI ExGen Other Exelon Net cash flows provided by operating activities (GAAP) $625 $1,325 $750 $975 $4,600 ($225) $8,050 Other cash from investing activities - - - - ($275) - ($275) Counterparty collateral activity - - - - ($300) - ($300) A/R Securitization - - - - ($500) - ($500) Adjusted Cash Flow from Operations (Non-GAAP) $625 $1,325 $750 $975 $3,525 ($225) $6,975 2020 Cash From Financing Calculation ($M)(1) BGE ComEd PECO PHI ExGen Other Exelon Net cash flow provided by financing activities (GAAP) $650 $950 $375 $550 ($2,775) $725 $450 Dividends paid on common stock $250 $500 $350 $350 $1,350 ($1,300) $1,500 A/R Securitization - - - - $500 - $500 Financing Cash Flow (Non-GAAP) $875 $1,450 $700 $900 ($925) ($575) $2,425 Exelon Total Cash Flow Reconciliation(1) 2020 GAAP Beginning Cash Balance $2,425 Adjustment for Cash Collateral Posted ($925) Adjusted Beginning Cash Balance(3) $1,500 Net Change in Cash (GAAP)(2) ($225) Adjusted Ending Cash Balance(3) $1,300 Adjustment for Cash Collateral Posted ($650) GAAP Ending Cash Balance $650 (1) All amounts rounded to the nearest $25M. Items may not sum due to rounding. (2) Represents the GAAP measure of net change in cash, which is the sum of cash flow from operations, cash from investing activities, and cash from financing activities. Figures reflect cash capital expenditures and CENG fleet at 100%. (3) Adjusted Beginning and Ending cash balances reflect GAAP Beginning and End Cash Balances excluding counterparty collateral activity 52 Q1 2020 Earnings Release Slides
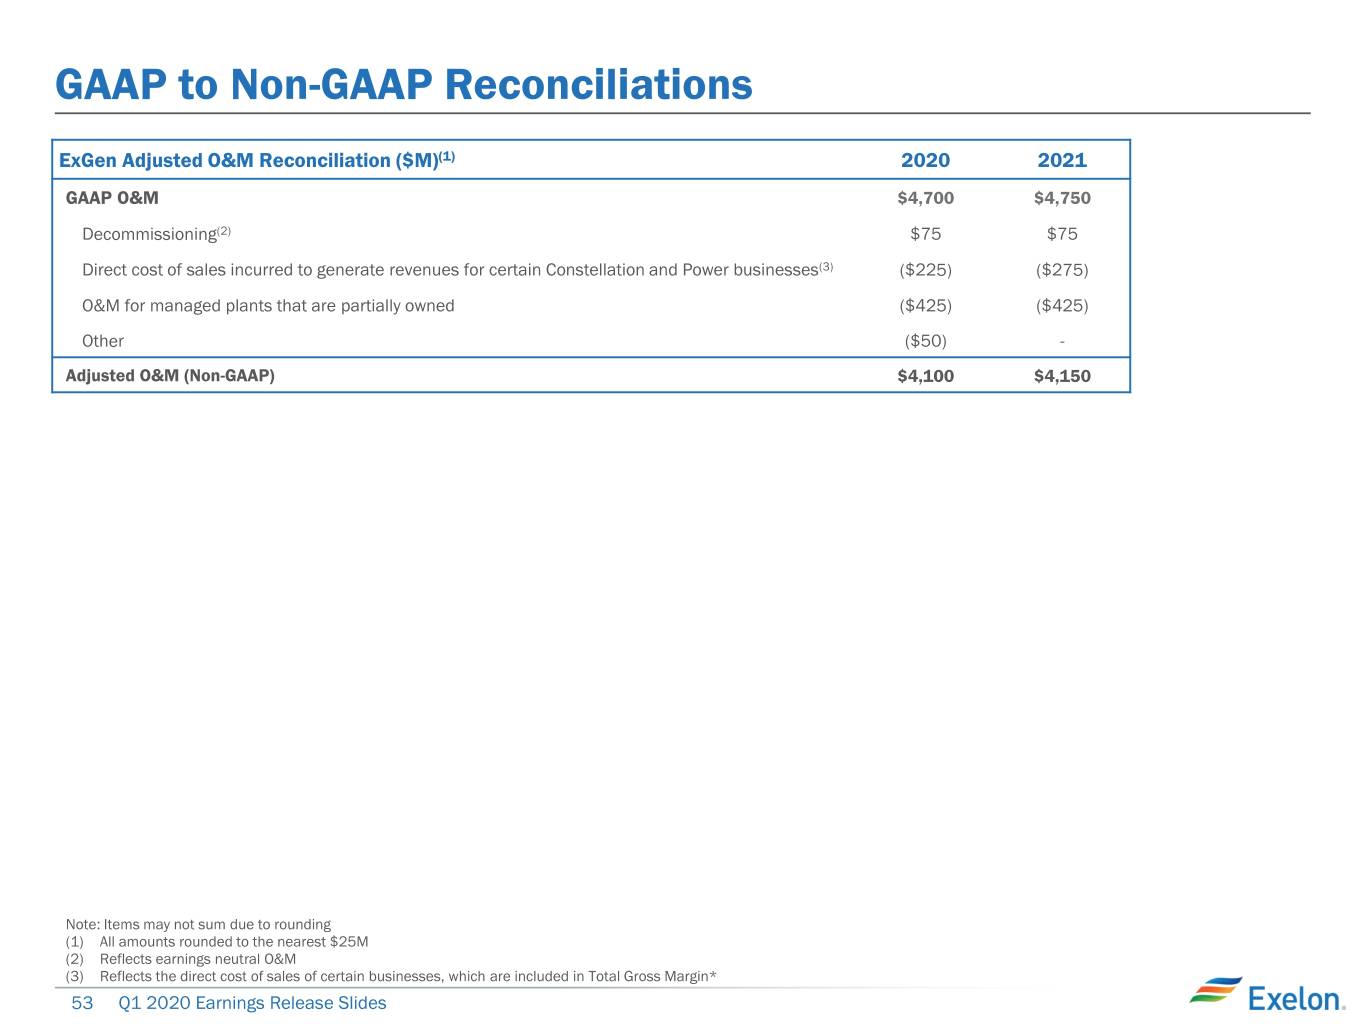
GAAP to Non-GAAP Reconciliations ExGen Adjusted O&M Reconciliation ($M)(1) 2020 2021 GAAP O&M $4,700 $4,750 Decommissioning(2) $75 $75 Direct cost of sales incurred to generate revenues for certain Constellation and Power businesses(3) ($225) ($275) O&M for managed plants that are partially owned ($425) ($425) Other ($50) - Adjusted O&M (Non-GAAP) $4,100 $4,150 Note: Items may not sum due to rounding (1) All amounts rounded to the nearest $25M (2) Reflects earnings neutral O&M (3) Reflects the direct cost of sales of certain businesses, which are included in Total Gross Margin* 53 Q1 2020 Earnings Release Slides