
FNKO 8-K
Funko, Inc. (FNKO)
8-K
2026-08-06
For: 2026-08-06
View Original
Added on
August 06, 2026
UNITED STATES
SECURITIES AND EXCHANGE COMMISSION
WASHINGTON, D.C. 20549
FORM 8-K
CURRENT REPORT
Pursuant to Section 13 or 15(d) of the Securities Exchange Act of 1934
Date of Report (Date of earliest event reported)
(Exact Name of Registrant as Specified in its Charter)
| (State or Other Jurisdiction of Incorporation) | (Commission File Number) | (IRS Employer Identification No.) | ||||||||||||
(Address of Principal Executive Offices) (Zip Code)
(425 ) 783-3616
(Registrant’s telephone number, including area code)
(Former Name or Former Address, if Changed Since Last Report)
Check the appropriate box below if the Form 8-K filing is intended to simultaneously satisfy the filing obligation of the registrant under any of the following provisions (see General Instruction A.2. below):
Securities registered pursuant to Section 12(b) of the Act:
| Title of each class | Trading Symbol(s) | Name of each exchange on which registered | ||||||
Class A Common Stock, $0.0001 par value per share | ||||||||
Indicate by check mark whether the registrant is an emerging growth company as defined in Rule 405 of the Securities Act of 1933 (§230.405 of this chapter) or Rule 12b-2 of the Securities Exchange Act of 1934 (§240.12b-2 of this chapter).
Emerging growth company ☐
If an emerging growth company, indicate by check mark if the registrant has elected not to use the extended transition period for complying with any new or revised financial accounting standards provided pursuant to Section 13(a) of the Exchange Act. ☐
Item 2.02. Results of Operations and Financial Condition.
On August 6, 2026, Funko, Inc. (the “Company”) announced its financial results for the three and six months ended June 30, 2026. The full text of the press release (the “Press Release”) issued in connection with the announcement is furnished as Exhibit 99.1 to this report and is incorporated herein by reference. The information contained in the website cited in the Press Release is not incorporated herein.
Item 7.01. Regulation FD Disclosure.
The Company intends to participate in upcoming meetings with investors. The presentation materials for such meetings are furnished as Exhibit 99.2 of this report.
The information in Item 2.02 and 7.01 of this report (including Exhibit 99.1) shall not be deemed “filed” for purposes of Section 18 of the Securities Exchange Act of 1934, as amended (the “Exchange Act”), or otherwise subject to the liabilities of that section, nor shall it be deemed incorporated by reference in any filing under the Securities Act of 1933, as amended, or the Exchange Act, except as expressly set forth by specific reference in such a filing.
Item 9.01. Financial Statements and Exhibits.
(d) Exhibits:
| Exhibit No. | Description | |||||||
| 99.1 | ||||||||
| 99.2 | ||||||||
| 104 | Cover Page Interactive Data File (embedded within the Inline XBRL document) | |||||||
SIGNATURE
Pursuant to the requirements of the Securities Exchange Act of 1934, the Registrant has duly caused this report to be signed on its behalf by the undersigned hereunto duly authorized.
Date: August 6, 2026 | FUNKO, INC. | |||||||
| By: | /s/ Yves Le Pendeven | |||||||
| Yves Le Pendeven | ||||||||
| Chief Financial Officer | ||||||||

Funko Reports Strong Second Quarter 2026 Financial Results;
Reiterates Full-Year Net Sales Outlook and Raises Adjusted EBITDA Guidance
--Q2 Net Sales Grew 7%; Core Collectibles Sales Increased 9%; Record Gross Margin;
Adjusted EBITDA Well Above Expectation; Debt Reduced by $15M --
EVERETT, Wash. August 6, 2026 -- Funko, Inc. (Nasdaq: FNKO), a leading pop culture lifestyle brand, today reported its consolidated financial results for the second quarter ended June 30, 2026.
Second Quarter Financial Results Summary: 2026 vs 2025
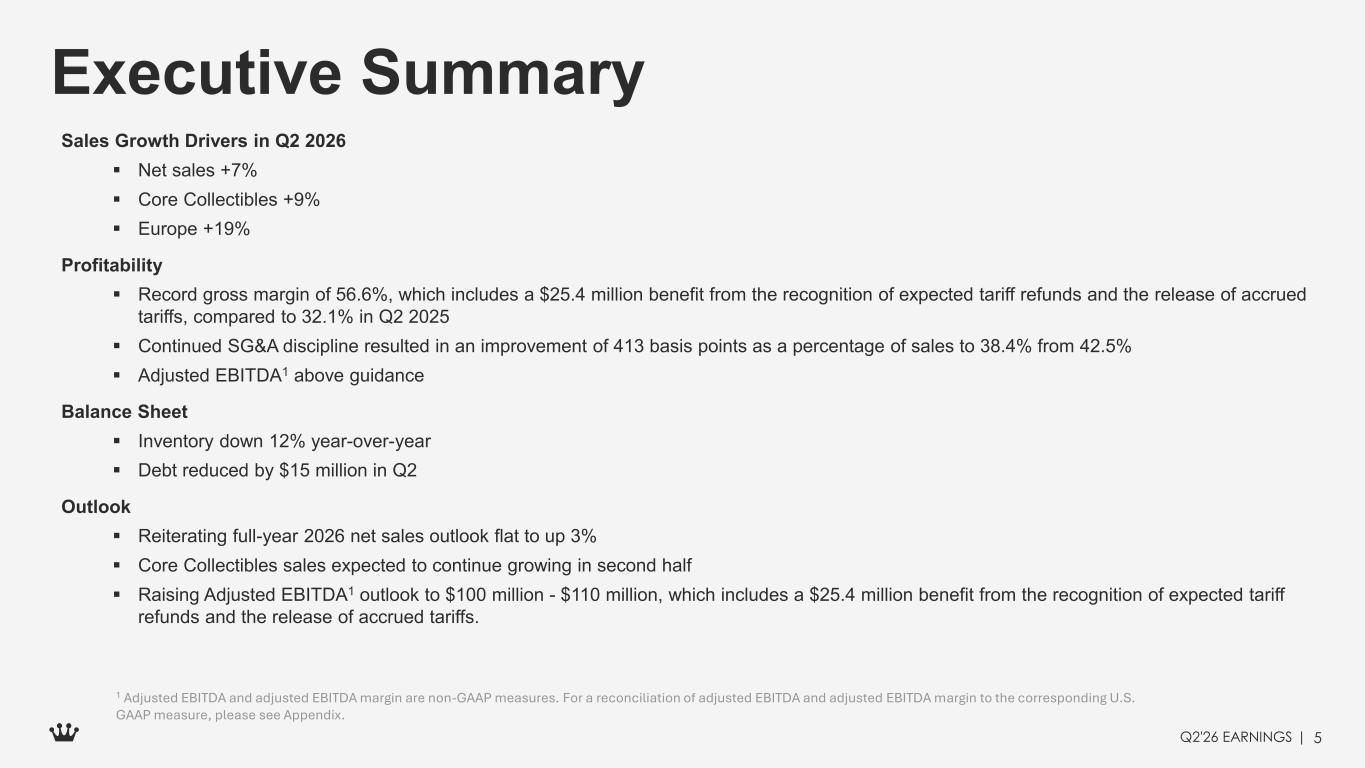
•Net sales increased 7% to $207.7 million, compared with $193.5 million
•Gross profit was $117.6 million, equal to gross margin of 56.6%, compared with $62.0 million, equal to gross margin of 32.1%
•SG&A expenses were $79.7 million compared with $82.3 million, and improved 413 basis points as a percentage of sales to 38.4% from 42.5%
•Net income was $15.4 million, or $0.27 per diluted share, compared with a net loss of $40.5 million, or $0.74 per diluted share
•Adjusted net income* was $15.0 million, or $0.26 per diluted share*, compared with an adjusted net loss* of $26.7 million, or $0.48 per diluted share*
•Adjusted EBITDA* was $40.9 million, compared with negative Adjusted EBITDA* of $16.5 million
•Gross margin, net income, adjusted net income* and adjusted EBITDA* for the second quarter of 2026 each included a pre-tax benefit of $25.4 million related to the recognition of expected tariff refunds and the release of accrued tariffs
“Q2 was a strong quarter for Funko. We delivered 7% sales growth, above the high end of our guidance range. Core Collectibles grew 9%, and gross margin reached a record high for the second consecutive quarter. Together with continued SG&A discipline, that performance drove adjusted EBITDA well above our guidance range.
These results are evidence that Make Culture Pop! is becoming a more deliberate and disciplined growth engine. We are getting better at identifying where fan demand is forming, moving faster to turn those signals into distinctive and repeatable products, and scaling them through the channels with the strongest economics. That progress showed up in broad-based POS momentum across theatrical, anime, gaming and sports, as well as rapid-response releases around live cultural moments and the launch of POP! Mystery.
At the same time, we are improving the quality of the business through tighter assortments, better SKU productivity, continued cost discipline, and concentrating our resources behind the products, fandoms and channels with the greatest demand and return potential.”
Second Quarter 2026 Net Sales by Category and Geography
The tables below show the breakdown of net sales on a brand category and geographical basis (in thousands):
| Three Months Ended June 30, | Period Over Period Change | ||||||||||||||||||||||
| 2026 | 2025 | Dollar | Percentage | ||||||||||||||||||||
| Net sales by brand category: | |||||||||||||||||||||||
| Core Collectibles | $ | 171,641 | $ | 157,477 | $ | 14,164 | 9.0 | % | |||||||||||||||
| Loungefly | 31,302 | 31,847 | (545) | (1.7) | % | ||||||||||||||||||
| Other | 4,776 | 4,145 | 631 | 15.2 | % | ||||||||||||||||||
| Total net sales | $ | 207,719 | $ | 193,469 | $ | 14,250 | 7.4 | % | |||||||||||||||
| Three Months Ended June 30, | Period Over Period Change | ||||||||||||||||||||||
| 2026 | 2025 | Dollar | Percentage | ||||||||||||||||||||
| Net sales by geography: | |||||||||||||||||||||||
| United States | $ | 121,845 | $ | 117,874 | $ | 3,971 | 3.4 | % | |||||||||||||||
| Europe | 68,976 | 57,784 | 11,192 | 19.4 | % | ||||||||||||||||||
| Other International | 16,898 | 17,811 | (913) | (5.1) | % | ||||||||||||||||||
| Total net sales | $ | 207,719 | $ | 193,469 | $ | 14,250 | 7.4 | % | |||||||||||||||
Balance Sheet Highlights - At June 30, 2026 vs December 31, 2025
•Total cash and cash equivalents were $40.7 million at June 30, 2026 compared with $42.1 million at December 31, 2025
•Inventories were $88.8 million at June 30, 2026 up from $83.1 million at December 31, 2025
•Total debt was $201.1 million at June 30, 2026 versus $225.3 million at December 31, 2025. Total debt includes the amount outstanding under the company's term loan facility, net of unamortized discounts, revolving line of credit and the company's equipment finance loan.
•In Q2, the company executed a participation sale of $22.1 million in tariff claims for $19.2 million. Half of the proceeds from the sale were used to pay down the company’s term loan.
Outlook for 2026
The company updated its 2026 full-year outlook to reflect its strong second quarter performance, expected continued growth in Core Collectibles, and its decision to rationalize Loungefly’s SKU count and concentrate the assortment behind products with stronger demand and return potential. The company also provided 2026 third-quarter guidance.
| Current Outlook | |||||
| 2026 Full Year | |||||
| Net Sales | Reiterating net sales guidance of flat to up 3% | ||||
| Gross Margin % | Raising to 46%-47%, including the $25.4 million Q2 tariff-related benefit, up from 41%-43% | ||||
| Adjusted EBITDA* | Raising to $100M-$110M, including the $25.4 million Q2 tariff-related benefit, up from $70M-$80M | ||||
| 2026 Third Quarter | |||||
| Net sales | Approximately flat year-over-year | ||||
| Gross margin % | Approximately 43%-44% | ||||
| Adjusted EBITDA* | $25 million to $30 million | ||||
Webcast Conference Call
The company will host a webcast at 4:30 p.m. Eastern Time (1:30 p.m. Pacific Time) today, August 6, 2026, to further discuss its second quarter results and business update. A live webcast, presentation materials and a replay of the event will be available on the Investor Relations section on the company’s website at investor.funko.com, as well as the Funko YouTube Channel at youtube.com/@FunkoIR. The replay of the webcast will be available for one year.
Use of Non-GAAP Financial Measures
This release contains references to non-GAAP financial measures, including adjusted net income (loss), per share amounts, adjusted EBITDA, adjusted EBITDA margin and adjusted net income (loss) margin, which are financial measures that are not prepared in conformity with United States generally accepted accounting principles (U.S. GAAP). Management uses these measures internally for evaluating its operating performance, for planning purposes, including the preparation of our annual operating budget and financial projections, to assess incentive compensation for our employees, and to evaluate our capacity to expand our business. The company's management believes that the presentation of non-GAAP financial measures provides useful supplementary information regarding operational performance because it enhances an investor's overall understanding of the financial results for the company's core business. Additionally, it provides a basis for the comparison of the financial results for the company's core business between current, past and future periods as they remove the impact of items not directly resulting from our core operations. The company also believes that including adjusted EBITDA and the other non-GAAP financial measures presented in this release is appropriate to provide additional information to investors and help to compare against other companies in our industry. Non-GAAP financial measures have limitations as analytical tools and should be considered only as a supplement to, and not as a substitute for or as a superior measure to, financial measures prepared in accordance with U.S. GAAP. We caution investors that amounts presented in accordance with our definitions of adjusted net income (loss), including per share amounts, adjusted EBITDA and adjusted EBITDA margin may not be comparable to similar measures disclosed by our competitors, because not all companies and analysts calculate these measures in the same manner.
Detailed reconciliations of non-GAAP financial measures to the most directly comparable GAAP financial measures are included in the financial tables following this release. A reconciliation of adjusted EBITDA outlook to the corresponding GAAP measure on a forward-looking basis cannot be provided without unreasonable efforts, as we are unable to provide reconciling information with respect to certain items. However, for the third quarter of 2026 the company expects equity-based compensation of approximately $4 million, depreciation and amortization of approximately $15 million and interest expense of approximately $5 million. For the full year 2026, the company expects equity-based compensation of approximately $13 million, depreciation and amortization of approximately $60 million and interest expense of approximately $20 million, each of which is a reconciling item to net income. See “Use of Non-GAAP Financial Measures” and the attached reconciliations for more information.
About Funko
Headquartered in Everett, Washington, Funko is a leading pop culture and collectibles brand. Funko designs, sources and distributes licensed pop culture products across multiple categories, including vinyl figures, action toys, plush, apparel, housewares and accessories for consumers who seek tangible ways to connect with their favorite pop culture brands and characters. Learn more at Funko.com, Loungefly.com and MondoShop.com, and follow us on TikTok, X, and Instagram.
Forward-Looking Statements
This press release contains forward-looking statements within the meaning of the Private Securities Litigation Reform Act of 1995. All statements contained in this press release that do not relate to matters of historical fact should be considered forward-looking statements, including statements regarding our strategic plans, growth strategies, expectations in sales trends and anticipated financial results, including without limitation, our full year and third quarter 2026 guidance. These forward-looking statements are based on management’s current expectations. These statements are neither promises nor guarantees, but involve known and unknown risks, uncertainties and other important factors that may cause our actual results, performance or achievements to be materially different from any future results, performance or achievements expressed or implied by the forward-looking statements, including, but not limited to, the following: impacts from economic downturns; changes in the retail industry and markets for our consumer products; risks associated with our international operations, including risk related to tariffs and trade restrictions; risks relating to our indebtedness, including our ability to comply with financial and negative covenants under our Credit Agreement, as amended; our ability to execute our business strategy; our ability to manage our inventories and growth; our ability to identify or complete any strategic alternative transaction; our dependence on content development and creation by third parties; our ability to obtain, maintain and protect our intellectual property rights or those of our licensors; fluctuations in our gross margin and seasonal impacts; our dependence on vendors and outsourcers; risks relating to government regulation; risks relating to litigation, including products liability claims and securities class action litigation; risk resulting from our e-commerce business and social media presence; our ability to successfully operate our information systems and implement new technology; our ability to secure additional financing on favorable terms or at all; the influence of our significant stockholder, TCG, and the possibility that TCG’s interests may conflict with the interests of our other stockholders; risks relating to our organizational structure; including the Tax Receivable Agreement ("TRA") which confers certain benefits upon the parties to the TRA ("TRA Parties") that will not benefit Class A common stockholders to the same extent as it will benefit the TRA Parties; and volatility in the price of our Class A common stock. These and other important factors discussed under the caption “Risk Factors” in our quarterly report on Form 10-Q for the quarter ended June 30, 2026 and our other filings with the Securities and Exchange Commission could cause actual results to differ materially from those indicated by the forward-looking statements made in this press release. Any such forward-looking statements represent management’s estimates as of the date of this press release. While we may elect to update such forward-looking statements at some point in the future, we disclaim any obligation to do so, even if subsequent events cause our views to change. These forward-looking statements should not be relied upon as representing our views as of any date subsequent to the date of this press release.
Investor Relations:
Media:
Funko, Inc.
Condensed Consolidated Statements of Operations
(Unaudited)
| Three Months Ended June 30, | Six Months Ended June 30, | ||||||||||||||||||||||
| 2026 | 2025 | 2026 | 2025 | ||||||||||||||||||||
| (In thousands, except per share data) | |||||||||||||||||||||||
| Net sales | $ | 207,719 | $ | 193,469 | $ | 408,638 | $ | 384,208 | |||||||||||||||
| Cost of sales (exclusive of depreciation and amortization) | 90,090 | 131,429 | 202,182 | 245,297 | |||||||||||||||||||
| Selling, general, and administrative expenses | 79,723 | 82,259 | 163,410 | 167,066 | |||||||||||||||||||
| Depreciation and amortization | 15,767 | 14,528 | 30,541 | 29,790 | |||||||||||||||||||
| Total operating expenses | 185,580 | 228,216 | 396,133 | 442,153 | |||||||||||||||||||
| Income (loss) from operations | 22,139 | (34,747) | 12,505 | (57,945) | |||||||||||||||||||
| Interest expense, net | 5,198 | 4,522 | 10,082 | 8,371 | |||||||||||||||||||
| Other expense, net | 480 | 887 | 936 | 1,055 | |||||||||||||||||||
| Income (loss) before income taxes | 16,461 | (40,156) | 1,487 | (67,371) | |||||||||||||||||||
| Income tax expense | 1,016 | 848 | 4,169 | 1,692 | |||||||||||||||||||
| Net income (loss) | 15,445 | (41,004) | (2,682) | (69,063) | |||||||||||||||||||
Less: net income (loss) attributable to non-controlling interests | 61 | (514) | 9 | (985) | |||||||||||||||||||
| Net income (loss) attributable to Funko, Inc. | $ | 15,384 | $ | (40,490) | $ | (2,691) | $ | (68,078) | |||||||||||||||
| Income (loss) per share of Class A common stock: | |||||||||||||||||||||||
| Basic | $ | 0.28 | $ | (0.74) | $ | (0.05) | $ | (1.26) | |||||||||||||||
| Diluted | $ | 0.27 | $ | (0.74) | $ | (0.05) | $ | (1.26) | |||||||||||||||
| Weighted average shares of Class A common stock outstanding: | |||||||||||||||||||||||
| Basic | 55,860 | 54,362 | 55,644 | 53,948 | |||||||||||||||||||
| Diluted | 57,461 | 54,362 | 55,644 | 53,948 | |||||||||||||||||||
Funko, Inc.
Condensed Consolidated Balance Sheets
(Unaudited)
| June 30, 2026 | December 31, 2025 | ||||||||||
| (In thousands, except per share data) | |||||||||||
| Assets | |||||||||||
| Current assets: | |||||||||||
| Cash and cash equivalents | $ | 40,713 | $ | 42,148 | |||||||
| Accounts receivable, net | 93,561 | 117,018 | |||||||||
| Inventories | 88,800 | 83,136 | |||||||||
| Prepaid expenses and other current assets | 51,540 | 48,094 | |||||||||
| Total current assets | 274,614 | 290,396 | |||||||||
| Property and equipment, net | 64,498 | 68,679 | |||||||||
| Operating lease right-of-use assets, net | 41,671 | 46,928 | |||||||||
| Goodwill | 133,848 | 133,900 | |||||||||
| Intangible assets, net | 127,925 | 135,826 | |||||||||
| Other assets | 11,191 | 9,505 | |||||||||
| Total assets | $ | 653,747 | $ | 685,234 | |||||||
| Liabilities and Stockholders’ Equity | |||||||||||
| Current liabilities: | |||||||||||
| Revolving credit facility | $ | 1,500 | $ | 1,125 | |||||||
| Current portion of term debt | 16,939 | 21,932 | |||||||||
| Current portion of operating lease liabilities | 16,989 | 18,792 | |||||||||
| Accounts payable | 58,206 | 64,748 | |||||||||
| Accrued royalties | 54,712 | 59,821 | |||||||||
| Accrued expenses and other current liabilities | 87,583 | 77,499 | |||||||||
| Total current liabilities | 235,929 | 243,917 | |||||||||
| Long-term debt | 182,659 | 202,246 | |||||||||
| Operating lease liabilities | 43,273 | 48,680 | |||||||||
| Other long-term liabilities | 3,867 | 4,261 | |||||||||
| Commitments and Contingencies | |||||||||||
| Stockholders’ equity: | |||||||||||
Class A common stock, par value $0.0001 per share, 200,000 shares authorized; 55,989 and 55,327 shares issued and outstanding as of June 30, 2026 and December 31, 2025, respectively | 5 | 5 | |||||||||
Class B common stock, par value $0.0001 per share, 50,000 shares authorized; 91 and 91 shares issued and outstanding as of June 30, 2026 and December 31, 2025, respectively | — | — | |||||||||
| Additional paid-in-capital | 362,526 | 357,330 | |||||||||
| Accumulated other comprehensive income | 4,003 | 4,621 | |||||||||
| Accumulated deficit | (178,833) | (176,142) | |||||||||
| Total stockholders’ equity attributable to Funko, Inc. | 187,701 | 185,814 | |||||||||
| Non-controlling interests | 318 | 316 | |||||||||
| Total stockholders’ equity | 188,019 | 186,130 | |||||||||
| Total liabilities and stockholders’ equity | $ | 653,747 | $ | 685,234 | |||||||
Funko, Inc.
Condensed Consolidated Statements of Cash Flows
(Unaudited)
| Six Months Ended June 30, | |||||||||||
| 2026 | 2025 | ||||||||||
| (In thousands) | |||||||||||
| Operating Activities | |||||||||||
| Net loss | $ | (2,682) | $ | (69,063) | |||||||
| Adjustments to reconcile net loss to net cash provided by (used in) operating activities: | |||||||||||
| Depreciation and amortization | 30,541 | 29,790 | |||||||||
| Equity-based compensation | 5,196 | 6,377 | |||||||||
| Other, net | 1,133 | 1,301 | |||||||||
| Changes in operating assets and liabilities: | |||||||||||
| Accounts receivable, net | 23,318 | 24,572 | |||||||||
| Inventories | (6,160) | (5,761) | |||||||||
| Prepaid expenses and other assets | 2,499 | 5,529 | |||||||||
| Accounts payable | (5,992) | 3,207 | |||||||||
| Accrued royalties | (5,109) | (14,967) | |||||||||
| Accrued expenses and other liabilities | (19,114) | (25,427) | |||||||||
| Net cash provided by (used in) operating activities | 23,630 | (44,442) | |||||||||
| Investing Activities | |||||||||||
| Purchases of property and equipment | (18,954) | (16,211) | |||||||||
| Other, net | — | 970 | |||||||||
| Net cash used in investing activities | (18,954) | (15,241) | |||||||||
| Financing Activities | |||||||||||
| Borrowings on revolving credit facility | — | 85,000 | |||||||||
| Debt amendment costs | (3,648) | — | |||||||||
| Payments of term debt | (21,303) | (11,530) | |||||||||
| Proceeds from sale of tariff receivable | 19,248 | — | |||||||||
| Payments under tax receivable agreement | (249) | — | |||||||||
| Other, net | 179 | 193 | |||||||||
| Net cash (used in) provided by financing activities | (5,773) | 73,663 | |||||||||
| Effect of exchange rates on cash and cash equivalents | (338) | 516 | |||||||||
| Net change in cash and cash equivalents | (1,435) | 14,496 | |||||||||
| Cash and cash equivalents at beginning of period | 42,148 | 34,655 | |||||||||
| Cash and cash equivalents at end of period | $ | 40,713 | $ | 49,151 | |||||||
The following tables reconcile the Non-GAAP Financial Measures to the most directly comparable U.S. GAAP financial performance measure, which is net income (loss), for the periods presented:
| Three Months Ended June 30, | Six Months Ended June 30, | ||||||||||||||||||||||
| 2026 | 2025 | 2026 | 2025 | ||||||||||||||||||||
| (In thousands, except per share data) | |||||||||||||||||||||||
| Net income (loss) attributable to Funko, Inc. | $ | 15,384 | $ | (40,490) | $ | (2,691) | $ | (68,078) | |||||||||||||||
Reallocation of net income (loss) attributable to non-controlling interests from the assumed exchange of common units of FAH, LLC for Class A common stock (1) | 61 | (514) | 9 | (985) | |||||||||||||||||||
Equity-based compensation (2) | 2,782 | 3,112 | 5,196 | 6,377 | |||||||||||||||||||
Foreign currency transaction loss (3) | 588 | 1,463 | 1,104 | 1,639 | |||||||||||||||||||
Tax receivable agreement liability adjustments (4) | — | — | 112 | — | |||||||||||||||||||
Third-party debt amendment fees (5) | 106 | — | 3,655 | — | |||||||||||||||||||
Income tax (benefit) expense (6) | (3,968) | 9,743 | 1,280 | 16,531 | |||||||||||||||||||
| Adjusted net income (loss) | $ | 14,953 | $ | (26,686) | $ | 8,665 | $ | (44,516) | |||||||||||||||
Adjusted net income (loss) margin (7) | 7.2 | % | (13.8) | % | 2.1 | % | (11.6) | % | |||||||||||||||
| Weighted-average shares of Class A common stock outstanding - basic | 55,860 | 54,362 | 55,644 | 53,948 | |||||||||||||||||||
| Equity-based compensation awards and common units of FAH, LLC that are convertible into Class A common stock | 1,601 | 749 | 187 | 907 | |||||||||||||||||||
| Adjusted weighted-average shares of Class A stock outstanding - diluted | 57,461 | 55,111 | 55,831 | 54,855 | |||||||||||||||||||
| Adjusted earnings (loss) per diluted share | $ | 0.26 | $ | (0.48) | $ | 0.16 | $ | (0.81) | |||||||||||||||
| Three Months Ended June 30, | Six Months Ended June 30, | ||||||||||||||||||||||
| 2026 | 2025 | 2026 | 2025 | ||||||||||||||||||||
| (amounts in thousands) | |||||||||||||||||||||||
| Net income (loss) | $ | 15,445 | $ | (41,004) | $ | (2,682) | $ | (69,063) | |||||||||||||||
| Interest expense, net | 5,198 | 4,522 | 10,082 | 8,371 | |||||||||||||||||||
| Income tax expense | 1,016 | 848 | 4,169 | 1,692 | |||||||||||||||||||
| Depreciation and amortization | 15,767 | 14,528 | 30,541 | 29,790 | |||||||||||||||||||
| EBITDA | $ | 37,426 | $ | (21,106) | $ | 42,110 | $ | (29,210) | |||||||||||||||
| Adjustments: | |||||||||||||||||||||||
Equity-based compensation (2) | 2,782 | 3,112 | 5,196 | 6,377 | |||||||||||||||||||
Foreign currency transaction loss (3) | 588 | 1,463 | 1,104 | 1,639 | |||||||||||||||||||
Tax receivable agreement liability adjustments (4) | — | — | 112 | — | |||||||||||||||||||
Third-party debt amendment fees (5) | 106 | — | 3,655 | — | |||||||||||||||||||
| Adjusted EBITDA | $ | 40,902 | $ | (16,531) | $ | 52,177 | $ | (21,194) | |||||||||||||||
Adjusted EBITDA margin (8) | 19.7 | % | (8.5) | % | 12.8 | % | (5.5) | % | |||||||||||||||
| (1) | Represents the reallocation of net income attributable to non-controlling interests from the assumed exchange of common units of FAH, LLC for Class A common stock in periods in which income was attributable to non-controlling interests. | ||||
| (2) | Represents non-cash charges related to equity-based compensation programs, which vary from period to period depending on the timing of awards. | ||||
| (3) | Represents both unrealized and realized foreign currency losses on transactions denominated other than in U.S. dollars, including derivative gains and losses on foreign currency forward exchange contracts. | ||||
| (4) | Represents recognized adjustments to the tax receivable agreement liability. | ||||
| (5) | Represents non-recurring third-party debt fees paid as part of the Fifth Amendment to the Credit Agreement. | ||||
| (6) | Represents the income tax expense effect of the above adjustments, including adding back the valuation allowance to the net loss. This adjustment uses an effective tax rate of 25% for all periods presented. | ||||
| (7) | Adjusted net income (loss) margin is calculated as adjusted net income (loss) as a percentage of net sales. | ||||
| (8) | Adjusted EBITDA margin is calculated as adjusted EBITDA as a percentage of net sales. | ||||
Q2 2026 EARNINGS August 6, 2026
Q2'26 EARNINGS | Presentation Disclosures This presentation contains forward-looking statements within the meaning of the Private Securities Litigation Reform Act of 1995. Any statements contained in this presentation that do not relate to matters of historical fact should be considered forward-looking statements, including statements regarding our strategic plans and partnerships, expansion in Asia, launch of new product lines, expected sales trends, effects of tariffs and anticipated financial results, including without limitation, our full year and third quarter 2026 guidance. These forward-looking statements are based on management’s current expectations. These statements are neither promises nor guarantees, but involve known and unknown risks, uncertainties and other important factors that may cause our actual results, performance or achievements to be materially different from any future results, performance or achievements expressed or implied by the forward-looking statements, including, but not limited to, the following: impacts from economic downturns; changes in the retail industry and markets for our consumer products; risks associated with our international operations, including risk related to tariffs and trade restrictions; risks relating to our indebtedness, including our ability to comply with financial and negative covenants under our Credit Agreement, as amended; our ability to execute our business strategy; our ability to manage our inventories and growth; our ability to identify or complete any strategic alternative transaction; our dependence on content development and creation by third parties; our ability to obtain, maintain and protect our intellectual property rights or those of our licensors; fluctuations in our gross margin and seasonal impacts; our dependence on vendors and outsourcers; risks relating to government regulation; risks relating to litigation, including products liability claims and securities class action litigation; risk resulting from our e-commerce business and social media presence; our ability to successfully operate our information systems and implement new technology; our ability to secure additional financing on favorable terms or at all; the influence of our significant stockholder, TCG, and the possibility that TCG’s interests may conflict with the interests of our other stockholders; risks relating to our organizational structure; including the Tax Receivable Agreement ("TRA") which confers certain benefits upon the parties to the TRA ("TRA Parties") that will not benefit Class A common stockholders to the same extent as it will benefit the TRA Parties; and volatility in the price of our Class A common stock. These and other important factors discussed under the caption “Risk Factors” in our quarterly report on Form 10-Q for the quarter ended June 30, 2026 and our other filings with the Securities and Exchange Commission could cause actual results to differ materially from those indicated by the forward-looking statements made in this presentation. Any such forward-looking statements represent management’s estimates as of the date of this presentation. While we may elect to update such forward-looking statements at some point in the future, we disclaim any obligation to do so, even if subsequent events cause our views to change. These forward- looking statements should not be relied upon as representing our views as of any date subsequent to the date of this presentation. 2
Q2'26 EARNINGS | Table of Contents 3 Executive Summary Financial Summary Strategic Progress Appendix 4 6 11 21 POP! Premium Godzilla (Heat Ray)

Q2'26 EARNINGS | Executive Summary 2’26 EARNINGS | 44
Q2'26 EARNINGS | Executive Summary Sales Growth Drivers in Q2 2026 ▪ Net sales +7% ▪ Core Collectibles +9% ▪ Europe +19% Profitability ▪ Record gross margin of 56.6%, which includes a $25.4 million benefit from the recognition of expected tariff refunds and the release of accrued tariffs, compared to 32.1% in Q2 2025 ▪ Continued SG&A discipline resulted in an improvement of 413 basis points as a percentage of sales to 38.4% from 42.5% ▪ Adjusted EBITDA1 above guidance Balance Sheet ▪ Inventory down 12% year-over-year ▪ Debt reduced by $15 million in Q2 Outlook ▪ Reiterating full-year 2026 net sales outlook flat to up 3% ▪ Core Collectibles sales expected to continue growing in second half ▪ Raising Adjusted EBITDA1 outlook to $100 million - $110 million, which includes a $25.4 million benefit from the recognition of expected tariff refunds and the release of accrued tariffs. 5 1 Adjusted EBITDA and adjusted EBITDA margin are non-GAAP measures. For a reconciliation of adjusted EBITDA and adjusted EBITDA margin to the corresponding U.S. GAAP measure, please see Appendix.

Q4 EARNINGS | 2025 Financial Summary Q2’26 EARNINGS | 6 A Goofy Movie - Powerline, Max, & Goofy Figure Set
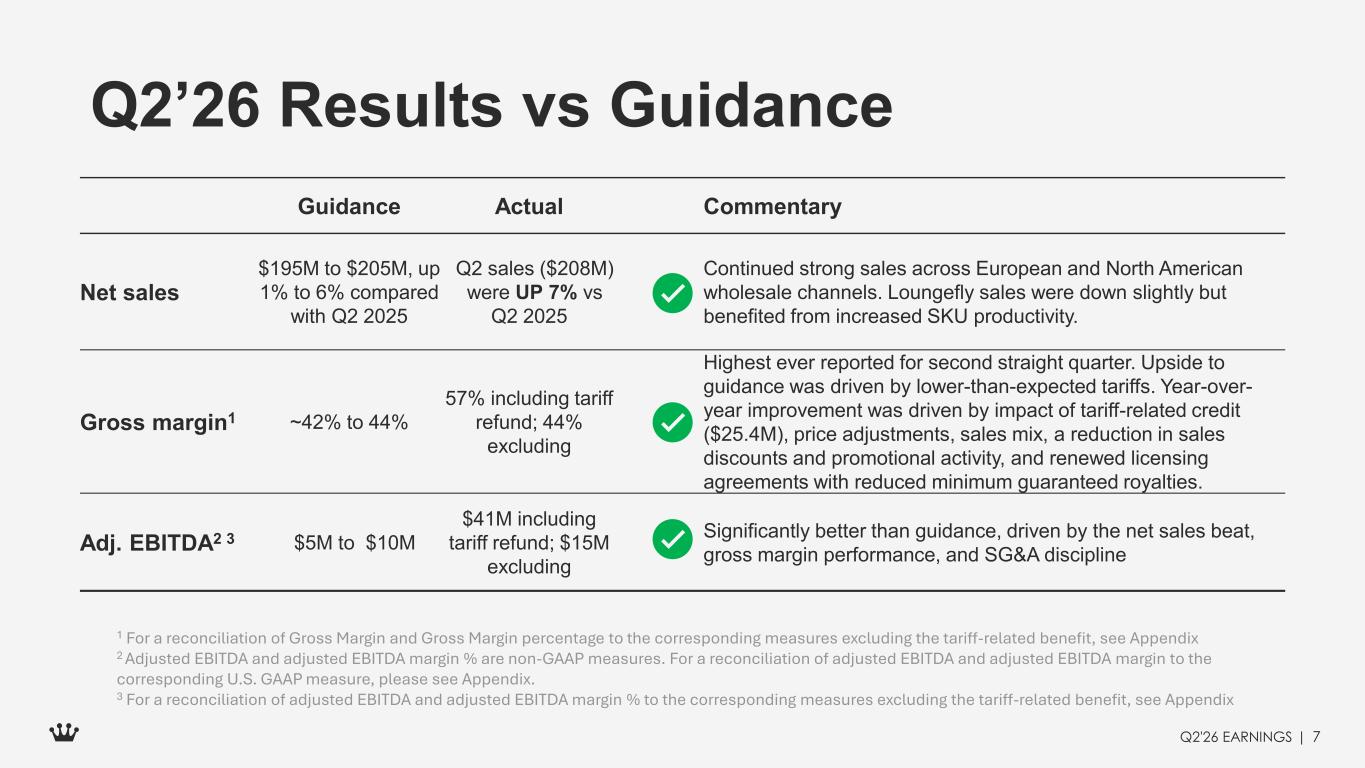
Q2'26 EARNINGS | Q2’26 Results vs Guidance 7 Guidance Actual Commentary Net sales $195M to $205M, up 1% to 6% compared with Q2 2025 Q2 sales ($208M) were UP 7% vs Q2 2025 Continued strong sales across European and North American wholesale channels. Loungefly sales were down slightly but benefited from increased SKU productivity. Gross margin1 ~42% to 44% 57% including tariff refund; 44% excluding Highest ever reported for second straight quarter. Upside to guidance was driven by lower-than-expected tariffs. Year-over- year improvement was driven by impact of tariff-related credit ($25.4M), price adjustments, sales mix, a reduction in sales discounts and promotional activity, and renewed licensing agreements with reduced minimum guaranteed royalties. Adj. EBITDA2 3 $5M to $10M $41M including tariff refund; $15M excluding Significantly better than guidance, driven by the net sales beat, gross margin performance, and SG&A discipline 1 For a reconciliation of Gross Margin and Gross Margin percentage to the corresponding measures excluding the tariff-related benefit, see Appendix 2 Adjusted EBITDA and adjusted EBITDA margin % are non-GAAP measures. For a reconciliation of adjusted EBITDA and adjusted EBITDA margin to the corresponding U.S. GAAP measure, please see Appendix. 3 For a reconciliation of adjusted EBITDA and adjusted EBITDA margin % to the corresponding measures excluding the tariff-related benefit, see Appendix
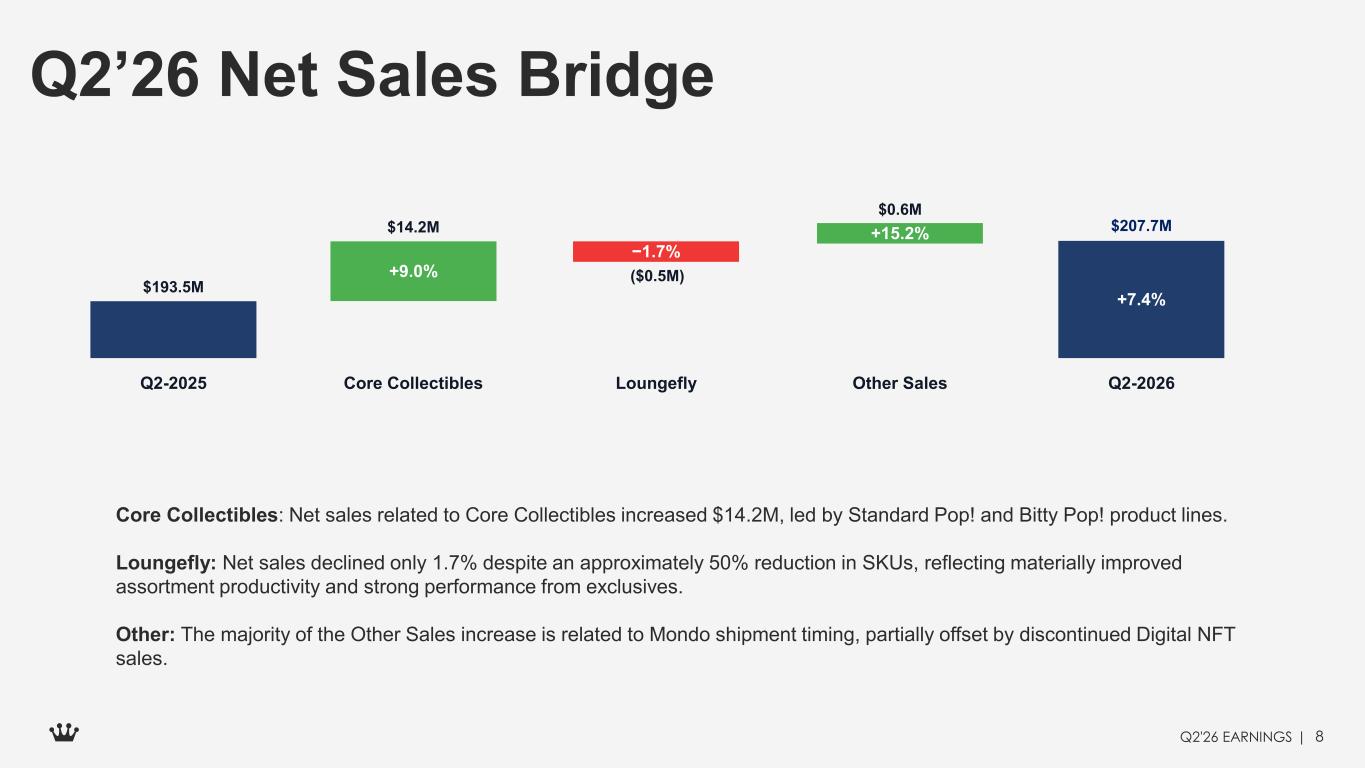
Q2'26 EARNINGS | Q2’26 Net Sales Bridge 8 Core Collectibles: Net sales related to Core Collectibles increased $14.2M, led by Standard Pop! and Bitty Pop! product lines. Loungefly: Net sales declined only 1.7% despite an approximately 50% reduction in SKUs, reflecting materially improved assortment productivity and strong performance from exclusives. Other: The majority of the Other Sales increase is related to Mondo shipment timing, partially offset by discontinued Digital NFT sales. +9.0% −1.7% +15.2% +7.4% $193.5M $207.7M$14.2M ($0.5M) $0.6M Q2-2025 Core Collectibles Loungefly Other Sales Q2-2026
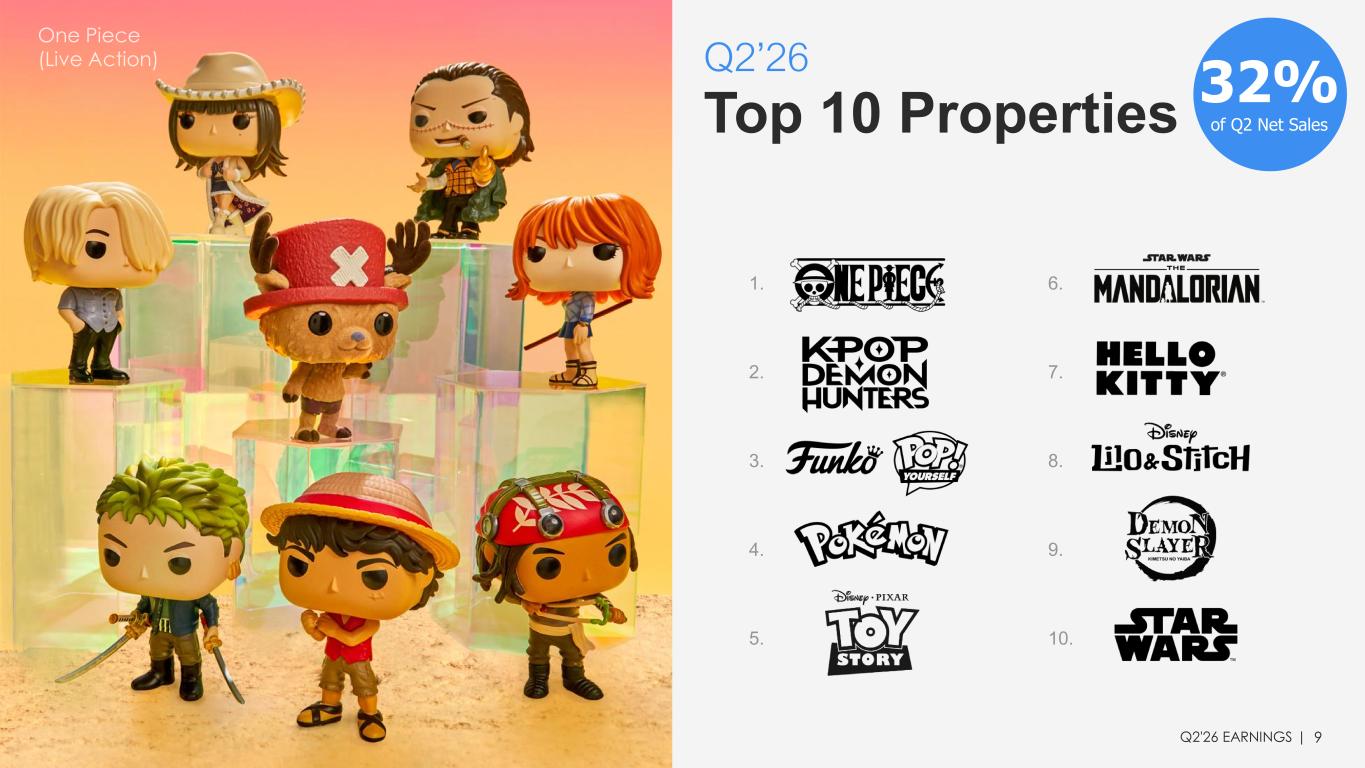
Q2'26 EARNINGS | Q2’26 Top 10 Properties 9 32% of Q2 Net Sales 1. 2. 3. 4. 5. 6. 7. 8. 9. 10.
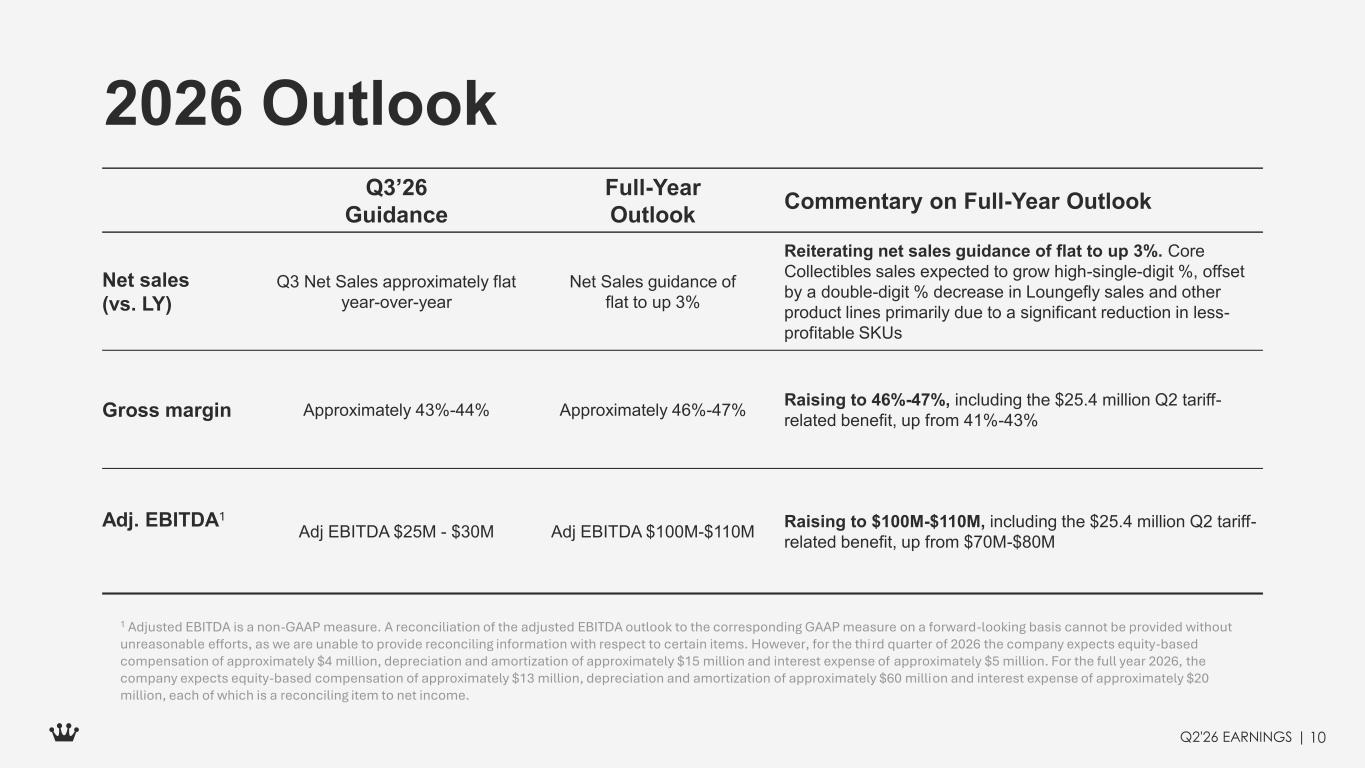
Q2'26 EARNINGS | 2026 Outlook 10 Q3’26 Guidance Full-Year Outlook Commentary on Full-Year Outlook Net sales (vs. LY) Q3 Net Sales approximately flat year-over-year Net Sales guidance of flat to up 3% Reiterating net sales guidance of flat to up 3%. Core Collectibles sales expected to grow high-single-digit %, offset by a double-digit % decrease in Loungefly sales and other product lines primarily due to a significant reduction in less- profitable SKUs Gross margin Approximately 43%-44% Approximately 46%-47% Raising to 46%-47%, including the $25.4 million Q2 tariff- related benefit, up from 41%-43% Adj. EBITDA1 Adj EBITDA $25M - $30M Adj EBITDA $100M-$110M Raising to $100M-$110M, including the $25.4 million Q2 tariff- related benefit, up from $70M-$80M 1 Adjusted EBITDA is a non-GAAP measure. A reconciliation of the adjusted EBITDA outlook to the corresponding GAAP measure on a forward-looking basis cannot be provided without unreasonable efforts, as we are unable to provide reconciling information with respect to certain items. However, for the third quarter of 2026 the company expects equity-based compensation of approximately $4 million, depreciation and amortization of approximately $15 million and interest expense of approximately $5 million. For the full year 2026, the company expects equity-based compensation of approximately $13 million, depreciation and amortization of approximately $60 million and interest expense of approximately $20 million, each of which is a reconciling item to net income.
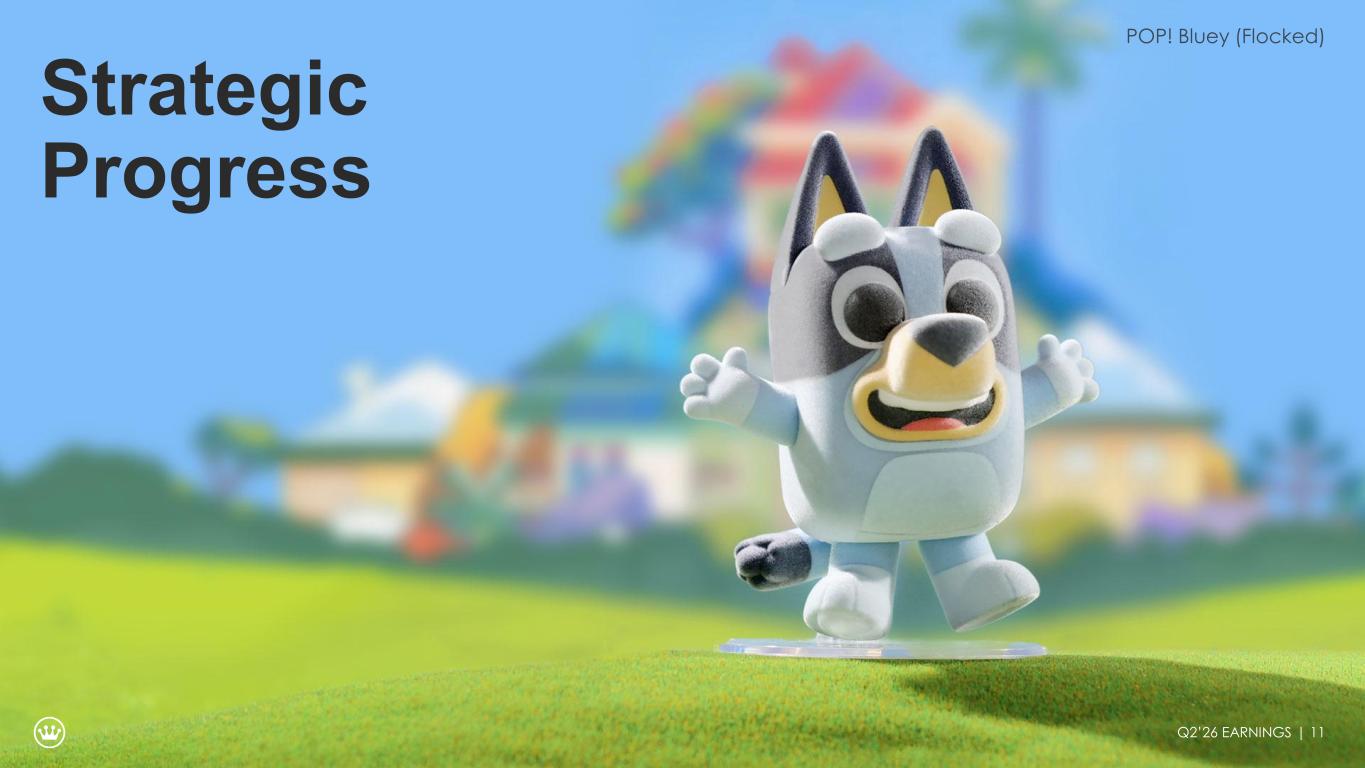
Q4 EARNINGS | 2025 Strategic Progress Q2’26 EARNINGS | 11
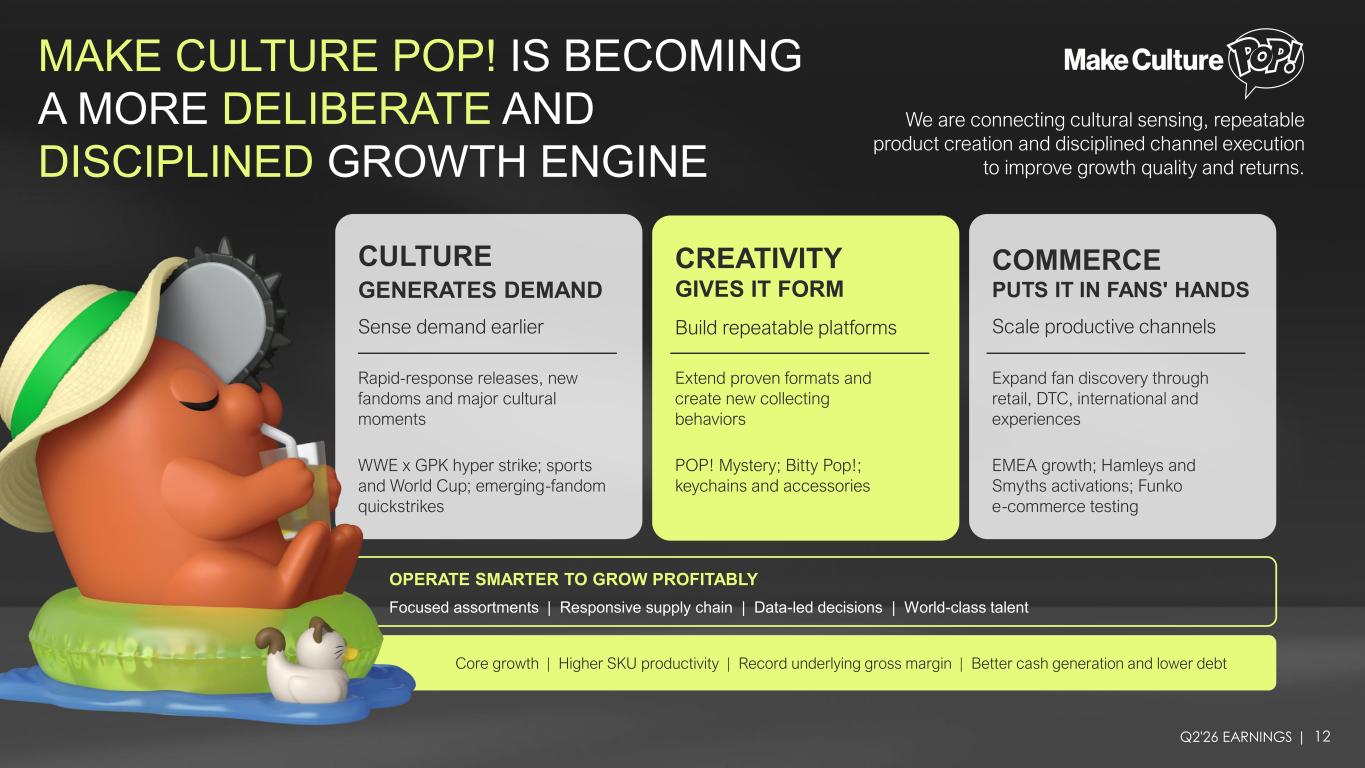
Q2'26 EARNINGS | MAKE CULTURE POP! IS BECOMING A MORE DELIBERATE AND DISCIPLINED GROWTH ENGINE We are connecting cultural sensing, repeatable product creation and disciplined channel execution to improve growth quality and returns. CULTURE GENERATES DEMAND Sense demand earlier Rapid-response releases, new fandoms and major cultural moments WWE x GPK hyper strike; sports and World Cup; emerging-fandom quickstrikes CREATIVITY GIVES IT FORM Build repeatable platforms Extend proven formats and create new collecting behaviors POP! Mystery; Bitty Pop!; keychains and accessories COMMERCE PUTS IT IN FANS' HANDS Scale productive channels Expand fan discovery through retail, DTC, international and experiences EMEA growth; Hamleys and Smyths activations; Funko e-commerce testing OPERATE SMARTER TO GROW PROFITABLY Focused assortments | Responsive supply chain | Data-led decisions | World-class talent Core growth | Higher SKU productivity | Record underlying gross margin | Better cash generation and lower debt 12
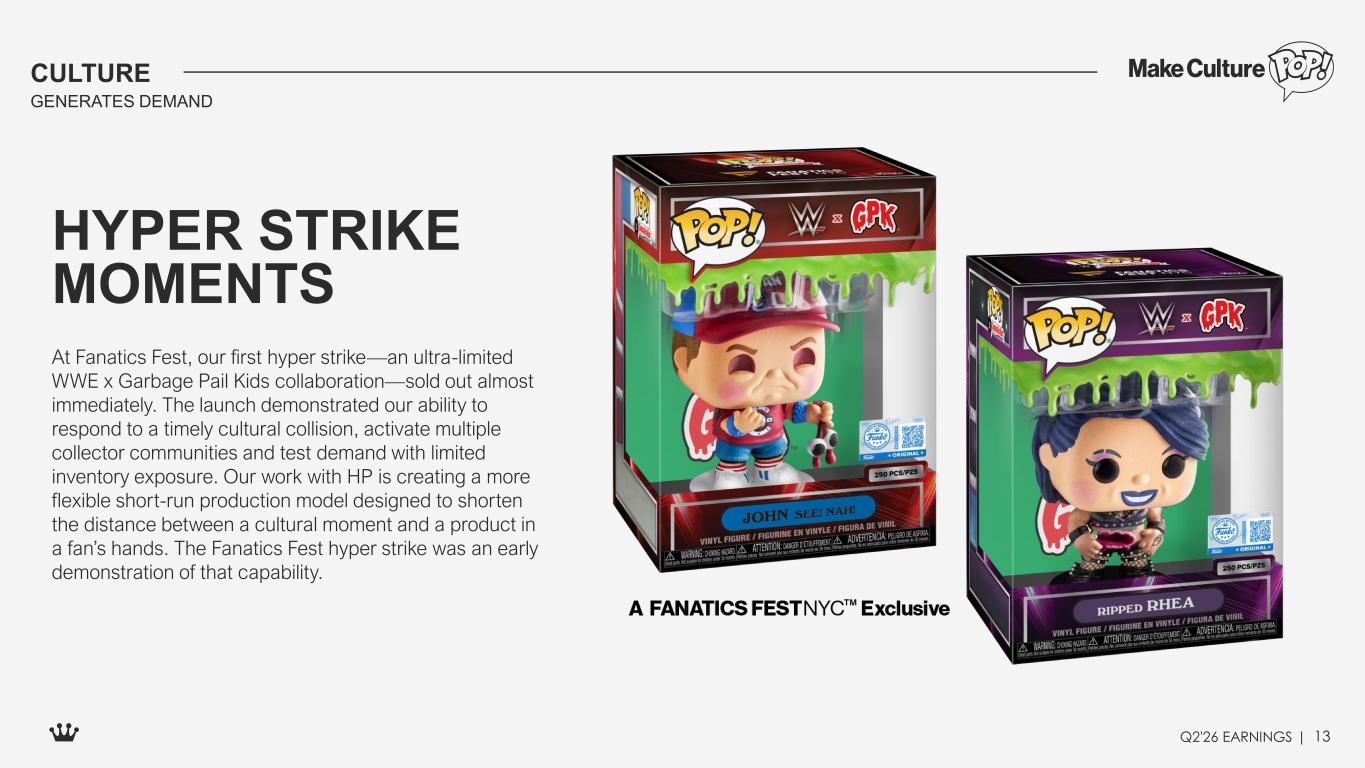
Q2'26 EARNINGS | At Fanatics Fest, our first hyper strike—an ultra-limited WWE x Garbage Pail Kids collaboration—sold out almost immediately. The launch demonstrated our ability to respond to a timely cultural collision, activate multiple collector communities and test demand with limited inventory exposure. Our work with HP is creating a more flexible short-run production model designed to shorten the distance between a cultural moment and a product in a fan’s hands. The Fanatics Fest hyper strike was an early demonstration of that capability. HYPER STRIKE MOMENTS CULTURE GENERATES DEMAND 13
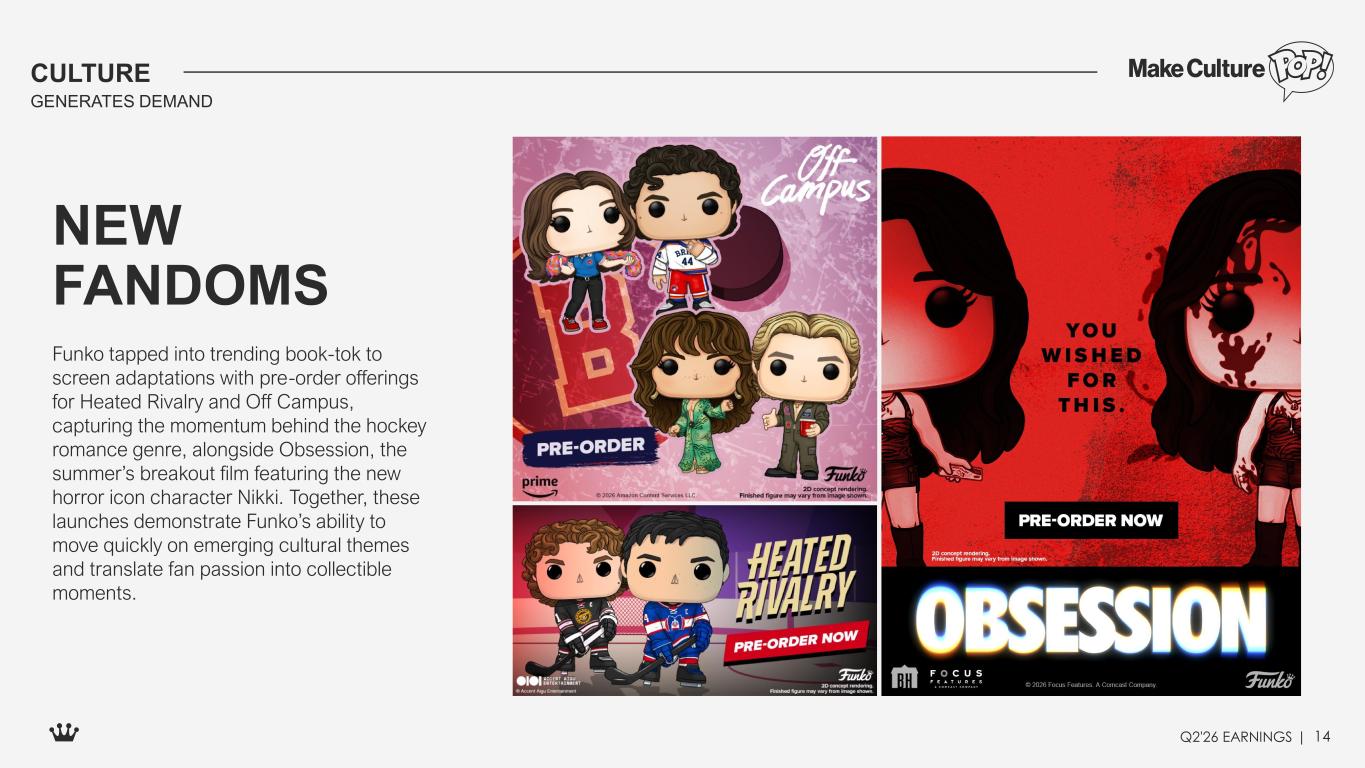
Q2'26 EARNINGS | Funko tapped into trending book-tok to screen adaptations with pre-order offerings for Heated Rivalry and Off Campus, capturing the momentum behind the hockey romance genre, alongside Obsession, the summer’s breakout film featuring the new horror icon character Nikki. Together, these launches demonstrate Funko’s ability to move quickly on emerging cultural themes and translate fan passion into collectible moments. NEW FANDOMS CULTURE GENERATES DEMAND 14
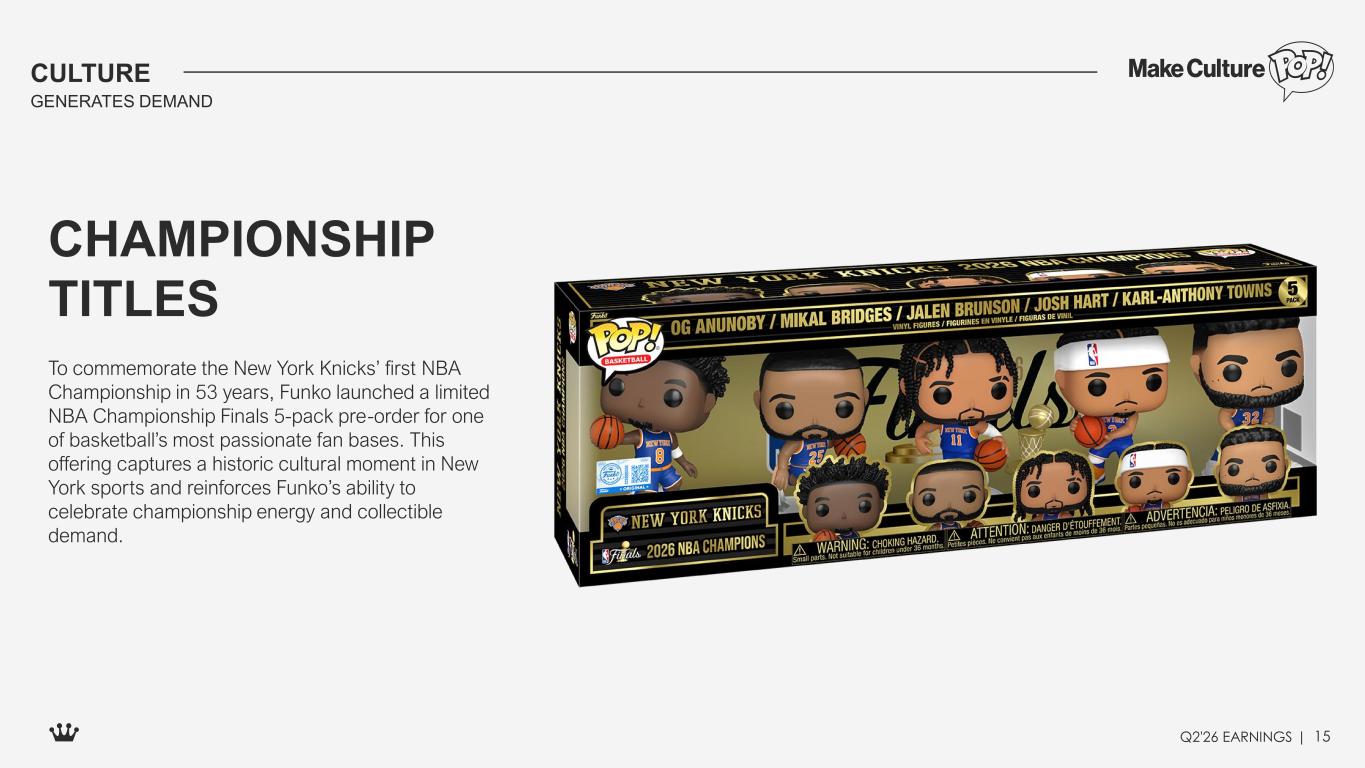
Q2'26 EARNINGS | To commemorate the New York Knicks’ first NBA Championship in 53 years, Funko launched a limited NBA Championship Finals 5-pack pre-order for one of basketball’s most passionate fan bases. This offering captures a historic cultural moment in New York sports and reinforces Funko’s ability to celebrate championship energy and collectible demand. CHAMPIONSHIP TITLES CULTURE GENERATES DEMAND 15
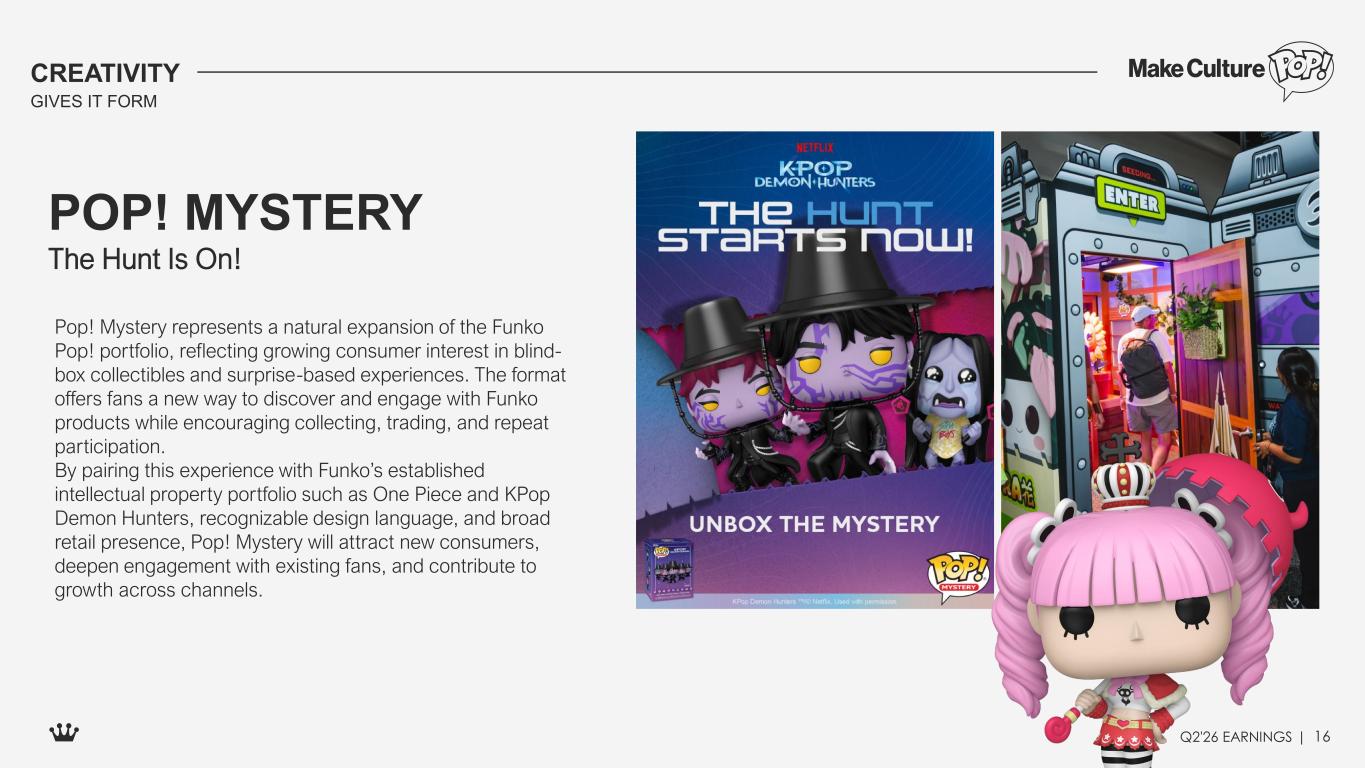
Q2'26 EARNINGS | CREATIVITY GIVES IT FORM Pop! Mystery represents a natural expansion of the Funko Pop! portfolio, reflecting growing consumer interest in blind- box collectibles and surprise-based experiences. The format offers fans a new way to discover and engage with Funko products while encouraging collecting, trading, and repeat participation. By pairing this experience with Funko’s established intellectual property portfolio such as One Piece and KPop Demon Hunters, recognizable design language, and broad retail presence, Pop! Mystery will attract new consumers, deepen engagement with existing fans, and contribute to growth across channels. POP! MYSTERY The Hunt Is On! 16
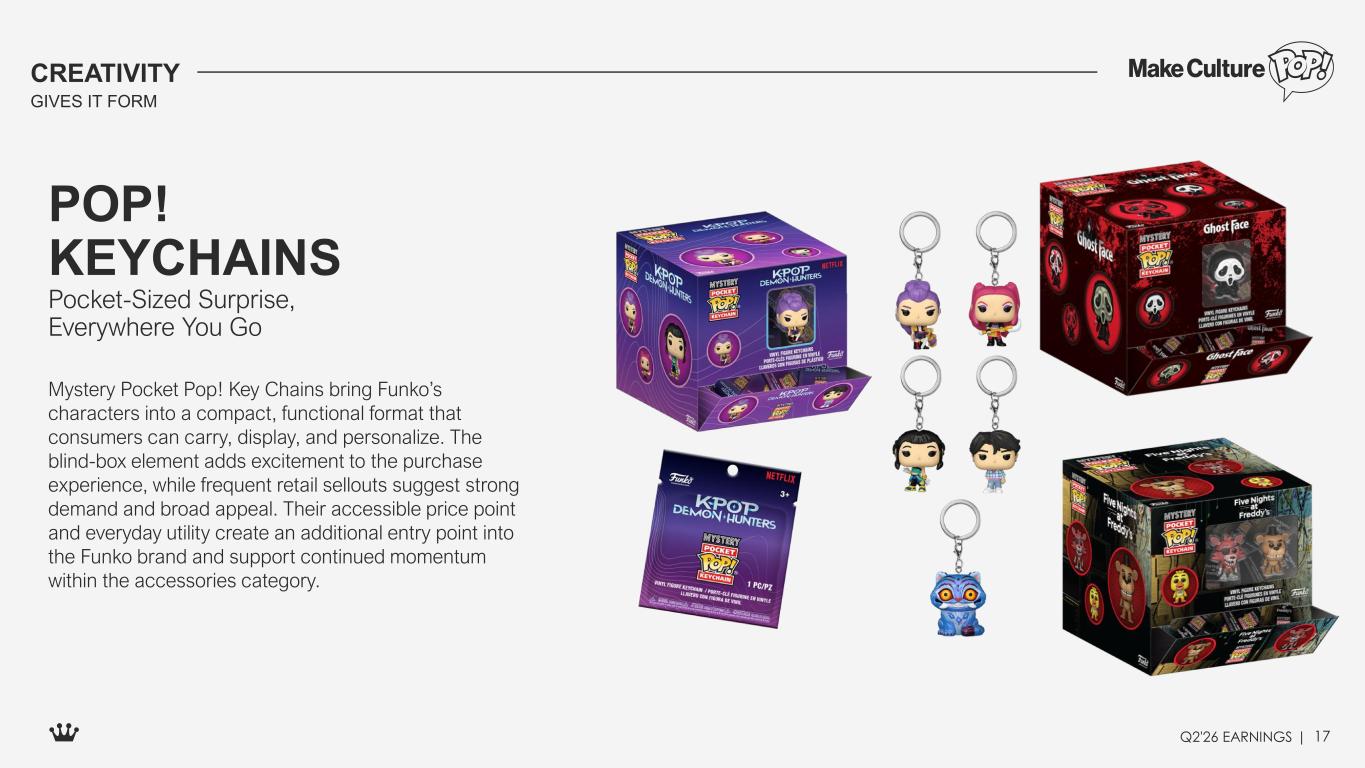
Q2'26 EARNINGS | Mystery Pocket Pop! Key Chains bring Funko’s characters into a compact, functional format that consumers can carry, display, and personalize. The blind-box element adds excitement to the purchase experience, while frequent retail sellouts suggest strong demand and broad appeal. Their accessible price point and everyday utility create an additional entry point into the Funko brand and support continued momentum within the accessories category. POP! KEYCHAINS Pocket-Sized Surprise, Everywhere You Go 17 CREATIVITY GIVES IT FORM
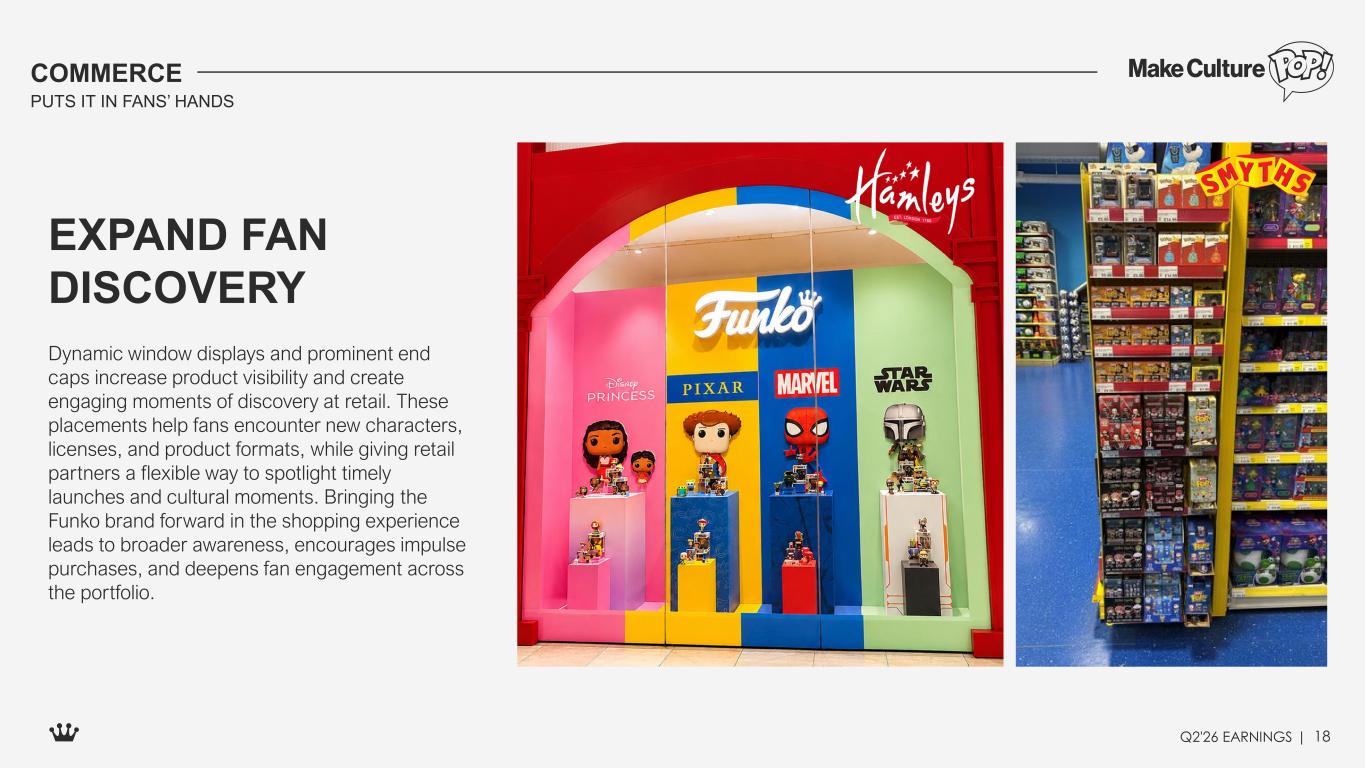
Q2'26 EARNINGS | COMMERCE PUTS IT IN FANS’ HANDS Dynamic window displays and prominent end caps increase product visibility and create engaging moments of discovery at retail. These placements help fans encounter new characters, licenses, and product formats, while giving retail partners a flexible way to spotlight timely launches and cultural moments. Bringing the Funko brand forward in the shopping experience leads to broader awareness, encourages impulse purchases, and deepens fan engagement across the portfolio. EXPAND FAN DISCOVERY 18
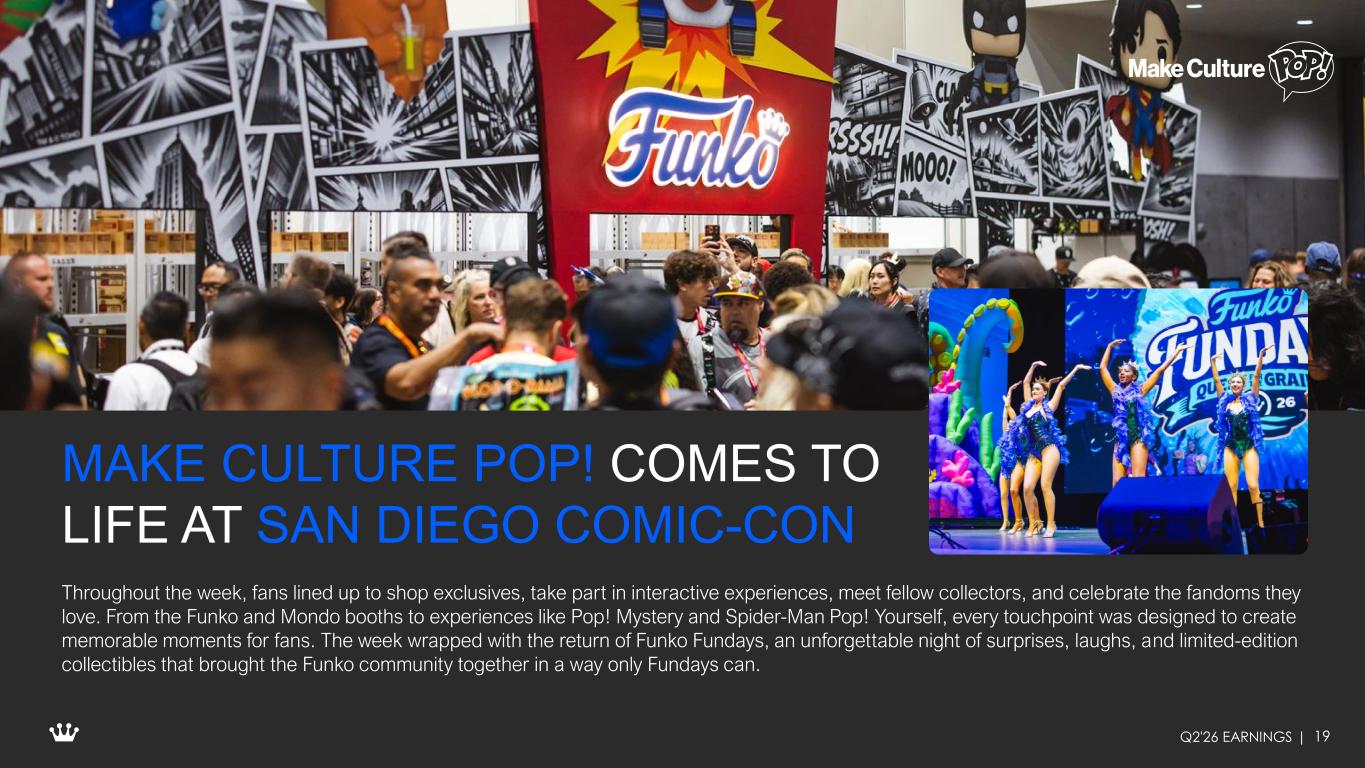
Q2'26 EARNINGS | 19 MAKE CULTURE POP! COMES TO LIFE AT SAN DIEGO COMIC-CON Throughout the week, fans lined up to shop exclusives, take part in interactive experiences, meet fellow collectors, and celebrate the fandoms they love. From the Funko and Mondo booths to experiences like Pop! Mystery and Spider-Man Pop! Yourself, every touchpoint was designed to create memorable moments for fans. The week wrapped with the return of Funko Fundays, an unforgettable night of surprises, laughs, and limited-edition collectibles that brought the Funko community together in a way only Fundays can.

Q2'26 EARNINGS | KPop Demon Hunters Introduced a new Saja Boys collection, building on continued fan engagement with the franchise. Delivered a high-visibility launch timed to the theatrical release, supported by national media on Good Morning America. Accessories Sustained double-digit growth in bag charms and accessories. Bob’s Burgers Added a highly recognizable franchise to the portfolio through a new Loungefly collection. Toy Story 5 BRAND HIGHLIGHTS 20

Q4 EARNINGS | 2025 Appendix Q2’26 EARNINGS | 21
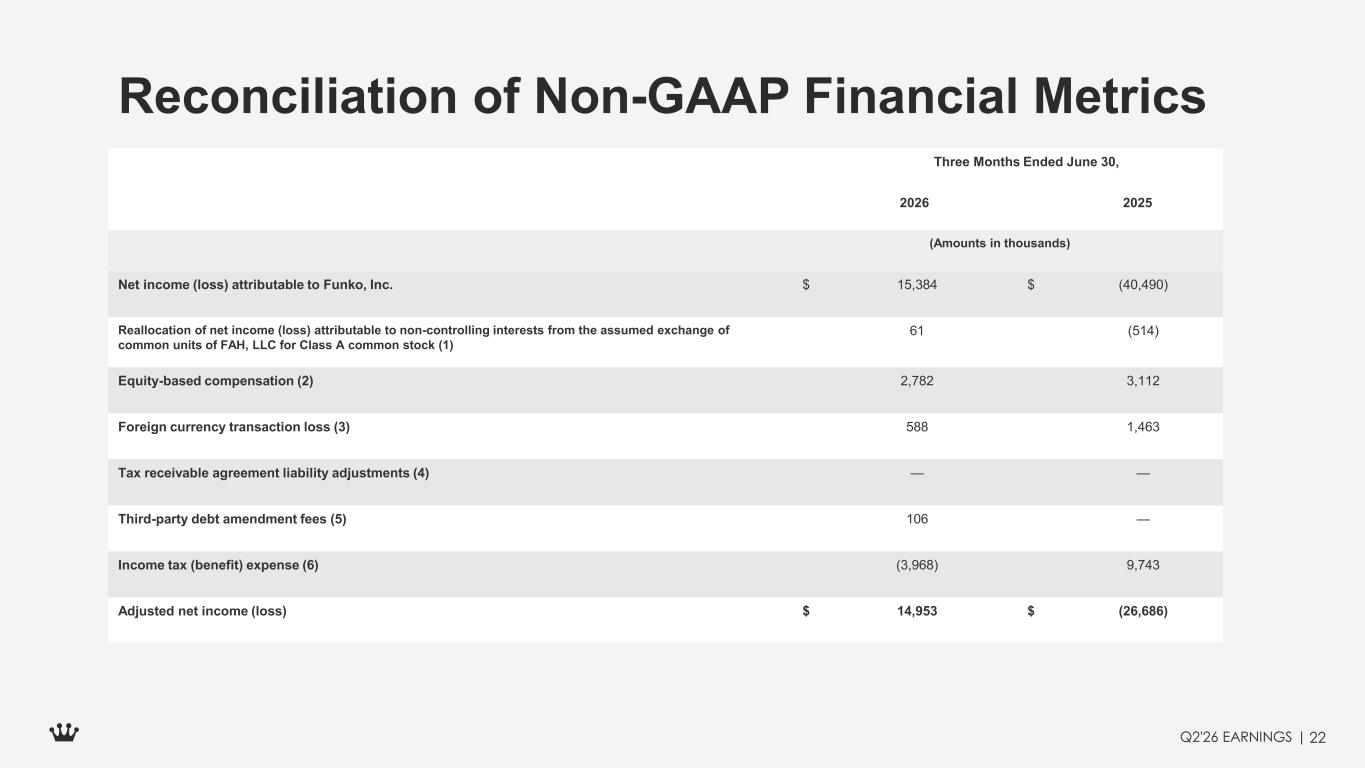
Q2'26 EARNINGS | Reconciliation of Non-GAAP Financial Metrics 22 Three Months Ended June 30, 2026 2025 (Amounts in thousands) Net income (loss) attributable to Funko, Inc. $ 15,384 $ (40,490) Reallocation of net income (loss) attributable to non-controlling interests from the assumed exchange of common units of FAH, LLC for Class A common stock (1) 61 (514) Equity-based compensation (2) 2,782 3,112 Foreign currency transaction loss (3) 588 1,463 Tax receivable agreement liability adjustments (4) — — Third-party debt amendment fees (5) 106 — Income tax (benefit) expense (6) (3,968) 9,743 Adjusted net income (loss) $ 14,953 $ (26,686)
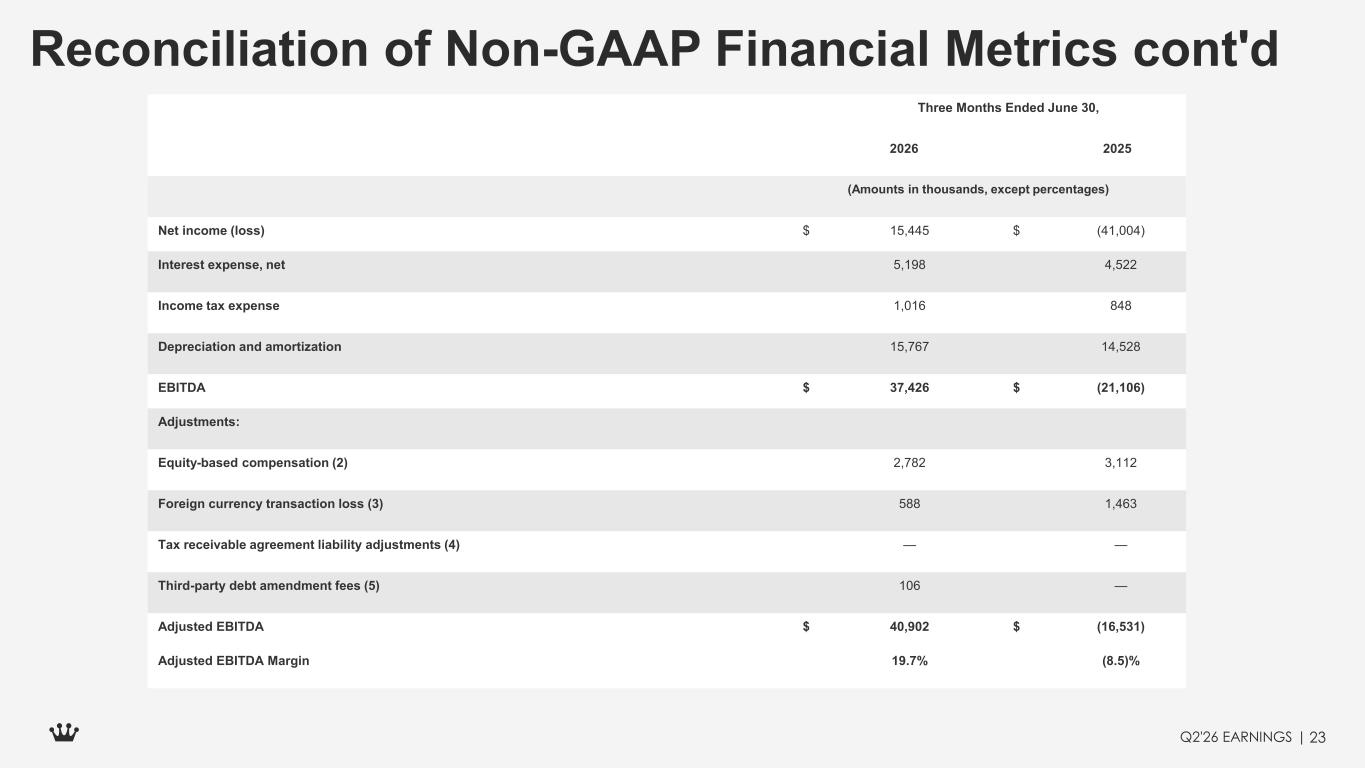
Q2'26 EARNINGS | Reconciliation of Non-GAAP Financial Metrics cont'd 23 Three Months Ended June 30, 2026 2025 (Amounts in thousands, except percentages) Net income (loss) $ 15,445 $ (41,004) Interest expense, net 5,198 4,522 Income tax expense 1,016 848 Depreciation and amortization 15,767 14,528 EBITDA $ 37,426 $ (21,106) Adjustments: Equity-based compensation (2) 2,782 3,112 Foreign currency transaction loss (3) 588 1,463 Tax receivable agreement liability adjustments (4) — — Third-party debt amendment fees (5) 106 — Adjusted EBITDA $ 40,902 $ (16,531) Adjusted EBITDA Margin 19.7% (8.5)%
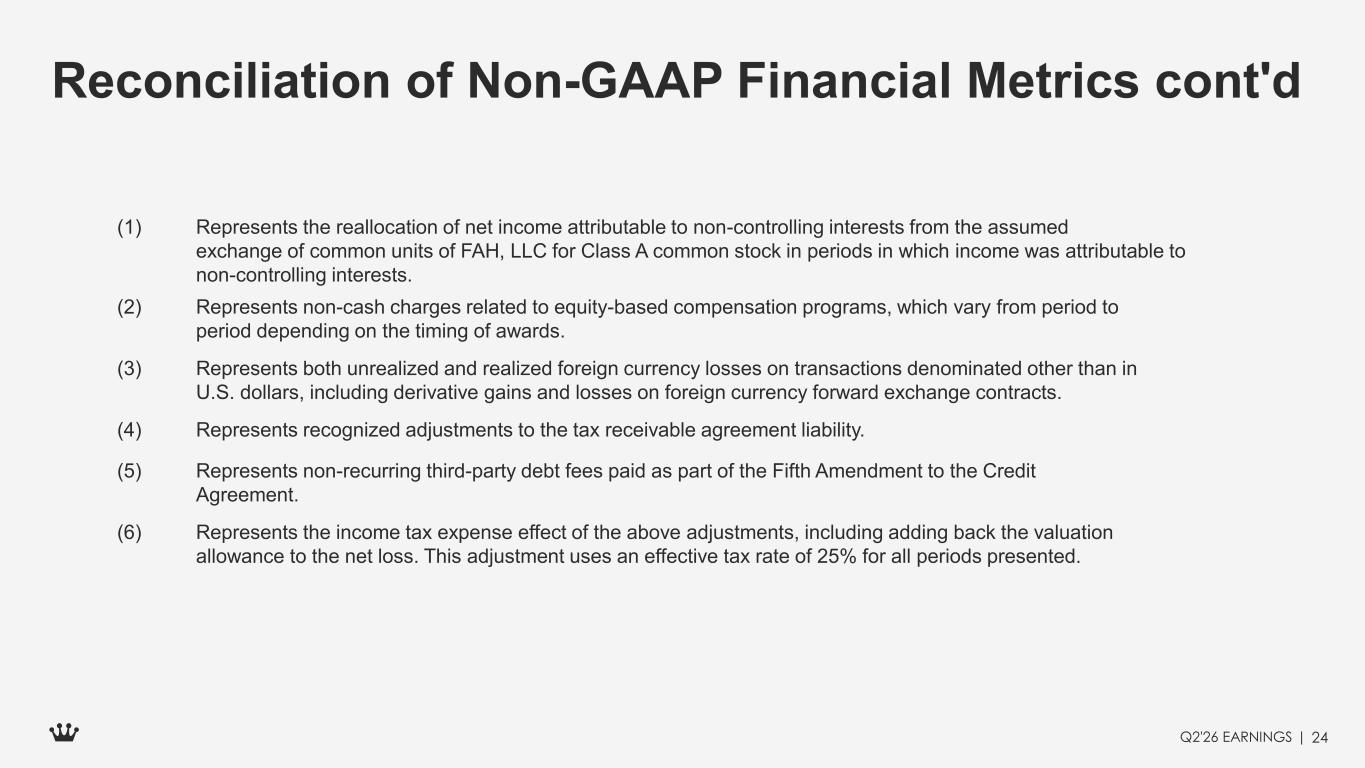
Q2'26 EARNINGS | Reconciliation of Non-GAAP Financial Metrics cont'd 24 (1) Represents the reallocation of net income attributable to non-controlling interests from the assumed exchange of common units of FAH, LLC for Class A common stock in periods in which income was attributable to non-controlling interests. (2) Represents non-cash charges related to equity-based compensation programs, which vary from period to period depending on the timing of awards. (3) Represents both unrealized and realized foreign currency losses on transactions denominated other than in U.S. dollars, including derivative gains and losses on foreign currency forward exchange contracts. (4) Represents recognized adjustments to the tax receivable agreement liability. (5) Represents non-recurring third-party debt fees paid as part of the Fifth Amendment to the Credit Agreement. (6) Represents the income tax expense effect of the above adjustments, including adding back the valuation allowance to the net loss. This adjustment uses an effective tax rate of 25% for all periods presented.
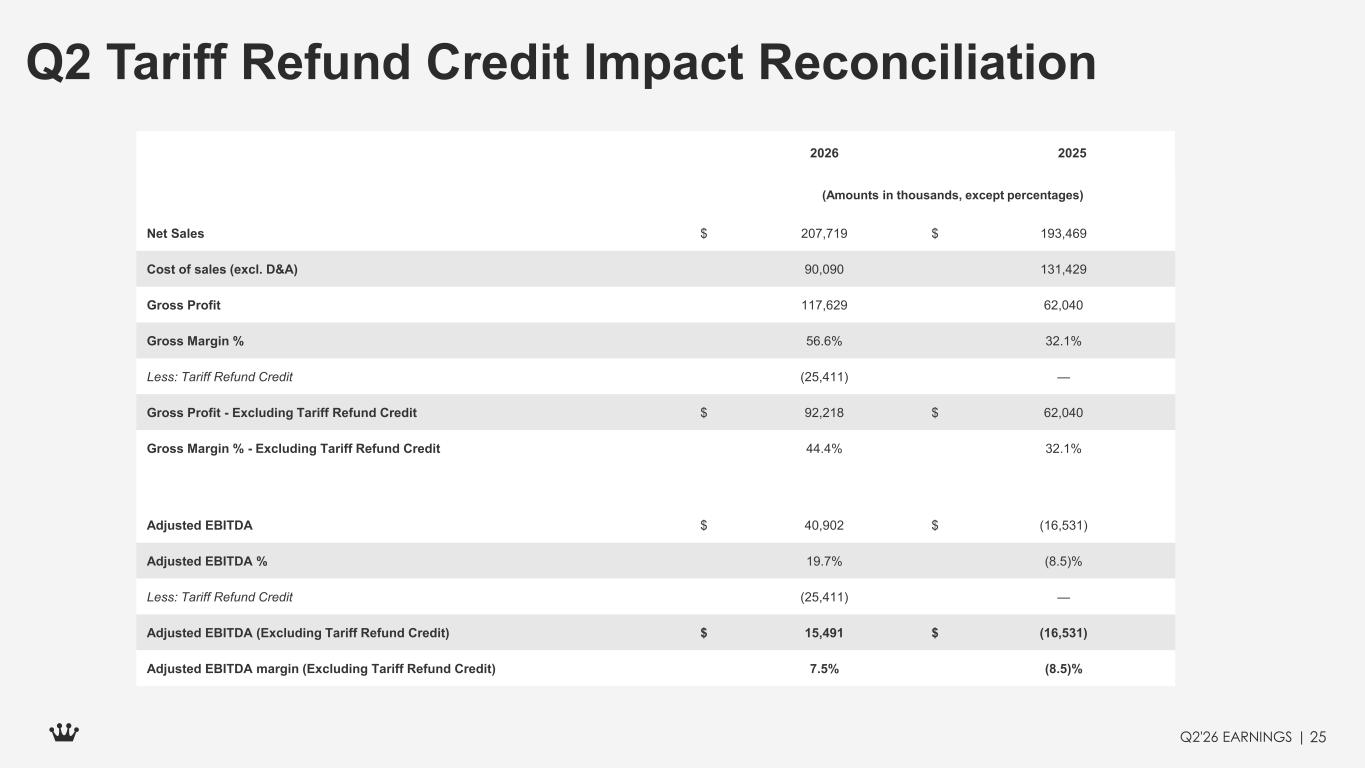
Q2'26 EARNINGS | Q2 Tariff Refund Credit Impact Reconciliation 25 2026 2025 (Amounts in thousands, except percentages) Net Sales $ 207,719 $ 193,469 Cost of sales (excl. D&A) 90,090 131,429 Gross Profit 117,629 62,040 Gross Margin % 56.6% 32.1% Less: Tariff Refund Credit (25,411) — Gross Profit - Excluding Tariff Refund Credit $ 92,218 $ 62,040 Gross Margin % - Excluding Tariff Refund Credit 44.4% 32.1% Adjusted EBITDA $ 40,902 $ (16,531) Adjusted EBITDA % 19.7% (8.5)% Less: Tariff Refund Credit (25,411) — Adjusted EBITDA (Excluding Tariff Refund Credit) $ 15,491 $ (16,531) Adjusted EBITDA margin (Excluding Tariff Refund Credit) 7.5% (8.5)%