FTK 8-K
Flotek Industries Inc/Cn/ (FTK)
8-K
2023-05-09
For: 2023-05-08
View Original
Added on
April 11, 2026
UNITED STATES
SECURITIES AND EXCHANGE COMMISSION
Washington, D.C. 20549
FORM 8-K
CURRENT REPORT
Pursuant to Section 13 or 15(d) of the Securities Exchange Act of 1934
Date of Report (Date of earliest event reported)
(Exact name of registrant as specified in its charter)
| (State or Other Jurisdiction of Incorporation) | (Commission File Number) | (IRS Employer Identification No.) | ||||||
(Address of principal executive office and zip code)
(Registrant’s telephone number, including area code)
(Not applicable)
(Former name or former address, if changed since last report)
Check the appropriate box below if the Form 8-K filing is intended to simultaneously satisfy the filing obligation of the registrant under any of the following provisions:
Securities registered pursuant to Section 12(b) of the Act:
| Title of each class | Trading Symbol(s) | Name of Exchange on which registered | ||||||
Indicate by check mark whether the registrant is an emerging growth company as defined in Rule 405 of the Securities Act of 1933 (§230.405 of this chapter) or Rule 12b-2 of the Securities Exchange Act of 1934 (§240.12b-2 of this chapter).
Emerging growth company ☐
If an emerging growth company, indicate by check mark if the registrant has elected not to use the extended transition period for complying with any new or revised financial accounting standards provided pursuant to Section 13(a) of the Exchange Act. ☐
Item 2.02. Results of Operations and Financial Condition
On May 8, 2023, Flotek Industries, Inc. (the “Company”) issued a press release providing its financial results for the quarter ended March 31, 2023 and announcing that it will hold a conference call to discuss its operating results. The press release is furnished herewith as Exhibit 99.1 to this Current Report on Form 8-K and is incorporated herein by reference.
The information furnished pursuant to Item 2.02 of this Current Report on Form 8-K and in Exhibit 99.1 shall not be deemed to be “filed” for the purposes of Section 18 of the Securities Exchange Act of 1934, as amended (the “Exchange Act”), is not subject to the liabilities of that section and is not deemed incorporated by reference into any filing of the Company under the Securities Act of 1933, as amended, or the Exchange Act, except as otherwise expressly stated in such filing.
Item 7.01 Regulation FD Disclosure
On May 8, 2023, the Company provided on its website a presentation containing information relating to its current operations and financial results. A copy of the presentation is attached hereto as Exhibit 99.2 and is incorporated herein by reference.
The information furnished pursuant to Item 7.01 of this Current Report on 8-K and in Exhibit 99.2 shall not be deemed to be “filed” for the purposes of Section 18 of the Exchange Act, is not subject to the liabilities of that section and is not deemed incorporated by reference into any filing of the Company under the Securities Act of 1933, as amended, or the Exchange Act, except as otherwise expressly stated in such filing.
Item 9.01. Financial Statements and Exhibits.
(d) Exhibits.
The following exhibits are included with this Current Report on Form 8-K:
Exhibit No. Description
SIGNATURES
Pursuant to the requirements of the Securities Exchange Act of 1934, the registrant has duly caused this report to be signed on its behalf by the undersigned hereunto duly authorized.
| FLOTEK INDUSTRIES, INC. | ||||||||
| Date: May 8, 2023 | /s/ Bond Clement | |||||||
| Name: | Bond Clement | |||||||
| Title: | Chief Financial Officer | |||||||
EXHIBIT 99.1
FLOTEK REPORTS POSITIVE GROSS PROFIT FOR FIRST QUARTER 2023 AND INITIATES 2023 GUIDANCE
HOUSTON, May 8, 2023 - Flotek Industries, Inc. (“Flotek” or the “Company”) (NYSE: FTK) today announced operational and financial results for the first quarter ended March 31, 2023.
Financial Summary
| (in thousands) | Q1 2023 | Q4 2022 | Percent Change | Q1 2022 | Percent Change | ||||||||||||||||||||||||
| Total Revenue | $ | 48,007 | $ | 48,217 | 0% | $ | 12,879 | 273% | |||||||||||||||||||||
| Gross Profit (Loss) | $ | 1,880 | $ | (2,074) | 191% | $ | (479) | 492% | |||||||||||||||||||||
Adjusted Gross Profit (Loss) (1) | $ | 2,647 | $ | (522) | 607% | $ | (226) | 1,271% | |||||||||||||||||||||
| Net Income (Loss) | $ | 21,343 | $ | (19,026) | 212% | $ | (10,724) | 299% | |||||||||||||||||||||
Adjusted EBITDA (1) | $ | (3,851) | $ | (5,079) | 24% | $ | (5,446) | 29% | |||||||||||||||||||||
(1)A non-GAAP financial measure. See “Unaudited Reconciliation of Non-GAAP Items and Non-Cash Items Impacting Earnings” section in this release for more information, including reconciliations to the most comparable GAAP measures.
Full Year 2023 Outlook
Flotek has initiated full year 2023 guidance for revenue of $210 million to $230 million and an Adjusted Gross Profit margin of 8% to 10%. Adjusted Gross Profit(1) excludes non-cash costs, including contract amortization.
First Quarter 2023 Highlights
•Reached positive gross profit for the first quarter of 2023, representing an almost 200% increase sequentially and growth of nearly 500% from the year-ago quarter.
•Increased revenue by more than 270% from the first quarter of 2022 primarily as a result of Flotek’s strategic 10-year supply agreement with ProFrac Holdings, LLC (“ProFrac”).
•Realized 135% revenue growth in the Company’s Data Analytics business versus first quarter of 2022. First quarter 2023 revenue totaled $2.5 million, representing 45% of total Data Analytics revenue for all of 2022.
•Increased the average number of ProFrac fleets serviced from 17 in the fourth quarter of 2022 to 19 in the first quarter of 2023.
1
•Achieved approximately 12% market share of the active U.S. frac fleets by the end of the first quarter of 2023. Flotek remains well positioned to capture additional market share as a result of its anticipated expanded scope of work with ProFrac and strategic business development efforts with other customers, supported by the Company’s unique product and service offerings.
Management Commentary
Harsha V. Agadi, Interim Chief Executive Officer for Flotek, stated, “Our first quarter results reflect the continued progress we are making to be the collaborative partner of choice for sustainable optimized chemistry and data solutions. Importantly, we achieved a $3.2 million improvement in adjusted gross profit, as compared to the fourth quarter, on nearly identical revenue, which demonstrates the continuing underlying improvement we are achieving in margins. The first quarter represents an inflection point for gross profit. With support from additional revenue opportunities and targeted cost reduction initiatives, we remain focused on reaching positive adjusted EBITDA during 2023.”
First Quarter 2023 Financial Results
•Revenue: Flotek recorded first quarter 2023 total revenue of $48.0 million compared to $48.2 million for the fourth quarter of 2022 and $12.9 million for the first quarter of 2022 – a 273% increase. Contributing to the year-over-year growth was the Company’s 10-year supply agreement with ProFrac and continued growth in the Company’s other Chemistry Technologies and Data Analytics product and service offerings. First quarter 2023 revenue remained flat sequentially, despite the industry’s seasonal slow-down in well stimulation operations early in the quarter.
•Gross Profit (Loss): The Company generated a gross profit of $1.9 million versus a gross loss of $2.1 million for the fourth quarter of 2022 and a gross loss of $0.5 million for the first quarter of 2022. The substantial improvement in gross margin was the result of pricing improvements, freight cost reductions and the Company’s initiatives to drive further efficiencies in the business, including focusing its efforts on leveraging the scale of its ProFrac business to drive margin enhancement.
•Adjusted Gross Profit (Loss) (Non-GAAP): Flotek generated an adjusted gross profit of $2.6 million compared to adjusted gross losses of $0.5 million and $0.2 million for the fourth and first quarters of 2022, respectively. Adjusted gross profit (loss) primarily excludes non-cash items, including amortization of contract assets, which reduces both revenue and gross profit.
•Selling, General and Administrative (“SG&A”) Expense: The Company’s SG&A expense was $6.5 million for the first quarter of 2023 compared to $5.8 million for the fourth quarter of 2022 and $4.9 million for the first quarter of 2022. First quarter 2023 SG&A included higher non-recurring legal fees, offset by lower stock compensation costs. In addition, fourth quarter 2022 SG&A benefited from a $1.5 million reversal of an accrued discretionary bonus.
2
•Severance Costs: Flotek recorded $2.2 million in separation costs in the first quarter of 2023, which was associated with the departure of the Company’s previous CEO and other management level headcount reductions implemented in the period.
•Net Income (Loss) and EPS: Flotek reported net income of $21.3 million, or $0.22 per basic share, for the first quarter of 2023. This is compared to a net loss of $19.0 million, or $0.25 per basic share, for the fourth quarter of 2022 and a net loss of $10.7 million, or $0.15 per basic share, in the first quarter of 2022. Net income during the first quarter of 2023 benefited from a $26.1 million non-cash gain related to the fair value adjustment of the Company’s convertible notes, as well as a $4.5 million gain from the forgiveness of the Company’s PPP loan.
•Adjusted EBITDA (Non-GAAP): Adjusted EBITDA was negative $3.9 million in the first quarter of 2023 versus negative $5.1 million and negative $5.4 million for the fourth and first quarters of 2022, respectively. Adjusted EBITDA continues to trend upward, improving 24% sequentially.
Balance Sheet and Liquidity
•Cash and cash equivalents remained stable at $12.4 million as of March 31, 2023, compared to $12.3 million as of December 31, 2022.
•Flotek is continuing to pursue asset-based borrowing options. To date, the Company has received four non-binding proposals and is evaluating the various terms and conditions in each of the term sheets.
Conference Call Details
Flotek will host a conference call on May 9, 2023, at 9:30 a.m. CDT (10:30 a.m. EDT) to discuss its first quarter 2023 results. Participants may access the call through Flotek’s website at www.flotekind.com under “Webcasts’’ or by telephone toll free at 1-844-835-9986 (international toll: 1-412-317-5270) approximately five minutes prior to the start of the call. Following the conclusion of the conference call, a recording of the call will be available on the Company’s website.
About Flotek Industries, Inc.
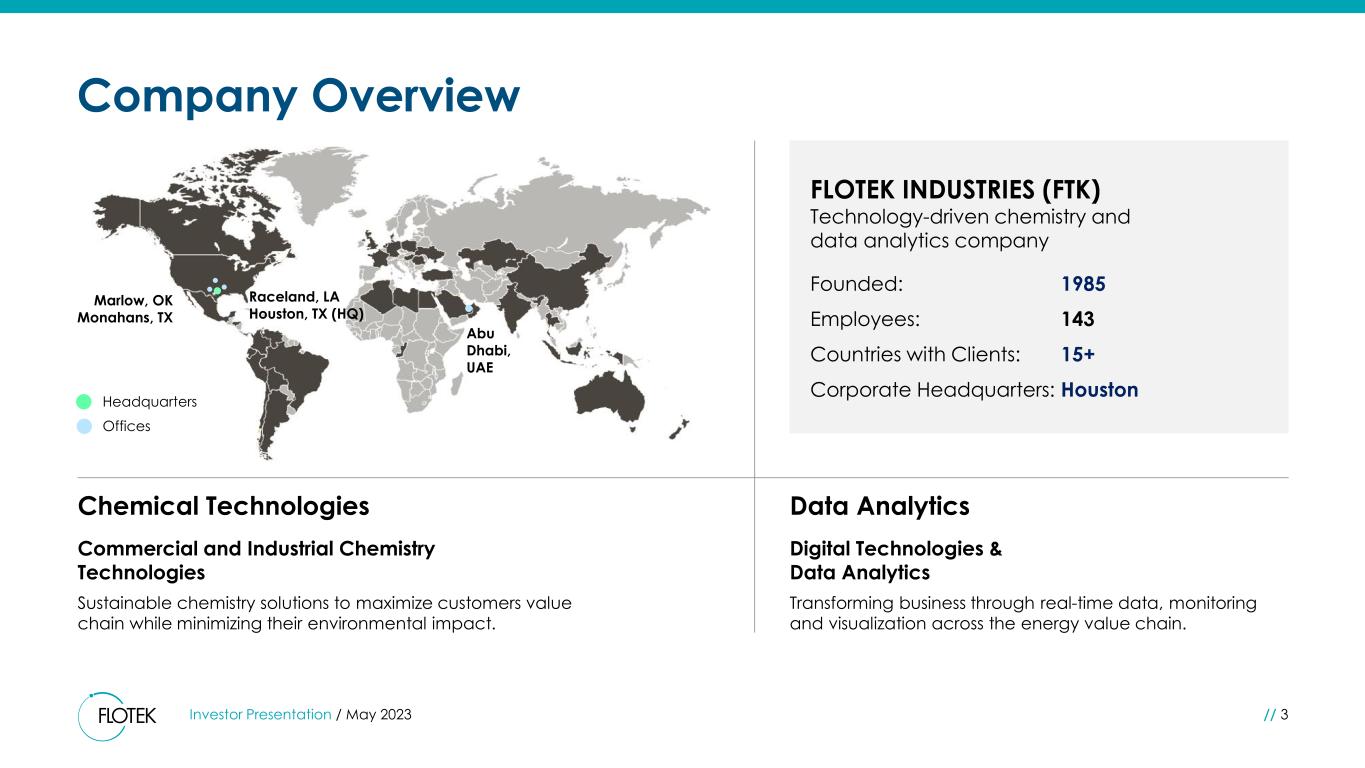
Flotek Industries, Inc. creates unique solutions to reduce the environmental impact of energy on air, water, land and people. A technology-driven, specialty green chemistry and data company, Flotek helps customers across industrial and commercial markets improve their environmental performance. The Company’s primary focus is to enable its customers to maximize the value of their hydrocarbon streams and improve return on invested capital through its real-time data platforms and green chemistry technologies. Flotek serves downstream, midstream, and upstream energy customers, both domestic and international. In addition, the Company is positioned to integrate parallel industrial chemistry and data platforms by capitalizing on its digitization, engineering, chemical formulation knowledge, and intellectual property to drive multi-disciplinary advancements in sustainability and enterprise risk management. Flotek is a publicly traded company headquartered in Houston, Texas, and its common shares are traded on the New York Stock Exchange under the ticker symbol “FTK.” For additional information, please visit www.flotekind.com.
3
Forward -Looking Statements
Certain statements set forth in this press release constitute forward-looking statements (within the meaning of Section 27A of the Securities Act of 1933 and Section 21E of the Securities Exchange Act of 1934) regarding Flotek Industries, Inc.’s business, financial condition, results of operations and prospects. Words such as will, continue, expects, anticipates, intends, plans, believes, seeks, estimates and similar expressions or variations of such words are intended to identify forward-looking statements, but are not the exclusive means of identifying forward-looking statements in this press release. Although forward-looking statements in this press release reflect the good faith judgment of management, such statements can only be based on facts and factors currently known to management. Consequently, forward-looking statements are inherently subject to risks and uncertainties, and actual results and outcomes may differ materially from the results and outcomes discussed in the forward-looking statements. Further information about the risks and uncertainties that may impact the company are set forth in the Company’s most recent filing with the Securities and Exchange Commission on Form 10-K (including, without limitation, in the “Risk Factors” section thereof), and in the Company’s other SEC filings and publicly available documents. Readers are urged not to place undue reliance on these forward-looking statements, which speak only as of the date of this press release. The Company undertakes no obligation to revise or update any forward-looking statements in order to reflect any event or circumstance that may arise after the date of this press release.
Company Contact
Bond Clement
Chief Financial Officer
P: (713) 726-5322
4
FLOTEK INDUSTRIES, INC.
UNAUDITED CONDENSED CONSOLIDATED STATEMENTS OF OPERATIONS
(in thousands, except per share data)
| Three Months Ended | ||||||||||||||||||||
| 3/31/2023 | 3/31/2022 | 12/31/2022 | ||||||||||||||||||
| Revenue: | ||||||||||||||||||||
Revenue from external customers | $ 11,652 | $ 10,382 | $ 15,940 | |||||||||||||||||
| Revenue from related party | 36,355 | 2,497 | 32,277 | |||||||||||||||||
| Total revenues | 48,007 | 12,879 | 48,217 | |||||||||||||||||
| Cost of goods sold | 46,127 | 13,358 | 50,291 | |||||||||||||||||
| Gross profit (loss) | 1,880 | (479) | (2,074) | |||||||||||||||||
| Operating costs and expenses: | ||||||||||||||||||||
| Selling, general, and administrative | 6,451 | 4,886 | 5,779 | |||||||||||||||||
| Depreciation | 176 | 195 | 180 | |||||||||||||||||
| Research and development | 614 | 1,415 | 922 | |||||||||||||||||
| Severance costs | 2,223 | (7) | — | |||||||||||||||||
| (Gain) loss on sale of property and equipment | — | 8 | (1,000) | |||||||||||||||||
| Gain on lease termination | — | (584) | — | |||||||||||||||||
| (Gain) loss in fair value of Contract Consideration Convertible Notes Payable | (26,095) | 3,892 | 8,941 | |||||||||||||||||
| Total operating costs and expenses | (16,631) | 9,805 | 14,822 | |||||||||||||||||
| Income (loss) from operations | 18,511 | (10,284) | (16,896) | |||||||||||||||||
| Other income (expense): | ||||||||||||||||||||
| Paycheck protection plan loan forgiveness | 4,522 | — | — | |||||||||||||||||
| Interest expense | (1,672) | (668) | (2,465) | |||||||||||||||||
| Other income (expense) , net | (9) | 224 | 212 | |||||||||||||||||
| Total other income (expense), net | 2,841 | (444) | (2,253) | |||||||||||||||||
| Income (loss) before income taxes | 21,352 | (10,728) | (19,149) | |||||||||||||||||
| Income tax (expense) benefit | (9) | 4 | 123 | |||||||||||||||||
| Net income (loss) | $ 21,343 | $ (10,724) | $ (19,026) | |||||||||||||||||
| Income (loss) per common share: | ||||||||||||||||||||
| Basic | $ 0.22 | $ (0.15) | $ (0.25) | |||||||||||||||||
| Diluted | $ (0.02) | $ (0.15) | $ (0.25) | |||||||||||||||||
| Weighted average common shares: | ||||||||||||||||||||
Weighted average common shares used in computing basic income (loss) per common share | 98,808 | 73,858 | 75,405 | |||||||||||||||||
Weighted average common shares used in computing diluted loss per common share | 158,441 | 73,858 | 75,405 | |||||||||||||||||
5
FLOTEK INDUSTRIES, INC.
UNAUDITED CONDENSED CONSOLIDATED BALANCE SHEETS
(in thousands, except share data)
| March 31, 2023 | December 31, 2022 | ||||||||||
| ASSETS | |||||||||||
| Current assets: | |||||||||||
| Cash and cash equivalents | $ 12,433 | $ 12,290 | |||||||||
| Restricted cash | 101 | 100 | |||||||||
| Accounts receivable, net of allowance for credit losses of $645 and $623 at March 31, 2023 and December 31, 2022, respectively | 15,609 | 19,136 | |||||||||
| Accounts receivable, related party | 26,230 | 22,683 | |||||||||
| Inventories, net | 15,904 | 15,720 | |||||||||
| Other current assets | 4,516 | 4,045 | |||||||||
| Current contract asset | 7,066 | 7,113 | |||||||||
| Total current assets | 81,859 | 81,087 | |||||||||
| Long-term contract assets | 71,372 | 72,576 | |||||||||
| Property and equipment, net | 4,807 | 4,826 | |||||||||
| Operating lease right-of-use assets | 4,923 | 5,900 | |||||||||
| Deferred tax assets, net | 410 | 404 | |||||||||
| Other long-term assets | 17 | 17 | |||||||||
| TOTAL ASSETS | $ 163,388 | $ 164,810 | |||||||||
| LIABILITIES AND STOCKHOLDERS’ EQUITY | |||||||||||
| Current liabilities: | |||||||||||
| Accounts payable | $ 41,929 | $ 33,375 | |||||||||
| Accrued liabilities | 9,870 | 8,984 | |||||||||
| Income taxes payable | 11 | 97 | |||||||||
| Interest payable | — | 130 | |||||||||
| Current portion of operating lease liabilities | 3,050 | 3,328 | |||||||||
| Current portion of finance lease liabilities | 36 | 36 | |||||||||
| Current portion of long-term debt | 179 | 2,052 | |||||||||
| Convertible notes payable | — | 19,799 | |||||||||
| Contract Consideration Convertible Notes Payable | 43,800 | 83,570 | |||||||||
| Total current liabilities | 98,875 | 151,371 | |||||||||
| Deferred revenue, long-term | 35 | 44 | |||||||||
| Long-term operating lease liabilities | 7,133 | 8,044 | |||||||||
| Long-term finance lease liabilities | 13 | 19 | |||||||||
| Long-term debt | 194 | 2,736 | |||||||||
| TOTAL LIABILITIES | 106,250 | 162,214 | |||||||||
| Stockholders’ equity: | |||||||||||
Common stock, $0.0001 par value, 240,000,000 shares authorized; 94,613,664 shares issued and 88,170,936 shares outstanding at March 31, 2023 ; 83,915,918 shares issued and 77,788,391 shares outstanding at December 31, 2022 | 9 | 8 | |||||||||
| Additional paid-in capital | 421,596 | 388,177 | |||||||||
| Accumulated other comprehensive income | 160 | 181 | |||||||||
| Accumulated deficit | (330,176) | (351,519) | |||||||||
Treasury stock, at cost; 6,442,728 and 6,127,527 shares at March 31, 2023 and December 31, 2022 , respectively | (34,451) | (34,251) | |||||||||
| Total stockholders’ equity | 57,138 | 2,596 | |||||||||
| TOTAL LIABILITIES AND STOCKHOLDERS’ EQUITY | $ 163,388 | $ 164,810 | |||||||||
6
FLOTEK INDUSTRIES, INC.
UNAUDITED CONDENSED CONSOLIDATED STATEMENTS OF CASH FLOWS
(in thousands)
7
| Three months ended March 31, | |||||||||||
| 2023 | 2022 | ||||||||||
| Cash flows from operating activities: | |||||||||||
| Net income (loss) | $ 21,343 | $ (10,724) | |||||||||
| Adjustments to reconcile net income (loss) to net cash provided by (used in) operating activities: | |||||||||||
Change in fair value of contingent consideration | (359) | 94 | |||||||||
Change in fair value of Contract Consideration Convertible Notes Payable | (26,095) | 3,892 | |||||||||
Amortization of convertible note issuance costs | 83 | 166 | |||||||||
Payment-in-kind interest expense | 1,571 | 485 | |||||||||
Amortization of contract assets | 1,251 | — | |||||||||
Depreciation and amortization | 176 | 195 | |||||||||
Provision for credit losses, net of recoveries | 23 | 238 | |||||||||
Provision for excess and obsolete inventory | 258 | 310 | |||||||||
Gain on sale of property and equipment | — | 8 | |||||||||
Gain on lease termination | — | (584) | |||||||||
Non-cash lease expense | 977 | 56 | |||||||||
Stock compensation expense | (1,112) | 739 | |||||||||
Deferred income tax (benefit) expense | (6) | (4) | |||||||||
Paycheck protection plan loan forgiveness | (4,522) | — | |||||||||
Changes in current assets and liabilities: | |||||||||||
Accounts receivable | 3,504 | (194) | |||||||||
Accounts receivable, related party | (3,546) | 14 | |||||||||
Inventories | (441) | (999) | |||||||||
Income taxes receivable | — | (10) | |||||||||
Other assets | (470) | (220) | |||||||||
Accounts payable | 8,554 | 616 | |||||||||
Accrued liabilities | 1,236 | (2,350) | |||||||||
Operating lease liabilities | (1,190) | (214) | |||||||||
Income taxes payable | (87) | — | |||||||||
Interest payable | (8) | 12 | |||||||||
| Net cash provided by (used in) operating activities | 1,140 | (8,474) | |||||||||
| Cash flows from investing activities: | |||||||||||
| Capital expenditures | (157) | — | |||||||||
| Proceeds from sale of assets | — | 24 | |||||||||
| Net cash (used in) provided by investing activities | (157) | 24 | |||||||||
| Cash flows from financing activities: | |||||||||||
| Payment for forfeited stock options | (617) | — | |||||||||
| Payments on long term debt | (15) | — | |||||||||
| Proceeds from issuance of convertible notes | — | 21,150 | |||||||||
| Payment of issuance costs of convertible notes | — | (1,084) | |||||||||
| Payments to tax authorities for shares withheld from employees | (200) | (59) | |||||||||
| Proceeds from issuance of stock | 20 | — | |||||||||
| Payments for finance leases | (6) | (14) | |||||||||
| Net cash (used in) provided by financing activities | (818) | 19,993 | |||||||||
| Effect of changes in exchange rates on cash and cash equivalents | (21) | 8 | |||||||||
| Net change in cash and cash equivalents and restricted cash | 144 | 11,551 | |||||||||
Cash and cash equivalents at the beginning of period | 12,290 | 11,534 | |||||||||
Restricted cash at the beginning of period | 100 | 1,790 | |||||||||
| Cash and cash equivalents and restricted cash at beginning of period | 12,390 | 13,324 | |||||||||
Cash and cash equivalents at end of period | 12,433 | 24,835 | |||||||||
Restricted cash at the end of period | 101 | 40 | |||||||||
| Cash and cash equivalents and restricted cash at end of period | $ 12,534 | $ 24,875 | |||||||||
FLOTEK INDUSTRIES, INC.
UNAUDITED RECONCILIATION OF NON-GAAP ITEMS AND NON-CASH ITEMS IMPACTING EARNINGS
(in thousands)
8
| Three Months Ended | ||||||||||||||||||||
| 3/31/2023 | 3/31/2022 | 12/31/2022 | ||||||||||||||||||
| Gross profit (loss) | $ 1,880 | $ (479) | $ (2,074) | |||||||||||||||||
| Stock compensation expense | (139) | 156 | 85 | |||||||||||||||||
| Severance and retirement | 15 | 3 | — | |||||||||||||||||
| Contingent liability revaluation | (359) | 94 | 81 | |||||||||||||||||
| Amortization of contract assets | 1,250 | — | 1,386 | |||||||||||||||||
| Adjusted Gross profit (loss) (Non-GAAP) | $ 2,647 | $ (226) | $ (522) | |||||||||||||||||
| Net income (loss) | $ 21,343 | $ (10,724) | $ (19,026) | |||||||||||||||||
| Interest expense | 1,672 | 668 | 2,465 | |||||||||||||||||
| Income tax expense (benefit) | 9 | (4) | (123) | |||||||||||||||||
| Depreciation and amortization | 176 | 195 | 180 | |||||||||||||||||
| EBITDA (Non-GAAP) | $ 23,200 | $ (9,865) | $ (16,504) | |||||||||||||||||
| Stock compensation expense | (1,112) | 739 | 1,062 | |||||||||||||||||
| Severance and retirement | 2,238 | (4) | — | |||||||||||||||||
| Contingent liability revaluation | (359) | 94 | 81 | |||||||||||||||||
| (Gain) loss on disposal of assets | — | 8 | (1,000) | |||||||||||||||||
| Gain on lease termination | — | (584) | — | |||||||||||||||||
| Contract Consideration Convertible Notes Payable revaluation adjustment | (26,095) | 3,892 | 8,941 | |||||||||||||||||
| Amortization of contract assets | 1,250 | — | 1,386 | |||||||||||||||||
| PPP loan forgiveness | (4,522) | — | — | |||||||||||||||||
| Non-Recurring professional fees | 1,549 | 274 | 955 | |||||||||||||||||
| Adjusted EBITDA (Non-GAAP) | $ (3,851) | $ (5,446) | $ (5,079) | |||||||||||||||||
(1) Management believes that adjusted gross profit and adjusted EBITDA for the three months ended March 31, 2023 and 2022, and the three months ended December 31, 2022, are useful to investors to assess and understand operating performance, especially when comparing those results with previous and subsequent periods. Management views the expenses noted above to be outside of the Company’s normal operating results. Management analyzes operating results without the impact of the above items as an indicator of performance, to identify underlying trends in the business and cash flow from continuing operations, and to establish operational goals.
9
Investor Summary May 2023 // NYSE: FTK
Forward-Looking Statements Certain statements set forth in this presentation constitute forward-looking statements (within the meaning of Section 27A of the Securities Act of 1933 and Section 21E of the Securities Exchange Act of 1934) regarding Flotek Industries, Inc.’s business, financial condition, results of operations and prospects. Words such as will, continue, expects, anticipates, intends, plans, believes, seeks, estimates and similar expressions or variations of such words are intended to identify forward-looking statements, but are not the exclusive means of identifying forward-looking statements in this press release. Although forward- looking statements in this presentation reflect the good faith judgment of management, such statements can only be based on facts and factors currently known to management. Consequently, forward-looking statements are inherently subject to risks and uncertainties, and actual results and outcomes may differ materially from the results and outcomes discussed in the forward-looking statements. Further information about the risks and uncertainties that may impact the Company are set forth in the Company’s most recent filing with the Securities and Exchange Commission on Form 10-K (including, without limitation, in the "Risk Factors" section thereof), and in the Company’s other SEC filings and publicly available documents. Readers are urged not to place undue reliance on these forward-looking statements, which speak only as of the date of this presentation. The Company undertakes no obligation to revise or update any forward-looking statements in order to reflect any event or circumstance that may arise after the date of this presentation. Investor Presentation / May 2023 // 2
FLOTEK INDUSTRIES (FTK) Technology-driven chemistry and data analytics company Founded: 1985 Employees: 143 Countries with Clients: 15+ Corporate Headquarters: Houston Company Overview Commercial and Industrial Chemistry Technologies Sustainable chemistry solutions to maximize customers value chain while minimizing their environmental impact. Digital Technologies & Data Analytics Transforming business through real-time data, monitoring and visualization across the energy value chain. Abu Dhabi, UAE Raceland, LA Houston, TX (HQ) Marlow, OK Monahans, TX Headquarters Offices Chemical Technologies Data Analytics Investor Presentation / May 2023 // 3
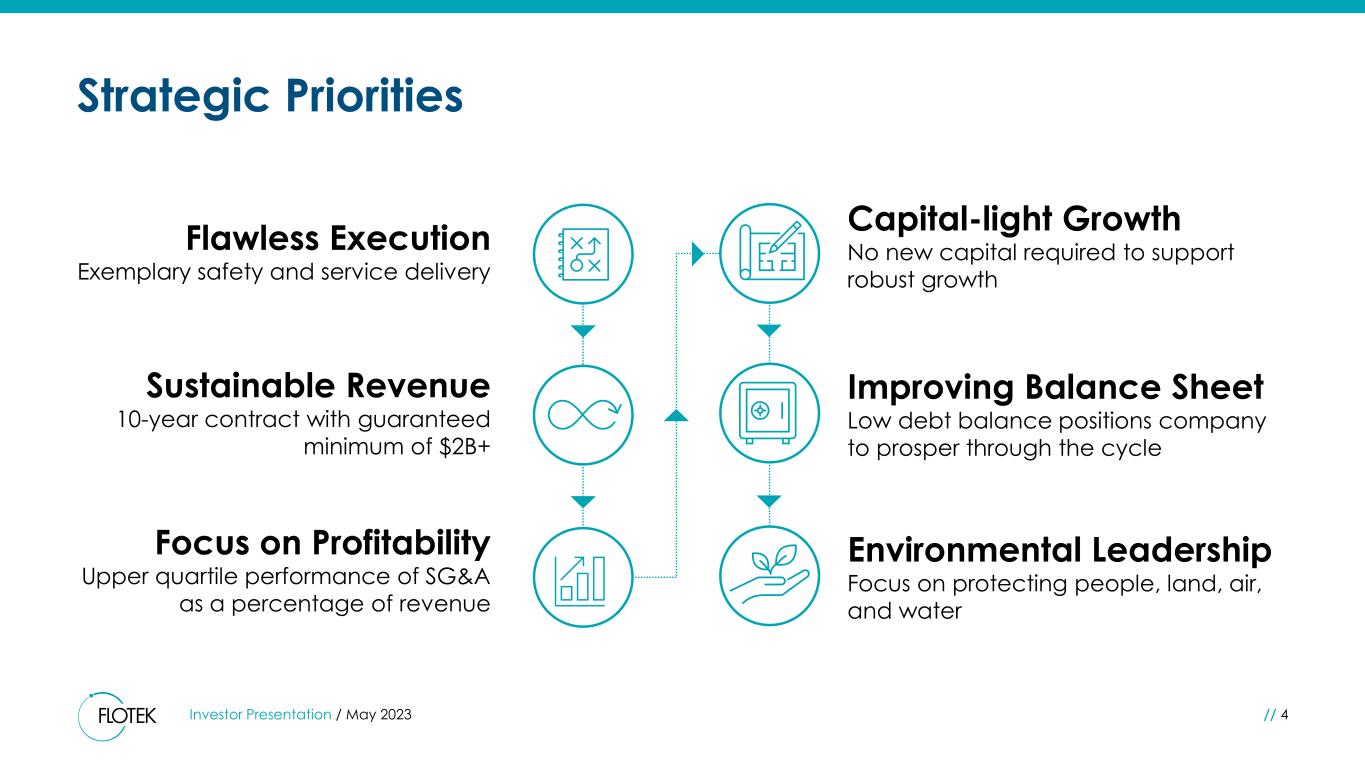
Strategic Priorities Flawless Execution Exemplary safety and service delivery Capital-light Growth No new capital required to support robust growth Environmental Leadership Focus on protecting people, land, air, and water Investor Presentation / May 2023 // 4 Sustainable Revenue 10-year contract with guaranteed minimum of $2B+ Focus on Profitability Upper quartile performance of SG&A as a percentage of revenue Improving Balance Sheet Low debt balance positions company to prosper through the cycle
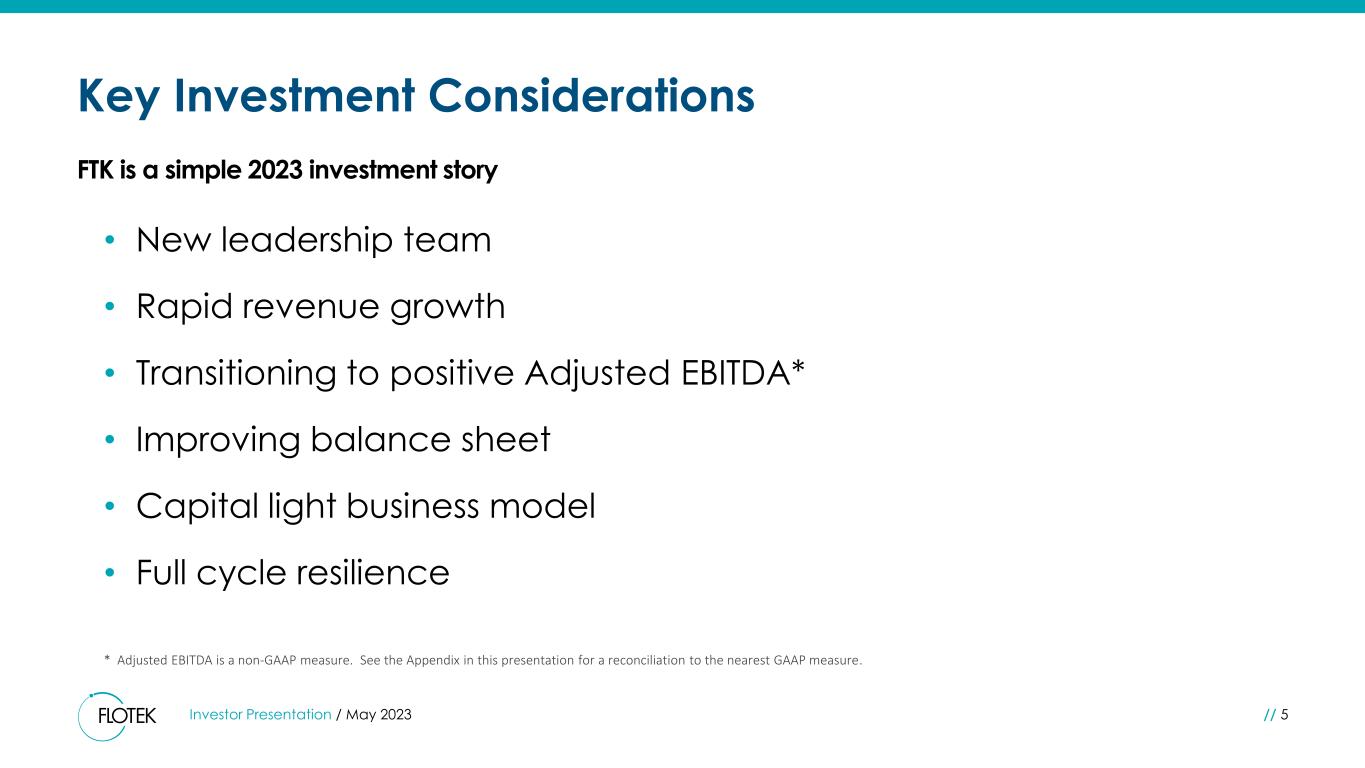
Key Investment Considerations Investor Presentation / May 2023 // 5 • New leadership team • Rapid revenue growth • Transitioning to positive Adjusted EBITDA* • Improving balance sheet • Capital light business model • Full cycle resilience FTK is a simple 2023 investment story * Adjusted EBITDA is a non-GAAP measure. See the Appendix in this presentation for a reconciliation to the nearest GAAP measure.
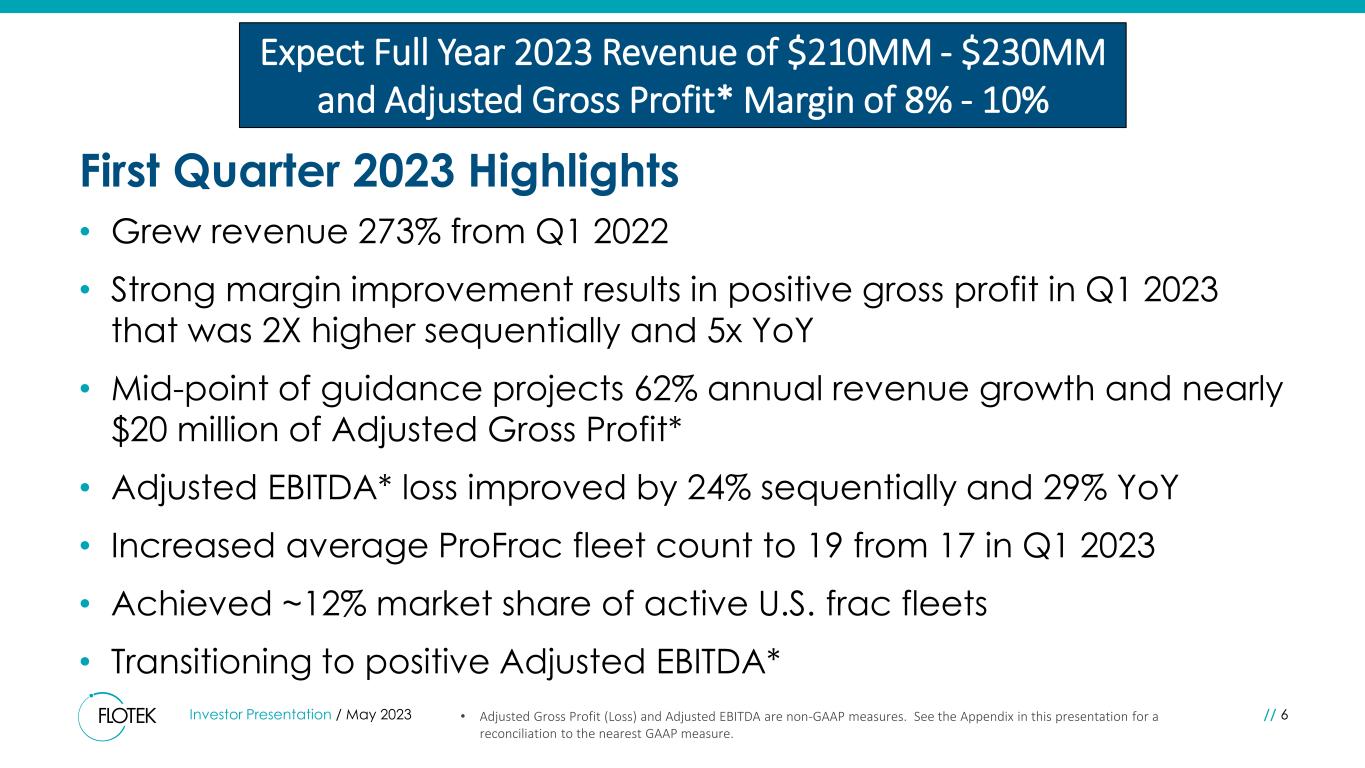
First Quarter 2023 Highlights Investor Presentation / May 2023 // 6 • Grew revenue 273% from Q1 2022 • Strong margin improvement results in positive gross profit in Q1 2023 that was 2X higher sequentially and 5x YoY • Mid-point of guidance projects 62% annual revenue growth and nearly $20 million of Adjusted Gross Profit* • Adjusted EBITDA* loss improved by 24% sequentially and 29% YoY • Increased average ProFrac fleet count to 19 from 17 in Q1 2023 • Achieved ~12% market share of active U.S. frac fleets • Transitioning to positive Adjusted EBITDA* Expect Full Year 2023 Revenue of $210MM - $230MM and Adjusted Gross Profit* Margin of 8% - 10% • Adjusted Gross Profit (Loss) and Adjusted EBITDA are non-GAAP measures. See the Appendix in this presentation for a reconciliation to the nearest GAAP measure.
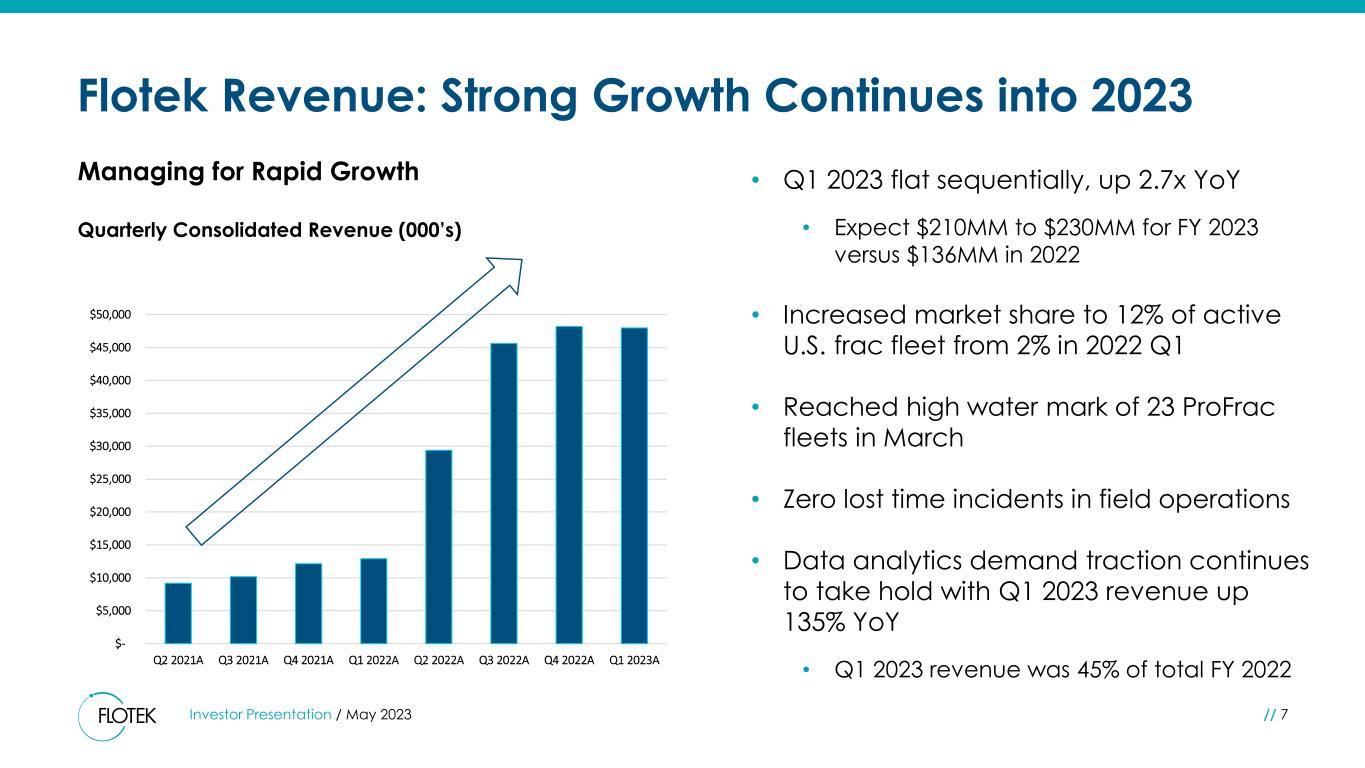
Flotek Revenue: Strong Growth Continues into 2023 Managing for Rapid Growth Investor Presentation / May 2023 // 7 • Q1 2023 flat sequentially, up 2.7x YoY • Expect $210MM to $230MM for FY 2023 versus $136MM in 2022 • Increased market share to 12% of active U.S. frac fleet from 2% in 2022 Q1 • Reached high water mark of 23 ProFrac fleets in March • Zero lost time incidents in field operations • Data analytics demand traction continues to take hold with Q1 2023 revenue up 135% YoY • Q1 2023 revenue was 45% of total FY 2022 Quarterly Consolidated Revenue (000’s) $- $5,000 $10,000 $15,000 $20,000 $25,000 $30,000 $35,000 $40,000 $45,000 $50,000 Q2 2021A Q3 2021A Q4 2021A Q1 2022A Q2 2022A Q3 2022A Q4 2022A Q1 2023A
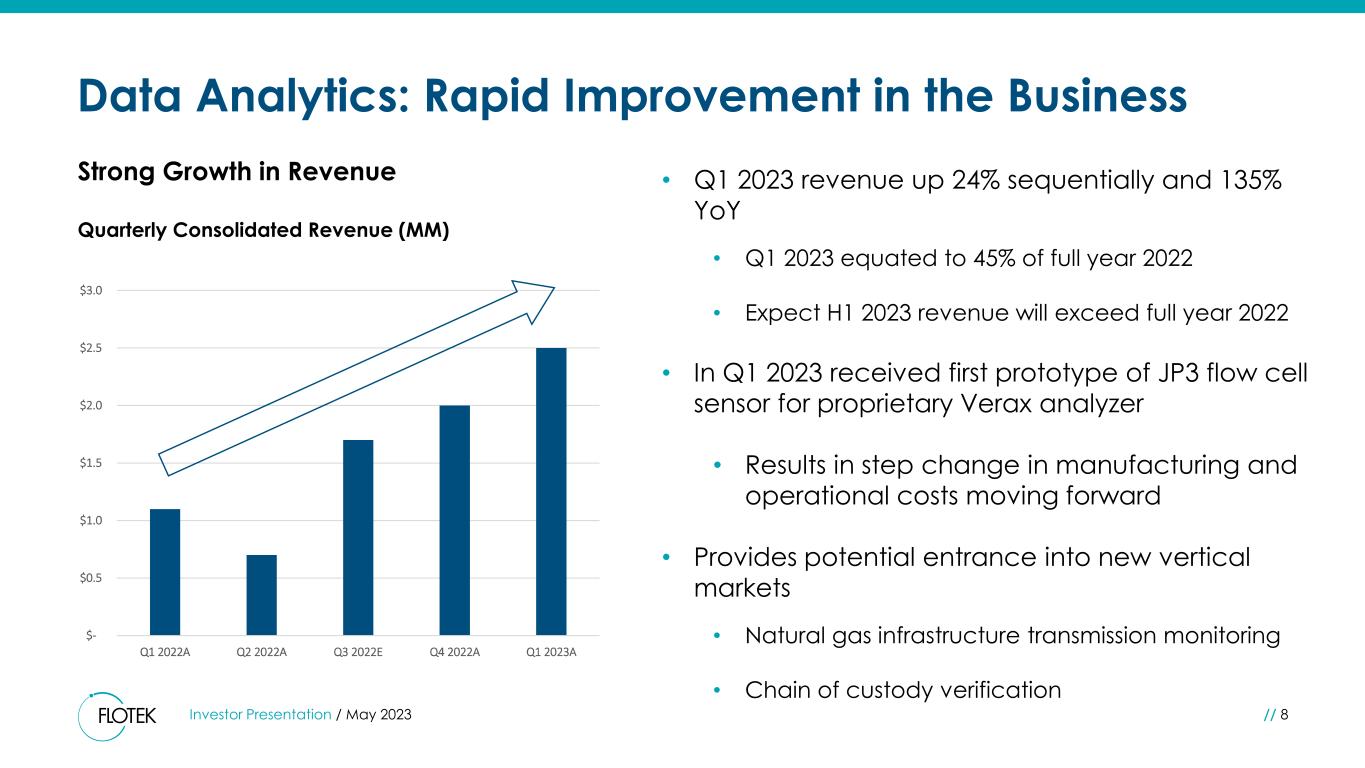
Data Analytics: Rapid Improvement in the Business Strong Growth in Revenue Quarterly Consolidated Revenue (MM) Investor Presentation / May 2023 // 8 • Q1 2023 revenue up 24% sequentially and 135% YoY • Q1 2023 equated to 45% of full year 2022 • Expect H1 2023 revenue will exceed full year 2022 • In Q1 2023 received first prototype of JP3 flow cell sensor for proprietary Verax analyzer • Results in step change in manufacturing and operational costs moving forward • Provides potential entrance into new vertical markets • Natural gas infrastructure transmission monitoring • Chain of custody verification $- $0.5 $1.0 $1.5 $2.0 $2.5 $3.0 Q1 2022A Q2 2022A Q3 2022E Q4 2022A Q1 2023A
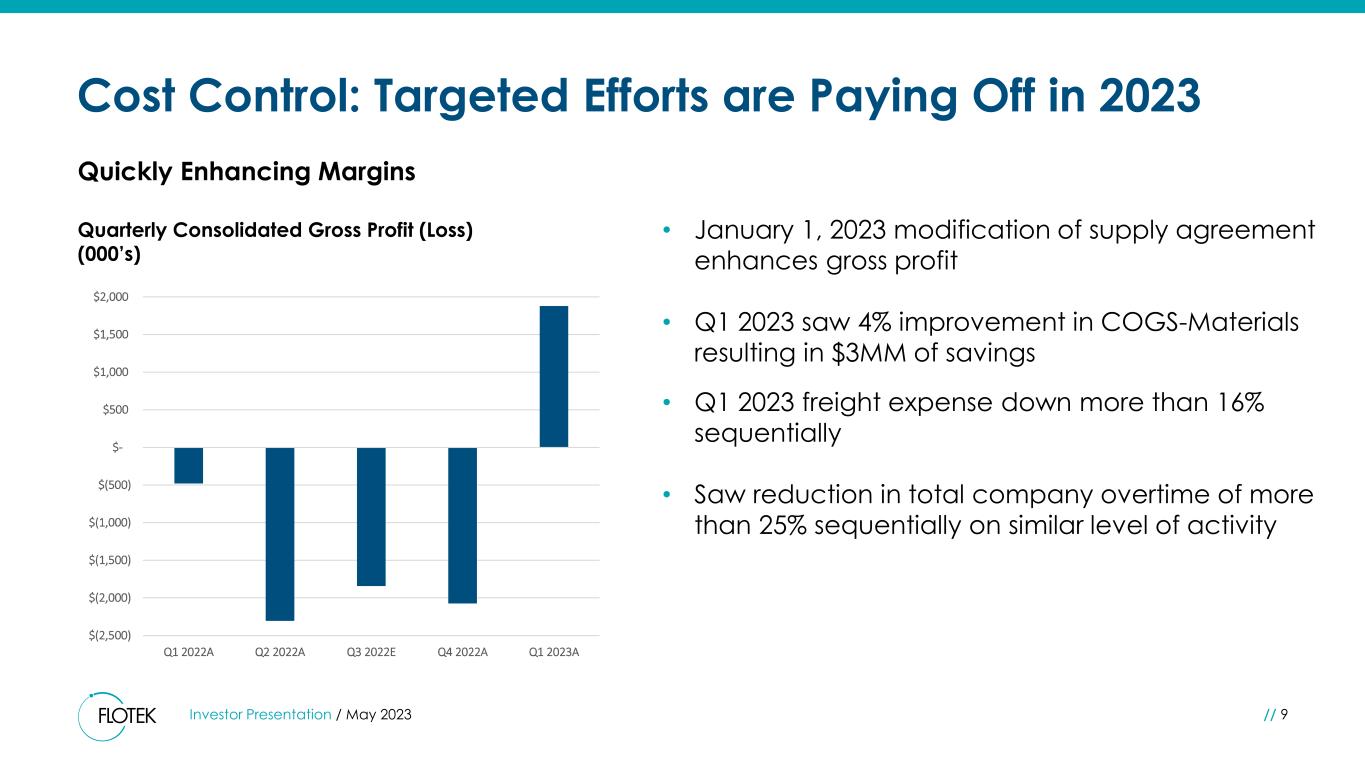
Cost Control: Targeted Efforts are Paying Off in 2023 Quickly Enhancing Margins Quarterly Consolidated Gross Profit (Loss) (000’s) Investor Presentation / May 2023 // 9 • January 1, 2023 modification of supply agreement enhances gross profit • Q1 2023 saw 4% improvement in COGS-Materials resulting in $3MM of savings • Q1 2023 freight expense down more than 16% sequentially • Saw reduction in total company overtime of more than 25% sequentially on similar level of activity $(2,500) $(2,000) $(1,500) $(1,000) $(500) $- $500 $1,000 $1,500 $2,000 Q1 2022A Q2 2022A Q3 2022E Q4 2022A Q1 2023A
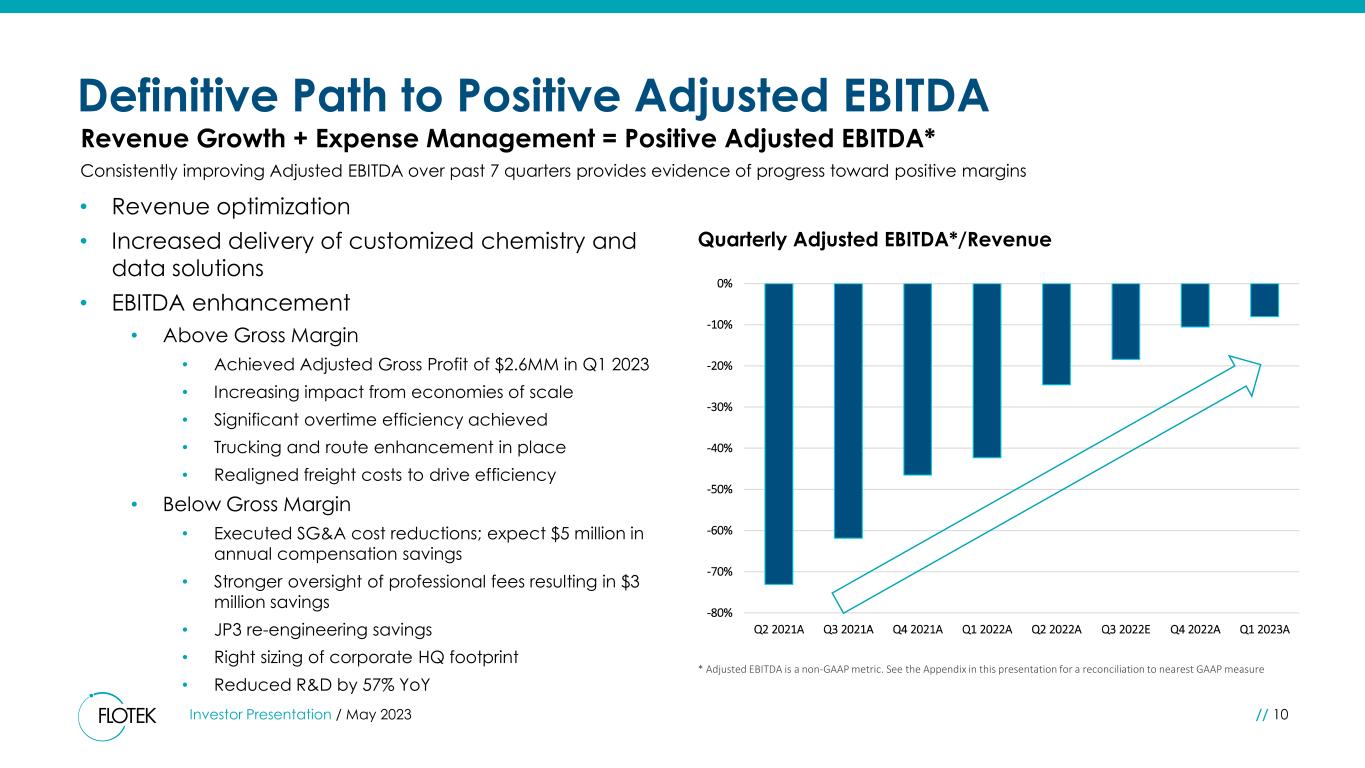
Definitive Path to Positive Adjusted EBITDA Revenue Growth + Expense Management = Positive Adjusted EBITDA* Investor Presentation / May 2023 // 10 Quarterly Adjusted EBITDA*/Revenue Consistently improving Adjusted EBITDA over past 7 quarters provides evidence of progress toward positive margins • Revenue optimization • Increased delivery of customized chemistry and data solutions • EBITDA enhancement • Above Gross Margin • Achieved Adjusted Gross Profit of $2.6MM in Q1 2023 • Increasing impact from economies of scale • Significant overtime efficiency achieved • Trucking and route enhancement in place • Realigned freight costs to drive efficiency • Below Gross Margin • Executed SG&A cost reductions; expect $5 million in annual compensation savings • Stronger oversight of professional fees resulting in $3 million savings • JP3 re-engineering savings • Right sizing of corporate HQ footprint • Reduced R&D by 57% YoY * Adjusted EBITDA is a non-GAAP metric. See the Appendix in this presentation for a reconciliation to nearest GAAP measure -80% -70% -60% -50% -40% -30% -20% -10% 0% Q2 2021A Q3 2021A Q4 2021A Q1 2022A Q2 2022A Q3 2022E Q4 2022A Q1 2023A
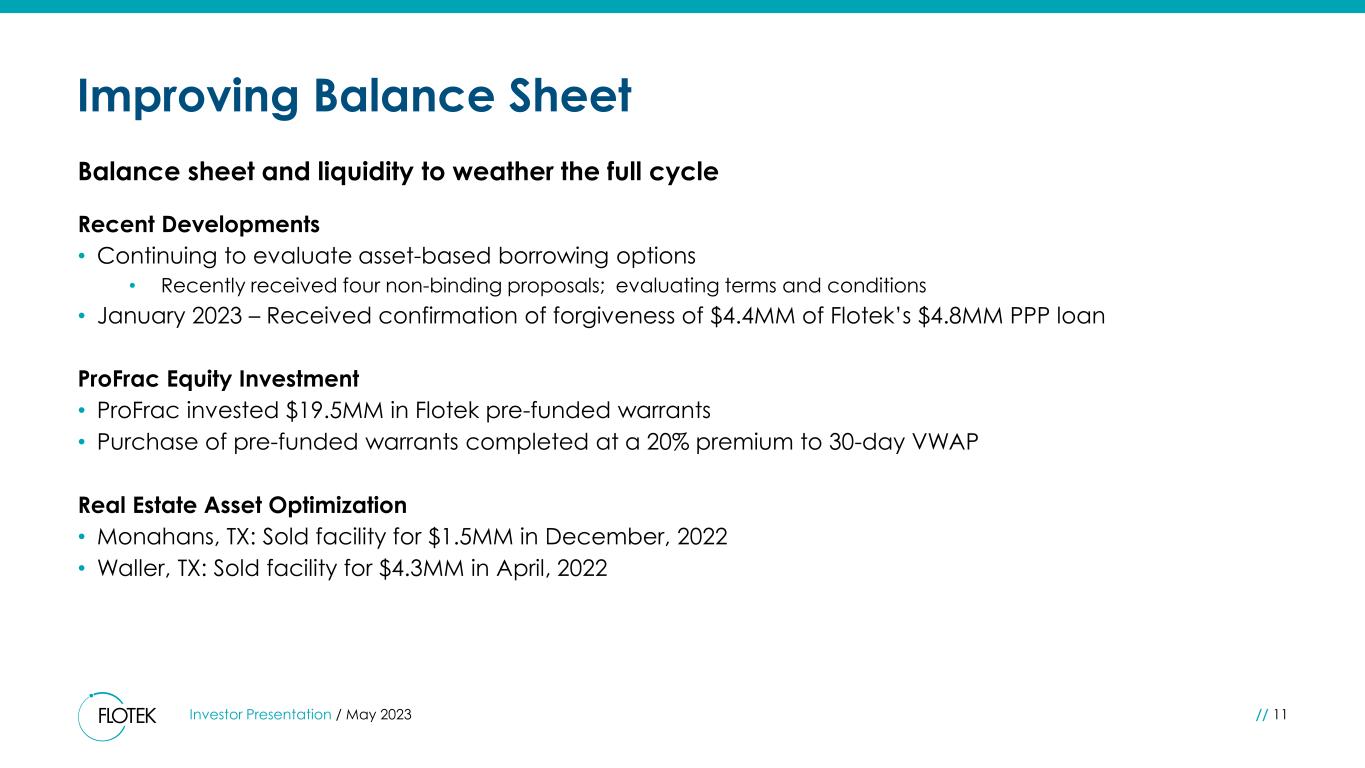
Improving Balance Sheet Recent Developments • Continuing to evaluate asset-based borrowing options • Recently received four non-binding proposals; evaluating terms and conditions • January 2023 – Received confirmation of forgiveness of $4.4MM of Flotek’s $4.8MM PPP loan ProFrac Equity Investment • ProFrac invested $19.5MM in Flotek pre-funded warrants • Purchase of pre-funded warrants completed at a 20% premium to 30-day VWAP Real Estate Asset Optimization • Monahans, TX: Sold facility for $1.5MM in December, 2022 • Waller, TX: Sold facility for $4.3MM in April, 2022 Balance sheet and liquidity to weather the full cycle Investor Presentation / May 2023 // 11
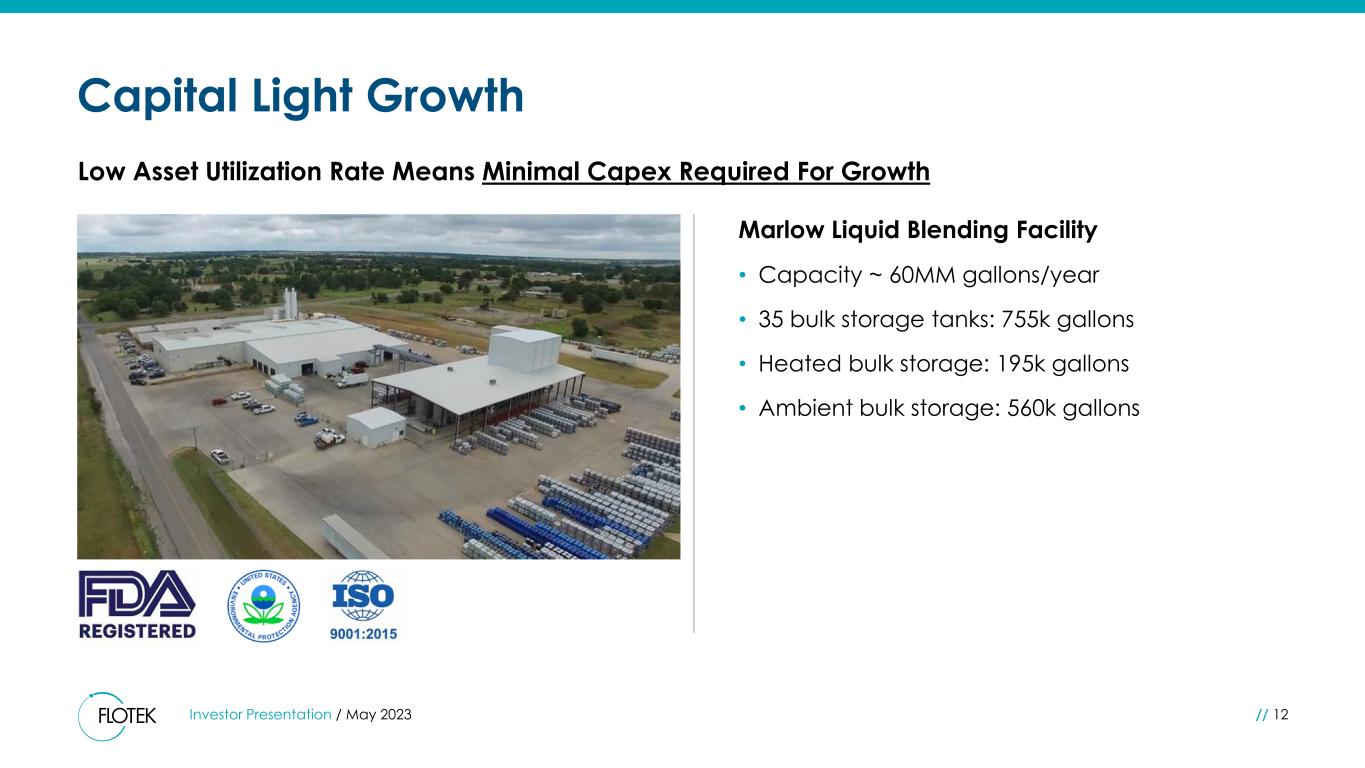
Capital Light Growth Marlow Liquid Blending Facility • Capacity ~ 60MM gallons/year • 35 bulk storage tanks: 755k gallons • Heated bulk storage: 195k gallons • Ambient bulk storage: 560k gallons Low Asset Utilization Rate Means Minimal Capex Required For Growth Investor Presentation / May 2023 // 12
// NYSE: FTK Appendix
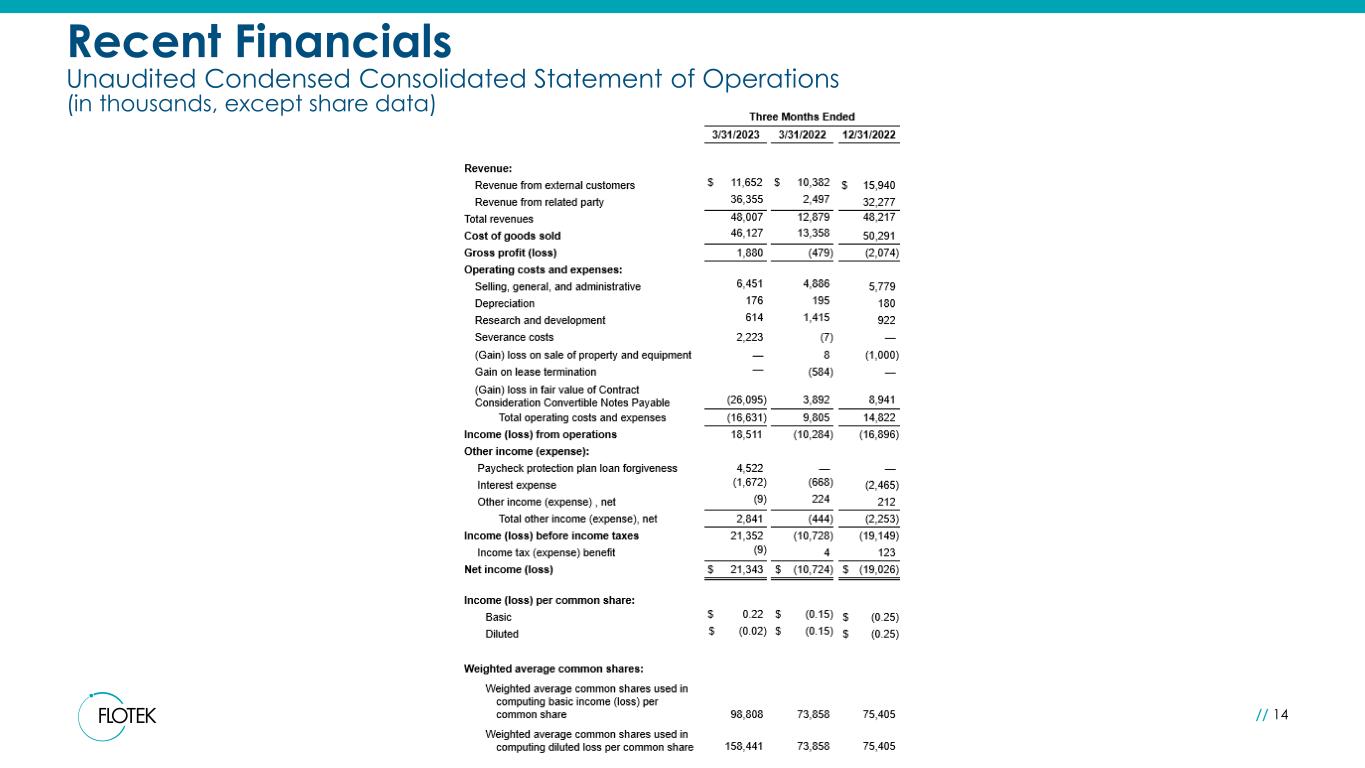
Recent Financials Unaudited Condensed Consolidated Statement of Operations (in thousands, except share data) // 14
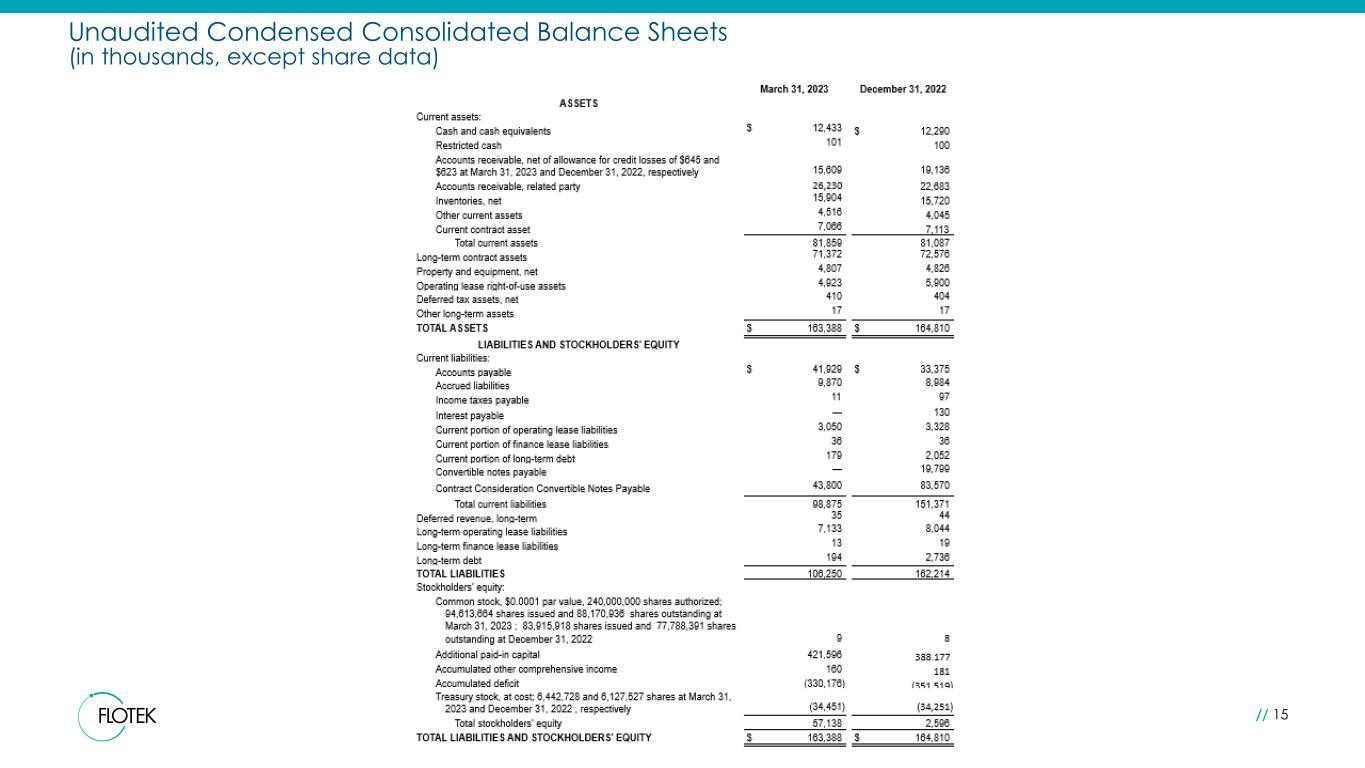
Unaudited Condensed Consolidated Balance Sheets (in thousands, except share data) // 15
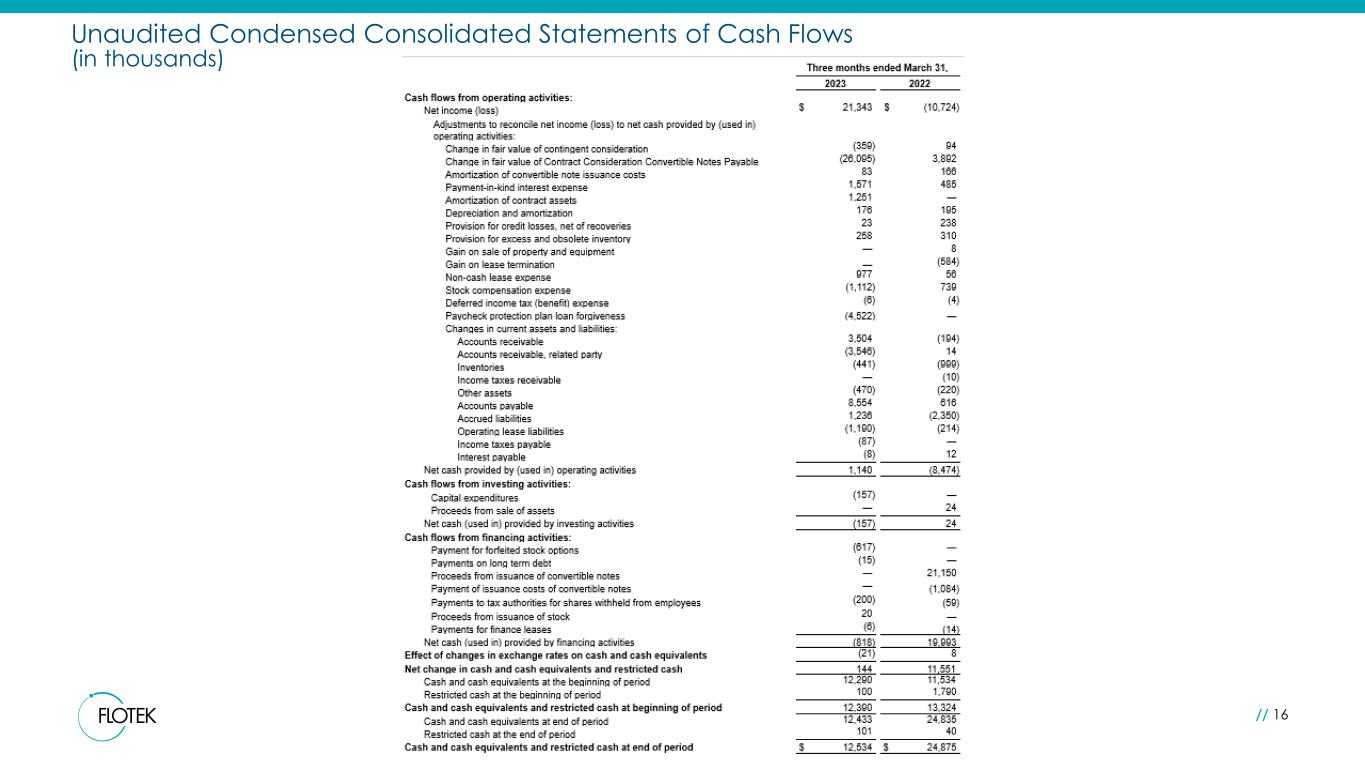
Unaudited Condensed Consolidated Statements of Cash Flows (in thousands) // 16
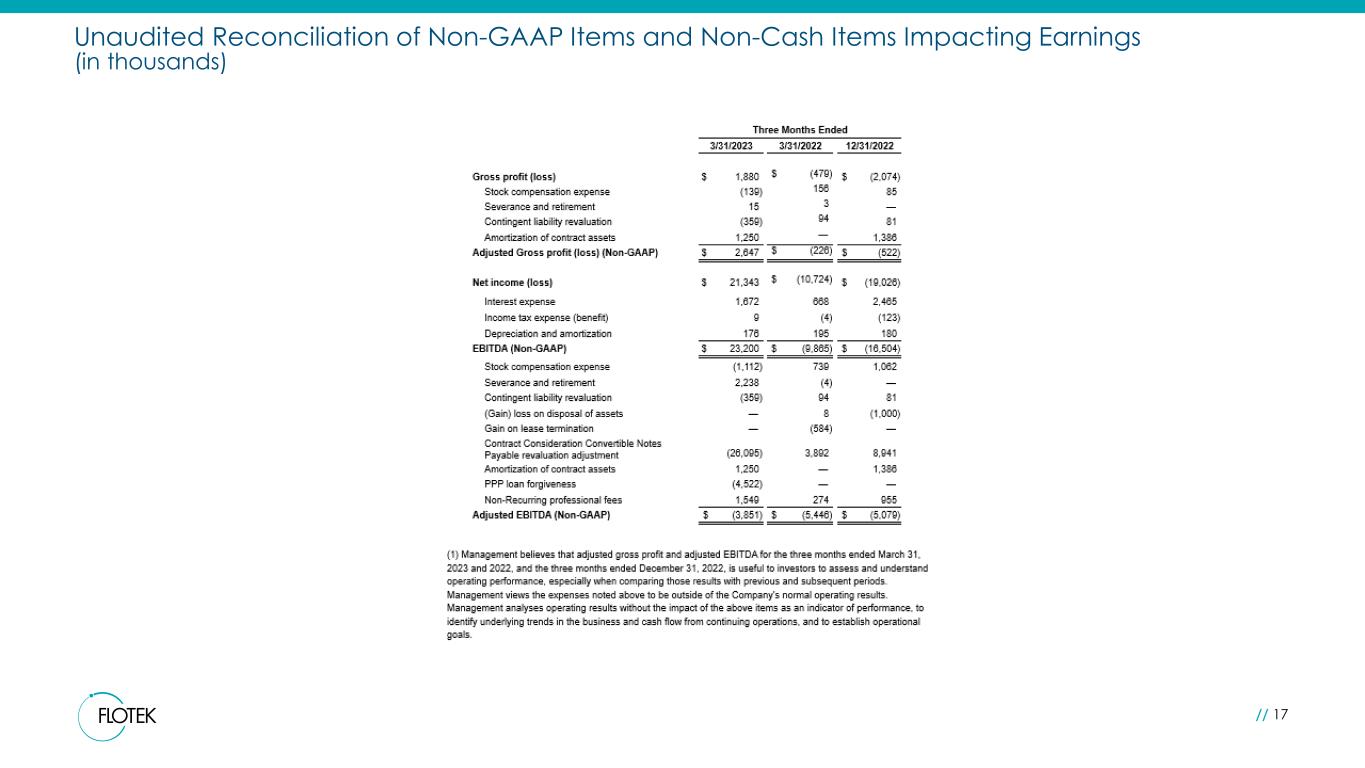
Unaudited Reconciliation of Non-GAAP Items and Non-Cash Items Impacting Earnings (in thousands) // 17