
FTK 8-K
Flotek Industries Inc/Cn/ (FTK)
8-K
2021-05-11
For: 2021-05-10
View Original
Added on
April 11, 2026
UNITED STATES
SECURITIES AND EXCHANGE COMMISSION
Washington, D.C. 20549
FORM 8-K
CURRENT REPORT
Pursuant to Section 13 or 15(d) of the Securities Exchange Act of 1934
Date of Report (Date of earliest event reported)
(Exact name of registrant as specified in its charter)
| (State or Other Jurisdiction of Incorporation) | (Commission File Number) | (IRS Employer Identification No.) | ||||||
(Address of principal executive office and zip code)
(713 ) 849-9911
(Registrant’s telephone number, including area code)
(Not applicable)
(Former name or former address, if changed since last report)
Check the appropriate box below if the Form 8-K filing is intended to simultaneously satisfy the filing obligation of the registrant under any of the following provisions:
Securities registered pursuant to Section 12(b) of the Act:
| Title of each class | Trading Symbol(s) | Name of Exchange on which registered | ||||||
Indicate by check mark whether the registrant is an emerging growth company as defined in Rule 405 of the Securities Act of 1933 (§230.405 of this chapter) or Rule 12b-2 of the Securities Exchange Act of 1934 (§240.12b-2 of this chapter).
Emerging growth company ☐
If an emerging growth company, indicate by check mark if the registrant has elected not to use the extended transition period for complying with any new or revised financial accounting standards provided pursuant to Section 13(a) of the Exchange Act. ☐
Item 2.02. Results of Operations and Financial Condition.
On May 10, 2021, Flotek Industries, Inc. (the “Company”) issued a press release providing its financial results for the quarter ended March 31, 2021 and announcing that it will hold a conference call to discuss its operating results. The press release is furnished herewith as Exhibit 99.1 to this Current Report on Form 8-K and is incorporated herein by reference.
The information furnished pursuant to Item 2.02 of this Current Report on Form 8-K and in Exhibit 99.1 shall not be deemed to be “filed” for the purposes of Section 18 of the Securities Exchange Act of 1934, as amended (the “Exchange Act”), is not subject to the liabilities of that section and is not deemed incorporated by reference into any filing of the Company under the Securities Act of 1933, as amended, or the Exchange Act, except as otherwise expressly stated in such filing.
Item 7.01 Regulation FD Disclosure.
On May 10, 2021, the Company provided on its website a presentation containing information relating to its current operations and financial results. A copy of the presentation is attached hereto as Exhibit 99.2 and is incorporated herein by reference.
The information furnished pursuant to Item 7.01 of this Current Report on 8-K and in Exhibit 99.2 shall not be deemed to be “filed” for the purposes of Section 18 of the Exchange Act, is not subject to the liabilities of that section and is not deemed incorporated by reference into any filing of the Company under the Securities Act of 1933, as amended, or the Exchange Act, except as otherwise expressly stated in such filing.
Item 9.01. Financial Statements and Exhibits.
(d) Exhibits.
| Exhibit Number | Description | |||||||
| 99.1 | ||||||||
| 99.2 | ||||||||
SIGNATURES
Pursuant to the requirements of the Securities Exchange Act of 1934, the registrant has duly caused this report to be signed on its behalf by the undersigned hereunto duly authorized.
| FLOTEK INDUSTRIES, INC. | ||||||||||||||
| Date: May 11, 2021 | /s/ Nicholas J. Bigney | |||||||||||||
| Name: | Nicholas J. Bigney | |||||||||||||
| Title: | Senior Vice President, General Counsel & Chief Compliance Officer | |||||||||||||
FLOTEK ANNOUNCES FIRST QUARTER 2021 RESULTS Q1’21 EBITDA Improves Sequentially HOUSTON, May 10, 2021 – Flotek Industries, Inc. ("Flotek" or the "Company") (NYSE: FTK) today announced results for the first three months ended March 31, 2021. John W. Gibson, Jr., Chairman, President, and Chief Executive Officer stated: “While we experienced a slow start to the quarter due to the continued challenging macro-environment and impacts of Winter Storm Uri, we are pleased with our progress through the quarter as demand significantly increased across both segments towards the end of the quarter and continued into this quarter. We are excited about the momentum we have and are optimistic about our opportunities for growth across our business as the market continues its recovery in the latter half of the year. “We are accelerating our ESG solutions, which we believe will be a key growth driver as the energy market increases its focus on ESG amid an evolving regulatory framework. Over the years, we have built a leading position as a developer of green chemistry solutions, and we are delivering our suite of greener chemistry and data solutions to meet our customers’ evolving needs today. Additionally, we continue to see significant opportunities in international markets and are optimistic about the momentum we are gaining in key growth markets. Lastly, we are strengthening our liquidity to improve our financial flexibility. As a result of these actions, we continue to be confident in our long-term strategy, and I look forward to working with our outstanding leadership team to further improve operational and financial performance.” First Quarter Financial Results • Consolidated Revenues: Flotek generated first quarter 2021 consolidated revenue of $11.8 million, down 2.8% from $12.1 million in the fourth quarter, and below $19.4 million in the first quarter last year. The year-over-year decrease in revenue was driven by trends in the macro-environment for U.S. onshore drilling and completion activity and the COVID-19 pandemic continues to pressure productivity and global customer demand. • Consolidated Operating Expenses: Consolidated operating expenses (excluding depreciation and amortization) were $13.8 million in the first quarter 2021, a 39.6% decline from $22.8 million in the same period last year and a 43.3% decline from the prior quarter. The year-over-year decline was driven by a reduction in costs of sales due to lower sales, as well as lower operating expense driven by consolidation of corporate facilities, reduction of equipment rentals, lowered personnel costs and supply chain expenses. • Corporate General & Administrative Expenses (CG&A): Corporate general and administrative expenses for the first quarter of 2021 were $4.4 million, compared to $4.5 million for the first quarter of 2020 and $3.7 million for the fourth quarter of 2020. The year-over-year decline was primarily driven by lower personnel and severance costs that occurred in the first quarter 2020, as well as a reduction in occupancy costs as the Company moved out of its corporate headquarters and consolidated its Global Research & Innovation Center. The sequential increase was primarily driven by an increase in one-time legal, accounting and other professional fees, offset by a decrease in compensation. • Adjusted EBITDA: Adjusted EBITDA for the first quarter 2021 was a loss of $6.6 million, slightly below the $6.8 million loss in the fourth quarter of 2020, driven by an increase in one-time professional fees, offset by lower compensation. • Loss from Operations: The Company reported a loss from operations for the first quarter 2021 of $8.3 million, or a loss of $0.12 per basic/diluted share, compared to a loss from operations in the first quarter 2020 of $64.0 million, or a loss of $1.07 per basic/diluted share which included a non- Exhibit 99.1
recurring charge of $57.5 million related to the impairment of property, plant, and equipment, right-of- use assets, and intangible assets. Balance Sheet and Liquidity As of March 31, 2021, the Company had cash and equivalents of $33.9 million, with significant year-over- year improvements in cash usage driven by operational efficiencies across the business. Flotek also had a combined $5.7 million of loans outstanding pursuant to the Paycheck Protection Program (“PPP”) related to the “Cares Act.” Chemistry Technologies Segment: Energy Chemistries & Professional Chemistries In the first quarter, sales in the Chemistry Technologies segment declined sequentially 5.0% to $10.3 million. The decrease was primarily a result of continued market volatility in the macro-environment impacting energy supply and major disruption in February from Winter Storm Uri, impacting the entire supply chain. The segment experienced notable pickup in March as demand significantly increased. Highlights from the quarter include: • Despite the winter storm in February, the Company saw a rebound in its domestic energy chemistries business, up 56%, on a sequential basis. Internationally, following headwinds in market activity and purchasing delays, the Company regained traction towards the end of the quarter. • The Company engaged with C-Suite leaders at E&Ps to reintroduce the Company’s Environmental, Social and Governance-focused (ESG) value proposition to deliver cost-effective, environmentally friendly, safer chemistry solutions. • In the quarter, the Company initiated key field trial applications for its green, reservoir-centric chemistry technologies. • The Company hired Nathan Snoke as Vice President of Energy Chemistries. A global leader in differentiated oilfield services, Snoke joins the Company from Halliburton, where he was most recently Senior Region Manager of Europe, Eurasia, and Sub-Sahara Africa, based in London. Nathan brings more than 16 years of oil and gas experience to Flotek, ranging from field operations to senior-level management across multiple continents. • In the first quarter, Flotek launched its new professional chemistries brand, Flotek Protekol™, which includes a comprehensive line of surface cleaners, degreasers, wipes, disinfectants and sanitizers made in the USA. • Flotek formed a strategic agreement with a major global manufacturer of specialty and intermediate chemicals in the first quarter to produce and package EPA-registered disinfectant wipes. • The Company hired Matthew Sullivan as Vice President of Professional Chemistries to lead business development. Sullivan has more 30 years of janitorial and sanitizing sales and marketing expertise, including Georgia-Pacific, Clorox, Kimberly Clark and Scott Worldwide. Data Analytics Segment In the first quarter, Data Analytics’ sales improved 16.7% sequentially to $1.5 million, primarily driven by an increase in new equipment sales in North America. Flotek continued to enhance its offerings and increase its efficiency in delivering solutions, while targeting new customers and markets to transform their businesses through real-time data and analytics. Highlights include: • Added new customers and increased repeat purchases from existing customers, demonstrating the value JP3 delivers to its customers with the multi-applications of its technologies.
• Made progress on its international market entry strategy by continuing meaningful engagement with potential customers in the Middle East, Africa and Asia. During the first quarter, Flotek secured its second pilot in the Middle East and completed its site survey with its first international pilot. • Implemented software development enhancements by accelerating Artificial Intelligence (“AI”) and machine learning capabilities, improving the precision of measurement between batches of refined hydrocarbon products – reducing time, waste and money spent. During the first quarter, the company launched its first application using AI in batch interface for pipelines and successfully installed the application in two locations. • Accelerated discussions with customers on its “green benefits” portfolio of applications which helps companies reduce their carbon footprint, energy consumption and emissions. The Company will continue to help customers improve their ESG performance through its JP3 product offerings. Termination of Agreement with Florida Chemical Company As previously disclosed in an 8-K filing on March 29, 2021, Flotek Chemistry, LLC, a wholly-owned subsidiary of Flotek, delivered a notice of termination for the Supply Agreement between Flotek and Florida Chemical Company, LLC (FCC) dated February 28, 2019 following Florida Chemical’s refusal to allow Flotek to exercise its contractual rights to audit the books and records related to the cost of terpene purchased. Flotek believes it has sufficient terpene inventory and alternative terpene supply sources to meet its requirements and does not intend to purchase additional supplies of terpene from FCC. Going forward, the Company’s supply management strategy will align terpene purchases with its demand and does not expect that the termination of the Supply Agreement will have a material effect on its operations or ability to meet customer needs. Conference Call Details Flotek will host a conference call on Tuesday, May 11, 2021, at 9:00 am CDT (10:00 a.m. EDT) to discuss its first quarter results ended March 31, 2021. To participate in the call, participants should dial 844-835- 9986 approximately five minutes prior to the start of the call. The call can also be accessed from Flotek’s website at www.flotekind.com. About Flotek Industries, Inc. Flotek Industries, Inc. is a technology-driven, specialty chemistry and data company that helps customers across industrial, commercial and consumer markets improve their Environmental, Social and Governance performance. Flotek’s Chemistry Technologies segment develops, manufactures, packages, distributes, delivers, and markets high-quality cleaning, disinfecting and sanitizing products for commercial, governmental and personal consumer use. Additionally, Flotek empowers the energy industry to maximize the value of their hydrocarbon streams and improve return on invested capital through its real-time data platforms and green chemistry technologies. Flotek serves downstream, midstream and upstream customers, both domestic and international. Flotek is a publicly traded company headquartered in Houston, Texas, and its common shares are traded on the New York Stock Exchange under the ticker symbol "FTK." For additional information, please visit Flotek's web site at www.flotekind.com. Forward-Looking Statements Certain statements set forth in this press release constitute forward-looking statements (within the meaning of Section 27A of the Securities Act of 1933 and Section 21E of the Securities Exchange Act of
1934) regarding Flotek Industries, Inc.’s business, financial condition, results of operations and prospects. Words such as will, continue, expects, anticipates, intends, plans, believes, seeks, estimates and similar expressions or variations of such words are intended to identify forward-looking statements, but are not the exclusive means of identifying forward-looking statements in this press release. Although forward- looking statements in this press release reflect the good faith judgment of management, such statements can only be based on facts and factors currently known to management. Consequently, forward-looking statements are inherently subject to risks and uncertainties, and actual results and outcomes may differ materially from the results and outcomes discussed in the forward-looking statements. Further information about the risks and uncertainties that may impact the Company are set forth in the Company’s most recent filing with the Securities and Exchange Commission on Form 10-K (including, without limitation, in the "Risk Factors" section thereof), and in the Company’s other SEC filings and publicly available documents. Readers are urged not to place undue reliance on these forward-looking statements, which speak only as of the date of this press release. The Company undertakes no obligation to revise or update any forward-looking statements in order to reflect any event or circumstance that may arise after the date of this press release. Inquiries, contact: Danielle Allen Senior Vice President, Chief of Staff E: [email protected] P: (713) 726-5322
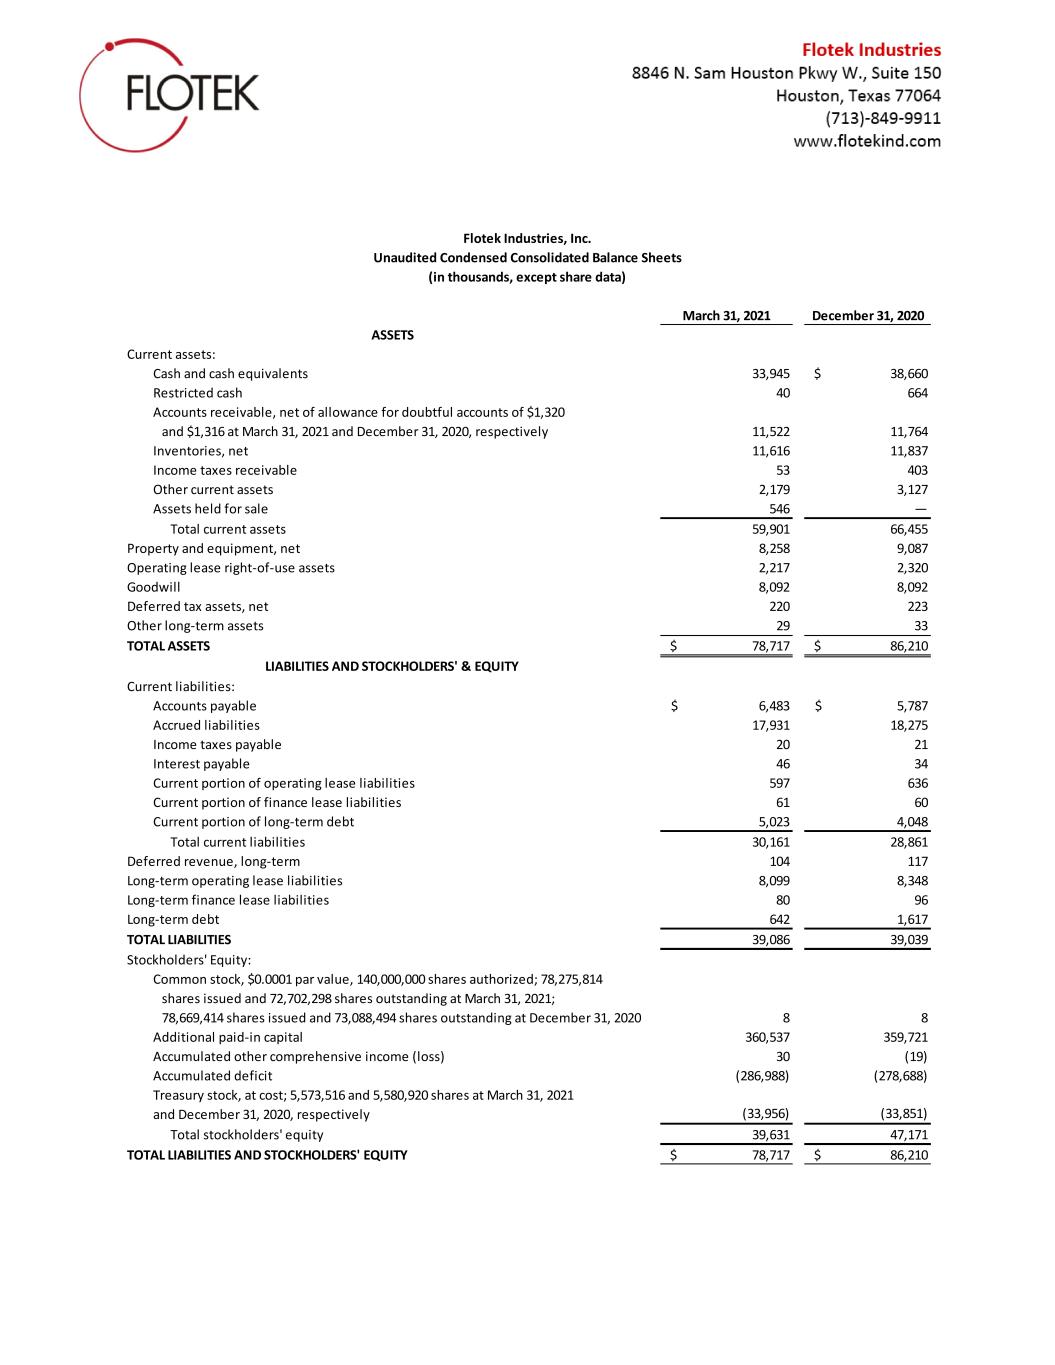
March 31, 2021 December 31, 2020 ASSETS Current assets: Cash and cash equivalents 33,945 $ 38,660 Restricted cash 40 664 Accounts receivable, net of allowance for doubtful accounts of $1,320 and $1,316 at March 31, 2021 and December 31, 2020, respectively 11,522 11,764 Inventories, net 11,616 11,837 Income taxes receivable 53 403 Other current assets 2,179 3,127 Assets held for sale 546 — Total current assets 59,901 66,455 Property and equipment, net 8,258 9,087 Operating lease right-of-use assets 2,217 2,320 Goodwill 8,092 8,092 Deferred tax assets, net 220 223 Other long-term assets 29 33 TOTAL ASSETS $ 78,717 $ 86,210 LIABILITIES AND STOCKHOLDERS' & EQUITY Current liabilities: Accounts payable $ 6,483 $ 5,787 Accrued liabilities 17,931 18,275 Income taxes payable 20 21 Interest payable 46 34 Current portion of operating lease liabilities 597 636 Current portion of finance lease liabilities 61 60 Current portion of long-term debt 5,023 4,048 Total current liabilities 30,161 28,861 Deferred revenue, long-term 104 117 Long-term operating lease liabilities 8,099 8,348 Long-term finance lease liabilities 80 96 Long-term debt 642 1,617 TOTAL LIABILITIES 39,086 39,039 Stockholders' Equity: Common stock, $0.0001 par value, 140,000,000 shares authorized; 78,275,814 shares issued and 72,702,298 shares outstanding at March 31, 2021; 78,669,414 shares issued and 73,088,494 shares outstanding at December 31, 2020 8 8 Additional paid-in capital 360,537 359,721 Accumulated other comprehensive income (loss) 30 (19) Accumulated deficit (286,988) (278,688) Treasury stock, at cost; 5,573,516 and 5,580,920 shares at March 31, 2021 and December 31, 2020, respectively (33,956) (33,851) Total stockholders' equity 39,631 47,171 TOTAL LIABILITIES AND STOCKHOLDERS' EQUITY $ 78,717 $ 86,210 Flotek Industries, Inc. Unaudited Condensed Consolidated Balance Sheets (in thousands, except share data)
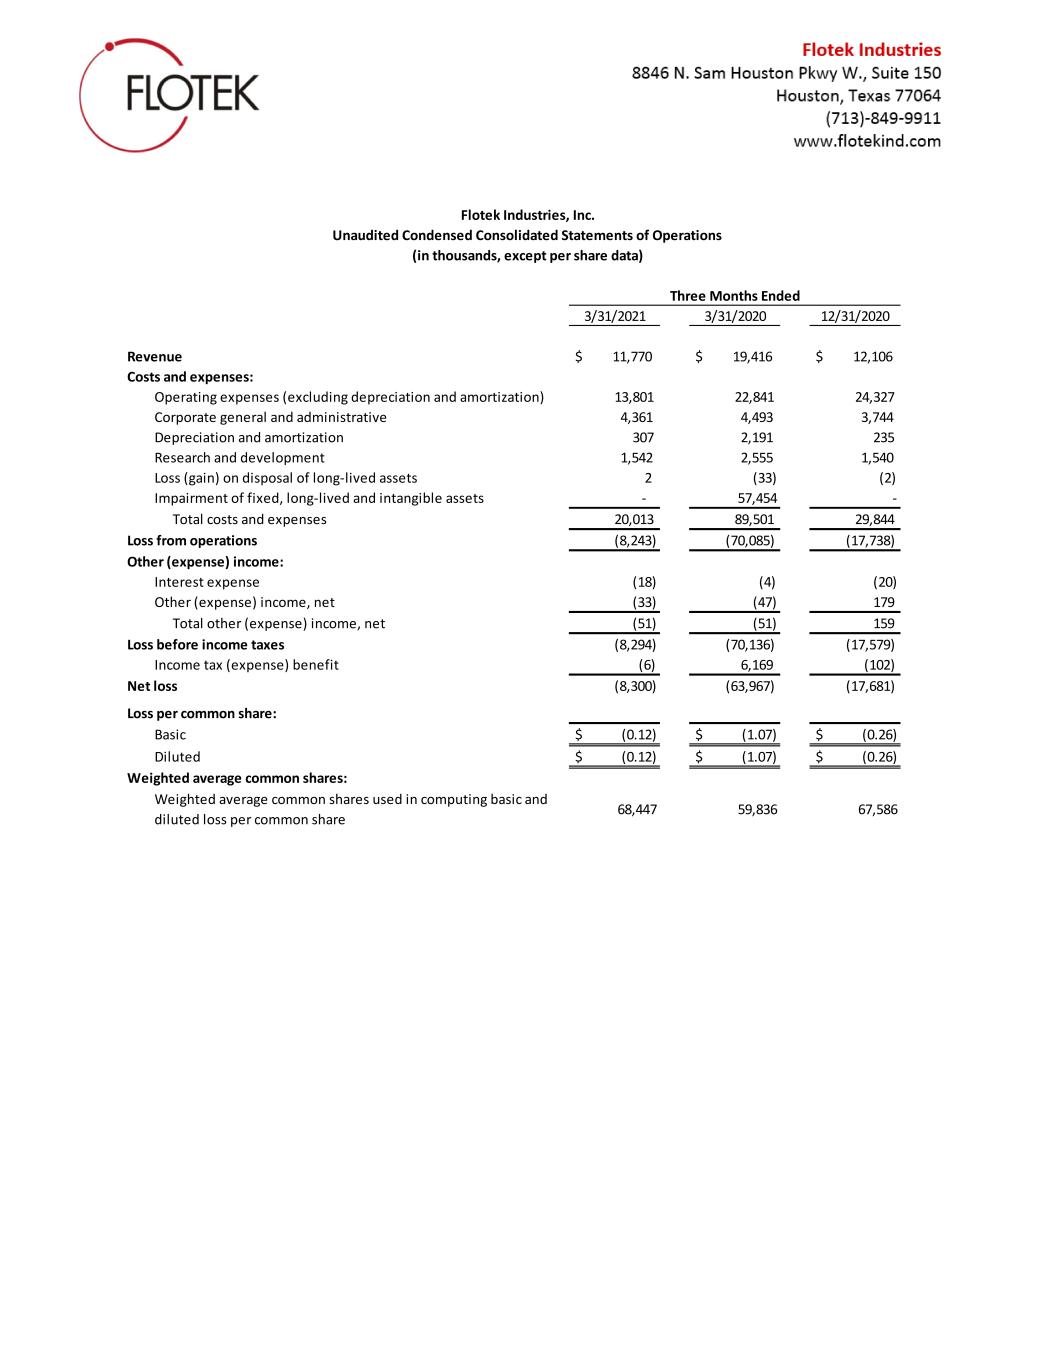
3/31/2021 3/31/2020 12/31/2020 Revenue $ 11,770 $ 19,416 $ 12,106 Costs and expenses: Operating expenses (excluding depreciation and amortization) 13,801 22,841 24,327 Corporate general and administrative 4,361 4,493 3,744 Depreciation and amortization 307 2,191 235 Research and development 1,542 2,555 1,540 Loss (gain) on disposal of long-lived assets 2 (33) (2) Impairment of fixed, long-lived and intangible assets - 57,454 - Total costs and expenses 20,013 89,501 29,844 Loss from operations (8,243) (70,085) (17,738) Other (expense) income: Interest expense (18) (4) (20) Other (expense) income, net (33) (47) 179 Total other (expense) income, net (51) (51) 159 Loss before income taxes (8,294) (70,136) (17,579) Income tax (expense) benefit (6) 6,169 (102) Net loss (8,300) (63,967) (17,681) Loss per common share: Basic $ (0.12) $ (1.07) $ (0.26) Diluted $ (0.12) $ (1.07) $ (0.26) Weighted average common shares: Weighted average common shares used in computing basic and diluted loss per common share 68,447 59,836 67,586 Three Months Ended Flotek Industries, Inc. Unaudited Condensed Consolidated Statements of Operations (in thousands, except per share data)
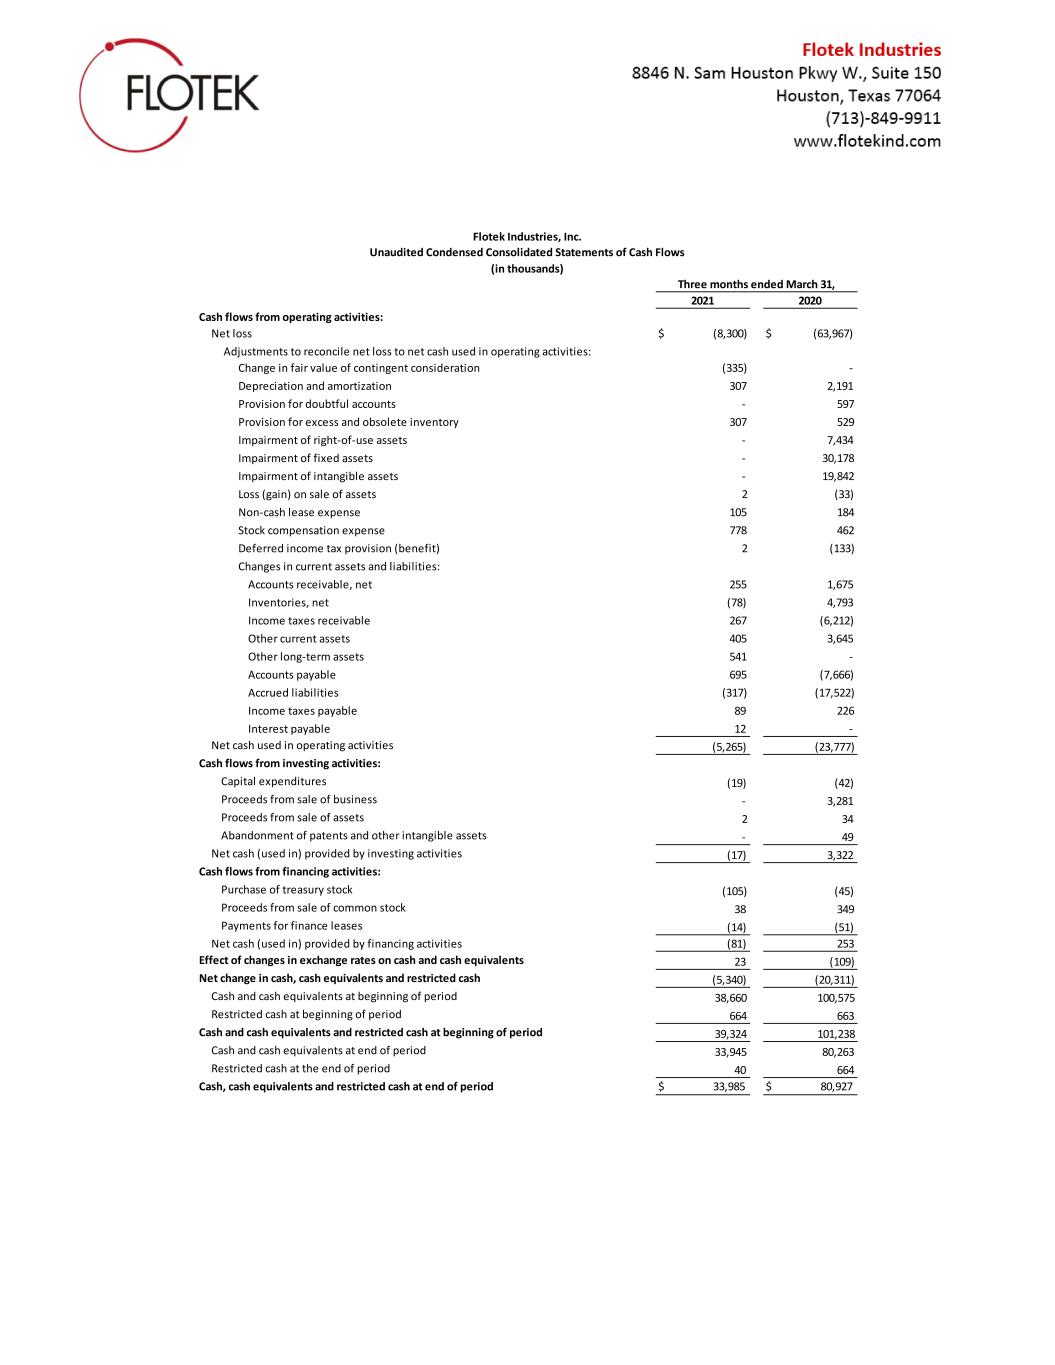
2021 2020 Cash flows from operating activities: Net loss $ (8,300) $ (63,967) Adjustments to reconcile net loss to net cash used in operating activities: Change in fair value of contingent consideration (335) - Depreciation and amortization 307 2,191 Provision for doubtful accounts - 597 Provision for excess and obsolete inventory 307 529 Impairment of right-of-use assets - 7,434 Impairment of fixed assets - 30,178 Impairment of intangible assets - 19,842 Loss (gain) on sale of assets 2 (33) Non-cash lease expense 105 184 Stock compensation expense 778 462 Deferred income tax provision (benefit) 2 (133) Changes in current assets and liabilities: Accounts receivable, net 255 1,675 Inventories, net (78) 4,793 Income taxes receivable 267 (6,212) Other current assets 405 3,645 Other long-term assets 541 - Accounts payable 695 (7,666) Accrued liabilities (317) (17,522) Income taxes payable 89 226 Interest payable 12 - Net cash used in operating activities (5,265) (23,777) Cash flows from investing activities: Capital expenditures (19) (42) Proceeds from sale of business - 3,281 Proceeds from sale of assets 2 34 Abandonment of patents and other intangible assets - 49 Net cash (used in) provided by investing activities (17) 3,322 Cash flows from financing activities: Purchase of treasury stock (105) (45) Proceeds from sale of common stock 38 349 Payments for finance leases (14) (51) Net cash (used in) provided by financing activities (81) 253 Effect of changes in exchange rates on cash and cash equivalents 23 (109) Net change in cash, cash equivalents and restricted cash (5,340) (20,311) Cash and cash equivalents at beginning of period 38,660 100,575 Restricted cash at beginning of period 664 663 Cash and cash equivalents and restricted cash at beginning of period 39,324 101,238 Cash and cash equivalents at end of period 33,945 80,263 Restricted cash at the end of period 40 664 Cash, cash equivalents and restricted cash at end of period $ 33,985 $ 80,927 Flotek Industries, Inc. Unaudited Condensed Consolidated Statements of Cash Flows (in thousands) Three months ended March 31,
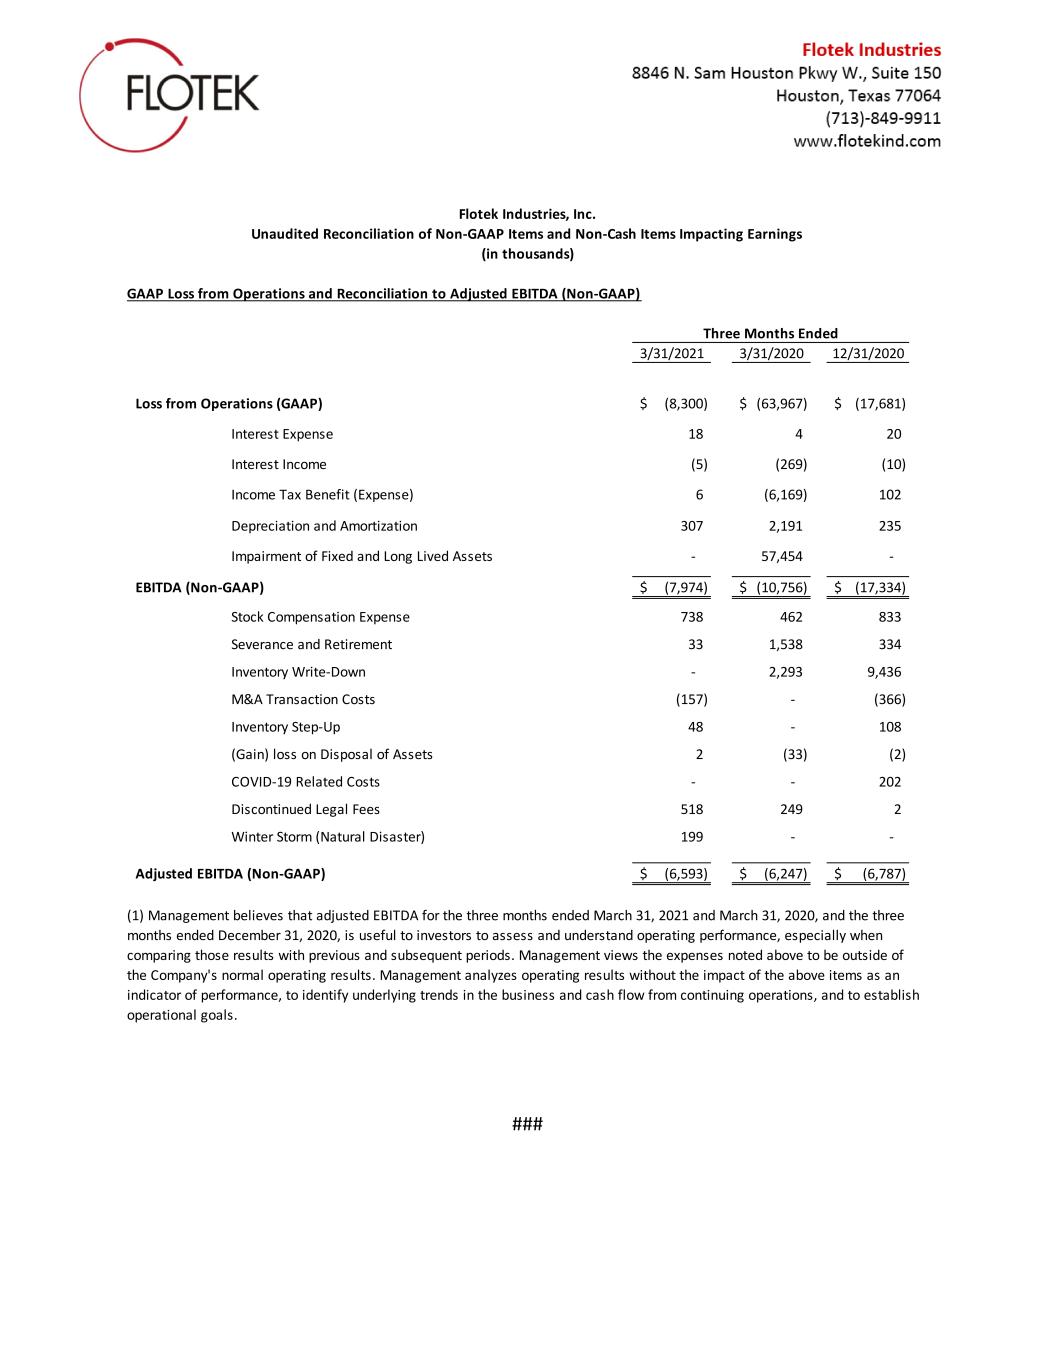
### GAAP Loss from Operations and Reconciliation to Adjusted EBITDA (Non-GAAP) 3/31/2021 3/31/2020 12/31/2020 Loss from Operations (GAAP) (8,300)$ (63,967)$ (17,681)$ Interest Expense 18 4 20 Interest Income (5) (269) (10) Income Tax Benefit (Expense) 6 (6,169) 102 Depreciation and Amortization 307 2,191 235 Impairment of Fixed and Long Lived Assets - 57,454 - EBITDA (Non-GAAP) (7,974)$ (10,756)$ (17,334)$ Stock Compensation Expense 738 462 833 Severance and Retirement 33 1,538 334 Inventory Write-Down - 2,293 9,436 M&A Transaction Costs (157) - (366) Inventory Step-Up 48 - 108 (Gain) loss on Disposal of Assets 2 (33) (2) COVID-19 Related Costs - - 202 Discontinued Legal Fees 518 249 2 Winter Storm (Natural Disaster) 199 - - Adjusted EBITDA (Non-GAAP) (6,593)$ (6,247)$ (6,787)$ (1) Management believes that adjusted EBITDA for the three months ended March 31, 2021 and March 31, 2020, and the three months ended December 31, 2020, is useful to investors to assess and understand operating performance, especially when comparing those results with previous and subsequent periods. Management views the expenses noted above to be outside of the Company's normal operating results. Management analyzes operating results without the impact of the above items as an indicator of performance, to identify underlying trends in the business and cash flow from continuing operations, and to establish operational goals. Three Months Ended Flotek Industries, Inc. Unaudited Reconciliation of Non-GAAP Items and Non-Cash Items Impacting Earnings (in thousands)
INVESTOR PRESENTATION First Quarter 2021 May 2021
Forward Looking Statements Certain statements set forth in this presentation constitute forward-looking statements (within the meaning of Section 27A of the Securities Act of 1933 and Section 21E of the Securities Exchange Act of 1934) regarding Flotek Industries, Inc.’s business, financial condition, results of operations and prospects. Words such as will, continue, expects, anticipates, intends, plans, believes, seeks, estimates and similar expressions or variations of such words are intended to identify forward-looking statements, but are not the exclusive means of identifying forward- looking statements in this press release. Although forward-looking statements in this presentation reflect the good faith judgment of management, such statements can only be based on facts and factors currently known to management. Consequently, forward-looking statements are inherently subject to risks and uncertainties, and actual results and outcomes may differ materially from the results and outcomes discussed in the forward-looking statements. Further information about the risks and uncertainties that may impact the Company are set forth in the Company’s most recent filing with the Securities and Exchange Commission on Form 10-K (including, without limitation, in the "Risk Factors" section thereof), and in the Company’s other SEC filings and publicly available documents. Readers are urged not to place undue reliance on these forward-looking statements, which speak only as of the date of this presentation. The Company undertakes no obligation to revise or update any forward-looking statements in order to reflect any event or circumstance that may arise after the date of this presentation. 2
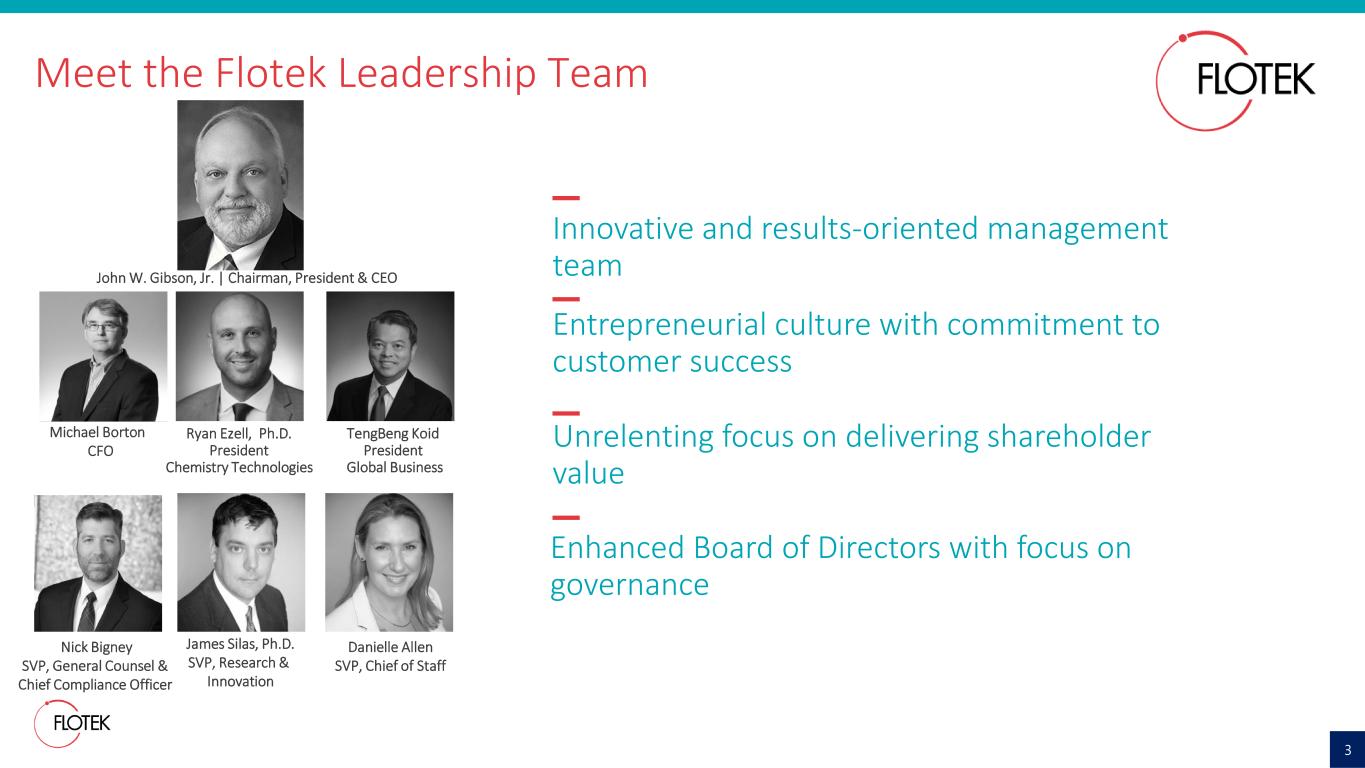
Innovative and results-oriented management team Meet the Flotek Leadership Team 3 James Entrepreneurial culture with commitment to customer success Unrelenting focus on delivering shareholder value Enhanced Board of Directors with focus on governance John W. Gibson, Jr. | Chairman, President & CEO Michael Borton CFO Ryan Ezell, Ph.D. President Chemistry Technologies TengBeng Koid President Global Business Nick Bigney SVP, General Counsel & Chief Compliance Officer James Silas, Ph.D. SVP, Research & Innovation Danielle Allen SVP, Chief of Staff
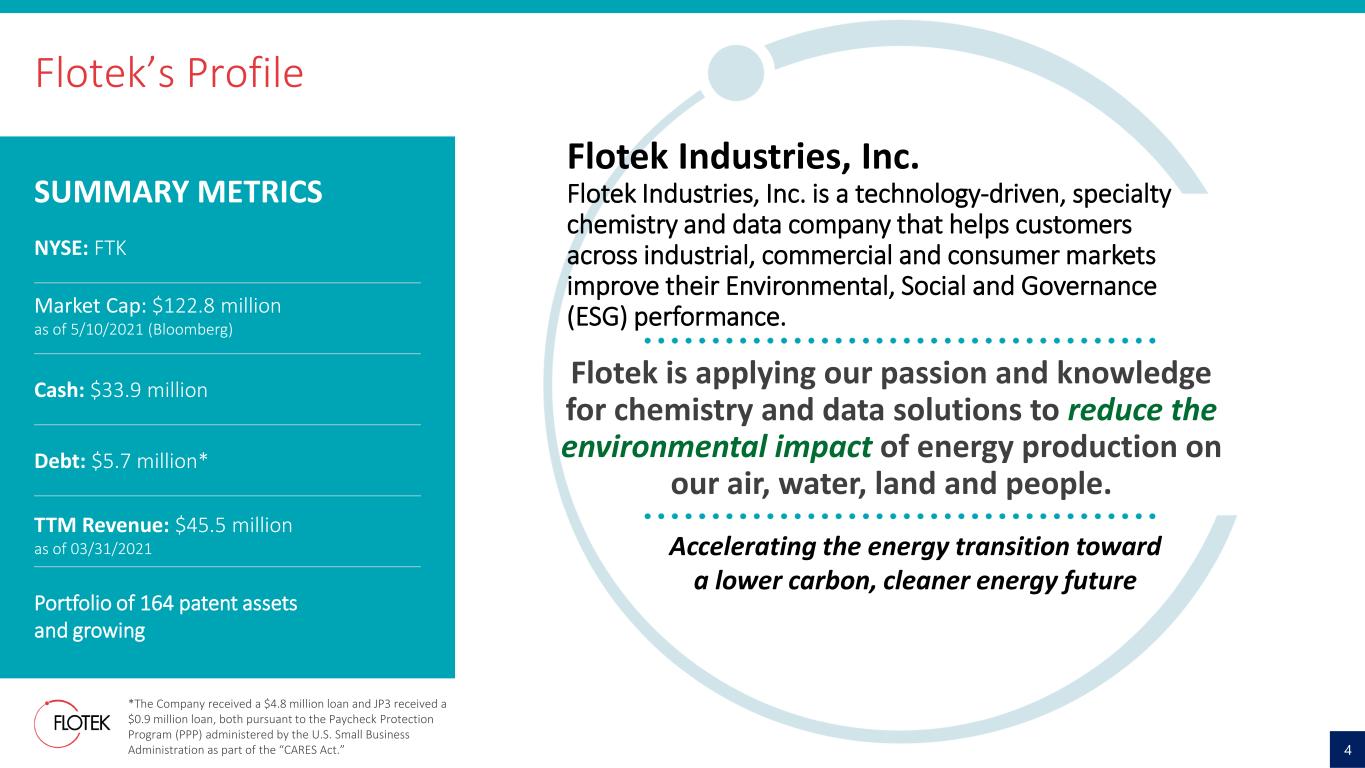
SUMMARY METRICS NYSE: FTK Market Cap: $122.8 million as of 5/10/2021 (Bloomberg) Cash: $33.9 million Debt: $5.7 million* TTM Revenue: $45.5 million as of 03/31/2021 Portfolio of 164 patent assets and growing Flotek’s Profile 4 *The Company received a $4.8 million loan and JP3 received a $0.9 million loan, both pursuant to the Paycheck Protection Program (PPP) administered by the U.S. Small Business Administration as part of the “CARES Act.” Flotek is applying our passion and knowledge for chemistry and data solutions to reduce the environmental impact of energy production on our air, water, land and people. Accelerating the energy transition toward a lower carbon, cleaner energy future Flotek Industries, Inc. Flotek Industries, Inc. is a technology-driven, specialty chemistry and data company that helps customers across industrial, commercial and consumer markets improve their Environmental, Social and Governance (ESG) performance.
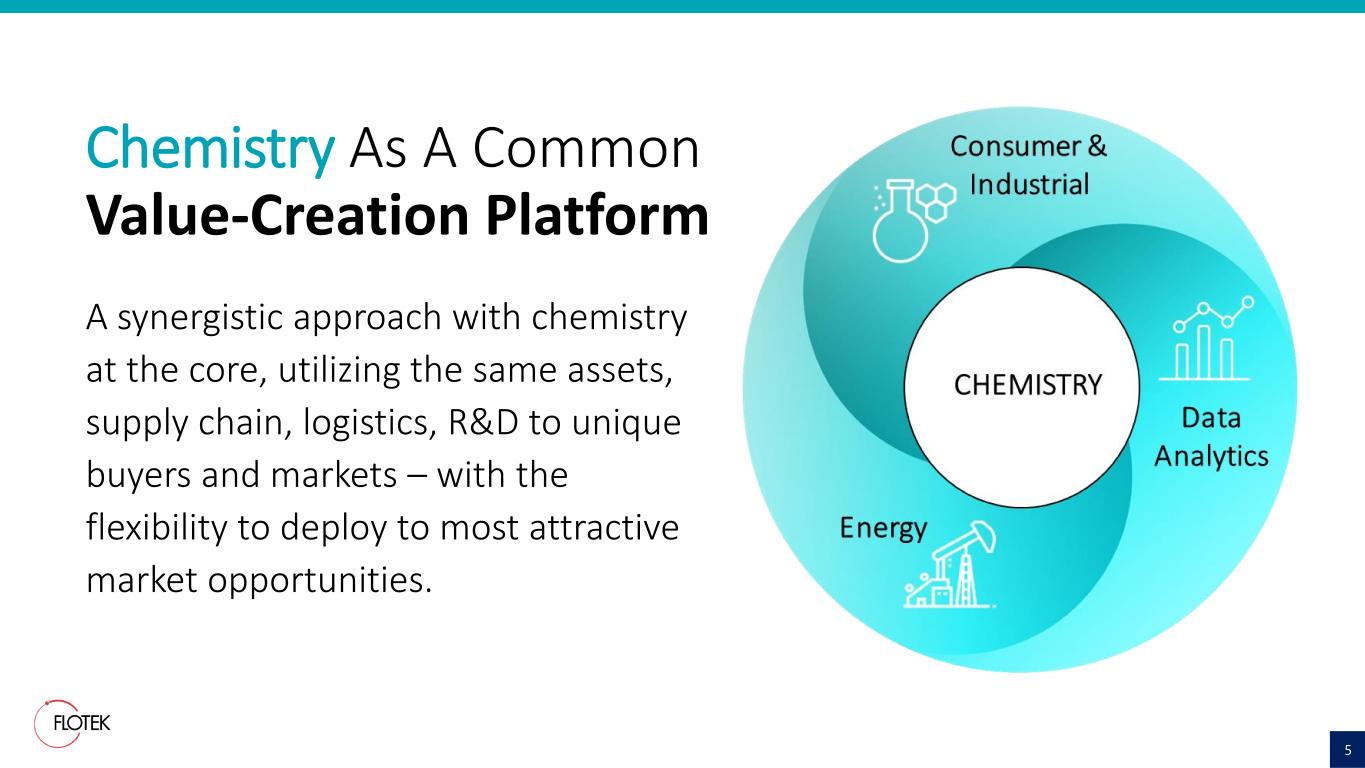
5 Chemistry As A Common Value-Creation Platform A synergistic approach with chemistry at the core, utilizing the same assets, supply chain, logistics, R&D to unique buyers and markets – with the flexibility to deploy to most attractive market opportunities.
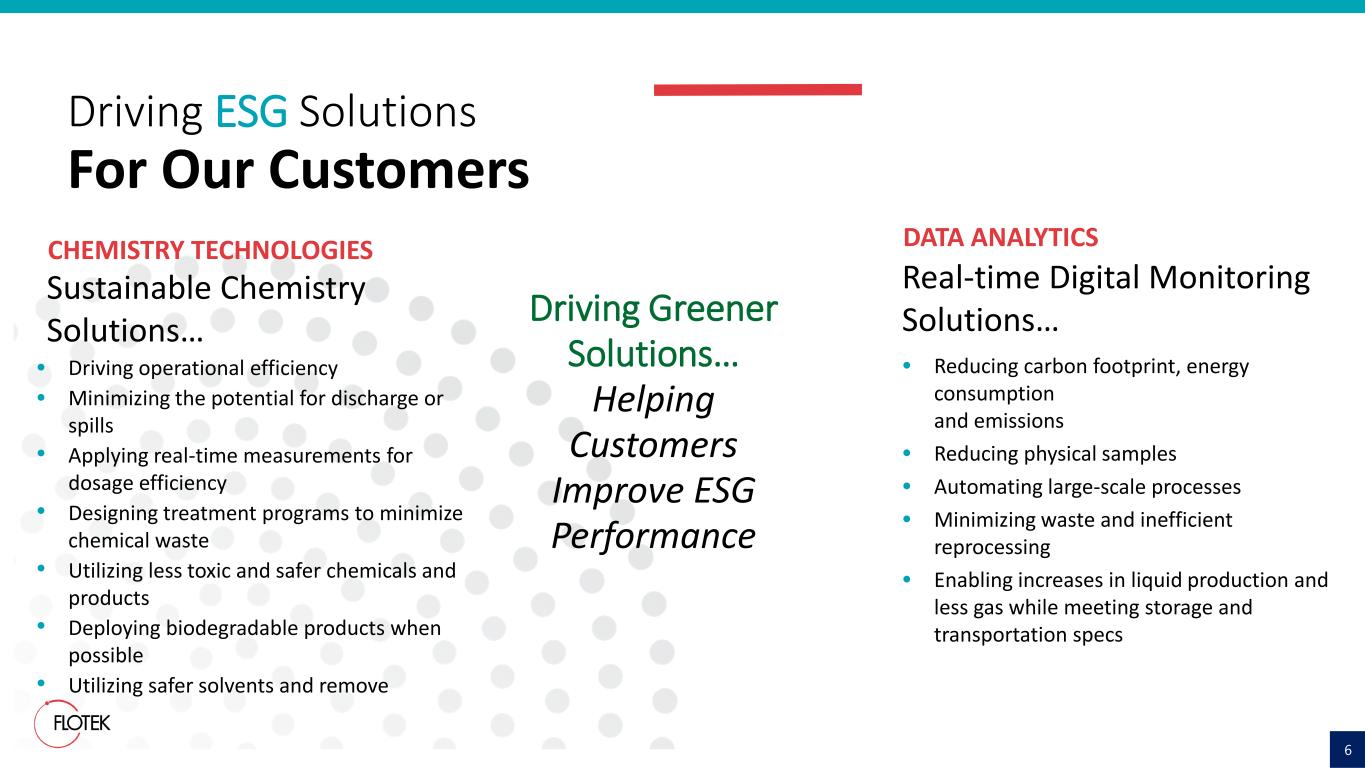
6 Driving ESG Solutions For Our Customers CHEMISTRY TECHNOLOGIES • Driving operational efficiency • Minimizing the potential for discharge or spills • Applying real-time measurements for dosage efficiency • Designing treatment programs to minimize chemical waste • Utilizing less toxic and safer chemicals and products • Deploying biodegradable products when possible • Utilizing safer solvents and remove Sustainable Chemistry Solutions… DATA ANALYTICS • Reducing carbon footprint, energy consumption and emissions • Reducing physical samples • Automating large-scale processes • Minimizing waste and inefficient reprocessing • Enabling increases in liquid production and less gas while meeting storage and transportation specs Real-time Digital Monitoring Solutions…Driving Greener Solutions… Helping Customers Improve ESG Performance
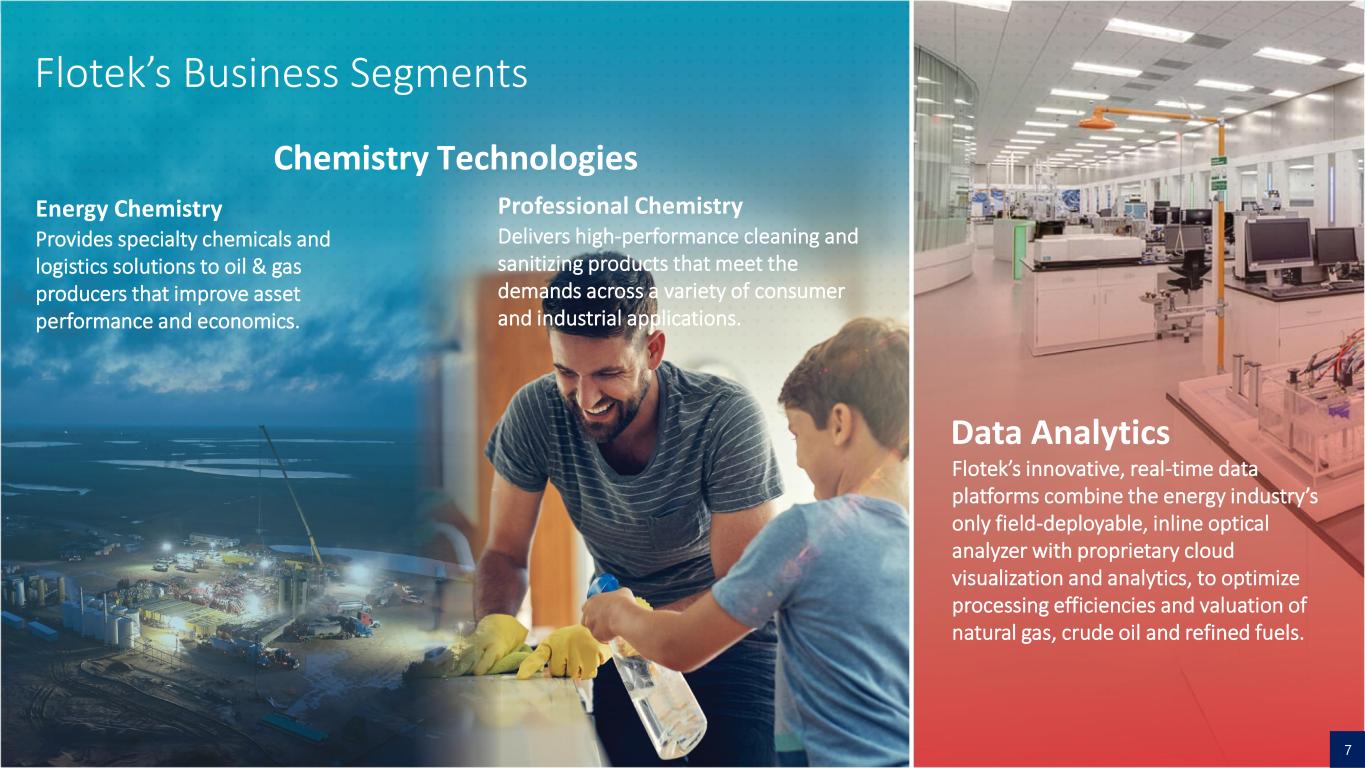
Chemistry Technologies Data Analytics Professional Chemistry Delivers high-performance cleaning and sanitizing products that meet the demands across a variety of consumer and industrial applications. Flotek’s Business Segments 7 Energy Chemistry Provides specialty chemicals and logistics solutions to oil & gas producers that improve asset performance and economics. Flotek’s innovative, real-time data platforms combine the energy industry’s only field-deployable, inline optical analyzer with proprietary cloud visualization and analytics, to optimize processing efficiencies and valuation of natural gas, crude oil and refined fuels.
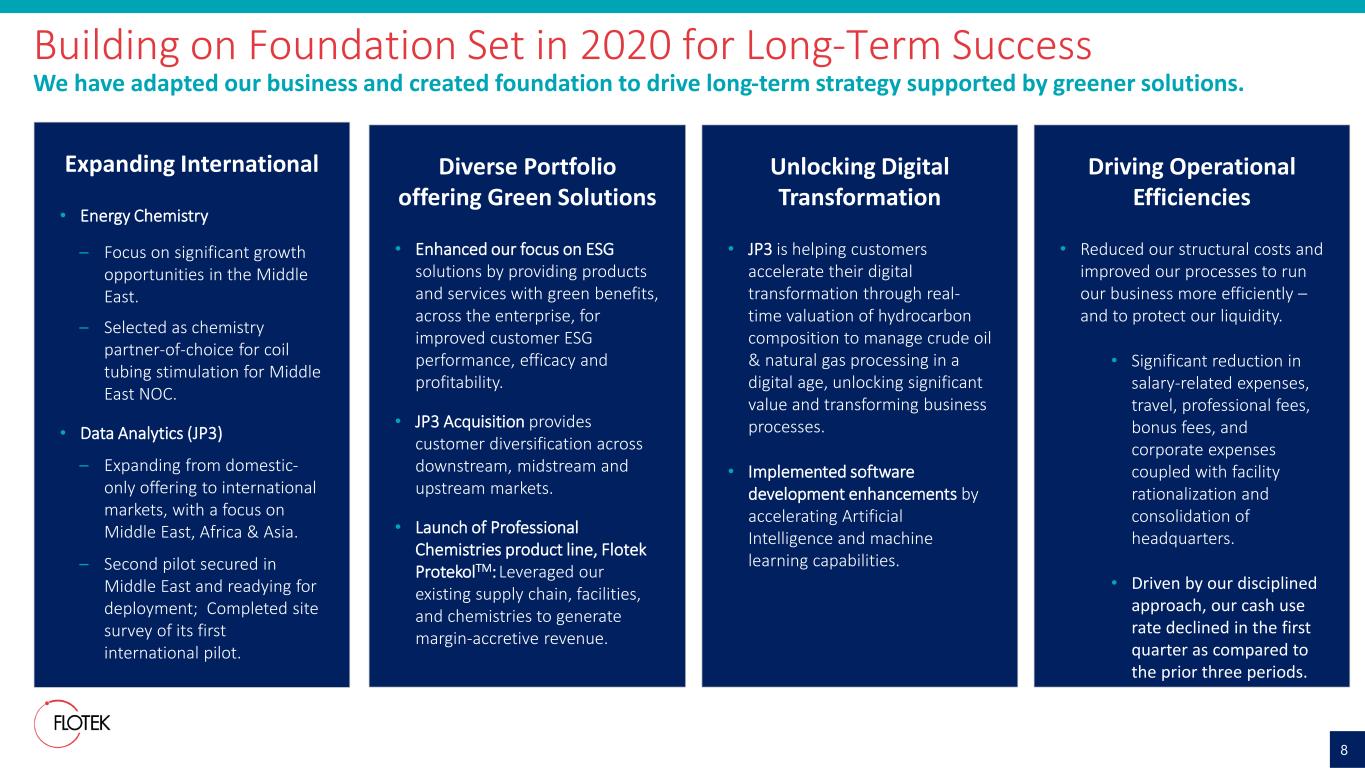
We have adapted our business and created foundation to drive long-term strategy supported by greener solutions. Building on Foundation Set in 2020 for Long-Term Success 8 Diverse Portfolio offering Green Solutions • Enhanced our focus on ESG solutions by providing products and services with green benefits, across the enterprise, for improved customer ESG performance, efficacy and profitability. • JP3 Acquisition provides customer diversification across downstream, midstream and upstream markets. • Launch of Professional Chemistries product line, Flotek ProtekolTM: Leveraged our existing supply chain, facilities, and chemistries to generate margin-accretive revenue. Expanding International • Energy Chemistry – Focus on significant growth opportunities in the Middle East. – Selected as chemistry partner-of-choice for coil tubing stimulation for Middle East NOC. • Data Analytics (JP3) – Expanding from domestic- only offering to international markets, with a focus on Middle East, Africa & Asia. – Second pilot secured in Middle East and readying for deployment; Completed site survey of its first international pilot. Unlocking Digital Transformation • JP3 is helping customers accelerate their digital transformation through real- time valuation of hydrocarbon composition to manage crude oil & natural gas processing in a digital age, unlocking significant value and transforming business processes. • Implemented software development enhancements by accelerating Artificial Intelligence and machine learning capabilities. Driving Operational Efficiencies • Reduced our structural costs and improved our processes to run our business more efficiently – and to protect our liquidity. • Significant reduction in salary-related expenses, travel, professional fees, bonus fees, and corporate expenses coupled with facility rationalization and consolidation of headquarters. • Driven by our disciplined approach, our cash use rate declined in the first quarter as compared to the prior three periods.
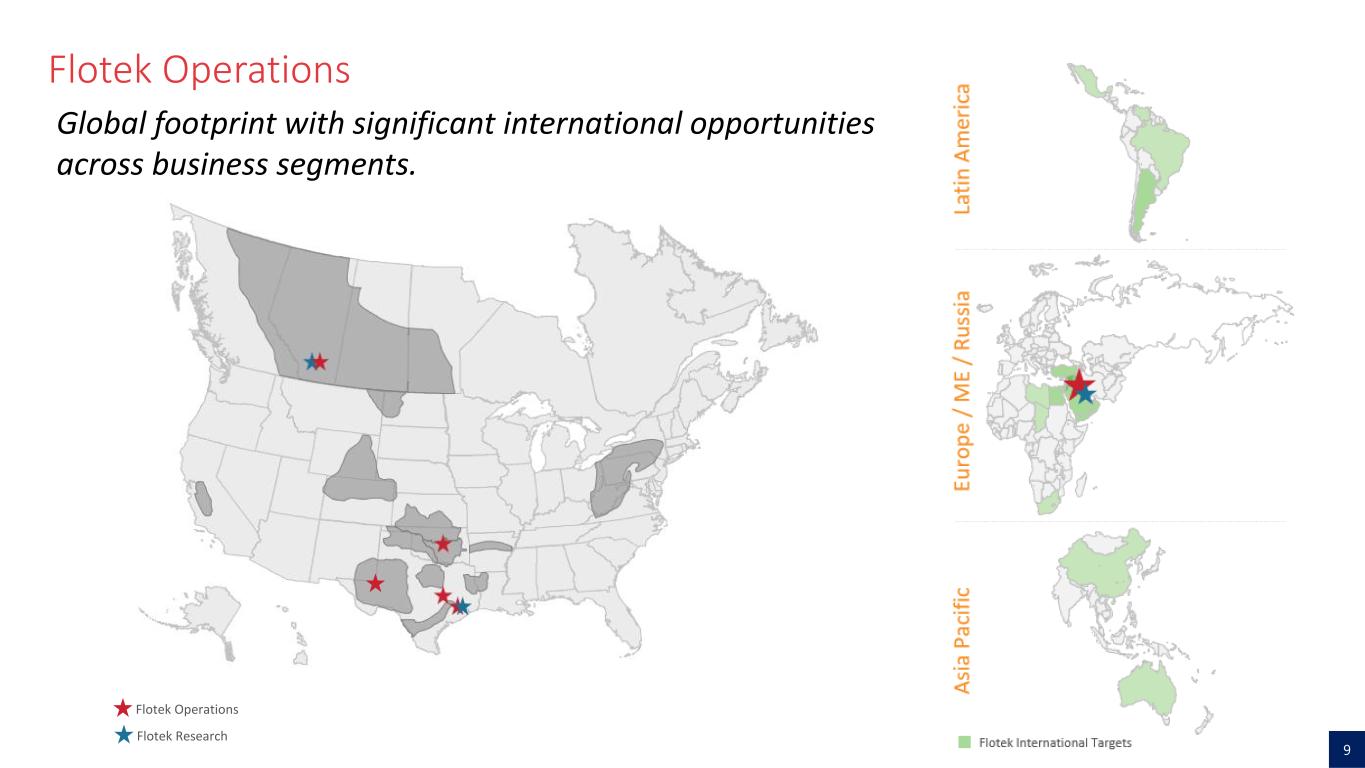
9 Flotek Operations Global footprint with significant international opportunities across business segments. Flotek Operations Flotek Research
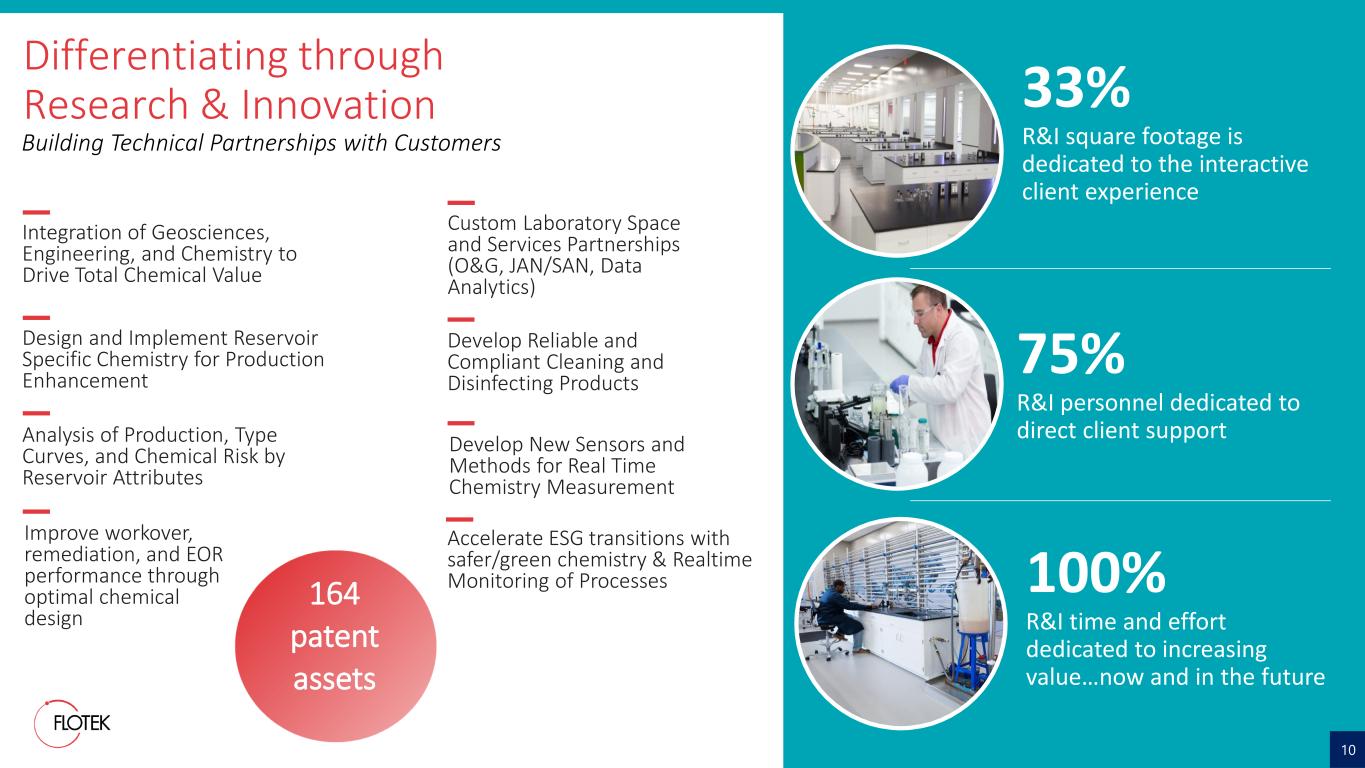
Differentiating through Research & Innovation 10 33% R&I square footage is dedicated to the interactive client experience 75% R&I personnel dedicated to direct client support 100% R&I time and effort dedicated to increasing value…now and in the future 164 patent assets Building Technical Partnerships with Customers Analysis of Production, Type Curves, and Chemical Risk by Reservoir Attributes Design and Implement Reservoir Specific Chemistry for Production Enhancement Accelerate ESG transitions with safer/green chemistry & Realtime Monitoring of Processes Develop New Sensors and Methods for Real Time Chemistry Measurement Improve workover, remediation, and EOR performance through optimal chemical design Custom Laboratory Space and Services Partnerships (O&G, JAN/SAN, Data Analytics) Develop Reliable and Compliant Cleaning and Disinfecting Products Integration of Geosciences, Engineering, and Chemistry to Drive Total Chemical Value
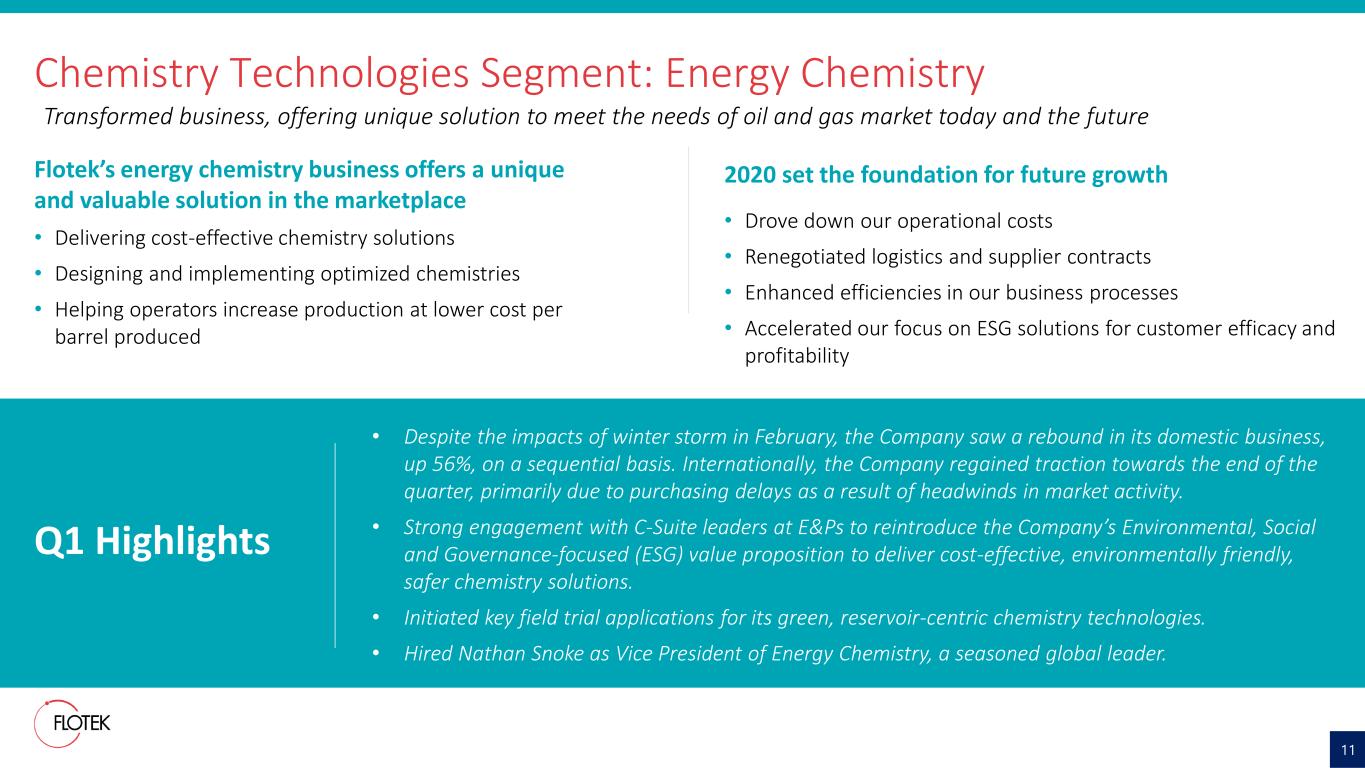
Chemistry Technologies Segment: Energy Chemistry 11 • Despite the impacts of winter storm in February, the Company saw a rebound in its domestic business, up 56%, on a sequential basis. Internationally, the Company regained traction towards the end of the quarter, primarily due to purchasing delays as a result of headwinds in market activity. • Strong engagement with C-Suite leaders at E&Ps to reintroduce the Company’s Environmental, Social and Governance-focused (ESG) value proposition to deliver cost-effective, environmentally friendly, safer chemistry solutions. • Initiated key field trial applications for its green, reservoir-centric chemistry technologies. • Hired Nathan Snoke as Vice President of Energy Chemistry, a seasoned global leader. Q1 Highlights 2020 set the foundation for future growth • Drove down our operational costs • Renegotiated logistics and supplier contracts • Enhanced efficiencies in our business processes • Accelerated our focus on ESG solutions for customer efficacy and profitability Transformed business, offering unique solution to meet the needs of oil and gas market today and the future Flotek’s energy chemistry business offers a unique and valuable solution in the marketplace • Delivering cost-effective chemistry solutions • Designing and implementing optimized chemistries • Helping operators increase production at lower cost per barrel produced
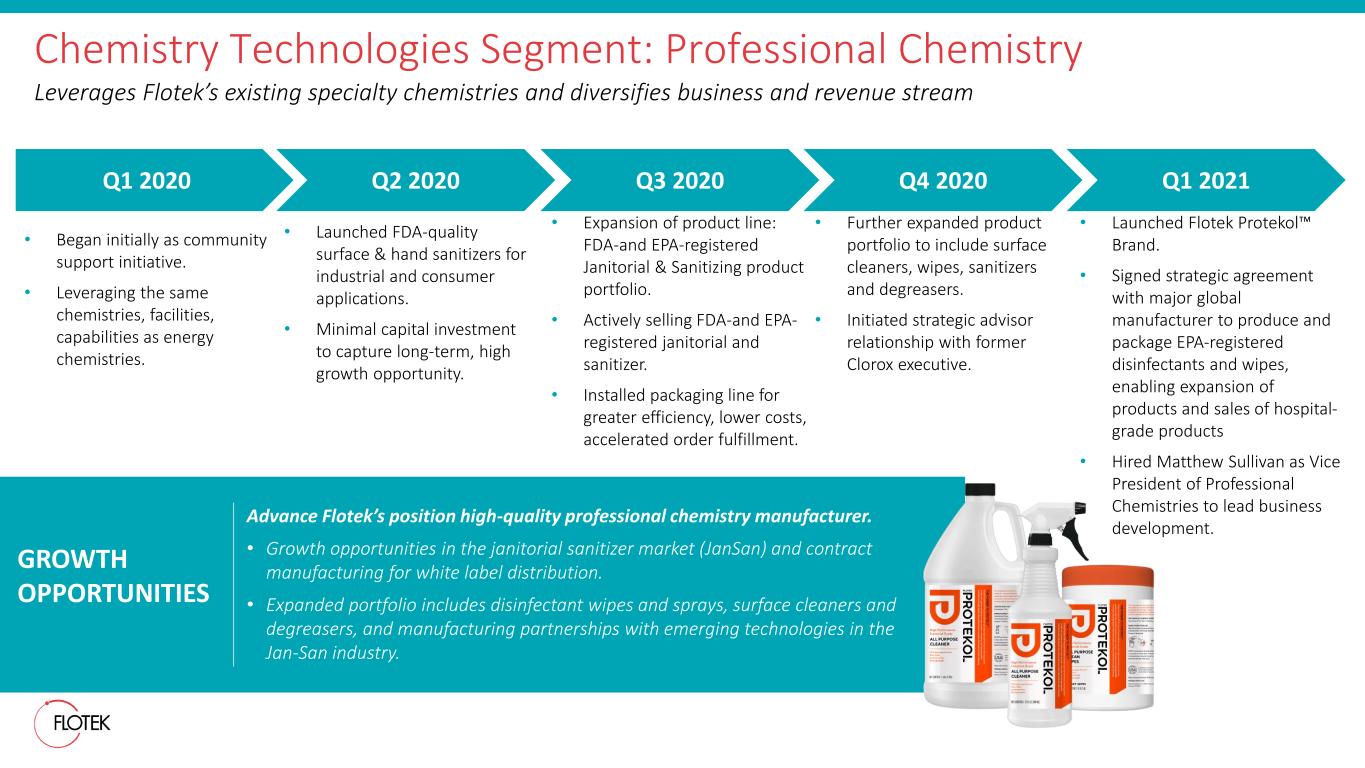
Chemistry Technologies Segment: Professional Chemistry Leverages Flotek’s existing specialty chemistries and diversifies business and revenue stream • Began initially as community support initiative. • Leveraging the same chemistries, facilities, capabilities as energy chemistries. • Launched FDA-quality surface & hand sanitizers for industrial and consumer applications. • Minimal capital investment to capture long-term, high growth opportunity. • Expansion of product line: FDA-and EPA-registered Janitorial & Sanitizing product portfolio. • Actively selling FDA-and EPA- registered janitorial and sanitizer. • Installed packaging line for greater efficiency, lower costs, accelerated order fulfillment. Advance Flotek’s position high-quality professional chemistry manufacturer. • Growth opportunities in the janitorial sanitizer market (JanSan) and contract manufacturing for white label distribution. • Expanded portfolio includes disinfectant wipes and sprays, surface cleaners and degreasers, and manufacturing partnerships with emerging technologies in the Jan-San industry. GROWTH OPPORTUNITIES Q1 2020 Q2 2020 Q3 2020 • Further expanded product portfolio to include surface cleaners, wipes, sanitizers and degreasers. • Initiated strategic advisor relationship with former Clorox executive. Q4 2020 Q1 2021 • Launched Flotek Protekol™ Brand. • Signed strategic agreement with major global manufacturer to produce and package EPA-registered disinfectants and wipes, enabling expansion of products and sales of hospital- grade products • Hired Matthew Sullivan as Vice President of Professional Chemistries to lead business development.
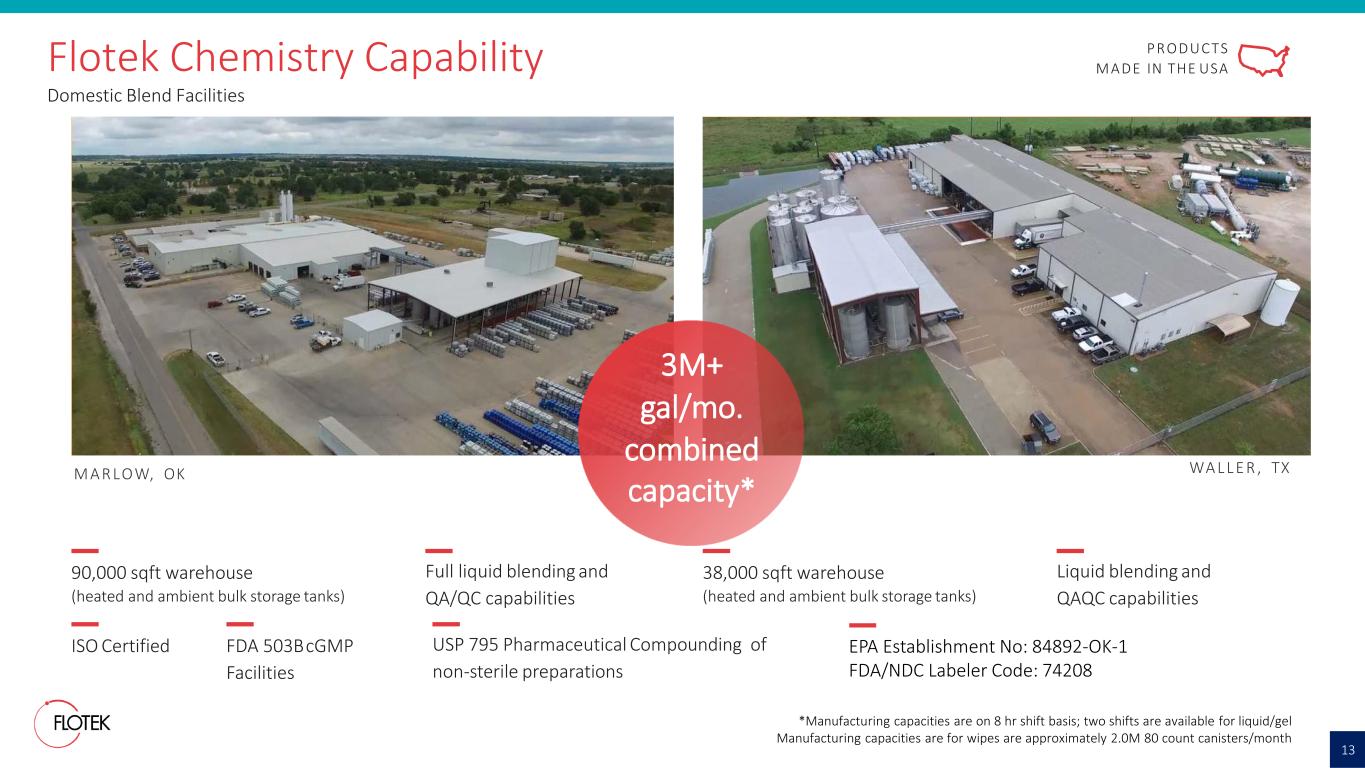
PRODUCTS MADE IN THE USA M A R LOW, OK WA L L E R , TX 90,000 sqft warehouse (heated and ambient bulk storage tanks) 38,000 sqft warehouse (heated and ambient bulk storage tanks) Full liquid blending and QA/QC capabilities Liquid blending and QAQC capabilities 3M+ gal/mo. combined capacity* *Manufacturing capacities are on 8 hr shift basis; two shifts are available for liquid/gel Manufacturing capacities are for wipes are approximately 2.0M 80 count canisters/month Flotek Chemistry Capability Domestic Blend Facilities 13 ISO Certified USP 795 Pharmaceutical Compounding of non-sterile preparations FDA 503BcGMP Facilities EPA Establishment No: 84892-OK-1 FDA/NDC Labeler Code: 74208
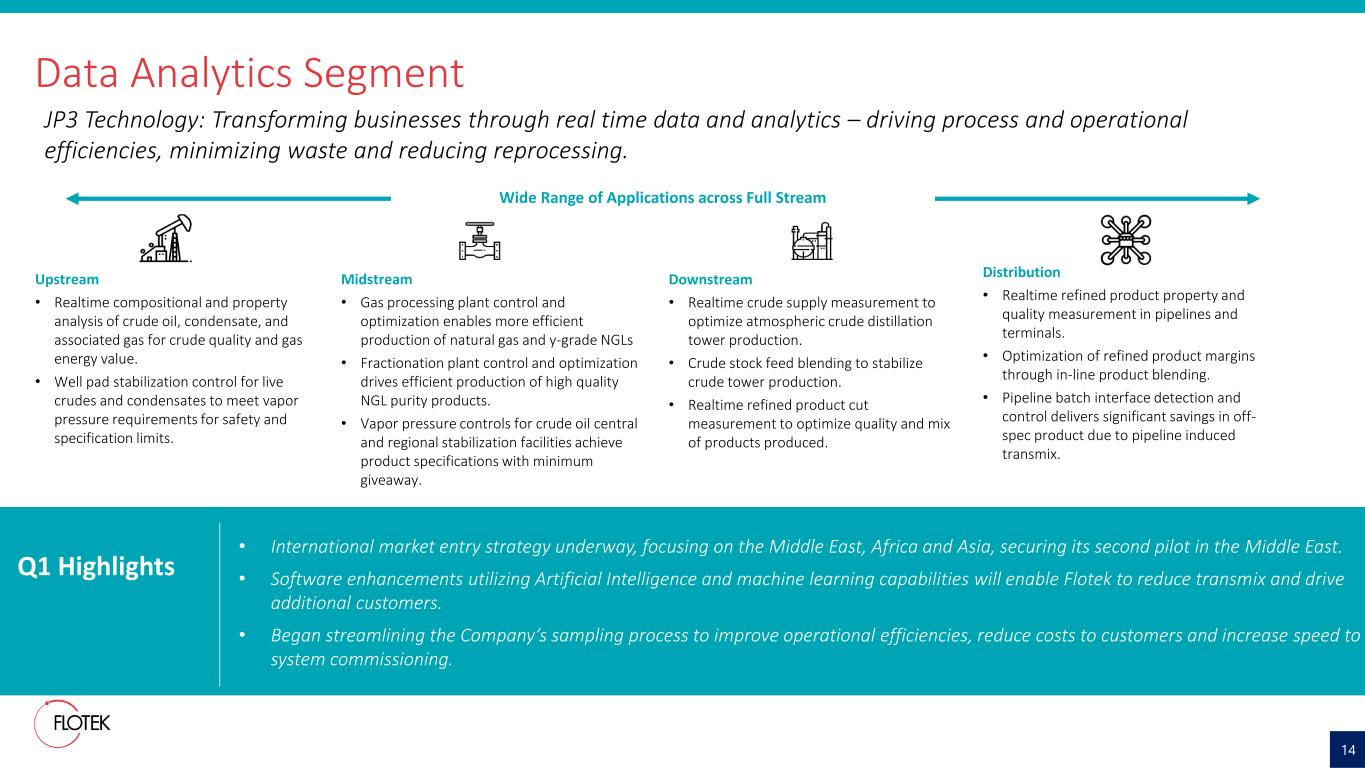
14 Wide Range of Applications across Full Stream Upstream • Realtime compositional and property analysis of crude oil, condensate, and associated gas for crude quality and gas energy value. • Well pad stabilization control for live crudes and condensates to meet vapor pressure requirements for safety and specification limits. Distribution • Realtime refined product property and quality measurement in pipelines and terminals. • Optimization of refined product margins through in-line product blending. • Pipeline batch interface detection and control delivers significant savings in off- spec product due to pipeline induced transmix. Midstream • Gas processing plant control and optimization enables more efficient production of natural gas and y-grade NGLs • Fractionation plant control and optimization drives efficient production of high quality NGL purity products. • Vapor pressure controls for crude oil central and regional stabilization facilities achieve product specifications with minimum giveaway. Downstream • Realtime crude supply measurement to optimize atmospheric crude distillation tower production. • Crude stock feed blending to stabilize crude tower production. • Realtime refined product cut measurement to optimize quality and mix of products produced. Data Analytics Segment • International market entry strategy underway, focusing on the Middle East, Africa and Asia, securing its second pilot in the Middle East. • Software enhancements utilizing Artificial Intelligence and machine learning capabilities will enable Flotek to reduce transmix and drive additional customers. • Began streamlining the Company’s sampling process to improve operational efficiencies, reduce costs to customers and increase speed to system commissioning. Q1 Highlights JP3 Technology: Transforming businesses through real time data and analytics – driving process and operational efficiencies, minimizing waste and reducing reprocessing.
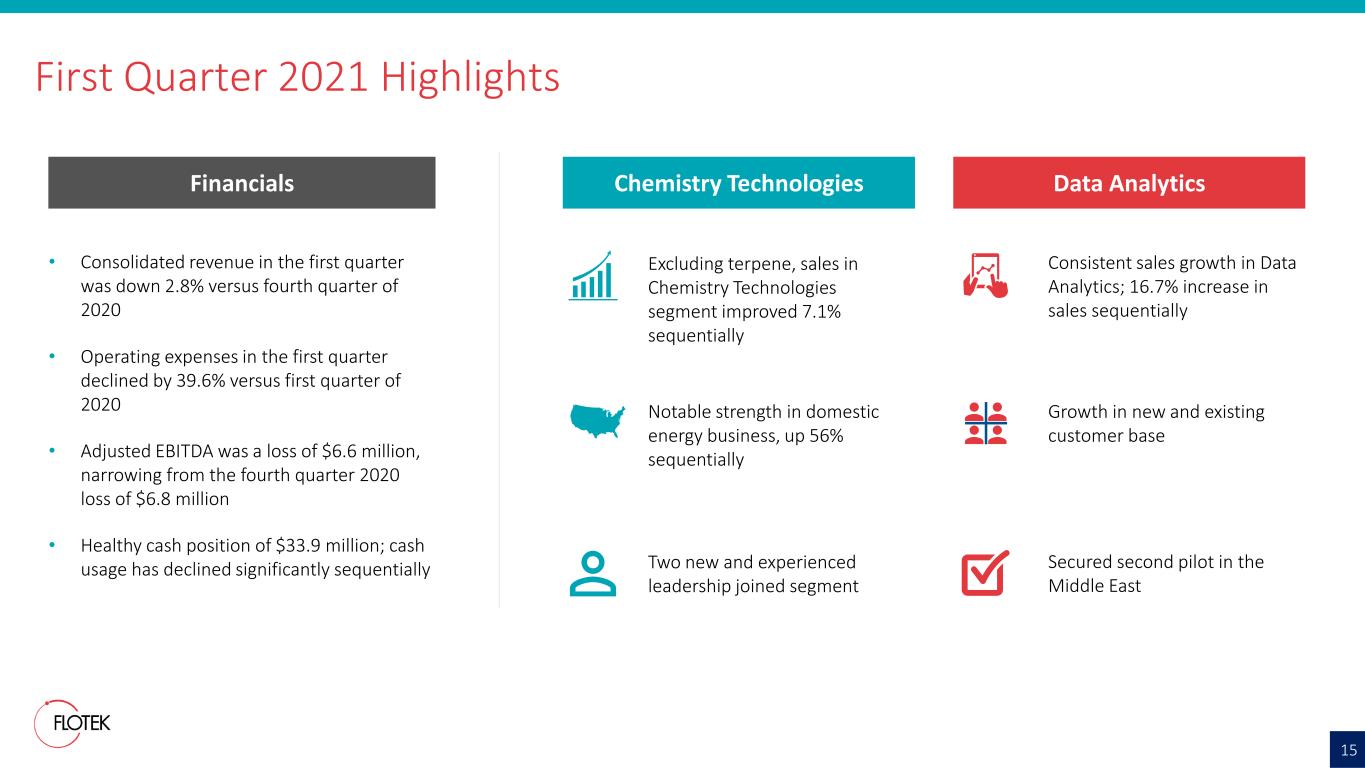
First Quarter 2021 Highlights 15 Financials • Consolidated revenue in the first quarter was down 2.8% versus fourth quarter of 2020 • Operating expenses in the first quarter declined by 39.6% versus first quarter of 2020 • Adjusted EBITDA was a loss of $6.6 million, narrowing from the fourth quarter 2020 loss of $6.8 million • Healthy cash position of $33.9 million; cash usage has declined significantly sequentially Chemistry Technologies Data Analytics Notable strength in domestic energy business, up 56% sequentially Excluding terpene, sales in Chemistry Technologies segment improved 7.1% sequentially Two new and experienced leadership joined segment Consistent sales growth in Data Analytics; 16.7% increase in sales sequentially Growth in new and existing customer base Secured second pilot in the Middle East
Investment Highlights Leading developer of specialty, performance chemistry Differentiated portfolio Strong R&D capabilities, world- class research & innovation center Attractive ESG value proposition and market dynamics Disciplined approach to growth and profitability Runway of growth internationally Empowering digital transformation
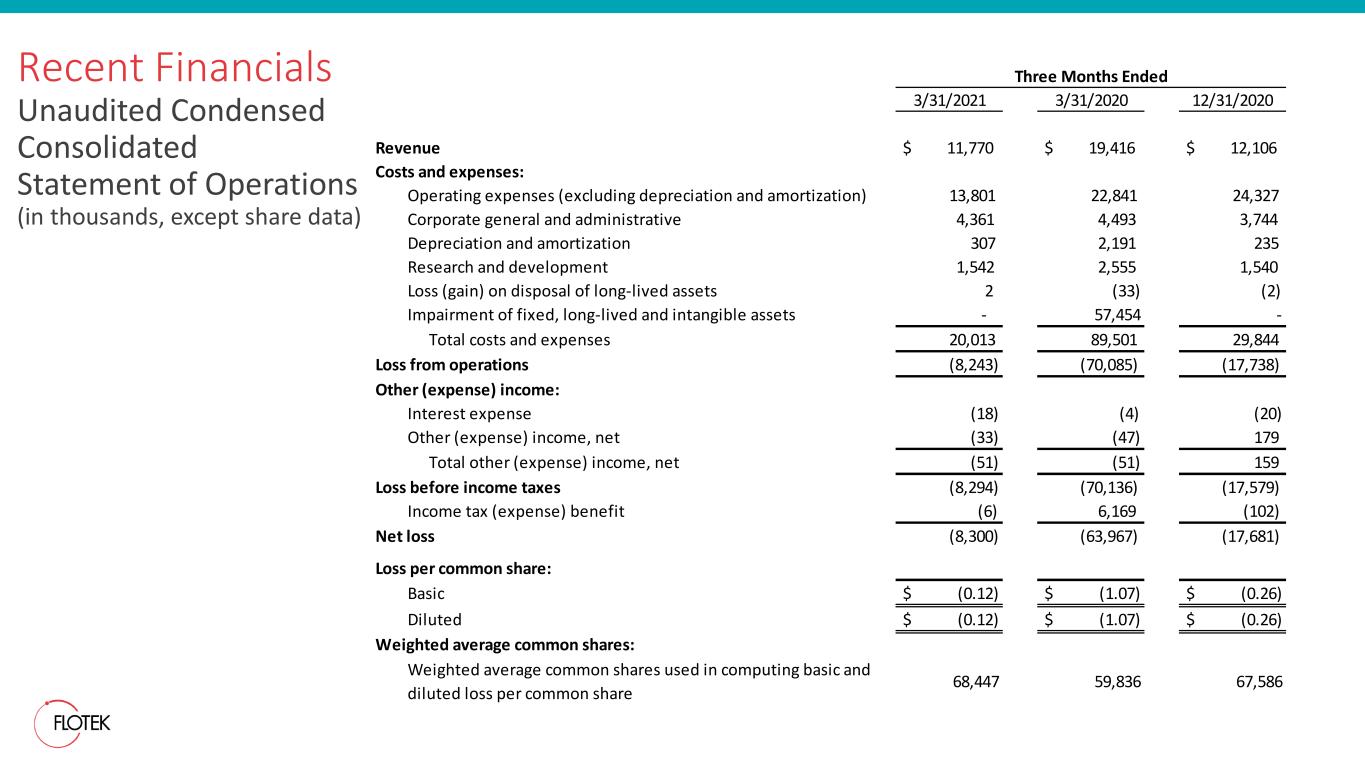
Recent Financials Unaudited Condensed Consolidated Statement of Operations (in thousands, except share data) 3/31/2021 3/31/2020 12/31/2020 Revenue $ 11,770 $ 19,416 $ 12,106 Costs and expenses: Operating expenses (excluding depreciation and amortization) 13,801 22,841 24,327 Corporate general and administrative 4,361 4,493 3,744 Depreciation and amortization 307 2,191 235 Research and development 1,542 2,555 1,540 Loss (gain) on disposal of long-lived assets 2 (33) (2) Impairment of fixed, long-lived and intangible assets - 57,454 - Total costs and expenses 20,013 89,501 29,844 Loss from operations (8,243) (70,085) (17,738) Other (expense) income: Interest expense (18) (4) (20) Other (expense) income, net (33) (47) 179 Total other (expense) income, net (51) (51) 159 Loss before income taxes (8,294) (70,136) (17,579) Income tax (expense) benefit (6) 6,169 (102) Net loss (8,300) (63,967) (17,681) Loss per common share: Basic $ (0.12) $ (1.07) $ (0.26) Diluted $ (0.12) $ (1.07) $ (0.26) Weighted average common shares: Weighted average common shares used in computing basic and diluted loss per common share 68,447 59,836 67,586 Three Months Ended
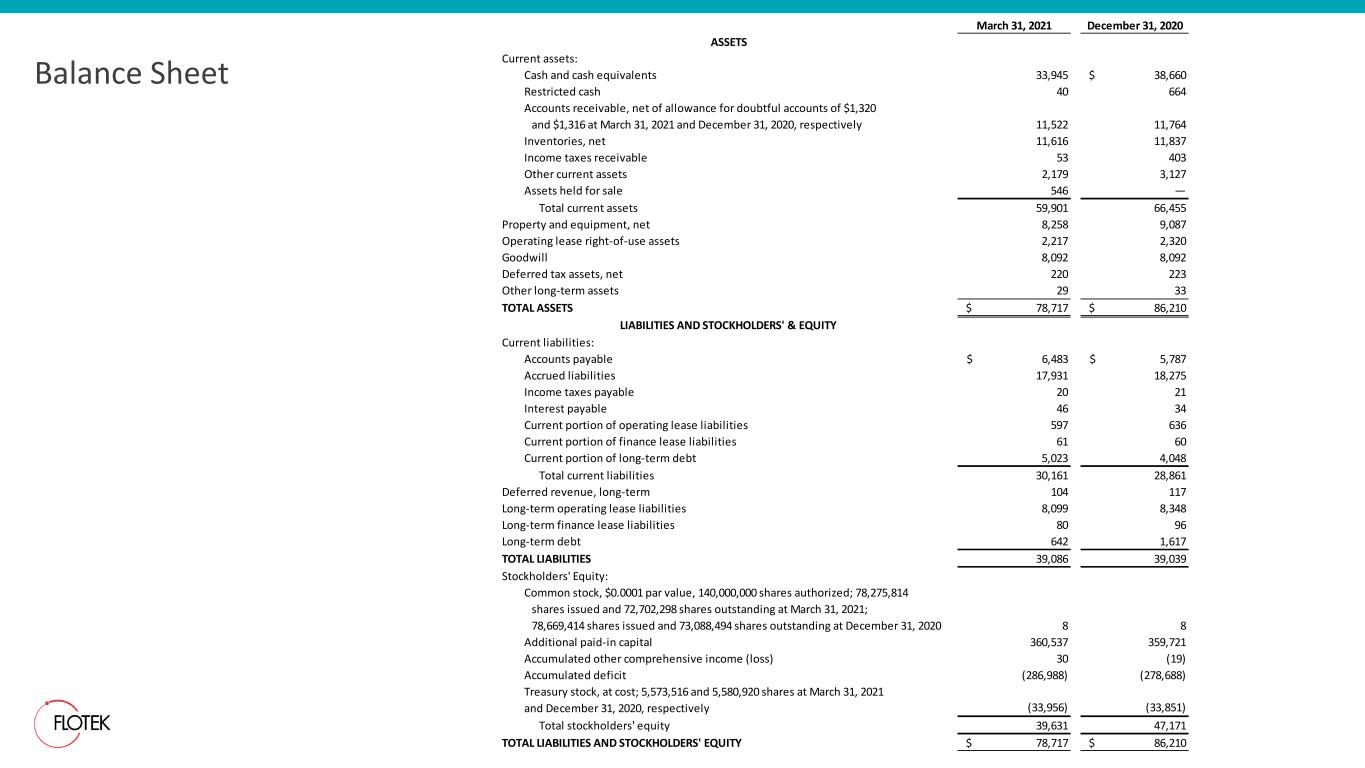
Balance Sheet March 31, 2021 December 31, 2020 ASSETS Current assets: Cash and cash equivalents 33,945 $ 38,660 Restricted cash 40 664 Accounts receivable, net of allowance for doubtful accounts of $1,320 and $1,316 at March 31, 2021 and December 31, 2020, respectively 11,522 11,764 Inventories, net 11,616 11,837 Income taxes receivable 53 403 Other current assets 2,179 3,127 Assets held for sale 546 — Total current assets 59,901 66,455 Property and equipment, net 8,258 9,087 Operating lease right-of-use assets 2,217 2,320 Goodwill 8,092 8,092 Deferred tax assets, net 220 223 Other long-term assets 29 33 TOTAL ASSETS $ 78,717 $ 86,210 LIABILITIES AND STOCKHOLDERS' & EQUITY Current liabilities: Accounts payable $ 6,483 $ 5,787 Accrued liabilities 17,931 18,275 Income taxes payable 20 21 Interest payable 46 34 Current portion of operating lease liabilities 597 636 Current portion of finance lease liabilities 61 60 Current portion of long-term debt 5,023 4,048 Total current liabilities 30,161 28,861 Deferred revenue, long-term 104 117 Long-term operating lease liabilities 8,099 8,348 Long-term finance lease liabilities 80 96 Long-term debt 642 1,617 TOTAL LIABILITIES 39,086 39,039 Stockholders' Equity: Common stock, $0.0001 par value, 140,000,000 shares authorized; 78,275,814 shares issued and 72,702,298 shares outstanding at March 31, 2021; 78,669,414 shares issued and 73,088,494 shares outstanding at December 31, 2020 8 8 Additional paid-in capital 360,537 359,721 Accumulated other comprehensive income (loss) 30 (19) Accumulated deficit (286,988) (278,688) Treasury stock, at cost; 5,573,516 and 5,580,920 shares at March 31, 2021 and December 31, 2020, respectively (33,956) (33,851) Total stockholders' equity 39,631 47,171 TOTAL LIABILITIES AND STOCKHOLDERS' EQUITY $ 78,717 $ 86,210
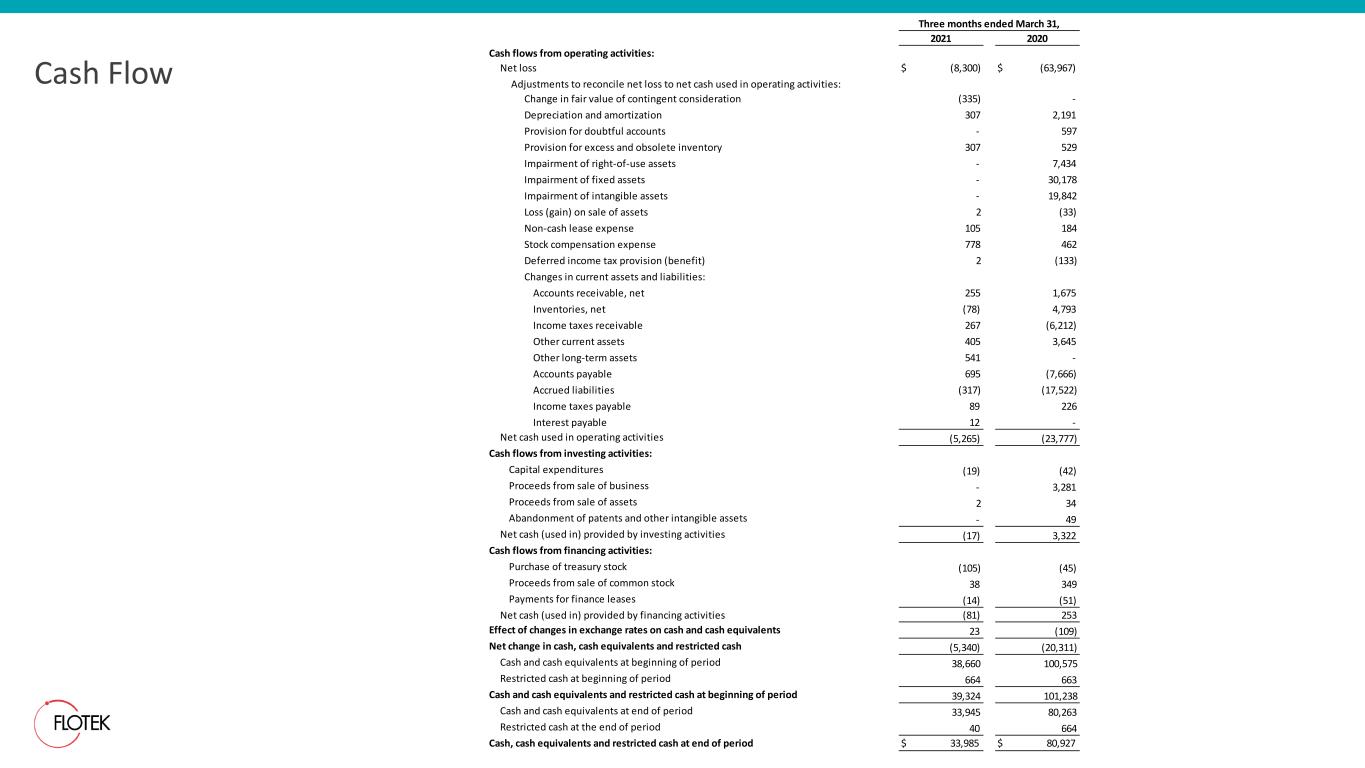
Cash Flow 2021 2020 Cash flows from operating activities: Net loss $ (8,300) $ (63,967) Adjustments to reconcile net loss to net cash used in operating activities: Change in fair value of contingent consideration (335) - Depreciation and amortization 307 2,191 Provision for doubtful accounts - 597 Provision for excess and obsolete inventory 307 529 Impairment of right-of-use assets - 7,434 Impairment of fixed assets - 30,178 Impairment of intangible assets - 19,842 Loss (gain) on sale of assets 2 (33) Non-cash lease expense 105 184 Stock compensation expense 778 462 Deferred income tax provision (benefit) 2 (133) Changes in current assets and liabilities: Accounts receivable, net 255 1,675 Inventories, net (78) 4,793 Income taxes receivable 267 (6,212) Other current assets 405 3,645 Other long-term assets 541 - Accounts payable 695 (7,666) Accrued liabilities (317) (17,522) Income taxes payable 89 226 Interest payable 12 - Net cash used in operating activities (5,265) (23,777) Cash flows from investing activities: Capital expenditures (19) (42) Proceeds from sale of business - 3,281 Proceeds from sale of assets 2 34 Abandonment of patents and other intangible assets - 49 Net cash (used in) provided by investing activities (17) 3,322 Cash flows from financing activities: Purchase of treasury stock (105) (45) Proceeds from sale of common stock 38 349 Payments for finance leases (14) (51) Net cash (used in) provided by financing activities (81) 253 Effect of changes in exchange rates on cash and cash equivalents 23 (109) Net change in cash, cash equivalents and restricted cash (5,340) (20,311) Cash and cash equivalents at beginning of period 38,660 100,575 Restricted cash at beginning of period 664 663 Cash and cash equivalents and restricted cash at beginning of period 39,324 101,238 Cash and cash equivalents at end of period 33,945 80,263 Restricted cash at the end of period 40 664 Cash, cash equivalents and restricted cash at end of period $ 33,985 $ 80,927 Three months ended March 31,
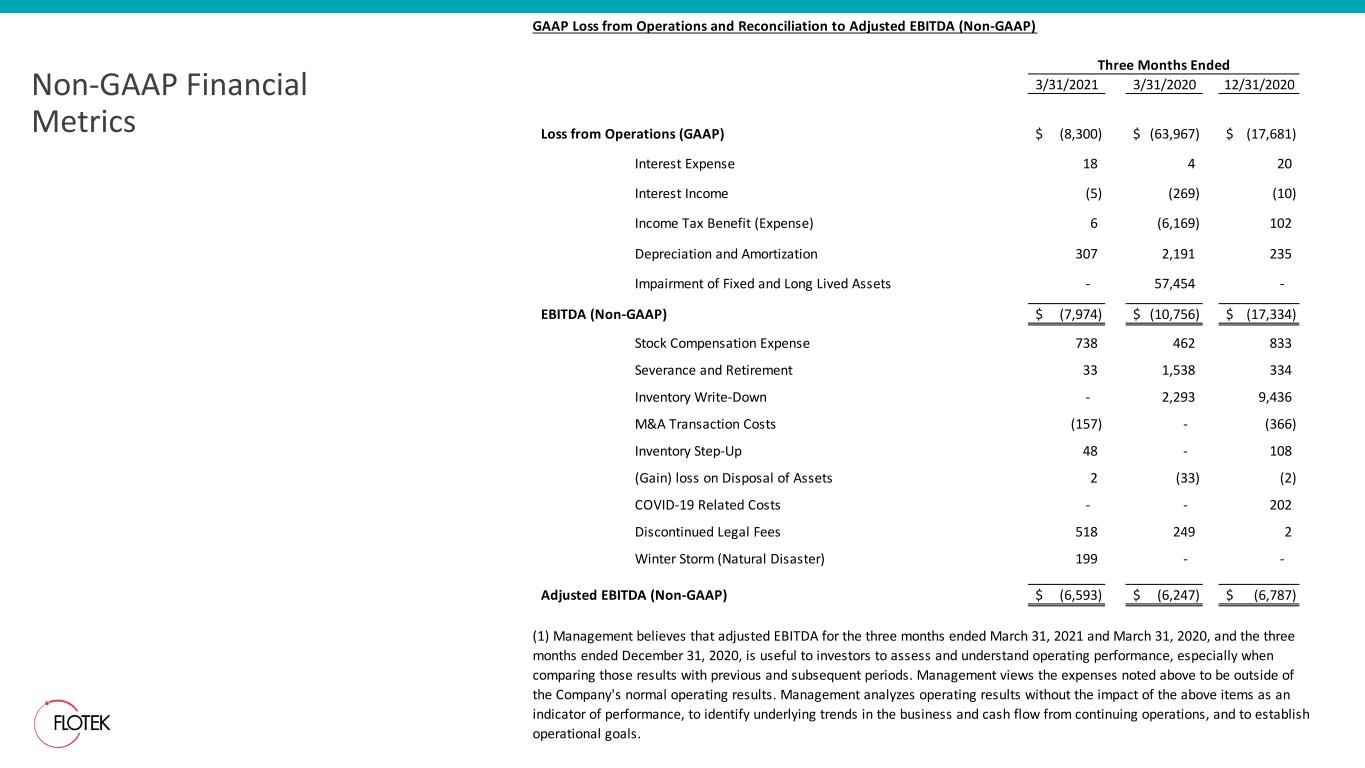
Non-GAAP Financial Metrics GAAP Loss from Operations and Reconciliation to Adjusted EBITDA (Non-GAAP) 3/31/2021 3/31/2020 12/31/2020 Loss from Operations (GAAP) (8,300)$ (63,967)$ (17,681)$ Interest Expense 18 4 20 Interest Income (5) (269) (10) Income Tax Benefit (Expense) 6 (6,169) 102 Depreciation and Amortization 307 2,191 235 Impairment of Fixed and Long Lived Assets - 57,454 - EBITDA (Non-GAAP) (7,974)$ (10,756)$ (17,334)$ Stock Compensation Expense 738 462 833 Severance and Retirement 33 1,538 334 Inventory Write-Down - 2,293 9,436 M&A Transaction Costs (157) - (366) Inventory Step-Up 48 - 108 (Gain) loss on Disposal of Assets 2 (33) (2) COVID-19 Related Costs - - 202 Discontinued Legal Fees 518 249 2 Winter Storm (Natural Disaster) 199 - - Adjusted EBITDA (Non-GAAP) (6,593)$ (6,247)$ (6,787)$ (1) Management believes that adjusted EBITDA for the three months ended March 31, 2021 and March 31, 2020, and the three months ended December 31, 2020, is useful to investors to assess and understand operating performance, especially when comparing those results with previous and subsequent periods. Management views the expenses noted above to be outside of the Company's normal operating results. Management analyzes operating results without the impact of the above items as an indicator of performance, to identify underlying trends in the business and cash flow from continuing operations, and to establish operational goals. Three Months Ended