
GEG 8-K
Great Elm Group, Inc. (GEG)
UNITED STATES
SECURITIES AND EXCHANGE COMMISSION
WASHINGTON, D.C. 20549
FORM
CURRENT REPORT
Pursuant to Section 13 or 15(d) of the Securities Exchange Act of 1934
Date of Report (Date of earliest event reported):
(Exact name of Registrant as Specified in Its Charter)
|
|
|
|
|
(State or Other Jurisdiction of Incorporation) |
(Commission File Number) |
(IRS Employer Identification No.) |
|
|
|
|
|
|
|
|
|
(Address of Principal Executive Offices) |
|
(Zip Code) |
Registrant’s Telephone Number, Including Area Code: (
Check the appropriate box below if the Form 8-K filing is intended to simultaneously satisfy the filing obligation of the registrant under any of the following provisions:
|
|
Written communications pursuant to Rule 425 under the Securities Act (17 CFR 230.425) |
|
|
Soliciting material pursuant to Rule 14a-12 under the Exchange Act (17 CFR 240.14a-12) |
|
|
Pre-commencement communications pursuant to Rule 14d-2(b) under the Exchange Act (17 CFR 240.14d-2(b)) |
|
|
Pre-commencement communications pursuant to Rule 13e-4(c) under the Exchange Act (17 CFR 240.13e-4(c)) |
Securities registered pursuant to Section 12(b) of the Act:
|
Title of each class |
Trading Symbol(s) |
Name of each exchange on which registered |
|
|
|
|
Indicate by check mark whether the registrant is an emerging growth company as defined in Rule 405 of the Securities Act of 1933 (§ 230.405 of this chapter) or Rule 12b-2 of the Securities Exchange Act of 1934 (§ 240.12b-2 of this chapter).
Emerging growth company
If an emerging growth company, indicate by check mark if the registrant has elected not to use the extended transition period for complying with any new or revised financial accounting standards provided pursuant to Section 13(a) of the Exchange Act. ☐
Item 2.02 Results of Operations and Financial Condition.
On November 12, 2021, Great Elm Group, Inc. issued the press release and published the presentation furnished as exhibits 99.1 and 99.2, respectively, to this report.
The foregoing information (including the exhibits hereto) is being furnished and shall not be deemed “filed” for purposes of Section 18 of the Securities Exchange Act of 1934, as amended (the “Exchange Act”), or otherwise subject to the liabilities of that section, nor shall such information be deemed incorporated by reference in any filing under the Securities Act of 1933, as amended, or the Exchange Act, except as expressly set forth by specific reference in such filing.
Item 9.01 Financial Statements and Exhibits.
(d) Exhibits.
The following exhibits are furnished with this report but shall not be deemed filed:
|
|
|
|
|
Exhibit Number |
|
Description |
|
99.1 |
|
|
|
99.2 |
|
|
|
104 |
|
The cover page from this current Report on Form 8-K, formatted as inline XBRL. |
SIGNATURES
Pursuant to the requirements of the Securities Exchange Act of 1934, the registrant has duly caused this report to be signed on its behalf by the undersigned hereunto duly authorized.
|
|
|
GREAT ELM GROUP, INC. |
|
|
|
|
|
Date: November 12, 2021 |
|
_/s/ Brent J. Pearson______ |
|
|
|
By: Brent J. Pearson |
|
|
|
Title: Chief Financial Officer |
Exhibit 99.1
Great Elm Group Reports FISCAL 2022 FIRST QUARTER
financial resulTs
Company to Host Conference Call at 9:00 a.m. ET on November 12, 2021
WALTHAM, Mass., November 12, 2021 -- Great Elm Group, Inc. (“we,” “us,” “our,” “GEG,” or “Great Elm”) (NASDAQ: GEG), a diversified holding company, today announced financial results for its fiscal first quarter ended September 30, 2021.
Fiscal 2022 First Quarter Operating and Financial Highlights
(all comparisons versus the prior-year period unless otherwise noted)
|
|
• |
Consolidated revenue for the first quarter was $16.5 million, compared to $15.4 million. |
|
|
• |
Consolidated net income from continuing operations for the first quarter was $0.1 million, compared to net loss from continuing operations of $3.8 million. |
|
|
• |
Consolidated Adjusted EBITDA for the first quarter ended September 30, 2021 was $4.3 million, compared to $1.9 million. |
|
|
• |
Made a strategic minority investment in the Sharp Alpha Fund I, LP, a private fund that is investing in early-stage companies seeking to address the growing sports betting market. |
|
|
• |
As of September 30, 2021, we had approximately $952 million of net operating loss (NOL) carryforwards for federal income tax purposes |
Operating Companies:
|
|
• |
Durable Medical Equipment (DME) grew total revenue for the first quarter by 6.5% to $15.6 million, compared to $14.6 million; driven by strong resupply sales despite challenging pandemic related conditions. |
|
|
• |
DME reported net income for the first quarter was $2.1 million, compared to a net loss of 0.5 million. |
|
|
• |
DME reported Adjusted EBITDA for the first quarter was of $5.1 million, compared to $2.8 million. |
|
|
• |
On August 31, 2021, acquired the power mobility assets of MedOne Healthcare LLC (MedOne), a high service power mobility provider in Arizona. The acquisition enhances DME’s power mobility solutions and expands its referral network. |
Investment Management (IM):
|
|
• |
IM increased revenue for the first quarter to $1.0 million, compared to $0.8 million. |
|
|
• |
IM reported a net loss for the first quarter of $0.1 million, compared to net loss of $1.5 million. |
|
|
• |
IM reported Adjusted EBITDA for the first quarter was $0.1 million, compared to $0.2 million. |
|
|
• |
On September 20, 2021, Great Elm Capital Corp. (GECC) acquired a majority ownership interest in Lenders Funding, LLC (Lenders Funding), a private funding and risk sharing source for factors and asset-based lenders. |
Management Commentary
Peter A. Reed, Chief Executive Officer, stated, “We reported an excellent period in DME despite the challenges of a relatively slow return to normal operations following the pandemic conditions over the past year. DME completed the acquisition of MedOne during the period, which marks the second completed acquisition during calendar 2021. We also have good momentum in IM, growing assets under management during the period and completing the acquisition by GECC of a majority ownership stake in Lenders Funding, which purchases participations in factoring and asset-based lending transactions. We are building upon our strategy at GECC of creating a portfolio of specialty finance solutions with the ability to service the liquidity needs of small businesses at varying stages of their development and are pleased with our pipeline of further growth opportunities in this space.”
Alignment of Interest
A distinct attribute of Great Elm is the particularly strong alignment of interest among shareholders and the employees, directors, and other insiders of Great Elm. As of September 30, 2021, Great Elm’s employees and directors (including funds under their management) collectively own or manage approximately 30% of GEG’s total outstanding shares.
Financial Review
Discussion of Financial Results by Segment for the Fiscal Quarter ended September 30, 2021
Great Elm is a holding company with two operating segments: Operating Companies and Investment Management, with General Corporate representing unallocated costs and activity to arrive at consolidated operations.
-2-
Operating Companies
During the three months ended September 30, 2021, DME reported $15.6 million in total revenue, compared to $14.6 million during the same period in the prior year. The increase in revenues was due to organic growth in resupply sales and the impact of acquisitions.
During the three months ended September 30, 2021, DME reported net income of $2.1 million, compared to net loss of $0.5 million for the same period in the prior year. Net income increased largely due to $2.3 million in employee retention credits claimed under the CARES Act in the current quarter.
During the three months ended September 30, 2021, DME Adjusted EBITDA, was $5.1 million, compared to $2.8 million in the prior-year period.
Investment Management
During the three months ended September 30, 2021, IM reported total revenue of $1.0 million, compared to $0.8 million during the same period in the prior year. Revenue for the quarter was slightly higher due to increases in the average assets on which such fees are calculated.
During the three months ended September 30, 2021, IM recognized a net loss of $0.1 million, compared to a net loss of $1.5 million during the same period in the prior year, which was driven primarily by unrealized losses on our investment in GECC in the prior period due to COVID-19-related volatility.
During the three months ended September 30, 2021, IM Adjusted EBITDA was $0.1 million, compared to $0.2 million during the same period in the prior year. Adjusted EBITDA for the quarter was impacted primarily by increased employee-related costs and professional fees related to investment management growth initiatives.
General Corporate
During the three months ended September 30, 2021, General Corporate recognized $0.2 million in revenue compared to $0.1 million in revenue during the same period in the prior year. Revenue increased slightly as
-3-
a result of Forest management fees which commenced in December 2020 in connection with our holding company reorganization.
During the three months ended September 30, 2021, General Corporate recognized a net loss from continuing operations of $1.8 million, compared to $1.8 million during the same period in the prior year.
During the three months ended September 30, 2021, General Corporate recognized ($1.0) million in Adjusted EBITDA, compared to Adjusted EBITDA of ($1.1) million during the same period in the prior year. Great Elm made significant progress on reducing its corporate overhead, driven by lower audit fees due to a change in auditors in the prior fiscal year and other decreases in professional service expense.
Fiscal 2022 First Quarter Conference Call & Webcast Information
When:Friday, November 12, 2021, 9:00 a.m. Eastern Time (ET)
|
Call: |
All interested parties are invited to participate in the conference call by dialing +1 (844) 559-0750; international callers should dial +1 (647) 689-5386. Participants should enter the Conference ID 6687507 when asked. |
About Great Elm Group, Inc.
Great Elm Group, Inc. (NASDAQ: GEG) is a publicly-traded holding company that is building a business across two operating verticals: operating companies and investment management. Great Elm Group, Inc.’s website can be found at www.greatelmgroup.com.
Safe Harbor Statement under the Private Securities Litigation Reform Act of 1995
-4-
Statements in this press release that are “forward-looking” statements, including statements regarding revenue, Adjusted EBITDA, expected growth, profitability, acquisition opportunities and outlook involve risks and uncertainties that may individually or collectively impact the matters described herein. Investors are cautioned not to place undue reliance on any such forward-looking statements, which speak only as of the date they are made and represent Great Elm’s assumptions and expectations in light of currently available information. These statements involve risks, variables and uncertainties, and Great Elm’s actual performance results may differ from those projected, and any such differences may be material. For information on certain factors that could cause actual events or results to differ materially from Great Elm’s expectations, please see Great Elm’s filings with the SEC, including its most recent annual report on Form 10-K and subsequent reports on Forms 10-Q and 8-K. Additional information relating to Great Elm’s financial position and results of operations is also contained in Great Elm’s annual and quarterly reports filed with the SEC and available for download at its website www.greatelmgroup.com or at the SEC website www.sec.gov.
Please note that previously reported amounts below have been recast to 1) reflect the operations of our real estate business as discontinued operations; 2) reflect the full retrospective adoption of ASU 2020-06, Accounting for Convertible Instruments and Contracts in an Entity’s Own Equity; and 3) conform with current segment organization.
Non-GAAP Financial Measures
The SEC has adopted rules to regulate the use in filings with the SEC, and in public disclosures, of financial measures that are not in accordance with US GAAP, such as adjusted earnings before interest, taxes, depreciation and amortization (“Adjusted EBITDA”). Adjusted EBITDA is derived from methodologies other than in accordance with US GAAP. Great Elm believes that Adjusted EBITDA is an important measure for investors to use in evaluating Great Elm’s businesses. In addition, Great Elm’s management reviews Adjusted EBITDA as they evaluate acquisition opportunities.
Adjusted EBITDA has limitations as an analytical tool, and you should not consider it either in isolation from, or as a substitute for, analyzing Great Elm’s results as reported under US GAAP. Non-GAAP financial measures reported by Great Elm may not be comparable to similarly titled amounts reported by other companies.
-5-
Included in the financial tables below is a reconciliation of Adjusted EBITDA to the most directly comparable US GAAP financial measure, net income.
Media & Investor Contact:
Investor Relations
Adam Prior
The Equity Group Inc.
+1 (212) 836-9606
-6-
Great Elm Group, Inc.
Condensed Consolidated Balance Sheets (Unaudited)
Dollar amounts in thousands (except per share data)
|
ASSETS |
|
September 30, 2021 |
|
|
June 30, 2021 |
|
||
|
Current assets: |
|
|
|
|
|
|
|
|
|
Cash and cash equivalents |
|
$ |
21,791 |
|
|
$ |
24,382 |
|
|
Accounts receivable |
|
|
5,544 |
|
|
|
6,518 |
|
|
Related party receivables |
|
|
1,895 |
|
|
|
1,665 |
|
|
Investments, at fair value (cost $44,647 and $45,326, respectively) |
|
|
24,008 |
|
|
|
24,044 |
|
|
Inventories |
|
|
1,071 |
|
|
|
1,066 |
|
|
Prepaid and other current assets |
|
|
5,169 |
|
|
|
3,791 |
|
|
Assets of consolidated funds |
|
|
|
|
|
|
|
|
|
Investments, at fair value (cost $26,955 and $26,814, respectively) |
|
|
26,541 |
|
|
|
26,490 |
|
|
Prepaid expenses and other assets |
|
|
574 |
|
|
|
578 |
|
|
Total current assets |
|
|
86,593 |
|
|
|
88,534 |
|
|
Property and equipment, net |
|
|
885 |
|
|
|
981 |
|
|
Equipment held for rental, net |
|
|
7,230 |
|
|
|
7,391 |
|
|
Identifiable intangible assets, net |
|
|
8,509 |
|
|
|
8,928 |
|
|
Goodwill |
|
|
52,463 |
|
|
|
50,536 |
|
|
Right of use assets |
|
|
5,184 |
|
|
|
5,241 |
|
|
Other assets |
|
|
256 |
|
|
|
258 |
|
|
Total assets |
|
$ |
161,120 |
|
|
$ |
161,869 |
|
|
LIABILITIES, NON-CONTROLLING INTEREST AND STOCKHOLDERS' EQUITY |
|
|
|
|
|
|
|
|
|
Current liabilities: |
|
|
|
|
|
|
|
|
|
Accounts payable |
|
$ |
5,108 |
|
|
$ |
5,521 |
|
|
Accrued expenses and other liabilities |
|
|
5,534 |
|
|
|
6,955 |
|
|
Deferred revenue |
|
|
3,279 |
|
|
|
4,438 |
|
|
Current portion of lease liabilities |
|
|
2,171 |
|
|
|
1,920 |
|
|
Current portion of capitalized equipment financing |
|
|
2,927 |
|
|
|
1,974 |
|
|
Liabilities of consolidated funds- accrued expenses and other |
|
|
11,940 |
|
|
|
12,197 |
|
|
Total current liabilities |
|
|
30,959 |
|
|
|
33,005 |
|
|
Lease liabilities, net of current portion |
|
|
3,281 |
|
|
|
3,596 |
|
|
Convertible notes (face value $34,346, including $16,231 held by related parties) |
|
|
33,362 |
|
|
|
33,333 |
|
|
Equipment financing debt, net of current portion |
|
|
42 |
|
|
|
67 |
|
|
Redeemable preferred stock of subsidiaries (held by related parties, face value $37,018) |
|
|
35,584 |
|
|
|
35,529 |
|
|
Other liabilities |
|
|
1,254 |
|
|
|
915 |
|
|
Total liabilities |
|
|
104,482 |
|
|
|
106,445 |
|
|
Commitments and Contingencies (Note 20) |
|
|
|
|
|
|
|
|
|
Contingently redeemable non-controlling interest |
|
|
2,844 |
|
|
|
2,639 |
|
|
Stockholders' equity |
|
|
|
|
|
|
|
|
-7-
|
Preferred stock, $0.001 par value; 5,000,000 authorized and zero outstanding |
|
|
- |
|
|
|
- |
|
|
Common stock, $0.001 par value; 350,000,000 shares authorized and 26,692,033 shares issued and 26,093,185 outstanding at September 30, 2021; and 26,613,913 shares issued and 25,948,100 outstanding at June 30, 2021 |
|
|
26 |
|
|
|
26 |
|
|
Additional paid-in-capital |
|
|
3,308,194 |
|
|
|
3,307,613 |
|
|
Accumulated deficit |
|
|
(3,264,603 |
) |
|
|
(3,264,403 |
) |
|
Total Great Elm Group, Inc. stockholders' equity |
|
|
43,617 |
|
|
|
43,236 |
|
|
Non-controlling interests |
|
|
10,177 |
|
|
|
9,549 |
|
|
Total stockholders' equity |
|
|
53,794 |
|
|
|
52,785 |
|
|
Total liabilities, non-controlling interest and stockholders' equity |
|
$ |
161,120 |
|
|
$ |
161,869 |
|
-8-
Great Elm Group, Inc.
Condensed Consolidated Statements of Operations (Unaudited)
Dollar amounts in thousands (except per share data)
|
|
|
For the three months ended September 30, |
|
|||||
|
|
|
2021 |
|
|
2020 |
|
||
|
Revenues: |
|
|
|
|
|
|
|
|
|
Durable medical equipment sales and services revenue |
|
$ |
10,076 |
|
|
$ |
9,213 |
|
|
Durable medical equipment rental income |
|
|
5,479 |
|
|
|
5,397 |
|
|
Investment management revenues |
|
|
983 |
|
|
|
773 |
|
|
Total revenues |
|
|
16,538 |
|
|
|
15,383 |
|
|
|
|
|
|
|
|
|
|
|
|
Operating costs and expenses: |
|
|
|
|
|
|
|
|
|
Cost of durable medical equipment sold and services |
|
|
4,060 |
|
|
|
4,207 |
|
|
Cost of durable medical equipment rentals1 |
|
|
1,850 |
|
|
|
1,915 |
|
|
Durable medical equipment other operating expenses2 |
|
|
6,253 |
|
|
|
7,680 |
|
|
Investment management expenses |
|
|
1,187 |
|
|
|
726 |
|
|
Depreciation and amortization |
|
|
562 |
|
|
|
591 |
|
|
Selling, general and administrative3 |
|
|
1,573 |
|
|
|
1,413 |
|
|
Expenses of consolidated funds |
|
|
52 |
|
|
|
- |
|
|
Total operating costs and expenses |
|
|
15,537 |
|
|
|
16,532 |
|
|
Operating income (loss) |
|
|
1,001 |
|
|
|
(1,149 |
) |
|
Dividends and interest income |
|
|
653 |
|
|
|
529 |
|
|
Net realized and unrealized loss on investment |
|
|
(14 |
) |
|
|
(1,902 |
) |
|
Net realized and unrealized loss on investments of consolidated funds |
|
|
(189 |
) |
|
|
- |
|
|
Interest expense |
|
|
(1,362 |
) |
|
|
(1,145 |
) |
|
Other income, net |
|
|
16 |
|
|
|
(2 |
) |
|
Income (loss) from continuing operations, before income taxes |
|
|
105 |
|
|
|
(3,669 |
) |
|
Income tax benefit (expense) |
|
|
1 |
|
|
|
(99 |
) |
|
Income (loss) from continuing operations |
|
|
106 |
|
|
|
(3,768 |
) |
|
Discontinued operations: |
|
|
|
|
|
|
|
|
|
Income from discontinued operations, net of tax |
|
|
- |
|
|
|
67 |
|
|
Net income (loss) |
|
$ |
106 |
|
|
$ |
(3,701 |
) |
|
Less: net income (loss) attributable to non-controlling interest, continuing operations |
|
|
306 |
|
|
|
(120 |
) |
|
Less: net income attributable to non-controlling interest, discontinued operations |
|
|
- |
|
|
|
13 |
|
|
Net loss attributable to Great Elm Group, Inc. |
|
$ |
(200 |
) |
|
$ |
(3,594 |
) |
-9-
|
Basic and diluted income (loss) per share from: |
|
|
|
|
|
|
|
|
|
Continuing operations |
|
$ |
(0.01 |
) |
|
$ |
(0.14 |
) |
|
Discontinued operations |
|
|
- |
|
|
|
0.00 |
|
|
Net loss |
|
$ |
(0.01 |
) |
|
$ |
(0.14 |
) |
|
Weighted average shares outstanding |
|
|
|
|
|
|
|
|
|
Basic |
|
|
25,982 |
|
|
|
25,576 |
|
|
Diluted |
|
|
25,982 |
|
|
|
25,576 |
|
|
|
|
|
|
|
|
|
|
|
|
(1) Includes depreciation expense of: |
|
|
1,688 |
|
|
|
1,748 |
|
|
(2) Net of CARES Act Stimulus of: |
|
|
2,321 |
|
|
|
- |
|
|
(3) Net of CARES Act Stimulus of: |
|
|
84 |
|
|
|
- |
|
-10-
Great Elm Group, Inc.
Reconciliation from EBITDA to Adjusted EBITDA - Quarterly
Dollar amounts in thousands (except per share data)
|
|
For the three months ended September 30, 2021 |
||||||
|
$ in thousands |
Durable Medical Equipment |
|
Investment Management |
|
Corporate |
|
Consolidated |
|
|
|
|
|
|
|
|
|
|
EBITDA: |
|
|
|
|
|
|
|
|
Income (loss) from continuing operations - GAAP |
$ 2,082 |
|
$ (140) |
|
$ (1,836) |
|
$ 106 |
|
Interest expense |
1,287 |
|
24 |
|
1,269 |
|
2,581 |
|
Interest income from preferred stock |
- |
|
- |
|
(1,218) |
|
(1,218) |
|
Depreciation & amortization |
2,142 |
|
109 |
|
- |
|
2,251 |
|
Tax expense |
- |
|
- |
|
(1) |
|
(1) |
|
EBITDA |
5,511 |
|
(7) |
|
(1,786) |
|
3,717 |
|
Adjusted EBITDA |
|
|
|
|
|
|
|
|
Non-cash compensation |
- |
|
396 |
|
372 |
|
768 |
|
Change in contingent consideration |
(163) |
|
- |
|
- |
|
(163) |
|
Dividend income |
- |
|
(554) |
|
(99) |
|
(653) |
|
(Gains) / losses on investments |
- |
|
305 |
|
(102) |
|
203 |
|
Other (income) expense |
(560) |
|
- |
|
544 |
|
(16) |
|
Transaction and integration costs (2) |
219 |
|
- |
|
184 |
|
403 |
|
DME management and monitoring fees |
130 |
|
- |
|
(130) |
|
- |
|
Adjusted EBITDA |
$ 5,137 |
|
$ 140 |
|
$ (1,017) |
|
$ 4,260 |
|
|
For the three months ended September 30, 2020 |
||||||
|
$ in thousands |
Durable Medical Equipment |
|
Investment Management (1) |
|
Corporate (1) |
|
Consolidated |
|
|
|
|
|
|
|
|
|
|
EBITDA: |
|
|
|
|
|
|
|
|
Income (loss) from continuing operations - GAAP |
$ (458) |
|
$ (1,485) |
|
$ (1,825) |
|
$ (3,768) |
|
Interest expense |
709 |
|
26 |
|
409 |
|
1,144 |
|
Interest income from preferred stock |
- |
|
- |
|
- |
|
- |
|
Depreciation & amortization |
2,211 |
|
128 |
|
- |
|
2,339 |
-11-
|
Tax expense |
- |
|
- |
|
99 |
|
99 |
|
EBITDA |
2,462 |
|
(1,331) |
|
(1,317) |
|
(186) |
|
Adjusted EBITDA |
|
|
|
|
|
|
|
|
Non-cash compensation |
- |
|
194 |
|
235 |
|
429 |
|
Change in contingent consideration |
- |
|
- |
|
- |
|
- |
|
Dividend income |
- |
|
(524) |
|
- |
|
(524) |
|
(Gains) / losses on investments |
- |
|
1,902 |
|
- |
|
1,902 |
|
Other (income) expense |
3 |
|
- |
|
- |
|
3 |
|
Transaction and integration costs (2) |
139 |
|
- |
|
32 |
|
171 |
|
Pharmacy closure |
54 |
|
- |
|
- |
|
54 |
|
DME management and monitoring fees |
116 |
|
- |
|
(91) |
|
25 |
|
Adjusted EBITDA |
$ 2,774 |
|
$ 241 |
|
$ (1,141) |
|
$ 1,874 |
(1) Previously reported non-operating activity including dividend income and unrealized gains/losses related to managed investments has been reclassified from General Corporate to Investment Management to conform with current segment organization
(2) Transaction and integration related costs include costs to acquire and integrate acquired businesses.
-12-
Great Elm Group, Inc. Conference Call Presentation Fiscal First Quarter Ended September 30, 2021 November 12, 2021 NASDAQ: GEG Exhibit 99.2
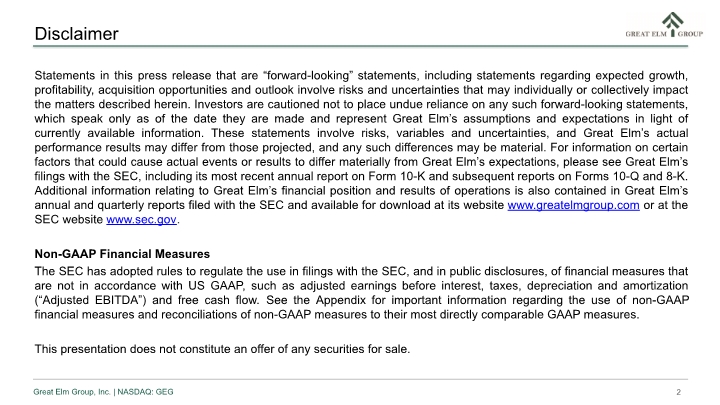
Disclaimer Statements in this press release that are “forward-looking” statements, including statements regarding expected growth, profitability, acquisition opportunities and outlook involve risks and uncertainties that may individually or collectively impact the matters described herein. Investors are cautioned not to place undue reliance on any such forward-looking statements, which speak only as of the date they are made and represent Great Elm’s assumptions and expectations in light of currently available information. These statements involve risks, variables and uncertainties, and Great Elm’s actual performance results may differ from those projected, and any such differences may be material. For information on certain factors that could cause actual events or results to differ materially from Great Elm’s expectations, please see Great Elm’s filings with the SEC, including its most recent annual report on Form 10-K and subsequent reports on Forms 10-Q and 8-K. Additional information relating to Great Elm’s financial position and results of operations is also contained in Great Elm’s annual and quarterly reports filed with the SEC and available for download at its website www.greatelmgroup.com or at the SEC website www.sec.gov. Non-GAAP Financial Measures The SEC has adopted rules to regulate the use in filings with the SEC, and in public disclosures, of financial measures that are not in accordance with US GAAP, such as adjusted earnings before interest, taxes, depreciation and amortization (“Adjusted EBITDA”) and free cash flow. See the Appendix for important information regarding the use of non-GAAP financial measures and reconciliations of non-GAAP measures to their most directly comparable GAAP measures. This presentation does not constitute an offer of any securities for sale. 2
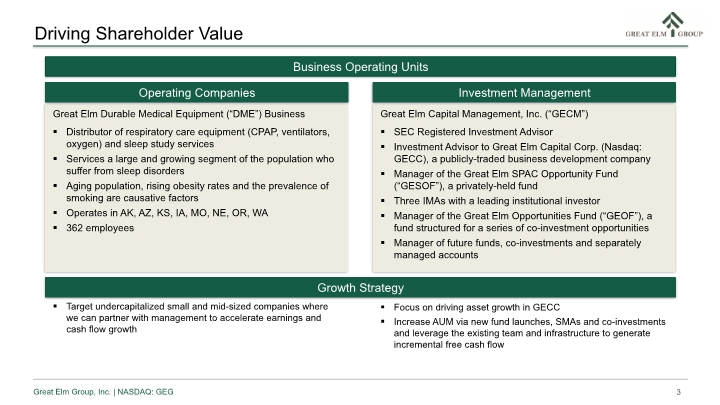
Driving Shareholder Value Growth Strategy Target undercapitalized small and mid-sized companies where we can partner with management to accelerate earnings and cash flow growth Great Elm Capital Management, Inc. (“GECM”) SEC Registered Investment Advisor Investment Advisor to Great Elm Capital Corp. (Nasdaq: GECC), a publicly-traded business development company Manager of the Great Elm SPAC Opportunity Fund (“GESOF”), a privately-held fund Three IMAs with a leading institutional investor Manager of the Great Elm Opportunities Fund (“GEOF”), a fund structured for a series of co-investment opportunities Manager of future funds, co-investments and separately managed accounts Investment Management Great Elm Durable Medical Equipment (“DME”) Business Distributor of respiratory care equipment (CPAP, ventilators, oxygen) and sleep study services Services a large and growing segment of the population who suffer from sleep disorders Aging population, rising obesity rates and the prevalence of smoking are causative factors Operates in AK, AZ, KS, IA, MO, NE, OR, WA 362 employees Operating Companies Business Operating Units Focus on driving asset growth in GECC Increase AUM via new fund launches, SMAs and co-investments and leverage the existing team and infrastructure to generate incremental free cash flow 3
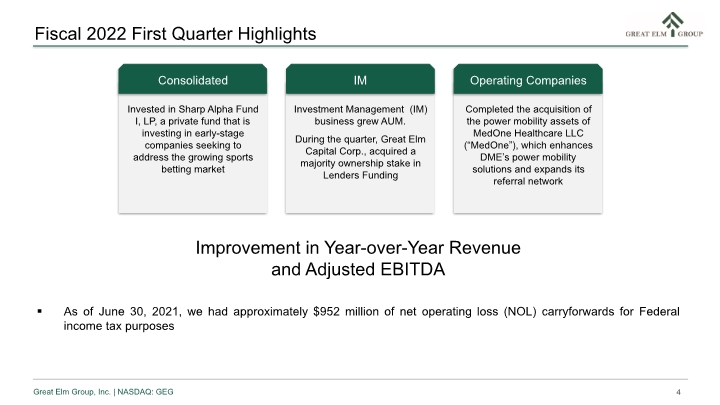
Fiscal 2022 First Quarter Highlights As of June 30, 2021, we had approximately $952 million of net operating loss (NOL) carryforwards for Federal income tax purposes 4 Improvement in Year-over-Year Revenue and Adjusted EBITDA
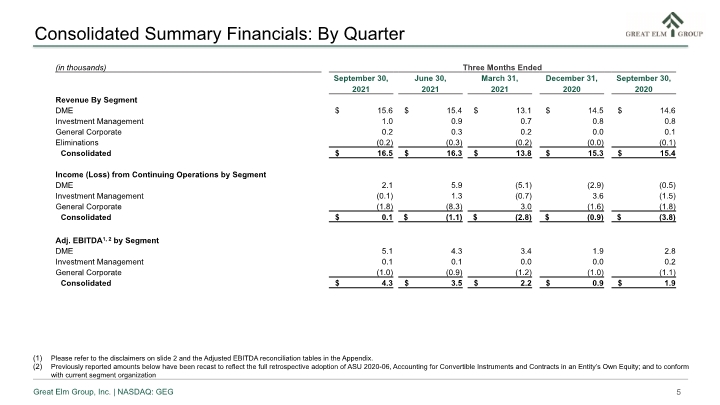
Please refer to the disclaimers on slide 2 and the Adjusted EBITDA reconciliation tables in the Appendix. Previously reported amounts below have been recast to reflect the full retrospective adoption of ASU 2020-06, Accounting for Convertible Instruments and Contracts in an Entity’s Own Equity; and to conform with current segment organization Consolidated Summary Financials: By Quarter 5
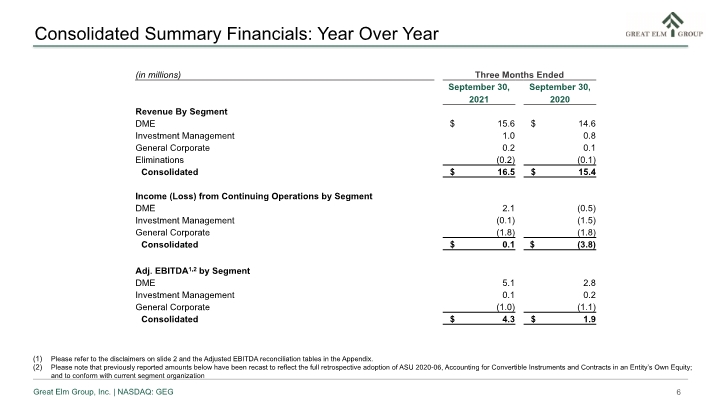
Consolidated Summary Financials: Year Over Year Please refer to the disclaimers on slide 2 and the Adjusted EBITDA reconciliation tables in the Appendix. Please note that previously reported amounts below have been recast to reflect the full retrospective adoption of ASU 2020-06, Accounting for Convertible Instruments and Contracts in an Entity’s Own Equity; and to conform with current segment organization 6
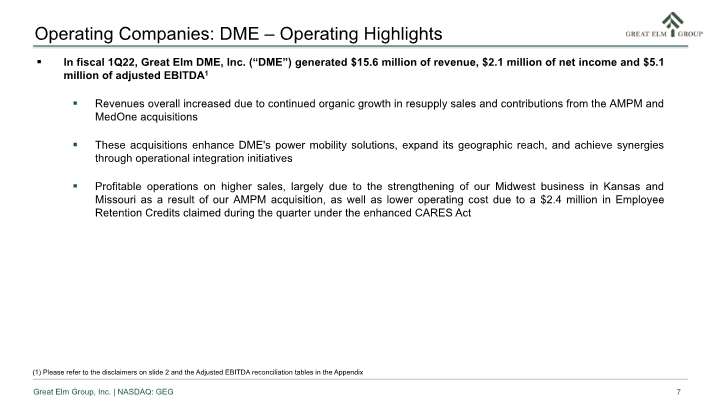
In fiscal 1Q22, Great Elm DME, Inc. (“DME”) generated $15.6 million of revenue, $2.1 million of net income and $5.1 million of adjusted EBITDA1 Revenues overall increased due to continued organic growth in resupply sales and contributions from the AMPM and MedOne acquisitions These acquisitions enhance DME's power mobility solutions, expand its geographic reach, and achieve synergies through operational integration initiatives Profitable operations on higher sales, largely due to the strengthening of our Midwest business in Kansas and Missouri as a result of our AMPM acquisition, as well as lower operating cost due to a $2.4 million in Employee Retention Credits claimed during the quarter under the enhanced CARES Act (1) Please refer to the disclaimers on slide 2 and the Adjusted EBITDA reconciliation tables in the Appendix 7 Operating Companies: DME – Operating Highlights
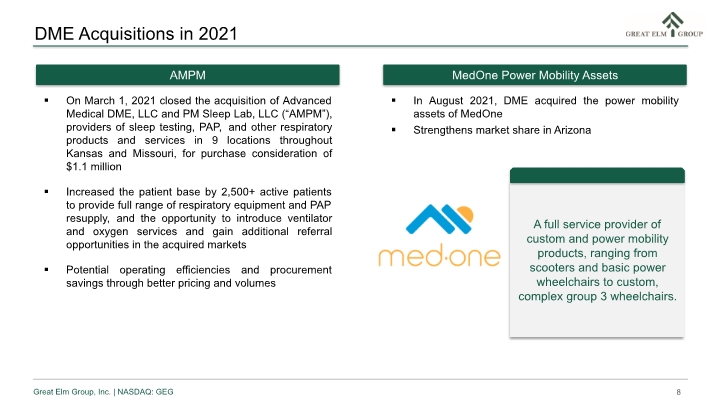
In August 2021, DME acquired the power mobility assets of MedOne Strengthens market share in Arizona 8 DME Acquisitions in 2021 On March 1, 2021 closed the acquisition of Advanced Medical DME, LLC and PM Sleep Lab, LLC (“AMPM”), providers of sleep testing, PAP, and other respiratory products and services in 9 locations throughout Kansas and Missouri, for purchase consideration of $1.1 million Increased the patient base by 2,500+ active patients to provide full range of respiratory equipment and PAP resupply, and the opportunity to introduce ventilator and oxygen services and gain additional referral opportunities in the acquired markets Potential operating efficiencies and procurement savings through better pricing and volumes AMPM MedOne Power Mobility Assets
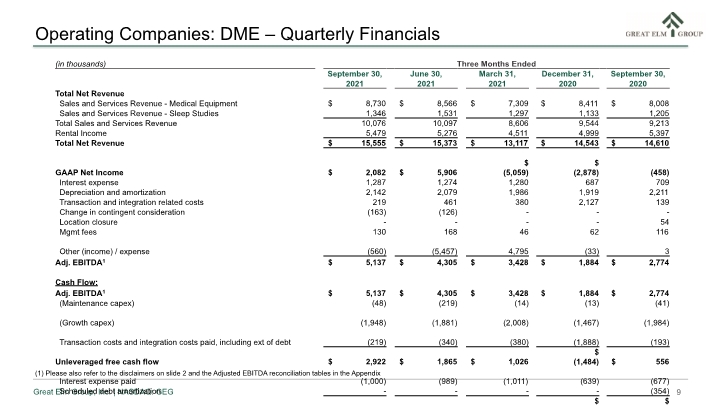
Operating Companies: DME – Quarterly Financials (1) Please also refer to the disclaimers on slide 2 and the Adjusted EBITDA reconciliation tables in the Appendix 9
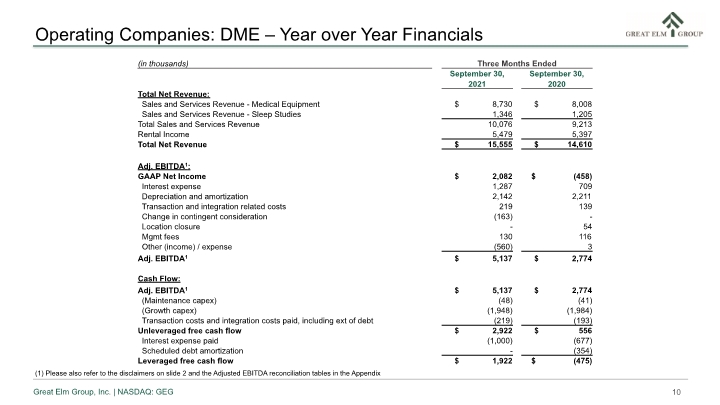
Operating Companies: DME – Year over Year Financials (1) Please also refer to the disclaimers on slide 2 and the Adjusted EBITDA reconciliation tables in the Appendix 10
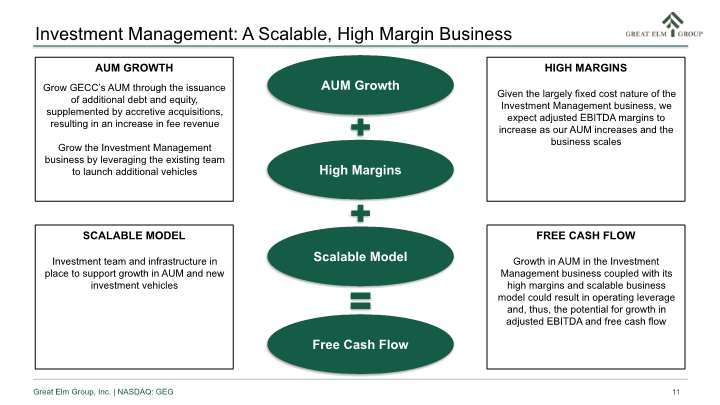
AUM Growth High Margins Scalable Model Free Cash Flow AUM GROWTH Grow GECC’s AUM through the issuance of additional debt and equity, supplemented by accretive acquisitions, resulting in an increase in fee revenue Grow the Investment Management business by leveraging the existing team to launch additional vehicles HIGH MARGINS Given the largely fixed cost nature of the Investment Management business, we expect adjusted EBITDA margins to increase as our AUM increases and the business scales SCALABLE MODEL Investment team and infrastructure in place to support growth in AUM and new investment vehicles FREE CASH FLOW Growth in AUM in the Investment Management business coupled with its high margins and scalable business model could result in operating leverage and, thus, the potential for growth in adjusted EBITDA and free cash flow 11 Investment Management: A Scalable, High Margin Business
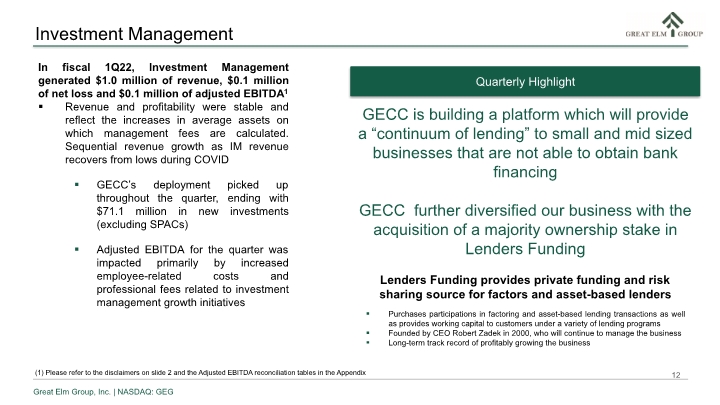
In fiscal 1Q22, Investment Management generated $1.0 million of revenue, $0.1 million of net loss and $0.1 million of adjusted EBITDA1 Revenue and profitability were stable and reflect the increases in average assets on which management fees are calculated. Sequential revenue growth as IM revenue recovers from lows during COVID GECC’s deployment picked up throughout the quarter, ending with $71.1 million in new investments (excluding SPACs) Adjusted EBITDA for the quarter was impacted primarily by increased employee-related costs and professional fees related to investment management growth initiatives (1) Please refer to the disclaimers on slide 2 and the Adjusted EBITDA reconciliation tables in the Appendix 12 Investment Management Lenders Funding provides private funding and risk sharing source for factors and asset-based lenders Purchases participations in factoring and asset-based lending transactions as well as provides working capital to customers under a variety of lending programs Founded by CEO Robert Zadek in 2000, who will continue to manage the business Long-term track record of profitably growing the business Quarterly Highlight GECC is building a platform which will provide a “continuum of lending” to small and mid sized businesses that are not able to obtain bank financing GECC further diversified our business with the acquisition of a majority ownership stake in Lenders Funding
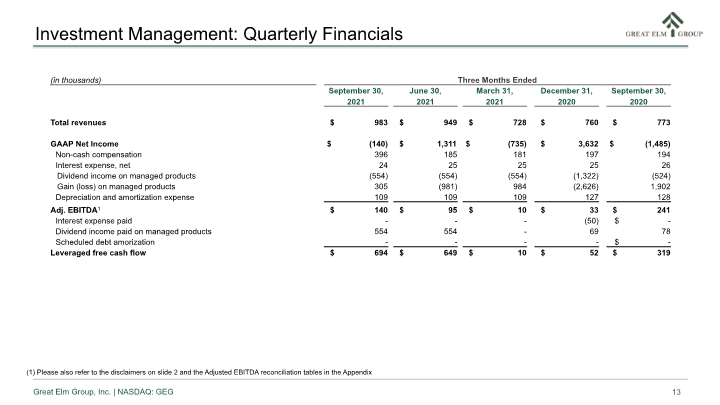
(1) Please also refer to the disclaimers on slide 2 and the Adjusted EBITDA reconciliation tables in the Appendix 13 Investment Management: Quarterly Financials
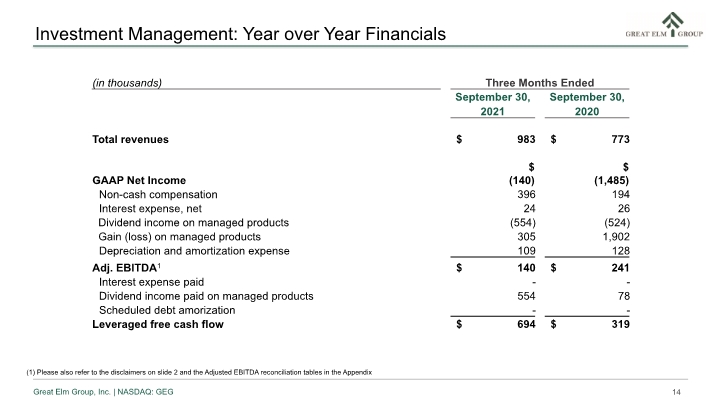
(1) Please also refer to the disclaimers on slide 2 and the Adjusted EBITDA reconciliation tables in the Appendix 14 Investment Management: Year over Year Financials
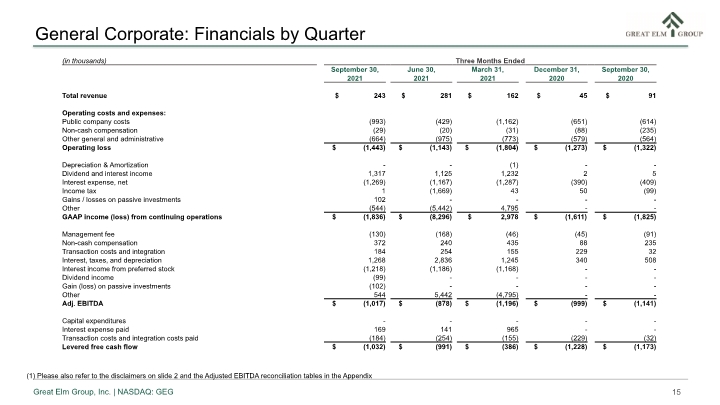
(1) Please also refer to the disclaimers on slide 2 and the Adjusted EBITDA reconciliation tables in the Appendix 15 General Corporate: Financials by Quarter
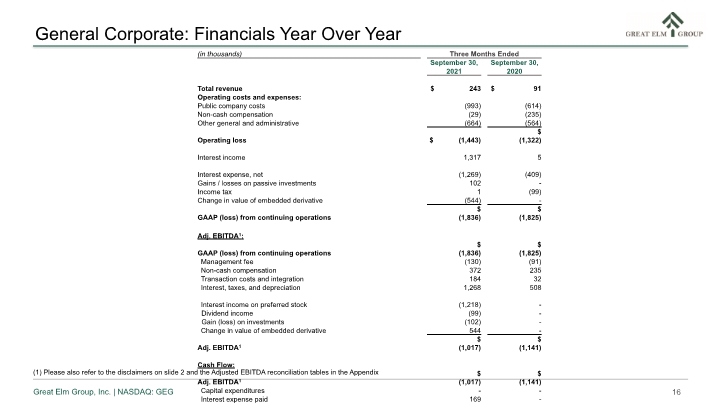
(1) Please also refer to the disclaimers on slide 2 and the Adjusted EBITDA reconciliation tables in the Appendix 16 General Corporate: Financials Year Over Year
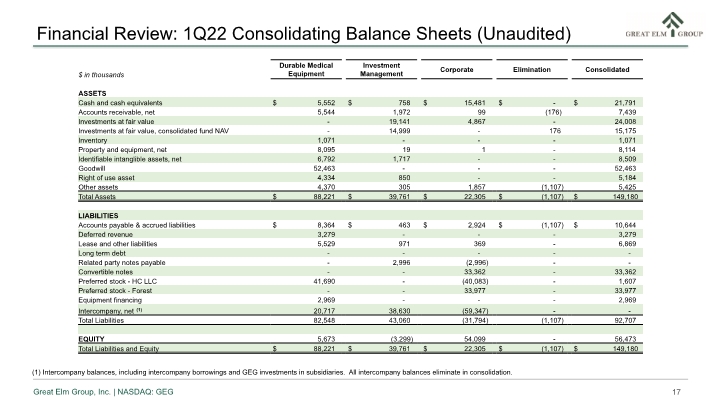
Financial Review: 1Q22 Consolidating Balance Sheets (Unaudited) (1) Intercompany balances, including intercompany borrowings and GEG investments in subsidiaries. All intercompany balances eliminate in consolidation. 17
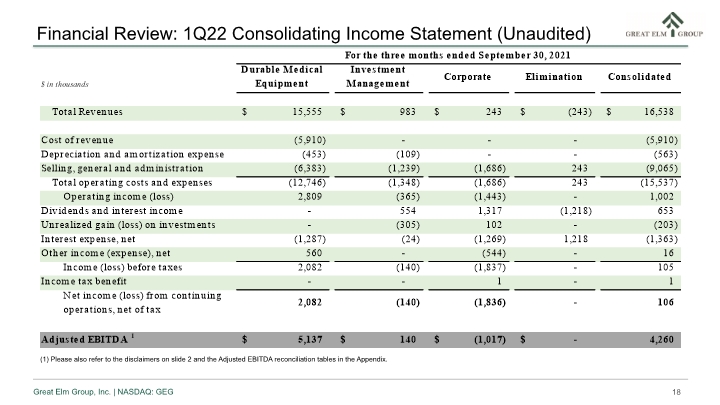
(1) Please also refer to the disclaimers on slide 2 and the Adjusted EBITDA reconciliation tables in the Appendix. 18 Financial Review: 1Q22 Consolidating Income Statement (Unaudited)
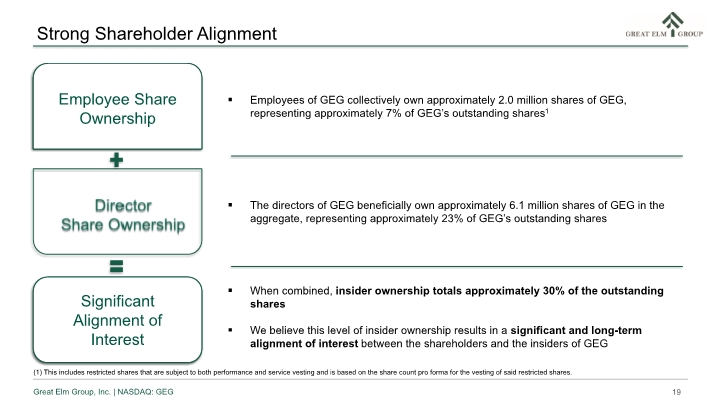
Employee Share Ownership Significant Alignment of Interest Director Share Ownership Employees of GEG/Great Elm Capital Management, Inc. (“GECM”) collectively own approximately 1.9 million shares of GEG, representing approximately 7% of GEG’s outstanding shares1 The directors of GEG beneficially own approximately 5.2 million shares of GEG in the aggregate, representing approximately 20% of GEG’s outstanding shares When combined, insider ownership totals approximately 27% of the outstanding shares We believe this level of insider ownership results in a significant and long-term alignment of interest between the shareholders and the insiders of GEG (1) This includes restricted shares that are subject to both performance and service vesting and is based on the share count pro forma for the vesting of said restricted shares. Employee Share Ownership Significant Alignment of Interest Employees of GEG collectively own approximately 2.0 million shares of GEG, representing approximately 7% of GEG’s outstanding shares1 The directors of GEG beneficially own approximately 6.1 million shares of GEG in the aggregate, representing approximately 23% of GEG’s outstanding shares When combined, insider ownership totals approximately 30% of the outstanding shares We believe this level of insider ownership results in a significant and long-term alignment of interest between the shareholders and the insiders of GEG 19 Strong Shareholder Alignment
Appendix 20
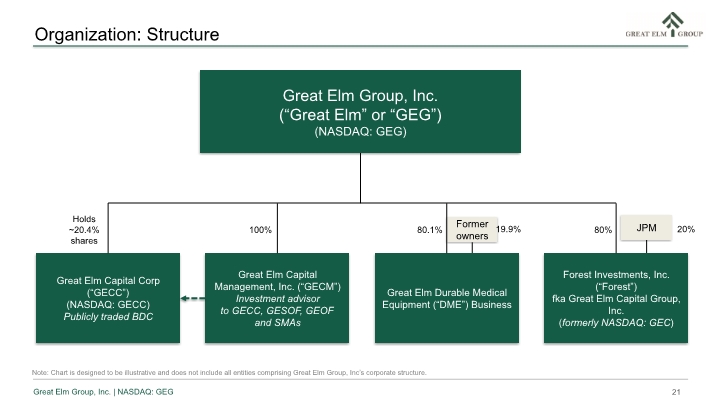
Organization: Structure Great Elm Group, Inc. (“Great Elm” or “GEG”) (NASDAQ: GEG) Great Elm Capital Management, Inc. (“GECM”) Investment advisor to GECC, GESOF, GEOF and SMAs Great Elm Capital Corp (“GECC”) (NASDAQ: GECC) Publicly traded BDC Great Elm Durable Medical Equipment (“DME”) Business Forest Investments, Inc. (“Forest”) fka Great Elm Capital Group, Inc. (formerly NASDAQ: GEC) 80% Holds ~20.4% shares 100% 80.1% Former owners 19.9% JPM 20% Note: Chart is designed to be illustrative and does not include all entities comprising Great Elm Group, Inc’s corporate structure. 21
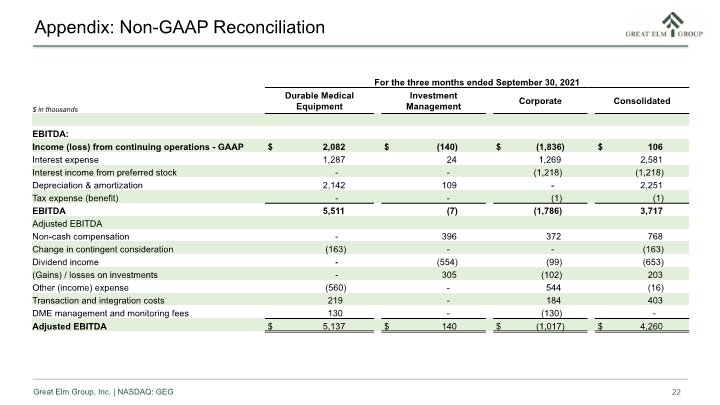
Appendix: Non-GAAP Reconciliation 22
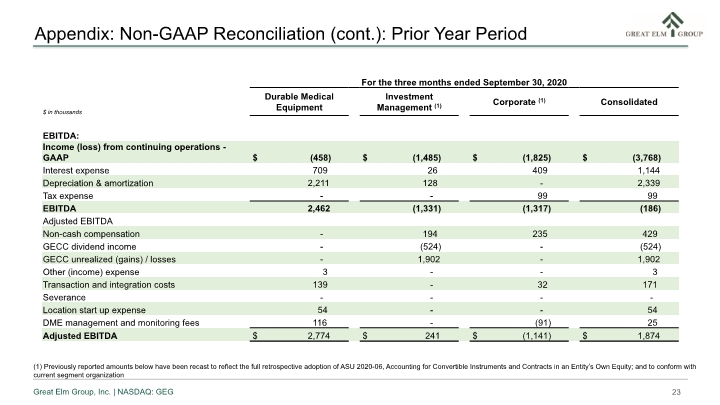
23 Appendix: Non-GAAP Reconciliation (cont.): Prior Year Period (1) Previously reported amounts below have been recast to reflect the full retrospective adoption of ASU 2020-06, Accounting for Convertible Instruments and Contracts in an Entity’s Own Equity; and to conform with current segment organization
Investor Relations 800 South Street, Suite 230 Waltham, MA 02453 [email protected] Adam Prior The Equity Group Inc. +1 (212) 836-9606 [email protected] 24 Appendix: Contact Information