
GLXY 8-K
Galaxy Digital Inc. (GLXY)
8-K
2026-02-03
For: 2026-02-03
View Original
Added on
April 11, 2026
UNITED STATES
SECURITIES AND EXCHANGE COMMISSION
WASHINGTON, D.C. 20549
FORM 8-K
CURRENT REPORT
Pursuant to Section 13 or 15(d) of the Securities Exchange Act of 1934
Date of Report (Date of earliest event reported): February 3, 2026
(Exact name of registrant as specified in its charter)
(State or other jurisdiction of incorporation) | (Commission File Number) | (IRS Employer Identification No.) | ||||||
| (Address of principal executive offices) | (Zip Code) | |||||||
(212 ) 390-9216
(Registrant’s telephone number, including area code)
Not Applicable
(Former name or former address, if changed since last report)
Check the appropriate box below if the Form 8-K filing is intended to simultaneously satisfy the filing obligation of the registrant under any of the following provisions (see General Instructions A.2. below):
| Written communications pursuant to Rule 425 under the Securities Act (17 CFR 230.425) | |||||
| Soliciting material pursuant to Rule 14a-12 under the Exchange Act (17 CFR 240.14a-12) | |||||
| Pre-commencement communications pursuant to Rule 14d-2(b) under the Exchange Act (17 CFR 240.14d-2(b)) | |||||
| Pre-commencement communications pursuant to Rule 13e-4(c) under the Exchange Act (17 CFR 240.13e-4(c)) | |||||
Securities registered pursuant to Section 12(b) of the Act:
| Title of each class | Trading Symbol(s) | Name of each exchange on which registered | ||||||
Indicate by check mark whether the registrant is an emerging growth company as defined in Rule 405 of the Securities Act of 1933 (§230.405 of this chapter) or Rule 12b-2 of the Securities Exchange Act of 1934 (§240.12b-2 of this chapter).
Emerging growth company o
If an emerging growth company, indicate by check mark if the registrant has elected not to use the extended transition period for complying with any new or revised financial accounting standards provided pursuant to Section 13(a) of the Exchange Act. o
Item 2.02 Results of Operations and Financial Condition.
On February 3, 2026, Galaxy Digital Inc. (“Galaxy”) issued a press release (the “Press Release”) regarding its financial results for the fourth quarter and fiscal year ended December 31, 2025. As previously announced, Galaxy will host a conference call on February 3, 2026 at 8:30 a.m. Eastern Time to discuss its financial results for the fourth quarter and fiscal year ended December 31, 2025.
On February 3, 2026, Galaxy also published quarterly update slides (the “Quarterly Update Presentation”) related to its financial results for the fourth quarter and fiscal year ended December 31, 2025 and a financial supplement (the “Financial Supplement”) providing the consolidated statements of operations for the years ended December 31, 2023, 2024 and 2025, and each of the quarters ended March 31, 2024 through December 31, 2025, as well as the consolidated statements of financial position as of the quarters ended March 31, 2022 through December 31, 2025. Copies of the Press Release, Quarterly Update Presentation and Financial Supplement are furnished as Exhibits 99.1, 99.2 and 99.3, respectively, to this Current Report on Form 8-K.
The information furnished with this Item 2.02, including Exhibits 99.1, 99.2 and 99.3, shall not be deemed “filed” for purposes of Section 18 of the Securities Exchange Act of 1934, as amended (the “Exchange Act”), or otherwise subject to the liabilities of that section, nor shall they be deemed incorporated by reference into any other filing under the Securities Act of 1933, as amended, or the Exchange Act, except as expressly set forth by specific reference in such filing.
Item 9.01 Financial Statements and Exhibits.
(d)Exhibits
Exhibit No. | Description | |||||||
| 99.1 | ||||||||
| 99.2 | ||||||||
| 99.3 | ||||||||
| 104 | Cover Page Interactive Data File (embedded within the Inline XBRL document). | |||||||
SIGNATURES
Pursuant to the requirements of the Securities Exchange Act of 1934, as amended, the registrant has duly caused this report to be signed on its behalf by the undersigned hereunto duly authorized.
| GALAXY DIGITAL INC. | ||||||||
Date: February 3, 2026 | By: | /s/ Anthony Paquette | ||||||
| Anthony Paquette | ||||||||
| Chief Financial Officer | ||||||||

1 GALAXY As of December 31, 2025 Q4 · 25 Investor.galaxy.com Exhibit 99.2
2 GALAXY D is cl ai m er This document, and the information contained herein, has been provided to you by Galaxy Digital Inc. and its affiliates (“Galaxy Digital” or “Galaxy”) solely for informational purposes. This document may not be reproduced or redistributed in whole or in part, in any format, without the express written approval of Galaxy Digital. Neither the information, nor any opinion contained in this document, constitutes an offer to buy or sell, or a solicitation of an offer to buy or sell, any advisory services, securities, futures, options or other financial instruments or to participate in any advisory services or trading strategy. Nothing contained in this document constitutes investment, legal or tax advice. You should make your own investigations and evaluations of the information herein. Any decisions based on information contained in this document are the sole responsibility of the reader. Certain statements in this document reflect Galaxy Digital’s views, estimates, opinions or predictions (which may be based on proprietary models and assumptions, including, in particular, Galaxy Digital’s views on the current and future market for certain digital assets), and there is no guarantee that these views, estimates, opinions or predictions are currently accurate or that they will be ultimately realized. To the extent these assumptions or models are not correct or circumstances change, the actual performance may vary substantially from, and be less than, the estimates included herein. None of Galaxy Digital nor any of its affiliates, shareholders, partners, members, directors, officers, management, employees or representatives makes any representation or warranty, express or implied, as to the accuracy or completeness of any of the information or any other information (whether communicated in written or oral form) transmitted or made available to you. Each of the aforementioned parties expressly disclaims any and all liability relating to or resulting from the use of this information. Certain information contained herein (including financial information) has been obtained from published and non-published sources. Such information has not been independently verified by Galaxy Digital and Galaxy Digital, does not assume responsibility for the accuracy of such information. Affiliates of Galaxy Digital may have owned or may own investments in some of the digital assets, companies and protocols discussed in this document and the inclusion herein is not an endorsement of such asset or company. Except where otherwise indicated, the information in this document is based on matters as they exist as of the date of preparation and not as of any future date, and will not be updated or otherwise revised to reflect information that subsequently becomes available, or circumstances existing or changes occurring after the date hereof. The Toronto Stock Exchange has not approved or disapproved of the information contained herein. No securities commission or similar regulatory authority in Canada has reviewed the information contained herein or has in any way passed on the merits of the securities of Galaxy Digital or upon the merits of the disclosure record of Galaxy Digital. The information contained herein is not, and under no circumstances is to be construed as, a prospectus, an advertisement or public offering of securities in Canada, nor is there any attempt to induce or cause any person or company to purchase any securities. CAUTION ABOUT FORWARD-LOOKING STATEMENTS Certain statements in these materials constitute forward-looking statements within the meaning of the Private Securities Litigation Reform Act of 1995 (“PLSRA”), Section 27A of the Securities Act of 1933, as amended, Section 21E of the Securities Exchange Act of 1934, as amended (the “Exchange Act”), and “forward-looking information” under Canadian securities laws (collectively, “forward-looking statements”). In some cases, you can identify these statements by forward-looking words such as “may,” “might,” “will,” “should,” “expects,” “plans,” “anticipates,” “believes,” “estimates,” “predicts,” “potential” or “continue,” the negative of these terms and other comparable terminology. These forward-looking statements, which are subject to risks, uncertainties and assumptions about us, may include projections of Galaxy Digital’s future financial performance or results, our anticipated growth strategies, anticipated trends in our business or future events and circumstances. These statements are only predictions based on Galaxy Digital’s current expectations, estimates, forecasts and projections about future events and trends that may affect the business, results of operations, financial condition and prospects. And as a result, these statements involve known and unknown risks, uncertainties, assumptions and other important factors, many of which are beyond the control of Galaxy Digital and which may cause actual results, performance or achievements to differ materially from those expressed or implied by such statements. For a further discussion of these risks, uncertainties and assumptions, please see the section titled “Risk Factors” in Part II, Item 1A of our Quarterly Report on Form 10-Q for the quarter ended September 30, 2025 filed with the Securities Exchange Commission on November 10, 2025, and available on Galaxy’s profile at www.sec.gov. Forward-looking statements are provided as a general guide only, and should not be relied on as an indication or guarantee of future performance. They can be affected by inaccurate assumptions we might make or by known or unknown risks or uncertainties. Given these uncertainties, recipients are cautioned to not place undue reliance on any forward-looking statement. Forward-looking statements speak only as of the date they are made. Subject to any continuing obligations under applicable law Galaxy Digital disclaims any obligation or undertaking to disseminate any updates or revisions to any forward-looking statements in these materials to reflect any change in expectations in relation to such forward-looking statements or any change in events, conditions or circumstances on which any such statement is based. ©Copyright Galaxy Digital 2026 All rights reserved. ®Registered Service Mark of Galaxy Digital Holdings LP Galaxy manages a number of funds, including the Galaxy Crypto Index Fund, Galaxy Ethereum Fund, the Galaxy Bitcoin Funds, the Galaxy Liquid Crypto Fund, the Galaxy Venture Fund I, the Galaxy Interactive Family of Funds and the Galaxy Vision Hill Family of Funds (each a “Fund” and together “Galaxy Funds”) which invests in digital assets. The Information is not an offer to buy or sell, nor is it a solicitation of an offer to buy or sell, interests in the Fund or any advisory services or any other security or to participate in any advisory services or trading strategy. If any offer and sale of securities is made, it will be pursuant to the confidential offering memorandum of the Fund (the “Offering Memorandum”). Any decision to make an investment in the Fund should be made after reviewing such Offering Memorandum, conducting such investigations as the investor deems necessary and consulting the investor’s own investment, legal, accounting and tax advisors in order to make an independent determination of the suitability and consequences of an investment. The performance of the Fund will vary from the performance of the relevant Index that it tracks. None of the Information has been filed with the SEC, any securities administrator under any state securities laws or any other governmental or self-regulatory authority. No governmental authority has opined on the merits of the offering of any securities by the Fund or Galaxy, or the adequacy of the information contained herein. Any representation to the contrary is a criminal offense in the United States. Investing in the Funds and digital assets involves a substantial degree of risk. There can be no assurance that the investment objectives of the Fund will be achieved. Any investment in the Fund may result in a loss of the entire amount invested. Investment losses may occur, and investors could lose some or all of their investment. Neither historical returns nor economic, market or other performance is an indication of future results. In addition to our results determined in accordance with GAAP, this presentation and the accompanying tables contain adjusted gross profit, adjusted EBITDA and EBITDA margin, which are non-GAAP financial measures. Adjusted gross profit, adjusted EBITDA and EBITDA margin are unaudited, presented as supplemental disclosure and should not be considered in isolation or as a substitute for, or superior to, the financial information prepared and presented in accordance with GAAP. Please see slide 19 for a reconciliation of adjusted gross profit to revenues and gains / (losses) from operations during the three months and fiscal year ended December 31, 2025, and of adjusted EBITDA to net income (loss) during the three months and fiscal year ended December 31, 2025. It is important to note that the particular items we exclude from, or include in, adjusted gross profit, adjusted EBITDA and EBITDA margin may differ from the items excluded from, or included in, similar non-GAAP financial measures used by other companies in the same industry. We also periodically review our non-GAAP financial measures and may revise these measures to reflect changes in our business or otherwise. We believe adjusted gross profit is a helpful non-GAAP financial measure to our management and investors because it eliminates the impact of the directly attributable transaction expenses. As such, it provides useful information about our financial performance, enhances the overall understanding of our past performance and future prospects, allows for greater transparency with respect to important metrics used by our management for financial, risk management and operational decision-making and provides an additional tool for investors to use to understand and compare our operating results across accounting periods. Adjusted EBITDA is a non-GAAP financial measure that is used by management, in addition to GAAP financial measures, to understand and compare our operating results across accounting periods, for risk management and operational decision-making. This non-GAAP measure provides investors with additional information in evaluating the Company’s operating performance. Adjusted EBITDA represents Net income / (loss) excluding (i) equity based compensation, (ii) interest expense on structural debt, (iii) taxes, (iv) depreciation and amortization expense, (v) gains and losses on the embedded derivative on our exchangeable notes which ceased to exist upon consolidation as a result of the Reorganization Transactions, (vi) mining-related impairment loss / loss on disposal of mining equipment, (vii) settlement expense, (viii) other (income) / expense, net and (ix) and reorganization and reorganization merger costs. The above items are excluded from our Adjusted EBITDA because these items are non-cash in nature, or because the amount and timing of these items are unpredictable, are not driven by core results of operations, and render comparisons with prior periods and competitors less meaningful. EBITDA Margin is defined as EBITDA, divided by revenue minus pass through expenses for the same period. This non-GAAP financial measure is commonly used as an analytical indicator of performance by investors within the industries in which we operate. EBITDA margin is not a measure of financial performance under GAAP. Items excluded from EBITDA Margin are significant components in understanding and assessing financial performance. EBITDA Margin should not be considered in isolation or as an alternative to or a substitute for financial statement data presented in Galaxy’s Digital’s consolidated financial statements as indicators of financial performance or liquidity (which, in the case of EBITDA margin, is net income margin).
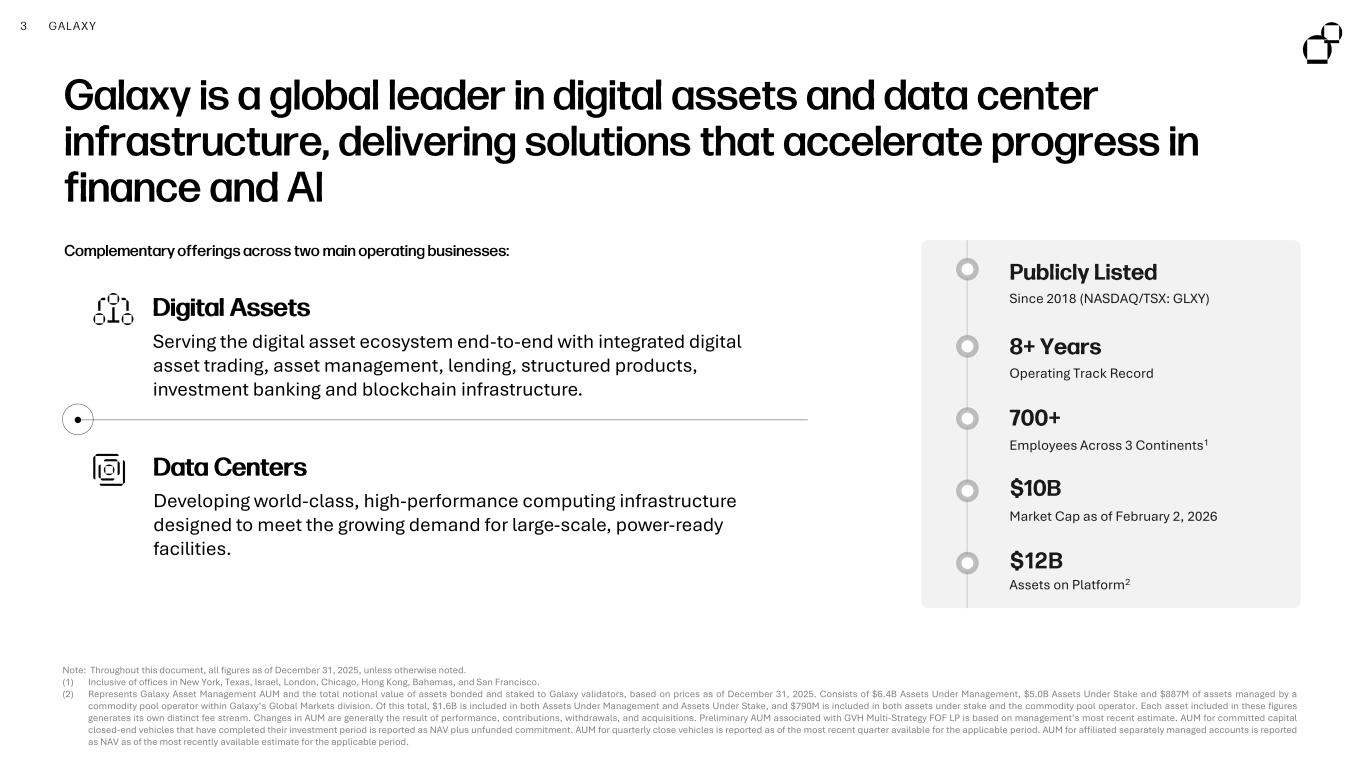
3 GALAXY Galaxy is a global leader in digital assets and data center infrastructure, delivering solutions that accelerate progress in finance and AI Note: Throughout this document, all figures as of December 31, 2025, unless otherwise noted. (1) Inclusive of offices in New York, Texas, Israel, London, Chicago, Hong Kong, Bahamas, and San Francisco. (2) Represents Galaxy Asset Management AUM and the total notional value of assets bonded and staked to Galaxy validators, based on prices as of December 31, 2025. Consists of $6.4B Assets Under Management, $5.0B Assets Under Stake and $887M of assets managed by a commodity pool operator within Galaxy’s Global Markets division. Of this total, $1.6B is included in both Assets Under Management and Assets Under Stake, and $790M is included in both assets under stake and the commodity pool operator. Each asset included in these figures generates its own distinct fee stream. Changes in AUM are generally the result of performance, contributions, withdrawals, and acquisitions. Preliminary AUM associated with GVH Multi-Strategy FOF LP is based on management’s most recent estimate. AUM for committed capital closed-end vehicles that have completed their investment period is reported as NAV plus unfunded commitment. AUM for quarterly close vehicles is reported as of the most recent quarter available for the applicable period. AUM for affiliated separately managed accounts is reported as NAV as of the most recently available estimate for the applicable period. Complementary offerings across two main operating businesses: Operating Track Record 8+ Years Employees Across 3 Continents1 700+ Market Cap as of February 2, 2026 $10B Since 2018 (NASDAQ/TSX: GLXY) Publicly Listed Assets on Platform2 $12B Data Centers Developing world-class, high-performance computing infrastructure designed to meet the growing demand for large-scale, power-ready facilities. Digital Assets Serving the digital asset ecosystem end-to-end with integrated digital asset trading, asset management, lending, structured products, investment banking and blockchain infrastructure.

4 GALAXY Galaxy Leadership Team Erin Brown Chief Operating Officer Andrew Taubman Deputy Chief Operations Officer Jason Urban Co -Head of Digital Assets Chris Ferraro President & CIO Mike Novogratz Founder & CEO Tony Paquette Chief Financial Officer Michael Ashe Head of Strategy & Corporate Development Sebastian Benkert Chief Marketing Officer Rob Cornish Chief Technology Officer Steve Kurz Co -Head of Digital Assets Tom Harrop Chief Risk Officer Leinee Hornbeck Chief People Officer A deep bench of experts across capital markets, asset management, digital assets, technology, and the development and operation of mission -critical data center infrastructure. Matt Friedrich Chief Legal Officer Brian Wright Co -Head of Data Centers Austin Storms Co -Head of Data Centers

5 GALAXY Our Opportunity
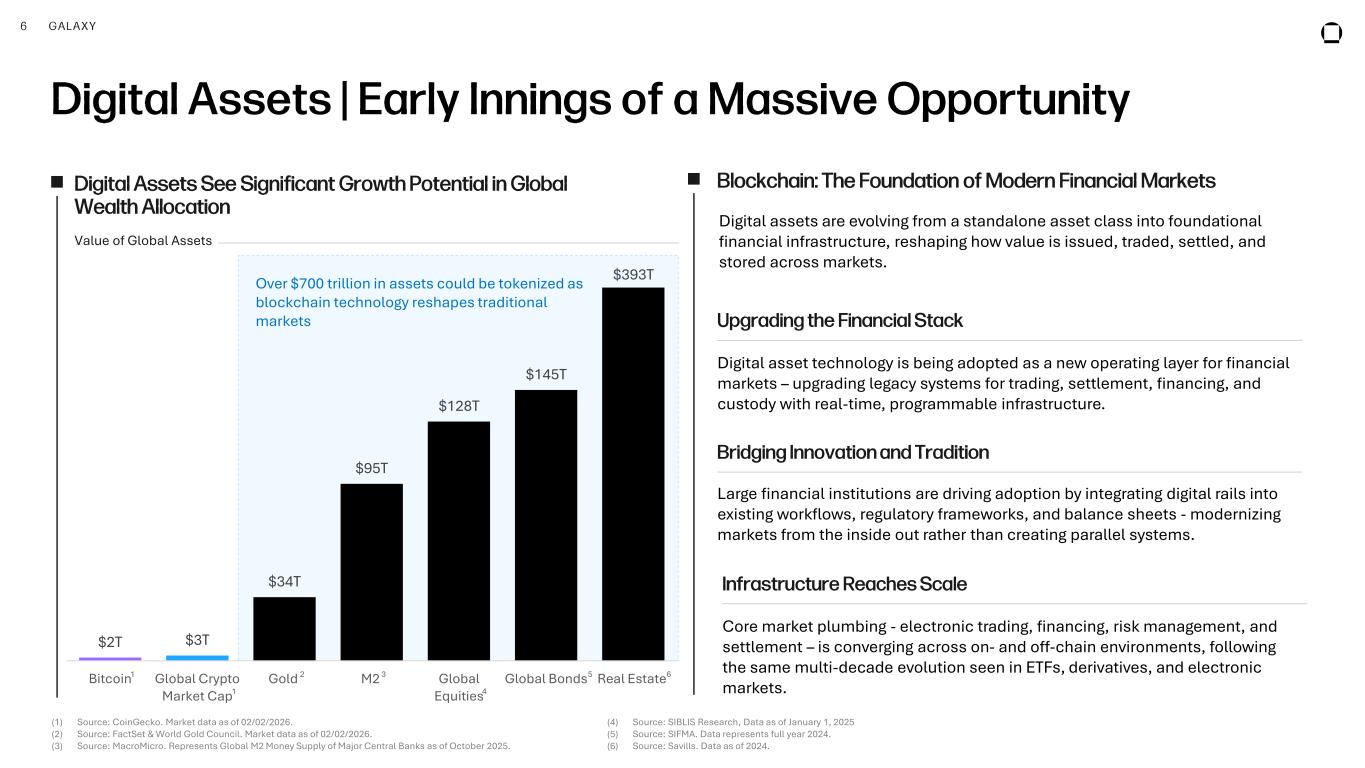
6 GALAXY (1) Source: CoinGecko. Market data as of 02/02/2026. (2) Source: FactSet & World Gold Council. Market data as of 02/02/2026. (3) Source: MacroMicro. Represents Global M2 Money Supply of Major Central Banks as of October 2025. (4) Source: SIBLIS Research, Data as of January 1, 2025 (5) Source: SIFMA. Data represents full year 2024. (6) Source: Savills. Data as of 2024. Digital Assets | Early Innings of a Massive Opportunity Digital Assets See Significant Growth Potential in Global Wealth Allocation Blockchain: The Foundation of Modern Financial Markets Value of Global Assets $2T $3T $34T $95T $128T $145T $393T Bitcoin Global Crypto Market Cap Gold M2 Global Equities Global Bonds Real Estate5 4 3 621 1 Over $700 trillion in assets could be tokenized as blockchain technology reshapes traditional markets Digital assets are evolving from a standalone asset class into foundational financial infrastructure, reshaping how value is issued, traded, settled, and stored across markets. Upgrading the Financial Stack Digital asset technology is being adopted as a new operating layer for financial markets – upgrading legacy systems for trading, settlement, financing, and custody with real-time, programmable infrastructure. Bridging Innovation and Tradition Large financial institutions are driving adoption by integrating digital rails into existing workflows, regulatory frameworks, and balance sheets - modernizing markets from the inside out rather than creating parallel systems. Infrastructure Reaches Scale Core market plumbing - electronic trading, financing, risk management, and settlement – is converging across on- and off-chain environments, following the same multi-decade evolution seen in ETFs, derivatives, and electronic markets.
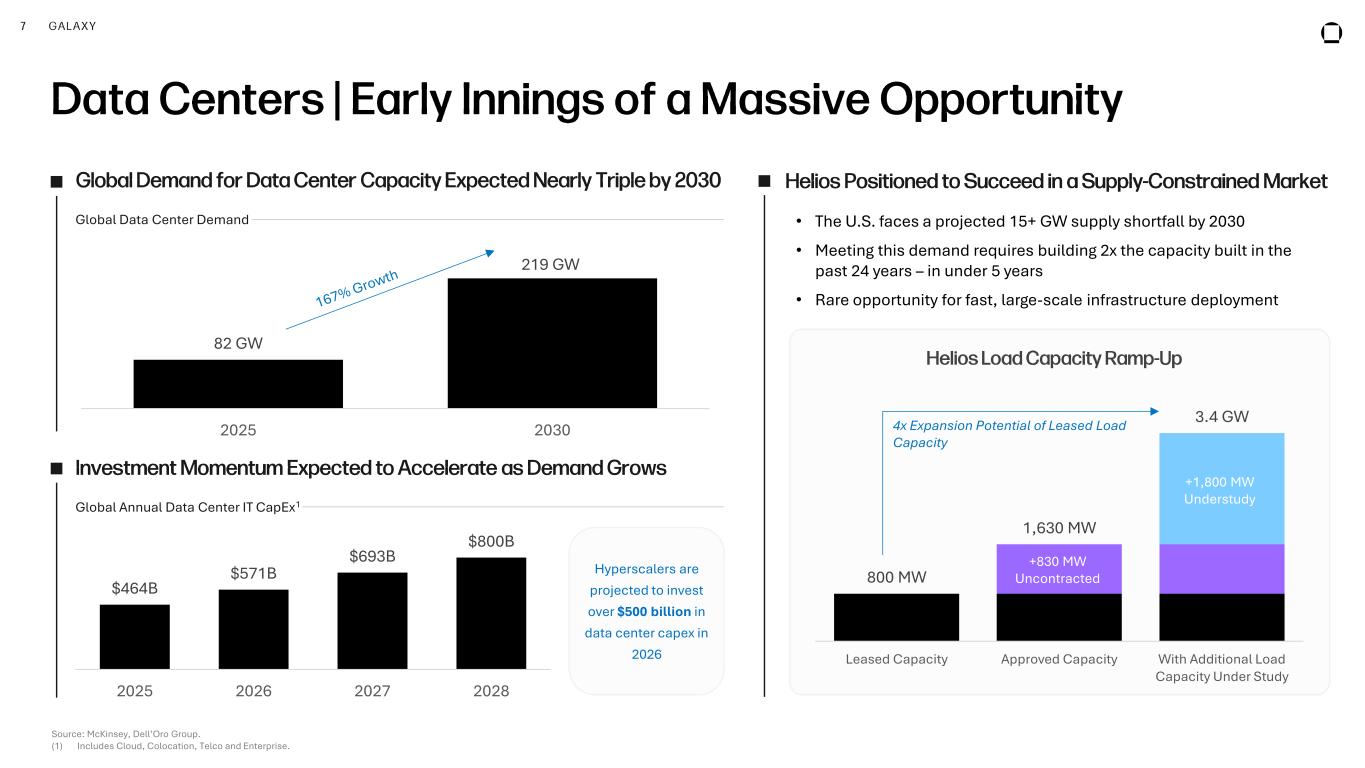
7 GALAXY Source: McKinsey, Dell’Oro Group. (1) Includes Cloud, Colocation, Telco and Enterprise. Data Centers | Early Innings of a Massive Opportunity 82 GW 219 GW 2025 2030 Investment Momentum Expected to Accelerate as Demand Grows 800 MW 1,630 MW 3.4 GW Leased Capacity Approved Capacity With Additional Load Capacity Under Study Helios Positioned to Succeed in a Supply -Constrained Market $464B $571B $693B $800B 2025 2026 2027 2028 Global Annual Data Center IT CapEx1 Global Data Center Demand • The U.S. faces a projected 15+ GW supply shortfall by 2030 • Meeting this demand requires building 2x the capacity built in the past 24 years – in under 5 years • Rare opportunity for fast, large-scale infrastructure deployment Helios Load Capacity Ramp -Up +1,800 MW Understudy Global Demand for Data Center Capacity Expected Nearly Triple by 2030 4x Expansion Potential of Leased Load Capacity Hyperscalers are projected to invest over $500 billion in data center capex in 2026 +830 MW Uncontracted
8 GALAXY Digital Assets Serving the digital asset ecosystem end -to-end. Global Markets Asset Management & Infrastructure Solutions
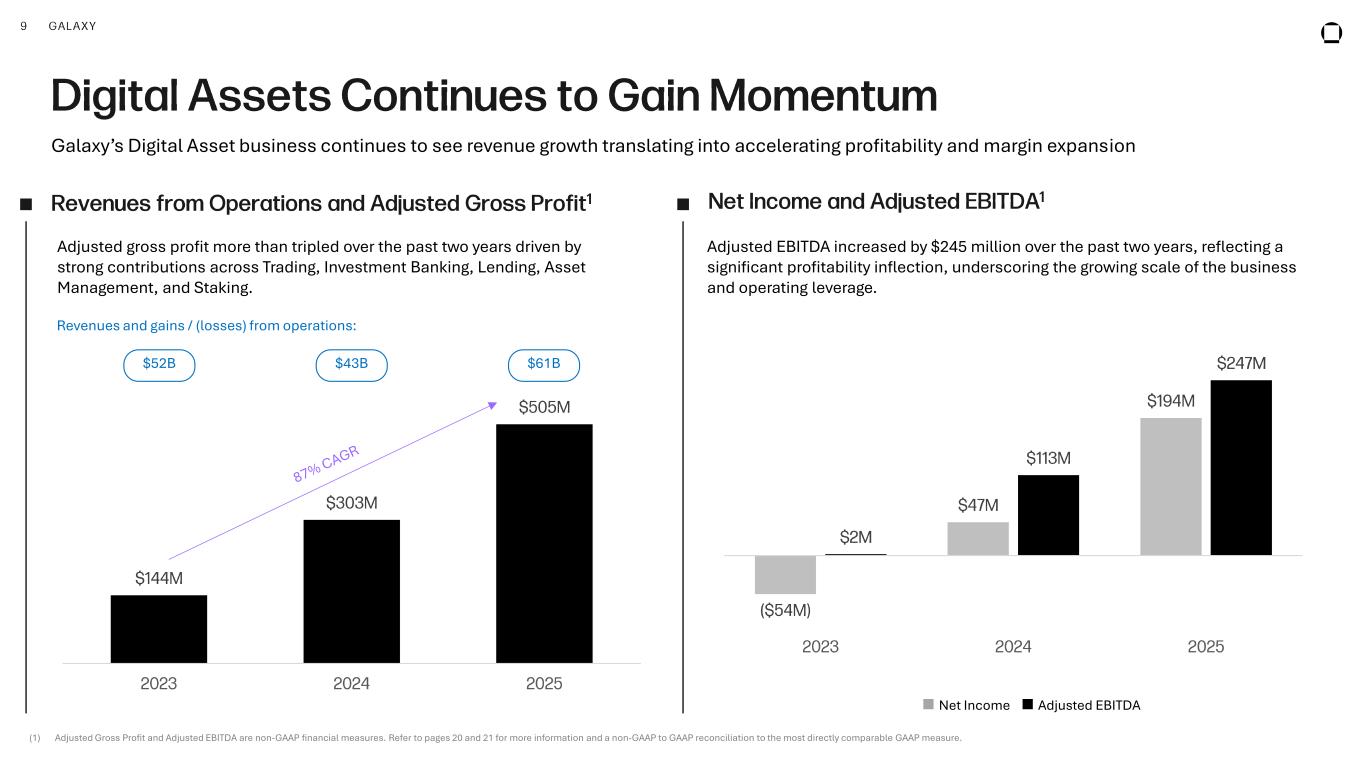
9 GALAXY Digital Assets Continues to Gain Momentum Net Income and Adjusted EBITDA 1Revenues from Operations and Adjusted Gross Profit 1 ($54M) $47M $194M $2M $113M $247M 2023 2024 2025 $144M $303M $505M 2023 2024 2025 Adjusted EBITDA increased by $245 million over the past two years, reflecting a significant profitability inflection, underscoring the growing scale of the business and operating leverage. Adjusted gross profit more than tripled over the past two years driven by strong contributions across Trading, Investment Banking, Lending, Asset Management, and Staking. Galaxy’s Digital Asset business continues to see revenue growth translating into accelerating profitability and margin expansion Net Income Adjusted EBITDA (1) Adjusted Gross Profit and Adjusted EBITDA are non-GAAP financial measures. Refer to pages 20 and 21 for more information and a non-GAAP to GAAP reconciliation to the most directly comparable GAAP measure. $43B Revenues and gains / (losses) from operations: $52B $61B
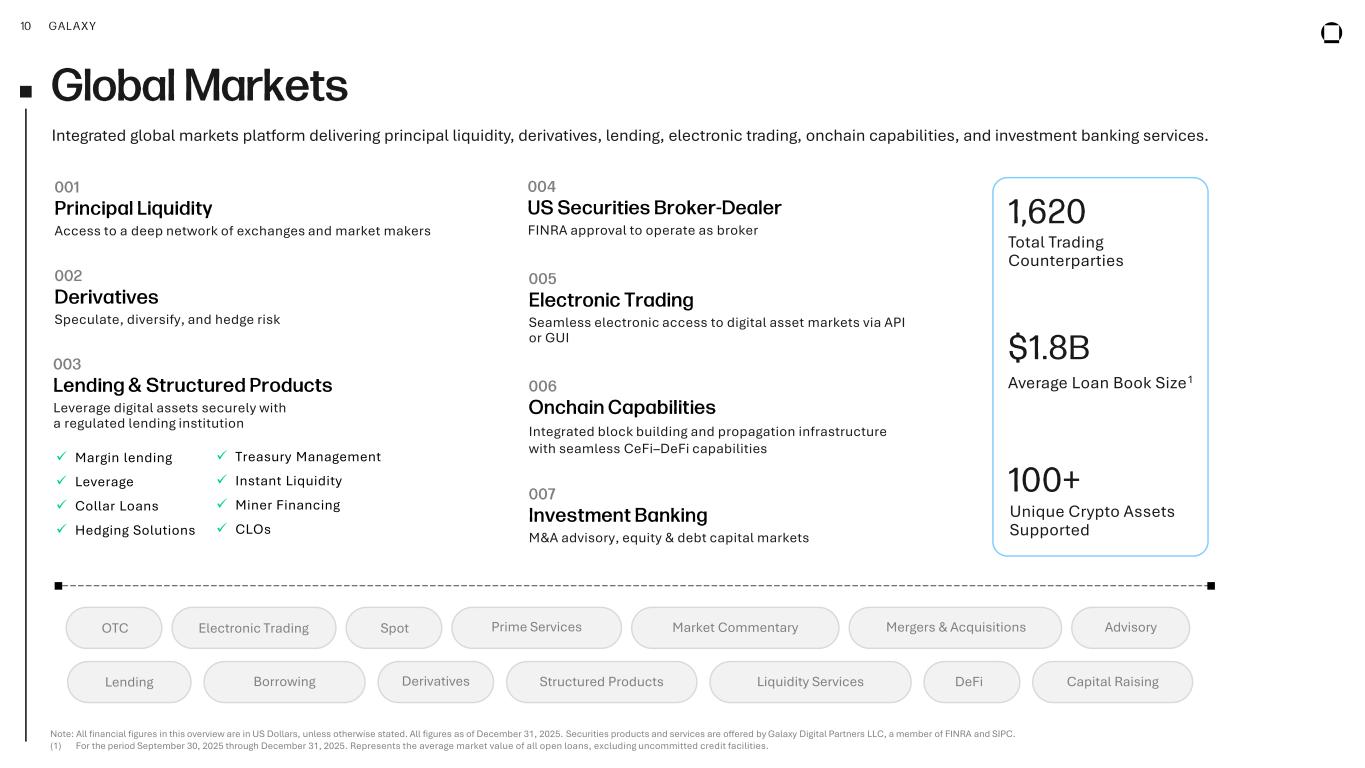
10 GALAXY Global Markets Integrated global markets platform delivering principal liquidity, derivatives, lending, electronic trading, onchain capabilities, and investment banking services. 001 Principal Liquidity Access to a deep network of exchanges and market makers 002 Derivatives Speculate, diversify, and hedge risk ✓ Margin lending ✓ Leverage ✓ Collar Loans ✓ Hedging Solutions ✓ Treasury Management ✓ Instant Liquidity ✓ Miner Financing ✓ CLOs 003 Lending & Structured Products Leverage digital assets securely with a regulated lending institution Total Trading Counterparties 1,620 Average Loan Book Size1 $1.8B Unique Crypto Assets Supported 100+007 Investment Banking M&A advisory, equity & debt capital markets 004 US Securities Broker -Dealer FINRA approval to operate as broker 005 Electronic Trading Seamless electronic access to digital asset markets via API or GUI 006 Onchain Capabilities Integrated block building and propagation infrastructure with seamless CeFi–DeFi capabilities DeFiLending Borrowing Derivatives Electronic TradingOTC Prime ServicesSpot Market Commentary Structured Products Liquidity Services Advisory Capital Raising Mergers & Acquisitions Note: All financial figures in this overview are in US Dollars, unless otherwise stated. All figures as of December 31, 2025. Securities products and services are offered by Galaxy Digital Partners LLC, a member of FINRA and SIPC. (1) For the period September 30, 2025 through December 31, 2025. Represents the average market value of all open loans, excluding uncommitted credit facilities.
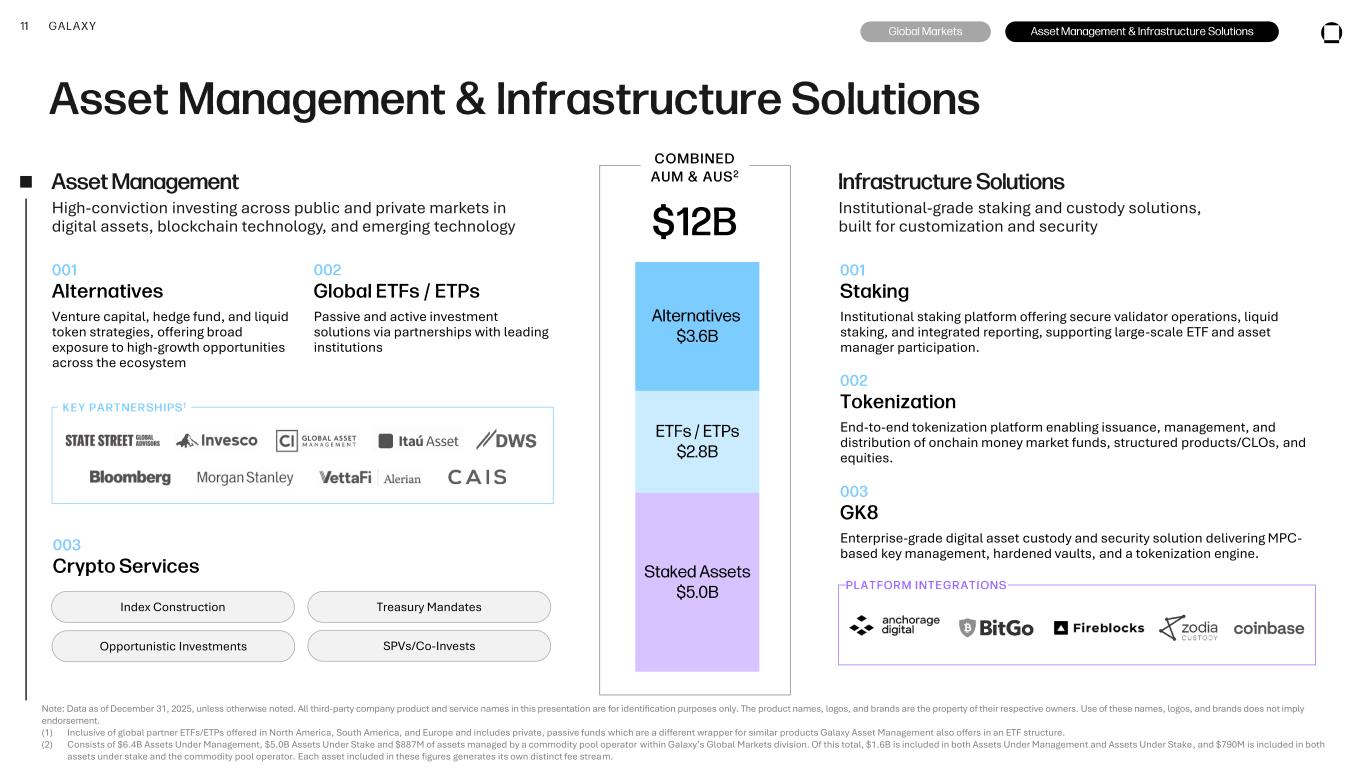
11 GALAXY Asset Management & Infrastructure Solutions Infrastructure Solutions Asset Management High-conviction investing across public and private markets in digital assets, blockchain technology, and emerging technology Institutional-grade staking and custody solutions, built for customization and security Staked Assets $5.0B ETFs / ETPs $2.8B Alternatives $3.6B $ 12B Global Markets Asset Management & Infrastructure Solutions 001 Alternatives Venture capital, hedge fund, and liquid token strategies, offering broad exposure to high-growth opportunities across the ecosystem 002 Global ETFs / ETPs Passive and active investment solutions via partnerships with leading institutions 003 Crypto Services Index Construction SPVs/Co-Invests Treasury Mandates Opportunistic Investments KEY PARTNERSHIPS 1 PLATFORM INTEGRATIONS COMBINED AUM & AUS 2 Note: Data as of December 31, 2025, unless otherwise noted. All third-party company product and service names in this presentation are for identification purposes only. The product names, logos, and brands are the property of their respective owners. Use of these names, logos, and brands does not imply endorsement. (1) Inclusive of global partner ETFs/ETPs offered in North America, South America, and Europe and includes private, passive funds which are a different wrapper for similar products Galaxy Asset Management also offers in an ETF structure. (2) Consists of $6.4B Assets Under Management, $5.0B Assets Under Stake and $887M of assets managed by a commodity pool operator within Galaxy’s Global Markets division. Of this total, $1.6B is included in both Assets Under Management and Assets Under Stake, and $790M is included in both assets under stake and the commodity pool operator. Each asset included in these figures generates its own distinct fee stream. 001 Staking Institutional staking platform offering secure validator operations, liquid staking, and integrated reporting, supporting large-scale ETF and asset manager participation. 002 Tokenization End-to-end tokenization platform enabling issuance, management, and distribution of onchain money market funds, structured products/CLOs, and equities. 003 GK8 Enterprise-grade digital asset custody and security solution delivering MPC- based key management, hardened vaults, and a tokenization engine.
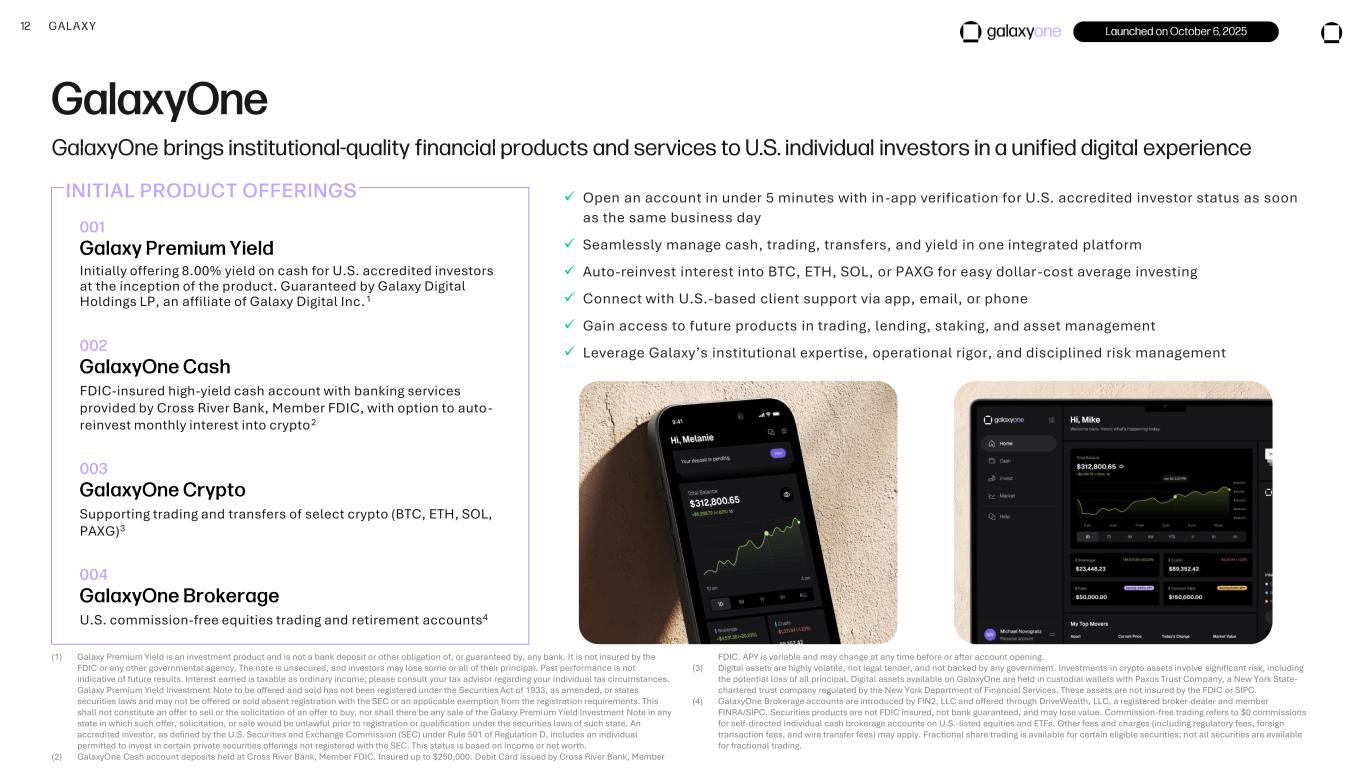
12 GALAXY GalaxyOne GalaxyOne brings institutional -quality financial products and services to U.S. individual investors in a unified digital experie nce Launched on October 6, 2025 001 Galaxy Premium Yield Initially offering 8.00% yield on cash for U.S. accredited investors at the inception of the product. Guaranteed by Galaxy Digital Holdings LP, an affiliate of Galaxy Digital Inc.1 002 GalaxyOne Cash FDIC-insured high-yield cash account with banking services provided by Cross River Bank, Member FDIC, with option to auto- reinvest monthly interest into crypto2 003 GalaxyOne Crypto Supporting trading and transfers of select crypto (BTC, ETH, SOL, PAXG)3 004 GalaxyOne Brokerage U.S. commission-free equities trading and retirement accounts4 INITIAL PRODUCT OFFERINGS ✓ Open an account in under 5 minutes with in-app verification for U.S. accredited investor status as soon as the same business day ✓ Seamlessly manage cash, trading, transfers, and yield in one integrated platform ✓ Auto-reinvest interest into BTC, ETH, SOL, or PAXG for easy dollar-cost average investing ✓ Connect with U.S.-based client support via app, email, or phone ✓ Gain access to future products in trading, lending, staking, and asset management ✓ Leverage Galaxy’s institutional expertise, operational rigor, and disciplined risk management (1) Galaxy Premium Yield is an investment product and is not a bank deposit or other obligation of, or guaranteed by, any bank. It is not insured by the FDIC or any other governmental agency. The note is unsecured, and investors may lose some or all of their principal. Past performance is not indicative of future results. Interest earned is taxable as ordinary income; please consult your tax advisor regarding your individual tax circumstances. Galaxy Premium Yield Investment Note to be offered and sold has not been registered under the Securities Act of 1933, as amended, or states securities laws and may not be offered or sold absent registration with the SEC or an applicable exemption from the registration requirements. This shall not constitute an offer to sell or the solicitation of an offer to buy, nor shall there be any sale of the Galaxy Premium Yield Investment Note in any state in which such offer, solicitation, or sale would be unlawful prior to registration or qualification under the securities laws of such state. An accredited investor, as defined by the U.S. Securities and Exchange Commission (SEC) under Rule 501 of Regulation D, includes an individual permitted to invest in certain private securities offerings not registered with the SEC. This status is based on income or net worth. (2) GalaxyOne Cash account deposits held at Cross River Bank, Member FDIC. Insured up to $250,000. Debit Card issued by Cross River Bank, Member FDIC. APY is variable and may change at any time before or after account opening. (3) Digital assets are highly volatile, not legal tender, and not backed by any government. Investments in crypto assets involve significant risk, including the potential loss of all principal. Digital assets available on GalaxyOne are held in custodial wallets with Paxos Trust Company, a New York State- chartered trust company regulated by the New York Department of Financial Services. These assets are not insured by the FDIC or SIPC. (4) GalaxyOne Brokerage accounts are introduced by FIN2, LLC and offered through DriveWealth, LLC, a registered broker-dealer and member FINRA/SIPC. Securities products are not FDIC insured, not bank guaranteed, and may lose value. Commission-free trading refers to $0 commissions for self-directed individual cash brokerage accounts on U.S.-listed equities and ETFs. Other fees and charges (including regulatory fees, foreign transaction fees, and wire transfer fees) may apply. Fractional share trading is available for certain eligible securities; not all securities are available for fractional trading.
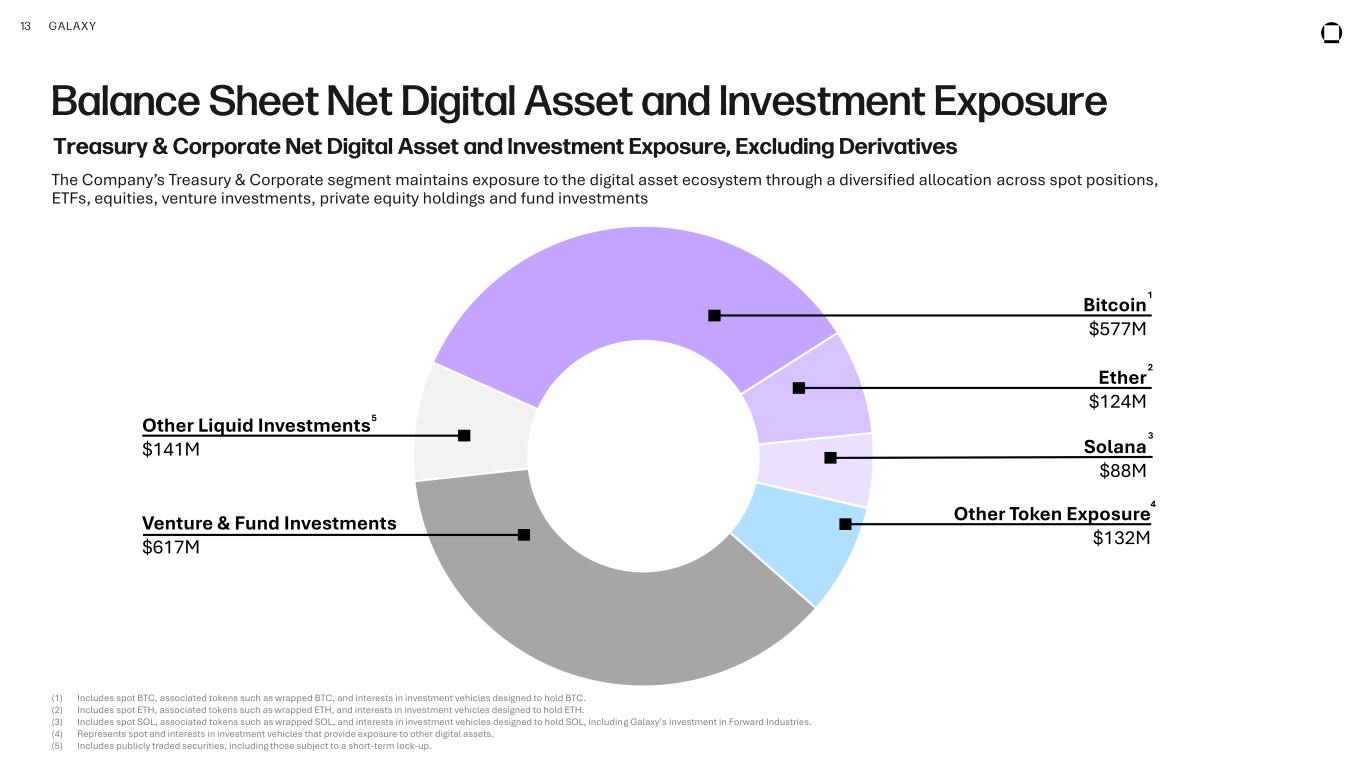
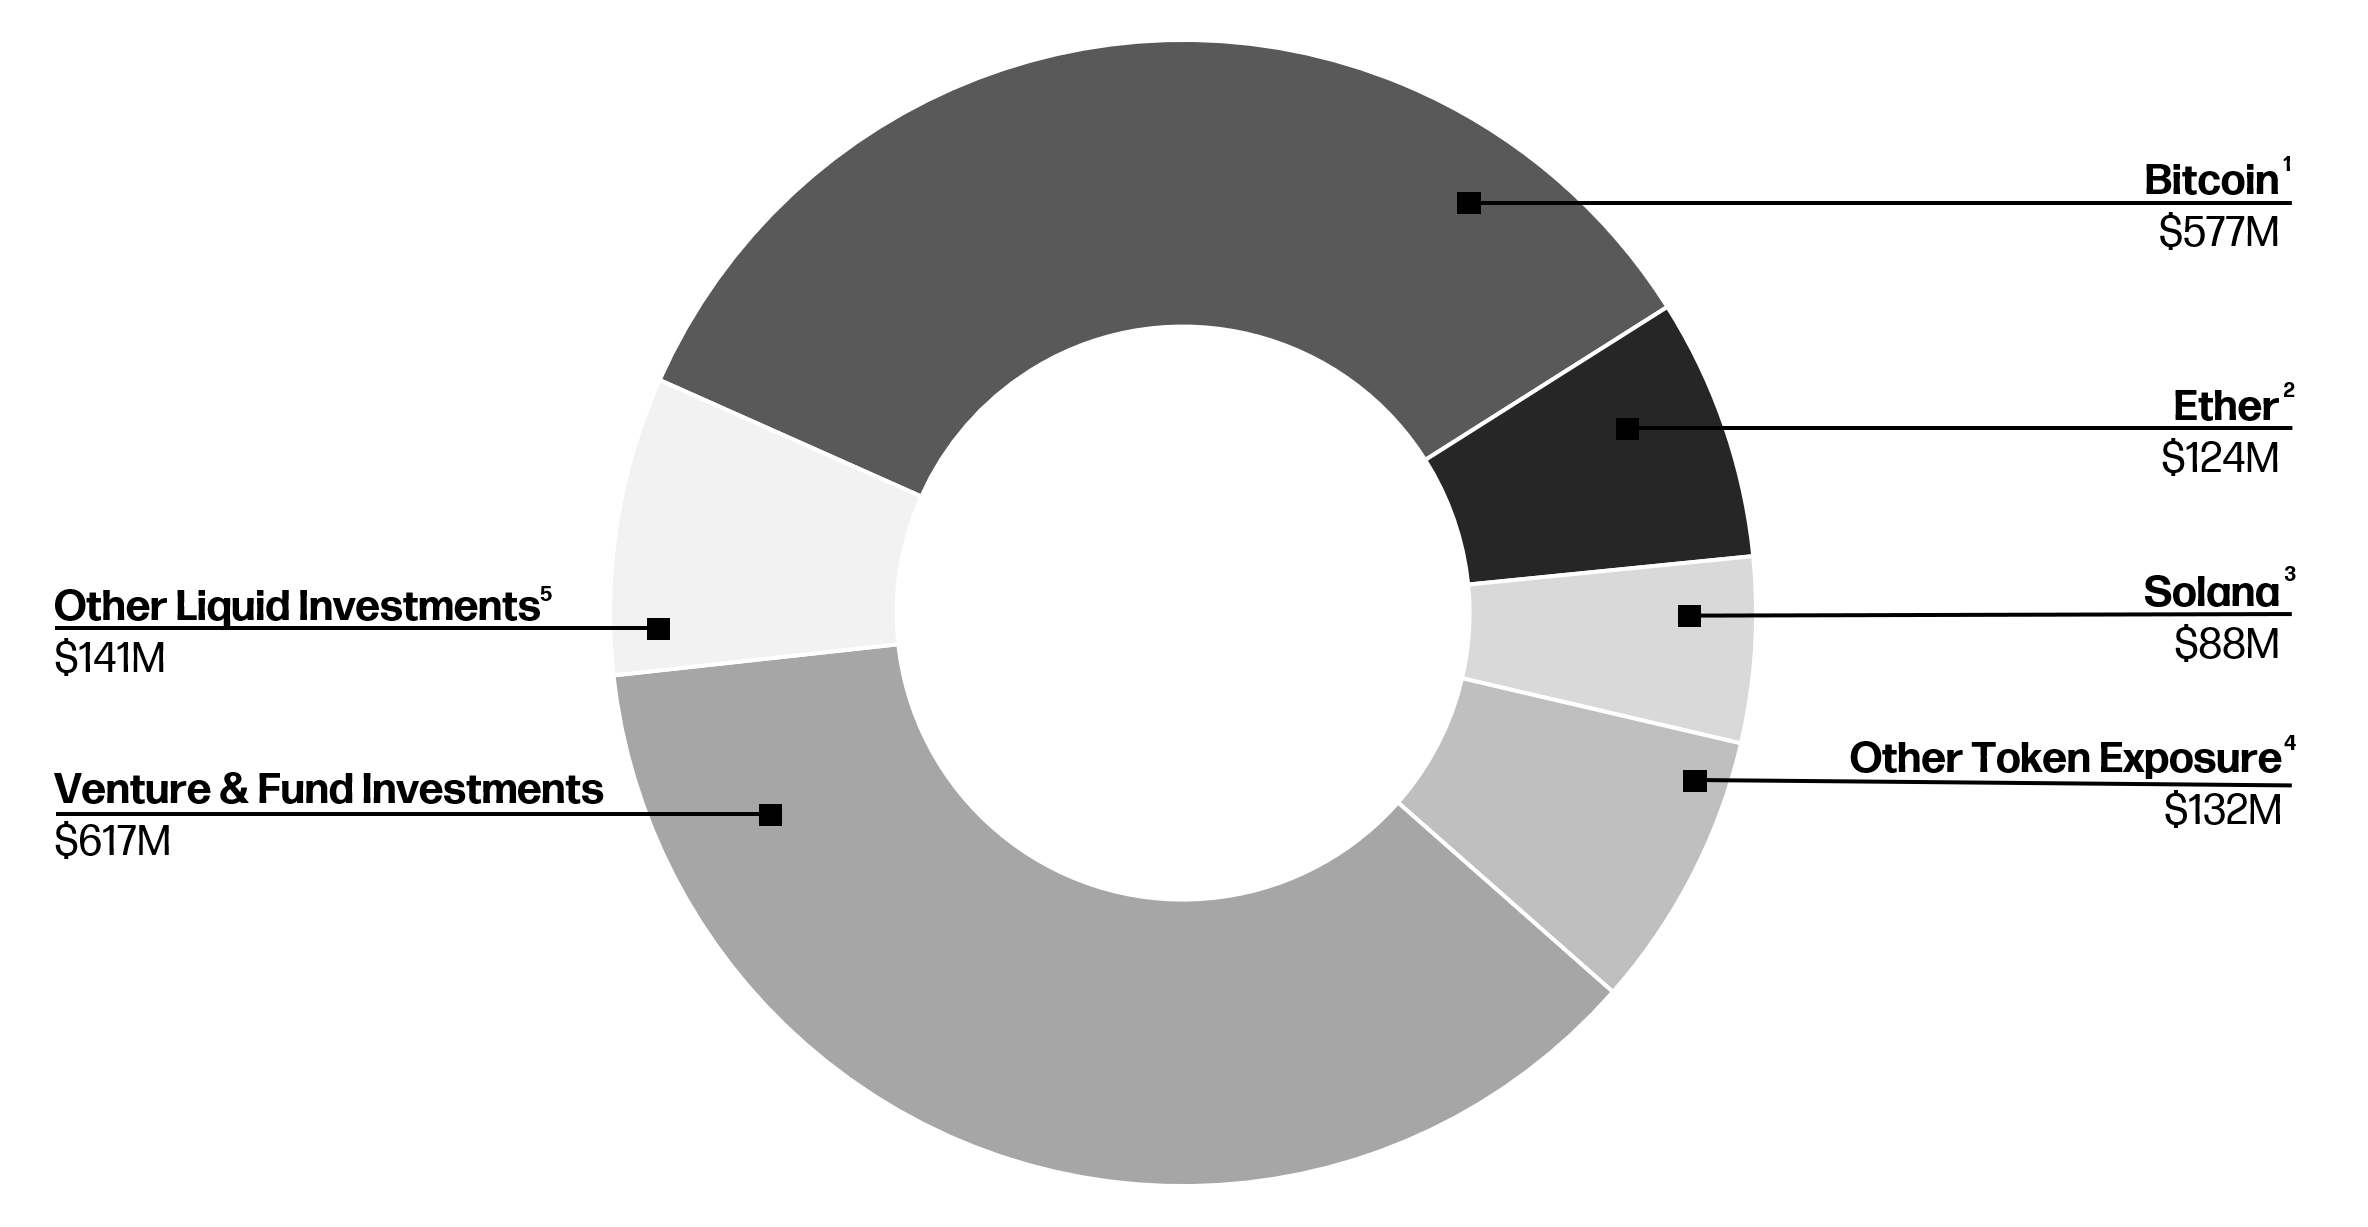
13 GALAXY Balance Sheet Net Digital Asset and Investment Exposure (1) Includes spot BTC, associated tokens such as wrapped BTC, and interests in investment vehicles designed to hold BTC. (2) Includes spot ETH, associated tokens such as wrapped ETH, and interests in investment vehicles designed to hold ETH. (3) Includes spot SOL, associated tokens such as wrapped SOL, and interests in investment vehicles designed to hold SOL, including Galaxy’s investment in Forward Industries. (4) Represents spot and interests in investment vehicles that provide exposure to other digital assets. (5) Includes publicly traded securities, including those subject to a short-term lock-up. Ether $124M 2 Solana $88M 3 Venture & Fund Investments $617M Other Token Exposure $132M 4 Other Liquid Investments $141M 5 Bitcoin $577M 1 Treasury & Corporate Net Digital Asset and Investment Exposure, Excluding Derivatives The Company’s Treasury & Corporate segment maintains exposure to the digital asset ecosystem through a diversified allocation across spot positions, ETFs, equities, venture investments, private equity holdings and fund investments
14 GALAXY Data Centers Developing infrastructure for an AI -enabled future. Data Centers High-Performance Computing Infrastructure
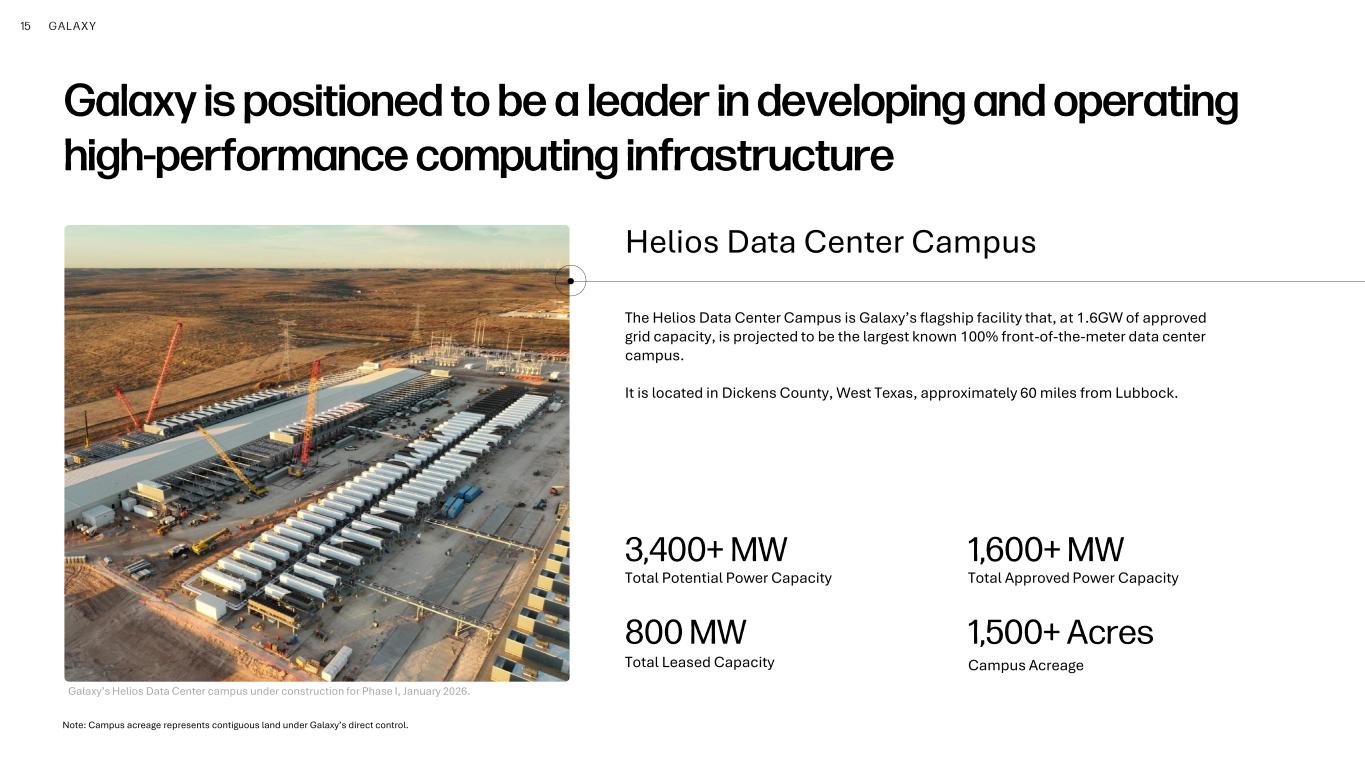
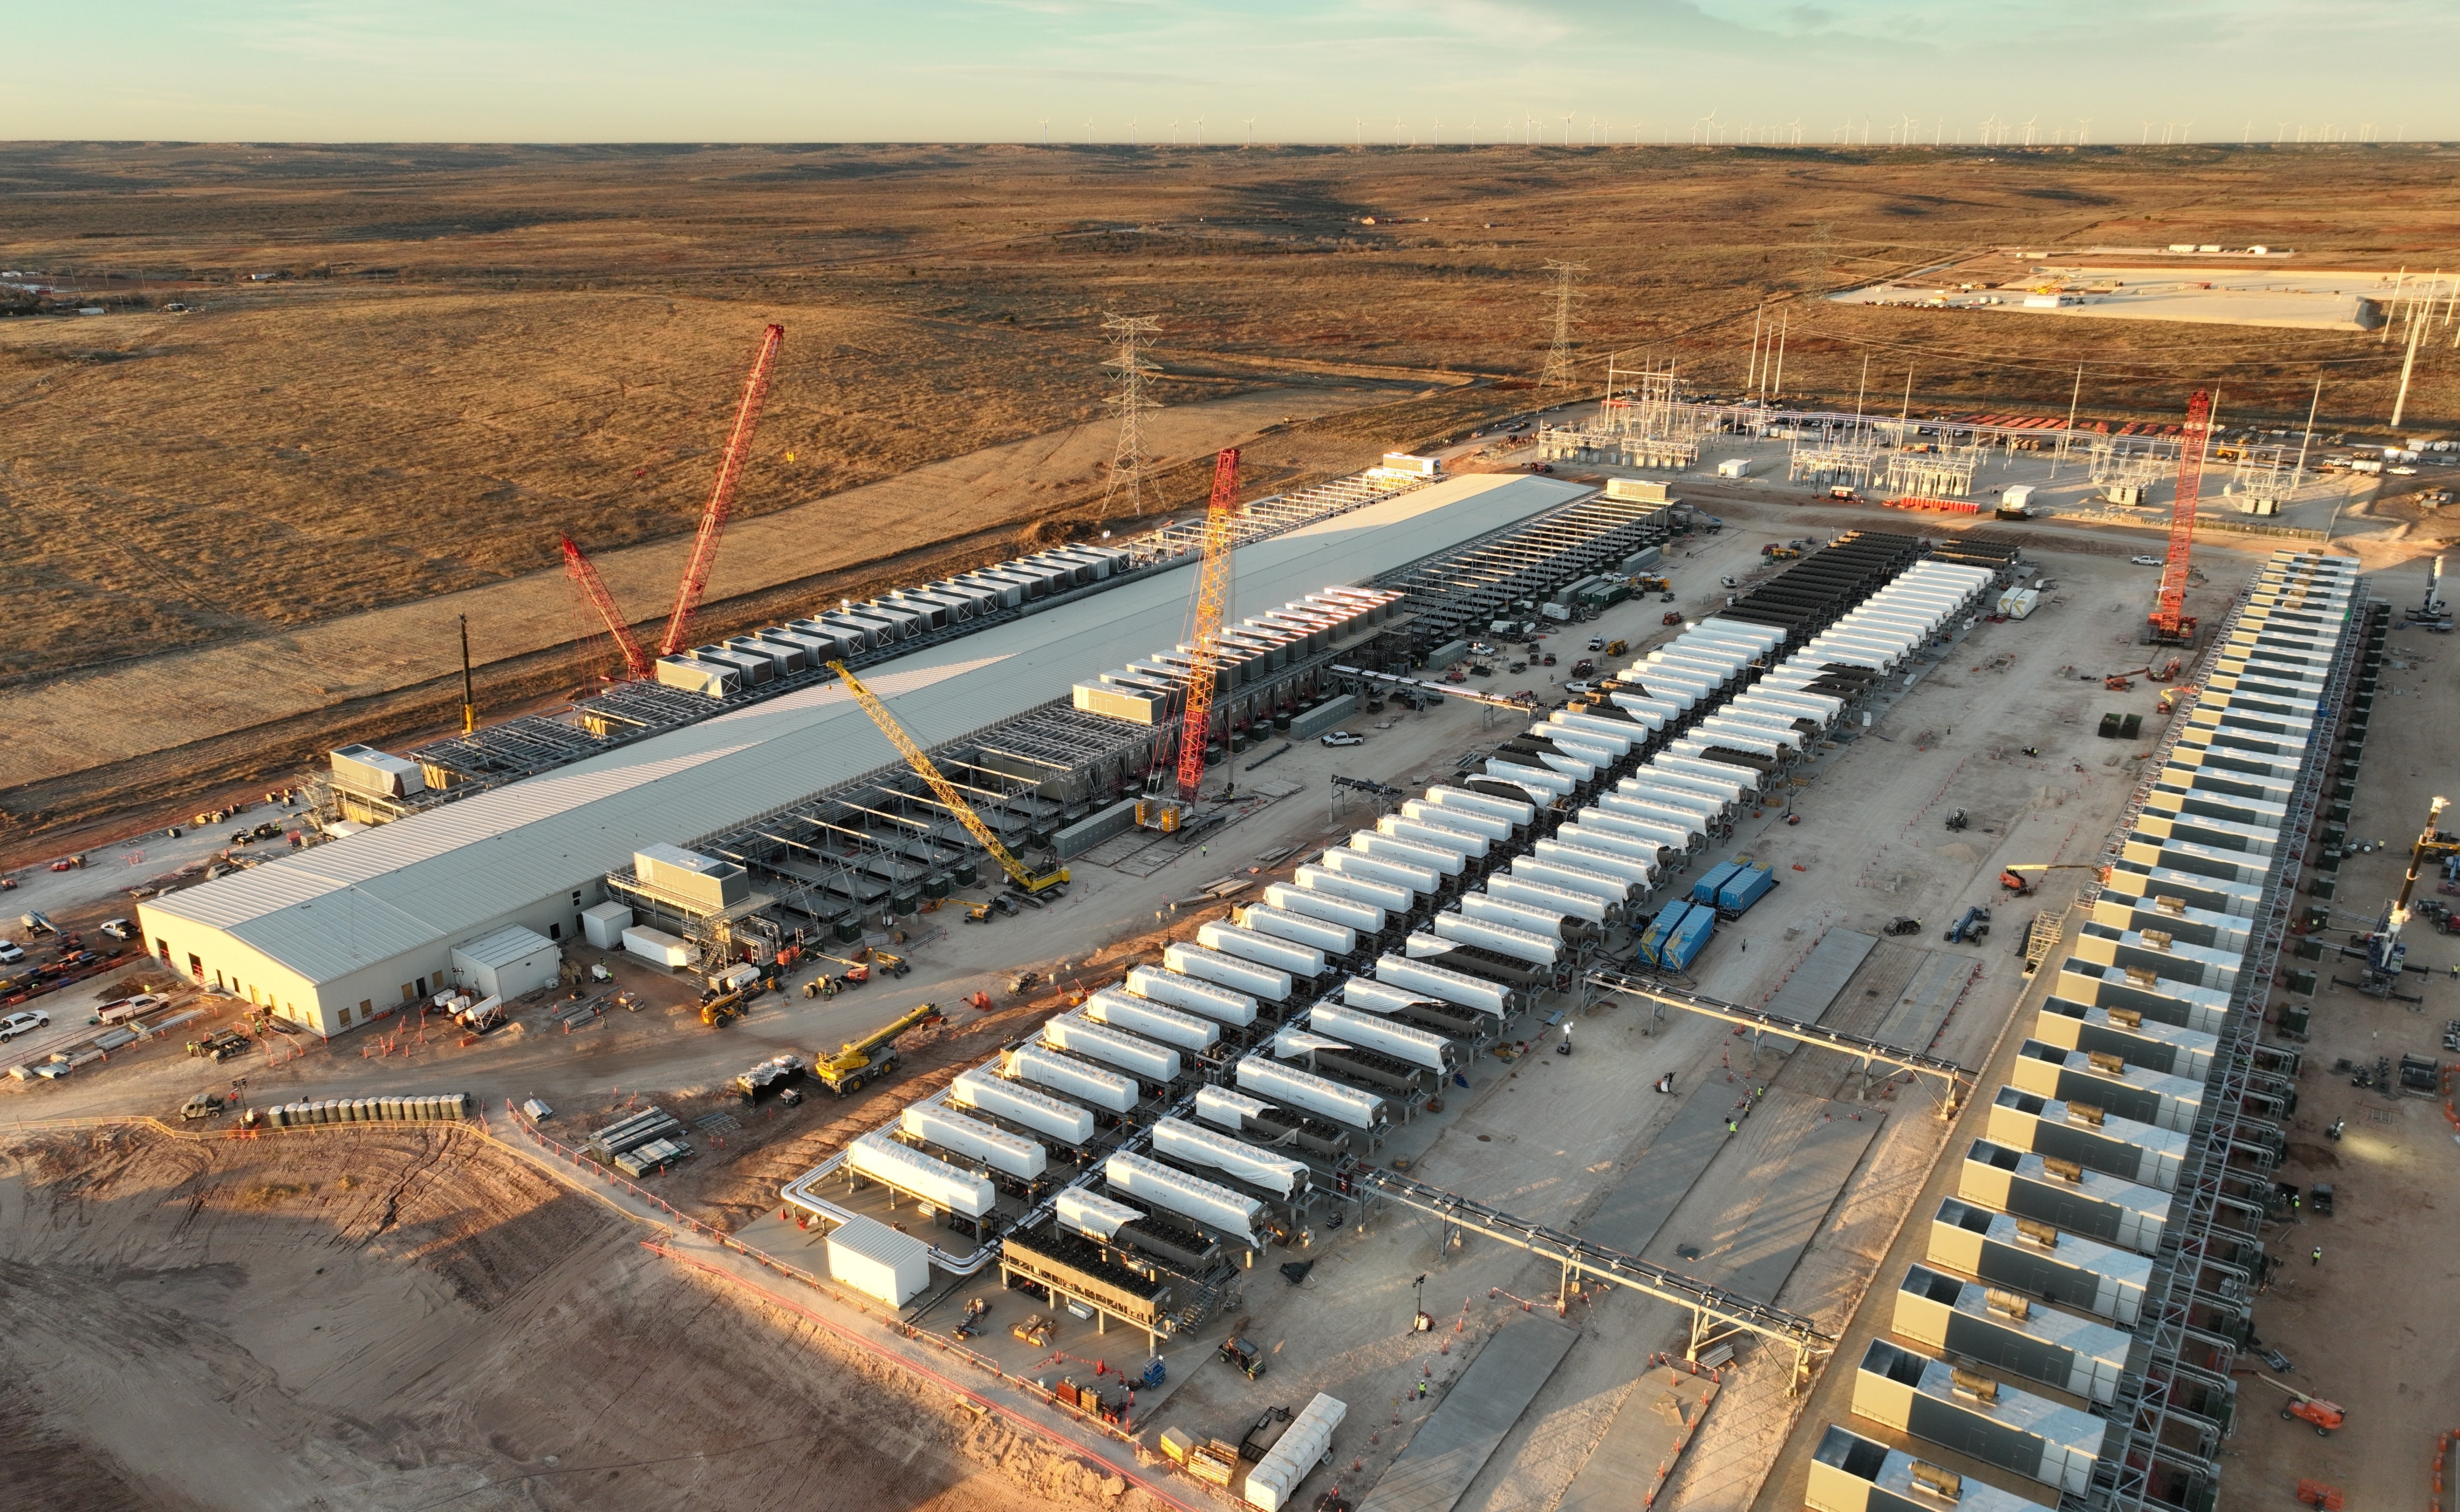
15 GALAXY Galaxy is positioned to be a leader in developing and operating high-performance computing infrastructure ▪ Galaxy • Galaxy Slides Master Overhaul Total Leased Capacity 800 MW The Helios Data Center Campus is Galaxy’s flagship facility that, at 1.6GW of approved grid capacity, is projected to be the largest known 100% front-of-the-meter data center campus. It is located in Dickens County, West Texas, approximately 60 miles from Lubbock. Helios Data Center Campus 1,600+ MW Total Approved Power Capacity 1,500+ Acres Campus Acreage Note: Campus acreage represents contiguous land under Galaxy’s direct control. 3,400+ MW Total Potential Power Capacity Galaxy’s Helios Data Center campus under construction for Phase I, January 2026.
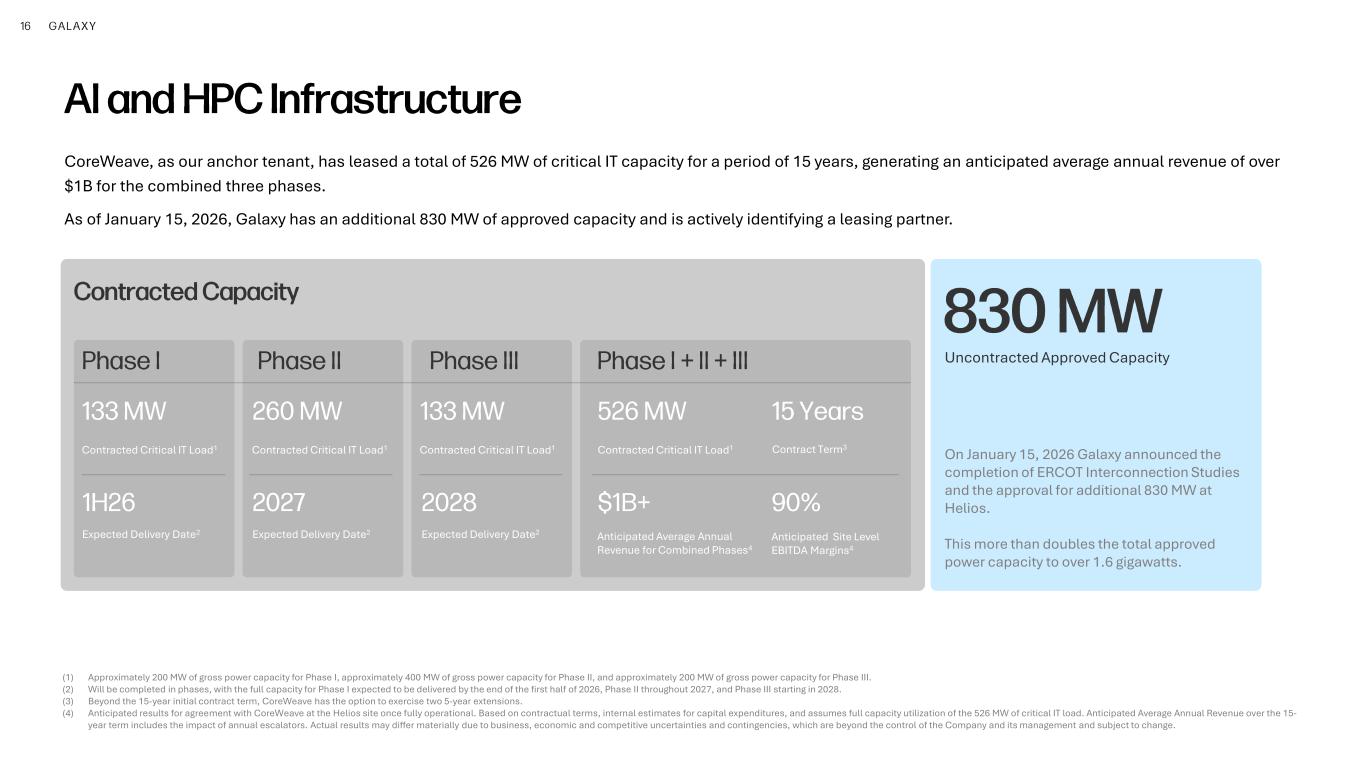
16 GALAXY AI and HPC Infrastructure CoreWeave, as our anchor tenant, has leased a total of 526 MW of critical IT capacity for a period of 15 years, generating an anticipated average annual revenue of over $1B for the combined three phases. As of January 15, 2026, Galaxy has an additional 830 MW of approved capacity and is actively identifying a leasing partner. Phase I Phase II Phase I + II + IIIPhase III Contracted Critical IT Load1 133 MW Expected Delivery Date2 1H26 Contracted Critical IT Load1 260 MW Expected Delivery Date2 2027 Anticipated Average Annual Revenue for Combined Phases4 $1B+ Anticipated Site Level EBITDA Margins4 90% 526 MW Contracted Critical IT Load1 15 Years Contract Term3Contracted Critical IT Load1 133 MW Expected Delivery Date2 2028 (1) Approximately 200 MW of gross power capacity for Phase I, approximately 400 MW of gross power capacity for Phase II, and approximately 200 MW of gross power capacity for Phase III. (2) Will be completed in phases, with the full capacity for Phase I expected to be delivered by the end of the first half of 2026, Phase II throughout 2027, and Phase III starting in 2028. (3) Beyond the 15-year initial contract term, CoreWeave has the option to exercise two 5-year extensions. (4) Anticipated results for agreement with CoreWeave at the Helios site once fully operational. Based on contractual terms, internal estimates for capital expenditures, and assumes full capacity utilization of the 526 MW of critical IT load. Anticipated Average Annual Revenue over the 15- year term includes the impact of annual escalators. Actual results may differ materially due to business, economic and competitive uncertainties and contingencies, which are beyond the control of the Company and its management and subject to change. 830 MW Contracted Capacity On January 15, 2026 Galaxy announced the completion of ERCOT Interconnection Studies and the approval for additional 830 MW at Helios. This more than doubles the total approved power capacity to over 1.6 gigawatts. Uncontracted Approved Capacity
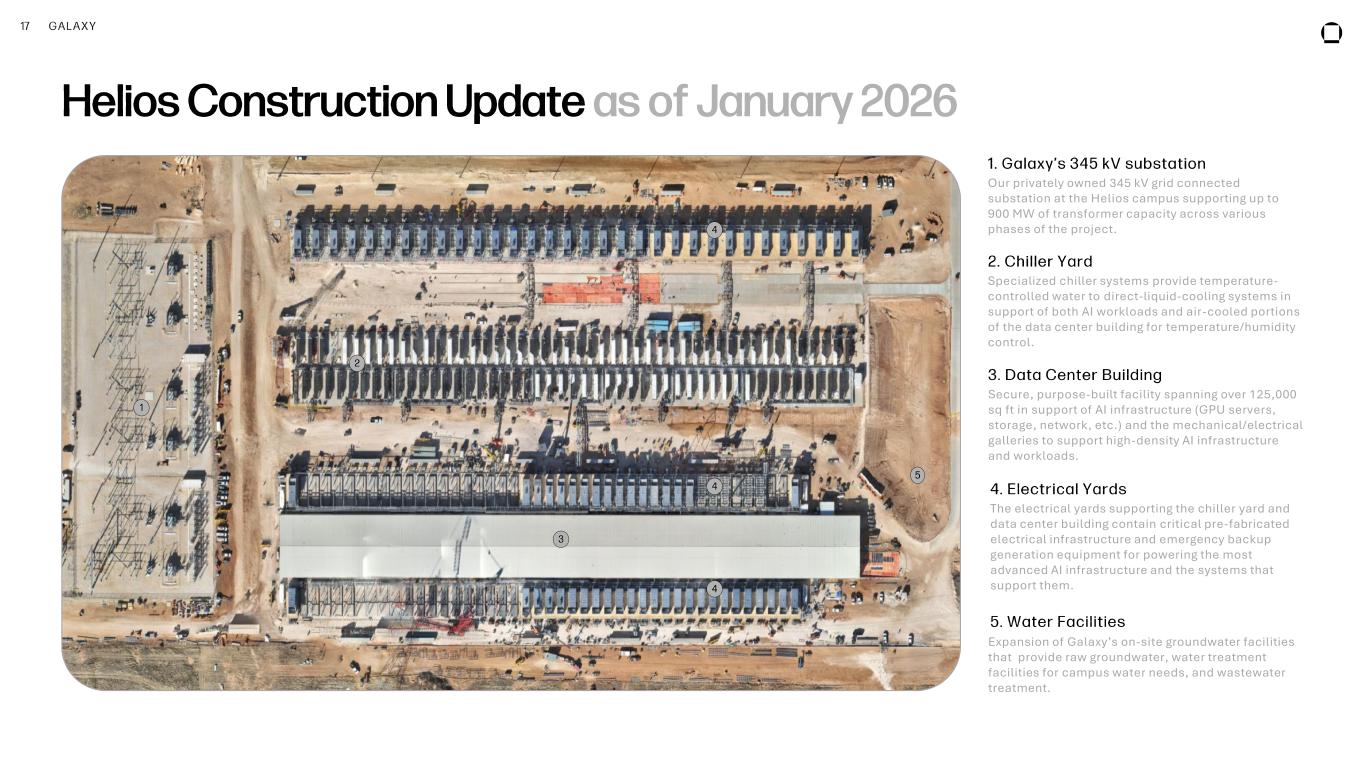
17 GALAXY Helios Construction Update as of January 2026 1 2 4 5 3 1. Galaxy’s 345 kV substation Our privately owned 345 kV grid connected substation at the Helios campus supporting up to 900 MW of transformer capacity across various phases of the project. 2. Chiller Yard Specialized chiller systems provide temperature- controlled water to direct-liquid-cooling systems in support of both AI workloads and air-cooled portions of the data center building for temperature/humidity control. 4. Electrical Yards The electrical yards supporting the chiller yard and data center building contain critical pre-fabricated electrical infrastructure and emergency backup generation equipment for powering the most advanced AI infrastructure and the systems that support them. 5. Water Facilities Expansion of Galaxy’s on-site groundwater facilities that provide raw groundwater, water treatment facilities for campus water needs, and wastewater treatment. 3. Data Center Building Secure, purpose-built facility spanning over 125,000 sq ft in support of AI infrastructure (GPU servers, storage, network, etc.) and the mechanical/electrical galleries to support high-density AI infrastructure and workloads. 4 4

18 GALAXY Appendix
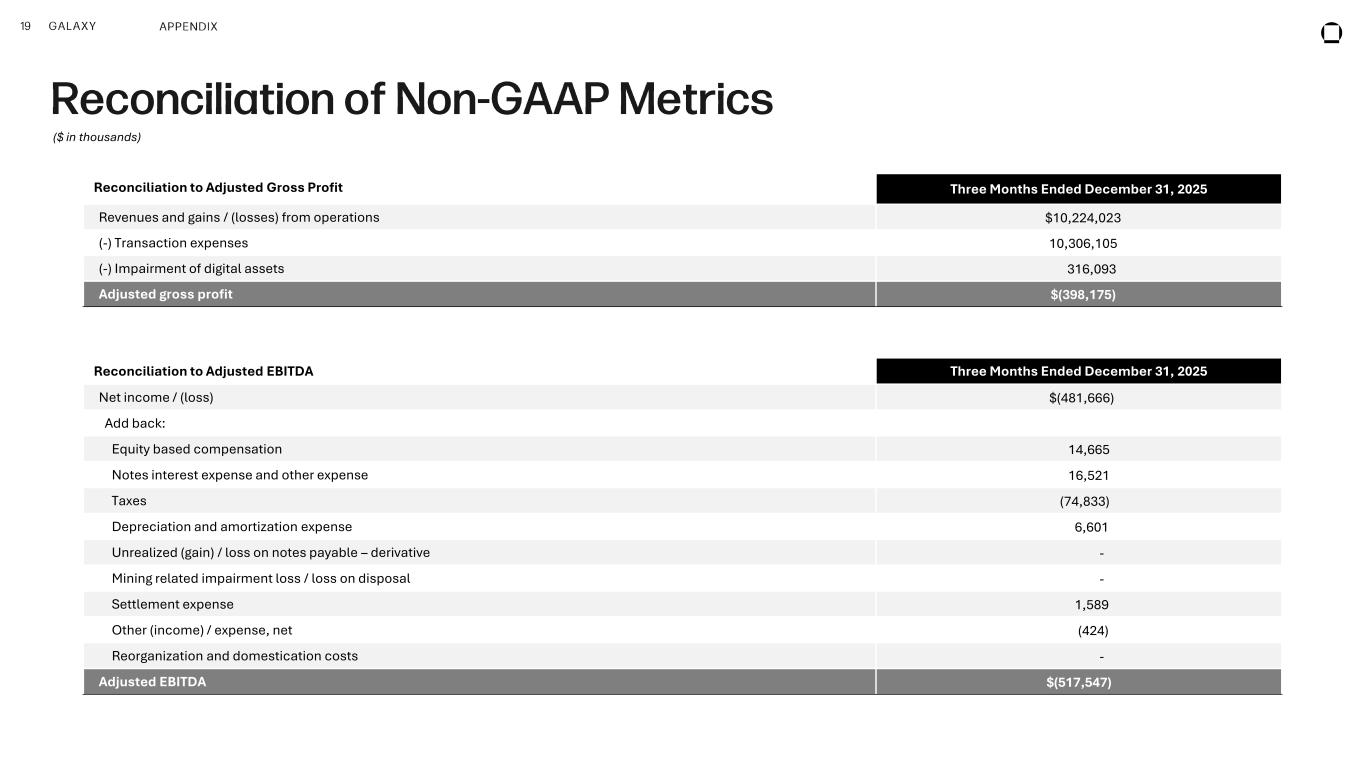
19 GALAXY APPENDIX Reconciliation of Non -GAAP Metrics Reconciliation to Adjusted Gross Profit Three Months Ended December 31, 2025 Revenues and gains / (losses) from operations $10,224,023 (-) Transaction expenses 10,306,105 (-) Impairment of digital assets 316,093 Adjusted gross profit $(398,175) Reconciliation to Adjusted EBITDA Three Months Ended December 31, 2025 Net income / (loss) $(481,666) Add back: Equity based compensation 14,665 Notes interest expense and other expense 16,521 Taxes (74,833) Depreciation and amortization expense 6,601 Unrealized (gain) / loss on notes payable – derivative - Mining related impairment loss / loss on disposal - Settlement expense 1,589 Other (income) / expense, net (424) Reorganization and domestication costs - Adjusted EBITDA $(517,547) ($ in thousands)
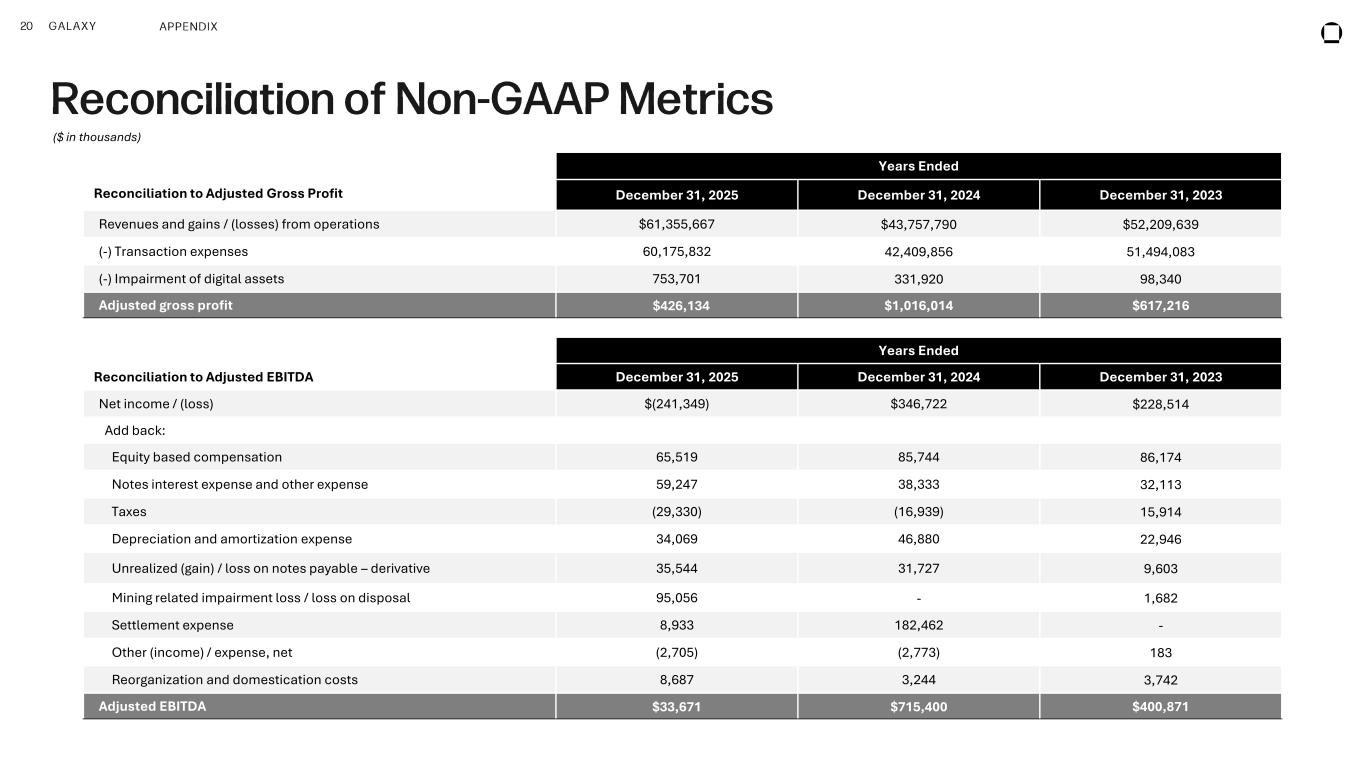
20 GALAXY APPENDIX Reconciliation of Non -GAAP Metrics Years Ended Reconciliation to Adjusted Gross Profit December 31, 2025 December 31, 2024 December 31, 2023 Revenues and gains / (losses) from operations $61,355,667 $43,757,790 $52,209,639 (-) Transaction expenses 60,175,832 42,409,856 51,494,083 (-) Impairment of digital assets 753,701 331,920 98,340 Adjusted gross profit $426,134 $1,016,014 $617,216 Years Ended Reconciliation to Adjusted EBITDA December 31, 2025 December 31, 2024 December 31, 2023 Net income / (loss) $(241,349) $346,722 $228,514 Add back: Equity based compensation 65,519 85,744 86,174 Notes interest expense and other expense 59,247 38,333 32,113 Taxes (29,330) (16,939) 15,914 Depreciation and amortization expense 34,069 46,880 22,946 Unrealized (gain) / loss on notes payable – derivative 35,544 31,727 9,603 Mining related impairment loss / loss on disposal 95,056 - 1,682 Settlement expense 8,933 182,462 - Other (income) / expense, net (2,705) (2,773) 183 Reorganization and domestication costs 8,687 3,244 3,742 Adjusted EBITDA $33,671 $715,400 $400,871 ($ in thousands)
Exhibit 99.3 Galaxy Digital Inc. Historical Select Financial Data as of Q4 2025 The information contained in this supplement speaks only as of the particular date or dates included in the accompanying pages. Galaxy Digital Inc. (the "Company") does not undertake an obligation to, and disclaims any duty to, update any of the information provided. The information contained in this supplement contains certain financial and other information reproduced or derived from more comprehensive information contained in our periodic reports and other filings with the Securities and Exchange Commission ("SEC"). The information contained in this supplement is unaudited and is not intended as a substitute for, and should be read in the context of, the information contained in these other documents. In the event of any conflict, the information contained in our periodic reports and other filings with the SEC shall take precedence.

Throughout this document, totals may not sum due to rounding. In addition, some items may not agree to totals disclosed elsewhere due to rounding.
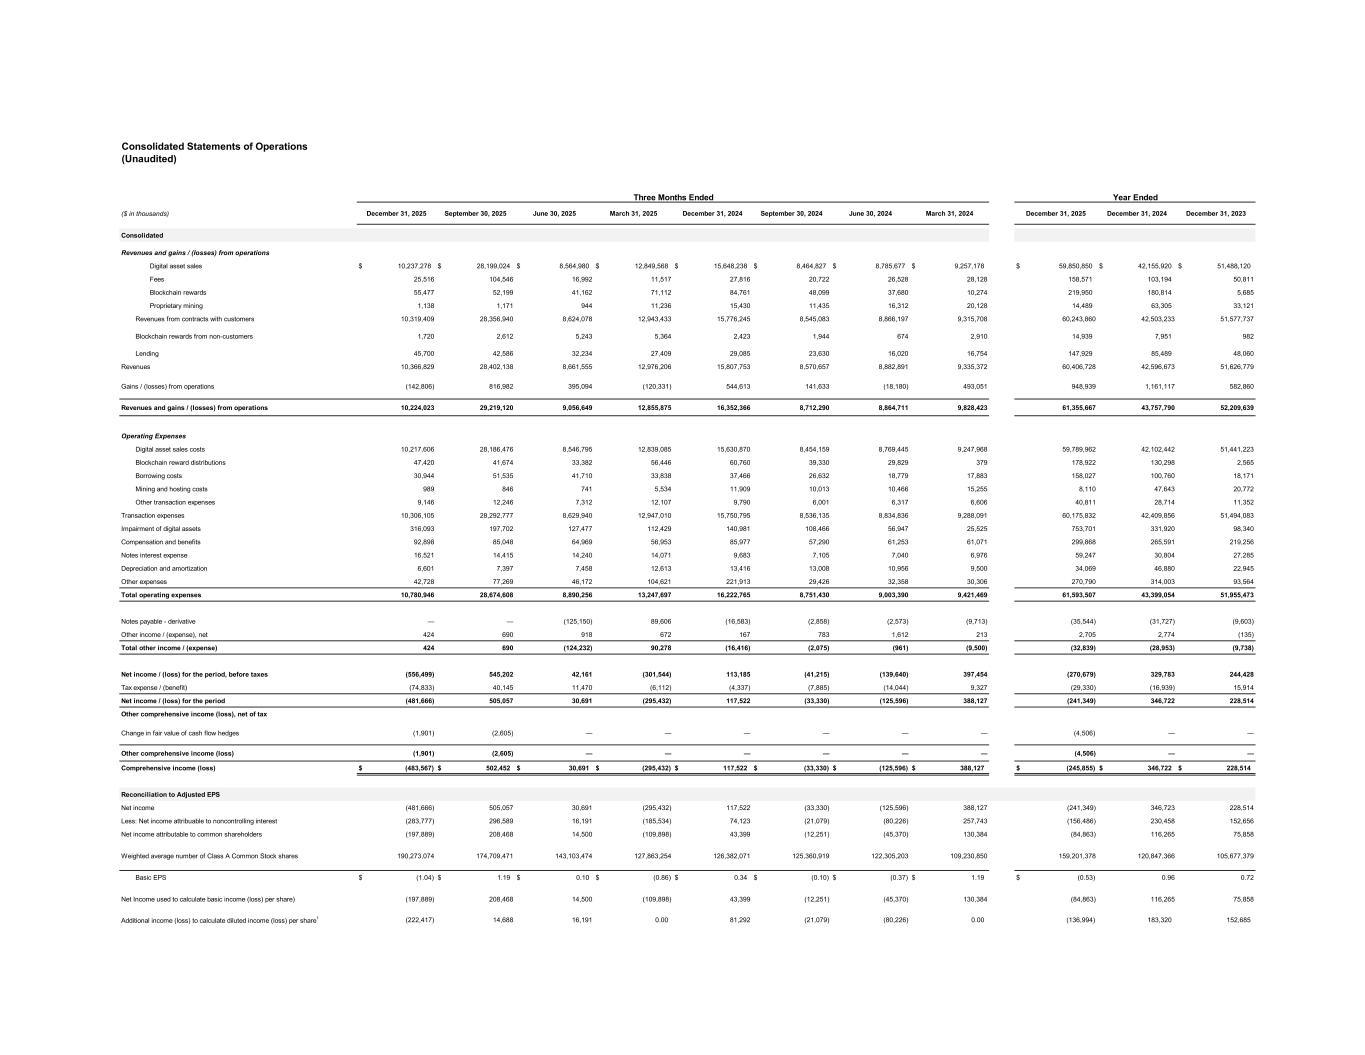
Consolidated Statements of Operations (Unaudited) Three Months Ended Year Ended ($ in thousands) December 31, 2025 September 30, 2025 June 30, 2025 March 31, 2025 December 31, 2024 September 30, 2024 June 30, 2024 March 31, 2024 December 31, 2025 December 31, 2024 December 31, 2023 Consolidated Revenues and gains / (losses) from operations Digital asset sales $ 10,237,278 $ 28,199,024 $ 8,564,980 $ 12,849,568 $ 15,648,238 $ 8,464,827 $ 8,785,677 $ 9,257,178 $ 59,850,850 $ 42,155,920 $ 51,488,120 Fees 25,516 104,546 16,992 11,517 27,816 20,722 26,528 28,128 158,571 103,194 50,811 Blockchain rewards 55,477 52,199 41,162 71,112 84,761 48,099 37,680 10,274 219,950 180,814 5,685 Proprietary mining 1,138 1,171 944 11,236 15,430 11,435 16,312 20,128 14,489 63,305 33,121 Revenues from contracts with customers 10,319,409 28,356,940 8,624,078 12,943,433 15,776,245 8,545,083 8,866,197 9,315,708 60,243,860 42,503,233 51,577,737 Blockchain rewards from non-customers 1,720 2,612 5,243 5,364 2,423 1,944 674 2,910 14,939 7,951 982 Lending 45,700 42,586 32,234 27,409 29,085 23,630 16,020 16,754 147,929 85,489 48,060 Revenues 10,366,829 28,402,138 8,661,555 12,976,206 15,807,753 8,570,657 8,882,891 9,335,372 60,406,728 42,596,673 51,626,779 Gains / (losses) from operations (142,806) 816,982 395,094 (120,331) 544,613 141,633 (18,180) 493,051 948,939 1,161,117 582,860 Revenues and gains / (losses) from operations 10,224,023 29,219,120 9,056,649 12,855,875 16,352,366 8,712,290 8,864,711 9,828,423 61,355,667 43,757,790 52,209,639 Operating Expenses Digital asset sales costs 10,217,606 28,186,476 8,546,795 12,839,085 15,630,870 8,454,159 8,769,445 9,247,968 59,789,962 42,102,442 51,441,223 Blockchain reward distributions 47,420 41,674 33,382 56,446 60,760 39,330 29,829 379 178,922 130,298 2,565 Borrowing costs 30,944 51,535 41,710 33,838 37,466 26,632 18,779 17,883 158,027 100,760 18,171 Mining and hosting costs 989 846 741 5,534 11,909 10,013 10,466 15,255 8,110 47,643 20,772 Other transaction expenses 9,146 12,246 7,312 12,107 9,790 6,001 6,317 6,606 40,811 28,714 11,352 Transaction expenses 10,306,105 28,292,777 8,629,940 12,947,010 15,750,795 8,536,135 8,834,836 9,288,091 60,175,832 42,409,856 51,494,083 Impairment of digital assets 316,093 197,702 127,477 112,429 140,981 108,466 56,947 25,525 753,701 331,920 98,340 Compensation and benefits 92,898 85,048 64,969 56,953 85,977 57,290 61,253 61,071 299,868 265,591 219,256 Notes interest expense 16,521 14,415 14,240 14,071 9,683 7,105 7,040 6,976 59,247 30,804 27,285 Depreciation and amortization 6,601 7,397 7,458 12,613 13,416 13,008 10,956 9,500 34,069 46,880 22,945 Other expenses 42,728 77,269 46,172 104,621 221,913 29,426 32,358 30,306 270,790 314,003 93,564 Total operating expenses 10,780,946 28,674,608 8,890,256 13,247,697 16,222,765 8,751,430 9,003,390 9,421,469 61,593,507 43,399,054 51,955,473 Notes payable - derivative — — (125,150) 89,606 (16,583) (2,858) (2,573) (9,713) (35,544) (31,727) (9,603) Other income / (expense), net 424 690 918 672 167 783 1,612 213 2,705 2,774 (135) Total other income / (expense) 424 690 (124,232) 90,278 (16,416) (2,075) (961) (9,500) (32,839) (28,953) (9,738) Net income / (loss) for the period, before taxes (556,499) 545,202 42,161 (301,544) 113,185 (41,215) (139,640) 397,454 (270,679) 329,783 244,428 Tax expense / (benefit) (74,833) 40,145 11,470 (6,112) (4,337) (7,885) (14,044) 9,327 (29,330) (16,939) 15,914 Net income / (loss) for the period (481,666) 505,057 30,691 (295,432) 117,522 (33,330) (125,596) 388,127 (241,349) 346,722 228,514 Other comprehensive income (loss), net of tax Change in fair value of cash flow hedges (1,901) (2,605) — — — — — — (4,506) — — Other comprehensive income (loss) (1,901) (2,605) — — — — — — (4,506) — — Comprehensive income (loss) $ (483,567) $ 502,452 $ 30,691 $ (295,432) $ 117,522 $ (33,330) $ (125,596) $ 388,127 $ (245,855) $ 346,722 $ 228,514 Reconciliation to Adjusted EPS Net income (481,666) 505,057 30,691 (295,432) 117,522 (33,330) (125,596) 388,127 (241,349) 346,723 228,514 Less: Net income attribuable to noncontrolling interest (283,777) 296,589 16,191 (185,534) 74,123 (21,079) (80,226) 257,743 (156,486) 230,458 152,656 Net income attributable to common shareholders (197,889) 208,468 14,500 (109,898) 43,399 (12,251) (45,370) 130,384 (84,863) 116,265 75,858 Weighted average number of Class A Common Stock shares 190,273,074 174,709,471 143,103,474 127,863,254 126,382,071 125,360,919 122,305,203 109,230,850 159,201,378 120,847,366 105,677,379 Basic EPS $ (1.04) $ 1.19 $ 0.10 $ (0.86) $ 0.34 $ (0.10) $ (0.37) $ 1.19 $ (0.53) 0.96 0.72 Net Income used to calculate basic income (loss) per share) (197,889) 208,468 14,500 (109,898) 43,399 (12,251) (45,370) 130,384 (84,863) 116,265 75,858 Additional income (loss) to calculate diluted income (loss) per share1 (222,417) 14,688 16,191 0.00 81,292 (21,079) (80,226) 0.00 (136,994) 183,320 152,685
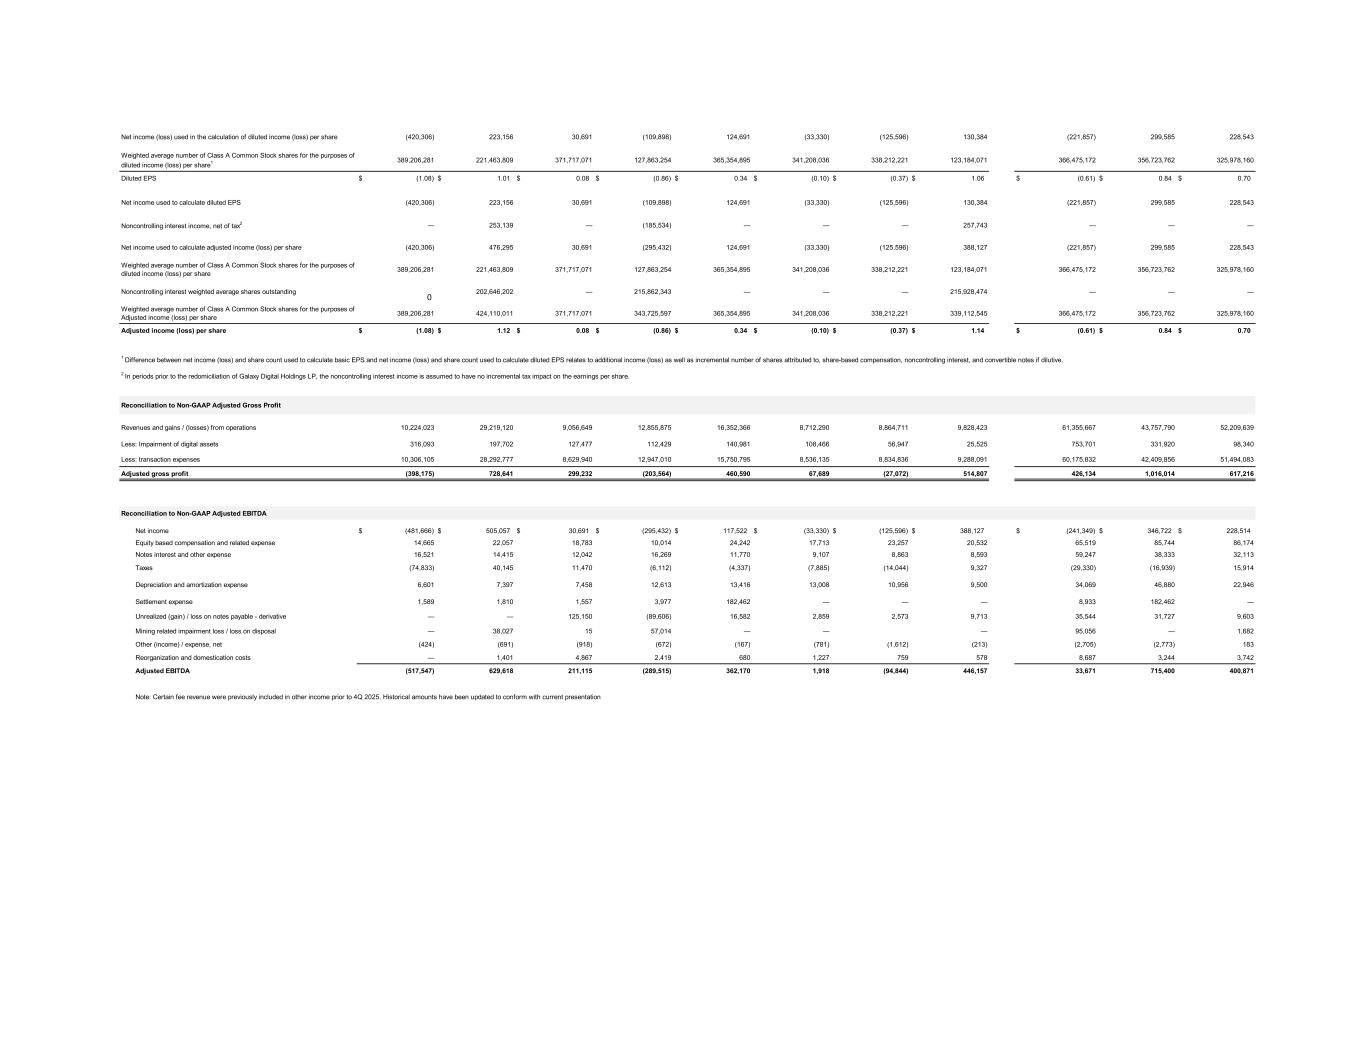
Net income (loss) used in the calculation of diluted income (loss) per share (420,306) 223,156 30,691 (109,898) 124,691 (33,330) (125,596) 130,384 (221,857) 299,585 228,543 Weighted average number of Class A Common Stock shares for the purposes of diluted income (loss) per share1 389,206,281 221,463,809 371,717,071 127,863,254 365,354,895 341,208,036 338,212,221 123,184,071 366,475,172 356,723,762 325,978,160 Diluted EPS $ (1.08) $ 1.01 $ 0.08 $ (0.86) $ 0.34 $ (0.10) $ (0.37) $ 1.06 $ (0.61) $ 0.84 $ 0.70 Net income used to calculate diluted EPS (420,306) 223,156 30,691 (109,898) 124,691 (33,330) (125,596) 130,384 (221,857) 299,585 228,543 Noncontrolling interest income, net of tax2 — 253,139 — (185,534) — — — 257,743 — — — Net income used to calculate adjusted income (loss) per share (420,306) 476,295 30,691 (295,432) 124,691 (33,330) (125,596) 388,127 (221,857) 299,585 228,543 Weighted average number of Class A Common Stock shares for the purposes of diluted income (loss) per share 389,206,281 221,463,809 371,717,071 127,863,254 365,354,895 341,208,036 338,212,221 123,184,071 366,475,172 356,723,762 325,978,160 Noncontrolling interest weighted average shares outstanding 0 202,646,202 — 215,862,343 — — — 215,928,474 — — — Weighted average number of Class A Common Stock shares for the purposes of Adjusted income (loss) per share 389,206,281 424,110,011 371,717,071 343,725,597 365,354,895 341,208,036 338,212,221 339,112,545 366,475,172 356,723,762 325,978,160 Adjusted income (loss) per share $ (1.08) $ 1.12 $ 0.08 $ (0.86) $ 0.34 $ (0.10) $ (0.37) $ 1.14 $ (0.61) $ 0.84 $ 0.70 Reconciliation to Non-GAAP Adjusted Gross Profit Revenues and gains / (losses) from operations 10,224,023 29,219,120 9,056,649 12,855,875 16,352,366 8,712,290 8,864,711 9,828,423 61,355,667 43,757,790 52,209,639 Less: Impairment of digital assets 316,093 197,702 127,477 112,429 140,981 108,466 56,947 25,525 753,701 331,920 98,340 Less: transaction expenses 10,306,105 28,292,777 8,629,940 12,947,010 15,750,795 8,536,135 8,834,836 9,288,091 60,175,832 42,409,856 51,494,083 Adjusted gross profit (398,175) 728,641 299,232 (203,564) 460,590 67,689 (27,072) 514,807 426,134 1,016,014 617,216 Reconciliation to Non-GAAP Adjusted EBITDA Net income $ (481,666) $ 505,057 $ 30,691 $ (295,432) $ 117,522 $ (33,330) $ (125,596) $ 388,127 $ (241,349) $ 346,722 $ 228,514 Equity based compensation and related expense 14,665 22,057 18,783 10,014 24,242 17,713 23,257 20,532 65,519 85,744 86,174 Notes interest and other expense 16,521 14,415 12,042 16,269 11,770 9,107 8,863 8,593 59,247 38,333 32,113 Taxes (74,833) 40,145 11,470 (6,112) (4,337) (7,885) (14,044) 9,327 (29,330) (16,939) 15,914 Depreciation and amortization expense 6,601 7,397 7,458 12,613 13,416 13,008 10,956 9,500 34,069 46,880 22,946 Settlement expense 1,589 1,810 1,557 3,977 182,462 — — — 8,933 182,462 — Unrealized (gain) / loss on notes payable - derivative — — 125,150 (89,606) 16,582 2,859 2,573 9,713 35,544 31,727 9,603 Mining related impairment loss / loss on disposal — 38,027 15 57,014 — — — 95,056 — 1,682 Other (income) / expense, net (424) (691) (918) (672) (167) (781) (1,612) (213) (2,705) (2,773) 183 Reorganization and domestication costs — 1,401 4,867 2,419 680 1,227 759 578 8,687 3,244 3,742 Adjusted EBITDA (517,547) 629,618 211,115 (289,515) 362,170 1,918 (94,844) 446,157 33,671 715,400 400,871 Note: Certain fee revenue were previously included in other income prior to 4Q 2025. Historical amounts have been updated to conform with current presentation 1 Difference between net income (loss) and share count used to calculate basic EPS and net income (loss) and share count used to calculate diluted EPS relates to additional income (loss) as well as incremental number of shares attributed to, share-based compensation, noncontrolling interest, and convertible notes if dilutive. 2 In periods prior to the redomiciliation of Galaxy Digital Holdings LP, the noncontrolling interest income is assumed to have no incremental tax impact on the earnings per share.
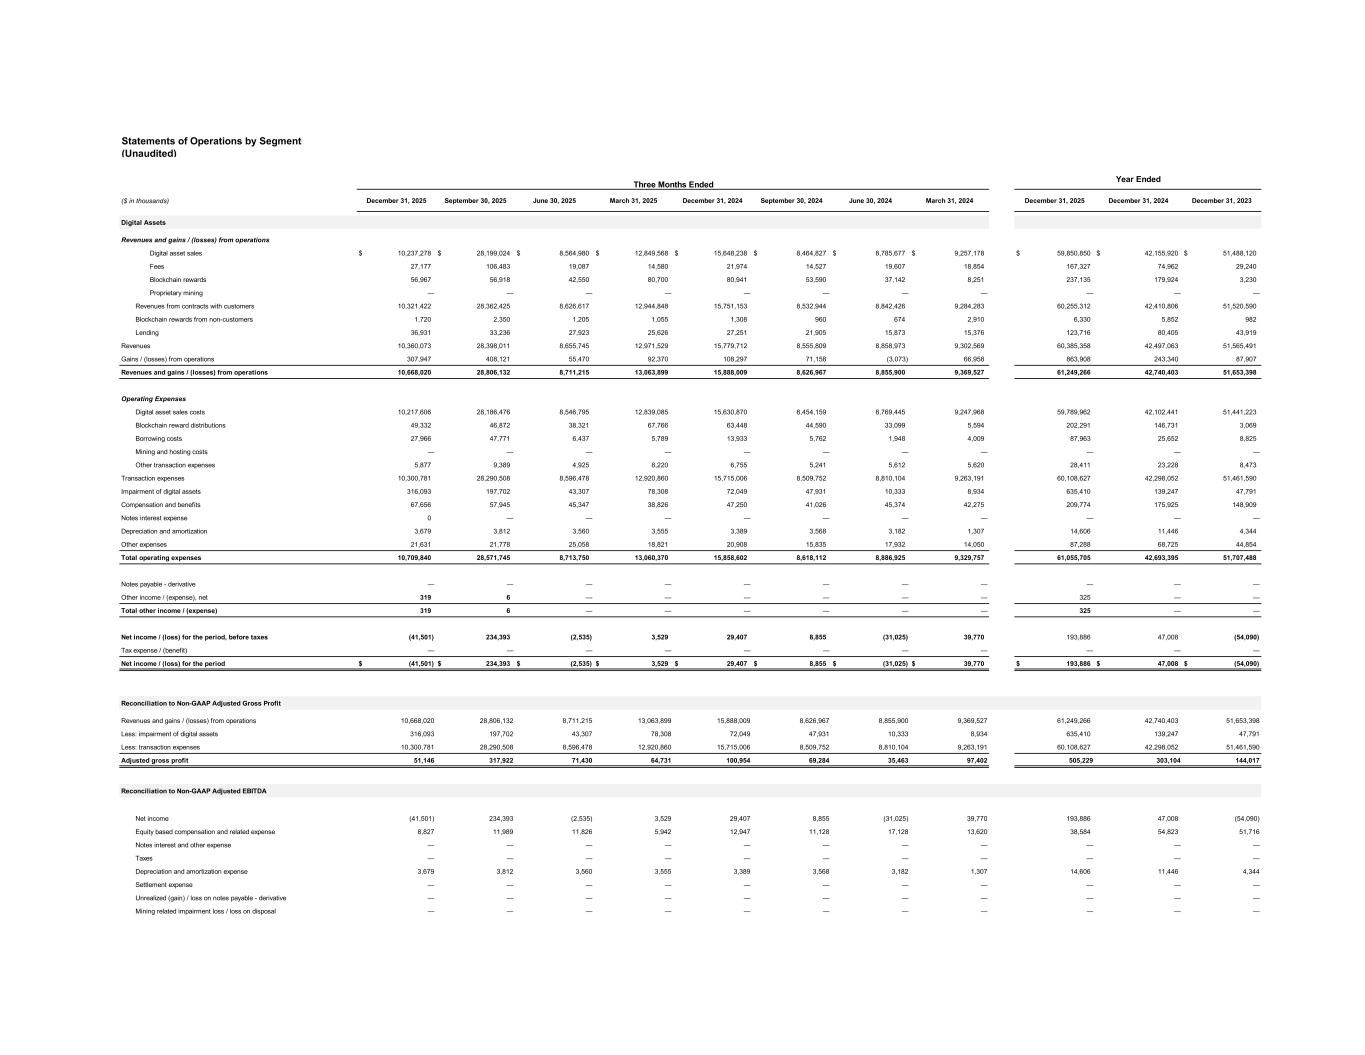
Statements of Operations by Segment (Unaudited) Three Months Ended Year Ended ($ in thousands) December 31, 2025 September 30, 2025 June 30, 2025 March 31, 2025 December 31, 2024 September 30, 2024 June 30, 2024 March 31, 2024 December 31, 2025 December 31, 2024 December 31, 2023 Digital Assets Revenues and gains / (losses) from operations Digital asset sales $ 10,237,278 $ 28,199,024 $ 8,564,980 $ 12,849,568 $ 15,648,238 $ 8,464,827 $ 8,785,677 $ 9,257,178 $ 59,850,850 $ 42,155,920 $ 51,488,120 Fees 27,177 106,483 19,087 14,580 21,974 14,527 19,607 18,854 167,327 74,962 29,240 Blockchain rewards 56,967 56,918 42,550 80,700 80,941 53,590 37,142 8,251 237,135 179,924 3,230 Proprietary mining — — — — — — — — — — — Revenues from contracts with customers 10,321,422 28,362,425 8,626,617 12,944,848 15,751,153 8,532,944 8,842,426 9,284,283 60,255,312 42,410,806 51,520,590 Blockchain rewards from non-customers 1,720 2,350 1,205 1,055 1,308 960 674 2,910 6,330 5,852 982 Lending 36,931 33,236 27,923 25,626 27,251 21,905 15,873 15,376 123,716 80,405 43,919 Revenues 10,360,073 28,398,011 8,655,745 12,971,529 15,779,712 8,555,809 8,858,973 9,302,569 60,385,358 42,497,063 51,565,491 Gains / (losses) from operations 307,947 408,121 55,470 92,370 108,297 71,158 (3,073) 66,958 863,908 243,340 87,907 Revenues and gains / (losses) from operations 10,668,020 28,806,132 8,711,215 13,063,899 15,888,009 8,626,967 8,855,900 9,369,527 61,249,266 42,740,403 51,653,398 Operating Expenses Digital asset sales costs 10,217,606 28,186,476 8,546,795 12,839,085 15,630,870 8,454,159 8,769,445 9,247,968 59,789,962 42,102,441 51,441,223 Blockchain reward distributions 49,332 46,872 38,321 67,766 63,448 44,590 33,099 5,594 202,291 146,731 3,069 Borrowing costs 27,966 47,771 6,437 5,789 13,933 5,762 1,948 4,009 87,963 25,652 8,825 Mining and hosting costs — — — — — — — — — — — Other transaction expenses 5,877 9,389 4,925 8,220 6,755 5,241 5,612 5,620 28,411 23,228 8,473 Transaction expenses 10,300,781 28,290,508 8,596,478 12,920,860 15,715,006 8,509,752 8,810,104 9,263,191 60,108,627 42,298,052 51,461,590 Impairment of digital assets 316,093 197,702 43,307 78,308 72,049 47,931 10,333 8,934 635,410 139,247 47,791 Compensation and benefits 67,656 57,945 45,347 38,826 47,250 41,026 45,374 42,275 209,774 175,925 148,909 Notes interest expense 0 — — — — — — — — — — Depreciation and amortization 3,679 3,812 3,560 3,555 3,389 3,568 3,182 1,307 14,606 11,446 4,344 Other expenses 21,631 21,778 25,058 18,821 20,908 15,835 17,932 14,050 87,288 68,725 44,854 Total operating expenses 10,709,840 28,571,745 8,713,750 13,060,370 15,858,602 8,618,112 8,886,925 9,329,757 61,055,705 42,693,395 51,707,488 Notes payable - derivative — — — — — — — — — — — Other income / (expense), net 319 6 — — — — — — 325 — — Total other income / (expense) 319 6 — — — — — — 325 — — Net income / (loss) for the period, before taxes (41,501) 234,393 (2,535) 3,529 29,407 8,855 (31,025) 39,770 193,886 47,008 (54,090) Tax expense / (benefit) — — — — — — — — — — — Net income / (loss) for the period $ (41,501) $ 234,393 $ (2,535) $ 3,529 $ 29,407 $ 8,855 $ (31,025) $ 39,770 $ 193,886 $ 47,008 $ (54,090) Reconciliation to Non-GAAP Adjusted Gross Profit Revenues and gains / (losses) from operations 10,668,020 28,806,132 8,711,215 13,063,899 15,888,009 8,626,967 8,855,900 9,369,527 61,249,266 42,740,403 51,653,398 Less: impairment of digital assets 316,093 197,702 43,307 78,308 72,049 47,931 10,333 8,934 635,410 139,247 47,791 Less: transaction expenses 10,300,781 28,290,508 8,596,478 12,920,860 15,715,006 8,509,752 8,810,104 9,263,191 60,108,627 42,298,052 51,461,590 Adjusted gross profit 51,146 317,922 71,430 64,731 100,954 69,284 35,463 97,402 505,229 303,104 144,017 Reconciliation to Non-GAAP Adjusted EBITDA Net income (41,501) 234,393 (2,535) 3,529 29,407 8,855 (31,025) 39,770 193,886 47,008 (54,090) Equity based compensation and related expense 8,827 11,989 11,826 5,942 12,947 11,128 17,128 13,620 38,584 54,823 51,716 Notes interest and other expense — — — — — — — — — — — Taxes — — — — — — — — — — — Depreciation and amortization expense 3,679 3,812 3,560 3,555 3,389 3,568 3,182 1,307 14,606 11,446 4,344 Settlement expense — — — — — — — — — — — Unrealized (gain) / loss on notes payable - derivative — — — — — — — — — — — Mining related impairment loss / loss on disposal — — — — — — — — — — —
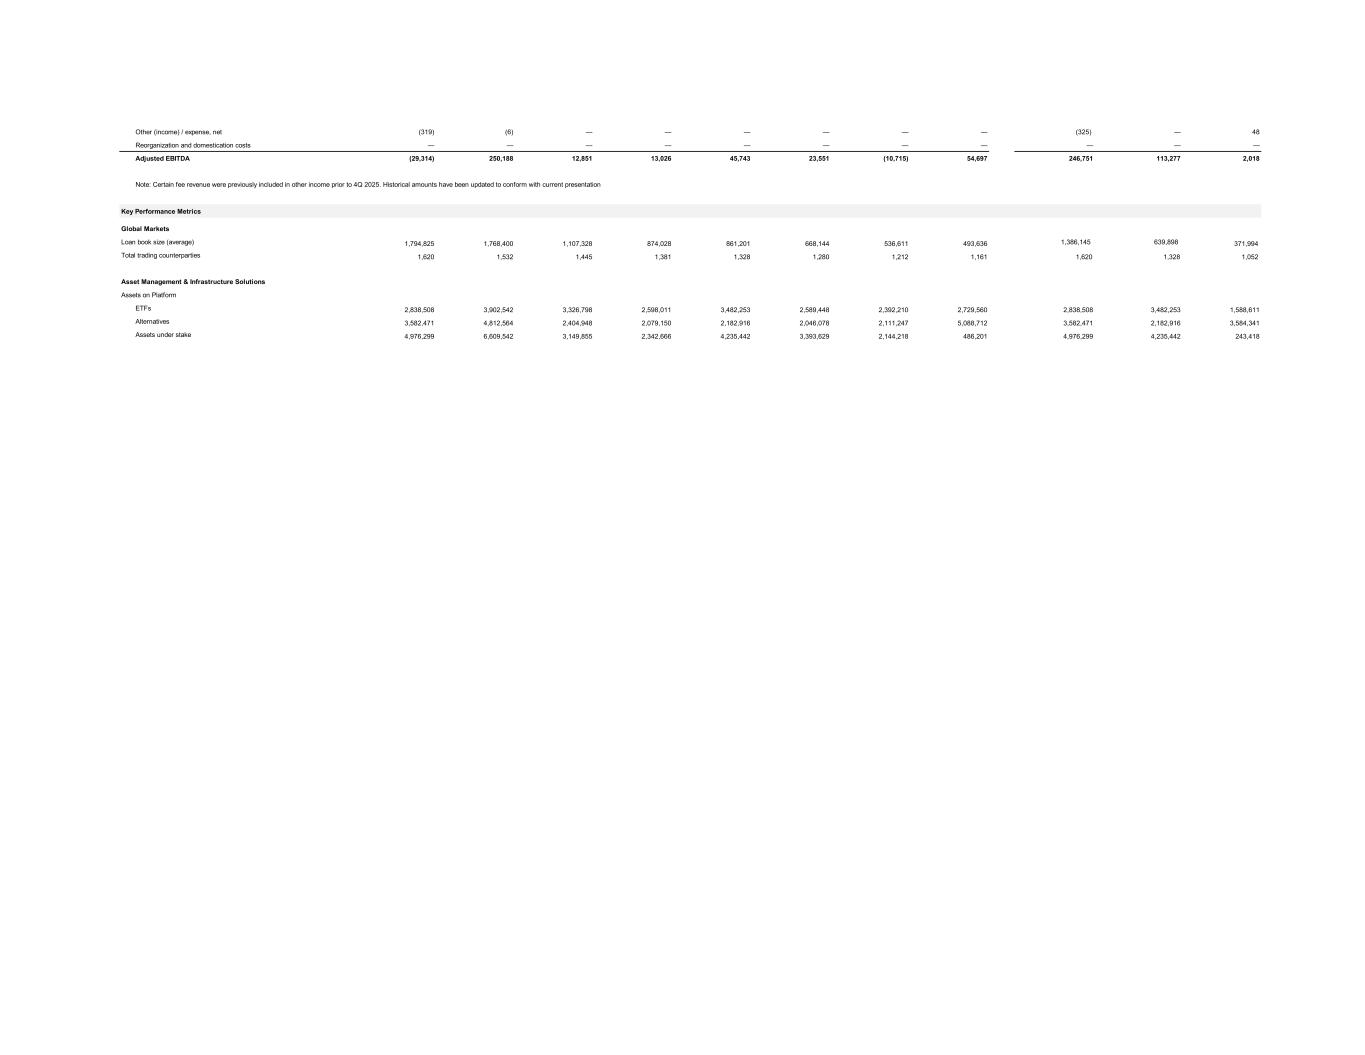
Other (income) / expense, net (319) (6) — — — — — — (325) — 48 Reorganization and domestication costs — — — — — — — — — — — Adjusted EBITDA (29,314) 250,188 12,851 13,026 45,743 23,551 (10,715) 54,697 246,751 113,277 2,018 Note: Certain fee revenue were previously included in other income prior to 4Q 2025. Historical amounts have been updated to conform with current presentation Key Performance Metrics Global Markets Loan book size (average) 1,794,825 1,768,400 1,107,328 874,028 861,201 668,144 536,611 493,636 1,386,145 639,898 371,994 Total trading counterparties 1,620 1,532 1,445 1,381 1,328 1,280 1,212 1,161 1,620 1,328 1,052 Asset Management & Infrastructure Solutions Assets on Platform ETFs 2,838,508 3,902,542 3,326,798 2,598,011 3,482,253 2,589,448 2,392,210 2,729,560 2,838,508 3,482,253 1,588,611 Alternatives 3,582,471 4,812,564 2,404,948 2,079,150 2,182,916 2,046,078 2,111,247 5,088,712 3,582,471 2,182,916 3,584,341 Assets under stake 4,976,299 6,609,542 3,149,855 2,342,666 4,235,442 3,393,629 2,144,218 486,201 4,976,299 4,235,442 243,418
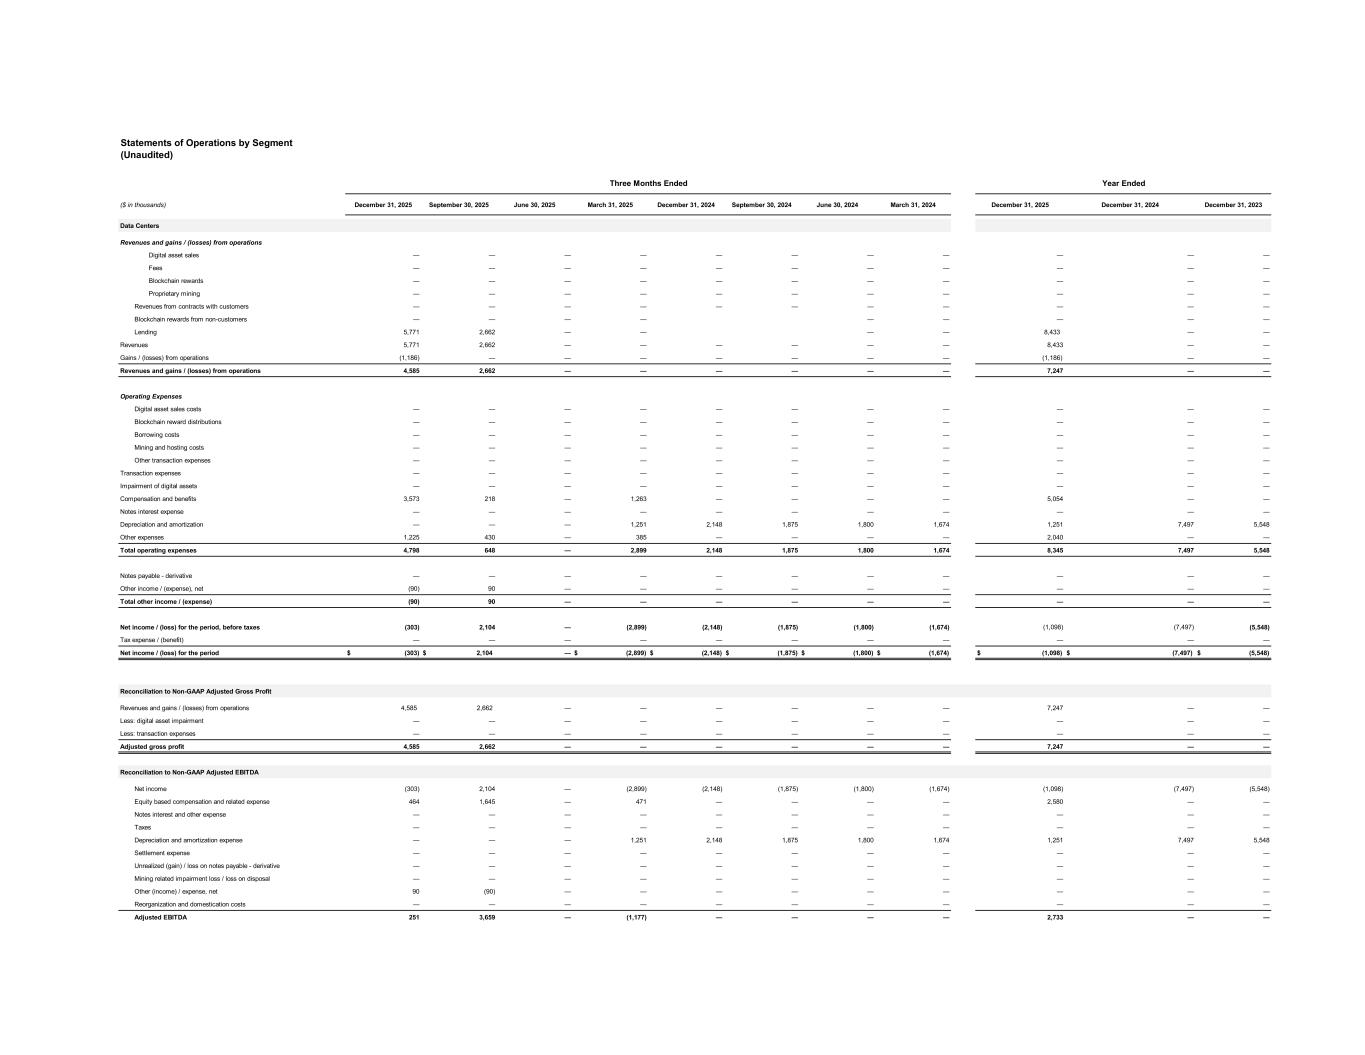
Statements of Operations by Segment (Unaudited) Three Months Ended Year Ended ($ in thousands) December 31, 2025 September 30, 2025 June 30, 2025 March 31, 2025 December 31, 2024 September 30, 2024 June 30, 2024 March 31, 2024 December 31, 2025 December 31, 2024 December 31, 2023 Data Centers Revenues and gains / (losses) from operations Digital asset sales — — — — — — — — — — — Fees — — — — — — — — — — — Blockchain rewards — — — — — — — — — — — Proprietary mining — — — — — — — — — — — Revenues from contracts with customers — — — — — — — — — — — Blockchain rewards from non-customers — — — — — — — — — Lending 5,771 2,662 — — — — 8,433 — — Revenues 5,771 2,662 — — — — — — 8,433 — — Gains / (losses) from operations (1,186) — — — — — — — (1,186) — — Revenues and gains / (losses) from operations 4,585 2,662 — — — — — — 7,247 — — Operating Expenses Digital asset sales costs — — — — — — — — — — — Blockchain reward distributions — — — — — — — — — — — Borrowing costs — — — — — — — — — — — Mining and hosting costs — — — — — — — — — — — Other transaction expenses — — — — — — — — — — — Transaction expenses — — — — — — — — — — — Impairment of digital assets — — — — — — — — — — — Compensation and benefits 3,573 218 — 1,263 — — — — 5,054 — — Notes interest expense — — — — — — — — — — — Depreciation and amortization — — — 1,251 2,148 1,875 1,800 1,674 1,251 7,497 5,548 Other expenses 1,225 430 — 385 — — — — 2,040 — — Total operating expenses 4,798 648 — 2,899 2,148 1,875 1,800 1,674 8,345 7,497 5,548 Notes payable - derivative — — — — — — — — — — — Other income / (expense), net (90) 90 — — — — — — — — — Total other income / (expense) (90) 90 — — — — — — — — — Net income / (loss) for the period, before taxes (303) 2,104 — (2,899) (2,148) (1,875) (1,800) (1,674) (1,098) (7,497) (5,548) Tax expense / (benefit) — — — — — — — — — — — Net income / (loss) for the period $ (303) $ 2,104 — $ (2,899) $ (2,148) $ (1,875) $ (1,800) $ (1,674) $ (1,098) $ (7,497) $ (5,548) Reconciliation to Non-GAAP Adjusted Gross Profit Revenues and gains / (losses) from operations 4,585 2,662 — — — — — — 7,247 — — Less: digital asset impairment — — — — — — — — — — — Less: transaction expenses — — — — — — — — — — — Adjusted gross profit 4,585 2,662 — — — — — — 7,247 — — Reconciliation to Non-GAAP Adjusted EBITDA Net income (303) 2,104 — (2,899) (2,148) (1,875) (1,800) (1,674) (1,098) (7,497) (5,548) Equity based compensation and related expense 464 1,645 — 471 — — — — 2,580 — — Notes interest and other expense — — — — — — — — — — — Taxes — — — — — — — — — — — Depreciation and amortization expense — — — 1,251 2,148 1,875 1,800 1,674 1,251 7,497 5,548 Settlement expense — — — — — — — — — — — Unrealized (gain) / loss on notes payable - derivative — — — — — — — — — — — Mining related impairment loss / loss on disposal — — — — — — — — — — — Other (income) / expense, net 90 (90) — — — — — — — — — Reorganization and domestication costs — — — — — — — — — — — Adjusted EBITDA 251 3,659 — (1,177) — — — — 2,733 — —
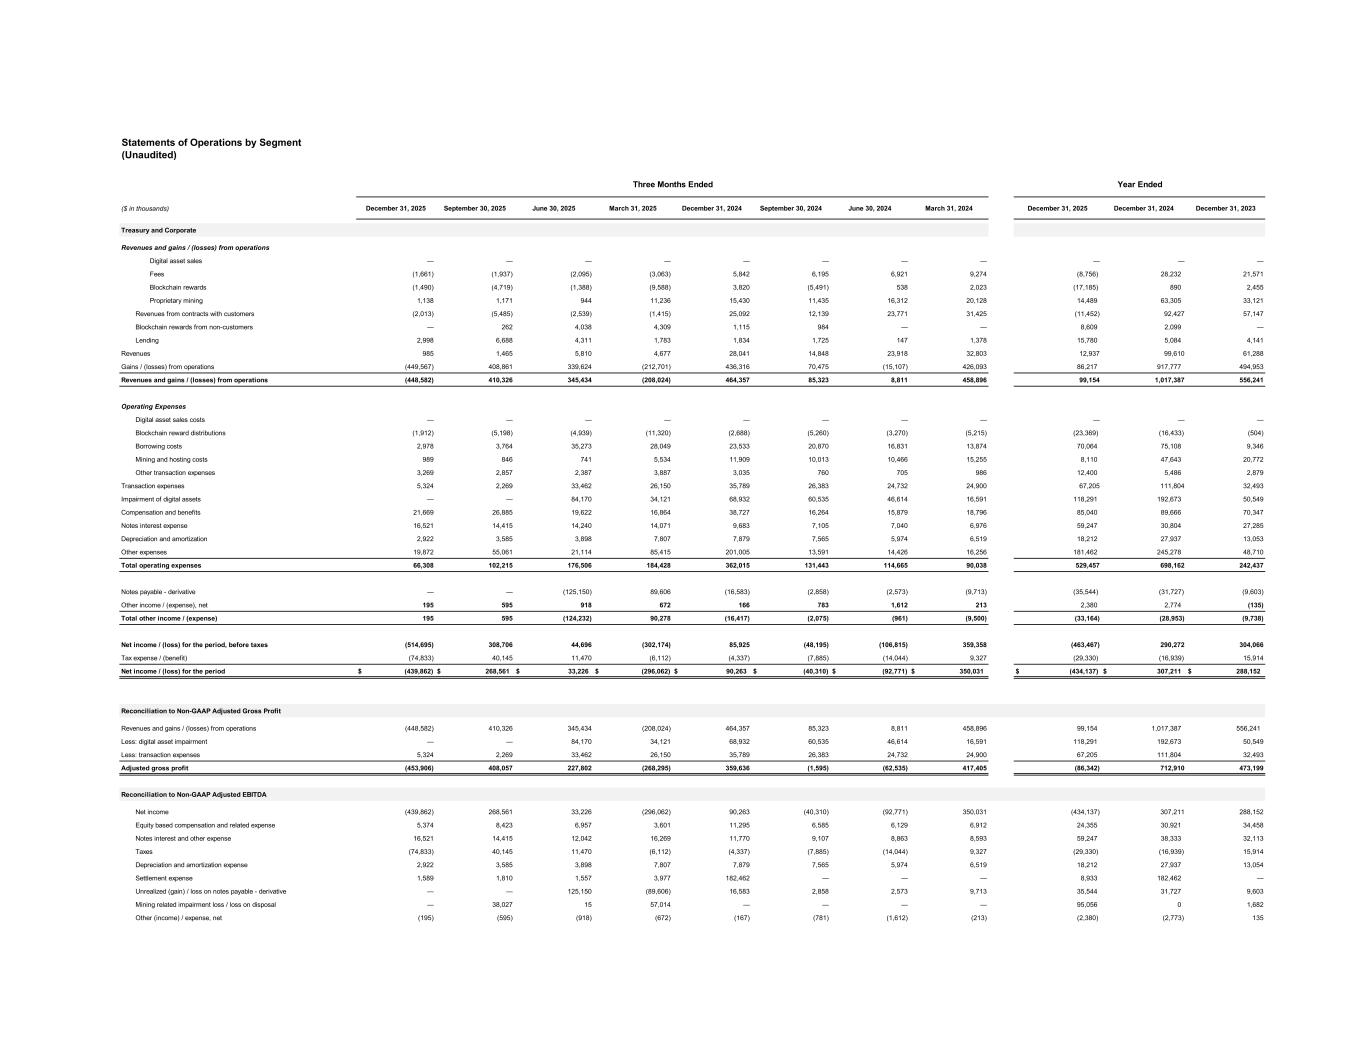
Statements of Operations by Segment (Unaudited) Three Months Ended Year Ended ($ in thousands) December 31, 2025 September 30, 2025 June 30, 2025 March 31, 2025 December 31, 2024 September 30, 2024 June 30, 2024 March 31, 2024 December 31, 2025 December 31, 2024 December 31, 2023 Treasury and Corporate Revenues and gains / (losses) from operations Digital asset sales — — — — — — — — — — — Fees (1,661) (1,937) (2,095) (3,063) 5,842 6,195 6,921 9,274 (8,756) 28,232 21,571 Blockchain rewards (1,490) (4,719) (1,388) (9,588) 3,820 (5,491) 538 2,023 (17,185) 890 2,455 Proprietary mining 1,138 1,171 944 11,236 15,430 11,435 16,312 20,128 14,489 63,305 33,121 Revenues from contracts with customers (2,013) (5,485) (2,539) (1,415) 25,092 12,139 23,771 31,425 (11,452) 92,427 57,147 Blockchain rewards from non-customers — 262 4,038 4,309 1,115 984 — — 8,609 2,099 — Lending 2,998 6,688 4,311 1,783 1,834 1,725 147 1,378 15,780 5,084 4,141 Revenues 985 1,465 5,810 4,677 28,041 14,848 23,918 32,803 12,937 99,610 61,288 Gains / (losses) from operations (449,567) 408,861 339,624 (212,701) 436,316 70,475 (15,107) 426,093 86,217 917,777 494,953 Revenues and gains / (losses) from operations (448,582) 410,326 345,434 (208,024) 464,357 85,323 8,811 458,896 99,154 1,017,387 556,241 Operating Expenses Digital asset sales costs — — — — — — — — — — — Blockchain reward distributions (1,912) (5,198) (4,939) (11,320) (2,688) (5,260) (3,270) (5,215) (23,369) (16,433) (504) Borrowing costs 2,978 3,764 35,273 28,049 23,533 20,870 16,831 13,874 70,064 75,108 9,346 Mining and hosting costs 989 846 741 5,534 11,909 10,013 10,466 15,255 8,110 47,643 20,772 Other transaction expenses 3,269 2,857 2,387 3,887 3,035 760 705 986 12,400 5,486 2,879 Transaction expenses 5,324 2,269 33,462 26,150 35,789 26,383 24,732 24,900 67,205 111,804 32,493 Impairment of digital assets — — 84,170 34,121 68,932 60,535 46,614 16,591 118,291 192,673 50,549 Compensation and benefits 21,669 26,885 19,622 16,864 38,727 16,264 15,879 18,796 85,040 89,666 70,347 Notes interest expense 16,521 14,415 14,240 14,071 9,683 7,105 7,040 6,976 59,247 30,804 27,285 Depreciation and amortization 2,922 3,585 3,898 7,807 7,879 7,565 5,974 6,519 18,212 27,937 13,053 Other expenses 19,872 55,061 21,114 85,415 201,005 13,591 14,426 16,256 181,462 245,278 48,710 Total operating expenses 66,308 102,215 176,506 184,428 362,015 131,443 114,665 90,038 529,457 698,162 242,437 Notes payable - derivative — — (125,150) 89,606 (16,583) (2,858) (2,573) (9,713) (35,544) (31,727) (9,603) Other income / (expense), net 195 595 918 672 166 783 1,612 213 2,380 2,774 (135) Total other income / (expense) 195 595 (124,232) 90,278 (16,417) (2,075) (961) (9,500) (33,164) (28,953) (9,738) Net income / (loss) for the period, before taxes (514,695) 308,706 44,696 (302,174) 85,925 (48,195) (106,815) 359,358 (463,467) 290,272 304,066 Tax expense / (benefit) (74,833) 40,145 11,470 (6,112) (4,337) (7,885) (14,044) 9,327 (29,330) (16,939) 15,914 Net income / (loss) for the period $ (439,862) $ 268,561 $ 33,226 $ (296,062) $ 90,263 $ (40,310) $ (92,771) $ 350,031 $ (434,137) $ 307,211 $ 288,152 Reconciliation to Non-GAAP Adjusted Gross Profit Revenues and gains / (losses) from operations (448,582) 410,326 345,434 (208,024) 464,357 85,323 8,811 458,896 99,154 1,017,387 556,241 Less: digital asset impairment — — 84,170 34,121 68,932 60,535 46,614 16,591 118,291 192,673 50,549 Less: transaction expenses 5,324 2,269 33,462 26,150 35,789 26,383 24,732 24,900 67,205 111,804 32,493 Adjusted gross profit (453,906) 408,057 227,802 (268,295) 359,636 (1,595) (62,535) 417,405 (86,342) 712,910 473,199 Reconciliation to Non-GAAP Adjusted EBITDA Net income (439,862) 268,561 33,226 (296,062) 90,263 (40,310) (92,771) 350,031 (434,137) 307,211 288,152 Equity based compensation and related expense 5,374 8,423 6,957 3,601 11,295 6,585 6,129 6,912 24,355 30,921 34,458 Notes interest and other expense 16,521 14,415 12,042 16,269 11,770 9,107 8,863 8,593 59,247 38,333 32,113 Taxes (74,833) 40,145 11,470 (6,112) (4,337) (7,885) (14,044) 9,327 (29,330) (16,939) 15,914 Depreciation and amortization expense 2,922 3,585 3,898 7,807 7,879 7,565 5,974 6,519 18,212 27,937 13,054 Settlement expense 1,589 1,810 1,557 3,977 182,462 — — — 8,933 182,462 — Unrealized (gain) / loss on notes payable - derivative — — 125,150 (89,606) 16,583 2,858 2,573 9,713 35,544 31,727 9,603 Mining related impairment loss / loss on disposal — 38,027 15 57,014 — — — — 95,056 0 1,682 Other (income) / expense, net (195) (595) (918) (672) (167) (781) (1,612) (213) (2,380) (2,773) 135
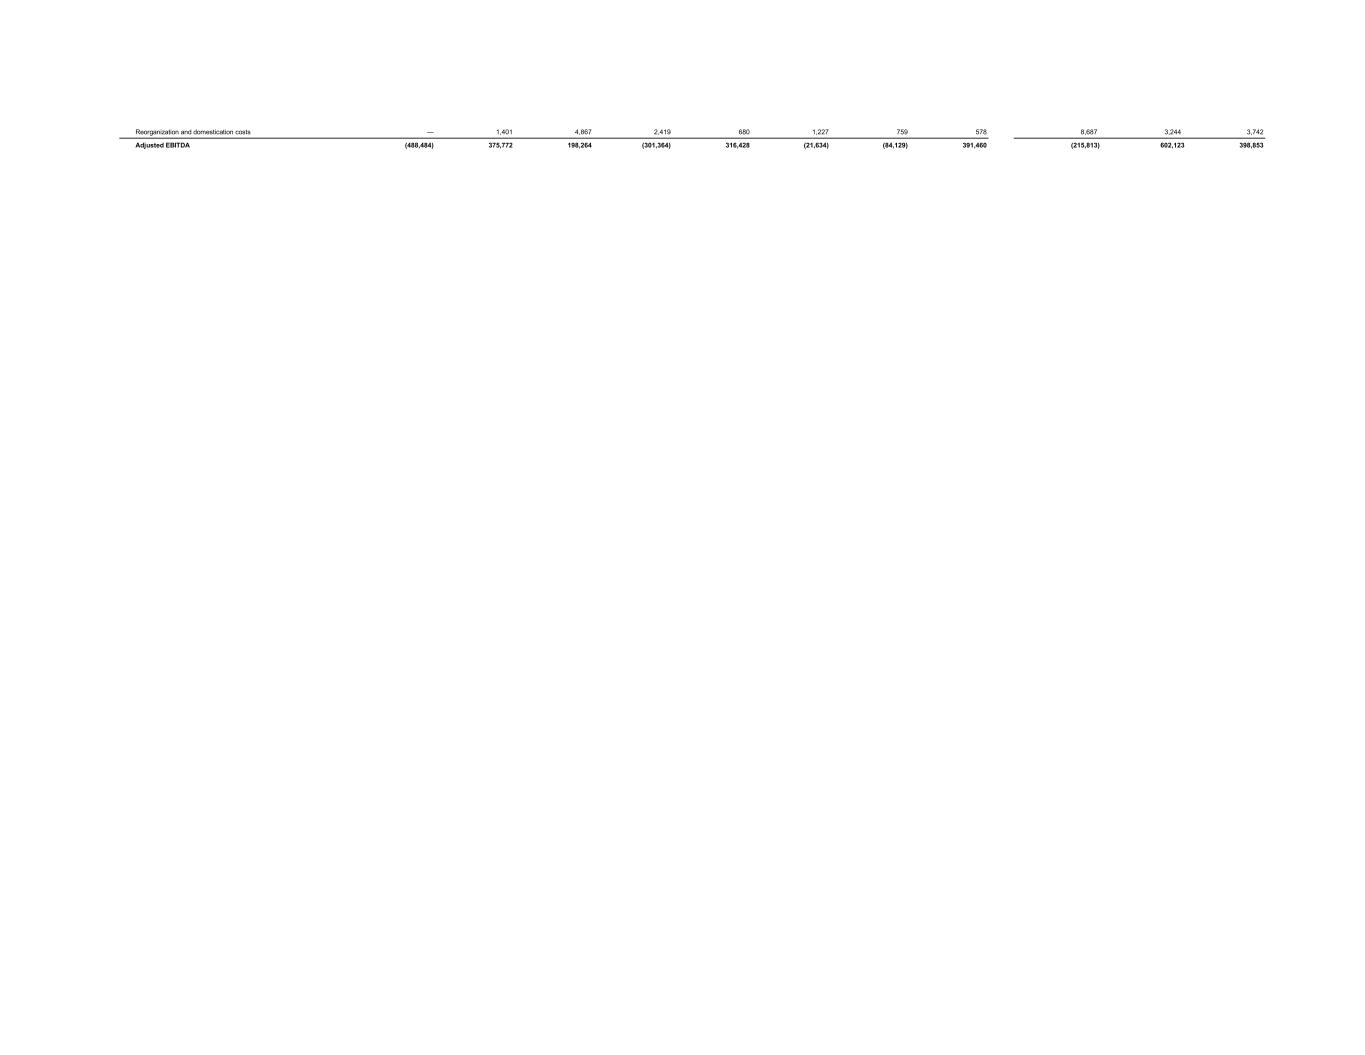
Reorganization and domestication costs — 1,401 4,867 2,419 680 1,227 759 578 8,687 3,244 3,742 Adjusted EBITDA (488,484) 375,772 198,264 (301,364) 316,428 (21,634) (84,129) 391,460 (215,813) 602,123 398,853
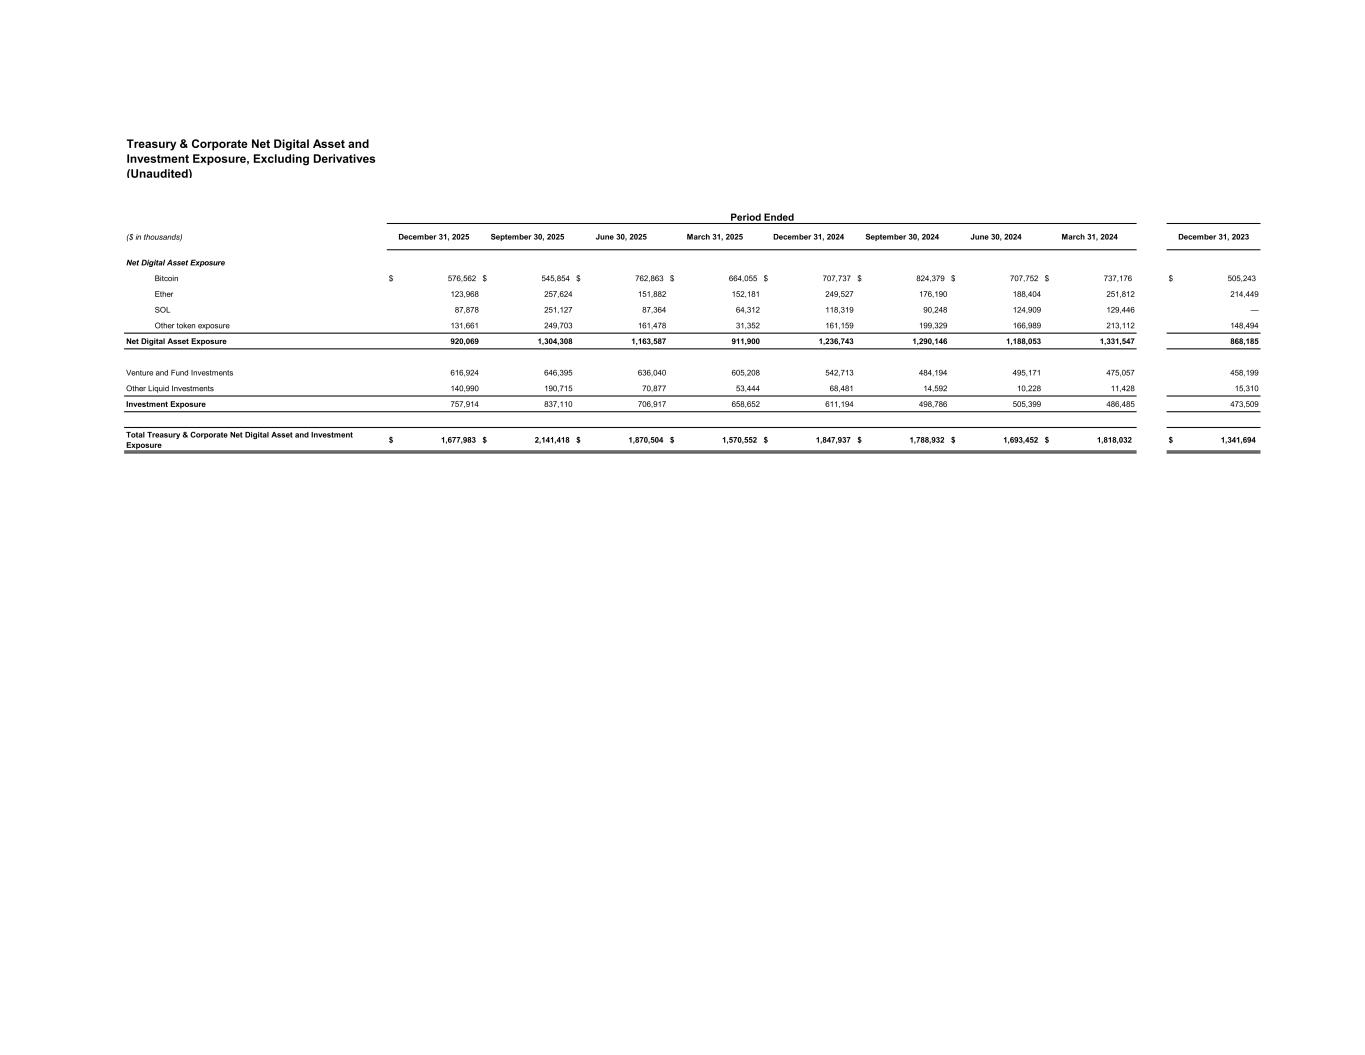
Treasury & Corporate Net Digital Asset and Investment Exposure, Excluding Derivatives (Unaudited) Period Ended ($ in thousands) December 31, 2025 September 30, 2025 June 30, 2025 March 31, 2025 December 31, 2024 September 30, 2024 June 30, 2024 March 31, 2024 December 31, 2023 Net Digital Asset Exposure Bitcoin $ 576,562 $ 545,854 $ 762,863 $ 664,055 $ 707,737 $ 824,379 $ 707,752 $ 737,176 $ 505,243 Ether 123,968 257,624 151,882 152,181 249,527 176,190 188,404 251,812 214,449 SOL 87,878 251,127 87,364 64,312 118,319 90,248 124,909 129,446 — Other token exposure 131,661 249,703 161,478 31,352 161,159 199,329 166,989 213,112 148,494 Net Digital Asset Exposure 920,069 1,304,308 1,163,587 911,900 1,236,743 1,290,146 1,188,053 1,331,547 868,185 Venture and Fund Investments 616,924 646,395 636,040 605,208 542,713 484,194 495,171 475,057 458,199 Other Liquid Investments 140,990 190,715 70,877 53,444 68,481 14,592 10,228 11,428 15,310 Investment Exposure 757,914 837,110 706,917 658,652 611,194 498,786 505,399 486,485 473,509 Total Treasury & Corporate Net Digital Asset and Investment Exposure $ 1,677,983 $ 2,141,418 $ 1,870,504 $ 1,570,552 $ 1,847,937 $ 1,788,932 $ 1,693,452 $ 1,818,032 $ 1,341,694
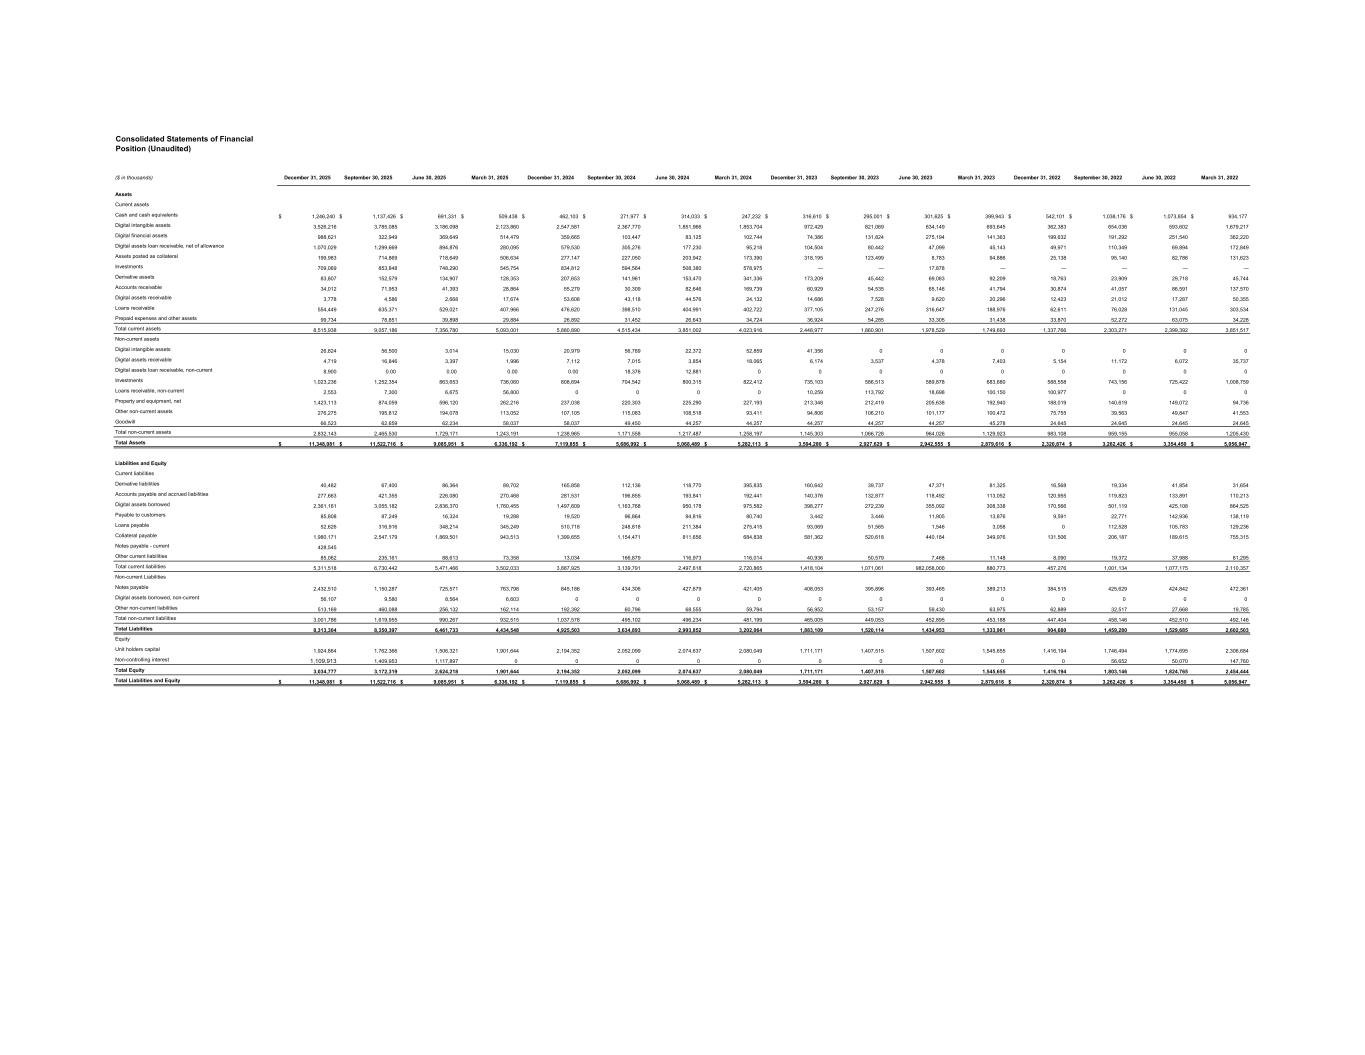
Consolidated Statements of Financial Position (Unaudited) ($ in thousands) December 31, 2025 September 30, 2025 June 30, 2025 March 31, 2025 December 31, 2024 September 30, 2024 June 30, 2024 March 31, 2024 December 31, 2023 September 30, 2023 June 30, 2023 March 31, 2023 December 31, 2022 September 30, 2022 June 30, 2022 March 31, 2022 Assets Current assets Cash and cash equivalents $ 1,246,240 $ 1,137,426 $ 691,331 $ 509,438 $ 462,103 $ 271,977 $ 314,033 $ 247,232 $ 316,610 $ 295,001 $ 301,625 $ 399,943 $ 542,101 $ 1,038,176 $ 1,073,854 $ 934,177 Digital intangible assets 3,526,216 3,785,085 3,186,098 2,123,860 2,547,581 2,367,770 1,851,966 1,853,704 972,429 821,069 834,149 693,645 362,383 654,036 593,602 1,679,217 Digital financial assets 988,621 322,949 369,649 514,479 359,665 103,447 83,125 102,744 74,386 131,824 275,194 141,363 199,632 191,292 251,540 362,220 Digital assets loan receivable, net of allowance 1,070,029 1,299,669 894,876 280,095 579,530 305,276 177,230 95,218 104,504 80,442 47,099 45,143 49,971 110,349 69,894 172,849 Assets posted as collateral 199,983 714,869 718,649 506,634 277,147 227,050 203,942 173,390 318,195 123,499 8,783 94,886 25,138 95,140 82,786 131,623 Investments 709,069 853,848 748,290 545,754 834,812 594,564 508,380 578,975 — — 17,878 — — — — — Derivative assets 83,807 152,579 134,907 128,353 207,653 141,961 153,470 341,336 173,209 45,442 69,083 92,209 18,763 23,909 29,718 45,744 Accounts receivable 34,012 71,953 41,393 28,864 55,279 30,309 82,646 169,739 60,929 54,535 65,146 41,794 30,874 41,057 86,591 137,570 Digital assets receivable 3,778 4,586 2,668 17,674 53,608 43,118 44,576 24,132 14,686 7,528 9,620 20,296 12,423 21,012 17,287 50,355 Loans receivable 554,449 635,371 529,021 407,966 476,620 398,510 404,991 402,722 377,105 247,276 316,647 188,976 62,611 76,028 131,045 303,534 Prepaid expenses and other assets 99,734 78,851 39,898 29,884 26,892 31,452 26,643 34,724 36,924 54,285 33,305 31,438 33,870 52,272 63,075 34,228 Total current assets 8,515,938 9,057,186 7,356,780 5,093,001 5,880,890 4,515,434 3,851,002 4,023,916 2,448,977 1,860,901 1,978,529 1,749,693 1,337,766 2,303,271 2,399,392 3,851,517 Non-current assets Digital intangible assets 26,824 56,500 3,014 15,030 20,979 56,789 22,372 52,859 41,356 0 0 0 0 0 0 0 Digital assets receivable 4,719 16,846 3,397 1,996 7,112 7,015 3,854 18,065 6,174 3,537 4,378 7,403 5,154 11,172 6,072 35,737 Digital assets loan receivable, non-current 8,900 0.00 0.00 0.00 0.00 18,376 12,881 0 0 0 0 0 0 0 0 0 Investments 1,023,236 1,252,354 863,653 736,060 808,694 704,542 800,315 822,412 735,103 586,513 589,878 683,680 588,558 743,156 725,422 1,008,759 Loans receivable, non-current 2,553 7,300 6,675 56,800 0 0 0 0 10,259 113,792 18,698 100,150 100,977 0 0 0 Property and equipment, net 1,423,113 874,059 596,120 262,216 237,038 220,303 225,290 227,193 213,348 212,419 205,638 192,940 188,019 140,619 149,072 94,736 Other non-current assets 276,275 195,812 194,078 113,052 107,105 115,083 108,518 93,411 94,806 106,210 101,177 100,472 75,755 39,563 49,847 41,553 Goodwill 66,523 62,659 62,234 58,037 58,037 49,450 44,257 44,257 44,257 44,257 44,257 45,278 24,645 24,645 24,645 24,645 Total non-current assets 2,832,143 2,465,530 1,729,171 1,243,191 1,238,965 1,171,558 1,217,487 1,258,197 1,145,303 1,066,728 964,026 1,129,923 983,108 959,155 955,058 1,205,430 Total Assets $ 11,348,081 $ 11,522,716 $ 9,085,951 $ 6,336,192 $ 7,119,855 $ 5,686,992 $ 5,068,489 $ 5,282,113 $ 3,594,280 $ 2,927,629 $ 2,942,555 $ 2,879,616 $ 2,320,874 $ 3,262,426 $ 3,354,450 $ 5,056,947 Liabilities and Equity Current liabilities Derivative liabilities 40,482 67,400 86,364 89,702 165,858 112,136 118,770 395,835 160,642 39,737 47,371 81,325 16,568 19,334 41,854 31,654 Accounts payable and accrued liabilities 277,663 421,355 226,080 270,468 281,531 196,855 193,841 192,441 140,376 132,877 118,492 113,052 120,955 119,823 133,891 110,213 Digital assets borrowed 2,361,161 3,055,182 2,836,370 1,760,455 1,497,609 1,163,768 950,178 975,582 398,277 272,239 355,092 308,338 170,566 501,119 425,108 864,525 Payable to customers 85,808 87,249 16,324 19,288 19,520 96,864 94,816 80,740 3,442 3,446 11,905 13,876 9,591 22,771 142,936 138,119 Loans payable 52,626 316,916 348,214 345,249 510,718 248,818 211,384 275,415 93,069 51,565 1,546 3,058 0 112,528 105,783 129,236 Collateral payable 1,980,171 2,547,179 1,869,501 943,513 1,399,655 1,154,471 811,656 684,838 581,362 520,618 440,184 349,976 131,506 206,187 189,615 755,315 Notes payable - current 428,545 Other current liabilities 85,062 235,161 88,613 73,358 13,034 166,879 116,973 116,014 40,936 50,579 7,468 11,148 8,090 19,372 37,988 81,295 Total current liabilities 5,311,518 6,730,442 5,471,466 3,502,033 3,887,925 3,139,791 2,497,618 2,720,865 1,418,104 1,071,061 982,058,000 880,773 457,276 1,001,134 1,077,175 2,110,357 Non-current Liabilities Notes payable 2,432,510 1,150,287 725,571 763,798 845,186 434,306 427,679 421,405 408,053 395,896 393,465 389,213 384,515 425,629 424,842 472,361 Digital assets borrowed, non-current 56,107 9,580 8,564 6,603 0 0 0 0 0 0 0 0 0 0 0 0 Other non-current liabilities 513,169 460,088 256,132 162,114 192,392 60,796 68,555 59,794 56,952 53,157 59,430 63,975 62,889 32,517 27,668 19,785 Total non-current liabilities 3,001,786 1,619,955 990,267 932,515 1,037,578 495,102 496,234 481,199 465,005 449,053 452,895 453,188 447,404 458,146 452,510 492,146 Total Liabilities 8,313,304 8,350,397 6,461,733 4,434,548 4,925,503 3,634,893 2,993,852 3,202,064 1,883,109 1,520,114 1,434,953 1,333,961 904,680 1,459,280 1,529,685 2,602,503 Equity Unit holders capital 1,924,864 1,762,366 1,506,321 1,901,644 2,194,352 2,052,099 2,074,637 2,080,049 1,711,171 1,407,515 1,507,602 1,545,655 1,416,194 1,746,494 1,774,695 2,306,684 Non-controlling interest 1,109,913 1,409,953 1,117,897 0 0 0 0 0 0 0 0 0 0 56,652 50,070 147,760 Total Equity 3,034,777 3,172,319 2,624,218 1,901,644 2,194,352 2,052,099 2,074,637 2,080,049 1,711,171 1,407,515 1,507,602 1,545,655 1,416,194 1,803,146 1,824,765 2,454,444 Total Liabilities and Equity $ 11,348,081 $ 11,522,716 $ 9,085,951 $ 6,336,192 $ 7,119,855 $ 5,686,992 $ 5,068,489 $ 5,282,113 $ 3,594,280 $ 2,927,629 $ 2,942,555 $ 2,879,616 $ 2,320,874 $ 3,262,426 $ 3,354,450 $ 5,056,947
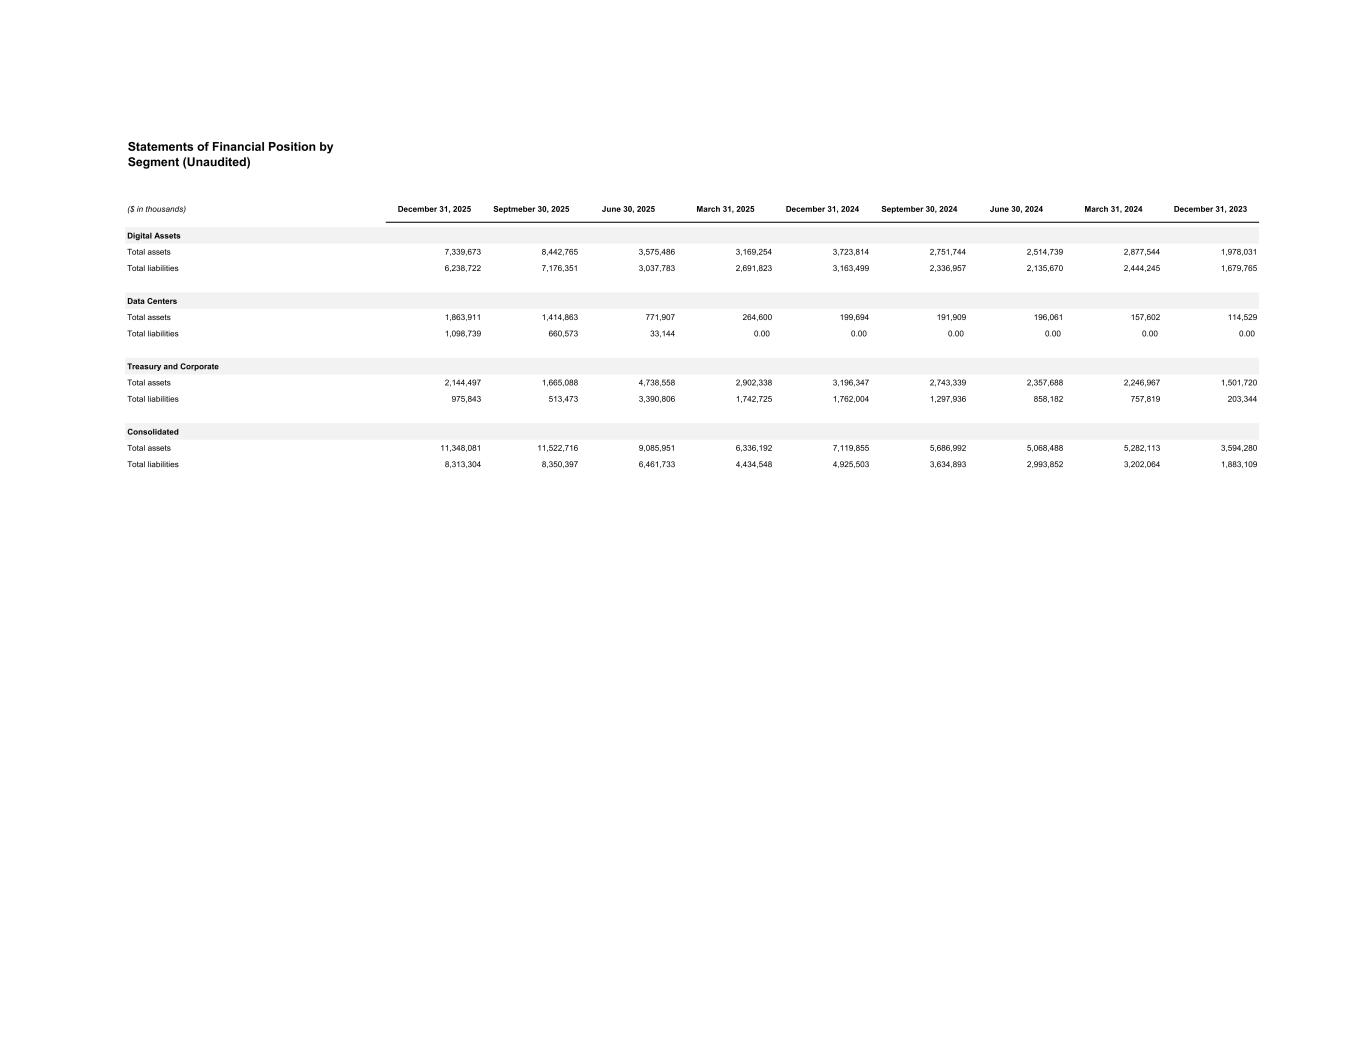
Statements of Financial Position by Segment (Unaudited) ($ in thousands) December 31, 2025 Septmeber 30, 2025 June 30, 2025 March 31, 2025 December 31, 2024 September 30, 2024 June 30, 2024 March 31, 2024 December 31, 2023 Digital Assets Total assets 7,339,673 8,442,765 3,575,486 3,169,254 3,723,814 2,751,744 2,514,739 2,877,544 1,978,031 Total liabilities 6,238,722 7,176,351 3,037,783 2,691,823 3,163,499 2,336,957 2,135,670 2,444,245 1,679,765 Data Centers Total assets 1,863,911 1,414,863 771,907 264,600 199,694 191,909 196,061 157,602 114,529 Total liabilities 1,098,739 660,573 33,144 0.00 0.00 0.00 0.00 0.00 0.00 Treasury and Corporate Total assets 2,144,497 1,665,088 4,738,558 2,902,338 3,196,347 2,743,339 2,357,688 2,246,967 1,501,720 Total liabilities 975,843 513,473 3,390,806 1,742,725 1,762,004 1,297,936 858,182 757,819 203,344 Consolidated Total assets 11,348,081 11,522,716 9,085,951 6,336,192 7,119,855 5,686,992 5,068,488 5,282,113 3,594,280 Total liabilities 8,313,304 8,350,397 6,461,733 4,434,548 4,925,503 3,634,893 2,993,852 3,202,064 1,883,109