GPMT 8-K
Granite Point Mortgage Trust Inc. (GPMT)
8-K
2020-03-02
For: 2020-03-02
View Original
Added on
April 06, 2026
UNITED STATES
SECURITIES AND EXCHANGE COMMISSION
Washington, D.C. 20549
FORM 8-K
CURRENT REPORT
Pursuant to Section 13 or 15(d) of the Securities Exchange Act of 1934
Date of Report: March 2, 2020
(Exact name of registrant as specified in its charter)
(State or other jurisdiction of incorporation) | (Commission File Number) | (I.R.S. Employer Identification No.) | ||
(Address of principal executive offices) | (Zip Code) | ||||||||
Registrant’s telephone number, including area code: (212 ) 364-5500
Not Applicable
(Former name or former address, if changed since last report)
Check the appropriate box below if the Form 8-K filing is intended to simultaneously satisfy the filing obligation of the registrant under any of the following provisions:
Written communications pursuant to Rule 425 under the Securities Act (17 CFR 230.425) | |
Soliciting material pursuant to Rule 14a-12 under the Exchange Act (17 CFR 240.14a-12) | |
Pre-commencement communications pursuant to Rule 14d-2(b) under the Exchange Act (17 CFR 240.14d-2(b)) | |
Pre-commencement communications pursuant to Rule 13e-4(c) under the Exchange Act (17 CFR 240.13e-4(c)) | |
Securities registered pursuant to Section 12(b) of the Act:
Title of each class | Trading Symbol(s) | Name of each exchange on which registered | ||
Indicate by check mark whether the registrant is an emerging growth company as defined in Rule 405 of the Securities Act of 1933 (§230.405 of this chapter) or Rule 12b-2 of the Securities Exchange Act of 1934 (§240.12b-2 of this chapter).
Emerging growth company ☐
If an emerging growth company, indicate by check mark if the registrant has elected not to use the extended transition period for complying with any new or revised financial accounting standards provided pursuant to Section 13(a) of the Exchange Act.
☐
Item 2.02 Results of Operations and Financial Disclosure.
On March 2, 2020, Granite Point Mortgage Trust Inc. (the "Company") issued a press release announcing its financial results for the fiscal quarter ended December 31, 2019. A copy of the press release and a 2019 Fourth Quarter Earnings Call Presentation are attached hereto as Exhibits 99.1 and 99.2, respectively, and are incorporated herein by reference.
The information in this Current Report, including Exhibits 99.1 and 99.2 attached hereto, is furnished pursuant to Item 2.02 of Form 8-K and shall not be deemed to be “filed” for any other purpose, including for purposes of Section 18 of the Securities Exchange Act of 1934, as amended, or otherwise subject to the liabilities of that Section. The information in Item 2.02 of this Current Report, including Exhibits 99.1 and 99.2, shall not be deemed incorporated by reference into any filing of the registrant under the Securities Act of 1933 or the Exchange Act, whether made before or after the date hereof, regardless of any general incorporation language in such filings (unless the registrant specifically states that the information or exhibit in this Item 2.02 is incorporated by reference).
Item 9.01 | Financial Statements and Exhibits. |
(d) Exhibits.
Exhibit No. | Description | ||
99.1 | |||
99.2 | |||
104 | Cover Page Interactive Data File, formatted in Inline XBRL. | ||
SIGNATURES
Pursuant to the requirements of the Securities Exchange Act of 1934, the registrant has duly caused this report to be signed on its behalf by the undersigned hereunto duly authorized.
GRANITE POINT MORTGAGE TRUST INC. | ||
By: | /s/ MICHAEL J. KARBER | |
Michael J. Karber | ||
General Counsel and Assistant Secretary | ||
Date: March 2, 2020 | ||

Granite Point Mortgage Trust Inc. Reports
Fourth Quarter and Full Year 2019 Financial Results
Announces Process to Internalize Management Function
NEW YORK, March 2, 2020 – Granite Point Mortgage Trust Inc. (NYSE: GPMT) today announced its financial results for the quarter and full year ended December 31, 2019, and provided an update on its activities subsequent to quarter-end. A presentation containing fourth quarter 2019 highlights and activity post quarter-end can be viewed at www.gpmtreit.com.
Fourth Quarter 2019 Highlights
• | Generated GAAP net income of $17.7 million, or $0.32 per basic share, and Core Earnings(1) of $18.7 million, or $0.34 per basic share. |
• | Closed 11 new loan commitments of $670.9 million, with an average loan size of $61.0 million, initial fundings of $516.3 million, a weighted average stabilized LTV of 67%(2), and a weighted average yield of LIBOR + 3.49%(3). |
• | Funded an additional $86.3 million on existing loan commitments and received prepayments and principal amortization of $302.8 million. |
• | Current portfolio principal balance of $4.3 billion that is over 98% floating rate and comprised of over 98% senior loans with a weighted average stabilized LTV of 64%(2). |
• | Declared and paid a dividend of $0.42 per common share. Book value was $18.58 per common share as of December 31, 2019. |
2019 Highlights
• | Generated GAAP net income of $70.1 million; Core Earnings(1) of $74.6 million, an increase of $8.3 million, or 13% as compared to 2018. |
• | Committed a total of $2.0 billion to 45 new loan investments, an increase of 27% over 2018 originations volume. Funded over $1.8 billion in total loan balances including $237.6 million for prior commitments. |
• | Grew our portfolio's total commitments to over $5.0 billion, an increase of approximately $1.2 billion, or 31%, from 2018. Outstanding principal balance increased to $4.3 billion, or 33%, from 2018. |
• | Improved the profile of our liabilities by increasing our non-mark-to-market financing through the issuance of our second CRE CLO, and by establishing a new financing facility with favorable structure and terms. Additionally, realized lower financing costs on the overall portfolio. |
• | Extended the maturities, modified financial covenants, increased the overall borrowing capacity and renegotiated various other terms of our financing facilities. |
• | Increased our equity capital base by 23% from 2018, growing the company's scale and market presence by raising over $207 million in total net proceeds through various capital markets activities. |
Activity Post Quarter-End
• | Generated a pipeline of senior CRE loans, with total commitments of $200 million and initial fundings of $125 million, which have either closed or are in the closing process, subject to fallout. |
• | Funded $120 million of loan balances, including prior commitments, and received $46.7 million of prepayments so far in Q1 2020. |
• | Extended the maturity of the Citi financing facility to 2023 and increased its borrowing capacity to $500 million. |
1
Jack Taylor, Granite Point’s President and Chief Executive Officer, stated: “Granite Point had a great 2019 highlighted by $2.0 billion in originations volume, continued growth of our business and further expansion of our platform’s brand recognition in the market. The record fourth quarter originations of over $670 million and fundings of over $600 million significantly contributed to our over 30% year-over-year portfolio growth. We also expanded our financing capacity, realized lower financing costs and further improved the profile of our liabilities by issuing our second CRE CLO, which provided us with additional matched-term, non-recourse and non-mark-to-market funding at attractive terms. We continue to emphasize strong loan underwriting and structuring discipline, and protecting our stockholders’ capital, and have not realized any loan credit losses since inception of our business. We are excited about the future of our business, we are confident that the franchise value our team has built will accrue to the benefit of our stockholders over time.”
Process to Internalize Management Function
Granite Point today also announced it has agreed to a process with its external manager, Pine River Capital Management L.P. (“Pine River”), to internalize the Company’s management function.
A committee of Granite Point’s Board of Directors comprising its independent members (the “Independent Committee”) has been negotiating the internalization on behalf of the Company, and has retained independent advisors. In connection with the completion of the internalization, the Company expects to continue to be managed by its strong senior management team along with other personnel providing services to Granite Point, who are currently employed by Pine River, and to whom the Independent Committee expects to extend offers of employment.
Details are expected to be announced once finalized in several months, and a final agreement and definitive documentation are expected to be delivered and executed at that time. Until that time, the Company does not undertake any obligation to provide updates with respect to this process. There can be no assurance that the internalization will be consummated.
(1) | Core Earnings is a non-U.S. GAAP measure that we define as comprehensive income attributable to common stockholders, excluding “realized and unrealized gains and losses” (impairment losses, realized and unrealized gains or losses on the aggregate portfolio and non-cash compensation expense related to restricted common stock). We believe the presentation of Core Earnings provides investors greater transparency into our period-over-period financial performance and facilitates comparisons to peer REITs. Please see page 7 for a reconciliation of GAAP to non-GAAP financial information. |
(2) | Stabilized loan-to-value ratio (LTV) is calculated as the fully funded loan amount (plus any financing that is pari passu with or senior to such loan), including all contractually provided for future fundings, divided by the as stabilized value (as determined in conformance with USPAP) set forth in the original appraisal. As stabilized value may be based on certain assumptions, such as future construction completion, projected re-tenanting, payment of tenant improvement or leasing commissions allowances or free or abated rent periods, or increased tenant occupancies. |
(3) | Yield includes net origination fees and exit fees, but does not include future fundings, and is expressed as a monthly equivalent yield. |
2
Conference Call
Granite Point Mortgage Trust Inc. will host a conference call on March 3, 2020 at 10:00 a.m. ET to discuss fourth quarter and full year 2019 financial results and related information. To participate in the teleconference, approximately 10 minutes prior to the above start time, please call toll-free (833) 255-2835 (or (412) 902-6769 for international callers), and ask to be joined into the Granite Point Mortgage Trust Inc. call. You may also listen to the teleconference live via the Internet at www.gpmtreit.com, in the Investor Relations section under the Events & Presentations link. For those unable to attend, a telephone playback will be available beginning March 3, 2020 at 12:00 p.m. ET through April 3, 2020 at 12:00 a.m. ET. The playback can be accessed by calling (877) 344-7529 (or (412) 317-0088 for international callers) and providing the Access Code 10138035. The call will also be archived on the company’s website in the Investor Relations section under the Events & Presentations link.
Granite Point Mortgage Trust
Granite Point Mortgage Trust Inc., a Maryland corporation, is a real estate investment trust that is focused on directly originating, investing in and managing senior floating rate commercial mortgage loans and other debt and debt-like commercial real estate investments. Granite Point is headquartered in New York, NY, and is externally managed by Pine River Capital Management L.P. Additional information is available at www.gpmtreit.com.
Forward-Looking Statements
This release contains, in addition to historical information, certain forward-looking statements that are based on our current assumptions, expectations and projections about future performance and events. In particular, statements regarding future economic performance, finances, and expectations and objectives of management constitute forward-looking statements. Forward-looking statements are not historical in nature and can be identified by words such as “believes,” “expects,” “may,” “will,” “should,” “seeks,” “approximately,” “intends,” “plans,” “estimates,” “anticipates,” “targets,” “goals,” “future,” “outlook,” “potential,” “continues,” “likely” and other expressions that are predictions of or indicate future events and trends and that do not relate to historical matters.
Although the forward-looking statements contained in this press release are based upon information available at the time the statements are made and reflect the best judgment of our senior management, forward-looking statements inherently involve known and unknown risks, uncertainties and other factors, which may cause the actual results, performance or achievements to differ materially from anticipated future results. Important factors that could cause actual results to differ materially from expected results, including, among other things, those described in our filings with the Securities and Exchange Commission (“SEC”), including our annual report on Form 10-K for the year ended December 31, 2019, and any subsequent Quarterly Reports on Form 10-Q under the caption “Risk Factors.” Factors that could cause actual results to differ include, but are not limited to: the general political, economic and competitive conditions in the markets in which we invest; defaults by borrowers in paying debt service on outstanding indebtedness and borrowers’ abilities to manage and stabilize properties; our ability to obtain financing arrangements on terms favorable to us or at all; the level and volatility of prevailing interest rates and credit spreads; reductions in the yield on our investments and an increase in the cost of our financing; general volatility of the securities markets in which we participate; the return or impact of current or future investments; allocation of investment opportunities to us by our Manager; increased competition from entities investing in our target asset investments; effects of hedging instruments on our target investments; changes in governmental regulations, tax law and rates, and similar matters; our ability to maintain our qualification as a REIT for U.S. federal income tax purposes and our exclusion from registration under the Investment Company Act; availability of desirable investment opportunities; availability of qualified personnel and our relationship with our Manager; the time and cost of the process to internalize our management function; estimates relating to our ability to make distributions to our stockholders in the future; hurricanes, earthquakes and other natural disasters, acts of war and/or terrorism, public health crises and other events that may cause unanticipated and uninsured performance declines and/or losses to us or the owners and operators of the real estate securing our investments; deterioration in the performance of the properties securing our investments that may cause deterioration in the performance of our investments and, potentially, principal losses to us; and difficulty or delays in redeploying the proceeds from repayments of our existing investments. These forward-looking statements apply only as of the date of this press release. We are under no duty to update any of these forward-looking statements after the date of this press release to conform these
3
statements to actual results or revised expectations. You should, therefore, not rely on these forward-looking statements as predictions of future events.
Non-GAAP Financial Measures
In addition to disclosing financial results calculated in accordance with United States generally accepted accounting principles (GAAP), this press release and the accompanying earnings presentation present non-GAAP financial measures, such as Core Earnings and Core Earnings per basic common share, that exclude certain items. Granite Point management believes that these non-GAAP measures enable it to perform meaningful comparisons of past, present and future results of the company’s core business operations, and uses these measures to gain a comparative understanding of the company’s operating performance and business trends. The non-GAAP financial measures presented by the company represent supplemental information to assist investors in analyzing the results of its operations. However, because these measures are not calculated in accordance with GAAP, they should not be considered a substitute for, or superior to, the financial measures calculated in accordance with GAAP. The company’s GAAP financial results and the reconciliations from these results should be carefully evaluated. See the GAAP to non-GAAP reconciliation table on page 7 of this release.
Additional Information
Stockholders of Granite Point and other interested persons may find additional information regarding the company at the Securities and Exchange Commission’s Internet site at www.sec.gov or by directing requests to: Granite Point Mortgage Trust Inc., 3 Bryant Park, 24th floor, New York, NY 10036, telephone (212) 364-5500.
Contact
Investors: Marcin Urbaszek, Chief Financial Officer, Granite Point Mortgage Trust Inc., (212) 364-5500, [email protected].
# # #
4
GRANITE POINT MORTGAGE TRUST INC.
CONSOLIDATED BALANCE SHEETS
(in thousands, except share data)
December 31, 2019 | December 31, 2018 | ||||||
ASSETS | |||||||
Loans held-for-investment | $ | 4,226,212 | $ | 3,167,913 | |||
Available-for-sale securities, at fair value | 12,830 | 12,606 | |||||
Held-to-maturity securities | 18,076 | 26,696 | |||||
Cash and cash equivalents | 80,281 | 91,700 | |||||
Restricted cash | 79,483 | 31,723 | |||||
Accrued interest receivable | 11,323 | 10,268 | |||||
Deferred debt issuance costs | 6,245 | 3,924 | |||||
Prepaid expenses | 883 | 1,055 | |||||
Other assets | 25,529 | 15,996 | |||||
Total Assets | $ | 4,460,862 | $ | 3,361,881 | |||
LIABILITIES AND STOCKHOLDERS’ EQUITY | |||||||
Liabilities | |||||||
Repurchase agreements | $ | 1,924,021 | $ | 1,500,543 | |||
Securitized debt obligations | 1,041,044 | 654,263 | |||||
Asset-specific financings | 116,465 | — | |||||
Revolving credit facilities | 42,008 | 75,000 | |||||
Convertible senior notes | 269,634 | 268,138 | |||||
Accrued interest payable | 7,285 | 6,394 | |||||
Unearned interest income | 228 | 510 | |||||
Dividends payable | 23,063 | 18,346 | |||||
Other liabilities | 16,978 | 10,156 | |||||
Total Liabilities | 3,440,726 | 2,533,350 | |||||
10% cumulative redeemable preferred stock, par value $0.01 per share; 50,000,000 shares authorized and 1,000 and 1,000 shares issued and outstanding, respectively | 1,000 | 1,000 | |||||
Stockholders’ Equity | |||||||
Common stock, par value $0.01 per share; 450,000,000 shares authorized and 54,853,205 and 43,621,174 shares issued and outstanding, respectively | 549 | 436 | |||||
Additional paid-in capital | 1,048,484 | 836,288 | |||||
Accumulated other comprehensive income (loss) | 32 | (192 | ) | ||||
Cumulative earnings | 162,076 | 91,875 | |||||
Cumulative distributions to stockholders | (192,005 | ) | (100,876 | ) | |||
Total Stockholders’ Equity | 1,019,136 | 827,531 | |||||
Total Liabilities and Stockholders’ Equity | $ | 4,460,862 | $ | 3,361,881 | |||
5
GRANITE POINT MORTGAGE TRUST INC.
CONSOLIDATED STATEMENTS OF COMPREHENSIVE INCOME
(in thousands, except share data)
Three Months Ended | Year Ended | ||||||||||||||
December 31, | December 31, | ||||||||||||||
2019 | 2018 | 2019 | 2018 | ||||||||||||
Interest income: | |||||||||||||||
Loans held-for-investment | $ | 63,428 | $ | 51,708 | $ | 240,022 | $ | 179,284 | |||||||
Available-for-sale securities | 294 | 309 | 1,221 | 1,160 | |||||||||||
Held-to-maturity securities | 435 | 716 | 2,239 | 3,194 | |||||||||||
Cash and cash equivalents | 547 | 101 | 2,775 | 242 | |||||||||||
Total interest income | 64,704 | 52,834 | 246,257 | 183,880 | |||||||||||
Interest expense: | |||||||||||||||
Repurchase agreements | 19,163 | 17,000 | 67,632 | 62,432 | |||||||||||
Securitized debt obligations | 10,935 | 7,092 | 46,815 | 17,660 | |||||||||||
Convertible senior notes | 4,512 | 4,182 | 17,971 | 10,783 | |||||||||||
Asset-specific financings | 1,174 | — | 2,891 | — | |||||||||||
Revolving credit facilities | 491 | 276 | 1,673 | 648 | |||||||||||
Total interest expense | 36,275 | 28,550 | 136,982 | 91,523 | |||||||||||
Net interest income | 28,429 | 24,284 | 109,275 | 92,357 | |||||||||||
Other income: | |||||||||||||||
Fee income | 95 | — | 1,210 | 1,446 | |||||||||||
Total other income | 95 | — | 1,210 | 1,446 | |||||||||||
Expenses: | |||||||||||||||
Management fees | 3,841 | 3,075 | 14,854 | 12,509 | |||||||||||
Incentive fees | — | — | 244 | — | |||||||||||
Servicing expenses | 999 | 628 | 3,670 | 2,196 | |||||||||||
General and administrative expenses | 6,008 | 3,884 | 21,507 | 16,025 | |||||||||||
Total expenses | 10,848 | 7,587 | 40,275 | 30,730 | |||||||||||
Income before income taxes | 17,676 | 16,697 | 70,210 | 63,073 | |||||||||||
(Benefit from) provision for income taxes | — | — | (4 | ) | (2 | ) | |||||||||
Net income | 17,676 | 16,697 | 70,214 | 63,075 | |||||||||||
Dividends on preferred stock | 25 | 25 | 100 | 100 | |||||||||||
Net income attributable to common stockholders | $ | 17,651 | $ | 16,672 | $ | 70,114 | $ | 62,975 | |||||||
Basic earnings per weighted average common share | $ | 0.32 | $ | 0.38 | $ | 1.32 | $ | 1.45 | |||||||
Diluted earnings per weighted average common share | $ | 0.32 | $ | 0.37 | $ | 1.32 | $ | 1.42 | |||||||
Dividends declared per common share | $ | 0.42 | $ | 0.42 | $ | 1.68 | $ | 1.62 | |||||||
Weighted average number of shares of common stock outstanding: | |||||||||||||||
Basic | 54,853,205 | 43,502,583 | 53,087,395 | 43,445,384 | |||||||||||
Diluted | 54,853,205 | 56,264,771 | 53,087,395 | 52,039,997 | |||||||||||
Comprehensive income: | |||||||||||||||
Net income attributable to common stockholders | $ | 17,651 | $ | 16,672 | $ | 70,114 | $ | 62,975 | |||||||
Other comprehensive (loss) income, net of tax: | |||||||||||||||
Unrealized (loss) gain on available-for-sale securities | — | (224 | ) | 224 | (192 | ) | |||||||||
Other comprehensive (loss) income | — | (224 | ) | 224 | (192 | ) | |||||||||
Comprehensive income attributable to common stockholders | $ | 17,651 | $ | 16,448 | $ | 70,338 | $ | 62,783 | |||||||
6
GRANITE POINT MORTGAGE TRUST INC.
RECONCILIATION OF GAAP TO NON-GAAP FINANCIAL INFORMATION
(dollars in thousands, except share data)
Three Months Ended December 31, 2019 | Year Ended December 31, 2019 | |||||
(unaudited) | (unaudited) | |||||
Reconciliation of GAAP net income to Core Earnings: | ||||||
GAAP Net Income | $ | 17,651 | $ | 70,114 | ||
Adjustments for non-core earnings: | ||||||
Non-cash equity compensation | 1,087 | 4,436 | ||||
Core Earnings(1) | $ | 18,738 | $ | 74,550 | ||
Core Earnings per basic common share | $ | 0.34 | $ | 1.40 | ||
Basic weighted average shares outstanding | 54,853,205 | 53,087,395 | ||||
(1) | Core Earnings is a non-U.S. GAAP measure that we define as comprehensive income attributable to common stockholders, excluding “realized and unrealized gains and losses” (impairment losses, realized and unrealized gains or losses on the aggregate portfolio and non-cash compensation expense related to restricted common stock). We believe the presentation of Core Earnings provides investors greater transparency into our period-over-period financial performance and facilitates comparisons to peer REITs. |
7
Fourth Quarter 2019 Earnings Presentation March 3, 2020
Safe Harbor Statement This presentation contains, in addition to historical information, certain forward-looking statements that are based on our current assumptions, expectations and projections about future performance and events. In particular, statements regarding future economic performance, finances and expectations and objectives of management constitute forward-looking statements. Forward-looking statements are not historical in nature and can be identified by words such as "believes," "expects," "may," "will," "should," "seeks," "approximately," "intends," "plans," "estimates," "anticipates," "targets," "goals," "future," "outlook," "potential," "continues," "likely" and other expressions that are predictions of or indicate future events and trends and that do not relate to historical matters. Although the forward-looking statements contained in this presentation are based upon information available at the time the statements are made and reflect the best judgment of our senior management, forward-looking statements inherently involve known and unknown risks, uncertainties and other factors, which may cause the actual results, performance or achievements to differ materially from anticipated future results. Important factors that could cause actual results to differ materially from expected results, including, among other things, those described in our filings with the Securities and Exchange Commission (“SEC”), including our annual report on Form 10-K for the year ended December 31, 2019, and any subsequent Quarterly Reports on Form 10-Q under the caption "Risk Factors." Factors that could cause actual results to differ include, but are not limited to: the general political, economic and competitive conditions in the markets in which we invest; defaults by borrowers in paying debt service on outstanding indebtedness and borrowers' abilities to manage and stabilize properties; our ability to obtain financing arrangements on terms favorable to us or at all; the level and volatility of prevailing interest rates and credit spreads; reductions in the yield on our investments and an increase in the cost of our financing; general volatility of the securities markets in which we participate; the return or impact of current or future investments; allocation of investment opportunities to us by our Manager; increased competition from entities investing in our target investments; effects of hedging instruments on our target investments; changes in governmental regulations, tax law and rates, and similar matters; our ability to maintain our qualification as a REIT for U.S. federal income tax purposes and our exclusion from registration under the Investment Company Act; availability of desirable investment opportunities; availability of qualified personnel and our relationship with our Manager; the time and cost of the process to internalize our management function; estimates relating to our ability to make distributions to our stockholders in the future; hurricanes, earthquakes and other natural disasters, acts of war and/or terrorism, public health crises and other events that may cause unanticipated and uninsured performance declines and/or losses to us or the owners and operators of the real estate securing our investments; deterioration in the performance of the properties securing our investments that may cause deterioration in the performance of our investments and, potentially, principal losses to us; and difficulty or delays in redeploying the proceeds from repayments of our existing investments. These forward-looking statements apply only as of the date of this presentation. We are under no duty to update any of these forward-looking statements after the date of this presentation to conform these statements to actual results or revised expectations. You should, therefore, not rely on these forward-looking statements as predictions of future events. This presentation also contains estimates and other statistical data made by independent parties and by us relating to market size and growth and other data about our industry. This data involves a number of assumptions and limitations, and you are cautioned not to give undue weight to such estimates. In addition, projections, assumptions and estimates of our future performance, and the future performance of the markets in which we operate, are necessarily subject to a high degree of uncertainty and risk. 2
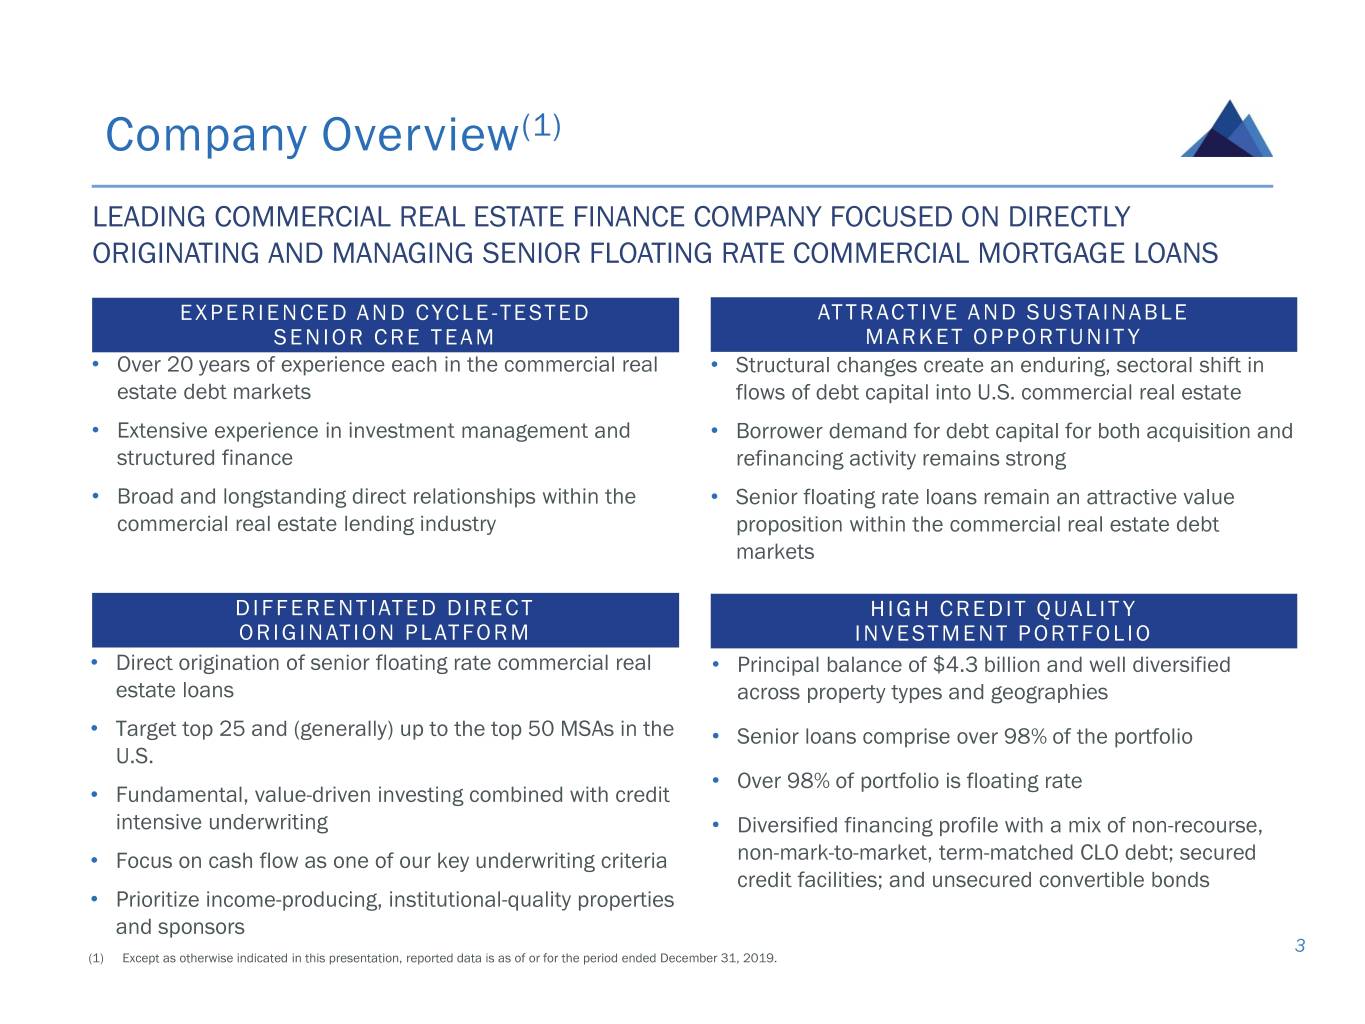
Company Overview(1) LEADING COMMERCIAL REAL ESTATE FINANCE COMPANY FOCUSED ON DIRECTLY ORIGINATING AND MANAGING SENIOR FLOATING RATE COMMERCIAL MORTGAGE LOANS EXPERIENCED AND CYCLE -TE STE D ATTRACTIVE AND SUSTAINABLE SENIOR CRE TEAM MARKET OPPORTUNITY • Over 20 years of experience each in the commercial real • Structural changes create an enduring, sectoral shift in estate debt markets flows of debt capital into U.S. commercial real estate • Extensive experience in investment management and • Borrower demand for debt capital for both acquisition and structured finance refinancing activity remains strong • Broad and longstanding direct relationships within the • Senior floating rate loans remain an attractive value commercial real estate lending industry proposition within the commercial real estate debt markets DIFFERENTIATED DIRECT HIGH CREDIT QUALITY ORIGINATION PLATFORM INVESTMENT PORTFOLIO • Direct origination of senior floating rate commercial real • Principal balance of $4.3 billion and well diversified estate loans across property types and geographies • Target top 25 and (generally) up to the top 50 MSAs in the • Senior loans comprise over 98% of the portfolio U.S. • Over 98% of portfolio is floating rate • Fundamental, value-driven investing combined with credit intensive underwriting • Diversified financing profile with a mix of non-recourse, • Focus on cash flow as one of our key underwriting criteria non-mark-to-market, term-matched CLO debt; secured credit facilities; and unsecured convertible bonds • Prioritize income-producing, institutional-quality properties and sponsors 3 (1) Except as otherwise indicated in this presentation, reported data is as of or for the period ended December 31, 2019.
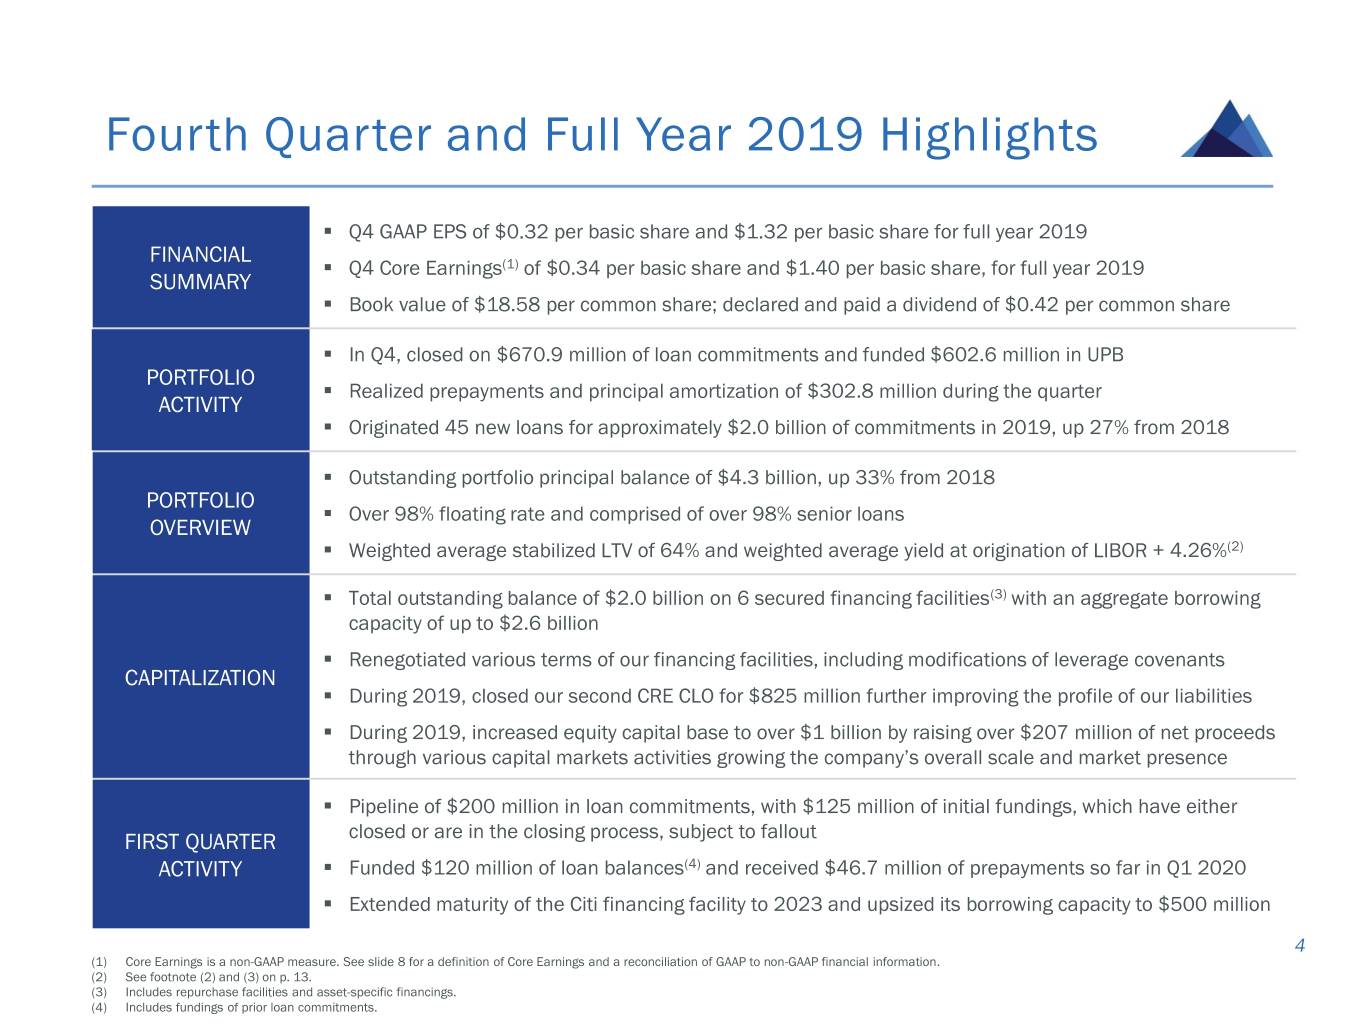
Fourth Quarter and Full Year 2019 Highlights . Q4 GAAP EPS of $0.32 per basic share and $1.32 per basic share for full year 2019 FINANCIAL . Q4 Core Earnings(1) of $0.34 per basic share and $1.40 per basic share, for full year 2019 SUMMARY . Book value of $18.58 per common share; declared and paid a dividend of $0.42 per common share . In Q4, closed on $670.9 million of loan commitments and funded $602.6 million in UPB PORTFOLIO . Realized prepayments and principal amortization of $302.8 million during the quarter ACTIVITY . Originated 45 new loans for approximately $2.0 billion of commitments in 2019, up 27% from 2018 . Outstanding portfolio principal balance of $4.3 billion, up 33% from 2018 PORTFOLIO . Over 98% floating rate and comprised of over 98% senior loans OVERVIEW . Weighted average stabilized LTV of 64% and weighted average yield at origination of LIBOR + 4.26%(2) . Total outstanding balance of $2.0 billion on 6 secured financing facilities(3) with an aggregate borrowing capacity of up to $2.6 billion . Renegotiated various terms of our financing facilities, including modifications of leverage covenants CAPITALIZATION . During 2019, closed our second CRE CLO for $825 million further improving the profile of our liabilities . During 2019, increased equity capital base to over $1 billion by raising over $207 million of net proceeds through various capital markets activities growing the company’s overall scale and market presence . Pipeline of $200 million in loan commitments, with $125 million of initial fundings, which have either FIRST QUARTER closed or are in the closing process, subject to fallout ACTIVITY . Funded $120 million of loan balances(4) and received $46.7 million of prepayments so far in Q1 2020 . Extended maturity of the Citi financing facility to 2023 and upsized its borrowing capacity to $500 million 4 (1) Core Earnings is a non-GAAP measure. See slide 8 for a definition of Core Earnings and a reconciliation of GAAP to non-GAAP financial information. (2) See footnote (2) and (3) on p. 13. (3) Includes repurchase facilities and asset-specific financings. (4) Includes fundings of prior loan commitments.
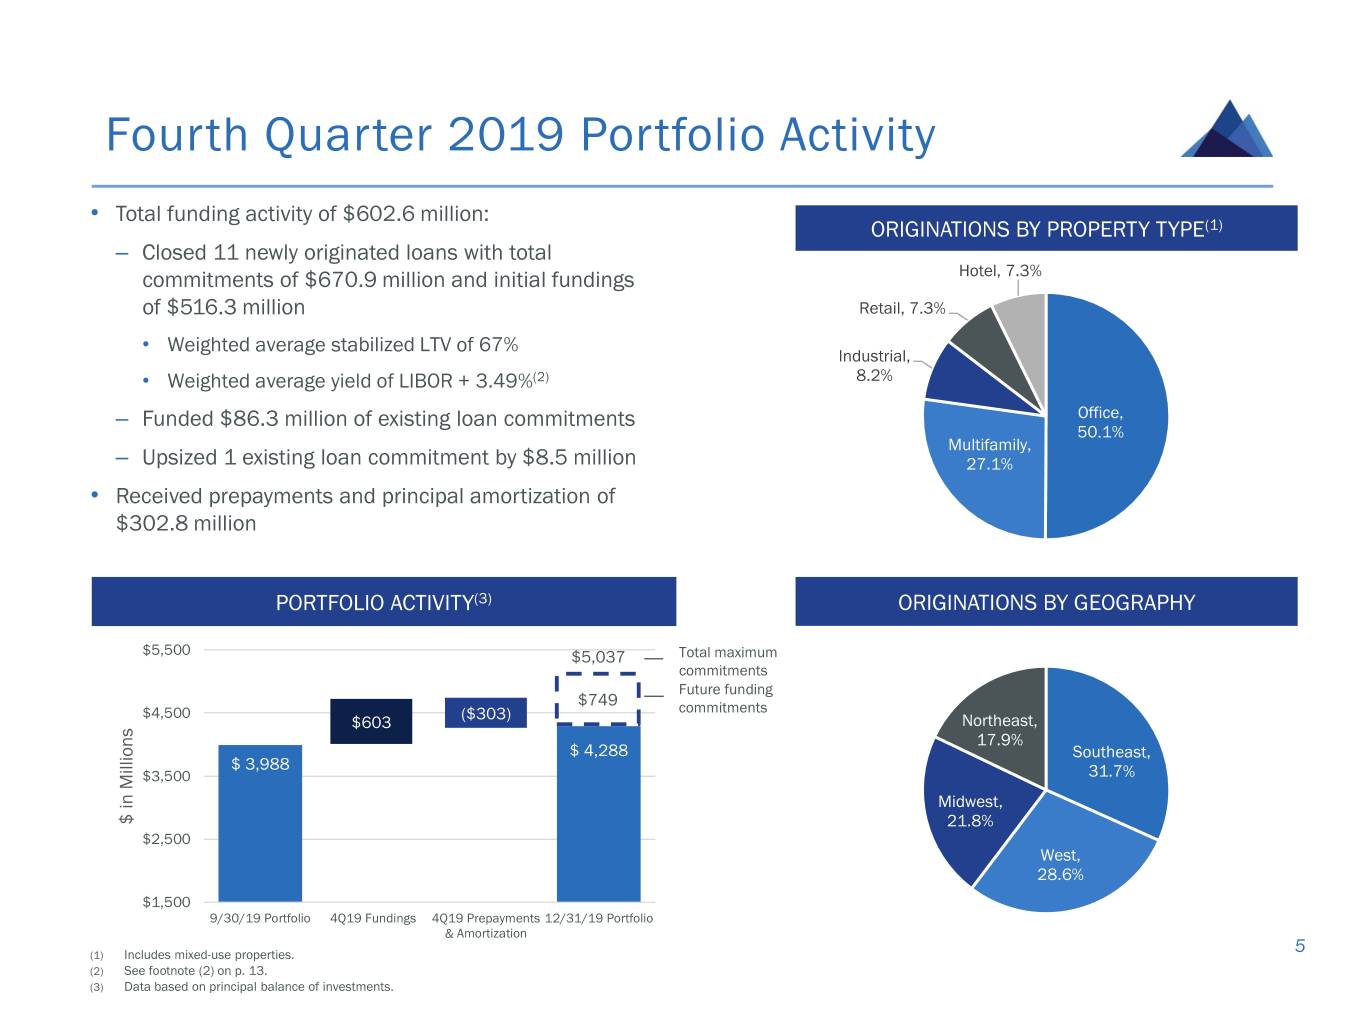
Fourth Quarter 2019 Portfolio Activity • Total funding activity of $602.6 million: ORIGINATIONS BY PROPERTY TYPE(1) – Closed 11 newly originated loans with total commitments of $670.9 million and initial fundings Hotel, 7.3% of $516.3 million Retail, 7.3% • Weighted average stabilized LTV of 67% Industrial, • Weighted average yield of LIBOR + 3.49%(2) 8.2% – Funded $86.3 million of existing loan commitments Office, 50.1% Multifamily, – Upsized 1 existing loan commitment by $8.5 million 27.1% • Received prepayments and principal amortization of $302.8 million PORTFOLIO ACTIVITY(3) ORIGINATIONS BY GEOGRAPHY $5,500 $5,037 Total maximum commitments Future funding $749 $4,500 ($303) commitments $603 Northeast, 17.9% $ 4,288 Southeast, $ 3,988 $3,500 31.7% Midwest, $ in Millions 21.8% $2,500 West, 28.6% $1,500 9/30/19 Portfolio 4Q19 Fundings 4Q19 Prepayments 12/31/19 Portfolio & Amortization 5 (1) Includes mixed-use properties. (2) See footnote (2) on p. 13. (3) Data based on principal balance of investments.
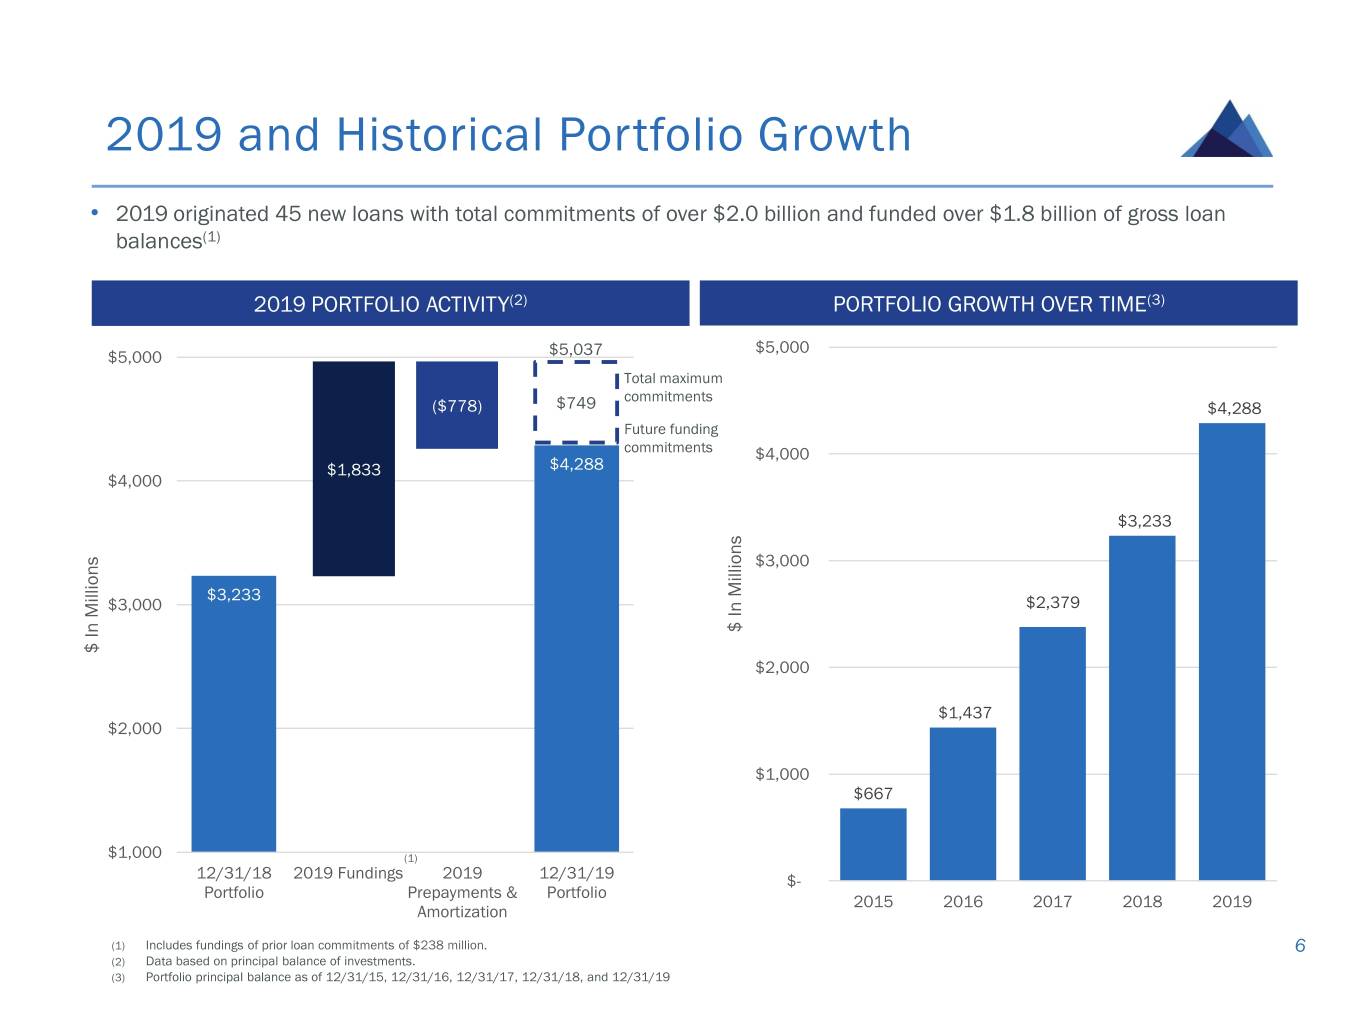
2019 and Historical Portfolio Growth • 2019 originated 45 new loans with total commitments of over $2.0 billion and funded over $1.8 billion of gross loan balances(1) 2019 PORTFOLIO ACTIVITY(2) PORTFOLIO GROWTH OVER TIME(3) $5,000 $5,000 $5,037 Total maximum commitments ($778) $749 $4,288 Future funding commitments $4,000 $1,833 $4,288 $4,000 $3,233 $3,000 $3,233 $3,000 $2,379 $ In Millions $ In Millions $2,000 $1,437 $2,000 $1,000 $667 $1,000 (1) 12/31/18 2019 Fundings 2019 12/31/19 $- Portfolio Prepayments & Portfolio 2015 2016 2017 2018 2019 Amortization (1) Includes fundings of prior loan commitments of $238 million. 6 (2) Data based on principal balance of investments. (3) Portfolio principal balance as of 12/31/15, 12/31/16, 12/31/17, 12/31/18, and 12/31/19
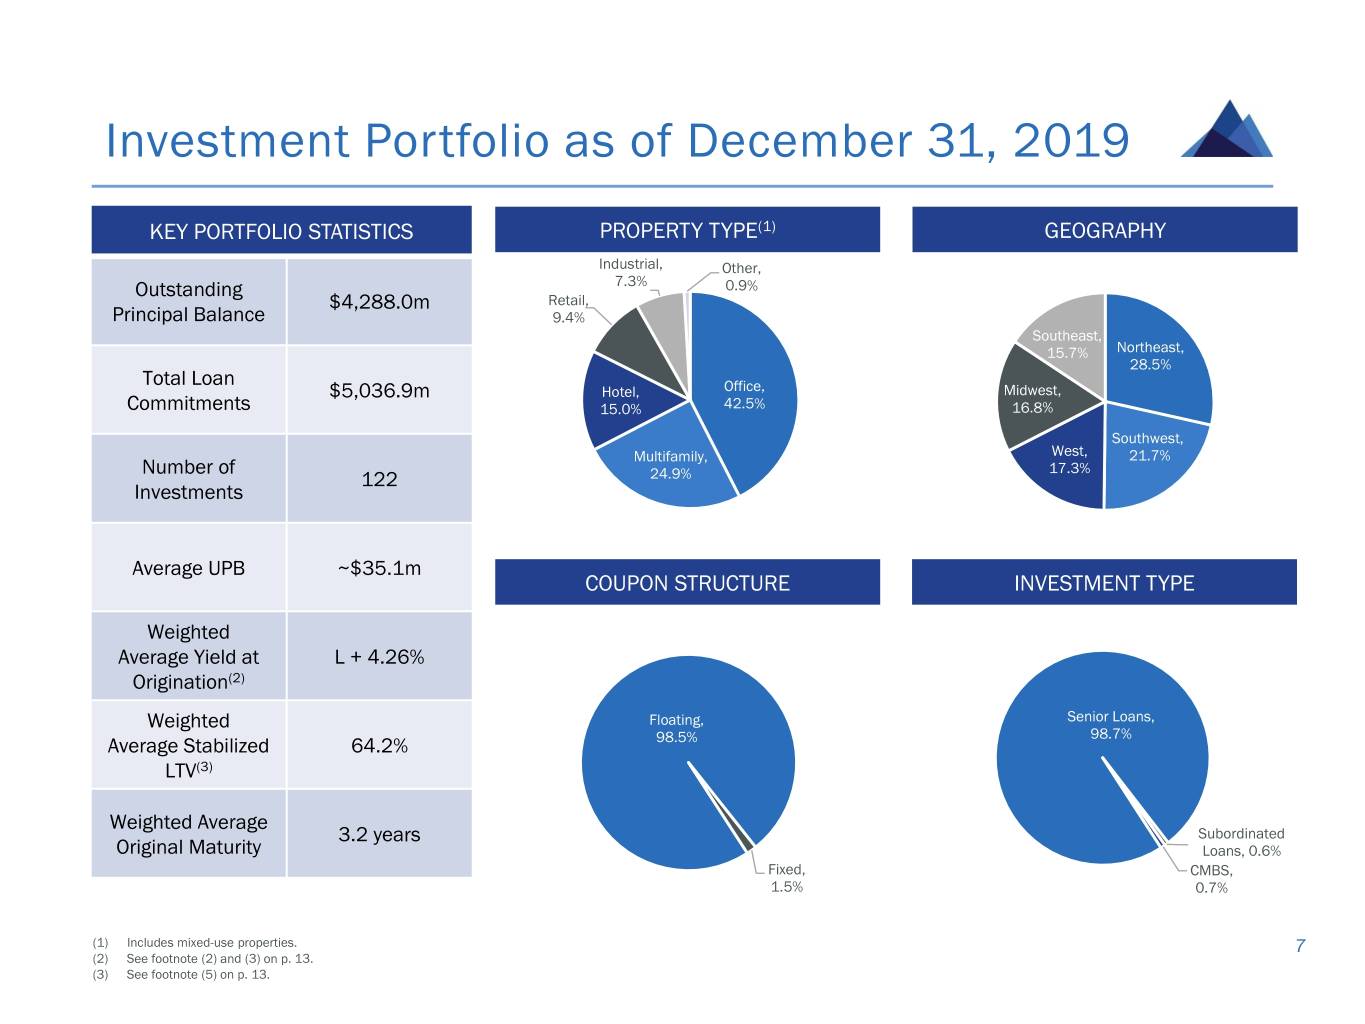
Investment Portfolio as of December 31, 2019 KEY PORTFOLIO STATISTICS PROPERTY TYPE(1) GEOGRAPHY Industrial, Other, Outstanding 7.3% 0.9% $4,288.0m Retail, Principal Balance 9.4% Southeast, 15.7% Northeast, 28.5% Total Loan $5,036.9m Hotel, Office, Midwest, Commitments 15.0% 42.5% 16.8% Southwest, Multifamily, West, 21.7% Number of 17.3% 122 24.9% Investments Average UPB ~$35.1m COUPON STRUCTURE INVESTMENT TYPE Weighted Average Yield at L + 4.26% Origination(2) Weighted Floating, Senior Loans, 98.7% Average Stabilized 64.2% 98.5% LTV(3) Weighted Average 3.2 years Subordinated Original Maturity Loans, 0.6% Fixed, CMBS, 1.5% 0.7% (1) Includes mixed-use properties. 7 (2) See footnote (2) and (3) on p. 13. (3) See footnote (5) on p. 13.
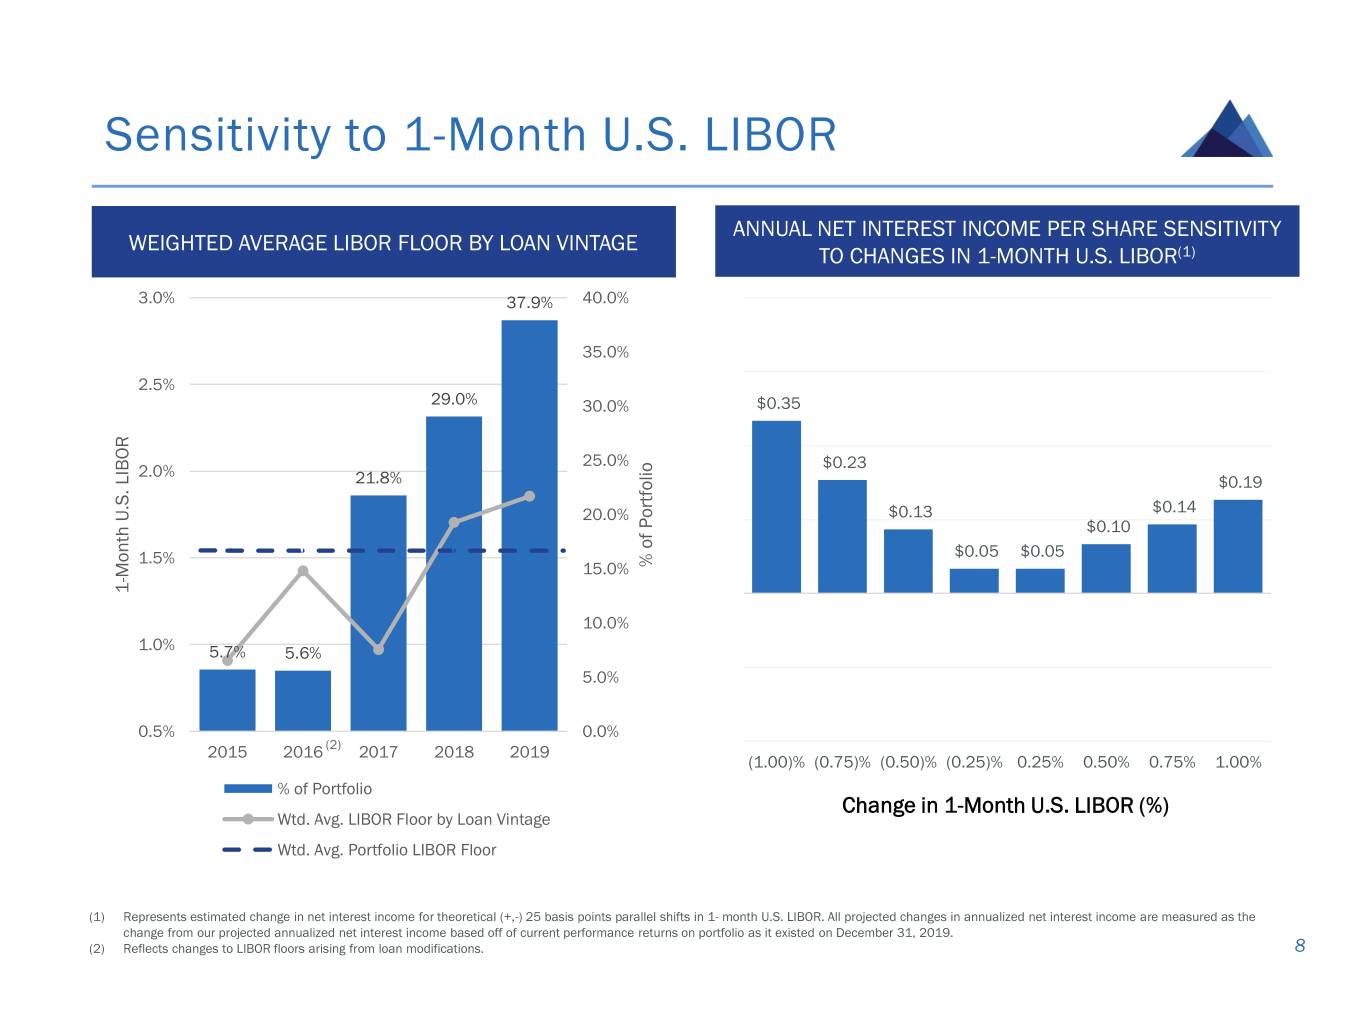
Sensitivity to 1-Month U.S. LIBOR ANNUAL NET INTEREST INCOME PER SHARE SENSITIVITY WEIGHTED AVERAGE LIBOR FLOOR BY LOAN VINTAGE TO CHANGES IN 1-MONTH U.S. LIBOR(1) 3.0% 37.9% 40.0% 35.0% 2.5% 29.0% 30.0% $0.35 25.0% $0.23 2.0% 21.8% $0.19 20.0% $0.13 $0.14 $0.10 1.5% $0.05 $0.05 15.0% % Portfolio of Month Month U.S. LIBOR - 1 10.0% 1.0% 5.7% 5.6% 5.0% 0.5% 0.0% 2015 2016 (2) 2017 2018 2019 (1.00)% (0.75)% (0.50)% (0.25)% 0.25% 0.50% 0.75% 1.00% % of Portfolio Change in 1-Month U.S. LIBOR (%) Wtd. Avg. LIBOR Floor by Loan Vintage Wtd. Avg. Portfolio LIBOR Floor (1) Represents estimated change in net interest income for theoretical (+,-) 25 basis points parallel shifts in 1- month U.S. LIBOR. All projected changes in annualized net interest income are measured as the change from our projected annualized net interest income based off of current performance returns on portfolio as it existed on December 31, 2019. (2) Reflects changes to LIBOR floors arising from loan modifications. 8
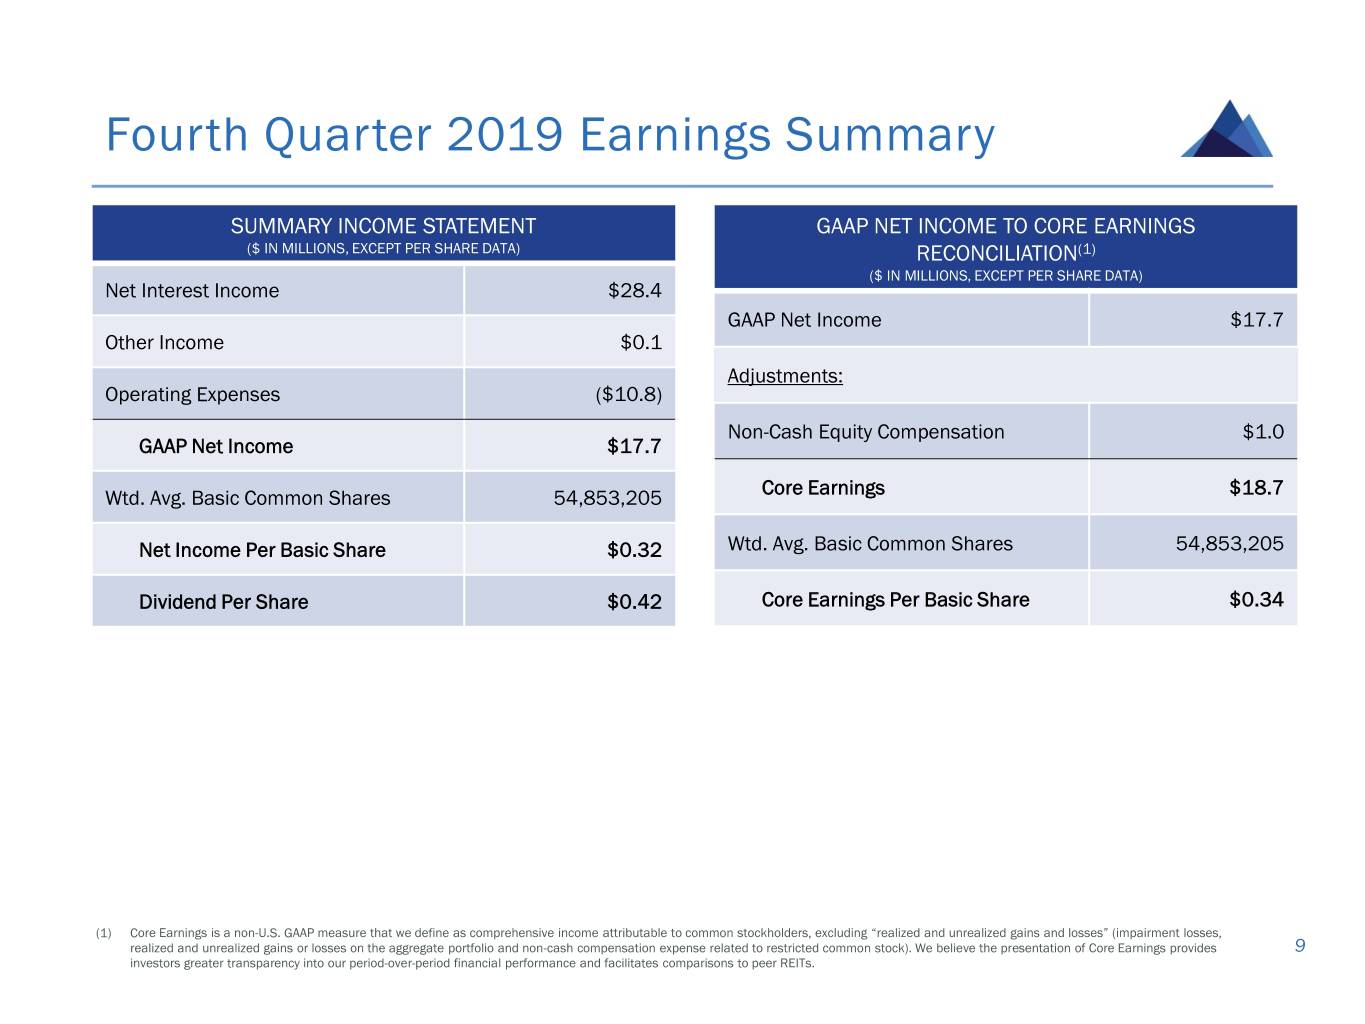
Fourth Quarter 2019 Earnings Summary SUMMARY INCOME STATEMENT GAAP NET INCOME TO CORE EARNINGS ($ IN MILLIONS, EXCEPT PER SHARE DATA) RECONCILIATION(1) ($ IN MILLIONS, EXCEPT PER SHARE DATA) Net Interest Income $28.4 GAAP Net Income $17.7 Other Income $0.1 Adjustments: Operating Expenses ($10.8) Non-Cash Equity Compensation $1.0 GAAP Net Income $17.7 Wtd. Avg. Basic Common Shares 54,853,205 Core Earnings $18.7 Net Income Per Basic Share $0.32 Wtd. Avg. Basic Common Shares 54,853,205 Dividend Per Share $0.42 Core Earnings Per Basic Share $0.34 (1) Core Earnings is a non-U.S. GAAP measure that we define as comprehensive income attributable to common stockholders, excluding “realized and unrealized gains and losses” (impairment losses, realized and unrealized gains or losses on the aggregate portfolio and non-cash compensation expense related to restricted common stock). We believe the presentation of Core Earnings provides 9 investors greater transparency into our period-over-period financial performance and facilitates comparisons to peer REITs.
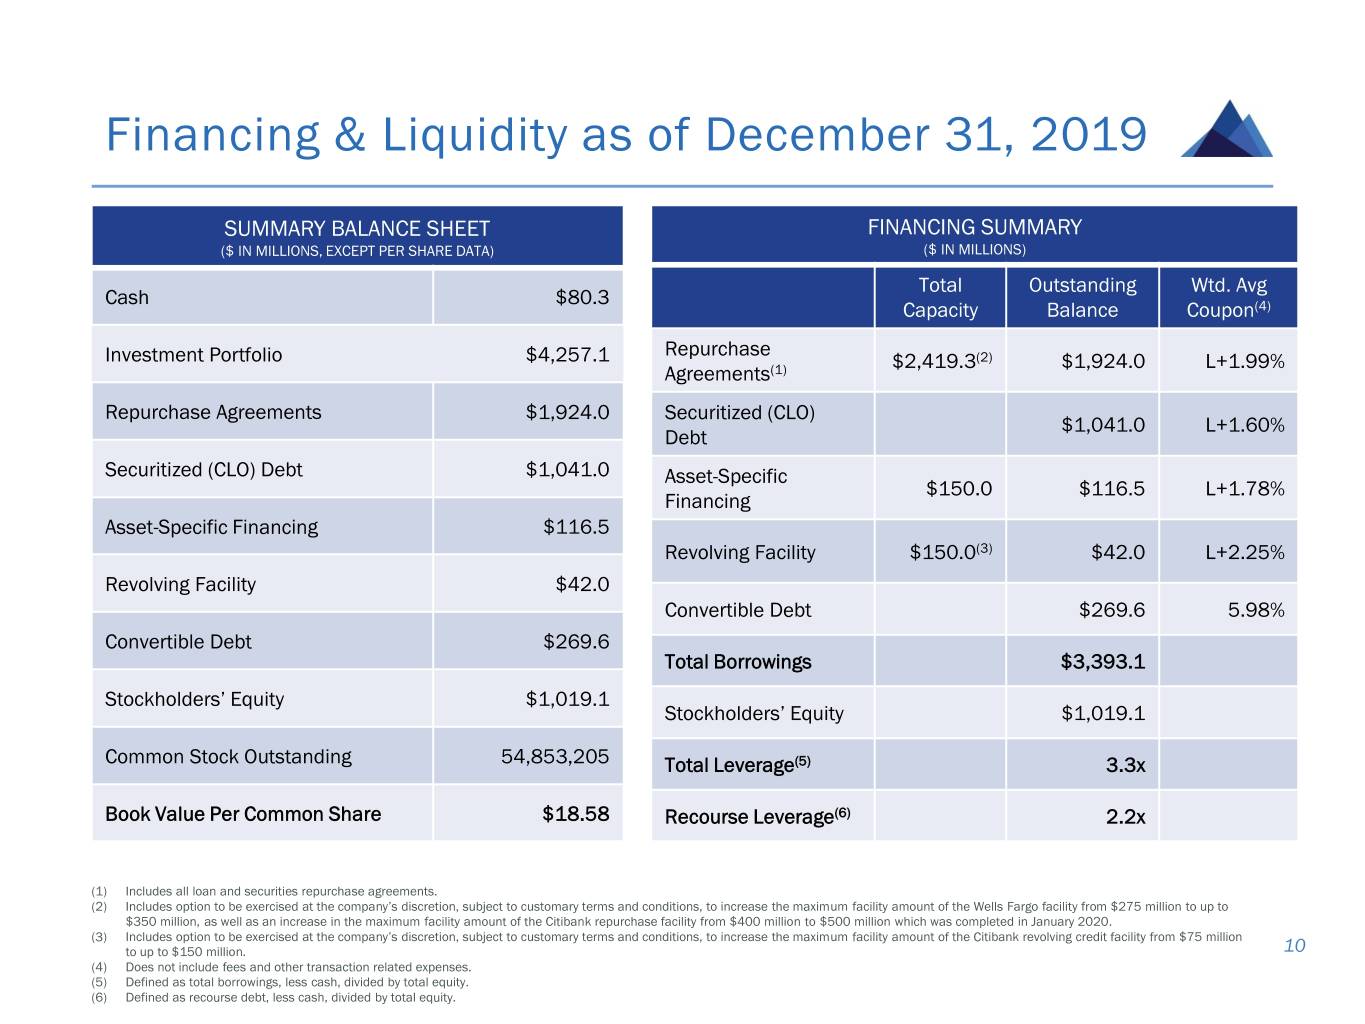
Financing & Liquidity as of December 31, 2019 SUMMARY BALANCE SHEET FINANCING SUMMARY ($ IN MILLIONS, EXCEPT PER SHARE DATA) ($ IN MILLIONS) Total Outstanding Wtd. Avg Cash $80.3 Capacity Balance Coupon(4) Repurchase Investment Portfolio $4,257.1 $2,419.3(2) $1,924.0 L+1.99% Agreements(1) Repurchase Agreements $1,924.0 Securitized (CLO) $1,041.0 L+1.60% Debt Securitized (CLO) Debt $1,041.0 Asset-Specific $150.0 $116.5 L+1.78% Financing Asset-Specific Financing $116.5 Revolving Facility $150.0(3) $42.0 L+2.25% Revolving Facility $42.0 Convertible Debt $269.6 5.98% Convertible Debt $269.6 Total Borrowings $3,393.1 Stockholders’ Equity $1,019.1 Stockholders’ Equity $1,019.1 Common Stock Outstanding 54,853,205 Total Leverage(5) 3.3x Book Value Per Common Share $18.58 Recourse Leverage(6) 2.2x (1) Includes all loan and securities repurchase agreements. (2) Includes option to be exercised at the company’s discretion, subject to customary terms and conditions, to increase the maximum facility amount of the Wells Fargo facility from $275 million to up to $350 million, as well as an increase in the maximum facility amount of the Citibank repurchase facility from $400 million to $500 million which was completed in January 2020. (3) Includes option to be exercised at the company’s discretion, subject to customary terms and conditions, to increase the maximum facility amount of the Citibank revolving credit facility from $75 million to up to $150 million. 10 (4) Does not include fees and other transaction related expenses. (5) Defined as total borrowings, less cash, divided by total equity. (6) Defined as recourse debt, less cash, divided by total equity.

Appendix
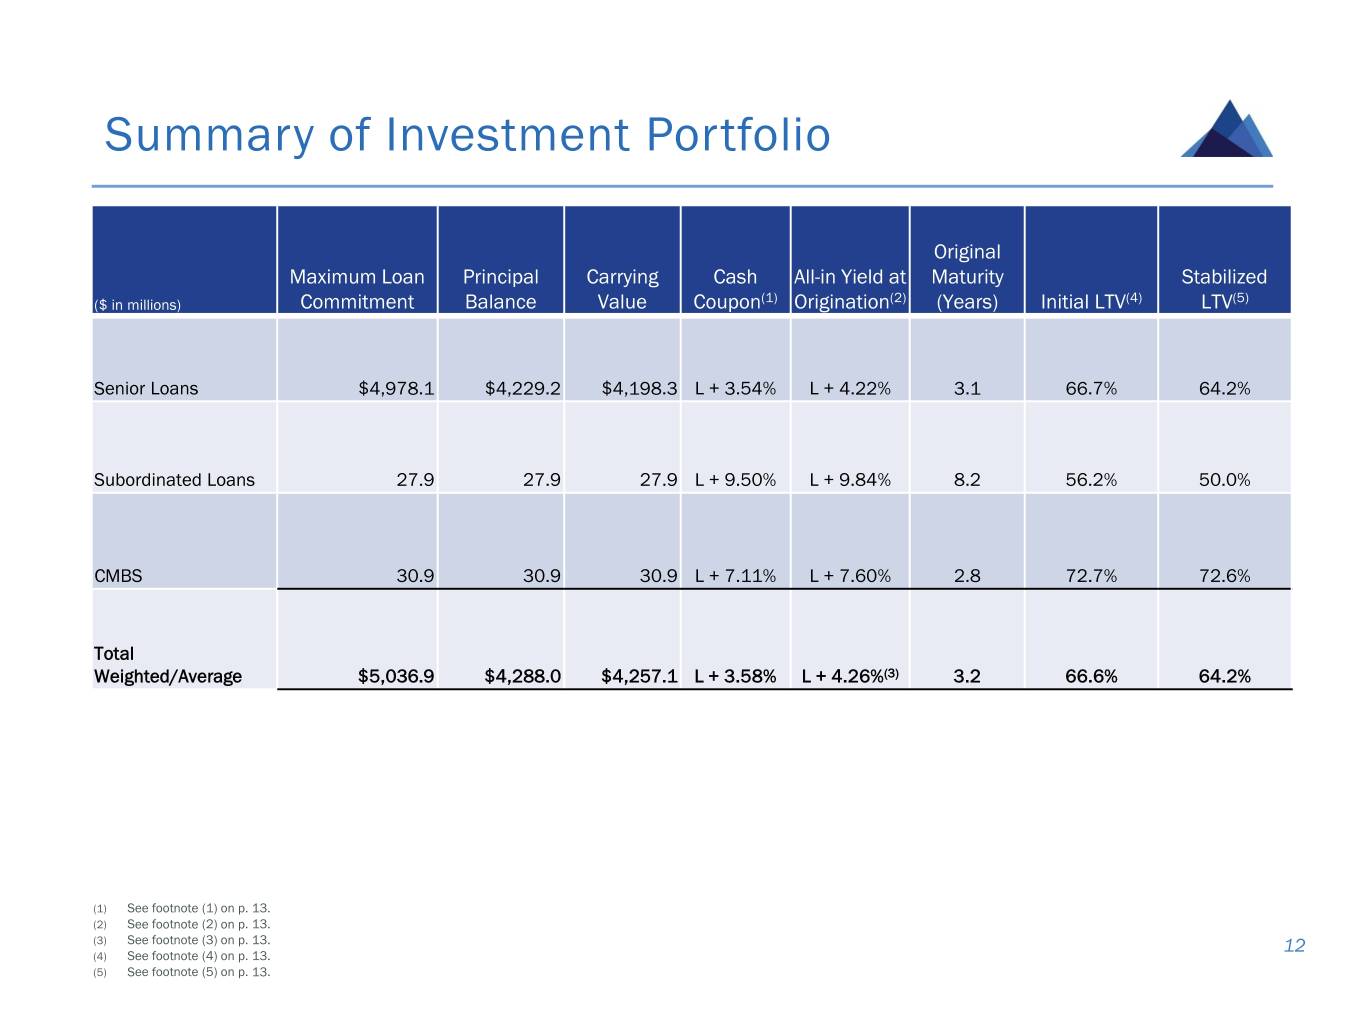
Summary of Investment Portfolio Original Maximum Loan Principal Carrying Cash All-in Yield at Maturity Stabilized ($ in millions) Commitment Balance Value Coupon(1) Origination(2) (Years) Initial LTV(4) LTV(5) Senior Loans $4,978.1 $4,229.2 $4,198.3 L + 3.54% L + 4.22% 3.1 66.7% 64.2% Subordinated Loans 27.9 27.9 27.9 L + 9.50% L + 9.84% 8.2 56.2% 50.0% CMBS 30.9 30.9 30.9 L + 7.11% L + 7.60% 2.8 72.7% 72.6% Total Weighted/Average $5,036.9 $4,288.0 $4,257.1 L + 3.58% L + 4.26%(3) 3.2 66.6% 64.2% (1) See footnote (1) on p. 13. (2) See footnote (2) on p. 13. (3) See footnote (3) on p. 13. 12 (4) See footnote (4) on p. 13. (5) See footnote (5) on p. 13.
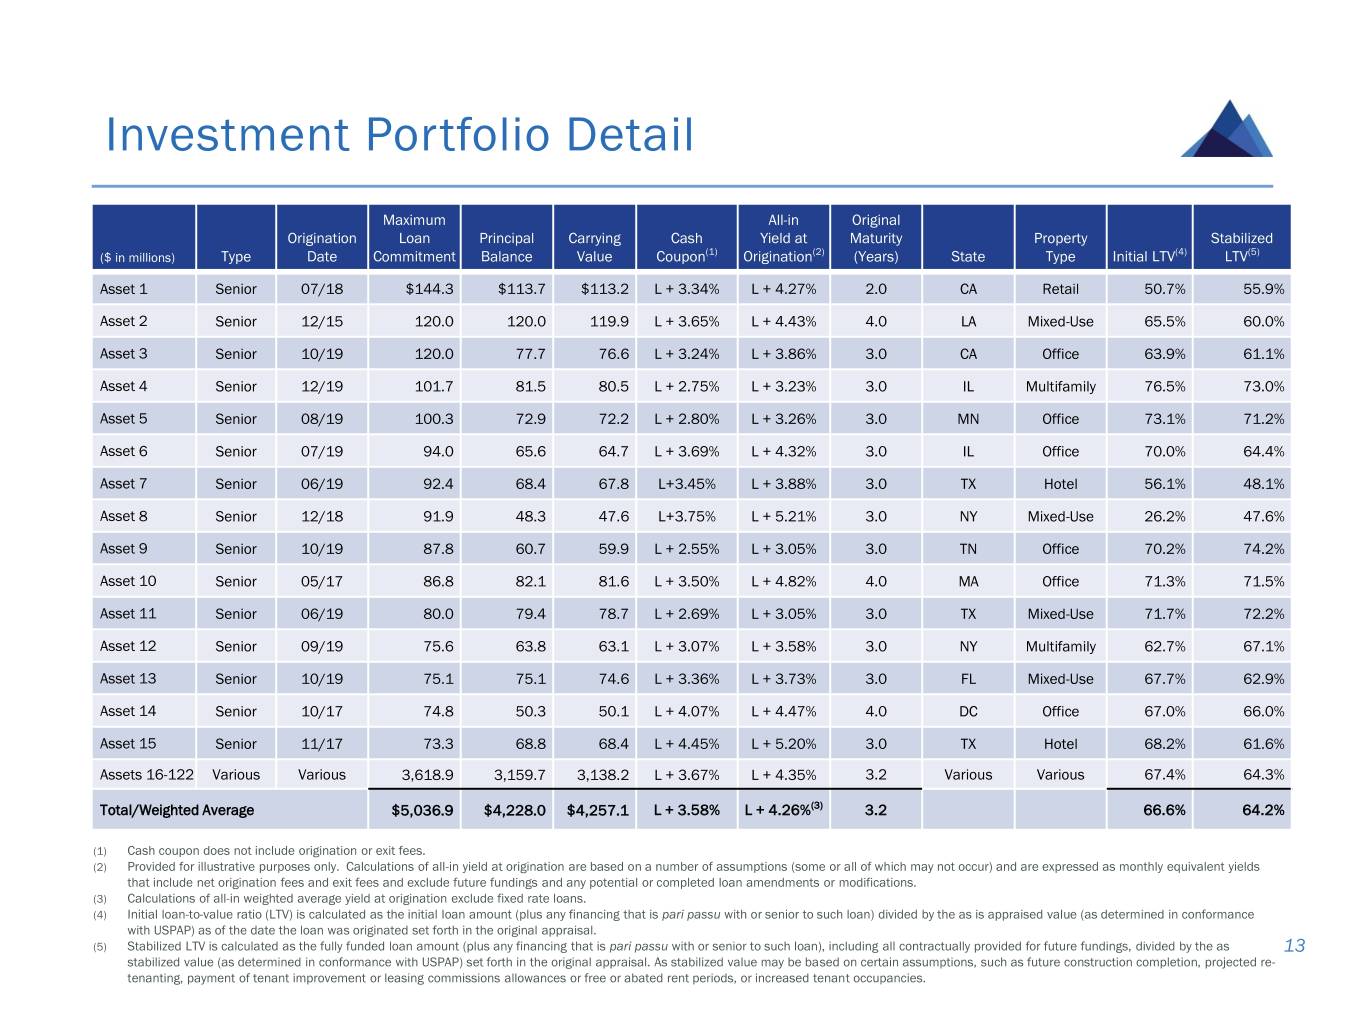
Investment Portfolio Detail Maximum All-in Original Origination Loan Principal Carrying Cash Yield at Maturity Property Stabilized ($ in millions) Type Date Commitment Balance Value Coupon(1) Origination(2) (Years) State Type Initial LTV(4) LTV(5) Asset 1 Senior 07/18 $144.3 $113.7 $113.2 L + 3.34% L + 4.27% 2.0 CA Retail 50.7% 55.9% Asset 2 Senior 12/15 120.0 120.0 119.9 L + 3.65% L + 4.43% 4.0 LA Mixed-Use 65.5% 60.0% Asset 3 Senior 10/19 120.0 77.7 76.6 L + 3.24% L + 3.86% 3.0 CA Office 63.9% 61.1% Asset 4 Senior 12/19 101.7 81.5 80.5 L + 2.75% L + 3.23% 3.0 IL Multifamily 76.5% 73.0% Asset 5 Senior 08/19 100.3 72.9 72.2 L + 2.80% L + 3.26% 3.0 MN Office 73.1% 71.2% Asset 6 Senior 07/19 94.0 65.6 64.7 L + 3.69% L + 4.32% 3.0 IL Office 70.0% 64.4% Asset 7 Senior 06/19 92.4 68.4 67.8 L+3.45% L + 3.88% 3.0 TX Hotel 56.1% 48.1% Asset 8 Senior 12/18 91.9 48.3 47.6 L+3.75% L + 5.21% 3.0 NY Mixed-Use 26.2% 47.6% Asset 9 Senior 10/19 87.8 60.7 59.9 L + 2.55% L + 3.05% 3.0 TN Office 70.2% 74.2% Asset 10 Senior 05/17 86.8 82.1 81.6 L + 3.50% L + 4.82% 4.0 MA Office 71.3% 71.5% Asset 11 Senior 06/19 80.0 79.4 78.7 L + 2.69% L + 3.05% 3.0 TX Mixed-Use 71.7% 72.2% Asset 12 Senior 09/19 75.6 63.8 63.1 L + 3.07% L + 3.58% 3.0 NY Multifamily 62.7% 67.1% Asset 13 Senior 10/19 75.1 75.1 74.6 L + 3.36% L + 3.73% 3.0 FL Mixed-Use 67.7% 62.9% Asset 14 Senior 10/17 74.8 50.3 50.1 L + 4.07% L + 4.47% 4.0 DC Office 67.0% 66.0% Asset 15 Senior 11/17 73.3 68.8 68.4 L + 4.45% L + 5.20% 3.0 TX Hotel 68.2% 61.6% Assets 16-122 Various Various 3,618.9 3,159.7 3,138.2 L + 3.67% L + 4.35% 3.2 Various Various 67.4% 64.3% Total/Weighted Average $5,036.9 $4,228.0 $4,257.1 L + 3.58% L + 4.26%(3) 3.2 66.6% 64.2% (1) Cash coupon does not include origination or exit fees. (2) Provided for illustrative purposes only. Calculations of all-in yield at origination are based on a number of assumptions (some or all of which may not occur) and are expressed as monthly equivalent yields that include net origination fees and exit fees and exclude future fundings and any potential or completed loan amendments or modifications. (3) Calculations of all-in weighted average yield at origination exclude fixed rate loans. (4) Initial loan-to-value ratio (LTV) is calculated as the initial loan amount (plus any financing that is pari passu with or senior to such loan) divided by the as is appraised value (as determined in conformance with USPAP) as of the date the loan was originated set forth in the original appraisal. (5) Stabilized LTV is calculated as the fully funded loan amount (plus any financing that is pari passu with or senior to such loan), including all contractually provided for future fundings, divided by the as 13 stabilized value (as determined in conformance with USPAP) set forth in the original appraisal. As stabilized value may be based on certain assumptions, such as future construction completion, projected re- tenanting, payment of tenant improvement or leasing commissions allowances or free or abated rent periods, or increased tenant occupancies.
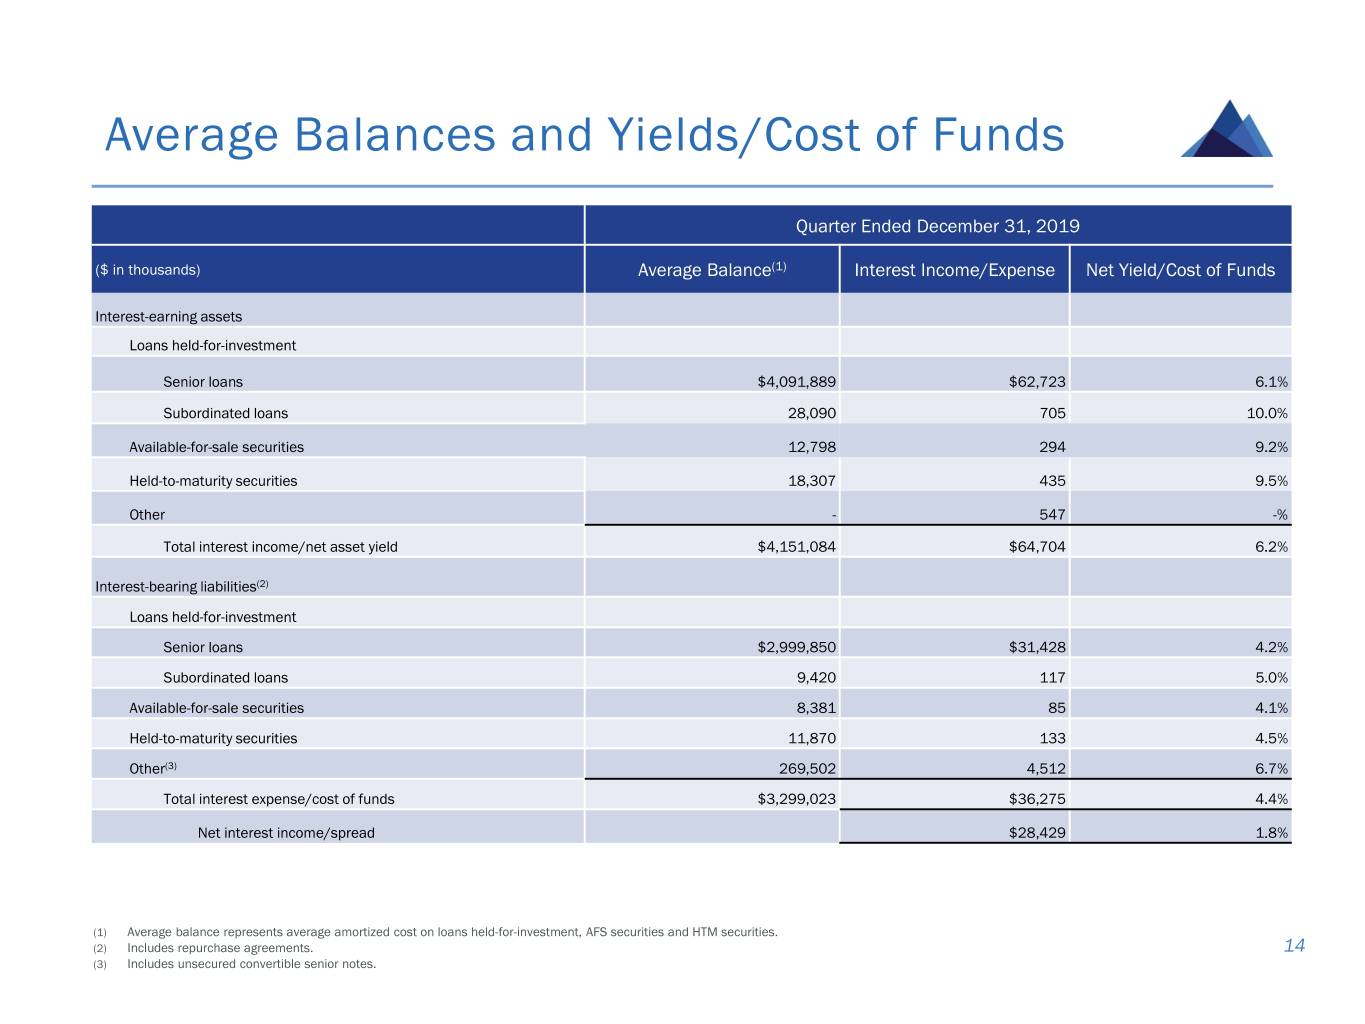
Average Balances and Yields/Cost of Funds Quarter Ended December 31, 2019 ($ in thousands) Average Balance(1) Interest Income/Expense Net Yield/Cost of Funds Interest-earning assets Loans held-for-investment Senior loans $4,091,889 $62,723 6.1% Subordinated loans 28,090 705 10.0% Available-for-sale securities 12,798 294 9.2% Held-to-maturity securities 18,307 435 9.5% Other - 547 -% Total interest income/net asset yield $4,151,084 $64,704 6.2% Interest-bearing liabilities(2) Loans held-for-investment Senior loans $2,999,850 $31,428 4.2% Subordinated loans 9,420 117 5.0% Available-for-sale securities 8,381 85 4.1% Held-to-maturity securities 11,870 133 4.5% Other(3) 269,502 4,512 6.7% Total interest expense/cost of funds $3,299,023 $36,275 4.4% Net interest income/spread $28,429 1.8% (1) Average balance represents average amortized cost on loans held-for-investment, AFS securities and HTM securities. (2) Includes repurchase agreements. 14 (3) Includes unsecured convertible senior notes.
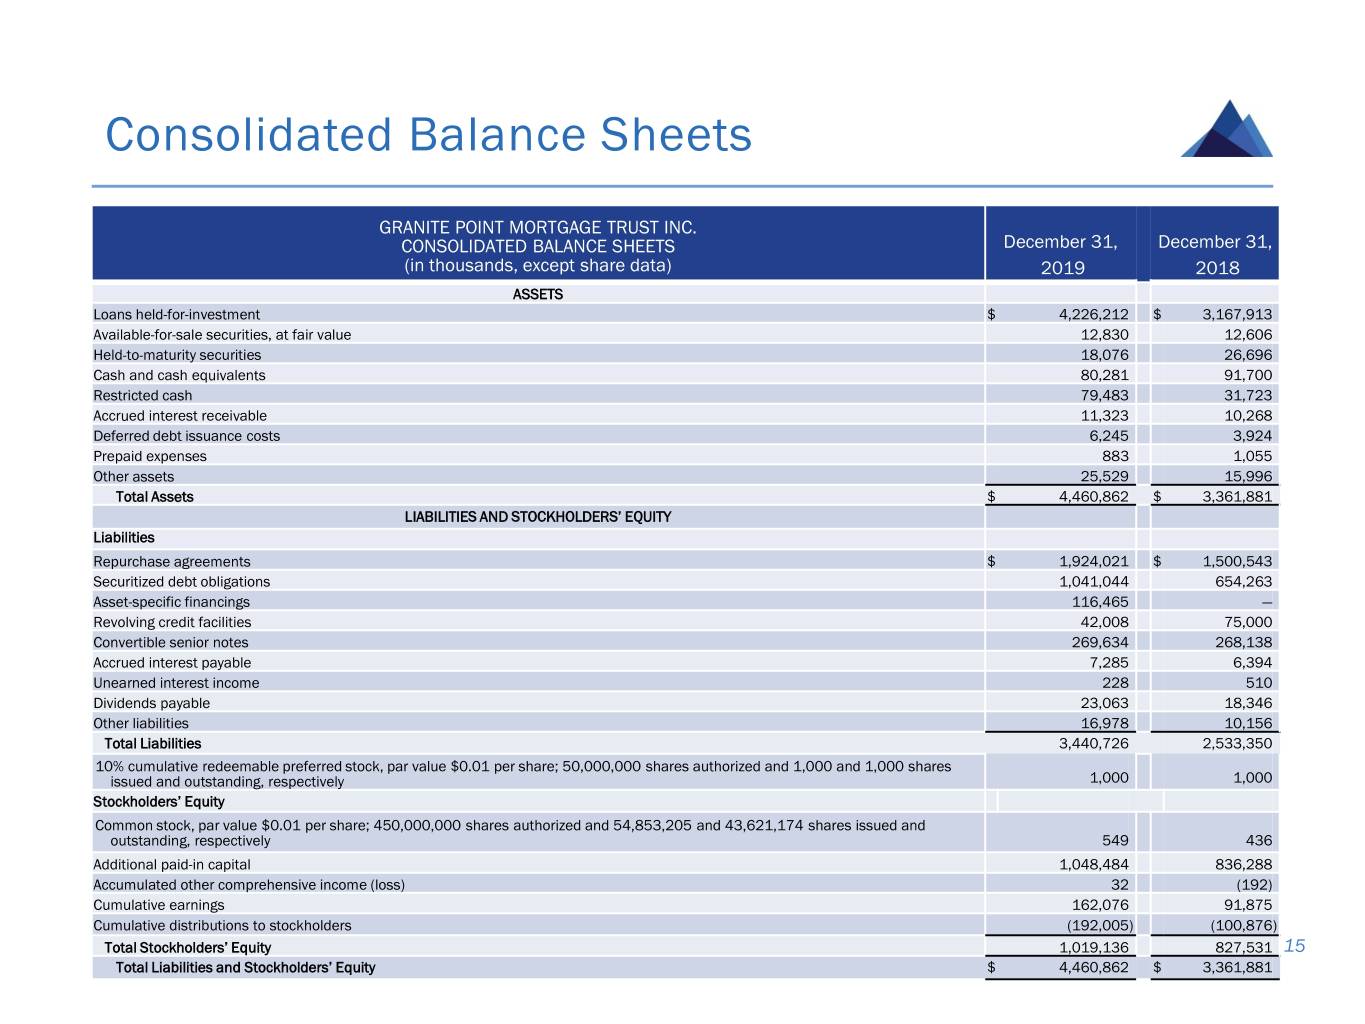
Consolidated Balance Sheets GRANITE POINT MORTGAGE TRUST INC. CONSOLIDATED BALANCE SHEETS December 31, December 31, (in thousands, except share data) 2019 2018 ASSETS Loans held-for-investment $ 4,226,212 $ 3,167,913 Available-for-sale securities, at fair value 12,830 12,606 Held-to-maturity securities 18,076 26,696 Cash and cash equivalents 80,281 91,700 Restricted cash 79,483 31,723 Accrued interest receivable 11,323 10,268 Deferred debt issuance costs 6,245 3,924 Prepaid expenses 883 1,055 Other assets 25,529 15,996 Total Assets $ 4,460,862 $ 3,361,881 LIABILITIES AND STOCKHOLDERS’ EQUITY Liabilities Repurchase agreements $ 1,924,021 $ 1,500,543 Securitized debt obligations 1,041,044 654,263 Asset-specific financings 116,465 — Revolving credit facilities 42,008 75,000 Convertible senior notes 269,634 268,138 Accrued interest payable 7,285 6,394 Unearned interest income 228 510 Dividends payable 23,063 18,346 Other liabilities 16,978 10,156 Total Liabilities 3,440,726 2,533,350 10% cumulative redeemable preferred stock, par value $0.01 per share; 50,000,000 shares authorized and 1,000 and 1,000 shares issued and outstanding, respectively 1,000 1,000 Stockholders’ Equity Common stock, par value $0.01 per share; 450,000,000 shares authorized and 54,853,205 and 43,621,174 shares issued and outstanding, respectively 549 436 Additional paid-in capital 1,048,484 836,288 Accumulated other comprehensive income (loss) 32 (192) Cumulative earnings 162,076 91,875 Cumulative distributions to stockholders (192,005) (100,876) Total Stockholders’ Equity 1,019,136 827,531 15 Total Liabilities and Stockholders’ Equity $ 4,460,862 $ 3,361,881
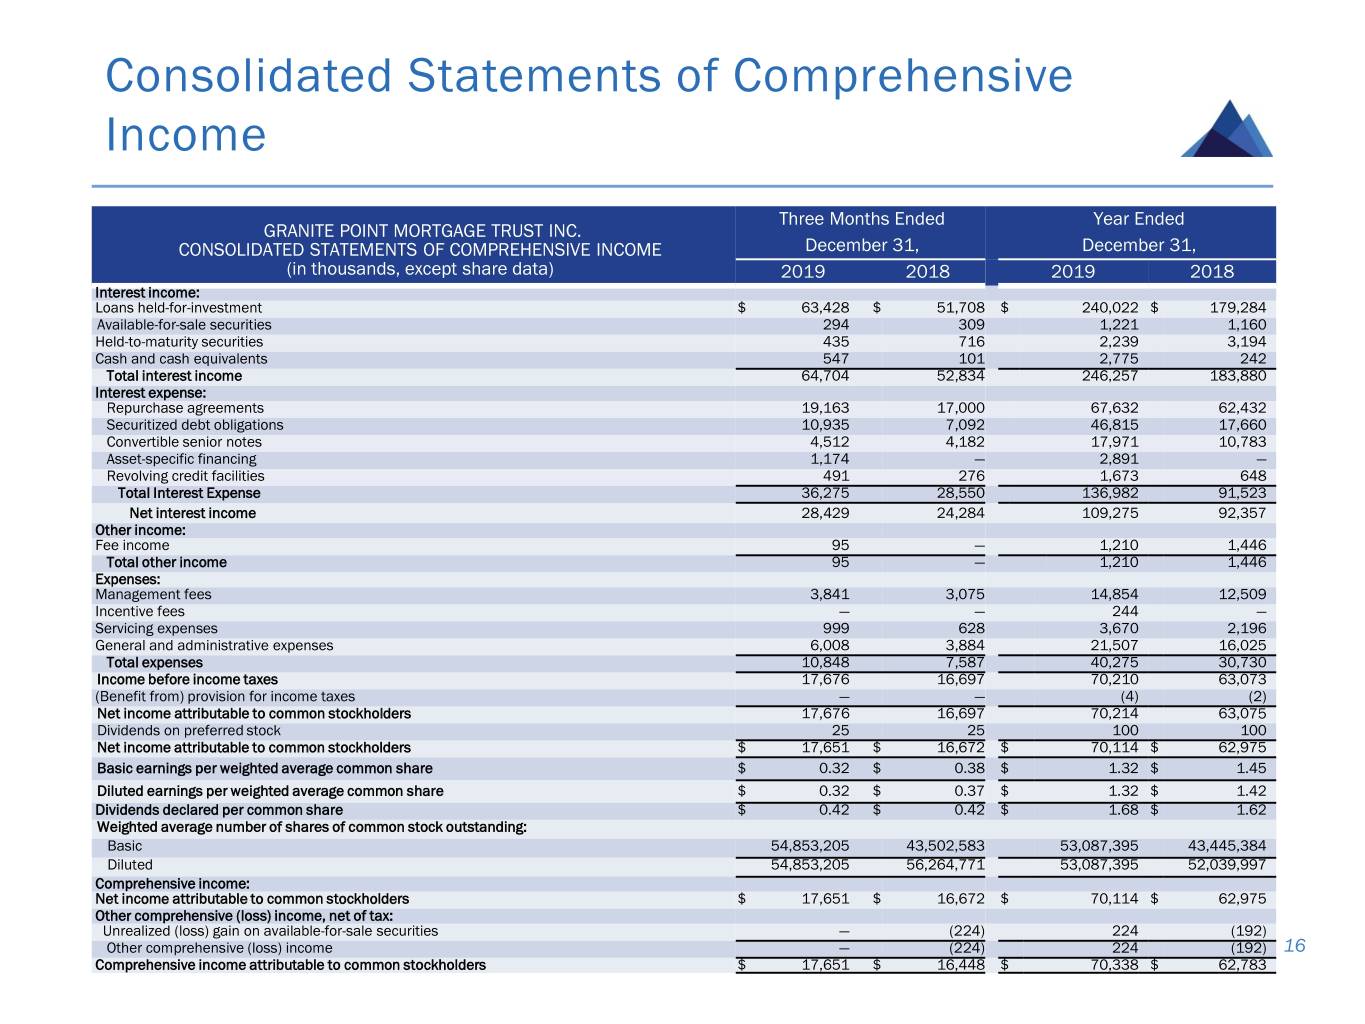
Consolidated Statements of Comprehensive Income Three Months Ended Year Ended GRANITE POINT MORTGAGE TRUST INC. CONSOLIDATED STATEMENTS OF COMPREHENSIVE INCOME December 31, December 31, (in thousands, except share data) 2019 2018 2019 2018 Interest income: Loans held-for-investment $ 63,428 $ 51,708 $ 240,022 $ 179,284 Available-for-sale securities 294 309 1,221 1,160 Held-to-maturity securities 435 716 2,239 3,194 Cash and cash equivalents 547 101 2,775 242 Total interest income 64,704 52,834 246,257 183,880 Interest expense: Repurchase agreements 19,163 17,000 67,632 62,432 Securitized debt obligations 10,935 7,092 46,815 17,660 Convertible senior notes 4,512 4,182 17,971 10,783 Asset-specific financing 1,174 — 2,891 — Revolving credit facilities 491 276 1,673 648 Total Interest Expense 36,275 28,550 136,982 91,523 Net interest income 28,429 24,284 109,275 92,357 Other income: Fee income 95 — 1,210 1,446 Total other income 95 — 1,210 1,446 Expenses: Management fees 3,841 3,075 14,854 12,509 Incentive fees — — 244 — Servicing expenses 999 628 3,670 2,196 General and administrative expenses 6,008 3,884 21,507 16,025 Total expenses 10,848 7,587 40,275 30,730 Income before income taxes 17,676 16,697 70,210 63,073 (Benefit from) provision for income taxes — — (4) (2) Net income attributable to common stockholders 17,676 16,697 70,214 63,075 Dividends on preferred stock 25 25 100 100 Net income attributable to common stockholders $ 17,651 $ 16,672 $ 70,114 $ 62,975 Basic earnings per weighted average common share $ 0.32 $ 0.38 $ 1.32 $ 1.45 Diluted earnings per weighted average common share $ 0.32 $ 0.37 $ 1.32 $ 1.42 Dividends declared per common share $ 0.42 $ 0.42 $ 1.68 $ 1.62 Weighted average number of shares of common stock outstanding: Basic 54,853,205 43,502,583 53,087,395 43,445,384 Diluted 54,853,205 56,264,771 53,087,395 52,039,997 Comprehensive income: Net income attributable to common stockholders $ 17,651 $ 16,672 $ 70,114 $ 62,975 Other comprehensive (loss) income, net of tax: Unrealized (loss) gain on available-for-sale securities — (224) 224 (192) Other comprehensive (loss) income — (224) 224 (192) 16 Comprehensive income attributable to common stockholders $ 17,651 $ 16,448 $ 70,338 $ 62,783