
GS 8-K
Goldman Sachs Group Inc (GS)
UNITED STATES SECURITIES AND EXCHANGE COMMISSION
Washington, D.C. 20549
FORM
CURRENT REPORT
Pursuant to Section 13 or 15(d) of the Securities Exchange Act of 1934
Date of Report (Date of earliest event reported):
(Exact name of registrant as specified in its charter)
| |
No. |
No. | ||
| (State or other jurisdiction of incorporation) |
(Commission File Number) |
(IRS Employer Identification No.) |
| |
| |
| (Address of principal executive offices) |
(Zip Code) |
Registrant’s telephone number, including area code:
N/A
(Former name or former address, if changed since last report.)
Check the appropriate box below if the Form 8-K filing is intended to simultaneously satisfy the filing obligation of the registrant under any of the following provisions:
| |
Written communications pursuant to Rule 425 under the Securities Act (17 CFR 230.425) |
| |
Soliciting material pursuant to Rule 14a-12 under the Exchange Act (17 CFR 240.14a-12) |
| |
Pre-commencement communications pursuant to Rule 14d-2(b) under the Exchange Act (17 CFR 240.14d-2(b)) |
| |
Pre-commencement communications pursuant to Rule 13e-4(c) under the Exchange Act (17 CFR 240.13e-4(c)) |
Securities registered pursuant to Section 12(b) of the Act:
| Title of each class |
Trading |
Exchange on which registered | ||
| |
|
| ||
| |
|
| ||
| |
|
| ||
| |
|
| ||
| |
|
| ||
| |
|
| ||
| |
|
| ||
| |
|
| ||
| |
|
| ||
| |
|
| ||
| |
|
| ||
| |
|
| ||
Indicate by check mark whether the registrant is an emerging growth company as defined in Rule 405 under the Securities Act (17 CFR 230.405) or Rule 12b-2 under the Exchange Act (17 CFR 240.12b-2).
Emerging growth company
If an emerging growth company, indicate by check mark if the registrant has elected not to use the extended transition period for complying with any new or revised financial accounting standards provided pursuant to Section 13(a) of the Exchange Act. ☐
TABLE OF CONTENTS
Item 2.02 Results of Operations and Financial Condition.
On April 15, 2020, The Goldman Sachs Group, Inc. (Group Inc. and, together with its consolidated subsidiaries, the firm) reported its earnings for the first quarter ended March 31, 2020. A copy of Group Inc.’s press release containing this information is attached as Exhibit 99.1 to this Report on Form 8-K and is incorporated herein by reference.
Item 7.01 Regulation FD Disclosure.
On April 15, 2020, at 9:30 a.m. (ET), the firm will hold a conference call to discuss the firm’s financial results, outlook and related matters. A copy of the presentation for the conference call is attached as Exhibit 99.2 to this Report on Form 8-K.
Item 8.01 Other Events.
Impact of COVID-19
The emergence of the Coronavirus Disease 2019 (COVID-19) pandemic has created economic and financial disruptions that during the quarter adversely affected, and are likely to continue to adversely affect, the firm’s business, financial condition, liquidity and results of operations. The extent to which the COVID-19 pandemic will continue to negatively affect the firm’s businesses, financial condition, liquidity and results of operations will depend on future developments, which are highly uncertain and cannot be predicted, including the scope and duration of the pandemic, the continued effectiveness of the firm’s business continuity plan (including work-from-home arrangements and staffing in operational facilities), the direct and indirect impact of the pandemic on the firm’s employees, clients, counterparties and service providers, as well as other market participants, and actions taken by governmental authorities and other third parties in response to the pandemic.
The significant reduction in the valuation of the equity, fixed-income and commodity markets and the significant increase in the volatility of those markets have required the firm to commit more capital to its market-making businesses. The effects of the COVID-19 pandemic on economic and market conditions have also increased demands on the firm’s liquidity as it meets client needs. All of these developments have impacted the firm’s liquidity, regulatory capital and leverage ratios. The firm has ceased purchases of its common stock in order to deploy more capital and liquidity to meet the needs of its clients. The effects of the COVID-19 pandemic may cause the firm to continue to limit future capital distributions.
The length of the pandemic and the efficacy of the extraordinary measures being put in place to address it are unknown. Until the pandemic subsides, the firm expects continued draws on lines of credit, reduced levels in certain of its investment banking activities, reduced revenues in its asset management and wealth management businesses and increased client defaults, including defaults in unsecured loans.
Item 9.01 Financial Statements and Exhibits.
(d) Exhibits.
| 99.1 | Press release of Group Inc. dated April 15, 2020 containing financial information for its first quarter ended March 31, 2020. |
The quotation on page 1 of Exhibit 99.1 and the information under the caption “Highlights” on the following page (Excluded Sections) shall not be deemed “filed” for purposes of Section 18 of the Securities Exchange Act of 1934 (Exchange Act) or otherwise subject to the liabilities under that Section and shall not be deemed to be incorporated by reference into any filing of Group Inc. under the Securities Act of 1933 or the Exchange Act. The information included in Exhibit 99.1, other than in the Excluded Sections, shall be deemed “filed” for purposes of the Exchange Act.
| 99.2 | Presentation of Group Inc. dated April 15, 2020, for the conference call on April 15, 2020. |
Exhibit 99.2 is being furnished pursuant to Item 7.01 of Form 8-K and the information included therein shall not be deemed “filed” for purposes of Section 18 of the Exchange Act or otherwise subject to the liabilities under that Section and shall not be deemed to be incorporated by reference into any filing of Group Inc. under the Securities Act of 1933 or the Exchange Act.
| 101 | Pursuant to Rule 406 of Regulation S-T, the cover page information is formatted in iXBRL (Inline eXtensible Business Reporting Language). |
| 104 | Cover Page Interactive Data File (formatted in iXBRL in Exhibit 101). |
SIGNATURE
Pursuant to the requirements of the Securities Exchange Act of 1934, the Registrant has duly caused this report to be signed on its behalf by the undersigned hereunto duly authorized.
| THE GOLDMAN SACHS GROUP, INC. |
||||||||
| (Registrant) |
||||||||
| Date: April 15, 2020 |
By: |
/s/ Stephen M. Scherr |
||||||
|
|
Name: Stephen M. Scherr |
|||||||
| Title: Chief Financial Officer |
||||||||
Exhibit 99.1

|
First Quarter 2020
Earnings Results
Media Relations: Jake Siewert 212-902-5400 Investor Relations: Heather Kennedy Miner 212-902-0300
|
||
|
The Goldman Sachs Group, Inc. 200 West Street | New York, NY 10282
|
First Quarter 2020 Earnings Results
Goldman Sachs Reports First Quarter Earnings Per Common Share of $3.11
|
“As the world grapples with this terrible pandemic, we are extremely grateful for the professionalism of the healthcare specialists and other front-line workers who are bearing the greatest burden in the fight against the virus. We are in awe of their courage and are doing our part to help communities and small businesses suffering from the economic impact of the crisis.
I am enormously proud of the determination and dedication of the people of Goldman Sachs, who continue to serve our clients despite high market volatility. Our quarterly profitability was inevitably affected by the economic dislocation. As public policy measures to stem the pandemic take root, I am firmly convinced that our firm will emerge well-positioned to help our clients and communities recover.” |
|
- David M. Solomon, Chairman and Chief Executive Officer
|
Financial Summary
|
|
|
|||||||
|
Net Revenues
|
Net Earnings
|
EPS
| ||||||
|
$8.74 billion
|
$1.21 billion
|
$3.11
| ||||||
|
Annualized ROE1
|
Annualized ROTE1
|
Book Value Per Share
| ||||||
|
5.7%
|
6.0%
|
$228.21
| ||||||
NEW YORK, April 15, 2020 – The Goldman Sachs Group, Inc. (NYSE: GS) today reported net revenues of $8.74 billion and net earnings of $1.21 billion for the first quarter ended March 31, 2020.
Diluted earnings per common share (EPS) was $3.11 for the first quarter of 2020 compared with $5.71 for the first quarter of 2019, and $4.69 for the fourth quarter of 2019.
Annualized return on average common shareholders’ equity (ROE)1 was 5.7% and annualized return on average tangible common shareholders’ equity (ROTE)1 was 6.0% for the first quarter of 2020.
1
Goldman Sachs Reports
First Quarter 2020 Earnings Results
Highlights
| ◾ |
During the quarter, the firm successfully executed on its Business Continuity Planning strategy amid the global COVID-19 pandemic, providing clients with advice, execution and liquidity. The firm generated $8.74 billion in quarterly net revenues during the first quarter of 2020, reflecting strength in franchise activity. |
| ◾ |
The firm acted quickly by committing $500 million in capital to support small business lending in addition to $50 million in grants for COVID-19 relief efforts. The firm also donated more than 700,000 N95 masks and more than 2.5 million surgical masks to hospitals across the U.S. and Europe. |
| ◾ |
As it relates to the firm’s businesses, Investment Banking generated quarterly net revenues of $2.18 billion, its second highest quarterly performance. The firm remained ranked #1 in worldwide announced and completed mergers and acquisitions for the year-to-date.2 |
| ◾ |
Fixed Income, Currency and Commodities (FICC) generated quarterly net revenues of $2.97 billion, its highest quarterly performance in five years, reflecting strong client activity in both intermediation and financing. |
| ◾ |
Equities generated quarterly net revenues of $2.19 billion, its second highest quarterly performance in five years, reflecting strength in derivatives and higher volumes in intermediation. |
| ◾ |
Consumer & Wealth Management generated record quarterly net revenues of $1.49 billion, reflecting strength in both Consumer banking and Wealth management. |
| ◾ |
The firm continued to scale the digital consumer deposit platforms, as consumer deposits increased by a record $12 billion in the first quarter of 2020 to $72 billion3. |
| ◾ |
The firm maintained a highly liquid balance sheet, as global core liquid assets4 averaged $243 billion3 for the first quarter of 2020. |
Quarterly Net Revenue Mix by Segment
|
|
|
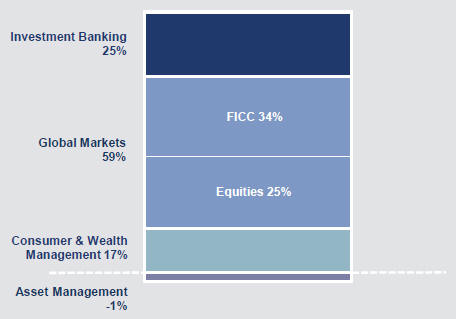
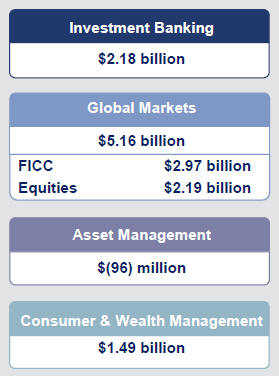
2
Goldman Sachs Reports
First Quarter 2020 Earnings Results
|
Net Revenues
|
|
|
| Net revenues were $8.74 billion for the first quarter of 2020, essentially unchanged compared with the first quarter of 2019 and 12% lower than the fourth quarter of 2019. Net revenues, compared with the first quarter of 2019, reflected significantly lower net revenues in Asset Management, largely offset by significantly higher net revenues in Global Markets, Investment Banking and Consumer & Wealth Management. |
|
Net Revenues
| ||
|
$8.74 billion
| ||||
|
The operating environment, notably in March, was impacted by the spread of the COVID-19 virus which caused a sharp contraction in global economic activity and increased market volatility. The events in March negatively impacted multiple industries, including energy, industrials, retail and leisure, and affected both equity and credit markets. In response, the U.S. Federal Reserve and other central banks, along with governments globally, intervened with monetary and fiscal measures aimed at mitigating market concerns and providing liquidity to the market. |
|
|
|
Investment Banking |
|
|
| Net revenues in Investment Banking were $2.18 billion for the first quarter of 2020, 25% higher than the first quarter of 2019 and 6% higher than the fourth quarter of 2019. The increase compared with the first quarter of 2019 reflected significantly higher net revenues in Corporate lending and Underwriting, partially offset by lower net revenues in Financial advisory.
The increase in Corporate lending net revenues was due to significantly higher net revenues related to relationship lending activities, reflecting the impact of changes in credit spreads on hedges. The increase in Underwriting net revenues was due to significantly higher net revenues in Equity underwriting, primarily from initial public offerings and convertible offerings, and in Debt underwriting, driven by asset-backed and leveraged finance activity. The decrease in Financial advisory net revenues reflected a decrease in industry-wide completed mergers and acquisitions transactions.
The firm’s investment banking transaction backlog4 decreased compared with the end of 2019, but increased compared with the end of the first quarter of 2019. |
Investment Banking
| |||||
|
$2.18 billion
| ||||||
|
|
Financial Advisory |
$781 million | ||||
| Underwriting |
$961 million | |||||
|
Corporate Lending
|
$442 million
| |||||
|
|
Global Markets |
|
| Net revenues in Global Markets were $5.16 billion for the first quarter of 2020, 28% higher than the first quarter of 2019 and 48% higher than the fourth quarter of 2019.
Net revenues in FICC were $2.97 billion, 33% higher than the first quarter of 2019, due to significantly higher net revenues in FICC intermediation, reflecting significantly higher net revenues in currencies and credit products, higher net revenues in commodities and slightly higher net revenues in interest rate products, partially offset by significantly lower net revenues in mortgages. In addition, net revenues in FICC financing were higher, driven by repurchase agreements.
Net revenues in Equities were $2.19 billion, 22% higher than the first quarter of 2019, due to significantly higher net revenues in Equities intermediation, driven by derivatives, and slightly higher net revenues in Equities financing, reflecting higher average customer balances. |
Global Markets
| |||||
|
$5.16 billion
| ||||||
|
FICC Intermediation |
$2.54 billion | |||||
| FICC Financing |
$432 million | |||||
| FICC |
$2.97 billion | |||||
| Equities Intermediation |
$1.53 billion | |||||
| Equities Financing |
$666 million | |||||
|
Equities |
$2.19 billion
| |||||
|
|
||||||
3
Goldman Sachs Reports
First Quarter 2020 Earnings Results
|
|
Asset Management |
|
| Net revenues in Asset Management were $(96) million for the first quarter of 2020, compared with $1.79 billion for the first quarter of 2019 and $3.00 billion for the fourth quarter of 2019. The decrease compared with the first quarter of 2019 reflected significant net losses in Lending and debt investments and net losses in Equity investments. These decreases were partially offset by significantly higher Incentive fees and higher Management and other fees from the firm’s institutional and third- party distribution asset management clients.
Macroeconomic concerns resulting from the challenging operating environment led to decreased global equity prices, wider credit spreads and uncertainty in the economic outlook. As a result, Lending and debt investments reflected significant net losses across debt securities and Equity investments reflected significant mark-to-market net losses from investments in public equities and significantly lower net gains from investments in private equities, which included gains from pending and completed sales. The increase in Incentive fees was driven by harvesting and the increase in Management and other fees reflected the impact of higher average assets under supervision, partially offset by a lower average effective fee due to shifts in the mix of client assets and strategies. |
Asset Management
| |||||
|
$(96) million
| ||||||
| Management and Other Fees |
$ 640 million | |||||
| Incentive Fees |
$154 million | |||||
| Equity Investments |
$(22) million | |||||
| Lending and Debt Investments
|
$(868) million
| |||||
|
|
Consumer & Wealth Management |
|
| Net revenues in Consumer & Wealth Management were $1.49 billion for the first quarter of 2020, 21% higher than the first quarter of 2019 and 6% higher than the fourth quarter of 2019.
Net revenues in Wealth management were $1.21 billion, 18% higher than the first quarter of 2019, due to significantly higher Management and other fees (including the impact of United Capital5), primarily reflecting higher average assets under supervision and higher transaction volumes, and higher Incentive fees. Net revenues in Private banking and lending were lower.
Net revenues in Consumer banking were $282 million, 39% higher than the first quarter of 2019, driven by higher net interest income, primarily reflecting an increase in deposit balances and credit card loans. |
Consumer & Wealth Management
| |||||
|
$1.49 billion
| ||||||
|
Wealth Management |
$ 1.21 billion | |||||
| Consumer Banking
|
$282 million
| |||||
Provision for Credit Losses
| Provision for credit losses was $937 million for the first quarter of 2020, compared with $224 million for the first quarter of 2019 and $336 million for the fourth quarter of 2019. The increase compared with the first quarter of 2019 was primarily due to significantly higher provisions related to corporate loans as a result of continued pressure in the energy sector and the impact of COVID-19 on the broader economic environment. In addition, the first quarter of 2020 included provisions related to growth in corporate loans and credit card loans, and the impact of accounting for credit losses under the CECL standard6.
The firm’s allowance for credit losses was $3.20 billion as of March 31, 2020. |
|
Provision for Credit Losses
| ||
|
$937 million
| ||||
4
Goldman Sachs Reports
First Quarter 2020 Earnings Results
Operating Expenses
| Operating expenses were $6.46 billion for the first quarter of 2020, 10% higher than the first quarter of 2019 and 12% lower than the fourth quarter of 2019. The firm’s efficiency ratio4 for the first quarter of 2020 was 73.9%, compared with 66.6% for the first quarter of 2019. |
|
Operating Expenses
| ||
|
$6.46 billion
| ||||
|
The increase in operating expenses compared with the first quarter of 2019 was primarily due to significantly higher expenses related to brokerage, clearing, exchange and distribution fees, reflecting an increase in activity levels, higher net provisions for litigation and regulatory proceedings, and higher expenses related to consolidated investments, including impairments (increase was primarily in depreciation and amortization, occupancy and other expenses). In addition, technology expenses and professional fees were higher. The first quarter of 2020 also included higher expenses related to the firm’s credit card activities (increases were primarily in professional fees and other expenses) and the impact of the consolidation of United Capital5. Compensation and benefits expenses were essentially unchanged, while market development expenses were lower.
Net provisions for litigation and regulatory proceedings for the first quarter of 2020 were $184 million compared with $37 million for the first quarter of 2019.
Headcount was essentially unchanged compared with the end of 2019.
|
Efficiency Ratio
| |||
|
73.9%
| ||||
Provision for Taxes
| The effective income tax rate for the first quarter of 2020 was 10.0%, down from the full year rate of 20.0% for 2019, primarily due to tax benefits on the settlement of employee share-based awards and the impact of lower pre-tax earnings on permanent tax benefits in the first quarter of 2020. |
Effective Tax Rate
| |||
|
10.0%
| ||||
Other Matters
| ◾ On April 14, 2020, the Board of Directors of The Goldman Sachs Group, Inc. declared a dividend of $1.25 per common share to be paid on June 29, 2020 to common shareholders of record on June 1, 2020.
◾ During the quarter, the firm returned $2.38 billion of capital to common shareholders, including $1.93 billion of share repurchases (8.2 million shares at an average cost of $236.35) and $449 million of common stock dividends.4
◾ Global core liquid assets4 averaged $243 billion3 for the first quarter of 2020, compared with an average of $237 billion for the fourth quarter of 2019. |
Declared Quarterly Dividend Per Common Share
| |||
|
$1.25
| ||||
|
Common Share Repurchases
| ||||
|
8.2 million shares for $1.93 billion
| ||||
|
Average GCLA
| ||||
|
$243 billion
|
5
Goldman Sachs Reports
First Quarter 2020 Earnings Results
The Goldman Sachs Group, Inc. is a leading global investment banking, securities and investment management firm that provides a wide range of financial services to a substantial and diversified client base that includes corporations, financial institutions, governments and individuals. Founded in 1869, the firm is headquartered in New York and maintains offices in all major financial centers around the world.
|
|
Cautionary Note Regarding Forward-Looking Statements |
|
This press release contains “forward-looking statements” within the meaning of the safe harbor provisions of the U.S. Private Securities Litigation Reform Act of 1995. Forward-looking statements are not historical facts, but instead represent only the firm’s beliefs regarding future events, many of which, by their nature, are inherently uncertain and outside of the firm’s control. It is possible that the firm’s actual results, financial condition and liquidity may differ, possibly materially, from the anticipated results, financial condition and liquidity indicated in these forward-looking statements. For information about some of the risks and important factors that could affect the firm’s future results, financial condition and liquidity, see Item 8.01 of the firm’s Report on Form 8-K dated April 15, 2020 and “Risk Factors” in Part I, Item 1A of the firm’s Annual Report on Form 10-K for the year ended December 31, 2019.
Information regarding the firm’s assets under supervision, capital ratios, risk-weighted assets, supplementary leverage ratio, balance sheet data, global core liquid assets and VaR consists of preliminary estimates. These estimates are forward-looking statements and are subject to change, possibly materially, as the firm completes its financial statements.
Statements about the firm’s investment banking transaction backlog also may constitute forward-looking statements. Such statements are subject to the risk that transactions may be modified or not completed at all and associated net revenues may not be realized or may be materially less than those currently expected. Important factors that could have such a result include, for underwriting transactions, a decline or weakness in general economic conditions, an outbreak of hostilities, volatility in the securities markets or an adverse development with respect to the issuer of the securities and, for financial advisory transactions, a decline in the securities markets, an inability to obtain adequate financing, an adverse development with respect to a party to the transaction or a failure to obtain a required regulatory approval. For information about other important factors that could adversely affect the firm’s investment banking transactions, see Item 8.01 of the firm’s Report on Form 8-K dated April 15, 2020 and “Risk Factors” in Part I, Item 1A of the firm’s Annual Report on Form 10-K for the year ended December 31, 2019.
Statements about the effects of the COVID-19 pandemic on the firm’s business, results, financial position and liquidity may constitute forward-looking statements and are subject to the risk that the actual impact may differ, possibly materially, from what is currently expected.
|
|
Conference Call |
|
A conference call to discuss the firm’s financial results, outlook and related matters will be held at 9:30 am (ET). The call will be open to the public. Members of the public who would like to listen to the conference call should dial 1-888-281-7154 (in the U.S.) or 1-706-679-5627 (outside the U.S.). The number should be dialed at least 10 minutes prior to the start of the conference call. The conference call will also be accessible as an audio webcast through the Investor Relations section of the firm’s website, www.goldmansachs.com/investor-relations. There is no charge to access the call. For those unable to listen to the live broadcast, a replay will be available on the firm’s website or by dialing 1-855-859-2056 (in the U.S.) or 1-404-537-
3406 (outside the U.S.) passcode number 64774224 beginning approximately three hours after the event. Please direct any questions regarding obtaining access to the conference call to Goldman Sachs Investor Relations, via e-mail, at gs-investor-
6
Goldman Sachs Reports
First Quarter 2020 Earnings Results
The Goldman Sachs Group, Inc. and Subsidiaries
Segment Net Revenues (unaudited)
$ in millions
| THREE MONTHS ENDED | % CHANGE FROM | |||||||||||||||||||||
| MARCH 31, 2020 |
DECEMBER 31, 2019 |
MARCH 31, 2019 |
DECEMBER 31, 2019 |
MARCH 31, 2019 |
||||||||||||||||||
|
INVESTMENT BANKING
|
||||||||||||||||||||||
|
Financial advisory |
$ 781 | $ 855 | $ 874 | (9) % | (11) % | |||||||||||||||||
| Equity underwriting |
378 | 378 | 262 | – | 44 | |||||||||||||||||
|
Debt underwriting
|
|
583
|
|
|
599
|
|
|
482
|
|
|
(3)
|
|
|
21
|
| |||||||
|
Underwriting |
961 | 977 | 744 | (2) | 29 | |||||||||||||||||
| Corporate lending |
|
442
|
|
|
232
|
|
|
128
|
|
|
91
|
|
|
N.M.
|
| |||||||
|
Net revenues
|
|
2,184
|
|
|
2,064
|
|
|
1,746
|
|
|
6
|
|
|
25
|
| |||||||
|
GLOBAL MARKETS
|
||||||||||||||||||||||
| FICC intermediation |
2,537 | 1,382 | 1,872 | 84 | 36 | |||||||||||||||||
| FICC financing |
|
432
|
|
|
387
|
|
|
366
|
|
|
12
|
|
|
18
|
| |||||||
|
FICC
|
2,969 | 1,769 | 2,238 | 68 | 33 | |||||||||||||||||
| Equities intermediation |
1,528 | 979 | 1,161 | 56 | 32 | |||||||||||||||||
|
Equities financing
|
|
666
|
|
|
732
|
|
|
641
|
|
|
(9)
|
|
|
4
|
| |||||||
| Equities |
2,194 | 1,711 | 1,802 | 28 | 22 | |||||||||||||||||
|
Net revenues
|
|
5,163
|
|
|
3,480
|
|
|
4,040
|
|
|
48
|
|
|
28
|
| |||||||
|
ASSET MANAGEMENT
|
||||||||||||||||||||||
|
Management and other fees |
640 | 666 | 607 | (4) | 5 | |||||||||||||||||
|
Incentive fees |
154 | 45 | 30 | N.M. | N.M. | |||||||||||||||||
|
Equity investments |
(22) | 1,865 | 805 | N.M. | N.M. | |||||||||||||||||
|
Lending and debt investments
|
|
(868)
|
|
|
427
|
|
|
351
|
|
|
N.M.
|
|
|
N.M.
|
| |||||||
|
Net revenues
|
|
(96)
|
|
|
3,003
|
|
|
1,793
|
|
|
N.M.
|
|
|
N.M.
|
| |||||||
|
CONSUMER & WEALTH MANAGEMENT
|
||||||||||||||||||||||
|
Management and other fees |
959 | 967 | 794 | (1) | 21 | |||||||||||||||||
|
Incentive fees |
69 | 19 | 28 | N.M. | 146 | |||||||||||||||||
|
Private banking and lending
|
|
182
|
|
|
194
|
|
|
203
|
|
|
(6)
|
|
|
(10)
|
| |||||||
|
Wealth management |
1,210 | 1,180 | 1,025 | 3 | 18 | |||||||||||||||||
| Consumer banking |
|
282
|
|
|
228
|
|
|
203
|
|
|
24
|
|
|
39
|
| |||||||
|
Net revenues
|
|
1,492
|
|
|
1,408
|
|
|
1,228
|
|
|
6
|
|
|
21
|
| |||||||
|
Total net revenues
|
|
$ 8,743
|
|
|
$ 9,955
|
|
|
$ 8,807
|
|
|
(12)
|
|
|
(1)
|
| |||||||
|
Geographic Net Revenues (unaudited)4 $ in millions
|
|
|||||||||||||||||||||
| THREE MONTHS ENDED | ||||||||||||||||||||||
| MARCH 31, 2020 |
DECEMBER 31, 2019 |
MARCH 31, 2019 |
||||||||||||||||||||
| Americas |
$ 5,171 | $ 6,310 | $ 5,245 | |||||||||||||||||||
|
EMEA |
2,108 | 2,268 | 2,459 | |||||||||||||||||||
|
Asia
|
|
1,464
|
|
|
1,377
|
|
|
1,103
|
|
|||||||||||||
|
Total net revenues
|
|
$ 8,743
|
|
|
$ 9,955
|
|
|
$ 8,807
|
|
|||||||||||||
| Americas |
59% | 63% | 60% | |||||||||||||||||||
|
EMEA |
24% | 23% | 28% | |||||||||||||||||||
|
Asia
|
|
17%
|
|
|
14%
|
|
|
12%
|
|
|||||||||||||
|
Total
|
|
100%
|
|
|
100%
|
|
|
100%
|
|
|||||||||||||
7
Goldman Sachs Reports
First Quarter 2020 Earnings Results
The Goldman Sachs Group, Inc. and Subsidiaries
Consolidated Statements of Earnings (unaudited)
In millions, except per share amounts and headcount
| THREE MONTHS ENDED | % CHANGE FROM | |||||||||||||||||||||||||
| MARCH 31, 2020 |
DECEMBER 31, 2019 |
MARCH 31, 2019 |
DECEMBER 31, 2019 |
MARCH 31, 2019 |
||||||||||||||||||||||
|
REVENUES
|
||||||||||||||||||||||||||
|
Investment banking |
$ 1,742 | $ 1,832 | $ 1,618 | (5) % | 8 % | |||||||||||||||||||||
|
Investment management |
1,768 | 1,671 | 1,436 | 6 | 23 | |||||||||||||||||||||
|
Commissions and fees |
1,020 | 687 | 745 | 48 | 37 | |||||||||||||||||||||
|
Market making |
3,682 | 2,479 | 2,723 | 49 | 35 | |||||||||||||||||||||
|
Other principal transactions
|
|
(782)
|
|
|
2,221
|
|
|
1,067
|
|
|
N.M.
|
|
|
N.M.
|
|
|||||||||||
|
Total non-interest revenues
|
|
7,430
|
|
|
8,890
|
|
|
7,589
|
|
|
(16)
|
|
|
(2)
|
|
|||||||||||
| Interest income |
4,750 | 4,922 | 5,597 | (3) | (15) | |||||||||||||||||||||
|
Interest expense
|
|
3,437
|
|
|
3,857
|
|
|
4,379
|
|
|
(11)
|
|
(22) | |||||||||||||
|
Net interest income
|
|
1,313
|
|
|
1,065
|
|
|
1,218
|
|
|
23
|
|
|
8
|
|
|||||||||||
|
Total net revenues
|
|
8,743
|
|
|
9,955
|
|
|
8,807
|
|
|
(12)
|
|
|
(1)
|
|
|||||||||||
|
Provision for credit losses
|
|
937
|
|
|
336
|
|
|
224
|
|
|
179
|
|
|
N.M.
|
|
|||||||||||
|
OPERATING EXPENSES
|
||||||||||||||||||||||||||
|
Compensation and benefits |
3,235 | 3,046 | 3,259 | 6 | (1) | |||||||||||||||||||||
|
Brokerage, clearing, exchange and distribution fees |
975 | 814 | 762 | 20 | 28 | |||||||||||||||||||||
|
Market development |
153 | 200 | 184 | (24) | (17) | |||||||||||||||||||||
|
Communications and technology |
321 | 308 | 286 | 4 | 12 | |||||||||||||||||||||
|
Depreciation and amortization |
437 | 464 | 368 | (6) | 19 | |||||||||||||||||||||
|
Occupancy |
238 | 318 | 225 | (25) | 6 | |||||||||||||||||||||
|
Professional fees |
347 | 366 | 298 | (5) | 16 | |||||||||||||||||||||
|
Other expenses
|
|
752
|
|
|
1,782
|
|
|
482
|
|
|
(58)
|
|
|
56
|
|
|||||||||||
|
Total operating expenses
|
|
6,458
|
|
|
7,298
|
|
|
5,864
|
|
|
(12)
|
|
|
10
|
|
|||||||||||
| Pre-tax earnings |
1,348 | 2,321 | 2,719 | (42) | (50) | |||||||||||||||||||||
|
Provision for taxes
|
|
135
|
|
|
404
|
|
|
468
|
|
|
(67)
|
|
|
(71)
|
|
|||||||||||
|
Net earnings
|
|
1,213
|
|
|
1,917
|
|
|
2,251
|
|
|
(37)
|
|
|
(46)
|
|
|||||||||||
| Preferred stock dividends
|
|
90
|
|
|
193
|
|
|
69
|
|
|
(53)
|
|
|
30
|
|
|||||||||||
|
Net earnings applicable to common shareholders
|
|
$ 1,123
|
|
|
$ 1,724
|
|
|
$ 2,182
|
|
|
(35)
|
|
|
(49)
|
|
|||||||||||
|
EARNINGS PER COMMON SHARE
|
||||||||||||||||||||||||||
|
Basic4 |
$ 3.12 | $ 4.74 | $ 5.73 | (34) % | (46) % | |||||||||||||||||||||
|
Diluted |
$ 3.11 | $ 4.69 | $ 5.71 | (34) | (46) | |||||||||||||||||||||
|
AVERAGE COMMON SHARES
|
||||||||||||||||||||||||||
|
Basic |
358.0 | 362.4 | 379.8 | (1) | (6) | |||||||||||||||||||||
|
Diluted |
361.1 | 367.3 | 382.4 | (2) | (6) | |||||||||||||||||||||
|
SELECTED DATA AT PERIOD-END
|
||||||||||||||||||||||||||
|
Common shareholders’ equity |
$ 81,176 | $ 79,062 | $ 79,070 | 3 | 3 | |||||||||||||||||||||
|
Basic shares4 |
355.7 | 361.8 | 378.2 | (2) | (6) | |||||||||||||||||||||
|
Book value per common share |
$ 228.21 | $ 218.52 | $ 209.07 | 4 | 9 | |||||||||||||||||||||
| Headcount
|
|
38,500
|
|
|
38,300
|
|
|
35,900
|
|
|
1
|
|
|
7
|
|
|||||||||||
8
Goldman Sachs Reports
First Quarter 2020 Earnings Results
The Goldman Sachs Group, Inc. and Subsidiaries
Condensed Consolidated Balance Sheets (unaudited)3
$ in billions
| AS OF | ||||||||||||||||
| MARCH 31, 2020 |
DECEMBER 31, 2019 |
|||||||||||||||
|
ASSETS
|
||||||||||||||||
|
Cash and cash equivalents |
$ 106 | $ 133 | ||||||||||||||
|
Collateralized agreements |
254 | 222 | ||||||||||||||
|
Customer and other receivables |
121 | 75 | ||||||||||||||
|
Trading assets |
375 | 355 | ||||||||||||||
|
Investments |
69 | 64 | ||||||||||||||
|
Loans |
128 | 109 | ||||||||||||||
|
Other assets
|
|
37
|
|
|
35
|
|
||||||||||
|
Total assets
|
|
$ 1,090
|
|
|
$ 993
|
|
||||||||||
|
LIABILITIES AND SHAREHOLDERS’ EQUITY
|
||||||||||||||||
|
Deposits |
$ 220 | $ 190 | ||||||||||||||
|
Collateralized financings |
147 | 152 | ||||||||||||||
|
Customer and other payables |
213 | 175 | ||||||||||||||
|
Trading liabilities |
137 | 109 | ||||||||||||||
|
Unsecured short-term borrowings |
37 | 48 | ||||||||||||||
|
Unsecured long-term borrowings |
226 | 207 | ||||||||||||||
|
Other liabilities
|
|
18
|
|
|
22
|
|
||||||||||
|
Total liabilities
|
|
998
|
|
|
903
|
|
||||||||||
|
Shareholders’ equity
|
|
92
|
|
|
90
|
|
||||||||||
|
Total liabilities and shareholders’ equity
|
|
$ 1,090
|
|
|
$ 993
|
|
||||||||||
|
Capital Ratios and Supplementary Leverage Ratio (unaudited)3,4 $ in billions
|
|
|||||||||||||||
| AS OF | ||||||||||||||||
| MARCH 31, 2020 |
DECEMBER 31, 2019 |
|||||||||||||||
|
Common equity tier 1 capital |
$ 74.6 | $ 74.9 | ||||||||||||||
|
STANDARDIZED CAPITAL RULES
|
||||||||||||||||
|
Risk-weighted assets |
$ 595 | $ 564 | ||||||||||||||
|
Common equity tier 1 capital ratio |
12.5% | 13.3% | ||||||||||||||
|
ADVANCED CAPITAL RULES
|
||||||||||||||||
|
Risk-weighted assets |
$ 606 | $ 545 | ||||||||||||||
|
Common equity tier 1 capital ratio |
12.3% | 13.7% | ||||||||||||||
|
SUPPLEMENTARY LEVERAGE RATIO
|
||||||||||||||||
| Supplementary leverage ratio
|
|
5.9%
|
|
|
6.2%
|
|
||||||||||
|
Average Daily VaR (unaudited)3,4 $ in millions
|
|
|||||||||||||||
| THREE MONTHS ENDED | ||||||||||||||||
| MARCH 31, 2020 |
DECEMBER 31, 2019 |
|||||||||||||||
|
RISK CATEGORIES
|
||||||||||||||||
|
Interest rates |
$ 60 | $ 49 | ||||||||||||||
|
Equity prices |
41 | 24 | ||||||||||||||
|
Currency rates |
18 | 11 | ||||||||||||||
|
Commodity prices |
11 | 12 | ||||||||||||||
|
Diversification effect
|
|
(49)
|
|
|
(38)
|
|
||||||||||
|
Total
|
|
$ 81
|
|
|
$ 58
|
|
||||||||||
9
Goldman Sachs Reports
First Quarter 2020 Earnings Results
The Goldman Sachs Group, Inc. and Subsidiaries
Assets Under Supervision (unaudited)3,4
$ in billions
| AS OF | ||||||||||||||||||||||
| MARCH 31, 2020 |
DECEMBER 31, 2019 |
MARCH 31, 2019 |
||||||||||||||||||||
|
SEGMENT
|
||||||||||||||||||||||
|
Asset Management |
$ 1,309 | $ 1,298 | $ 1,117 | |||||||||||||||||||
|
Consumer & Wealth Management
|
|
509
|
|
|
561
|
|
|
482
|
|
|||||||||||||
|
Total AUS
|
|
$ 1,818
|
|
|
$ 1,859
|
|
|
$ 1,599
|
|
|||||||||||||
|
ASSET CLASS
|
||||||||||||||||||||||
| Alternative investments |
$ 178 | $ 185 | $ 172 | |||||||||||||||||||
|
Equity |
335 | 423 | 335 | |||||||||||||||||||
|
Fixed income
|
|
771
|
|
|
789
|
|
|
717
|
|
|||||||||||||
|
Total long-term AUS
|
|
1,284
|
|
|
1,397
|
|
|
1,224
|
|
|||||||||||||
|
Liquidity products
|
|
534
|
|
|
462
|
|
|
375
|
|
|||||||||||||
|
Total AUS
|
|
$ 1,818
|
|
|
$ 1,859
|
|
|
$ 1,599
|
|
|||||||||||||
| THREE MONTHS ENDED | ||||||||||||||||||||||
| MARCH 31, 2020 |
DECEMBER 31, 2019 |
MARCH 31, 2019 |
||||||||||||||||||||
|
ASSET MANAGEMENT |
||||||||||||||||||||||
|
Beginning balance |
$ 1,298 | $ 1,232 | $ 1,087 | |||||||||||||||||||
|
Net inflows / (outflows): |
||||||||||||||||||||||
|
Alternative investments |
(1) | (1) | – | |||||||||||||||||||
|
Equity |
2 | 1 | 3 | |||||||||||||||||||
|
Fixed income |
|
7
|
|
|
(4)
|
|
|
18
|
|
|||||||||||||
|
Total long-term AUS net inflows / (outflows) |
|
8
|
|
|
(4)
|
|
|
21
|
|
|||||||||||||
|
Liquidity products
|
|
66
|
|
|
50
|
|
|
(25)
|
|
|||||||||||||
|
Total AUS net inflows / (outflows)
|
|
74
|
|
|
46
|
|
|
(4)
|
|
|||||||||||||
|
Net market appreciation / (depreciation) |
|
(63)
|
|
|
20
|
|
|
34
|
|
|||||||||||||
|
Ending balance
|
|
$ 1,309
|
|
|
$ 1,298
|
|
|
$ 1,117
|
|
|||||||||||||
|
CONSUMER & WEALTH MANAGEMENT |
||||||||||||||||||||||
|
Beginning balance |
$ 561 | $ 530 | $ 455 | |||||||||||||||||||
|
Net inflows / (outflows): |
||||||||||||||||||||||
|
Alternative investments |
– | 2 | 1 | |||||||||||||||||||
|
Equity |
1 | – | (4) | |||||||||||||||||||
|
Fixed income |
|
(8)
|
|
|
4
|
|
|
2
|
|
|||||||||||||
|
Total long-term AUS net inflows / (outflows)
|
|
(7)
|
|
|
6
|
|
|
(1)
|
|
|||||||||||||
|
Liquidity products |
|
6
|
|
|
8
|
|
|
3
|
|
|||||||||||||
|
Total AUS net inflows / (outflows)
|
|
(1)
|
|
|
14
|
|
|
2
|
|
|||||||||||||
|
Net market appreciation / (depreciation) |
|
(51)
|
|
|
17
|
|
|
25
|
|
|||||||||||||
|
Ending balance
|
|
$
509
|
|
|
$
561
|
|
|
$
482
|
|
|||||||||||||
|
FIRMWIDE |
||||||||||||||||||||||
|
Beginning balance |
$ 1,859 | $ 1,762 | $ 1,542 | |||||||||||||||||||
|
Net inflows / (outflows): |
||||||||||||||||||||||
|
Alternative investments |
(1) | 1 | 1 | |||||||||||||||||||
|
Equity |
3 | 1 | (1) | |||||||||||||||||||
|
Fixed income |
|
(1)
|
|
|
– |
|
|
20
|
|
|||||||||||||
|
Total long-term AUS net inflows / (outflows)
|
|
1
|
|
|
2
|
|
|
20
|
|
|||||||||||||
|
Liquidity products |
|
72
|
|
|
58
|
|
|
(22)
|
|
|||||||||||||
|
Total AUS net inflows / (outflows)
|
|
73
|
|
|
60
|
|
|
(2)
|
|
|||||||||||||
|
Net market appreciation / (depreciation)
|
|
(114)
|
|
|
37
|
|
|
59
|
|
|||||||||||||
|
Ending balance
|
|
$ 1,818
|
|
|
$ 1,859
|
|
|
$ 1,599
|
|
|||||||||||||
10
Goldman Sachs Reports
First Quarter 2020 Earnings Results
|
Footnotes |
|
|
| 1. | Annualized ROE is calculated by dividing annualized net earnings applicable to common shareholders by average monthly common shareholders’ equity. Annualized ROTE is calculated by dividing annualized net earnings applicable to common shareholders by average monthly tangible common shareholders’ equity (tangible common shareholders’ equity is calculated as total shareholders’ equity less preferred stock, goodwill and identifiable intangible assets). Management believes that ROTE is meaningful because it measures the performance of businesses consistently, whether they were acquired or developed internally, and that tangible common shareholders’ equity is meaningful because it is a measure that the firm and investors use to assess capital adequacy. ROTE and tangible common shareholders’ equity are non-GAAP measures and may not be comparable to similar non-GAAP measures used by other companies. |
The table below presents average equity and a reconciliation of average common shareholders’ equity to average tangible common shareholders’ equity:
| AVERAGE FOR THE | ||||||||
| Unaudited, $ in millions | THREE MONTHS ENDED MARCH 31, 2020 |
|||||||
|
Total shareholders’ equity
|
|
$ 90,466
|
|
|||||
| Preferred stock
|
|
(11,203)
|
|
|||||
|
Common shareholders’ equity
|
|
79,263
|
|
|||||
|
Goodwill and identifiable intangible assets
|
|
(4,821)
|
|
|||||
|
Tangible common shareholders’ equity
|
|
$
74,442
|
|
|
|
| ||
| 2. | Dealogic – January 1, 2020 through March 31, 2020. |
| 3. | Represents a preliminary estimate for the first quarter of 2020 and may be revised in the firm’s Quarterly Report on Form 10-Q for the period ended March 31, 2020. |
| 4. | For information about the following items, see the referenced sections in Part II, Item 7 “Management’s Discussion and Analysis of Financial Condition and Results of Operations” in the firm’s Annual Report on Form 10-K for the year ended December 31, 2019: (i) investment banking transaction backlog – see “Results of Operations – Investment Banking” (ii) assets under supervision – see “Results of Operations – Assets Under Supervision” (iii) efficiency ratio – see “Results of Operations – Operating Expenses” (iv) share repurchase program – see “Equity Capital Management and Regulatory Capital – Equity Capital Management” (v) global core liquid assets – see “Risk Management – Liquidity Risk Management” (vi) basic shares – see “Balance Sheet and Funding Sources – Balance Sheet Analysis and Metrics” and (vii) VaR – see “Risk Management – Market Risk Management.” |
For information about the following items, see the referenced sections in Part II, Item 8 “Financial Statements and Supplementary Data” in the firm’s Annual Report on Form 10-K for the year ended December 31, 2019: (i) risk-based capital ratios and supplementary leverage ratio – see Note 20 “Regulation and Capital Adequacy” (ii) geographic net revenues – see Note 25 “Business Segments” and (iii) unvested share-based awards that have non-forfeitable rights to dividends or dividend equivalents in calculating basic EPS – see Note 21 “Earnings Per Common Share.”
| 5. | United Capital Financial Partners, Inc. (United Capital) was acquired by the firm in the third quarter of 2019. |
| 6. | In the first quarter of 2020, the firm adopted ASU No. 2016-13, “Financial Instruments – Credit Losses (Topic 326) – Measurement of Credit Losses on Financial Instruments,” which amends several aspects of the measurement of credit losses on certain financial instruments, including replacing the existing incurred credit loss model and other models with the Current Expected Credit Losses (CECL) model. For further information about ASU No. 2016-13, see Note 3 “Significant Accounting Policies” in Part II, Item 8 “Financial Statements and Supplementary Data” in the firm’s Annual Report on Form 10-K for the year ended December 31, 2019. |
11
Exhibit 99.2 First Quarter 2020 Earnings Results Presentation April 15, 2020Exhibit 99.2 First Quarter 2020 Earnings Results Presentation April 15, 2020
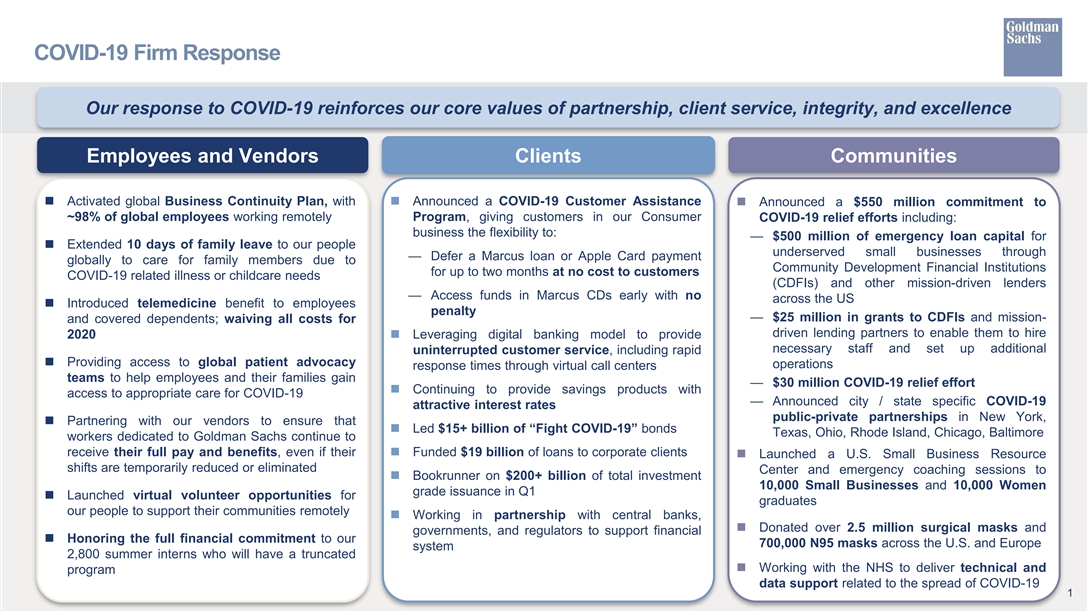
COVID-19 Firm Response Our response to COVID-19 reinforces our core values of partnership, client service, integrity, and excellence Employees and Vendors Clients Communities n Activated global Business Continuity Plan, withn Announced a COVID-19 Customer Assistance n Announced a $550 million commitment to ~98% of global employees working remotely Program, giving customers in our Consumer COVID-19 relief efforts including: business the flexibility to: — $500 million of emergency loan capital for n Extended 10 days of family leave to our people underserved small businesses through — Defer a Marcus loan or Apple Card payment globally to care for family members due to Community Development Financial Institutions for up to two months at no cost to customers COVID-19 related illness or childcare needs (CDFIs) and other mission-driven lenders — Access funds in Marcus CDs early with no across the US n Introduced telemedicine benefit to employees penalty — $25 million in grants to CDFIs and mission- and covered dependents; waiving all costs for driven lending partners to enable them to hire 2020n Leveraging digital banking model to provide necessary staff and set up additional uninterrupted customer service, including rapid n Providing access to global patient advocacy operations response times through virtual call centers teams to help employees and their families gain — $30 million COVID-19 relief effort n Continuing to provide savings products with access to appropriate care for COVID-19 — Announced city / state specific COVID-19 attractive interest rates public-private partnerships in New York, n Partnering with our vendors to ensure that n Led $15+ billion of“Fight COVID-19” bonds Texas, Ohio, Rhode Island, Chicago, Baltimore workers dedicated to Goldman Sachs continue to receive their full pay and benefits, even if theirn Funded $19 billion of loans to corporate clients n Launched a U.S. Small Business Resource shifts are temporarily reduced or eliminated Center and emergency coaching sessions to n Bookrunner on $200+ billion of total investment 10,000 Small Businesses and 10,000 Women grade issuance in Q1 n Launched virtual volunteer opportunities for graduates our people to support their communities remotely n Working in partnership with central banks, n Donated over 2.5 million surgical masks and governments, and regulators to support financial n Honoring the full financial commitment to our 700,000 N95 masks across the U.S. and Europe system 2,800 summer interns who will have a truncated n Working with the NHS to deliver technical and program data support related to the spread of COVID-19 1COVID-19 Firm Response Our response to COVID-19 reinforces our core values of partnership, client service, integrity, and excellence Employees and Vendors Clients Communities n Activated global Business Continuity Plan, withn Announced a COVID-19 Customer Assistance n Announced a $550 million commitment to ~98% of global employees working remotely Program, giving customers in our Consumer COVID-19 relief efforts including: business the flexibility to: — $500 million of emergency loan capital for n Extended 10 days of family leave to our people underserved small businesses through — Defer a Marcus loan or Apple Card payment globally to care for family members due to Community Development Financial Institutions for up to two months at no cost to customers COVID-19 related illness or childcare needs (CDFIs) and other mission-driven lenders — Access funds in Marcus CDs early with no across the US n Introduced telemedicine benefit to employees penalty — $25 million in grants to CDFIs and mission- and covered dependents; waiving all costs for driven lending partners to enable them to hire 2020n Leveraging digital banking model to provide necessary staff and set up additional uninterrupted customer service, including rapid n Providing access to global patient advocacy operations response times through virtual call centers teams to help employees and their families gain — $30 million COVID-19 relief effort n Continuing to provide savings products with access to appropriate care for COVID-19 — Announced city / state specific COVID-19 attractive interest rates public-private partnerships in New York, n Partnering with our vendors to ensure that n Led $15+ billion of“Fight COVID-19” bonds Texas, Ohio, Rhode Island, Chicago, Baltimore workers dedicated to Goldman Sachs continue to receive their full pay and benefits, even if theirn Funded $19 billion of loans to corporate clients n Launched a U.S. Small Business Resource shifts are temporarily reduced or eliminated Center and emergency coaching sessions to n Bookrunner on $200+ billion of total investment 10,000 Small Businesses and 10,000 Women grade issuance in Q1 n Launched virtual volunteer opportunities for graduates our people to support their communities remotely n Working in partnership with central banks, n Donated over 2.5 million surgical masks and governments, and regulators to support financial n Honoring the full financial commitment to our 700,000 N95 masks across the U.S. and Europe system 2,800 summer interns who will have a truncated n Working with the NHS to deliver technical and program data support related to the spread of COVID-19 1
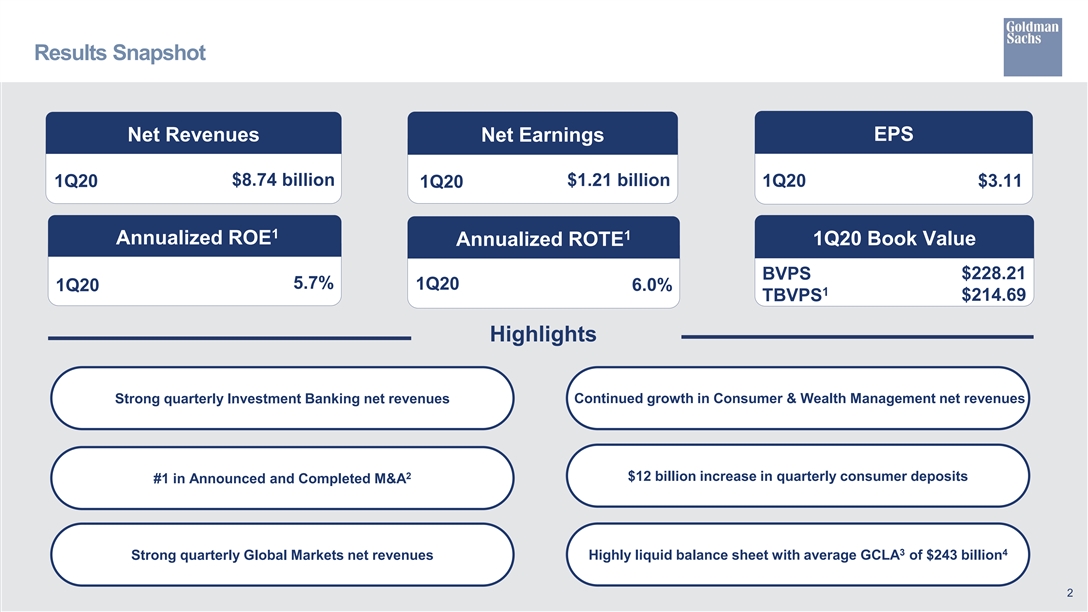
Results Snapshot Net Revenues EPS Net Earnings $8.74 billion $1.21 billion 1Q20 1Q20 $3.11 1Q20 1 1 Annualized ROE 1Q20 Book Value Annualized ROTE $228.21 BVPS 5.7% 1Q20 1Q20 6.0% 1 TBVPS $214.69 Highlights Strong quarterly Investment Banking net revenues Continued growth in Consumer & Wealth Management net revenues 2 $12 billion increase in quarterly consumer deposits #1 in Announced and Completed M&A 3 4 Strong quarterly Global Markets net revenues Highly liquid balance sheet with average GCLA of $243 billion 2Results Snapshot Net Revenues EPS Net Earnings $8.74 billion $1.21 billion 1Q20 1Q20 $3.11 1Q20 1 1 Annualized ROE 1Q20 Book Value Annualized ROTE $228.21 BVPS 5.7% 1Q20 1Q20 6.0% 1 TBVPS $214.69 Highlights Strong quarterly Investment Banking net revenues Continued growth in Consumer & Wealth Management net revenues 2 $12 billion increase in quarterly consumer deposits #1 in Announced and Completed M&A 3 4 Strong quarterly Global Markets net revenues Highly liquid balance sheet with average GCLA of $243 billion 2
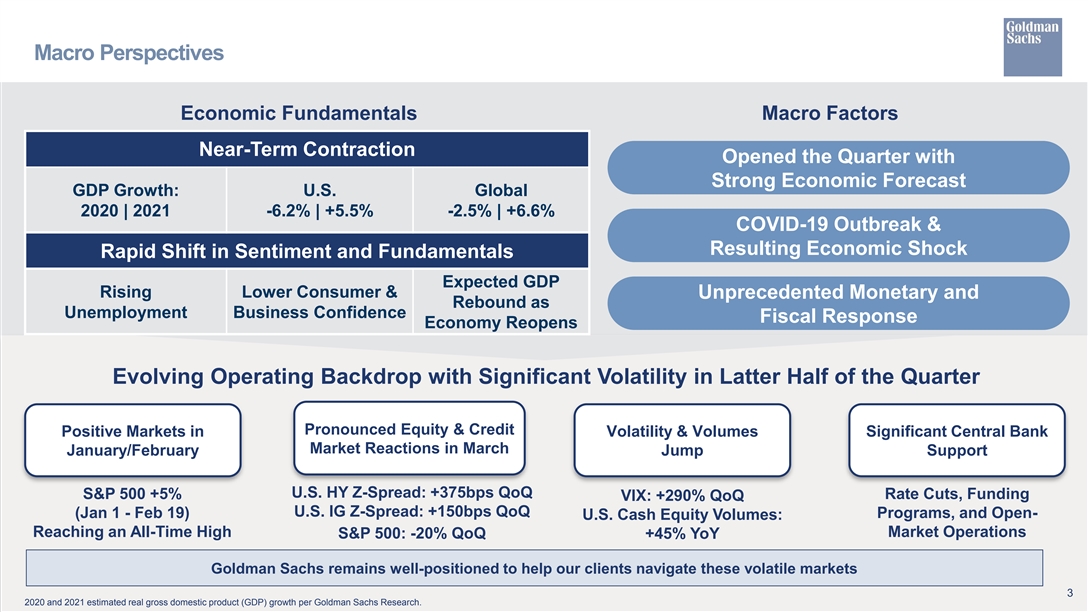
Macro Perspectives Economic Fundamentals Macro Factors Near-Term Contraction Opened the Quarter with Strong Economic Forecast GDP Growth: U.S. Global 2020 | 2021 -6.2% | +5.5% -2.5% | +6.6% COVID-19 Outbreak & Resulting Economic Shock Rapid Shift in Sentiment and Fundamentals Expected GDP Rising Lower Consumer & Unprecedented Monetary and Rebound as Unemployment Business Confidence Fiscal Response Economy Reopens Evolving Operating Backdrop with Significant Volatility in Latter Half of the Quarter Pronounced Equity & Credit Positive Markets in Volatility & Volumes Significant Central Bank Market Reactions in March January/February Jump Support U.S. HY Z-Spread: +375bps QoQ S&P 500 +5% Rate Cuts, Funding VIX: +290% QoQ U.S. IG Z-Spread: +150bps QoQ (Jan 1 - Feb 19) Programs, and Open- U.S. Cash Equity Volumes: Reaching an All-Time High Market Operations S&P 500: -20% QoQ +45% YoY Goldman Sachs remains well-positioned to help our clients navigate these volatile markets 3 2020 and 2021 estimated real gross domestic product (GDP) growth per Goldman Sachs Research. Macro Perspectives Economic Fundamentals Macro Factors Near-Term Contraction Opened the Quarter with Strong Economic Forecast GDP Growth: U.S. Global 2020 | 2021 -6.2% | +5.5% -2.5% | +6.6% COVID-19 Outbreak & Resulting Economic Shock Rapid Shift in Sentiment and Fundamentals Expected GDP Rising Lower Consumer & Unprecedented Monetary and Rebound as Unemployment Business Confidence Fiscal Response Economy Reopens Evolving Operating Backdrop with Significant Volatility in Latter Half of the Quarter Pronounced Equity & Credit Positive Markets in Volatility & Volumes Significant Central Bank Market Reactions in March January/February Jump Support U.S. HY Z-Spread: +375bps QoQ S&P 500 +5% Rate Cuts, Funding VIX: +290% QoQ U.S. IG Z-Spread: +150bps QoQ (Jan 1 - Feb 19) Programs, and Open- U.S. Cash Equity Volumes: Reaching an All-Time High Market Operations S&P 500: -20% QoQ +45% YoY Goldman Sachs remains well-positioned to help our clients navigate these volatile markets 3 2020 and 2021 estimated real gross domestic product (GDP) growth per Goldman Sachs Research.
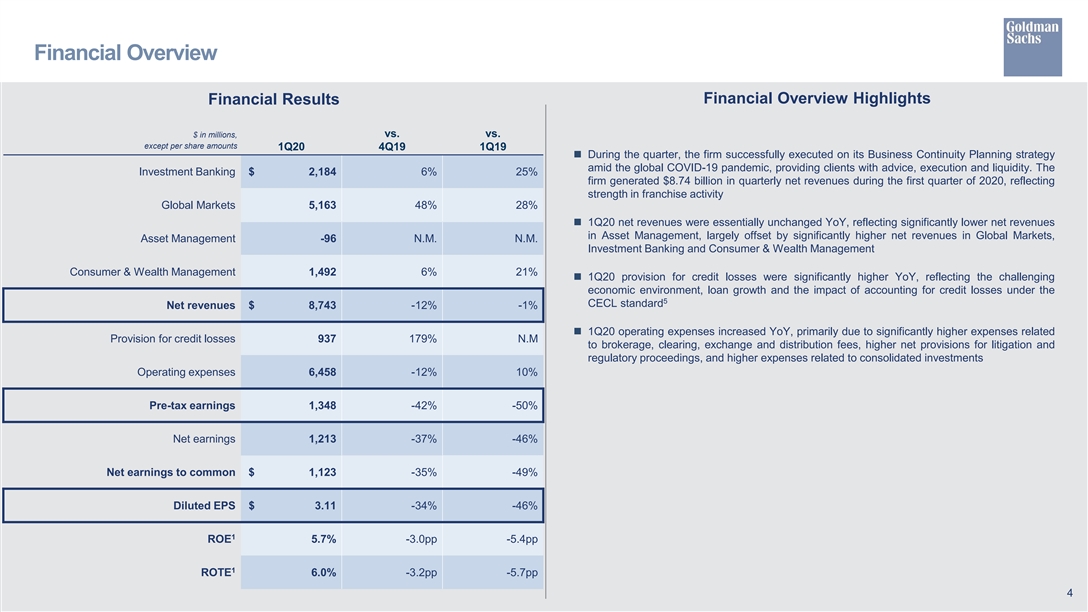
Financial Overview Financial Overview Highlights Financial Results vs. vs. $ in millions, except per share amounts 1Q20 4Q19 1Q19 n During the quarter, the firm successfully executed on its Business Continuity Planning strategy amid the global COVID-19 pandemic, providing clients with advice, execution and liquidity. The Investment Banking $ 2,184 6% 25% firm generated $8.74 billion in quarterly net revenues during the first quarter of 2020, reflecting strength in franchise activity Global Markets 5,163 48% 28% n 1Q20 net revenues were essentially unchanged YoY, reflecting significantly lower net revenues in Asset Management, largely offset by significantly higher net revenues in Global Markets, Asset Management -96 N.M. N.M. Investment Banking and Consumer & Wealth Management Consumer & Wealth Management 1,492 6% 21% n 1Q20 provision for credit losses were significantly higher YoY, reflecting the challenging economic environment, loan growth and the impact of accounting for credit losses under the 5 CECL standard Net revenues $ 8,743 -12% -1% n 1Q20 operating expenses increased YoY, primarily due to significantly higher expenses related Provision for credit losses 937 179% N.M to brokerage, clearing, exchange and distribution fees, higher net provisions for litigation and regulatory proceedings, and higher expenses related to consolidated investments Operating expenses 6,458 -12% 10% Pre-tax earnings 1,348 -42% -50% Net earnings 1,213 -37% -46% Net earnings to common $ 1,123 -35% -49% Diluted EPS $ 3.11 -34% -46% 1 ROE 5.7% -3.0pp -5.4pp 1 ROTE 6.0% -3.2pp -5.7pp 4Financial Overview Financial Overview Highlights Financial Results vs. vs. $ in millions, except per share amounts 1Q20 4Q19 1Q19 n During the quarter, the firm successfully executed on its Business Continuity Planning strategy amid the global COVID-19 pandemic, providing clients with advice, execution and liquidity. The Investment Banking $ 2,184 6% 25% firm generated $8.74 billion in quarterly net revenues during the first quarter of 2020, reflecting strength in franchise activity Global Markets 5,163 48% 28% n 1Q20 net revenues were essentially unchanged YoY, reflecting significantly lower net revenues in Asset Management, largely offset by significantly higher net revenues in Global Markets, Asset Management -96 N.M. N.M. Investment Banking and Consumer & Wealth Management Consumer & Wealth Management 1,492 6% 21% n 1Q20 provision for credit losses were significantly higher YoY, reflecting the challenging economic environment, loan growth and the impact of accounting for credit losses under the 5 CECL standard Net revenues $ 8,743 -12% -1% n 1Q20 operating expenses increased YoY, primarily due to significantly higher expenses related Provision for credit losses 937 179% N.M to brokerage, clearing, exchange and distribution fees, higher net provisions for litigation and regulatory proceedings, and higher expenses related to consolidated investments Operating expenses 6,458 -12% 10% Pre-tax earnings 1,348 -42% -50% Net earnings 1,213 -37% -46% Net earnings to common $ 1,123 -35% -49% Diluted EPS $ 3.11 -34% -46% 1 ROE 5.7% -3.0pp -5.4pp 1 ROTE 6.0% -3.2pp -5.7pp 4
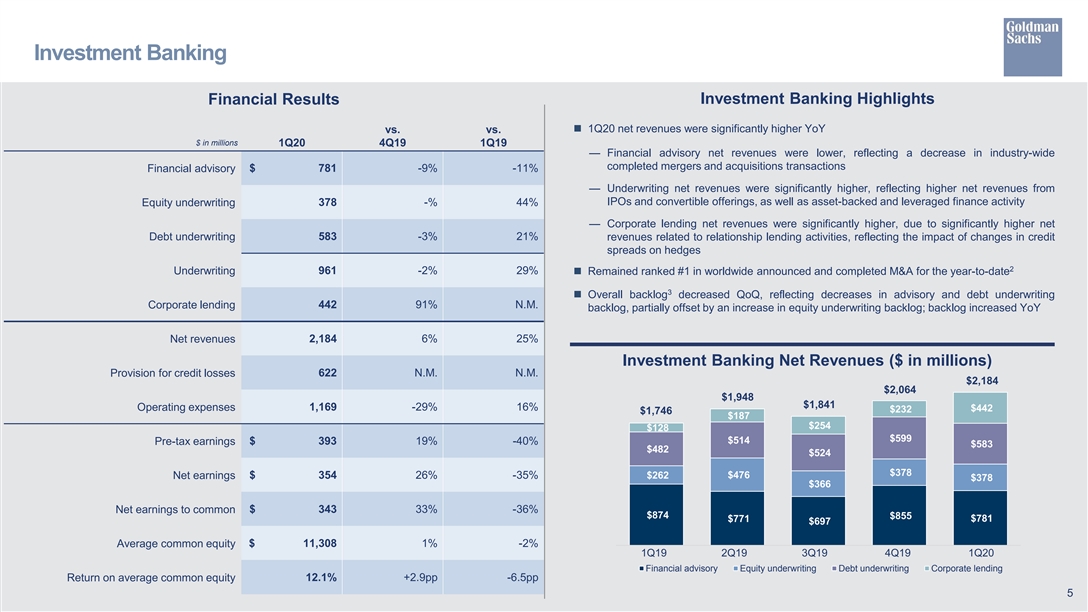
Investment Banking Investment Banking Highlights Financial Results n 1Q20 net revenues were significantly higher YoY vs. vs. $ in millions 1Q20 4Q19 1Q19 — Financial advisory net revenues were lower, reflecting a decrease in industry-wide completed mergers and acquisitions transactions Financial advisory $ 781 -9% -11% — Underwriting net revenues were significantly higher, reflecting higher net revenues from IPOs and convertible offerings, as well as asset-backed and leveraged finance activity Equity underwriting 378 -% 44% — Corporate lending net revenues were significantly higher, due to significantly higher net Debt underwriting 583 -3% 21% revenues related to relationship lending activities, reflecting the impact of changes in credit spreads on hedges 2 961 -2% 29% Underwritingn Remained ranked #1 in worldwide announced and completed M&A for the year-to-date 3 n Overall backlog decreased QoQ, reflecting decreases in advisory and debt underwriting 442 91% N.M. Corporate lending backlog, partially offset by an increase in equity underwriting backlog; backlog increased YoY 2,184 6% 25% Net revenues Investment Banking Net Revenues ($ in millions) Provision for credit losses 622 N.M. N.M. $2,184 $2,064 $1,948 $1,841 Operating expenses 1,169 -29% 16% $442 $232 $1,746 $187 $254 $128 $599 $514 Pre-tax earnings $ 393 19% -40% $583 $482 $524 $378 $476 Net earnings $ 354 26% -35% $262 $378 $366 Net earnings to common $ 343 33% -36% $874 $855 $771 $781 $697 Average common equity $ 11,308 1% -2% 1Q19 2Q19 3Q19 4Q19 1Q20 Financial advisory Equity underwriting Debt underwriting Corporate lending Return on average common equity 12.1% +2.9pp -6.5pp 5Investment Banking Investment Banking Highlights Financial Results n 1Q20 net revenues were significantly higher YoY vs. vs. $ in millions 1Q20 4Q19 1Q19 — Financial advisory net revenues were lower, reflecting a decrease in industry-wide completed mergers and acquisitions transactions Financial advisory $ 781 -9% -11% — Underwriting net revenues were significantly higher, reflecting higher net revenues from IPOs and convertible offerings, as well as asset-backed and leveraged finance activity Equity underwriting 378 -% 44% — Corporate lending net revenues were significantly higher, due to significantly higher net Debt underwriting 583 -3% 21% revenues related to relationship lending activities, reflecting the impact of changes in credit spreads on hedges 2 961 -2% 29% Underwritingn Remained ranked #1 in worldwide announced and completed M&A for the year-to-date 3 n Overall backlog decreased QoQ, reflecting decreases in advisory and debt underwriting 442 91% N.M. Corporate lending backlog, partially offset by an increase in equity underwriting backlog; backlog increased YoY 2,184 6% 25% Net revenues Investment Banking Net Revenues ($ in millions) Provision for credit losses 622 N.M. N.M. $2,184 $2,064 $1,948 $1,841 Operating expenses 1,169 -29% 16% $442 $232 $1,746 $187 $254 $128 $599 $514 Pre-tax earnings $ 393 19% -40% $583 $482 $524 $378 $476 Net earnings $ 354 26% -35% $262 $378 $366 Net earnings to common $ 343 33% -36% $874 $855 $771 $781 $697 Average common equity $ 11,308 1% -2% 1Q19 2Q19 3Q19 4Q19 1Q20 Financial advisory Equity underwriting Debt underwriting Corporate lending Return on average common equity 12.1% +2.9pp -6.5pp 5
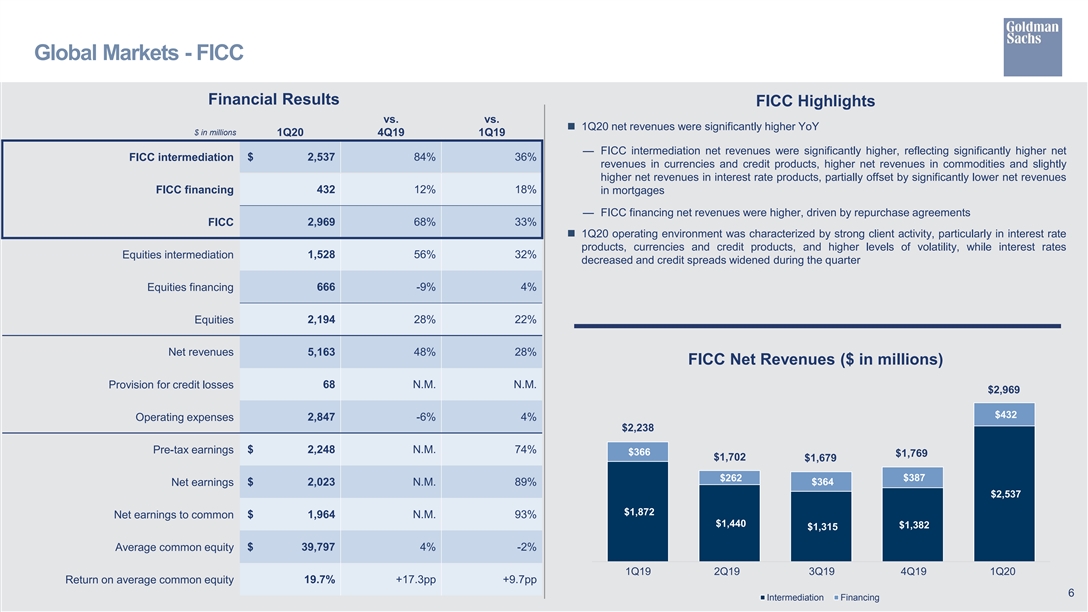
Global Markets - FICC Financial Results FICC Highlights vs. vs. n 1Q20 net revenues were significantly higher YoY $ in millions 1Q20 4Q19 1Q19 — FICC intermediation net revenues were significantly higher, reflecting significantly higher net FICC intermediation $ 2,537 84% 36% revenues in currencies and credit products, higher net revenues in commodities and slightly higher net revenues in interest rate products, partially offset by significantly lower net revenues 432 12% 18% FICC financing in mortgages — FICC financing net revenues were higher, driven by repurchase agreements FICC 2,969 68% 33% n 1Q20 operating environment was characterized by strong client activity, particularly in interest rate products, currencies and credit products, and higher levels of volatility, while interest rates 1,528 56% 32% Equities intermediation decreased and credit spreads widened during the quarter Equities financing 666 -9% 4% 2,194 28% 22% Equities Net revenues 5,163 48% 28% FICC Net Revenues ($ in millions) 68 N.M. N.M. Provision for credit losses $2,969 $432 Operating expenses 2,847 -6% 4% $2,238 $ 2,248 N.M. 74% Pre-tax earnings $366 $1,769 $1,702 $1,679 $262 $387 $364 Net earnings $ 2,023 N.M. 89% $2,537 $1,872 $ 1,964 N.M. 93% Net earnings to common $1,440 $1,382 $1,315 Average common equity $ 39,797 4% -2% 1Q19 2Q19 3Q19 4Q19 1Q20 19.7% +17.3pp +9.7pp Return on average common equity 6 Intermediation FinancingGlobal Markets - FICC Financial Results FICC Highlights vs. vs. n 1Q20 net revenues were significantly higher YoY $ in millions 1Q20 4Q19 1Q19 — FICC intermediation net revenues were significantly higher, reflecting significantly higher net FICC intermediation $ 2,537 84% 36% revenues in currencies and credit products, higher net revenues in commodities and slightly higher net revenues in interest rate products, partially offset by significantly lower net revenues 432 12% 18% FICC financing in mortgages — FICC financing net revenues were higher, driven by repurchase agreements FICC 2,969 68% 33% n 1Q20 operating environment was characterized by strong client activity, particularly in interest rate products, currencies and credit products, and higher levels of volatility, while interest rates 1,528 56% 32% Equities intermediation decreased and credit spreads widened during the quarter Equities financing 666 -9% 4% 2,194 28% 22% Equities Net revenues 5,163 48% 28% FICC Net Revenues ($ in millions) 68 N.M. N.M. Provision for credit losses $2,969 $432 Operating expenses 2,847 -6% 4% $2,238 $ 2,248 N.M. 74% Pre-tax earnings $366 $1,769 $1,702 $1,679 $262 $387 $364 Net earnings $ 2,023 N.M. 89% $2,537 $1,872 $ 1,964 N.M. 93% Net earnings to common $1,440 $1,382 $1,315 Average common equity $ 39,797 4% -2% 1Q19 2Q19 3Q19 4Q19 1Q20 19.7% +17.3pp +9.7pp Return on average common equity 6 Intermediation Financing
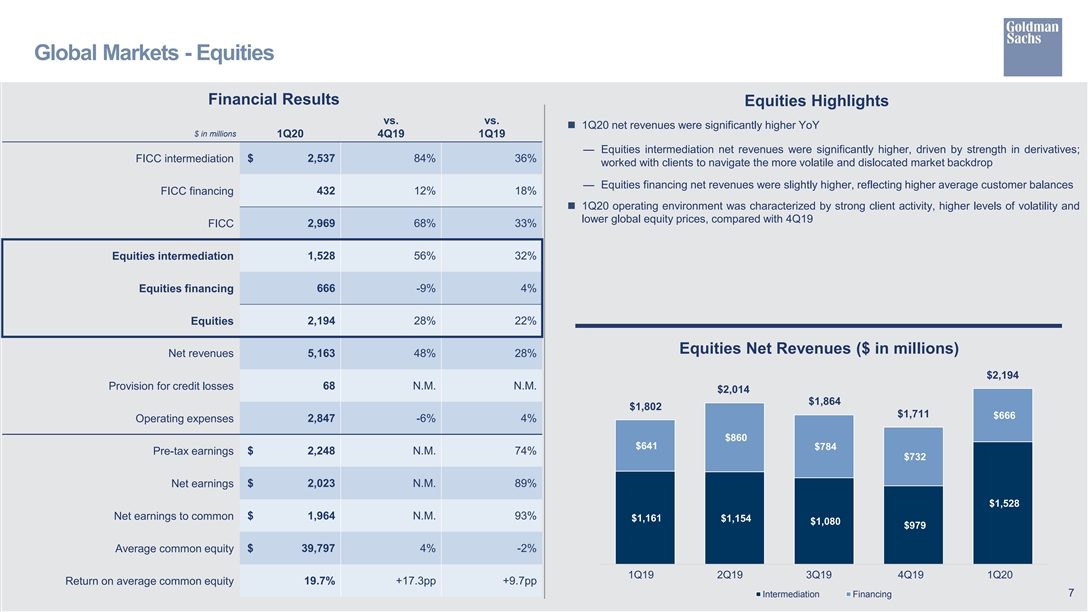
Global Markets - Equities Financial Results Equities Highlights vs. vs. n 1Q20 net revenues were significantly higher YoY $ in millions 1Q20 4Q19 1Q19 — Equities intermediation net revenues were significantly higher, driven by strength in derivatives; FICC intermediation $ 2,537 84% 36% worked with clients to navigate the more volatile and dislocated market backdrop — Equities financing net revenues were slightly higher, reflecting higher average customer balances FICC financing 432 12% 18% n 1Q20 operating environment was characterized by strong client activity, higher levels of volatility and lower global equity prices, compared with 4Q19 FICC 2,969 68% 33% Equities intermediation 1,528 56% 32% Equities financing 666 -9% 4% Equities 2,194 28% 22% Equities Net Revenues ($ in millions) Net revenues 5,163 48% 28% $2,194 Provision for credit losses 68 N.M. N.M. $2,014 $1,864 $1,802 $1,711 $666 Operating expenses 2,847 -6% 4% $860 $641 $784 Pre-tax earnings $ 2,248 N.M. 74% $732 Net earnings $ 2,023 N.M. 89% $1,528 Net earnings to common $ 1,964 N.M. 93% $1,161 $1,154 $1,080 $979 Average common equity $ 39,797 4% -2% 1Q19 2Q19 3Q19 4Q19 1Q20 Return on average common equity 19.7% +17.3pp +9.7pp Intermediation Financing 7Global Markets - Equities Financial Results Equities Highlights vs. vs. n 1Q20 net revenues were significantly higher YoY $ in millions 1Q20 4Q19 1Q19 — Equities intermediation net revenues were significantly higher, driven by strength in derivatives; FICC intermediation $ 2,537 84% 36% worked with clients to navigate the more volatile and dislocated market backdrop — Equities financing net revenues were slightly higher, reflecting higher average customer balances FICC financing 432 12% 18% n 1Q20 operating environment was characterized by strong client activity, higher levels of volatility and lower global equity prices, compared with 4Q19 FICC 2,969 68% 33% Equities intermediation 1,528 56% 32% Equities financing 666 -9% 4% Equities 2,194 28% 22% Equities Net Revenues ($ in millions) Net revenues 5,163 48% 28% $2,194 Provision for credit losses 68 N.M. N.M. $2,014 $1,864 $1,802 $1,711 $666 Operating expenses 2,847 -6% 4% $860 $641 $784 Pre-tax earnings $ 2,248 N.M. 74% $732 Net earnings $ 2,023 N.M. 89% $1,528 Net earnings to common $ 1,964 N.M. 93% $1,161 $1,154 $1,080 $979 Average common equity $ 39,797 4% -2% 1Q19 2Q19 3Q19 4Q19 1Q20 Return on average common equity 19.7% +17.3pp +9.7pp Intermediation Financing 7
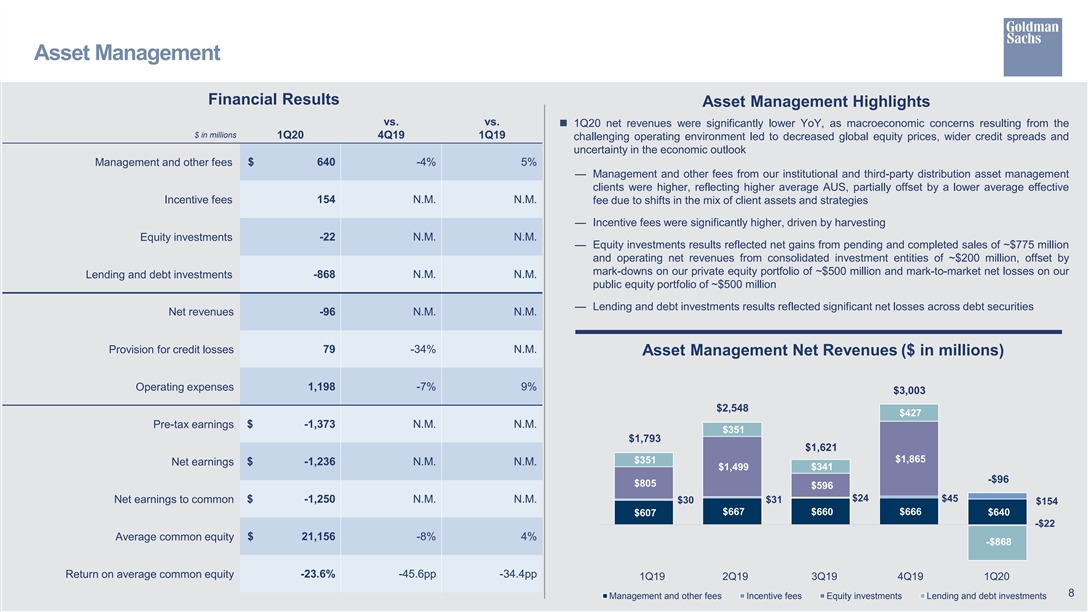
Asset Management Financial Results Asset Management Highlights vs. vs. n 1Q20 net revenues were significantly lower YoY, as macroeconomic concerns resulting from the $ in millions 1Q20 4Q19 1Q19 challenging operating environment led to decreased global equity prices, wider credit spreads and uncertainty in the economic outlook Management and other fees $ 640 -4% 5% — Management and other fees from our institutional and third-party distribution asset management clients were higher, reflecting higher average AUS, partially offset by a lower average effective Incentive fees 154 N.M. N.M. fee due to shifts in the mix of client assets and strategies — Incentive fees were significantly higher, driven by harvesting Equity investments -22 N.M. N.M. — Equity investments results reflected net gains from pending and completed sales of ~$775 million and operating net revenues from consolidated investment entities of ~$200 million, offset by mark-downs on our private equity portfolio of ~$500 million and mark-to-market net losses on our Lending and debt investments -868 N.M. N.M. public equity portfolio of ~$500 million — Lending and debt investments results reflected significant net losses across debt securities Net revenues -96 N.M. N.M. Provision for credit losses 79 -34% N.M. Asset Management Net Revenues ($ in millions) 1,198 -7% 9% Operating expenses $3,003 $2,548 $427 Pre-tax earnings $ -1,373 N.M. N.M. $351 $1,793 $1,621 $1,865 $351 $ -1,236 N.M. N.M. Net earnings $1,499 $341 -$96 $805 $596 $24 $45 Net earnings to common $ -1,250 N.M. N.M. $31 $30 $154 $667 $660 $666 $607 $640 -$22 Average common equity $ 21,156 -8% 4% -$868 Return on average common equity -23.6% -45.6pp -34.4pp 1Q19 2Q19 3Q19 4Q19 1Q20 8 Management and other fees Incentive fees Equity investments Lending and debt investmentsAsset Management Financial Results Asset Management Highlights vs. vs. n 1Q20 net revenues were significantly lower YoY, as macroeconomic concerns resulting from the $ in millions 1Q20 4Q19 1Q19 challenging operating environment led to decreased global equity prices, wider credit spreads and uncertainty in the economic outlook Management and other fees $ 640 -4% 5% — Management and other fees from our institutional and third-party distribution asset management clients were higher, reflecting higher average AUS, partially offset by a lower average effective Incentive fees 154 N.M. N.M. fee due to shifts in the mix of client assets and strategies — Incentive fees were significantly higher, driven by harvesting Equity investments -22 N.M. N.M. — Equity investments results reflected net gains from pending and completed sales of ~$775 million and operating net revenues from consolidated investment entities of ~$200 million, offset by mark-downs on our private equity portfolio of ~$500 million and mark-to-market net losses on our Lending and debt investments -868 N.M. N.M. public equity portfolio of ~$500 million — Lending and debt investments results reflected significant net losses across debt securities Net revenues -96 N.M. N.M. Provision for credit losses 79 -34% N.M. Asset Management Net Revenues ($ in millions) 1,198 -7% 9% Operating expenses $3,003 $2,548 $427 Pre-tax earnings $ -1,373 N.M. N.M. $351 $1,793 $1,621 $1,865 $351 $ -1,236 N.M. N.M. Net earnings $1,499 $341 -$96 $805 $596 $24 $45 Net earnings to common $ -1,250 N.M. N.M. $31 $30 $154 $667 $660 $666 $607 $640 -$22 Average common equity $ 21,156 -8% 4% -$868 Return on average common equity -23.6% -45.6pp -34.4pp 1Q19 2Q19 3Q19 4Q19 1Q20 8 Management and other fees Incentive fees Equity investments Lending and debt investments
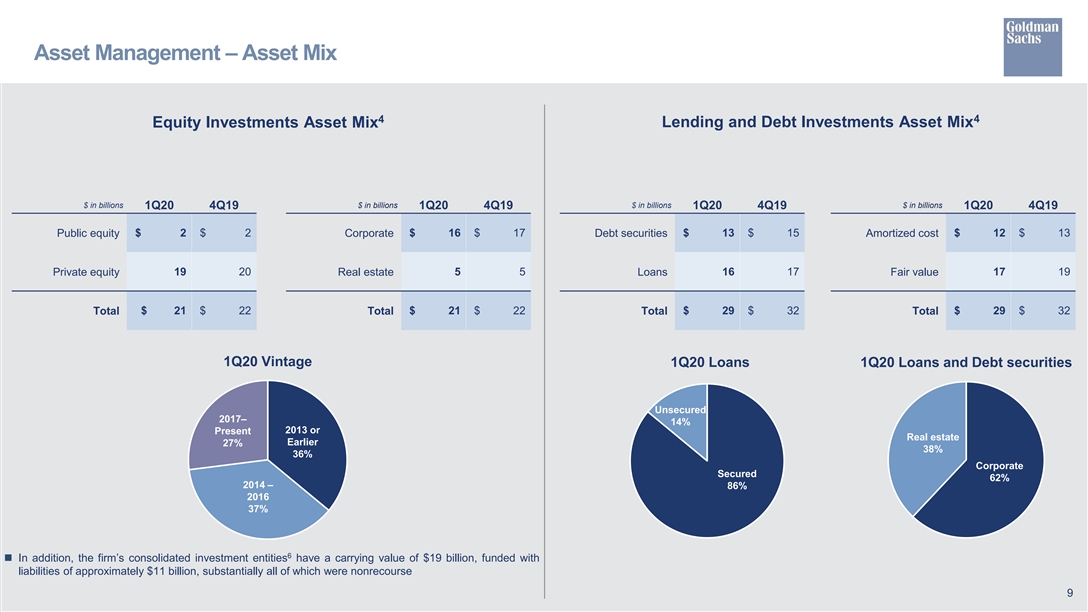
Asset Management – Asset Mix 4 4 Lending and Debt Investments Asset Mix Equity Investments Asset Mix $ in billions $ in billions $ in billions $ in billions 1Q20 4Q19 1Q20 4Q19 1Q20 4Q19 1Q20 4Q19 Public equity $ 2 $ 2 Corporate $ 16 $ 17 Debt securities $ 13 $ 15 Amortized cost $ 12 $ 13 Private equity 19 20 Real estate 5 5 Loans 16 17 Fair value 17 19 $ 21 $ 22 $ 21 $ 22 $ 29 $ 32 $ 29 $ 32 Total Total Total Total 1Q20 Vintage 1Q20 Loans 1Q20 Loans and Debt securities Unsecured 2017– 14% 2013 or Present Real estate Earlier 27% 38% 36% Corporate Secured 62% 2014 – 86% 2016 37% 6 n In addition, the firm’s consolidated investment entities have a carrying value of $19 billion, funded with liabilities of approximately $11 billion, substantially all of which were nonrecourse 9Asset Management – Asset Mix 4 4 Lending and Debt Investments Asset Mix Equity Investments Asset Mix $ in billions $ in billions $ in billions $ in billions 1Q20 4Q19 1Q20 4Q19 1Q20 4Q19 1Q20 4Q19 Public equity $ 2 $ 2 Corporate $ 16 $ 17 Debt securities $ 13 $ 15 Amortized cost $ 12 $ 13 Private equity 19 20 Real estate 5 5 Loans 16 17 Fair value 17 19 $ 21 $ 22 $ 21 $ 22 $ 29 $ 32 $ 29 $ 32 Total Total Total Total 1Q20 Vintage 1Q20 Loans 1Q20 Loans and Debt securities Unsecured 2017– 14% 2013 or Present Real estate Earlier 27% 38% 36% Corporate Secured 62% 2014 – 86% 2016 37% 6 n In addition, the firm’s consolidated investment entities have a carrying value of $19 billion, funded with liabilities of approximately $11 billion, substantially all of which were nonrecourse 9
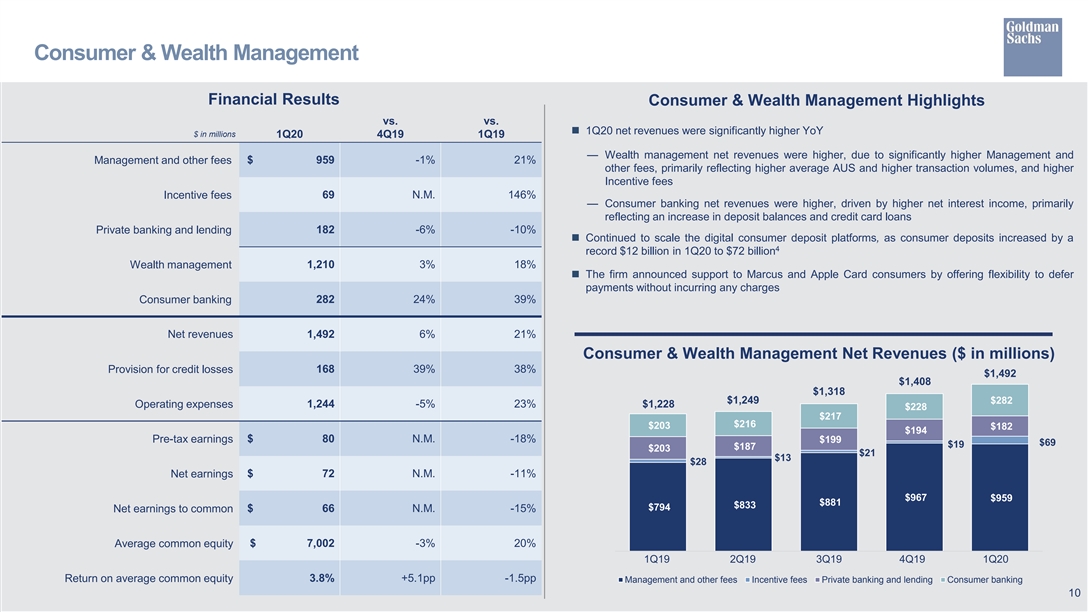
Consumer & Wealth Management Financial Results Consumer & Wealth Management Highlights vs. vs. n 1Q20 net revenues were significantly higher YoY $ in millions 1Q20 4Q19 1Q19 — Wealth management net revenues were higher, due to significantly higher Management and Management and other fees $ 959 -1% 21% other fees, primarily reflecting higher average AUS and higher transaction volumes, and higher Incentive fees Incentive fees 69 N.M. 146% — Consumer banking net revenues were higher, driven by higher net interest income, primarily reflecting an increase in deposit balances and credit card loans 182 -6% -10% Private banking and lending n Continued to scale the digital consumer deposit platforms, as consumer deposits increased by a 4 record $12 billion in 1Q20 to $72 billion Wealth management 1,210 3% 18% n The firm announced support to Marcus and Apple Card consumers by offering flexibility to defer payments without incurring any charges Consumer banking 282 24% 39% Net revenues 1,492 6% 21% Consumer & Wealth Management Net Revenues ($ in millions) Provision for credit losses 168 39% 38% $1,492 $1,408 $1,318 $1,249 $282 Operating expenses 1,244 -5% 23% $1,228 $228 $217 $216 $203 $182 $194 $ 80 N.M. -18% Pre-tax earnings $199 $69 $19 $187 $203 $21 $13 $28 $ 72 N.M. -11% Net earnings $967 $959 $881 $833 $794 Net earnings to common $ 66 N.M. -15% Average common equity $ 7,002 -3% 20% 1Q19 2Q19 3Q19 4Q19 1Q20 Return on average common equity 3.8% +5.1pp -1.5pp Management and other fees Incentive fees Private banking and lending Consumer banking 10Consumer & Wealth Management Financial Results Consumer & Wealth Management Highlights vs. vs. n 1Q20 net revenues were significantly higher YoY $ in millions 1Q20 4Q19 1Q19 — Wealth management net revenues were higher, due to significantly higher Management and Management and other fees $ 959 -1% 21% other fees, primarily reflecting higher average AUS and higher transaction volumes, and higher Incentive fees Incentive fees 69 N.M. 146% — Consumer banking net revenues were higher, driven by higher net interest income, primarily reflecting an increase in deposit balances and credit card loans 182 -6% -10% Private banking and lending n Continued to scale the digital consumer deposit platforms, as consumer deposits increased by a 4 record $12 billion in 1Q20 to $72 billion Wealth management 1,210 3% 18% n The firm announced support to Marcus and Apple Card consumers by offering flexibility to defer payments without incurring any charges Consumer banking 282 24% 39% Net revenues 1,492 6% 21% Consumer & Wealth Management Net Revenues ($ in millions) Provision for credit losses 168 39% 38% $1,492 $1,408 $1,318 $1,249 $282 Operating expenses 1,244 -5% 23% $1,228 $228 $217 $216 $203 $182 $194 $ 80 N.M. -18% Pre-tax earnings $199 $69 $19 $187 $203 $21 $13 $28 $ 72 N.M. -11% Net earnings $967 $959 $881 $833 $794 Net earnings to common $ 66 N.M. -15% Average common equity $ 7,002 -3% 20% 1Q19 2Q19 3Q19 4Q19 1Q20 Return on average common equity 3.8% +5.1pp -1.5pp Management and other fees Incentive fees Private banking and lending Consumer banking 10
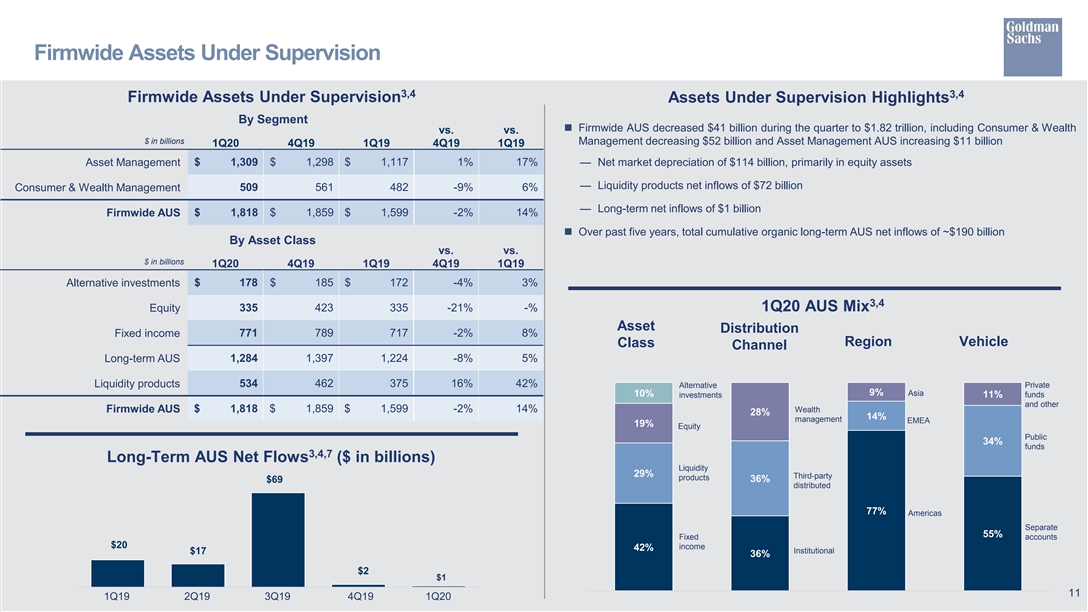
Firmwide Assets Under Supervision 3,4 3,4 Firmwide Assets Under Supervision Assets Under Supervision Highlights By Segment n Firmwide AUS decreased $41 billion during the quarter to $1.82 trillion, including Consumer & Wealth vs. vs. $ in billions Management decreasing $52 billion and Asset Management AUS increasing $11 billion 1Q20 4Q19 1Q19 4Q19 1Q19 Asset Management $ 1,309 $ 1,298 $ 1,117 1% 17% — Net market depreciation of $114 billion, primarily in equity assets — Liquidity products net inflows of $72 billion Consumer & Wealth Management 509 561 482 -9% 6% — Long-term net inflows of $1 billion $ 1,818 $ 1,859 $ 1,599 -2% 14% Firmwide AUS n Over past five years, total cumulative organic long-term AUS net inflows of ~$190 billion By Asset Class vs. vs. $ in billions 1Q20 4Q19 1Q19 4Q19 1Q19 $ 178 $ 185 $ 172 -4% 3% Alternative investments 3,4 1Q20 AUS Mix Equity 335 423 335 -21% -% Asset Distribution Fixed income 771 789 717 -2% 8% Region Vehicle Class Channel Long-term AUS 1,284 1,397 1,224 -8% 5% Liquidity products 534 462 375 16% 42% Alternative Private 9% Asia 10% investments 11% funds and other $ 1,818 $ 1,859 $ 1,599 -2% 14% Wealth Firmwide AUS 28% 14% management EMEA 19% Equity Public 34% funds 3,4,7 Long-Term AUS Net Flows ($ in billions) Liquidity 29% Third-party products 36% $69 distributed 77% Americas Separate 55% Fixed accounts $20 income 42% $17 Institutional 36% $2 $1 11 1Q19 2Q19 3Q19 4Q19 1Q20Firmwide Assets Under Supervision 3,4 3,4 Firmwide Assets Under Supervision Assets Under Supervision Highlights By Segment n Firmwide AUS decreased $41 billion during the quarter to $1.82 trillion, including Consumer & Wealth vs. vs. $ in billions Management decreasing $52 billion and Asset Management AUS increasing $11 billion 1Q20 4Q19 1Q19 4Q19 1Q19 Asset Management $ 1,309 $ 1,298 $ 1,117 1% 17% — Net market depreciation of $114 billion, primarily in equity assets — Liquidity products net inflows of $72 billion Consumer & Wealth Management 509 561 482 -9% 6% — Long-term net inflows of $1 billion $ 1,818 $ 1,859 $ 1,599 -2% 14% Firmwide AUS n Over past five years, total cumulative organic long-term AUS net inflows of ~$190 billion By Asset Class vs. vs. $ in billions 1Q20 4Q19 1Q19 4Q19 1Q19 $ 178 $ 185 $ 172 -4% 3% Alternative investments 3,4 1Q20 AUS Mix Equity 335 423 335 -21% -% Asset Distribution Fixed income 771 789 717 -2% 8% Region Vehicle Class Channel Long-term AUS 1,284 1,397 1,224 -8% 5% Liquidity products 534 462 375 16% 42% Alternative Private 9% Asia 10% investments 11% funds and other $ 1,818 $ 1,859 $ 1,599 -2% 14% Wealth Firmwide AUS 28% 14% management EMEA 19% Equity Public 34% funds 3,4,7 Long-Term AUS Net Flows ($ in billions) Liquidity 29% Third-party products 36% $69 distributed 77% Americas Separate 55% Fixed accounts $20 income 42% $17 Institutional 36% $2 $1 11 1Q19 2Q19 3Q19 4Q19 1Q20
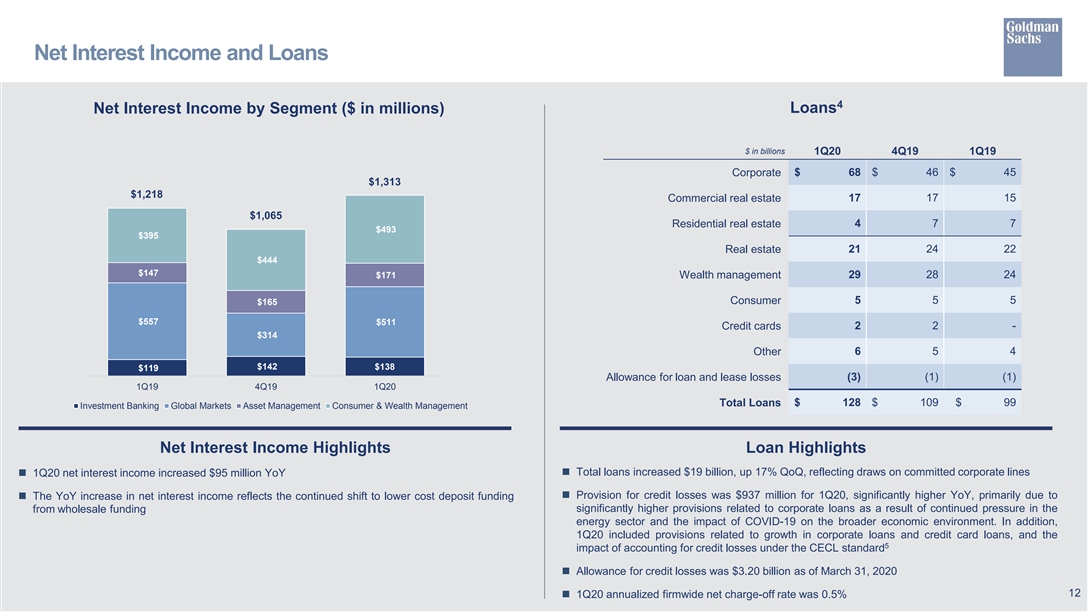
Net Interest Income and Loans 4 Loans Net Interest Income by Segment ($ in millions) $ in billions 1Q20 4Q19 1Q19 Corporate $ 68 $ 46 $ 45 $1,313 $1,218 Commercial real estate 17 17 15 $1,065 Residential real estate 4 7 7 $493 $395 Real estate 21 24 22 $444 $147 $171 29 28 24 Wealth management Consumer 5 5 5 $165 $557 $511 2 2 - Credit cards $314 Other 6 5 4 $142 $138 $119 Allowance for loan and lease losses (3) (1) (1) 1Q19 4Q19 1Q20 Total Loans $ 128 $ 109 $ 99 Investment Banking Global Markets Asset Management Consumer & Wealth Management Net Interest Income Highlights Loan Highlights n Total loans increased $19 billion, up 17% QoQ, reflecting draws on committed corporate lines n 1Q20 net interest income increased $95 million YoY n Provision for credit losses was $937 million for 1Q20, significantly higher YoY, primarily due to n The YoY increase in net interest income reflects the continued shift to lower cost deposit funding significantly higher provisions related to corporate loans as a result of continued pressure in the from wholesale funding energy sector and the impact of COVID-19 on the broader economic environment. In addition, 1Q20 included provisions related to growth in corporate loans and credit card loans, and the 5 impact of accounting for credit losses under the CECL standard n Allowance for credit losses was $3.20 billion as of March 31, 2020 12 n 1Q20 annualized firmwide net charge-off rate was 0.5%Net Interest Income and Loans 4 Loans Net Interest Income by Segment ($ in millions) $ in billions 1Q20 4Q19 1Q19 Corporate $ 68 $ 46 $ 45 $1,313 $1,218 Commercial real estate 17 17 15 $1,065 Residential real estate 4 7 7 $493 $395 Real estate 21 24 22 $444 $147 $171 29 28 24 Wealth management Consumer 5 5 5 $165 $557 $511 2 2 - Credit cards $314 Other 6 5 4 $142 $138 $119 Allowance for loan and lease losses (3) (1) (1) 1Q19 4Q19 1Q20 Total Loans $ 128 $ 109 $ 99 Investment Banking Global Markets Asset Management Consumer & Wealth Management Net Interest Income Highlights Loan Highlights n Total loans increased $19 billion, up 17% QoQ, reflecting draws on committed corporate lines n 1Q20 net interest income increased $95 million YoY n Provision for credit losses was $937 million for 1Q20, significantly higher YoY, primarily due to n The YoY increase in net interest income reflects the continued shift to lower cost deposit funding significantly higher provisions related to corporate loans as a result of continued pressure in the from wholesale funding energy sector and the impact of COVID-19 on the broader economic environment. In addition, 1Q20 included provisions related to growth in corporate loans and credit card loans, and the 5 impact of accounting for credit losses under the CECL standard n Allowance for credit losses was $3.20 billion as of March 31, 2020 12 n 1Q20 annualized firmwide net charge-off rate was 0.5%
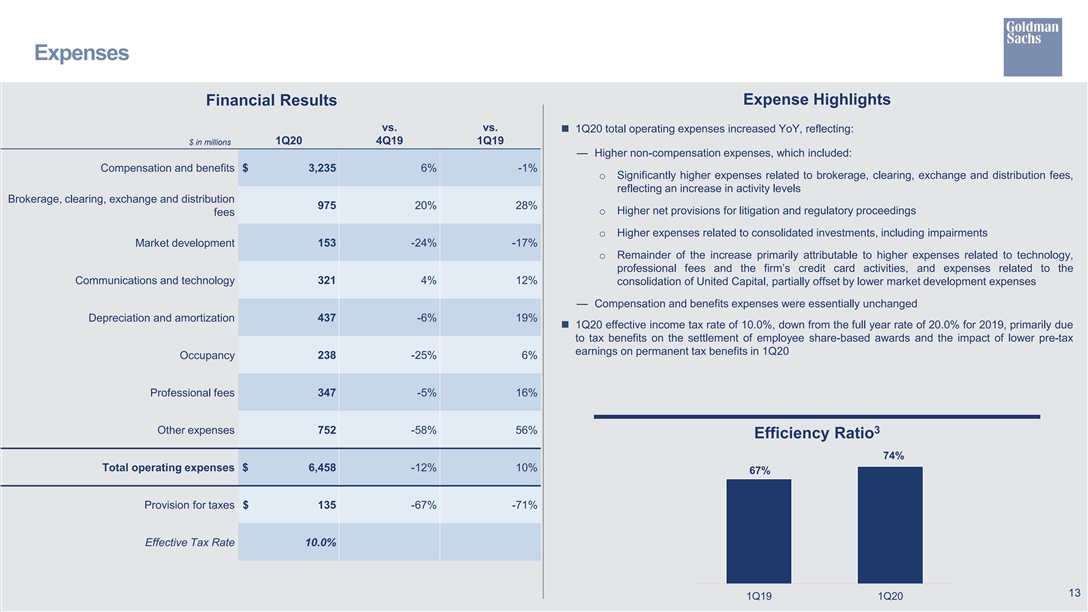
Expenses Expense Highlights Financial Results vs. vs. n 1Q20 total operating expenses increased YoY, reflecting: 1Q20 4Q19 1Q19 $ in millions — Higher non-compensation expenses, which included: Compensation and benefits $ 3,235 6% -1% o Significantly higher expenses related to brokerage, clearing, exchange and distribution fees, reflecting an increase in activity levels Brokerage, clearing, exchange and distribution 975 20% 28% o Higher net provisions for litigation and regulatory proceedings fees o Higher expenses related to consolidated investments, including impairments Market development 153 -24% -17% o Remainder of the increase primarily attributable to higher expenses related to technology, professional fees and the firm’s credit card activities, and expenses related to the Communications and technology 321 4% 12% consolidation of United Capital, partially offset by lower market development expenses — Compensation and benefits expenses were essentially unchanged Depreciation and amortization 437 -6% 19% n 1Q20 effective income tax rate of 10.0%, down from the full year rate of 20.0% for 2019, primarily due to tax benefits on the settlement of employee share-based awards and the impact of lower pre-tax earnings on permanent tax benefits in 1Q20 Occupancy 238 -25% 6% 347 -5% 16% Professional fees Other expenses 752 -58% 56% 3 Efficiency Ratio 74% Total operating expenses $ 6,458 -12% 10% 67% Provision for taxes $ 135 -67% -71% Effective Tax Rate 10.0% 13 1Q19 1Q20Expenses Expense Highlights Financial Results vs. vs. n 1Q20 total operating expenses increased YoY, reflecting: 1Q20 4Q19 1Q19 $ in millions — Higher non-compensation expenses, which included: Compensation and benefits $ 3,235 6% -1% o Significantly higher expenses related to brokerage, clearing, exchange and distribution fees, reflecting an increase in activity levels Brokerage, clearing, exchange and distribution 975 20% 28% o Higher net provisions for litigation and regulatory proceedings fees o Higher expenses related to consolidated investments, including impairments Market development 153 -24% -17% o Remainder of the increase primarily attributable to higher expenses related to technology, professional fees and the firm’s credit card activities, and expenses related to the Communications and technology 321 4% 12% consolidation of United Capital, partially offset by lower market development expenses — Compensation and benefits expenses were essentially unchanged Depreciation and amortization 437 -6% 19% n 1Q20 effective income tax rate of 10.0%, down from the full year rate of 20.0% for 2019, primarily due to tax benefits on the settlement of employee share-based awards and the impact of lower pre-tax earnings on permanent tax benefits in 1Q20 Occupancy 238 -25% 6% 347 -5% 16% Professional fees Other expenses 752 -58% 56% 3 Efficiency Ratio 74% Total operating expenses $ 6,458 -12% 10% 67% Provision for taxes $ 135 -67% -71% Effective Tax Rate 10.0% 13 1Q19 1Q20
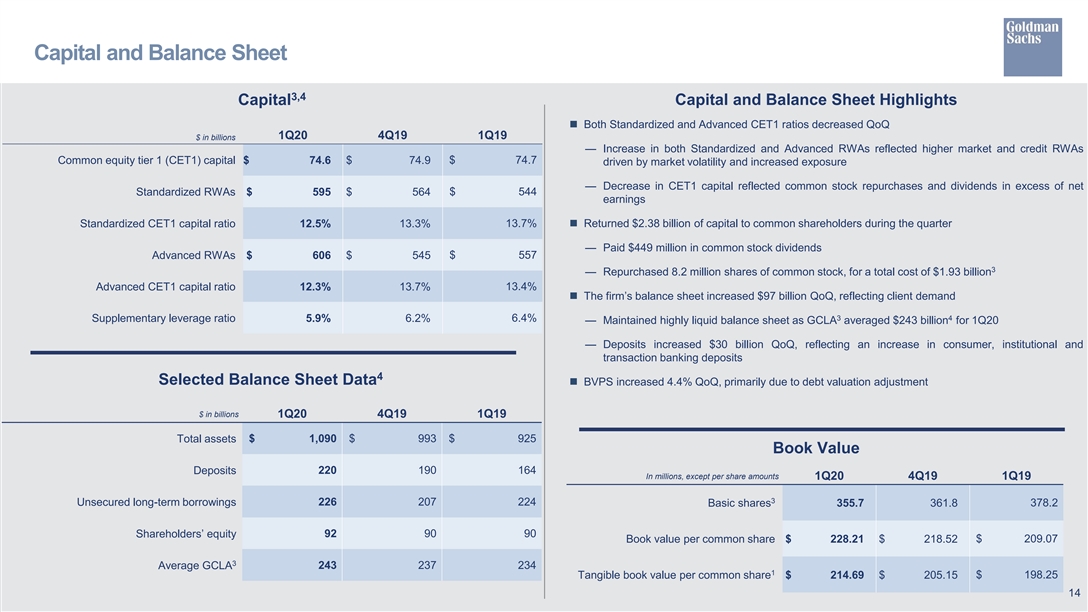
Capital and Balance Sheet 3,4 Capital Capital and Balance Sheet Highlights n Both Standardized and Advanced CET1 ratios decreased QoQ 1Q20 4Q19 1Q19 $ in billions — Increase in both Standardized and Advanced RWAs reflected higher market and credit RWAs Common equity tier 1 (CET1) capital $ 74.6 $ 74.9 $ 74.7 driven by market volatility and increased exposure — Decrease in CET1 capital reflected common stock repurchases and dividends in excess of net $ 544 Standardized RWAs $ 595 $ 564 earnings Standardized CET1 capital ratio 12.5% 13.3% 13.7%n Returned $2.38 billion of capital to common shareholders during the quarter — Paid $449 million in common stock dividends Advanced RWAs $ 606 $ 545 $ 557 3 — Repurchased 8.2 million shares of common stock, for a total cost of $1.93 billion 13.4% Advanced CET1 capital ratio 12.3% 13.7% n The firm’s balance sheet increased $97 billion QoQ, reflecting client demand 3 4 Supplementary leverage ratio 5.9% 6.2% 6.4% — Maintained highly liquid balance sheet as GCLA averaged $243 billion for 1Q20 — Deposits increased $30 billion QoQ, reflecting an increase in consumer, institutional and transaction banking deposits 4 Selected Balance Sheet Data n BVPS increased 4.4% QoQ, primarily due to debt valuation adjustment $ in billions 1Q20 4Q19 1Q19 $ 1,090 $ 993 $ 925 Total assets Book Value Deposits 220 190 164 In millions, except per share amounts 1Q20 4Q19 1Q19 3 Unsecured long-term borrowings 226 207 224 378.2 Basic shares 355.7 361.8 92 90 90 Shareholders’ equity $ 209.07 Book value per common share $ 228.21 $ 218.52 3 Average GCLA 243 237 234 1 $ 198.25 Tangible book value per common share $ 214.69 $ 205.15 14Capital and Balance Sheet 3,4 Capital Capital and Balance Sheet Highlights n Both Standardized and Advanced CET1 ratios decreased QoQ 1Q20 4Q19 1Q19 $ in billions — Increase in both Standardized and Advanced RWAs reflected higher market and credit RWAs Common equity tier 1 (CET1) capital $ 74.6 $ 74.9 $ 74.7 driven by market volatility and increased exposure — Decrease in CET1 capital reflected common stock repurchases and dividends in excess of net $ 544 Standardized RWAs $ 595 $ 564 earnings Standardized CET1 capital ratio 12.5% 13.3% 13.7%n Returned $2.38 billion of capital to common shareholders during the quarter — Paid $449 million in common stock dividends Advanced RWAs $ 606 $ 545 $ 557 3 — Repurchased 8.2 million shares of common stock, for a total cost of $1.93 billion 13.4% Advanced CET1 capital ratio 12.3% 13.7% n The firm’s balance sheet increased $97 billion QoQ, reflecting client demand 3 4 Supplementary leverage ratio 5.9% 6.2% 6.4% — Maintained highly liquid balance sheet as GCLA averaged $243 billion for 1Q20 — Deposits increased $30 billion QoQ, reflecting an increase in consumer, institutional and transaction banking deposits 4 Selected Balance Sheet Data n BVPS increased 4.4% QoQ, primarily due to debt valuation adjustment $ in billions 1Q20 4Q19 1Q19 $ 1,090 $ 993 $ 925 Total assets Book Value Deposits 220 190 164 In millions, except per share amounts 1Q20 4Q19 1Q19 3 Unsecured long-term borrowings 226 207 224 378.2 Basic shares 355.7 361.8 92 90 90 Shareholders’ equity $ 209.07 Book value per common share $ 228.21 $ 218.52 3 Average GCLA 243 237 234 1 $ 198.25 Tangible book value per common share $ 214.69 $ 205.15 14
Cautionary Note Regarding Forward-Looking Statements This presentation contains “forward-looking statements” within the meaning of the safe harbor provisions of the U.S. Private Securities Litigation Reform Act of 1995. Forward-looking statements are not historical facts, but instead represent only the firm’s beliefs regarding future events, many of which, by their nature, are inherently uncertain and outside of the firm’s control. It is possible that the firm’s actual results, financial condition and liquidity may differ, possibly materially, from the anticipated results, financial condition and liquidity indicated in these statements. For information about some of the risks and important factors that could affect the firm’s future results, financial condition and liquidity and the forward-looking statements below, see Item 8.01 of the firm’s Report on Form 8-K dated April 15, 2020 and “Risk Factors” in Part I, Item 1A of the firm’s Annual Report on Form 10-K for the year ended December 31, 2019. Information regarding the firm’s assets under supervision, capital ratios, risk-weighted assets, supplementary leverage ratio, balance sheet data and global core liquid assets (GCLA) consists of preliminary estimates. These estimates are forward-looking statements and are subject to change, possibly materially, as the firm completes its financial statements. Statements regarding (i) estimated GDP growth, (ii) the impact of the COVID-19 pandemic on our business, results, financial position and liquidity, (iii) the timing and profitability of business initiatives and the achievability of medium- and long-term targets and goals, (iv) the future state of the firm’s liquidity and regulatory capital ratios, (v) the firm’s prospective capital distributions, (vi) the firm’s future effective income tax rate, and (vii) the firm’s investment banking transaction backlog are forward-looking statements. Statements regarding estimated GDP growth are subject to the risk that actual GDP growth may differ, possibly materially, due to, among other things, changes in general economic conditions. Statements about the effects of the COVID-19 pandemic on the firm’s business, results, financial position and liquidity are subject to the risk that the actual impact may differ, possibly materially, from what is currently expected. Statements about the timing and benefits of business initiatives and the achievability of medium and long-term targets and goals are based on the firm’s current expectations regarding our ability to implement these initiatives and achieve these targets and goals and may change, possibly materially, from what is currently expected. Statements about the future state of the firm’s liquidity and regulatory capital ratios, as well as its prospective capital distributions, are subject to the risk that the firm’s actual liquidity, regulatory capital ratios and capital distributions may differ, possibly materially, from what is currently expected. Statements about the firm’s future effective income tax rate are subject to the risk that the firm’s future effective income tax rate may differ from the anticipated rate indicated, possibly materially, due to, among other things, changes in the firm’s earnings mix or profitability, the entities in which the firm generates profits and the assumptions made in forecasting the firm’s expected tax rate, and potential future guidance from the U.S. IRS. Statements about the firm’s investment banking transaction backlog are subject to the risk that transactions may be modified or not completed at all and associated net revenues may not be realized or may be materially less than those currently expected. Important factors that could have such a result include, for underwriting transactions, a decline or weakness in general economic conditions, an outbreak of hostilities, volatility in the securities markets or an adverse development with respect to the issuer of the securities and, for financial advisory transactions, a decline in the securities markets, an inability to obtain adequate financing, an adverse development with respect to a party to the transaction or a failure to obtain a required regulatory approval. 15Cautionary Note Regarding Forward-Looking Statements This presentation contains “forward-looking statements” within the meaning of the safe harbor provisions of the U.S. Private Securities Litigation Reform Act of 1995. Forward-looking statements are not historical facts, but instead represent only the firm’s beliefs regarding future events, many of which, by their nature, are inherently uncertain and outside of the firm’s control. It is possible that the firm’s actual results, financial condition and liquidity may differ, possibly materially, from the anticipated results, financial condition and liquidity indicated in these statements. For information about some of the risks and important factors that could affect the firm’s future results, financial condition and liquidity and the forward-looking statements below, see Item 8.01 of the firm’s Report on Form 8-K dated April 15, 2020 and “Risk Factors” in Part I, Item 1A of the firm’s Annual Report on Form 10-K for the year ended December 31, 2019. Information regarding the firm’s assets under supervision, capital ratios, risk-weighted assets, supplementary leverage ratio, balance sheet data and global core liquid assets (GCLA) consists of preliminary estimates. These estimates are forward-looking statements and are subject to change, possibly materially, as the firm completes its financial statements. Statements regarding (i) estimated GDP growth, (ii) the impact of the COVID-19 pandemic on our business, results, financial position and liquidity, (iii) the timing and profitability of business initiatives and the achievability of medium- and long-term targets and goals, (iv) the future state of the firm’s liquidity and regulatory capital ratios, (v) the firm’s prospective capital distributions, (vi) the firm’s future effective income tax rate, and (vii) the firm’s investment banking transaction backlog are forward-looking statements. Statements regarding estimated GDP growth are subject to the risk that actual GDP growth may differ, possibly materially, due to, among other things, changes in general economic conditions. Statements about the effects of the COVID-19 pandemic on the firm’s business, results, financial position and liquidity are subject to the risk that the actual impact may differ, possibly materially, from what is currently expected. Statements about the timing and benefits of business initiatives and the achievability of medium and long-term targets and goals are based on the firm’s current expectations regarding our ability to implement these initiatives and achieve these targets and goals and may change, possibly materially, from what is currently expected. Statements about the future state of the firm’s liquidity and regulatory capital ratios, as well as its prospective capital distributions, are subject to the risk that the firm’s actual liquidity, regulatory capital ratios and capital distributions may differ, possibly materially, from what is currently expected. Statements about the firm’s future effective income tax rate are subject to the risk that the firm’s future effective income tax rate may differ from the anticipated rate indicated, possibly materially, due to, among other things, changes in the firm’s earnings mix or profitability, the entities in which the firm generates profits and the assumptions made in forecasting the firm’s expected tax rate, and potential future guidance from the U.S. IRS. Statements about the firm’s investment banking transaction backlog are subject to the risk that transactions may be modified or not completed at all and associated net revenues may not be realized or may be materially less than those currently expected. Important factors that could have such a result include, for underwriting transactions, a decline or weakness in general economic conditions, an outbreak of hostilities, volatility in the securities markets or an adverse development with respect to the issuer of the securities and, for financial advisory transactions, a decline in the securities markets, an inability to obtain adequate financing, an adverse development with respect to a party to the transaction or a failure to obtain a required regulatory approval. 15
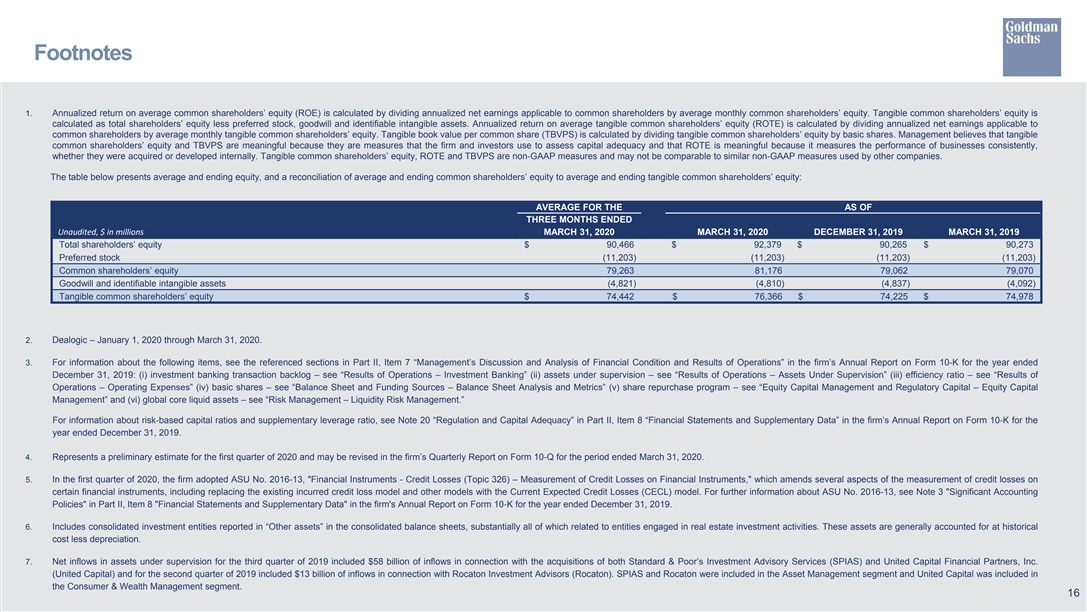
Footnotes 1. Annualized return on average common shareholders’ equity (ROE) is calculated by dividing annualized net earnings applicable to common shareholders by average monthly common shareholders’ equity. Tangible common shareholders’ equity is calculated as total shareholders’ equity less preferred stock, goodwill and identifiable intangible assets. Annualized return on average tangible common shareholders’ equity (ROTE) is calculated by dividing annualized net earnings applicable to common shareholders by average monthly tangible common shareholders’ equity. Tangible book value per common share (TBVPS) is calculated by dividing tangible common shareholders’ equity by basic shares. Management believes that tangible common shareholders’ equity and TBVPS are meaningful because they are measures that the firm and investors use to assess capital adequacy and that ROTE is meaningful because it measures the performance of businesses consistently, whether they were acquired or developed internally. Tangible common shareholders’ equity, ROTE and TBVPS are non-GAAP measures and may not be comparable to similar non-GAAP measures used by other companies. The table below presents average and ending equity, and a reconciliation of average and ending common shareholders’ equity to average and ending tangible common shareholders’ equity: AVERAGE FOR THE AS OF THREE MONTHS ENDED Unaudited, $ in millions MARCH 31, 2020 MARCH 31, 2020 DECEMBER 31, 2019 MARCH 31, 2019 Total shareholders’ equity $ 90,466 $ 92,379 $ 90,265 $ 90,273 Preferred stock (11,203) (11,203) (11,203) (11,203) Common shareholders’ equity 79,263 81,176 79,062 79,070 Goodwill and identifiable intangible assets (4,821) (4,810) (4,837) (4,092) Tangible common shareholders’ equity $ 74,442 $ 76,366 $ 74,225 $ 74,978 2. Dealogic – January 1, 2020 through March 31, 2020. 3. For information about the following items, see the referenced sections in Part II, Item 7 “Management’s Discussion and Analysis of Financial Condition and Results of Operations” in the firm’s Annual Report on Form 10-K for the year ended December 31, 2019: (i) investment banking transaction backlog – see “Results of Operations – Investment Banking” (ii) assets under supervision – see “Results of Operations – Assets Under Supervision” (iii) efficiency ratio – see “Results of Operations – Operating Expenses” (iv) basic shares – see “Balance Sheet and Funding Sources – Balance Sheet Analysis and Metrics” (v) share repurchase program – see “Equity Capital Management and Regulatory Capital – Equity Capital Management” and (vi) global core liquid assets – see “Risk Management – Liquidity Risk Management.” For information about risk-based capital ratios and supplementary leverage ratio, see Note 20 “Regulation and Capital Adequacy” in Part II, Item 8 “Financial Statements and Supplementary Data” in the firm’s Annual Report on Form 10-K for the year ended December 31, 2019. 4. Represents a preliminary estimate for the first quarter of 2020 and may be revised in the firm’s Quarterly Report on Form 10-Q for the period ended March 31, 2020. 5. In the first quarter of 2020, the firm adopted ASU No. 2016-13, Financial Instruments - Credit Losses (Topic 326) – Measurement of Credit Losses on Financial Instruments, which amends several aspects of the measurement of credit losses on certain financial instruments, including replacing the existing incurred credit loss model and other models with the Current Expected Credit Losses (CECL) model. For further information about ASU No. 2016-13, see Note 3 Significant Accounting Policies in Part II, Item 8 Financial Statements and Supplementary Data in the firm's Annual Report on Form 10-K for the year ended December 31, 2019. 6. Includes consolidated investment entities reported in “Other assets” in the consolidated balance sheets, substantially all of which related to entities engaged in real estate investment activities. These assets are generally accounted for at historical cost less depreciation. 7. Net inflows in assets under supervision for the third quarter of 2019 included $58 billion of inflows in connection with the acquisitions of both Standard & Poor’s Investment Advisory Services (SPIAS) and United Capital Financial Partners, Inc. (United Capital) and for the second quarter of 2019 included $13 billion of inflows in connection with Rocaton Investment Advisors (Rocaton). SPIAS and Rocaton were included in the Asset Management segment and United Capital was included in the Consumer & Wealth Management segment. 16Footnotes 1. Annualized return on average common shareholders’ equity (ROE) is calculated by dividing annualized net earnings applicable to common shareholders by average monthly common shareholders’ equity. Tangible common shareholders’ equity is calculated as total shareholders’ equity less preferred stock, goodwill and identifiable intangible assets. Annualized return on average tangible common shareholders’ equity (ROTE) is calculated by dividing annualized net earnings applicable to common shareholders by average monthly tangible common shareholders’ equity. Tangible book value per common share (TBVPS) is calculated by dividing tangible common shareholders’ equity by basic shares. Management believes that tangible common shareholders’ equity and TBVPS are meaningful because they are measures that the firm and investors use to assess capital adequacy and that ROTE is meaningful because it measures the performance of businesses consistently, whether they were acquired or developed internally. Tangible common shareholders’ equity, ROTE and TBVPS are non-GAAP measures and may not be comparable to similar non-GAAP measures used by other companies. The table below presents average and ending equity, and a reconciliation of average and ending common shareholders’ equity to average and ending tangible common shareholders’ equity: AVERAGE FOR THE AS OF THREE MONTHS ENDED Unaudited, $ in millions MARCH 31, 2020 MARCH 31, 2020 DECEMBER 31, 2019 MARCH 31, 2019 Total shareholders’ equity $ 90,466 $ 92,379 $ 90,265 $ 90,273 Preferred stock (11,203) (11,203) (11,203) (11,203) Common shareholders’ equity 79,263 81,176 79,062 79,070 Goodwill and identifiable intangible assets (4,821) (4,810) (4,837) (4,092) Tangible common shareholders’ equity $ 74,442 $ 76,366 $ 74,225 $ 74,978 2. Dealogic – January 1, 2020 through March 31, 2020. 3. For information about the following items, see the referenced sections in Part II, Item 7 “Management’s Discussion and Analysis of Financial Condition and Results of Operations” in the firm’s Annual Report on Form 10-K for the year ended December 31, 2019: (i) investment banking transaction backlog – see “Results of Operations – Investment Banking” (ii) assets under supervision – see “Results of Operations – Assets Under Supervision” (iii) efficiency ratio – see “Results of Operations – Operating Expenses” (iv) basic shares – see “Balance Sheet and Funding Sources – Balance Sheet Analysis and Metrics” (v) share repurchase program – see “Equity Capital Management and Regulatory Capital – Equity Capital Management” and (vi) global core liquid assets – see “Risk Management – Liquidity Risk Management.” For information about risk-based capital ratios and supplementary leverage ratio, see Note 20 “Regulation and Capital Adequacy” in Part II, Item 8 “Financial Statements and Supplementary Data” in the firm’s Annual Report on Form 10-K for the year ended December 31, 2019. 4. Represents a preliminary estimate for the first quarter of 2020 and may be revised in the firm’s Quarterly Report on Form 10-Q for the period ended March 31, 2020. 5. In the first quarter of 2020, the firm adopted ASU No. 2016-13, Financial Instruments - Credit Losses (Topic 326) – Measurement of Credit Losses on Financial Instruments, which amends several aspects of the measurement of credit losses on certain financial instruments, including replacing the existing incurred credit loss model and other models with the Current Expected Credit Losses (CECL) model. For further information about ASU No. 2016-13, see Note 3 Significant Accounting Policies in Part II, Item 8 Financial Statements and Supplementary Data in the firm's Annual Report on Form 10-K for the year ended December 31, 2019. 6. Includes consolidated investment entities reported in “Other assets” in the consolidated balance sheets, substantially all of which related to entities engaged in real estate investment activities. These assets are generally accounted for at historical cost less depreciation. 7. Net inflows in assets under supervision for the third quarter of 2019 included $58 billion of inflows in connection with the acquisitions of both Standard & Poor’s Investment Advisory Services (SPIAS) and United Capital Financial Partners, Inc. (United Capital) and for the second quarter of 2019 included $13 billion of inflows in connection with Rocaton Investment Advisors (Rocaton). SPIAS and Rocaton were included in the Asset Management segment and United Capital was included in the Consumer & Wealth Management segment. 16