
HE 8-K
Hawaiian Electric Industries Inc (HE)
8-K
2026-09-08
For: 2026-09-08
View Original
Added on
September 08, 2026
UNITED STATES
SECURITIES AND EXCHANGE COMMISSION
Washington, D.C. 20549
FORM 8-K
CURRENT REPORT
Pursuant to Section 13 or 15(d) of the
Securities Exchange Act of 1934
Date of Report: September 8, 2026
| Exact Name of Registrant | Commission | I.R.S. Employer | ||||||
| as Specified in Its Charter | File Number | Identification No. | ||||||
State of Hawaii
(State or other jurisdiction of incorporation)
(Address of principal executive offices and zip code)
Registrant’s telephone number, including area code:
(808 ) 543-5662 - HEI
(808 ) 543-7771 - Hawaiian Electric
Not applicable
(Former name or former address, if changed since last report.)
Check the appropriate box below if the Form 8-K filing is intended to simultaneously satisfy the filing obligation of the registrant under any of the following provisions:
Securities registered pursuant to 12(b) of the Act:
| Registrant | Title of each class | Trading Symbol(s) | Name of each exchange on which registered | ||||||||
| Hawaiian Electric Industries, Inc. | |||||||||||
Indicate by check mark whether the registrant is an emerging growth company as defined in Rule 405 of the Securities Act of 1933 (§230.405 of this chapter) or Rule12b-2 of the Securities Act of 1934 (§240.12b-2 of this chapter).
Emerging growth company
| Hawaiian Electric Industries, Inc. | Hawaiian Electric Company, Inc. | ||||||||||
If an emerging growth company, indicate by check mark if the registrant has elected not to use the extended transition period for complying with any new or revised financial accounting standards provided pursuant to Section 13(a) of the Exchange Act.
| Hawaiian Electric Industries, Inc. | ☐ | Hawaiian Electric Company, Inc. | ☐ | ||||||||
Item 7.01 Regulation FD Disclosure.
In accordance with Regulation FD, Hawaiian Electric Industries, Inc. (the “Company”) hereby furnishes a presentation that the Company intends to use with investors, analysts and others beginning on or after September 8, 2026. Such presentation is attached to this Current Report on Form 8-K as Exhibit 99. A copy of the investor presentation is posted on the Company’s website at www.hei.com.
Item 9.01 Financial Statements and Exhibits.
(d) Exhibits | |||||
| September 2026 Investor Meetings | |||||
| 104 | Cover Page Interactive Data File (embedded within the Inline XBRL document) | ||||
The information furnished in connection with this current report on Form 8-K shall not be deemed “filed” for purposes of Section 18 of the Securities Exchange Act of 1934, as amended (the Exchange Act), or incorporated by reference in any filing under the Securities Act of 1933, as amended, or the Exchange Act, except as shall be expressly set forth by specific reference in such a filing.
1
SIGNATURES
Pursuant to the requirements of the Securities Exchange Act of 1934, the Registrants have duly caused this report to be signed on their behalf by the undersigned thereunto duly authorized. The signature of the undersigned companies shall be deemed to relate only to matters having reference to such companies and any subsidiaries thereof.
| HAWAIIAN ELECTRIC INDUSTRIES, INC. | HAWAIIAN ELECTRIC COMPANY, INC. | |||||||
| (Registrant) | (Registrant) | |||||||
| /s/ Paul K. Ito | /s/ Paul K. Ito | |||||||
| Paul K. Ito | Paul K. Ito | |||||||
| Senior Vice President and | Senior Vice President, | |||||||
| Chief Financial Officer | Chief Financial Officer and Treasurer | |||||||
| Date: September 8, 2026 | Date: September 8, 2026 | |||||||
2

HEI September 2026 Investor Meetings
Non-GAAP Financial Information This presentation refers to certain financial measures that were not prepared in accordance with U.S. generally accepted accounting principles, including Core Earnings Per Share (EPS), Core Net Income and other Core measures. Reconciliations of those non-GAAP financial measures to the most directly comparable GAAP financial measures can be found in the Appendix herein. See Appendix for definition of Core Earnings and Core EPS. This report and other presentations made by Hawaiian Electric Industries, Inc. (HEI) and Hawaiian Electric Company, Inc. (Hawaiian Electric) and their subsidiaries (collectively, the Company) contain “forward-looking statements.” These forward-looking statements are not guarantees of future performance and actual results and financial condition may differ materially from those indicated in the forward-looking statements. Factors that could cause actual results to differ materially from expectations can be found in the appendix herein, in the Company’s SEC filings and in the Investor Relations section of the Company’s website. 2
3 Topics of Focus HEI at a Glance Regulatory framework provides steady, predictable revenues, with rate rebasing underway Implementing industry leading wildfire mitigation efforts and reducing operating risk 1 3 2 Strong balance sheet and liquidity with improving credit metrics4 Executing through historic capital cycle5
4 Topics of Focus HEI at a Glance Regulatory framework provides steady, predictable revenues, with rate rebasing underway Implementing industry leading wildfire mitigation efforts and reducing operating risk 1 3 2 Strong balance sheet and liquidity with improving credit metrics4 Executing through historic capital cycle5
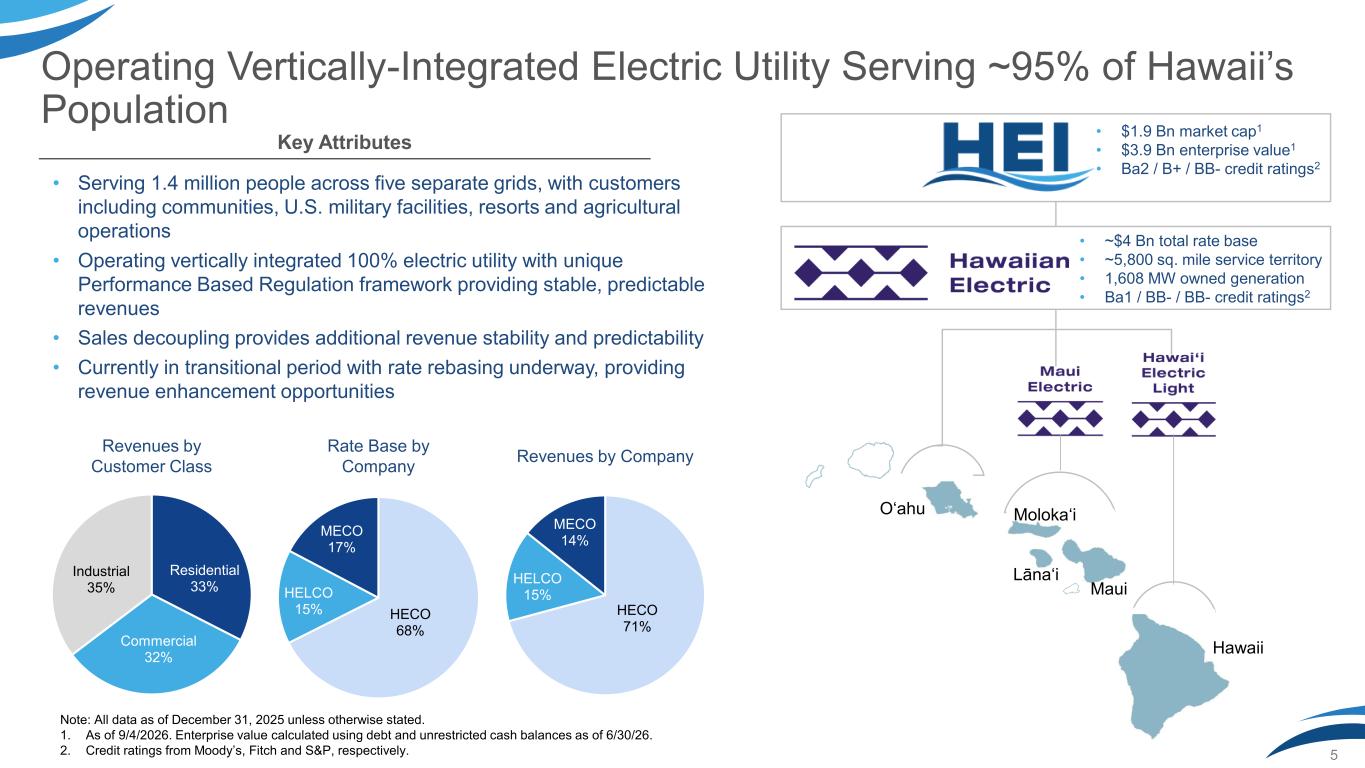
HECO 71% HELCO 15% MECO 14% • ~$4 Bn total rate base • ~5,800 sq. mile service territory • 1,608 MW owned generation • Ba1 / BB- / BB- credit ratings2 Hawaii Maui Lānaʻi Oʻahu Operating Vertically-Integrated Electric Utility Serving ~95% of Hawaii’s Population 5 Note: All data as of December 31, 2025 unless otherwise stated. 1. As of 9/4/2026. Enterprise value calculated using debt and unrestricted cash balances as of 6/30/26. 2. Credit ratings from Moody’s, Fitch and S&P, respectively. Key Attributes • Serving 1.4 million people across five separate grids, with customers including communities, U.S. military facilities, resorts and agricultural operations • Operating vertically integrated 100% electric utility with unique Performance Based Regulation framework providing stable, predictable revenues • Sales decoupling provides additional revenue stability and predictability • Currently in transitional period with rate rebasing underway, providing revenue enhancement opportunities • $1.9 Bn market cap1 • $3.9 Bn enterprise value1 • Ba2 / B+ / BB- credit ratings2 Residential 33% Commercial 32% Industrial 35% Revenues by Customer Class Rate Base by Company Revenues by Company HECO 68% HELCO 15% MECO 17% Molokaʻi
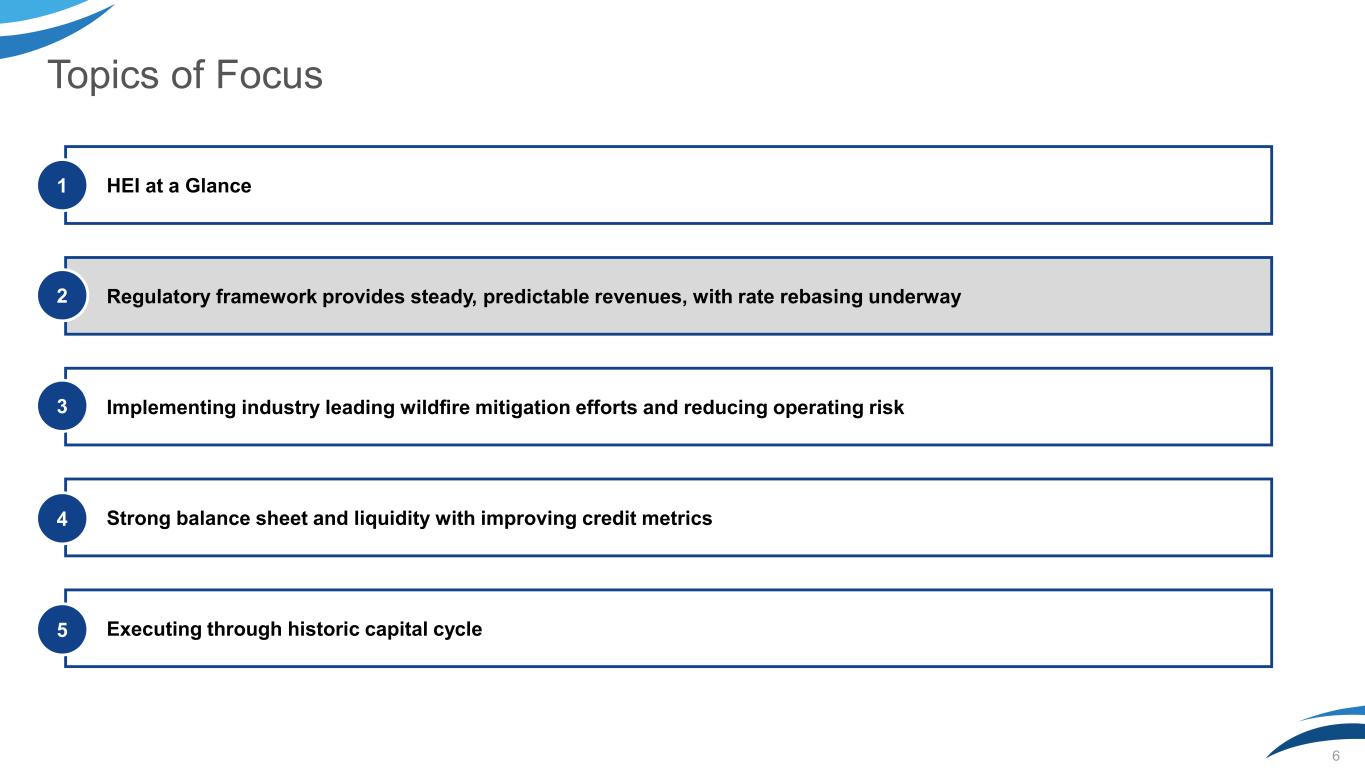
6 Topics of Focus HEI at a Glance Regulatory framework provides steady, predictable revenues, with rate rebasing underway Implementing industry leading wildfire mitigation efforts and reducing operating risk 1 3 2 Strong balance sheet and liquidity with improving credit metrics4 Executing through historic capital cycle5
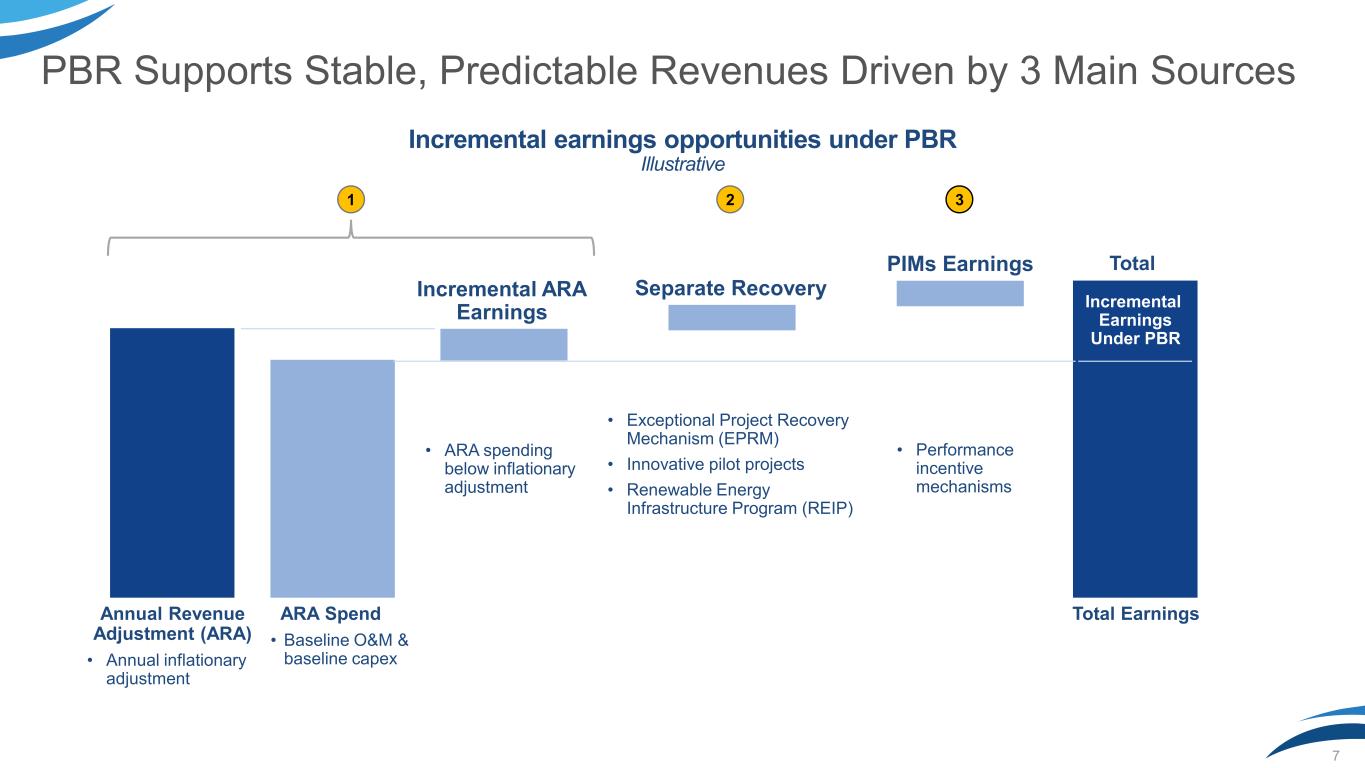
PBR Supports Stable, Predictable Revenues Driven by 3 Main Sources 7 Incremental earnings opportunities under PBR Illustrative Total • ARA spending below inflationary adjustment Annual Revenue Adjustment (ARA) • Annual inflationary adjustment Total Earnings Separate RecoveryIncremental ARA Earnings PIMs Earnings ARA Spend • Baseline O&M & baseline capex • Exceptional Project Recovery Mechanism (EPRM) • Innovative pilot projects • Renewable Energy Infrastructure Program (REIP) • Performance incentive mechanisms Incremental Earnings Under PBR 1 2 3
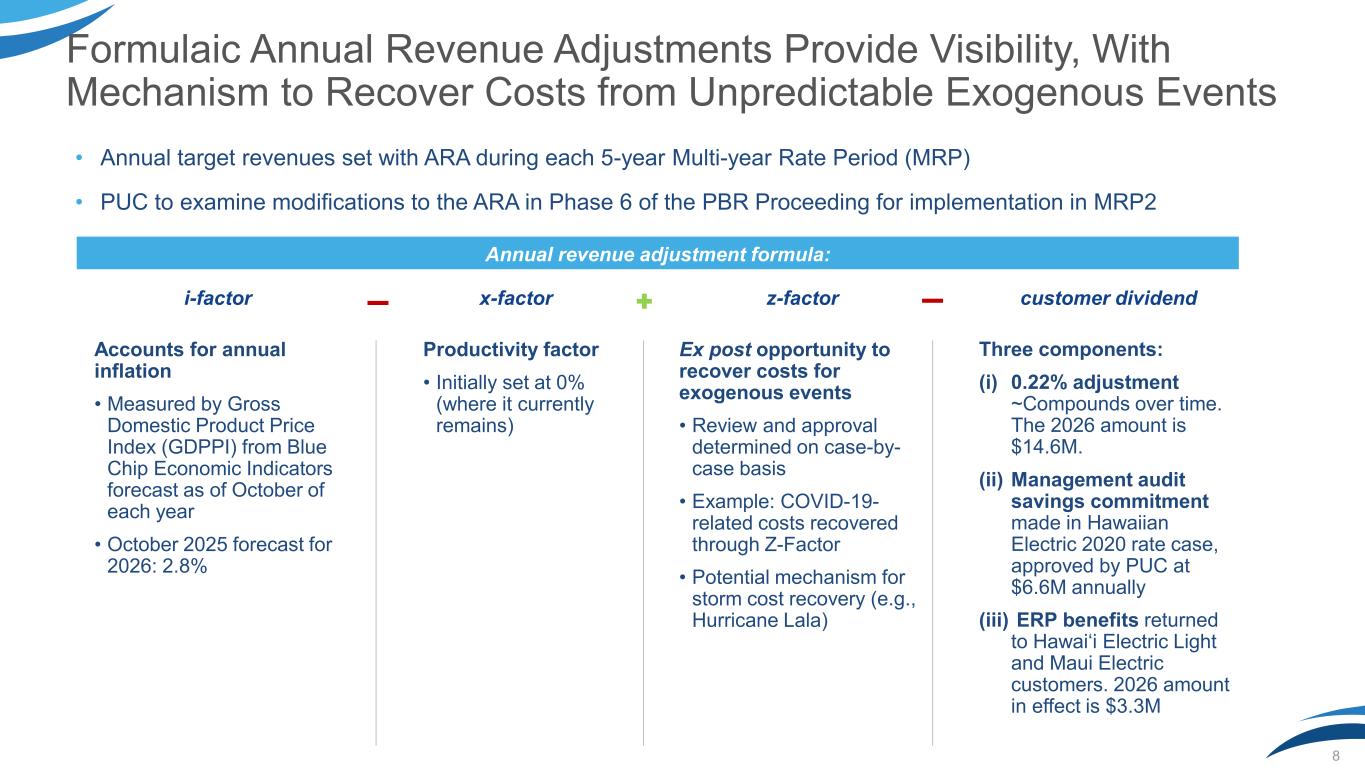
Formulaic Annual Revenue Adjustments Provide Visibility, With Mechanism to Recover Costs from Unpredictable Exogenous Events Annual revenue adjustment formula: i-factor x-factor z-factor customer dividend Accounts for annual inflation • Measured by Gross Domestic Product Price Index (GDPPI) from Blue Chip Economic Indicators forecast as of October of each year • October 2025 forecast for 2026: 2.8% Productivity factor • Initially set at 0% (where it currently remains) Ex post opportunity to recover costs for exogenous events • Review and approval determined on case-by- case basis • Example: COVID-19- related costs recovered through Z-Factor • Potential mechanism for storm cost recovery (e.g., Hurricane Lala) Three components: (i) 0.22% adjustment ~Compounds over time. The 2026 amount is $14.6M. (ii) Management audit savings commitment made in Hawaiian Electric 2020 rate case, approved by PUC at $6.6M annually (iii) ERP benefits returned to Hawai‘i Electric Light and Maui Electric customers. 2026 amount in effect is $3.3M 8 • Annual target revenues set with ARA during each 5-year Multi-year Rate Period (MRP) • PUC to examine modifications to the ARA in Phase 6 of the PBR Proceeding for implementation in MRP2
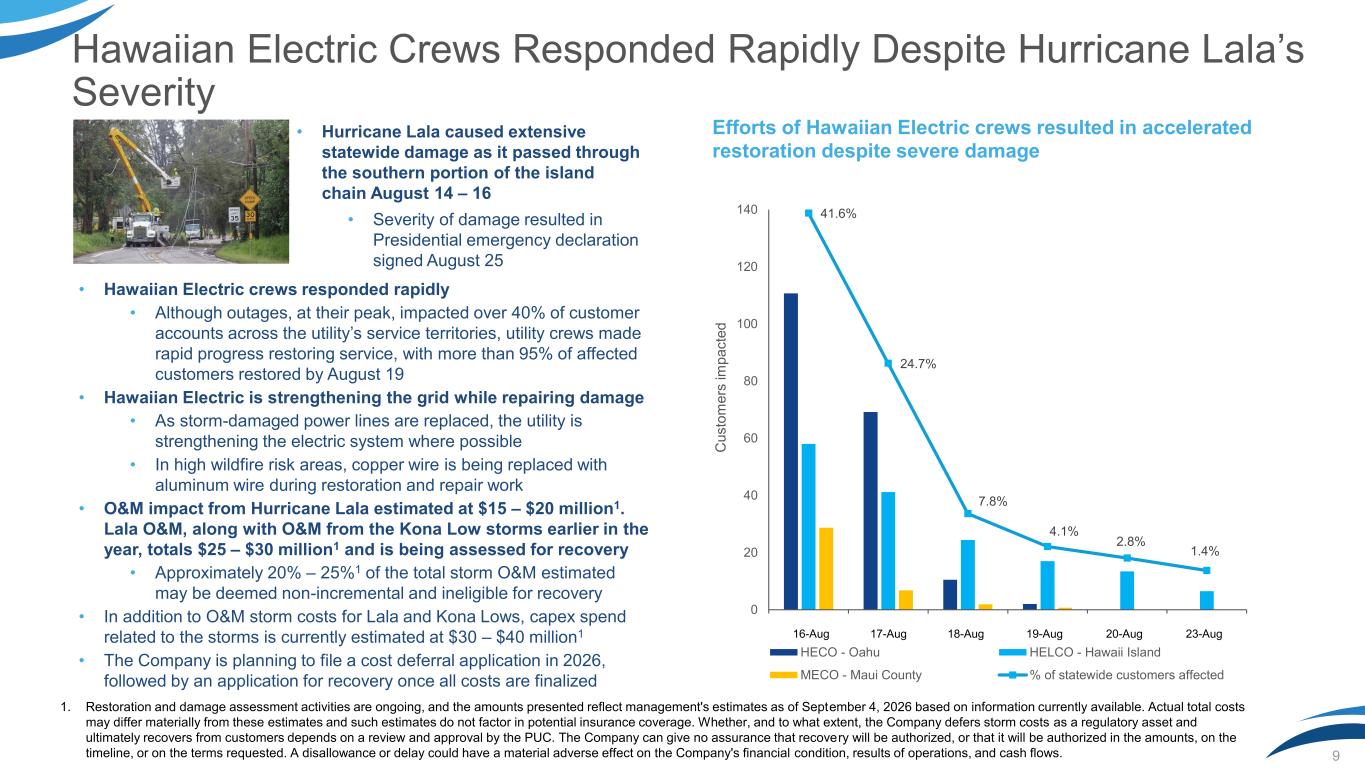
Hawaiian Electric Crews Responded Rapidly Despite Hurricane Lala’s Severity 9 • Hawaiian Electric crews responded rapidly • Although outages, at their peak, impacted over 40% of customer accounts across the utility’s service territories, utility crews made rapid progress restoring service, with more than 95% of affected customers restored by August 19 • Hawaiian Electric is strengthening the grid while repairing damage • As storm-damaged power lines are replaced, the utility is strengthening the electric system where possible • In high wildfire risk areas, copper wire is being replaced with aluminum wire during restoration and repair work • O&M impact from Hurricane Lala estimated at $15 – $20 million1. Lala O&M, along with O&M from the Kona Low storms earlier in the year, totals $25 – $30 million1 and is being assessed for recovery • Approximately 20% – 25%1 of the total storm O&M estimated may be deemed non-incremental and ineligible for recovery • In addition to O&M storm costs for Lala and Kona Lows, capex spend related to the storms is currently estimated at $30 – $40 million1 • The Company is planning to file a cost deferral application in 2026, followed by an application for recovery once all costs are finalized 41.6% 24.7% 7.8% 4.1% 2.8% 1.4% 0 20 40 60 80 100 120 140 1.0 2.0 3.0 4.0 5.0 6.0 HECO - Oahu HELCO - Hawaii Island MECO - Maui County % of statewide customers affected 16-Aug 17-Aug 18-Aug 19-Aug 20-Aug 23-Aug Efforts of Hawaiian Electric crews resulted in accelerated restoration despite severe damage C u s to m e rs i m p a c te d • Hurricane Lala caused extensive statewide damage as it passed through the southern portion of the island chain August 14 – 16 • Severity of damage resulted in Presidential emergency declaration signed August 25 1. Restoration and damage assessment activities are ongoing, and the amounts presented reflect management's estimates as of September 4, 2026 based on information currently available. Actual total costs may differ materially from these estimates and such estimates do not factor in potential insurance coverage. Whether, and to what extent, the Company defers storm costs as a regulatory asset and ultimately recovers from customers depends on a review and approval by the PUC. The Company can give no assurance that recovery will be authorized, or that it will be authorized in the amounts, on the timeline, or on the terms requested. A disallowance or delay could have a material adverse effect on the Company's financial condition, results of operations, and cash flows.
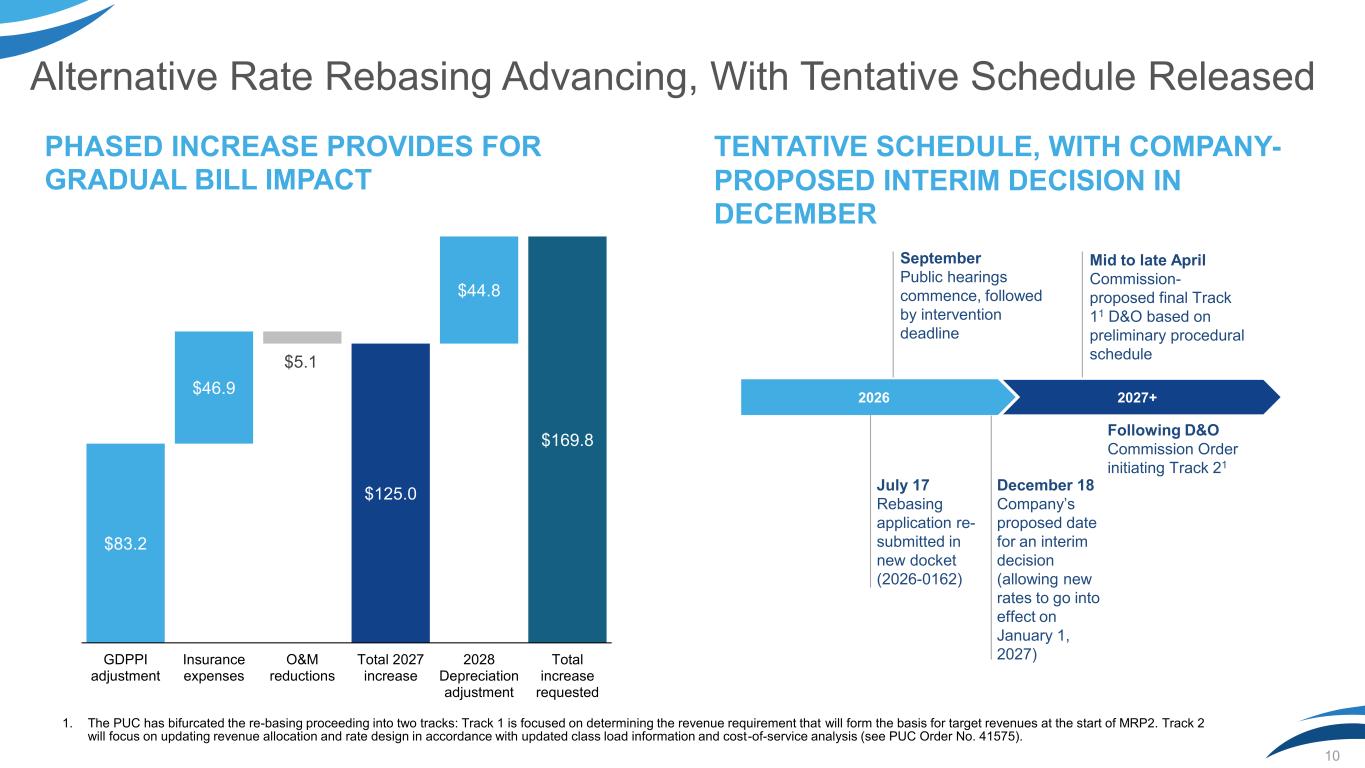
10 Alternative Rate Rebasing Advancing, With Tentative Schedule Released PHASED INCREASE PROVIDES FOR GRADUAL BILL IMPACT TENTATIVE SCHEDULE, WITH COMPANY- PROPOSED INTERIM DECISION IN DECEMBER $83.2 $125.0 $169.8 $46.9 $5.1 $44.8 GDPPI adjustment Insurance expenses O&M reductions Total 2027 increase 2028 Depreciation adjustment Total increase requested 2027+2026 July 17 Rebasing application re- submitted in new docket (2026-0162) December 18 Company’s proposed date for an interim decision (allowing new rates to go into effect on January 1, 2027) September Public hearings commence, followed by intervention deadline Mid to late April Commission- proposed final Track 11 D&O based on preliminary procedural schedule Following D&O Commission Order initiating Track 21 1. The PUC has bifurcated the re-basing proceeding into two tracks: Track 1 is focused on determining the revenue requirement that will form the basis for target revenues at the start of MRP2. Track 2 will focus on updating revenue allocation and rate design in accordance with updated class load information and cost-of-service analysis (see PUC Order No. 41575).
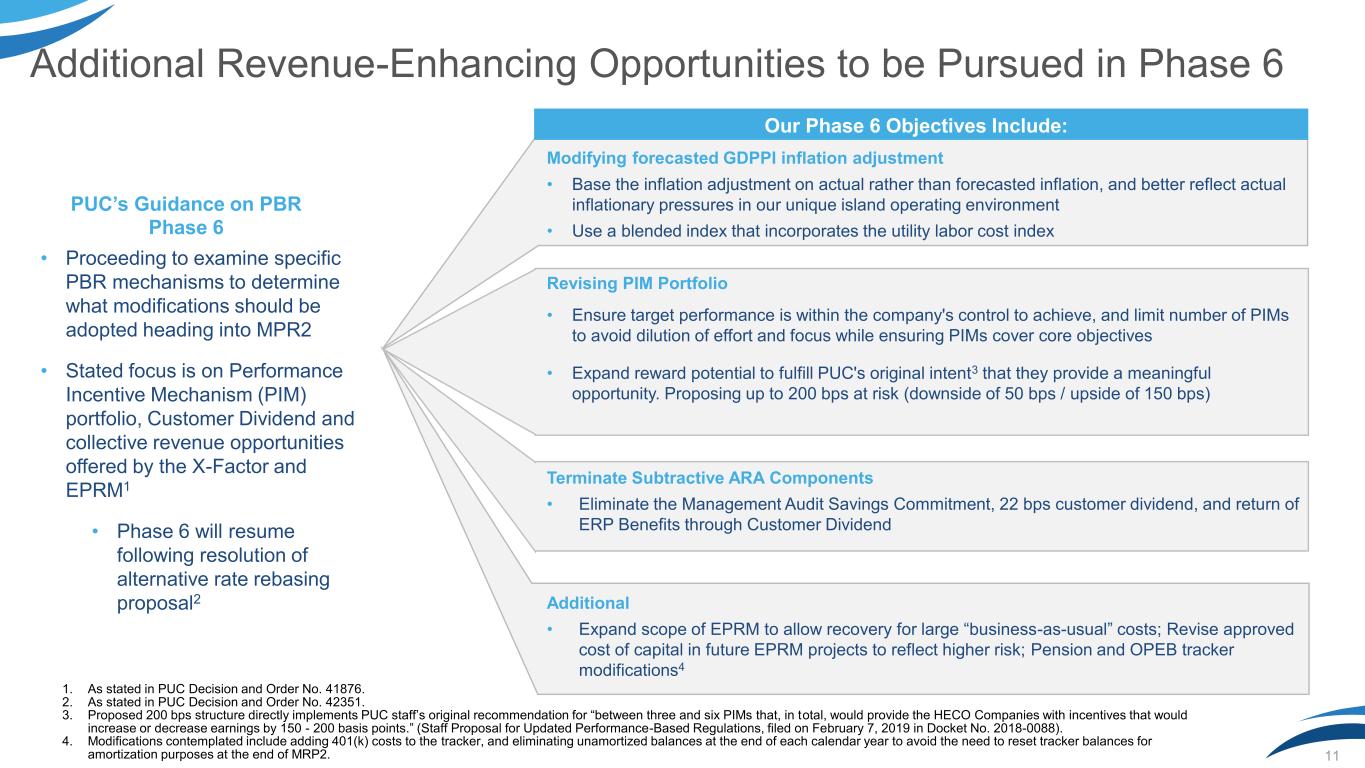
Modifying forecasted GDPPI inflation adjustment • Base the inflation adjustment on actual rather than forecasted inflation, and better reflect actual inflationary pressures in our unique island operating environment • Use a blended index that incorporates the utility labor cost index Revising PIM Portfolio • Ensure target performance is within the company's control to achieve, and limit number of PIMs to avoid dilution of effort and focus while ensuring PIMs cover core objectives • Expand reward potential to fulfill PUC's original intent3 that they provide a meaningful opportunity. Proposing up to 200 bps at risk (downside of 50 bps / upside of 150 bps) Terminate Subtractive ARA Components • Eliminate the Management Audit Savings Commitment, 22 bps customer dividend, and return of ERP Benefits through Customer Dividend Additional • Expand scope of EPRM to allow recovery for large “business-as-usual” costs; Revise approved cost of capital in future EPRM projects to reflect higher risk; Pension and OPEB tracker modifications4 11 Additional Revenue-Enhancing Opportunities to be Pursued in Phase 6 PUC’s Guidance on PBR Phase 6 • Proceeding to examine specific PBR mechanisms to determine what modifications should be adopted heading into MPR2 • Stated focus is on Performance Incentive Mechanism (PIM) portfolio, Customer Dividend and collective revenue opportunities offered by the X-Factor and EPRM1 • Phase 6 will resume following resolution of alternative rate rebasing proposal2 1. As stated in PUC Decision and Order No. 41876. 2. As stated in PUC Decision and Order No. 42351. 3. Proposed 200 bps structure directly implements PUC staff’s original recommendation for “between three and six PIMs that, in total, would provide the HECO Companies with incentives that would increase or decrease earnings by 150 - 200 basis points.” (Staff Proposal for Updated Performance-Based Regulations, filed on February 7, 2019 in Docket No. 2018-0088). 4. Modifications contemplated include adding 401(k) costs to the tracker, and eliminating unamortized balances at the end of each calendar year to avoid the need to reset tracker balances for amortization purposes at the end of MRP2. Our Phase 6 Objectives Include:
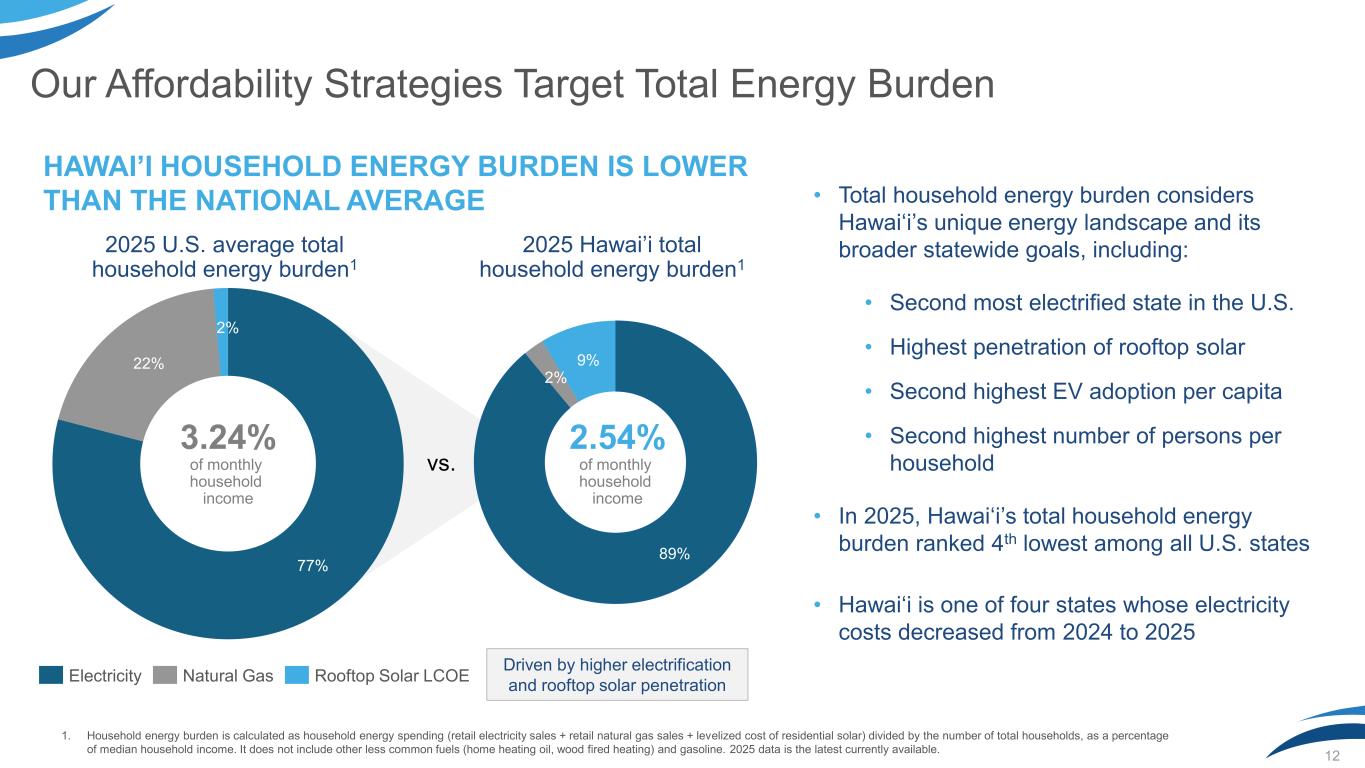
12 Our Affordability Strategies Target Total Energy Burden 3.24% of monthly household income • Total household energy burden considers Hawaiʻi’s unique energy landscape and its broader statewide goals, including: • Second most electrified state in the U.S. • Highest penetration of rooftop solar • Second highest EV adoption per capita • Second highest number of persons per household • In 2025, Hawaiʻi’s total household energy burden ranked 4th lowest among all U.S. states • Hawaiʻi is one of four states whose electricity costs decreased from 2024 to 2025 HAWAI’I HOUSEHOLD ENERGY BURDEN IS LOWER THAN THE NATIONAL AVERAGE 2.54% of monthly household income 2025 Hawai’i total household energy burden1 89% 77% 9%22% 2% 2% 1. Household energy burden is calculated as household energy spending (retail electricity sales + retail natural gas sales + levelized cost of residential solar) divided by the number of total households, as a percentage of median household income. It does not include other less common fuels (home heating oil, wood fired heating) and gasoline. 2025 data is the latest currently available. vs. Driven by higher electrification and rooftop solar penetration 2025 U.S. average total household energy burden1 Rooftop Solar LCOENatural GasElectricity
13 Topics of Focus HEI at a Glance Regulatory framework provides steady, predictable revenues, with rate rebasing underway Implementing industry leading wildfire mitigation efforts and reducing operating risk 1 3 2 Strong balance sheet and liquidity with improving credit metrics4 Executing through historic capital cycle5
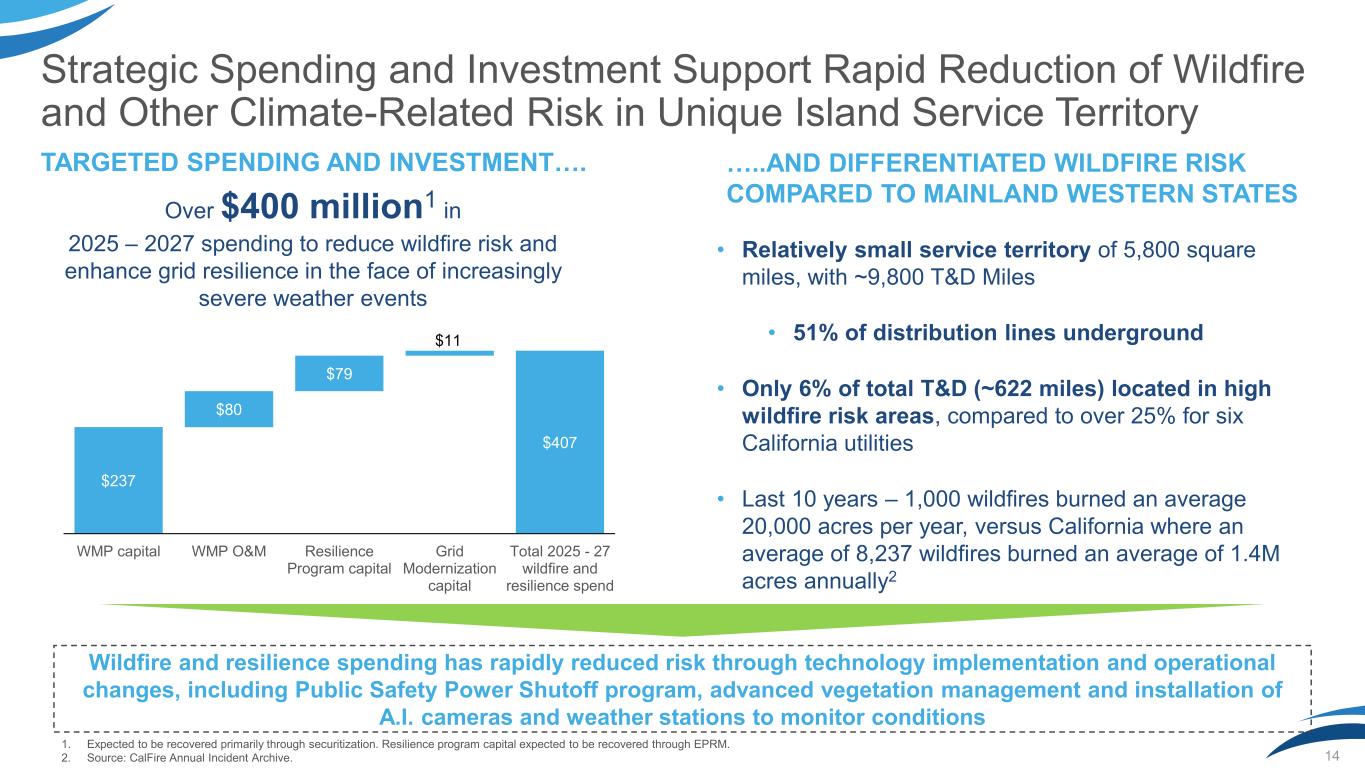
Strategic Spending and Investment Support Rapid Reduction of Wildfire and Other Climate-Related Risk in Unique Island Service Territory 14 TARGETED SPENDING AND INVESTMENT…. …..AND DIFFERENTIATED WILDFIRE RISK COMPARED TO MAINLAND WESTERN STATES Over $400 million1 in 2025 – 2027 spending to reduce wildfire risk and enhance grid resilience in the face of increasingly severe weather events $237 $407 $80 $79 $11 WMP capital WMP O&M Resilience Program capital Grid Modernization capital Total 2025 - 27 wildfire and resilience spend • Relatively small service territory of 5,800 square miles, with ~9,800 T&D Miles • 51% of distribution lines underground • Only 6% of total T&D (~622 miles) located in high wildfire risk areas, compared to over 25% for six California utilities • Last 10 years – 1,000 wildfires burned an average 20,000 acres per year, versus California where an average of 8,237 wildfires burned an average of 1.4M acres annually2 Wildfire and resilience spending has rapidly reduced risk through technology implementation and operational changes, including Public Safety Power Shutoff program, advanced vegetation management and installation of A.I. cameras and weather stations to monitor conditions 1. Expected to be recovered primarily through securitization. Resilience program capital expected to be recovered through EPRM. 2. Source: CalFire Annual Incident Archive.
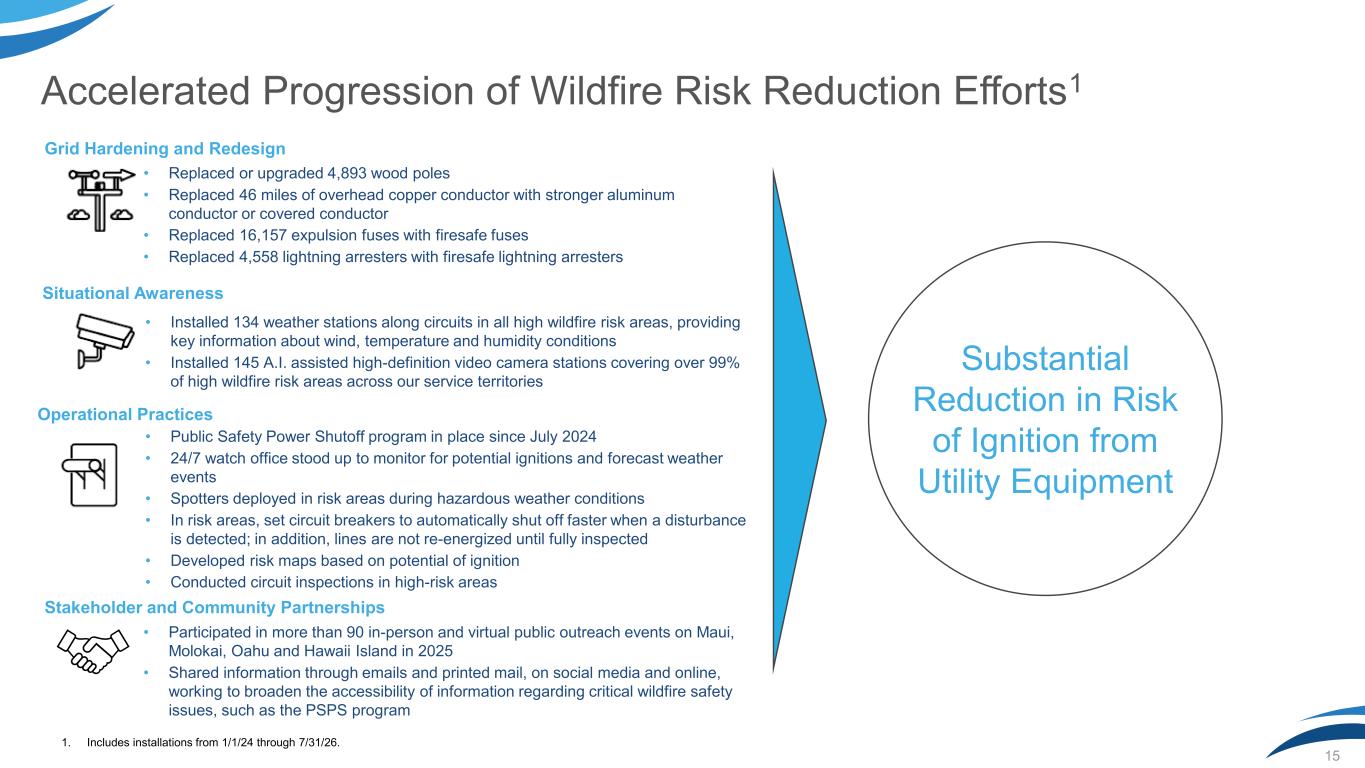
Accelerated Progression of Wildfire Risk Reduction Efforts1 15 • Installed 134 weather stations along circuits in all high wildfire risk areas, providing key information about wind, temperature and humidity conditions • Installed 145 A.I. assisted high-definition video camera stations covering over 99% of high wildfire risk areas across our service territories Situational Awareness • Replaced or upgraded 4,893 wood poles • Replaced 46 miles of overhead copper conductor with stronger aluminum conductor or covered conductor • Replaced 16,157 expulsion fuses with firesafe fuses • Replaced 4,558 lightning arresters with firesafe lightning arresters Grid Hardening and Redesign • Public Safety Power Shutoff program in place since July 2024 • 24/7 watch office stood up to monitor for potential ignitions and forecast weather events • Spotters deployed in risk areas during hazardous weather conditions • In risk areas, set circuit breakers to automatically shut off faster when a disturbance is detected; in addition, lines are not re-energized until fully inspected • Developed risk maps based on potential of ignition • Conducted circuit inspections in high-risk areas Operational Practices • Participated in more than 90 in-person and virtual public outreach events on Maui, Molokai, Oahu and Hawaii Island in 2025 • Shared information through emails and printed mail, on social media and online, working to broaden the accessibility of information regarding critical wildfire safety issues, such as the PSPS program Stakeholder and Community Partnerships Substantial Reduction in Risk of Ignition from Utility Equipment 1. Includes installations from 1/1/24 through 7/31/26.
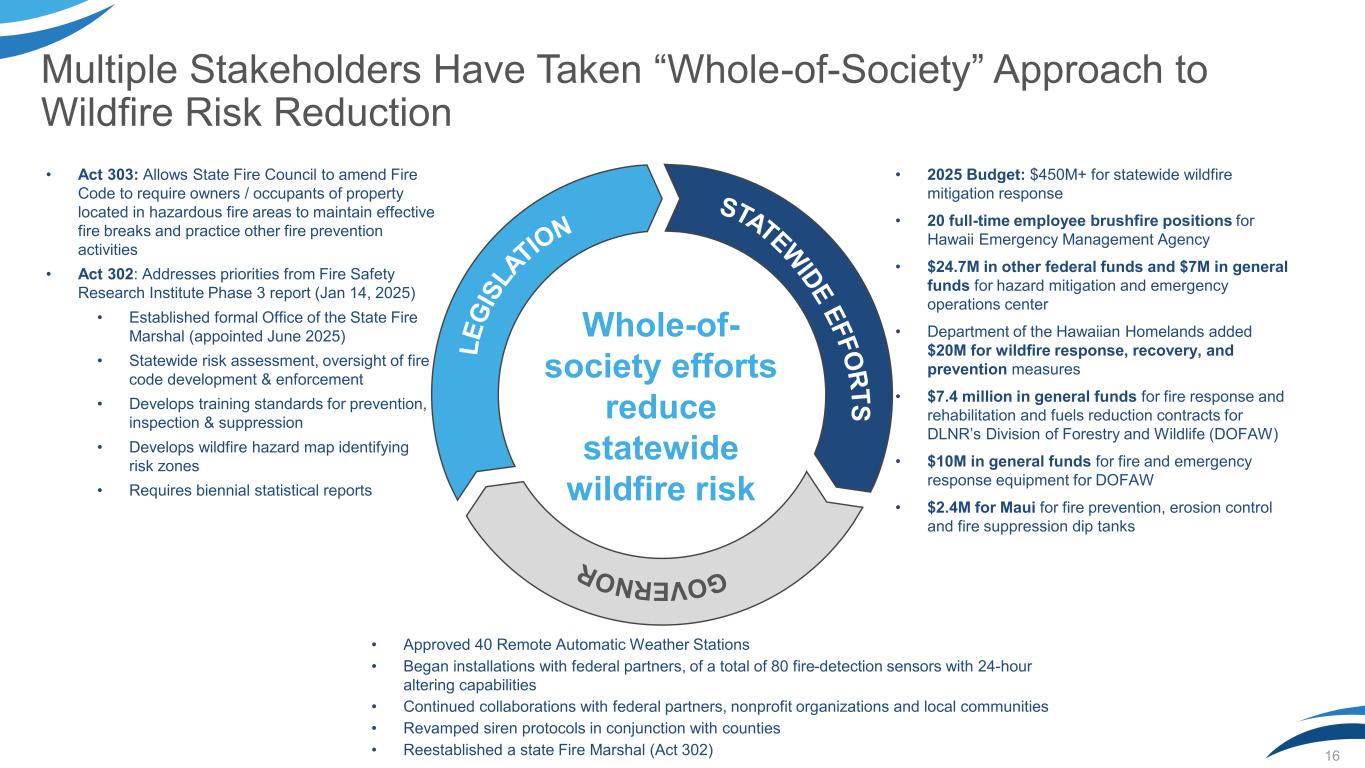
Multiple Stakeholders Have Taken “Whole-of-Society” Approach to Wildfire Risk Reduction 16 • Act 303: Allows State Fire Council to amend Fire Code to require owners / occupants of property located in hazardous fire areas to maintain effective fire breaks and practice other fire prevention activities • Act 302: Addresses priorities from Fire Safety Research Institute Phase 3 report (Jan 14, 2025) • Established formal Office of the State Fire Marshal (appointed June 2025) • Statewide risk assessment, oversight of fire code development & enforcement • Develops training standards for prevention, inspection & suppression • Develops wildfire hazard map identifying risk zones • Requires biennial statistical reports L E G IS L AT IO N GOVERNOR STATEW ID E E F F O R T S • Approved 40 Remote Automatic Weather Stations • Began installations with federal partners, of a total of 80 fire-detection sensors with 24-hour altering capabilities • Continued collaborations with federal partners, nonprofit organizations and local communities • Revamped siren protocols in conjunction with counties • Reestablished a state Fire Marshal (Act 302) • 2025 Budget: $450M+ for statewide wildfire mitigation response • 20 full-time employee brushfire positions for Hawaii Emergency Management Agency • $24.7M in other federal funds and $7M in general funds for hazard mitigation and emergency operations center • Department of the Hawaiian Homelands added $20M for wildfire response, recovery, and prevention measures • $7.4 million in general funds for fire response and rehabilitation and fuels reduction contracts for DLNR’s Division of Forestry and Wildlife (DOFAW) • $10M in general funds for fire and emergency response equipment for DOFAW • $2.4M for Maui for fire prevention, erosion control and fire suppression dip tanks Whole-of- society efforts reduce statewide wildfire risk
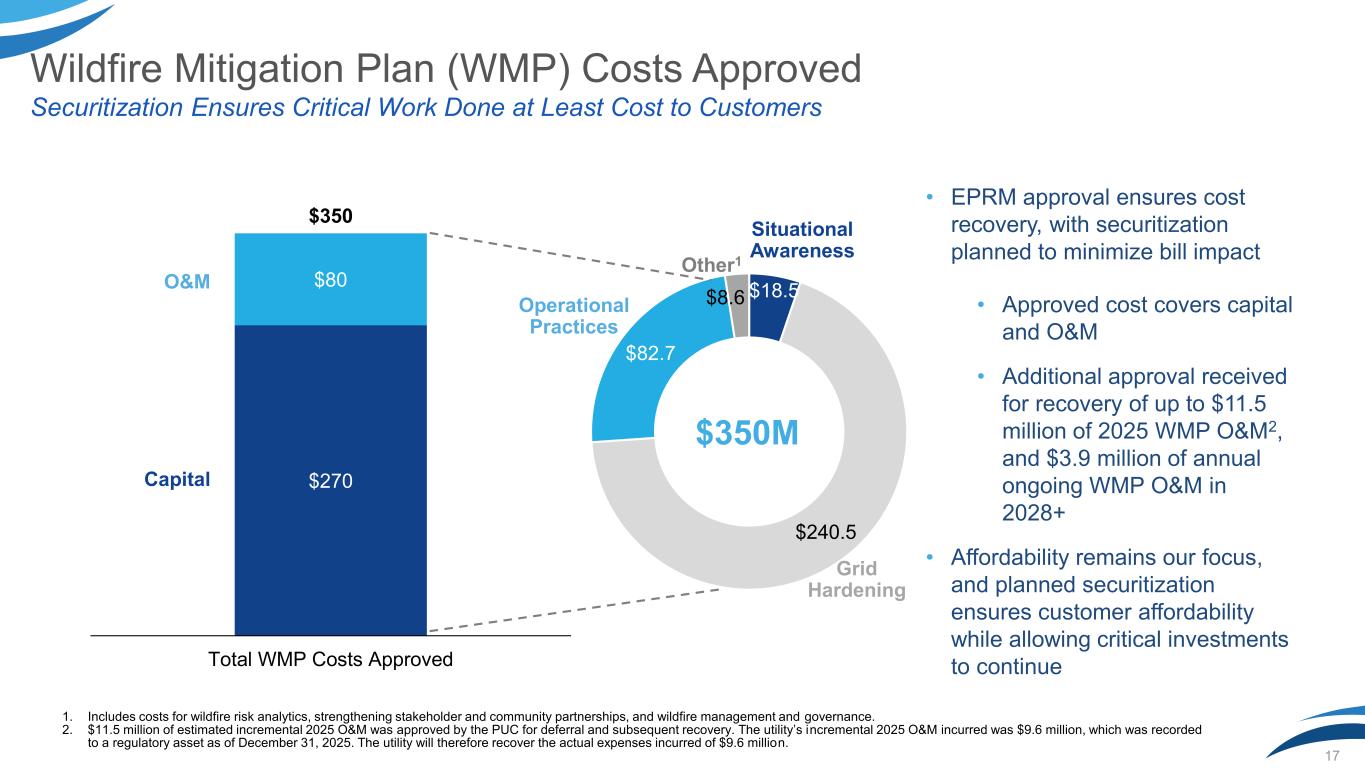
17 Wildfire Mitigation Plan (WMP) Costs Approved Securitization Ensures Critical Work Done at Least Cost to Customers $270 $80 $350 Total WMP Costs Approved O&M Capital $18.5 $240.5 $82.7 $8.6 • EPRM approval ensures cost recovery, with securitization planned to minimize bill impact • Approved cost covers capital and O&M • Additional approval received for recovery of up to $11.5 million of 2025 WMP O&M2, and $3.9 million of annual ongoing WMP O&M in 2028+ • Affordability remains our focus, and planned securitization ensures customer affordability while allowing critical investments to continue Grid Hardening Operational Practices Situational Awareness Other1 $350M 1. Includes costs for wildfire risk analytics, strengthening stakeholder and community partnerships, and wildfire management and governance. 2. $11.5 million of estimated incremental 2025 O&M was approved by the PUC for deferral and subsequent recovery. The utility’s incremental 2025 O&M incurred was $9.6 million, which was recorded to a regulatory asset as of December 31, 2025. The utility will therefore recover the actual expenses incurred of $9.6 million.
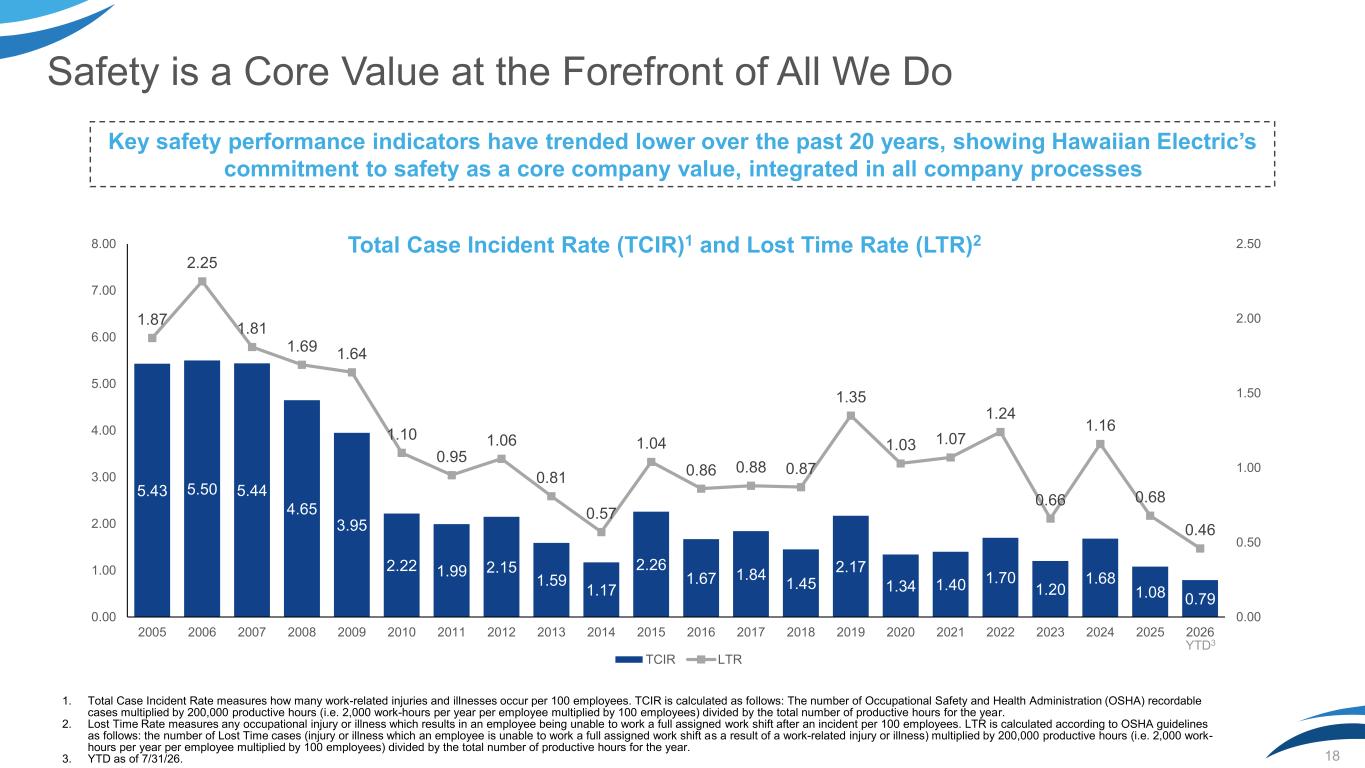
18 Safety is a Core Value at the Forefront of All We Do 1. Total Case Incident Rate measures how many work-related injuries and illnesses occur per 100 employees. TCIR is calculated as follows: The number of Occupational Safety and Health Administration (OSHA) recordable cases multiplied by 200,000 productive hours (i.e. 2,000 work-hours per year per employee multiplied by 100 employees) divided by the total number of productive hours for the year. 2. Lost Time Rate measures any occupational injury or illness which results in an employee being unable to work a full assigned work shift after an incident per 100 employees. LTR is calculated according to OSHA guidelines as follows: the number of Lost Time cases (injury or illness which an employee is unable to work a full assigned work shift as a result of a work-related injury or illness) multiplied by 200,000 productive hours (i.e. 2,000 work- hours per year per employee multiplied by 100 employees) divided by the total number of productive hours for the year. 3. YTD as of 7/31/26. 5.43 5.50 5.44 4.65 3.95 2.22 1.99 2.15 1.59 1.17 2.26 1.67 1.84 1.45 2.17 1.34 1.40 1.70 1.20 1.68 1.08 0.79 1.87 2.25 1.81 1.69 1.64 1.10 0.95 1.06 0.81 0.57 1.04 0.86 0.88 0.87 1.35 1.03 1.07 1.24 0.66 1.16 0.68 0.46 0.00 0.50 1.00 1.50 2.00 2.50 0.00 1.00 2.00 3.00 4.00 5.00 6.00 7.00 8.00 2005 2006 2007 2008 2009 2010 2011 2012 2013 2014 2015 2016 2017 2018 2019 2020 2021 2022 2023 2024 2025 2026 TCIR LTR Total Case Incident Rate (TCIR)1 and Lost Time Rate (LTR)2 Key safety performance indicators have trended lower over the past 20 years, showing Hawaiian Electric’s commitment to safety as a core company value, integrated in all company processes YTD3
19 Topics of Focus HEI at a Glance Regulatory framework provides steady, predictable revenues, with rate rebasing underway Implementing industry leading wildfire mitigation efforts and reducing operating risk 1 3 2 Strong balance sheet and liquidity with improving credit metrics4 Executing through historic capital cycle5
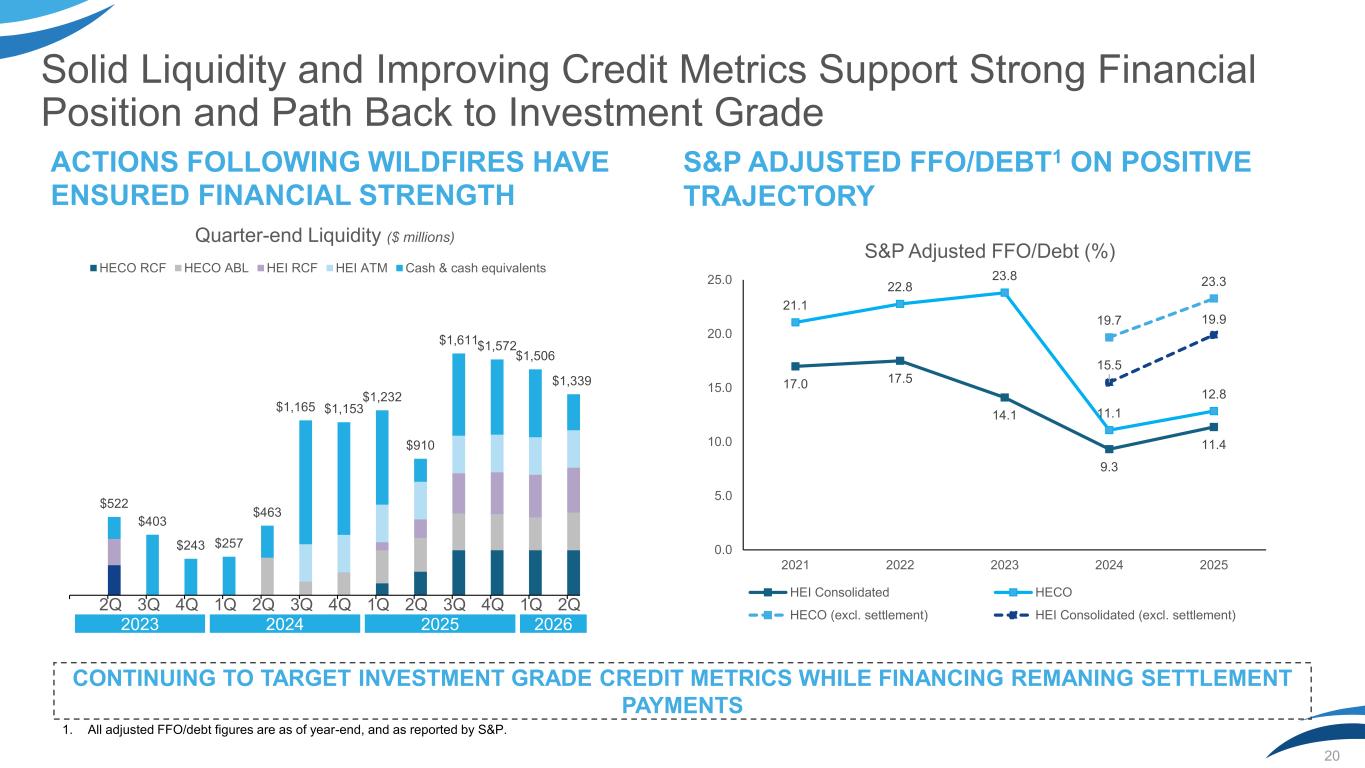
Solid Liquidity and Improving Credit Metrics Support Strong Financial Position and Path Back to Investment Grade 20 ACTIONS FOLLOWING WILDFIRES HAVE ENSURED FINANCIAL STRENGTH S&P ADJUSTED FFO/DEBT1 ON POSITIVE TRAJECTORY 1. All adjusted FFO/debt figures are as of year-end, and as reported by S&P. CONTINUING TO TARGET INVESTMENT GRADE CREDIT METRICS WHILE FINANCING REMANING SETTLEMENT PAYMENTS $522 $403 $243 $257 $463 $1,165 $1,153 $1,232 $910 $1,611 $1,572 $1,506 $1,339 Quarter-end Liquidity ($ millions) HECO RCF HECO ABL HEI RCF HEI ATM Cash & cash equivalents 2Q 3Q 4Q 1Q 2Q 3Q 4Q 1Q 2Q 3Q 4Q 1Q 2Q 2023 2024 2025 2026 17.0 17.5 14.1 9.3 11.4 21.1 22.8 23.8 11.1 12.8 19.7 23.3 15.5 19.9 0.0 5.0 10.0 15.0 20.0 25.0 2021 2022 2023 2024 2025 S&P Adjusted FFO/Debt (%) HEI Consolidated HECO HECO (excl. settlement) HEI Consolidated (excl. settlement)
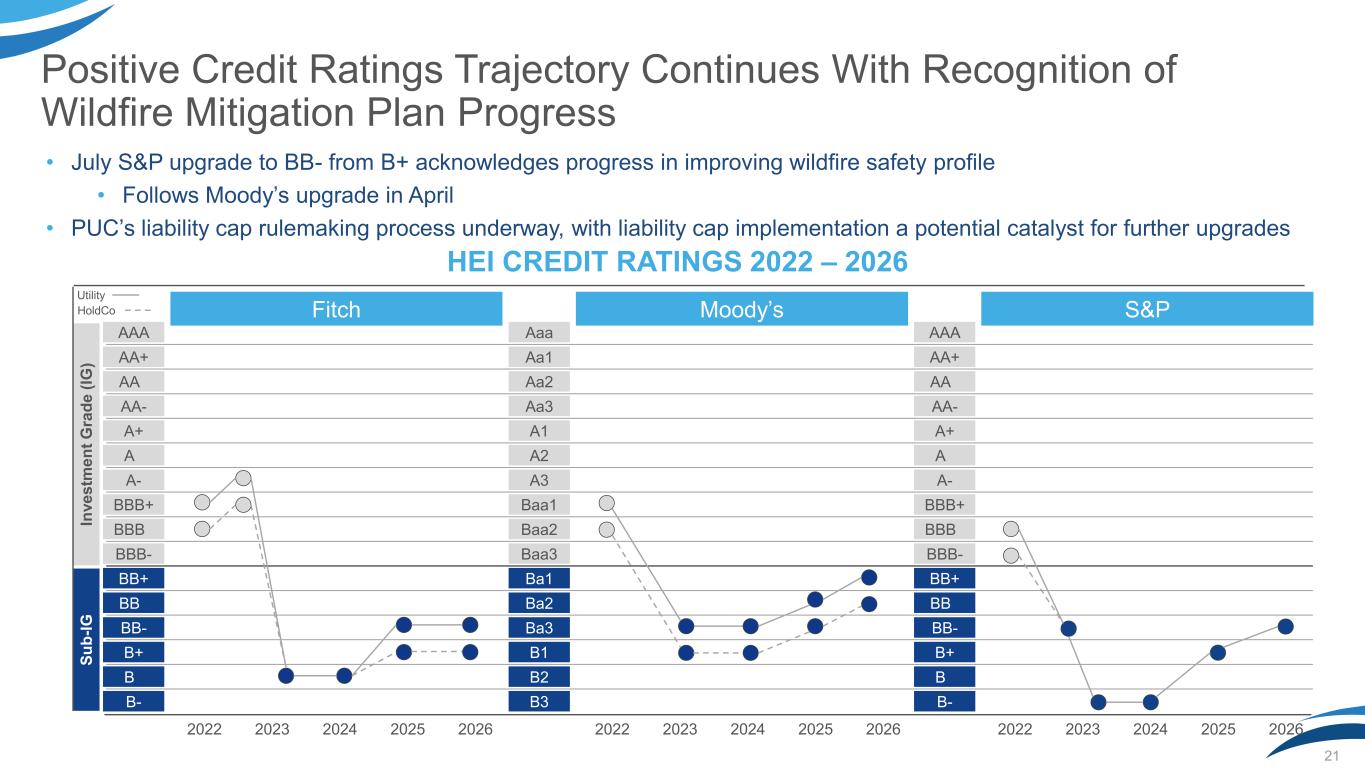
Positive Credit Ratings Trajectory Continues With Recognition of Wildfire Mitigation Plan Progress 21 HEI CREDIT RATINGS 2022 – 2026 • July S&P upgrade to BB- from B+ acknowledges progress in improving wildfire safety profile • Follows Moody’s upgrade in April • PUC’s liability cap rulemaking process underway, with liability cap implementation a potential catalyst for further upgrades Fitch Moody’s S&P B- AAA AA+ AA_ AA- A+ A_ A- BBB+ BBB_ BBB- BB+ BB_ BB- B+ B_ B- Aaa Aa1 Aa2 Aa3 A1 A2 A3 Baa1 Baa2 Baa3 Ba1 Ba2 Ba3 B1 B2 B3 AAA AA+ AA_ AA- A+ A_ A- BBB+ BBB_ BBB- BB+ BB_ BB- B+ B_ B- In v e s tm e n t G ra d e ( IG ) S u b -I G 2022 2023 2024 2025 2026 2022 2023 2024 2025 2026 2022 2023 2024 2025 2026 HoldCo Utility
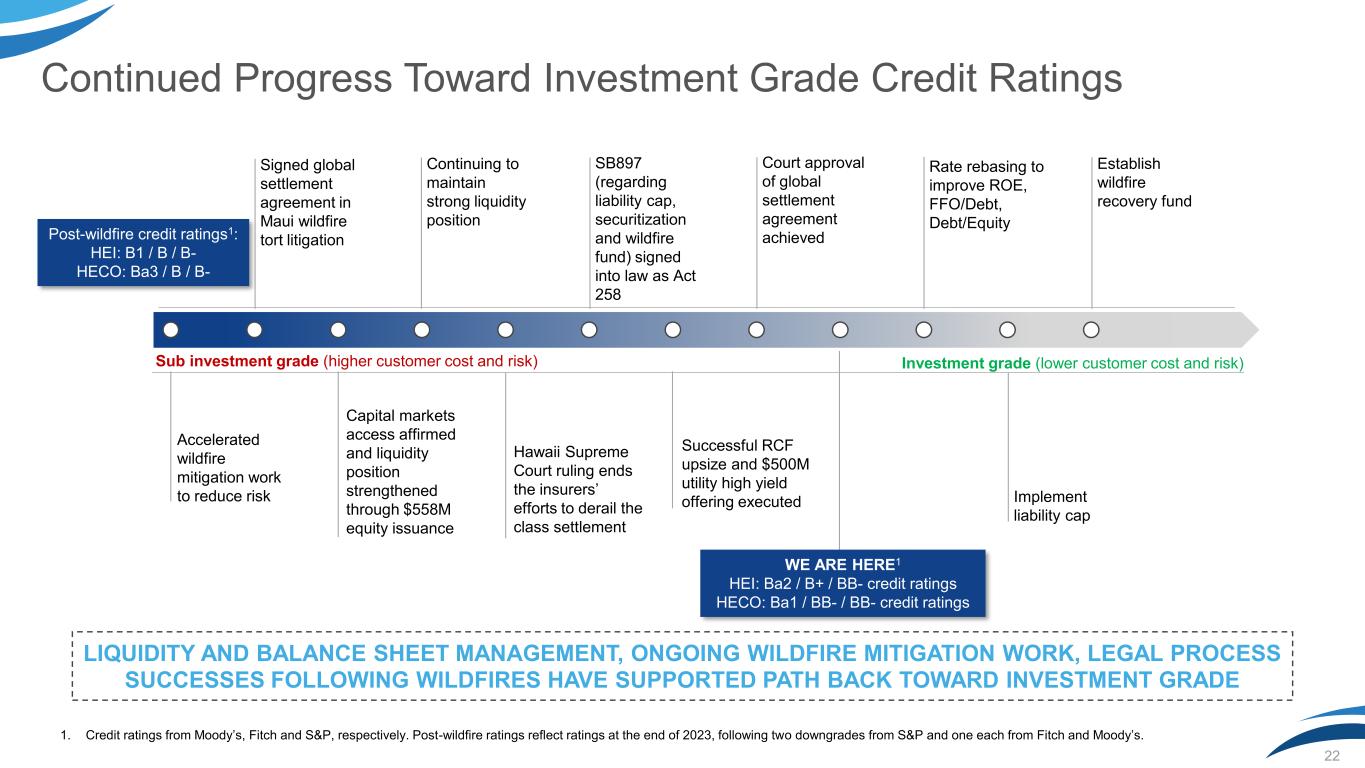
Rate rebasing to improve ROE, FFO/Debt, Debt/Equity Continued Progress Toward Investment Grade Credit Ratings 22 Sub investment grade (higher customer cost and risk) Investment grade (lower customer cost and risk) Accelerated wildfire mitigation work to reduce risk Signed global settlement agreement in Maui wildfire tort litigationPost-wildfire credit ratings1: HEI: B1 / B / B- HECO: Ba3 / B / B- Capital markets access affirmed and liquidity position strengthened through $558M equity issuance Continuing to maintain strong liquidity position Hawaii Supreme Court ruling ends the insurers’ efforts to derail the class settlement SB897 (regarding liability cap, securitization and wildfire fund) signed into law as Act 258 Successful RCF upsize and $500M utility high yield offering executed Court approval of global settlement agreement achieved WE ARE HERE1 HEI: Ba2 / B+ / BB- credit ratings HECO: Ba1 / BB- / BB- credit ratings 1. Credit ratings from Moody’s, Fitch and S&P, respectively. Post-wildfire ratings reflect ratings at the end of 2023, following two downgrades from S&P and one each from Fitch and Moody’s. Implement liability cap Establish wildfire recovery fund LIQUIDITY AND BALANCE SHEET MANAGEMENT, ONGOING WILDFIRE MITIGATION WORK, LEGAL PROCESS SUCCESSES FOLLOWING WILDFIRES HAVE SUPPORTED PATH BACK TOWARD INVESTMENT GRADE
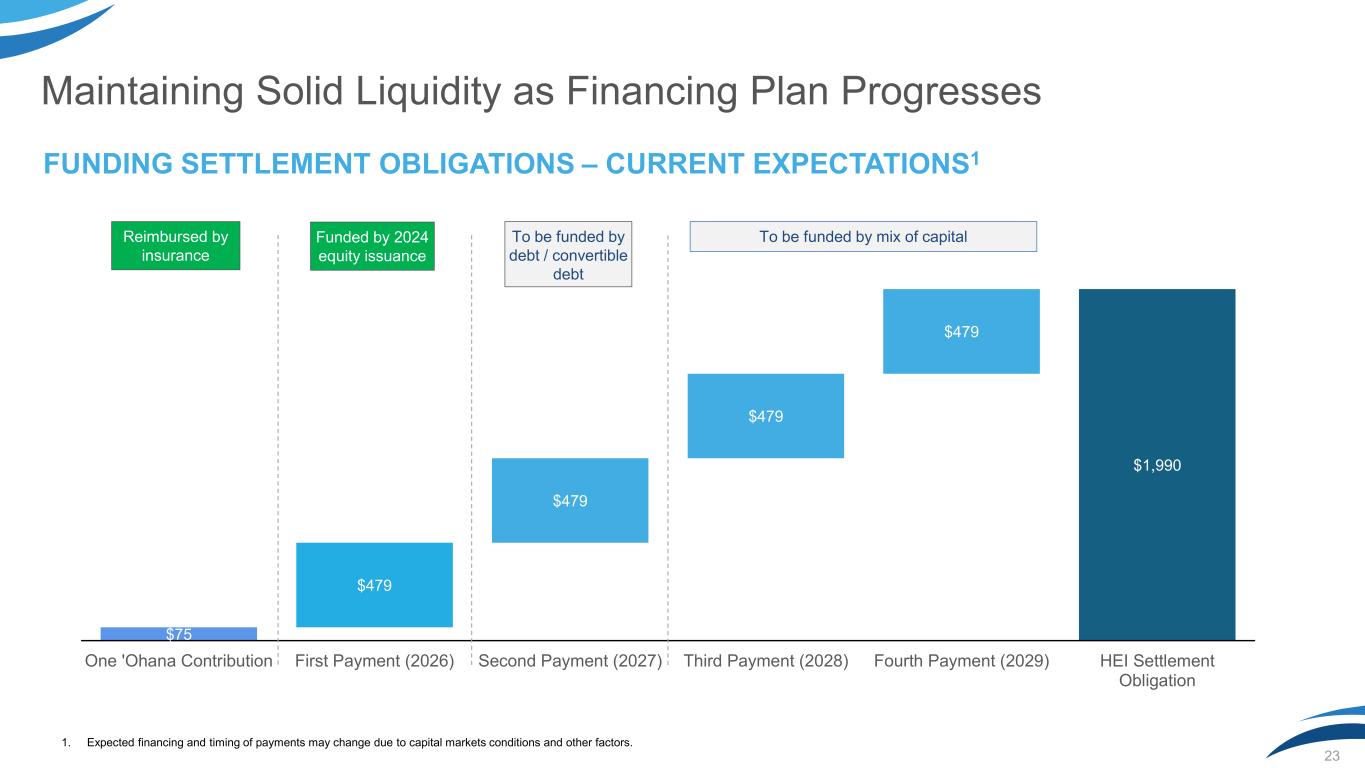
Maintaining Solid Liquidity as Financing Plan Progresses 23 FUNDING SETTLEMENT OBLIGATIONS – CURRENT EXPECTATIONS1 $75 $1,990 $479 $479 $479 $479 One 'Ohana Contribution First Payment (2026) Second Payment (2027) Third Payment (2028) Fourth Payment (2029) HEI Settlement Obligation Reimbursed by insurance Funded by 2024 equity issuance To be funded by debt / convertible debt To be funded by mix of capital 1. Expected financing and timing of payments may change due to capital markets conditions and other factors.
HEI at a Glance Regulatory framework provides steady, predictable revenues, with rate rebasing underway Implementing industry leading wildfire mitigation efforts and reducing operating risk Strong balance sheet and liquidity with improving credit metrics 24 Topics of Focus 1 3 2 4 Executing through historic capital cycle5
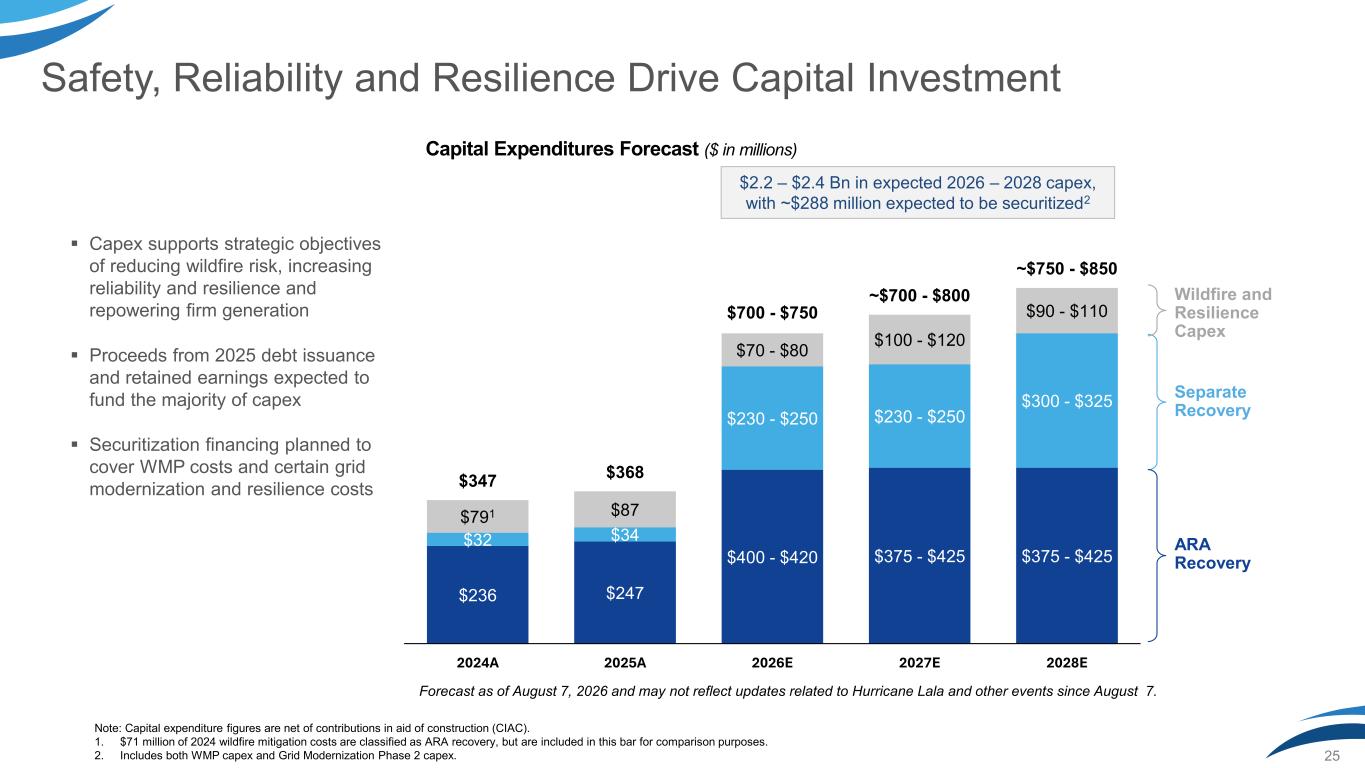
$236 $247 $400 - $420 $375 - $425 $375 - $425 $32 $34 $230 - $250 $230 - $250 $300 - $325 $791 $87 $70 - $80 $100 - $120 $90 - $110 $347 $368 $700 - $750 ~$700 - $800 ~$750 - $850 2024A 2025A 2026E 2027E 2028E ARA Recovery Safety, Reliability and Resilience Drive Capital Investment 25 ▪ Capex supports strategic objectives of reducing wildfire risk, increasing reliability and resilience and repowering firm generation ▪ Proceeds from 2025 debt issuance and retained earnings expected to fund the majority of capex ▪ Securitization financing planned to cover WMP costs and certain grid modernization and resilience costs Capital Expenditures Forecast ($ in millions) Separate Recovery Wildfire and Resilience Capex Note: Capital expenditure figures are net of contributions in aid of construction (CIAC). 1. $71 million of 2024 wildfire mitigation costs are classified as ARA recovery, but are included in this bar for comparison purposes. 2. Includes both WMP capex and Grid Modernization Phase 2 capex. $2.2 – $2.4 Bn in expected 2026 – 2028 capex, with ~$288 million expected to be securitized2 Forecast as of August 7, 2026 and may not reflect updates related to Hurricane Lala and other events since August 7.
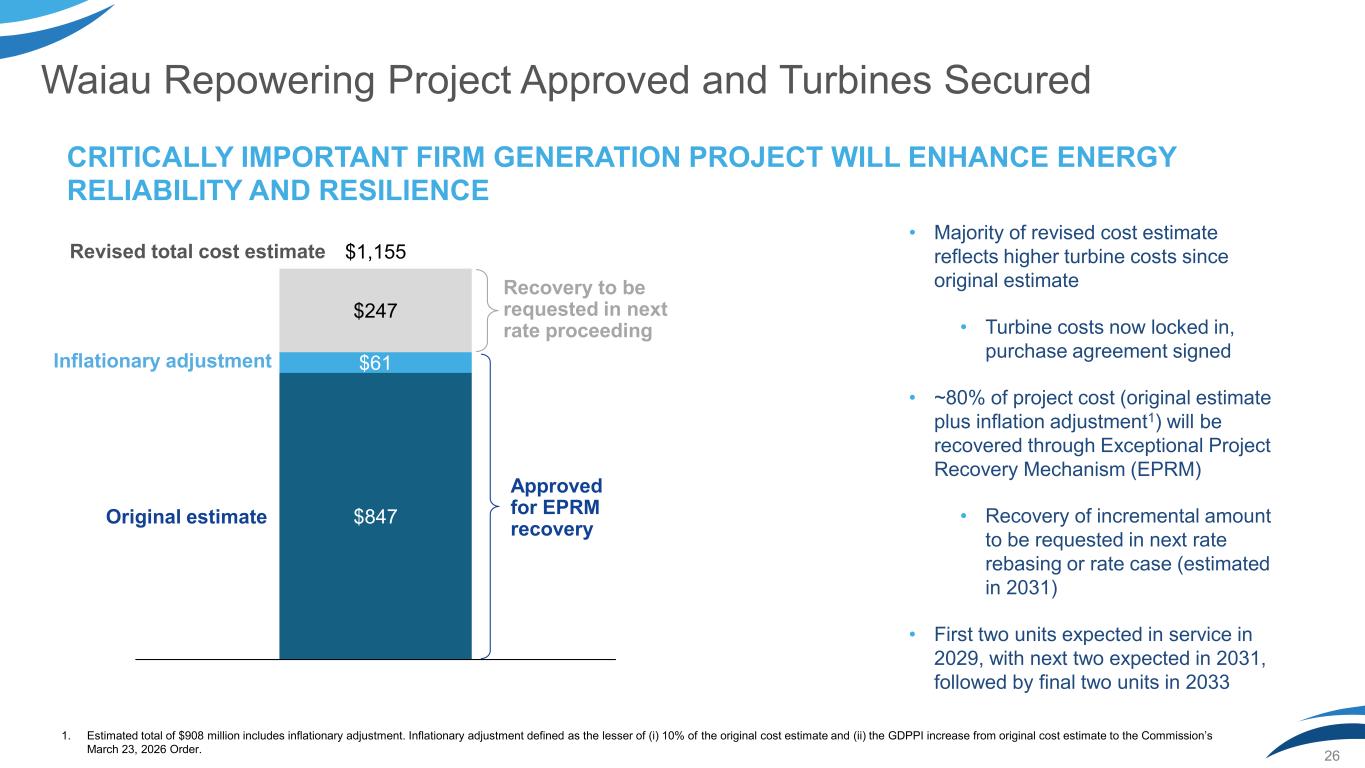
Waiau Repowering Project Approved and Turbines Secured 26 CRITICALLY IMPORTANT FIRM GENERATION PROJECT WILL ENHANCE ENERGY RELIABILITY AND RESILIENCE • Majority of revised cost estimate reflects higher turbine costs since original estimate • Turbine costs now locked in, purchase agreement signed • ~80% of project cost (original estimate plus inflation adjustment1) will be recovered through Exceptional Project Recovery Mechanism (EPRM) • Recovery of incremental amount to be requested in next rate rebasing or rate case (estimated in 2031) • First two units expected in service in 2029, with next two expected in 2031, followed by final two units in 2033 1. Estimated total of $908 million includes inflationary adjustment. Inflationary adjustment defined as the lesser of (i) 10% of the original cost estimate and (ii) the GDPPI increase from original cost estimate to the Commission’s March 23, 2026 Order. 1 $847 $61 $247 $1,155 1 Approved for EPRM recovery Inflationary adjustment Recovery to be requested in next rate proceeding Original estimate Revised total cost estimate
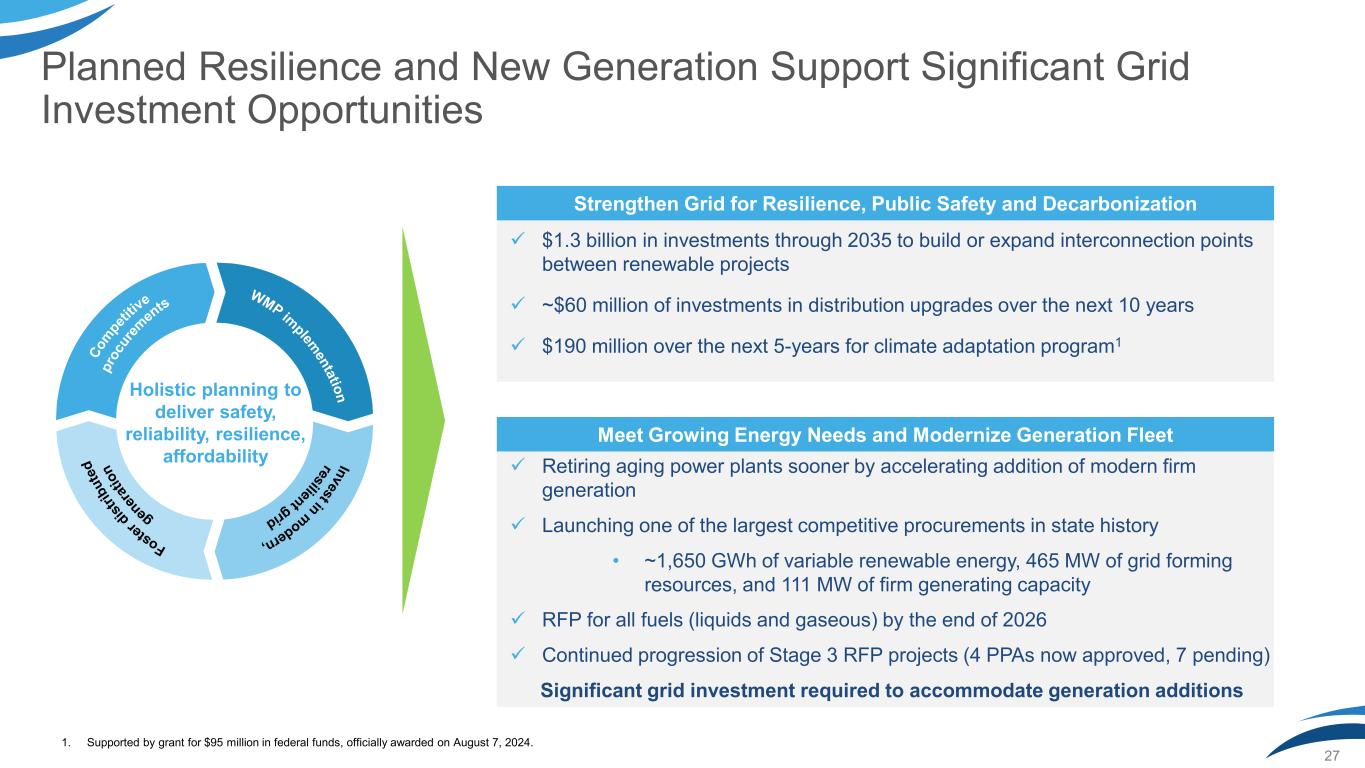
Planned Resilience and New Generation Support Significant Grid Investment Opportunities 27 C o m pe tit iv e p ro cu re m en ts WMP im plem en ta tio n Foste rdis tr ib u te d gen er at io n In v estin m odern, resilientgrid Holistic planning to deliver safety, reliability, resilience, affordability ✓ Retiring aging power plants sooner by accelerating addition of modern firm generation ✓ Launching one of the largest competitive procurements in state history • ~1,650 GWh of variable renewable energy, 465 MW of grid forming resources, and 111 MW of firm generating capacity ✓ RFP for all fuels (liquids and gaseous) by the end of 2026 ✓ Continued progression of Stage 3 RFP projects (4 PPAs now approved, 7 pending) Significant grid investment required to accommodate generation additions Meet Growing Energy Needs and Modernize Generation Fleet ✓ $1.3 billion in investments through 2035 to build or expand interconnection points between renewable projects ✓ ~$60 million of investments in distribution upgrades over the next 10 years ✓ $190 million over the next 5-years for climate adaptation program1 Strengthen Grid for Resilience, Public Safety and Decarbonization 1. Supported by grant for $95 million in federal funds, officially awarded on August 7, 2024.

Appendix
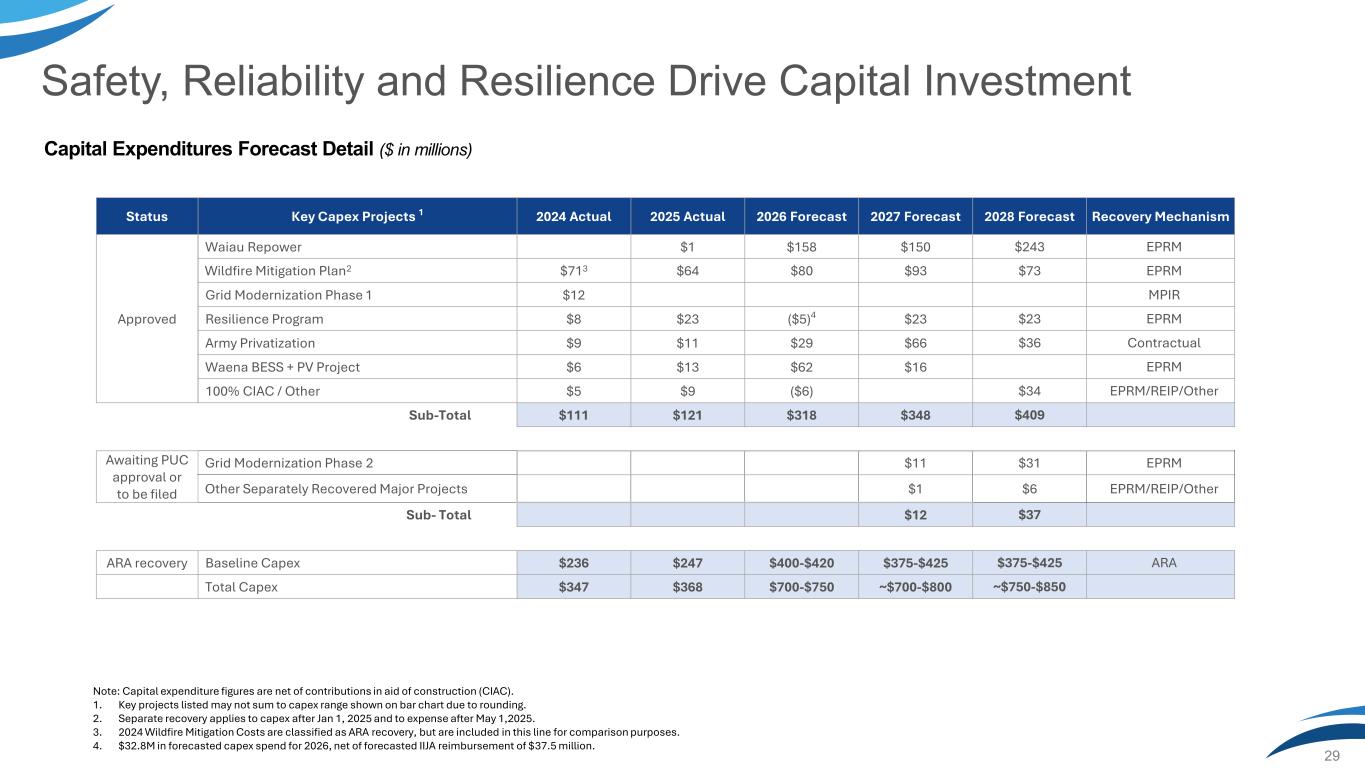
Safety, Reliability and Resilience Drive Capital Investment 29 Capital Expenditures Forecast Detail ($ in millions) Status Key Capex Projects 1 2024 Actual 2025 Actual 2026 Forecast 2027 Forecast 2028 Forecast Recovery Mechanism Approved Waiau Repower $1 $158 $150 $243 EPRM Wildfire Mitigation Plan2 $713 $64 $80 $93 $73 EPRM Grid Modernization Phase 1 $12 MPIR Resilience Program $8 $23 ($5)4 $23 $23 EPRM Army Privatization $9 $11 $29 $66 $36 Contractual Waena BESS + PV Project $6 $13 $62 $16 EPRM 100% CIAC / Other $5 $9 ($6) $34 EPRM/REIP/Other Sub-Total $111 $121 $318 $348 $409 Awaiting PUC approval or to be filed Grid Modernization Phase 2 $11 $31 EPRM Other Separately Recovered Major Projects $1 $6 EPRM/REIP/Other Sub- Total $12 $37 ARA recovery Baseline Capex $236 $247 $400-$420 $375-$425 $375-$425 ARA Total Capex $347 $368 $700-$750 ~$700-$800 ~$750-$850 Note: Capital expenditure figures are net of contributions in aid of construction (CIAC). 1. Key projects listed may not sum to capex range shown on bar chart due to rounding. 2. Separate recovery applies to capex after Jan 1, 2025 and to expense after May 1,2025. 3. 2024 Wildfire Mitigation Costs are classified as ARA recovery, but are included in this line for comparison purposes. 4. $32.8M in forecasted capex spend for 2026, net of forecasted IIJA reimbursement of $37.5 million.
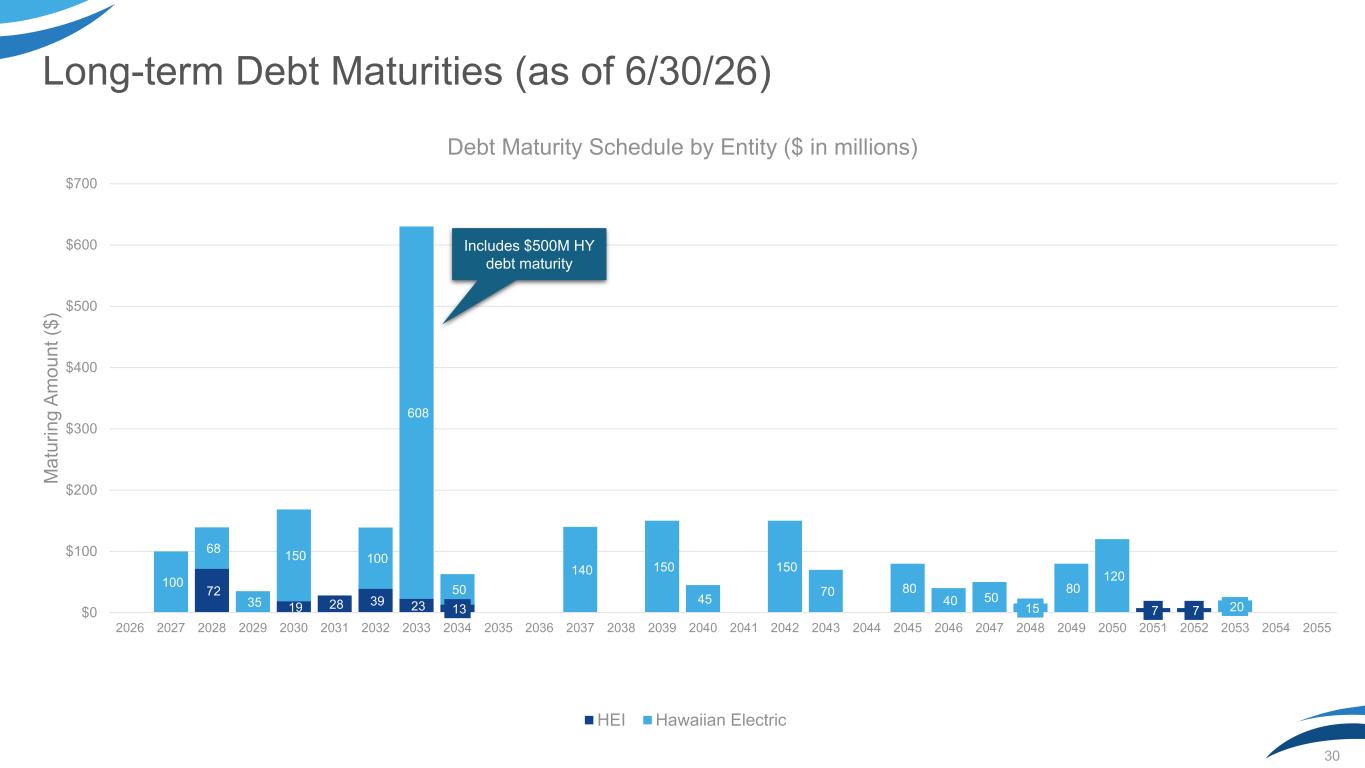
Long-term Debt Maturities (as of 6/30/26) 30 - - 72 - 19 28 39 23 13 - - - - - - - - - - - - - - - - 7 7 - - - 100 68 35 150 - 100 608 50 140 150 45 150 70 80 40 50 15 80 120 - - 20 $0 $100 $200 $300 $400 $500 $600 $700 2026 2027 2028 2029 2030 2031 2032 2033 2034 2035 2036 2037 2038 2039 2040 2041 2042 2043 2044 2045 2046 2047 2048 2049 2050 2051 2052 2053 2054 2055 M a tu ri n g A m o u n t ($ ) Debt Maturity Schedule by Entity ($ in millions) HEI Hawaiian Electric Includes $500M HY debt maturity
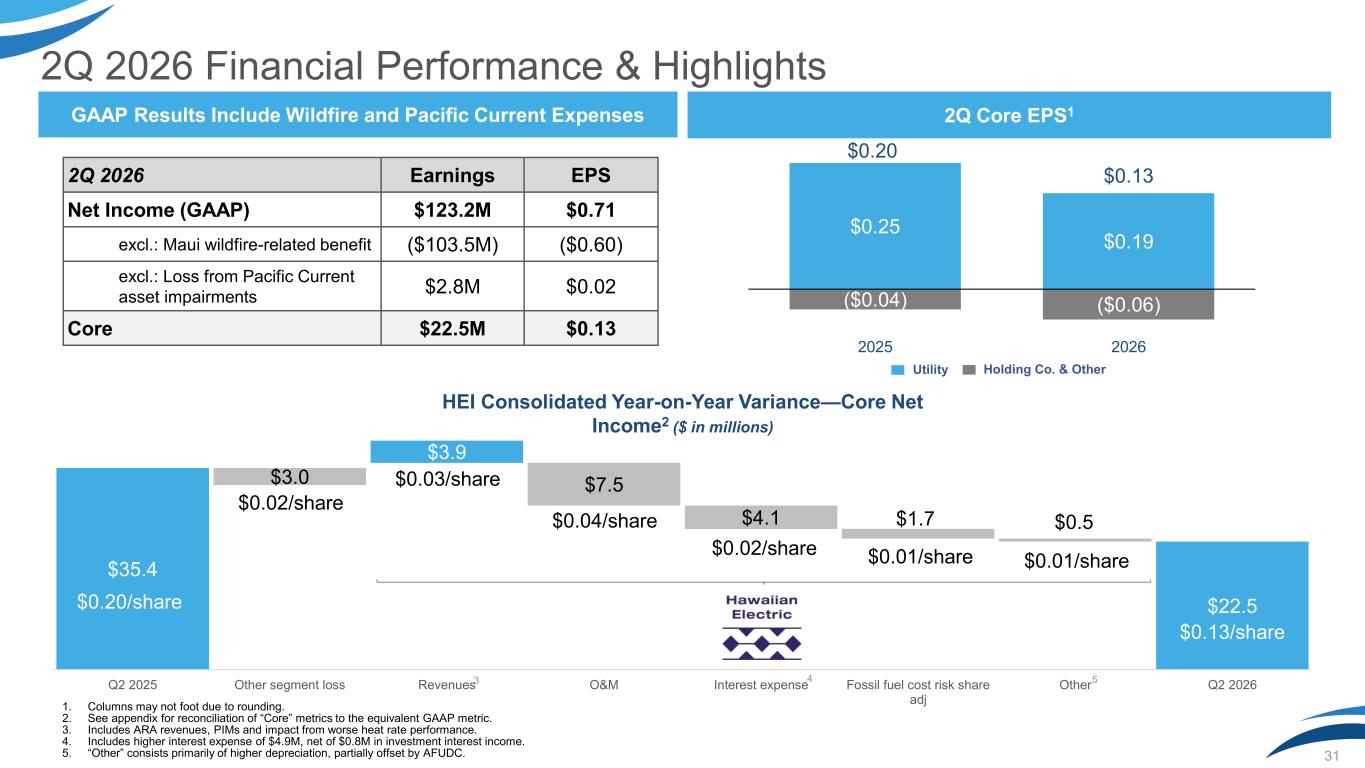
2Q 2026 Financial Performance & Highlights 31 GAAP Results Include Wildfire and Pacific Current Expenses Utility Holding Co. & Other 2Q 2026 Earnings EPS Net Income (GAAP) $123.2M $0.71 excl.: Maui wildfire-related benefit ($103.5M) ($0.60) excl.: Loss from Pacific Current asset impairments $2.8M $0.02 Core $22.5M $0.13 HEI Consolidated Year-on-Year Variance—Core Net Income2 ($ in millions) $0.25 $0.19 ($0.04) ($0.06) $0.20 $0.13 2025 2026 1. Columns may not foot due to rounding. 2. See appendix for reconciliation of “Core” metrics to the equivalent GAAP metric. 3. Includes ARA revenues, PIMs and impact from worse heat rate performance. 4. Includes higher interest expense of $4.9M, net of $0.8M in investment interest income. 5. “Other” consists primarily of higher depreciation, partially offset by AFUDC. $35.4 $22.5 $3.0 $3.9 $7.5 $4.1 $1.7 $0.5 Q2 2025 Other segment loss Revenues O&M Interest expense Fossil fuel cost risk share adj Other Q2 20263 4 2Q Core EPS1 5 $0.20/share $0.02/share $0.03/share $0.04/share $0.02/share $0.01/share $0.01/share $0.13/share
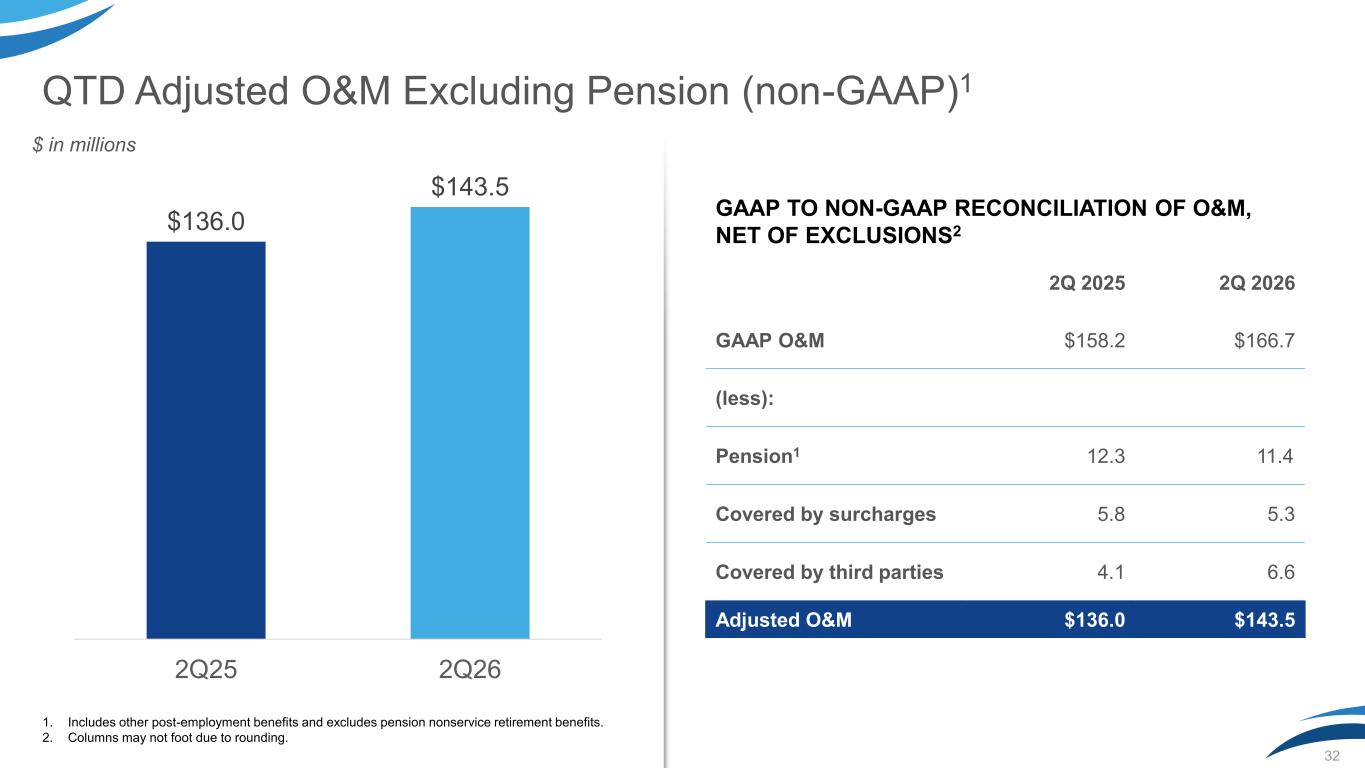
QTD Adjusted O&M Excluding Pension (non-GAAP)1 1. Includes other post-employment benefits and excludes pension nonservice retirement benefits. 2. Columns may not foot due to rounding. 32 $136.0 $143.5 2Q25 2Q26 GAAP TO NON-GAAP RECONCILIATION OF O&M, NET OF EXCLUSIONS2 2Q 2025 2Q 2026 GAAP O&M $158.2 $166.7 (less): Pension1 12.3 11.4 Covered by surcharges 5.8 5.3 Covered by third parties 4.1 6.6 Adjusted O&M $136.0 $143.5 $ in millions
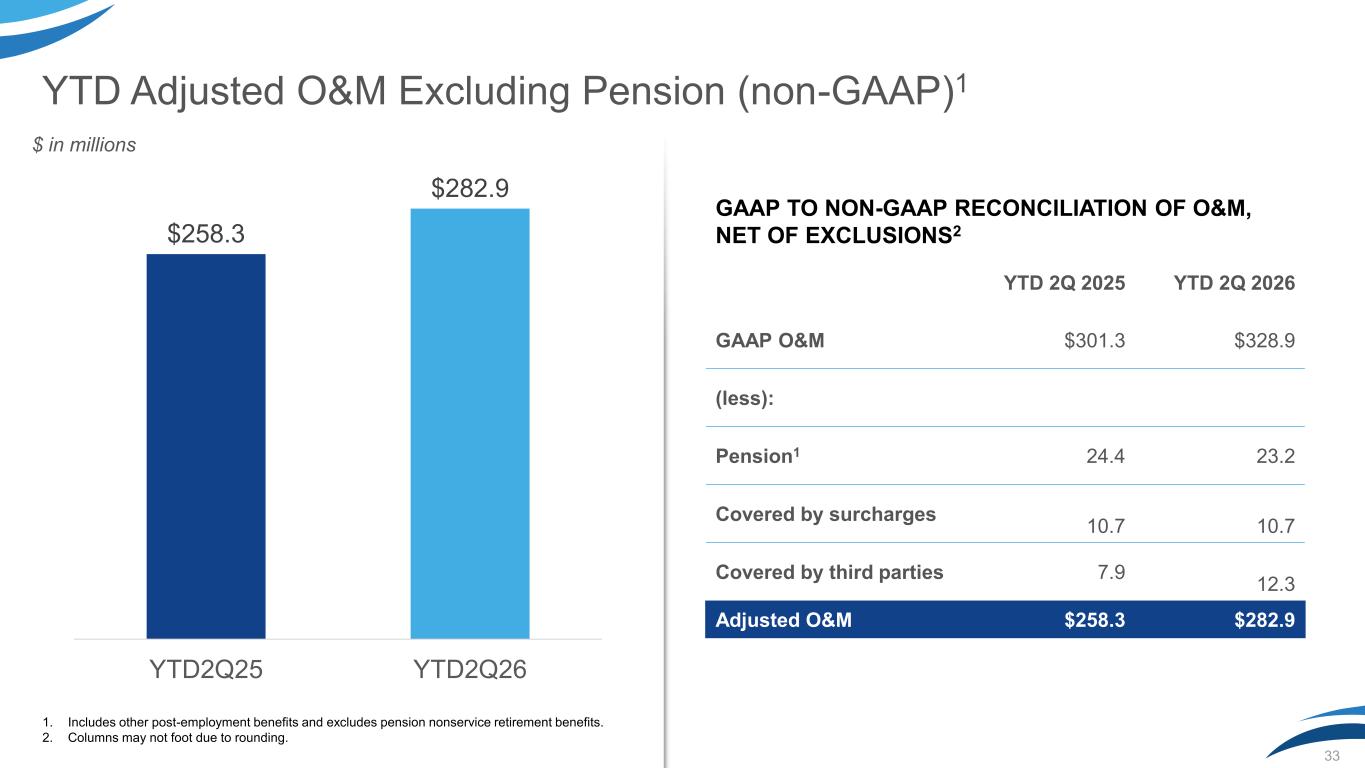
YTD Adjusted O&M Excluding Pension (non-GAAP)1 1. Includes other post-employment benefits and excludes pension nonservice retirement benefits. 2. Columns may not foot due to rounding. 33 $258.3 $282.9 YTD2Q25 YTD2Q26 GAAP TO NON-GAAP RECONCILIATION OF O&M, NET OF EXCLUSIONS2 YTD 2Q 2025 YTD 2Q 2026 GAAP O&M $301.3 $328.9 (less): Pension1 24.4 23.2 Covered by surcharges 10.7 10.7 Covered by third parties 7.9 12.3 Adjusted O&M $258.3 $282.9 $ in millions
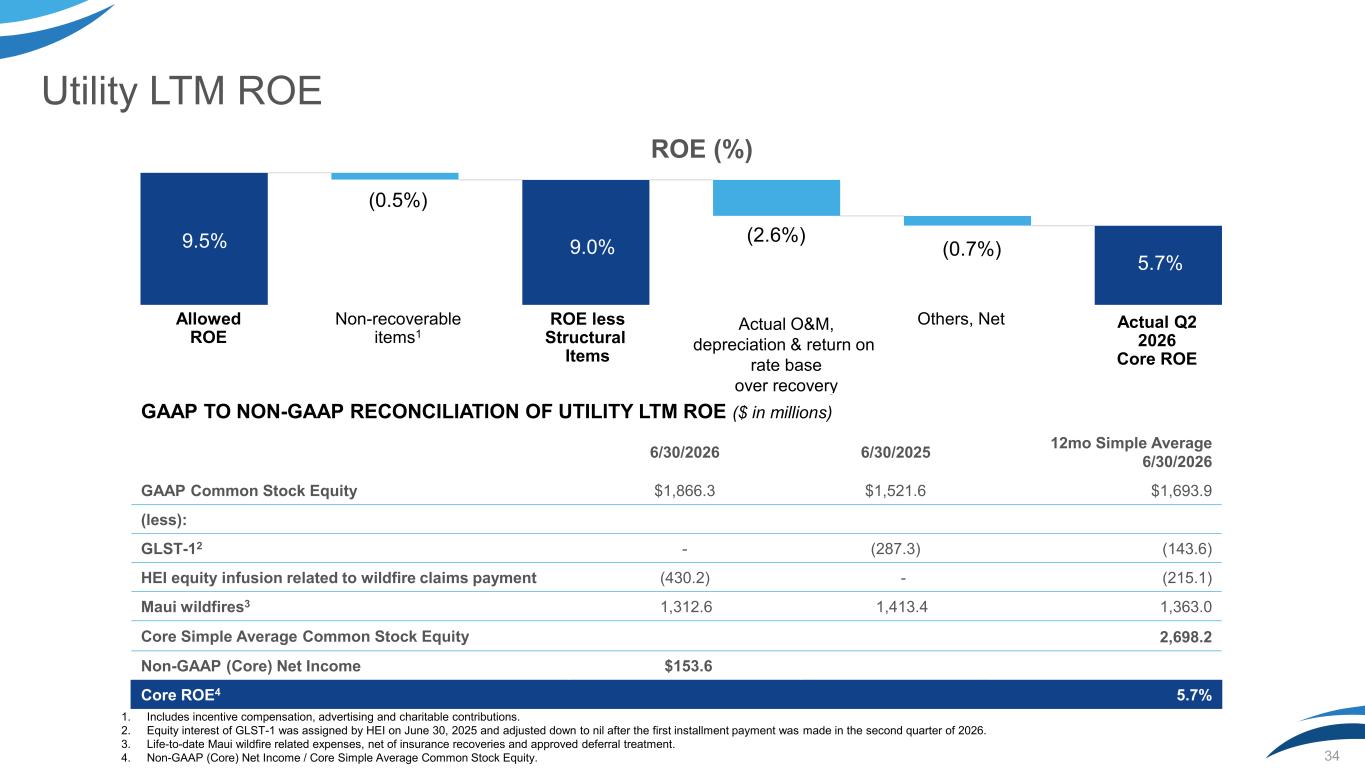
Utility LTM ROE 9.5% ROE (%) (2.6%) Non-recoverable items1 Allowed ROE (0.5%) 9.0% ROE less Structural Items Actual O&M, depreciation & return on rate base over recovery Actual Q2 2026 Core ROE Others, Net 5.7% (0.7%) GAAP TO NON-GAAP RECONCILIATION OF UTILITY LTM ROE ($ in millions) 6/30/2026 6/30/2025 12mo Simple Average 6/30/2026 GAAP Common Stock Equity $1,866.3 $1,521.6 $1,693.9 (less): GLST-12 - (287.3) (143.6) HEI equity infusion related to wildfire claims payment (430.2) - (215.1) Maui wildfires3 1,312.6 1,413.4 1,363.0 Core Simple Average Common Stock Equity 2,698.2 Non-GAAP (Core) Net Income $153.6 Core ROE4 5.7% 1. Includes incentive compensation, advertising and charitable contributions. 2. Equity interest of GLST-1 was assigned by HEI on June 30, 2025 and adjusted down to nil after the first installment payment was made in the second quarter of 2026. 3. Life-to-date Maui wildfire related expenses, net of insurance recoveries and approved deferral treatment. 4. Non-GAAP (Core) Net Income / Core Simple Average Common Stock Equity. 34
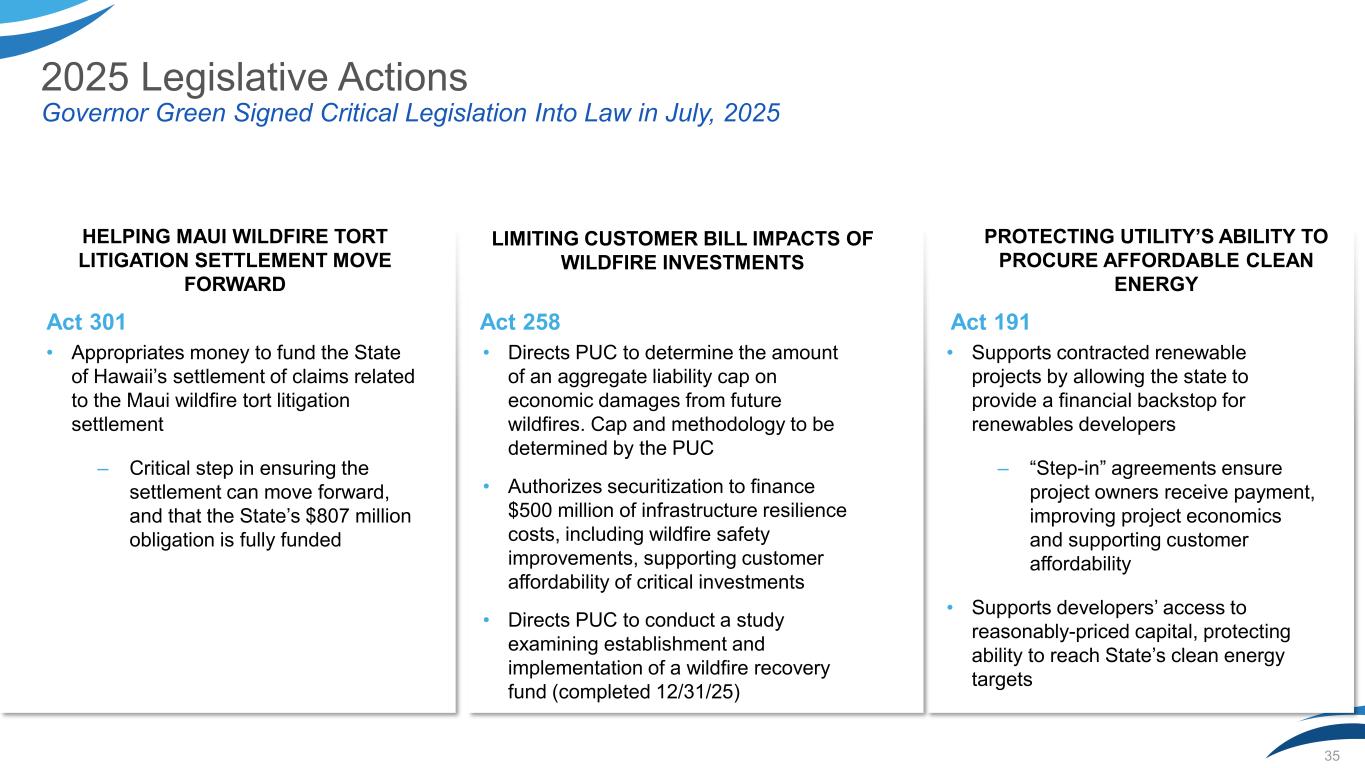
2025 Legislative Actions Governor Green Signed Critical Legislation Into Law in July, 2025 35 • Directs PUC to determine the amount of an aggregate liability cap on economic damages from future wildfires. Cap and methodology to be determined by the PUC • Authorizes securitization to finance $500 million of infrastructure resilience costs, including wildfire safety improvements, supporting customer affordability of critical investments • Directs PUC to conduct a study examining establishment and implementation of a wildfire recovery fund (completed 12/31/25) LIMITING CUSTOMER BILL IMPACTS OF WILDFIRE INVESTMENTS Act 258 PROTECTING UTILITY’S ABILITY TO PROCURE AFFORDABLE CLEAN ENERGY Act 191 • Supports contracted renewable projects by allowing the state to provide a financial backstop for renewables developers ‒ “Step-in” agreements ensure project owners receive payment, improving project economics and supporting customer affordability • Supports developers’ access to reasonably-priced capital, protecting ability to reach State’s clean energy targets HELPING MAUI WILDFIRE TORT LITIGATION SETTLEMENT MOVE FORWARD Act 301 • Appropriates money to fund the State of Hawaii’s settlement of claims related to the Maui wildfire tort litigation settlement ‒ Critical step in ensuring the settlement can move forward, and that the State’s $807 million obligation is fully funded
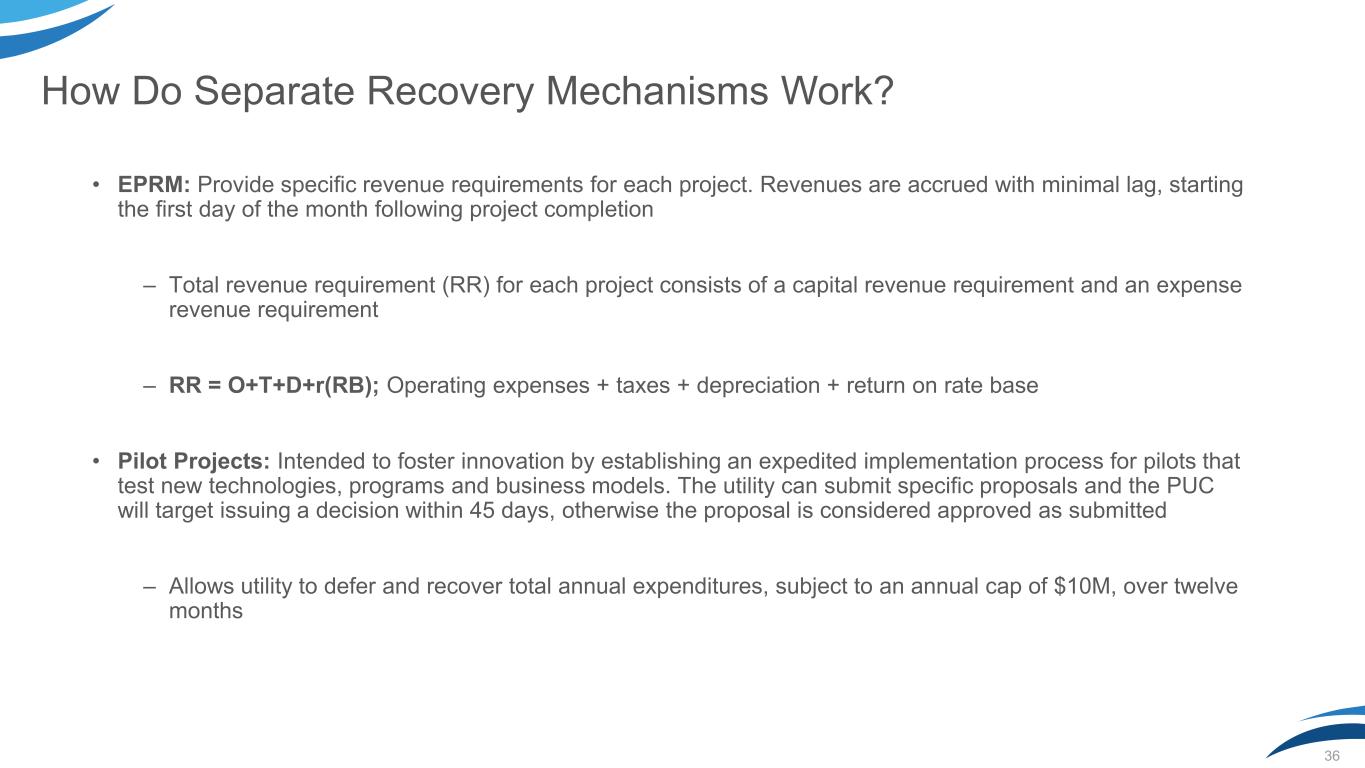
How Do Separate Recovery Mechanisms Work? • EPRM: Provide specific revenue requirements for each project. Revenues are accrued with minimal lag, starting the first day of the month following project completion ‒ Total revenue requirement (RR) for each project consists of a capital revenue requirement and an expense revenue requirement ‒ RR = O+T+D+r(RB); Operating expenses + taxes + depreciation + return on rate base • Pilot Projects: Intended to foster innovation by establishing an expedited implementation process for pilots that test new technologies, programs and business models. The utility can submit specific proposals and the PUC will target issuing a decision within 45 days, otherwise the proposal is considered approved as submitted ‒ Allows utility to defer and recover total annual expenditures, subject to an annual cap of $10M, over twelve months 36
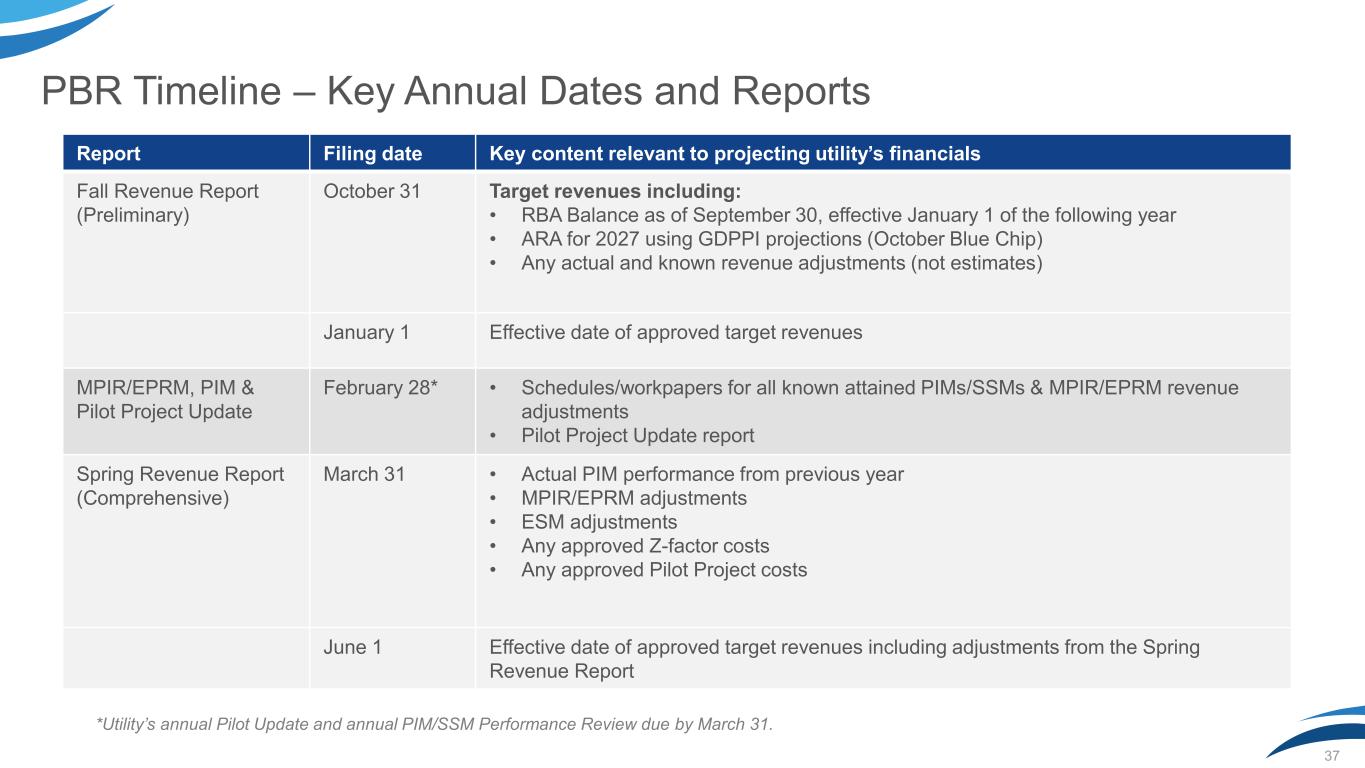
PBR Timeline – Key Annual Dates and Reports 37 *Utility’s annual Pilot Update and annual PIM/SSM Performance Review due by March 31. Report Filing date Key content relevant to projecting utility’s financials Fall Revenue Report (Preliminary) October 31 Target revenues including: • RBA Balance as of September 30, effective January 1 of the following year • ARA for 2027 using GDPPI projections (October Blue Chip) • Any actual and known revenue adjustments (not estimates) January 1 Effective date of approved target revenues MPIR/EPRM, PIM & Pilot Project Update February 28* • Schedules/workpapers for all known attained PIMs/SSMs & MPIR/EPRM revenue adjustments • Pilot Project Update report Spring Revenue Report (Comprehensive) March 31 • Actual PIM performance from previous year • MPIR/EPRM adjustments • ESM adjustments • Any approved Z-factor costs • Any approved Pilot Project costs June 1 Effective date of approved target revenues including adjustments from the Spring Revenue Report
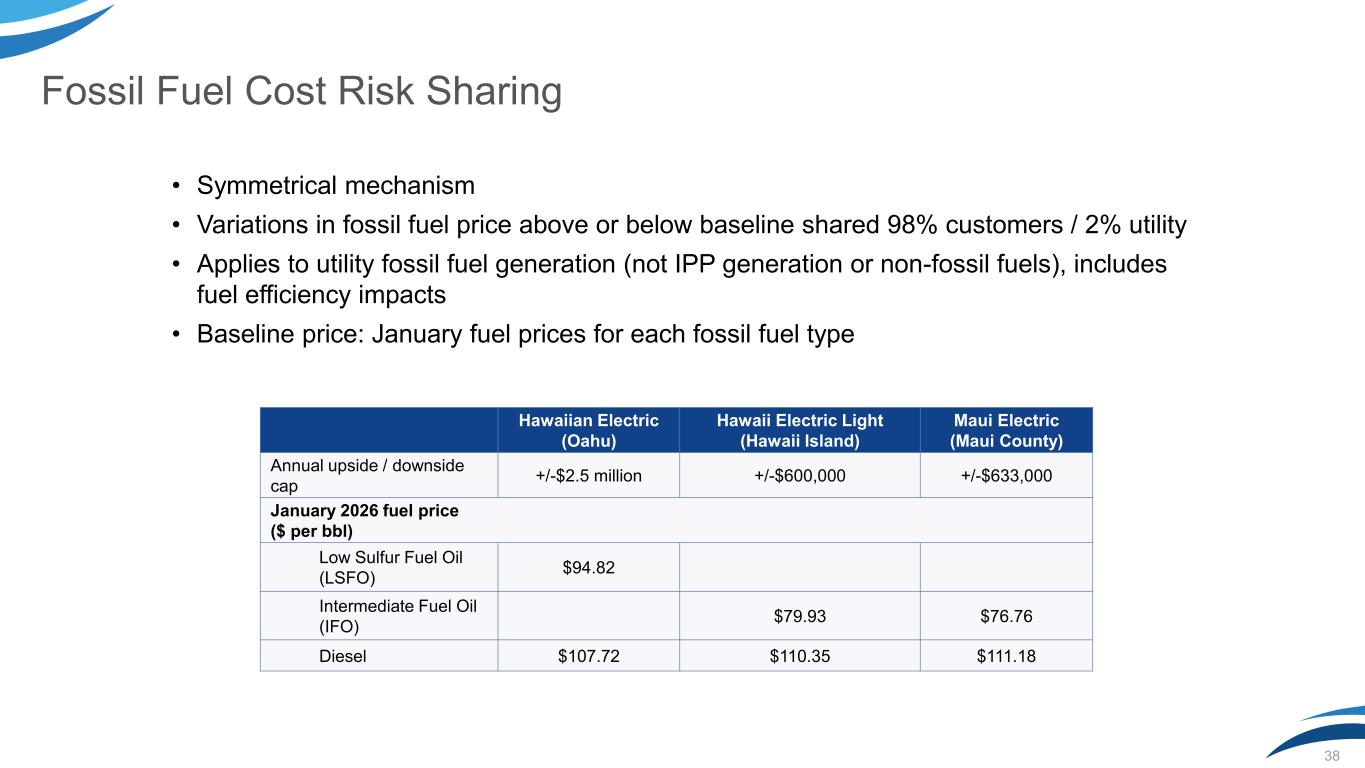
Fossil Fuel Cost Risk Sharing • Symmetrical mechanism • Variations in fossil fuel price above or below baseline shared 98% customers / 2% utility • Applies to utility fossil fuel generation (not IPP generation or non-fossil fuels), includes fuel efficiency impacts • Baseline price: January fuel prices for each fossil fuel type 38 Hawaiian Electric (Oahu) Hawaii Electric Light (Hawaii Island) Maui Electric (Maui County) Annual upside / downside cap +/-$2.5 million +/-$600,000 +/-$633,000 January 2026 fuel price ($ per bbl) Low Sulfur Fuel Oil (LSFO) $94.82 Intermediate Fuel Oil (IFO) $79.93 $76.76 Diesel $107.72 $110.35 $111.18
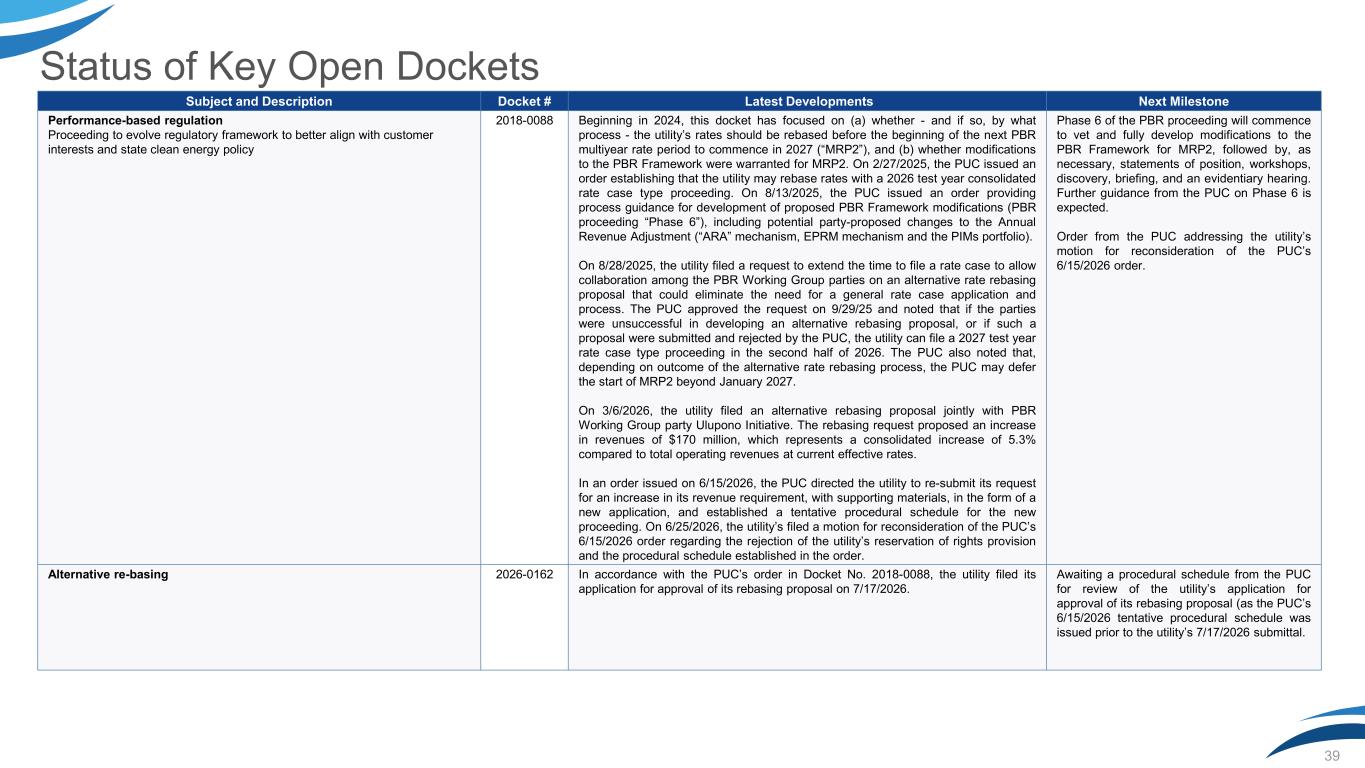
Status of Key Open Dockets 39 Subject and Description Docket # Latest Developments Next Milestone Performance-based regulation Proceeding to evolve regulatory framework to better align with customer interests and state clean energy policy 2018-0088 Beginning in 2024, this docket has focused on (a) whether - and if so, by what process - the utility’s rates should be rebased before the beginning of the next PBR multiyear rate period to commence in 2027 (“MRP2”), and (b) whether modifications to the PBR Framework were warranted for MRP2. On 2/27/2025, the PUC issued an order establishing that the utility may rebase rates with a 2026 test year consolidated rate case type proceeding. On 8/13/2025, the PUC issued an order providing process guidance for development of proposed PBR Framework modifications (PBR proceeding “Phase 6”), including potential party-proposed changes to the Annual Revenue Adjustment (“ARA” mechanism, EPRM mechanism and the PIMs portfolio). On 8/28/2025, the utility filed a request to extend the time to file a rate case to allow collaboration among the PBR Working Group parties on an alternative rate rebasing proposal that could eliminate the need for a general rate case application and process. The PUC approved the request on 9/29/25 and noted that if the parties were unsuccessful in developing an alternative rebasing proposal, or if such a proposal were submitted and rejected by the PUC, the utility can file a 2027 test year rate case type proceeding in the second half of 2026. The PUC also noted that, depending on outcome of the alternative rate rebasing process, the PUC may defer the start of MRP2 beyond January 2027. On 3/6/2026, the utility filed an alternative rebasing proposal jointly with PBR Working Group party Ulupono Initiative. The rebasing request proposed an increase in revenues of $170 million, which represents a consolidated increase of 5.3% compared to total operating revenues at current effective rates. In an order issued on 6/15/2026, the PUC directed the utility to re-submit its request for an increase in its revenue requirement, with supporting materials, in the form of a new application, and established a tentative procedural schedule for the new proceeding. On 6/25/2026, the utility’s filed a motion for reconsideration of the PUC’s 6/15/2026 order regarding the rejection of the utility’s reservation of rights provision and the procedural schedule established in the order. Phase 6 of the PBR proceeding will commence to vet and fully develop modifications to the PBR Framework for MRP2, followed by, as necessary, statements of position, workshops, discovery, briefing, and an evidentiary hearing. Further guidance from the PUC on Phase 6 is expected. Order from the PUC addressing the utility’s motion for reconsideration of the PUC’s 6/15/2026 order. Alternative re-basing 2026-0162 In accordance with the PUC’s order in Docket No. 2018-0088, the utility filed its application for approval of its rebasing proposal on 7/17/2026. Awaiting a procedural schedule from the PUC for review of the utility’s application for approval of its rebasing proposal (as the PUC’s 6/15/2026 tentative procedural schedule was issued prior to the utility’s 7/17/2026 submittal.
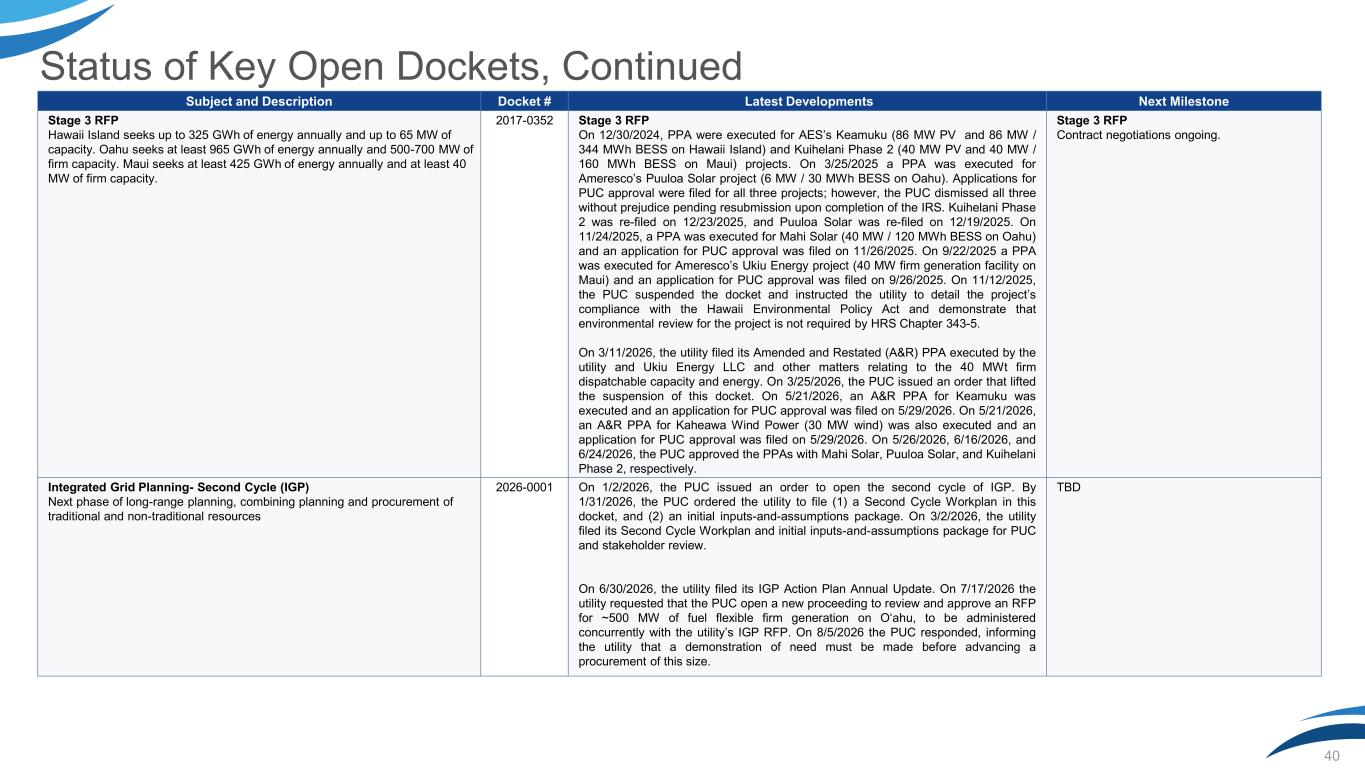
Status of Key Open Dockets, Continued 40 Subject and Description Docket # Latest Developments Next Milestone Stage 3 RFP Hawaii Island seeks up to 325 GWh of energy annually and up to 65 MW of capacity. Oahu seeks at least 965 GWh of energy annually and 500-700 MW of firm capacity. Maui seeks at least 425 GWh of energy annually and at least 40 MW of firm capacity. 2017-0352 Stage 3 RFP On 12/30/2024, PPA were executed for AES’s Keamuku (86 MW PV and 86 MW / 344 MWh BESS on Hawaii Island) and Kuihelani Phase 2 (40 MW PV and 40 MW / 160 MWh BESS on Maui) projects. On 3/25/2025 a PPA was executed for Ameresco’s Puuloa Solar project (6 MW / 30 MWh BESS on Oahu). Applications for PUC approval were filed for all three projects; however, the PUC dismissed all three without prejudice pending resubmission upon completion of the IRS. Kuihelani Phase 2 was re-filed on 12/23/2025, and Puuloa Solar was re-filed on 12/19/2025. On 11/24/2025, a PPA was executed for Mahi Solar (40 MW / 120 MWh BESS on Oahu) and an application for PUC approval was filed on 11/26/2025. On 9/22/2025 a PPA was executed for Ameresco’s Ukiu Energy project (40 MW firm generation facility on Maui) and an application for PUC approval was filed on 9/26/2025. On 11/12/2025, the PUC suspended the docket and instructed the utility to detail the project’s compliance with the Hawaii Environmental Policy Act and demonstrate that environmental review for the project is not required by HRS Chapter 343-5. On 3/11/2026, the utility filed its Amended and Restated (A&R) PPA executed by the utility and Ukiu Energy LLC and other matters relating to the 40 MWt firm dispatchable capacity and energy. On 3/25/2026, the PUC issued an order that lifted the suspension of this docket. On 5/21/2026, an A&R PPA for Keamuku was executed and an application for PUC approval was filed on 5/29/2026. On 5/21/2026, an A&R PPA for Kaheawa Wind Power (30 MW wind) was also executed and an application for PUC approval was filed on 5/29/2026. On 5/26/2026, 6/16/2026, and 6/24/2026, the PUC approved the PPAs with Mahi Solar, Puuloa Solar, and Kuihelani Phase 2, respectively. Stage 3 RFP Contract negotiations ongoing. Integrated Grid Planning- Second Cycle (IGP) Next phase of long-range planning, combining planning and procurement of traditional and non-traditional resources 2026-0001 On 1/2/2026, the PUC issued an order to open the second cycle of IGP. By 1/31/2026, the PUC ordered the utility to file (1) a Second Cycle Workplan in this docket, and (2) an initial inputs-and-assumptions package. On 3/2/2026, the utility filed its Second Cycle Workplan and initial inputs-and-assumptions package for PUC and stakeholder review. On 6/30/2026, the utility filed its IGP Action Plan Annual Update. On 7/17/2026 the utility requested that the PUC open a new proceeding to review and approve an RFP for ~500 MW of fuel flexible firm generation on Oʻahu, to be administered concurrently with the utility’s IGP RFP. On 8/5/2026 the PUC responded, informing the utility that a demonstration of need must be made before advancing a procurement of this size. TBD
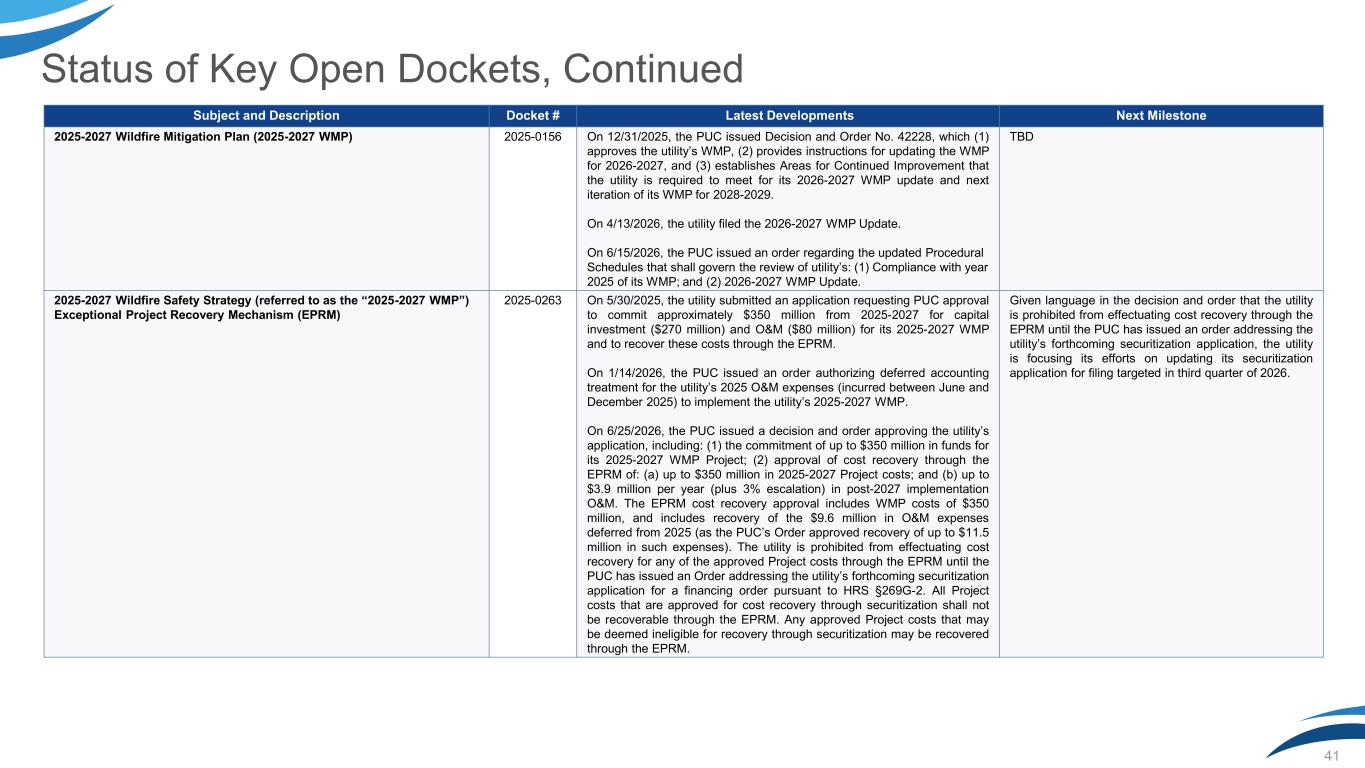
41 Subject and Description Docket # Latest Developments Next Milestone 2025-2027 Wildfire Mitigation Plan (2025-2027 WMP) 2025-0156 On 12/31/2025, the PUC issued Decision and Order No. 42228, which (1) approves the utility’s WMP, (2) provides instructions for updating the WMP for 2026-2027, and (3) establishes Areas for Continued Improvement that the utility is required to meet for its 2026-2027 WMP update and next iteration of its WMP for 2028-2029. On 4/13/2026, the utility filed the 2026-2027 WMP Update. On 6/15/2026, the PUC issued an order regarding the updated Procedural Schedules that shall govern the review of utility’s: (1) Compliance with year 2025 of its WMP; and (2) 2026-2027 WMP Update. TBD 2025-2027 Wildfire Safety Strategy (referred to as the “2025-2027 WMP”) Exceptional Project Recovery Mechanism (EPRM) 2025-0263 On 5/30/2025, the utility submitted an application requesting PUC approval to commit approximately $350 million from 2025-2027 for capital investment ($270 million) and O&M ($80 million) for its 2025-2027 WMP and to recover these costs through the EPRM. On 1/14/2026, the PUC issued an order authorizing deferred accounting treatment for the utility’s 2025 O&M expenses (incurred between June and December 2025) to implement the utility’s 2025-2027 WMP. On 6/25/2026, the PUC issued a decision and order approving the utility’s application, including: (1) the commitment of up to $350 million in funds for its 2025-2027 WMP Project; (2) approval of cost recovery through the EPRM of: (a) up to $350 million in 2025-2027 Project costs; and (b) up to $3.9 million per year (plus 3% escalation) in post-2027 implementation O&M. The EPRM cost recovery approval includes WMP costs of $350 million, and includes recovery of the $9.6 million in O&M expenses deferred from 2025 (as the PUC’s Order approved recovery of up to $11.5 million in such expenses). The utility is prohibited from effectuating cost recovery for any of the approved Project costs through the EPRM until the PUC has issued an Order addressing the utility’s forthcoming securitization application for a financing order pursuant to HRS §269G-2. All Project costs that are approved for cost recovery through securitization shall not be recoverable through the EPRM. Any approved Project costs that may be deemed ineligible for recovery through securitization may be recovered through the EPRM. Given language in the decision and order that the utility is prohibited from effectuating cost recovery through the EPRM until the PUC has issued an order addressing the utility’s forthcoming securitization application, the utility is focusing its efforts on updating its securitization application for filing targeted in third quarter of 2026. Status of Key Open Dockets, Continued
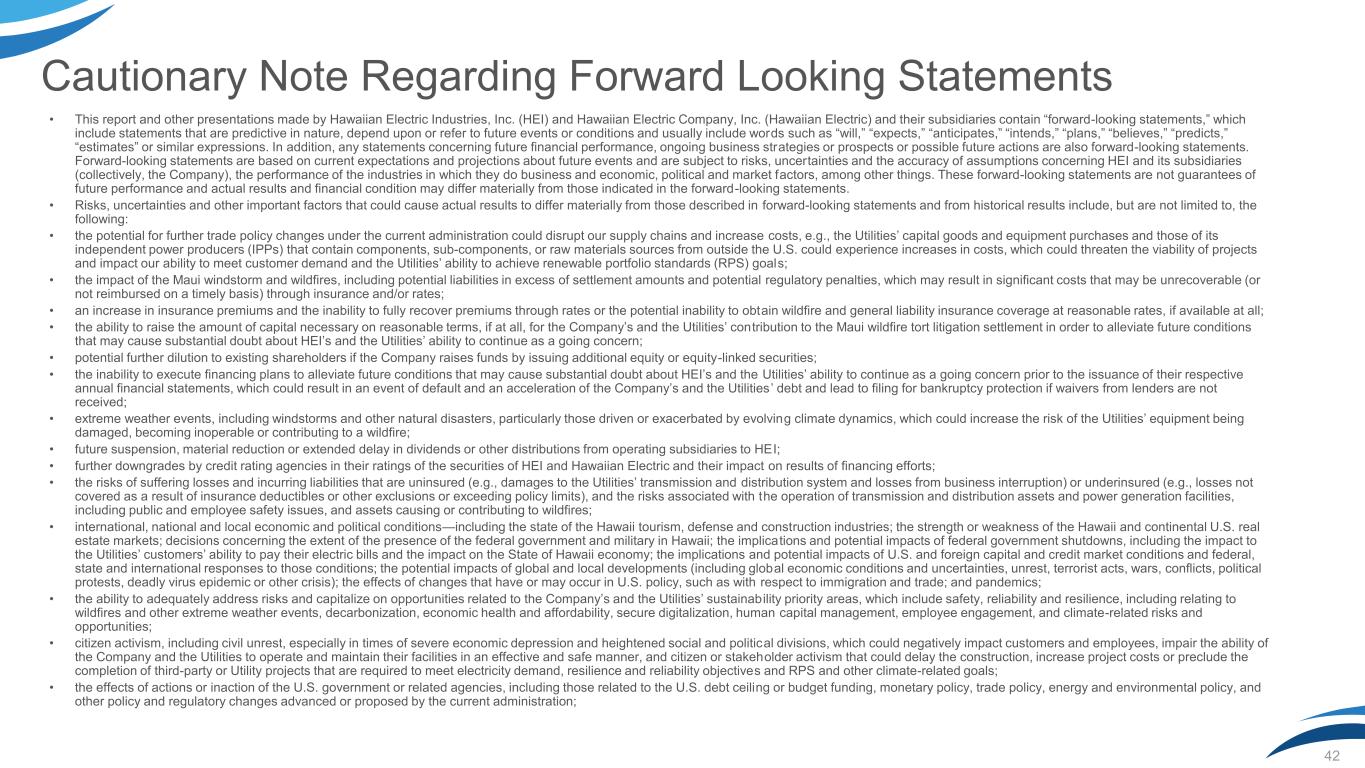
Cautionary Note Regarding Forward Looking Statements • This report and other presentations made by Hawaiian Electric Industries, Inc. (HEI) and Hawaiian Electric Company, Inc. (Hawaiian Electric) and their subsidiaries contain “forward-looking statements,” which include statements that are predictive in nature, depend upon or refer to future events or conditions and usually include words such as “will,” “expects,” “anticipates,” “intends,” “plans,” “believes,” “predicts,” “estimates” or similar expressions. In addition, any statements concerning future financial performance, ongoing business strategies or prospects or possible future actions are also forward-looking statements. Forward-looking statements are based on current expectations and projections about future events and are subject to risks, uncertainties and the accuracy of assumptions concerning HEI and its subsidiaries (collectively, the Company), the performance of the industries in which they do business and economic, political and market factors, among other things. These forward-looking statements are not guarantees of future performance and actual results and financial condition may differ materially from those indicated in the forward-looking statements. • Risks, uncertainties and other important factors that could cause actual results to differ materially from those described in forward-looking statements and from historical results include, but are not limited to, the following: • the potential for further trade policy changes under the current administration could disrupt our supply chains and increase costs, e.g., the Utilities’ capital goods and equipment purchases and those of its independent power producers (IPPs) that contain components, sub-components, or raw materials sources from outside the U.S. could experience increases in costs, which could threaten the viability of projects and impact our ability to meet customer demand and the Utilities’ ability to achieve renewable portfolio standards (RPS) goals; • the impact of the Maui windstorm and wildfires, including potential liabilities in excess of settlement amounts and potential regulatory penalties, which may result in significant costs that may be unrecoverable (or not reimbursed on a timely basis) through insurance and/or rates; • an increase in insurance premiums and the inability to fully recover premiums through rates or the potential inability to obtain wildfire and general liability insurance coverage at reasonable rates, if available at all; • the ability to raise the amount of capital necessary on reasonable terms, if at all, for the Company’s and the Utilities’ contribution to the Maui wildfire tort litigation settlement in order to alleviate future conditions that may cause substantial doubt about HEI’s and the Utilities’ ability to continue as a going concern; • potential further dilution to existing shareholders if the Company raises funds by issuing additional equity or equity-linked securities; • the inability to execute financing plans to alleviate future conditions that may cause substantial doubt about HEI’s and the Utilities’ ability to continue as a going concern prior to the issuance of their respective annual financial statements, which could result in an event of default and an acceleration of the Company’s and the Utilities’ debt and lead to filing for bankruptcy protection if waivers from lenders are not received; • extreme weather events, including windstorms and other natural disasters, particularly those driven or exacerbated by evolving climate dynamics, which could increase the risk of the Utilities’ equipment being damaged, becoming inoperable or contributing to a wildfire; • future suspension, material reduction or extended delay in dividends or other distributions from operating subsidiaries to HEI; • further downgrades by credit rating agencies in their ratings of the securities of HEI and Hawaiian Electric and their impact on results of financing efforts; • the risks of suffering losses and incurring liabilities that are uninsured (e.g., damages to the Utilities’ transmission and distribution system and losses from business interruption) or underinsured (e.g., losses not covered as a result of insurance deductibles or other exclusions or exceeding policy limits), and the risks associated with the operation of transmission and distribution assets and power generation facilities, including public and employee safety issues, and assets causing or contributing to wildfires; • international, national and local economic and political conditions—including the state of the Hawaii tourism, defense and construction industries; the strength or weakness of the Hawaii and continental U.S. real estate markets; decisions concerning the extent of the presence of the federal government and military in Hawaii; the implications and potential impacts of federal government shutdowns, including the impact to the Utilities’ customers’ ability to pay their electric bills and the impact on the State of Hawaii economy; the implications and potential impacts of U.S. and foreign capital and credit market conditions and federal, state and international responses to those conditions; the potential impacts of global and local developments (including global economic conditions and uncertainties, unrest, terrorist acts, wars, conflicts, political protests, deadly virus epidemic or other crisis); the effects of changes that have or may occur in U.S. policy, such as with respect to immigration and trade; and pandemics; • the ability to adequately address risks and capitalize on opportunities related to the Company’s and the Utilities’ sustainab ility priority areas, which include safety, reliability and resilience, including relating to wildfires and other extreme weather events, decarbonization, economic health and affordability, secure digitalization, human capital management, employee engagement, and climate-related risks and opportunities; • citizen activism, including civil unrest, especially in times of severe economic depression and heightened social and political divisions, which could negatively impact customers and employees, impair the ability of the Company and the Utilities to operate and maintain their facilities in an effective and safe manner, and citizen or stakeholder activism that could delay the construction, increase project costs or preclude the completion of third-party or Utility projects that are required to meet electricity demand, resilience and reliability objectives and RPS and other climate-related goals; • the effects of actions or inaction of the U.S. government or related agencies, including those related to the U.S. debt ceiling or budget funding, monetary policy, trade policy, energy and environmental policy, and other policy and regulatory changes advanced or proposed by the current administration; 42
Cautionary Note Regarding Forward Looking Statements continued • weather, natural disasters (e.g., hurricanes, earthquakes, tsunamis, lightning strikes, lava flows and the effects of evolving climate dynamics, such as more severe storms, flooding, droughts, heat waves, and rising sea levels) and wildfires, including their impact on the resilience and reliability and cost of the Company’s and Util ities’ operations, and the economy; • the timing, speed and extent of changes in interest rates and the shape of the yield curve, which could result in higher borrowing costs and changes in market liquidity; • the continued ability of the Company and the Utilities to access the credit and capital markets to fund necessary investments and expenditures (e.g., to obtain short-term and long-term debt financing, including lines of credit, and, in the case of HEI, to issue common stock) under volatile and challenging market conditions, and the potential higher cost of such financings, if available, and due to the uncertainties associated with the costs related to the Maui windstorm and wildfires; • the risks inherent in changes in the value of the Company’s pension and other retirement plan assets, and the risks inherent in changes in the value of the Company’s pension liabilities, including changes driven by stock market values, interest rates and mortality improvements; • changes in laws, regulations (including tax regulations), market conditions, interest rates and other factors that result in changes in assumptions used to calculate retirement benefits costs and funding requirements; • the potential delay by the Public Utilities Commission of the State of Hawaii (PUC) in considering (and potential disapproval of actual or proposed) proposals related to rate rebasing, performance-based regulation (PBR), wildfire safety, renewable energy or grid resiliency, among others, and related costs; reliance by the Util ities on outside parties such as the State, IPPs and developers; supply-chain challenges; and uncertainties surrounding technologies, solar power, wind power, biofuels, liquefied natural gas, environmental assessments required to meet RPS and other climate-related goals; the impacts of implementation of the wildfire mitigation, renewable energy and resilience proposals on future costs of electricity and potential penalties imposed by the PUC for delays in the commercial operations of renewable energy projects; • the ability of the Utilities to develop, execute and recover the implementation costs of the Utilities’ action plans included in their Integrated Grid Plan, which was accepted by the PUC in 2024, due to the recent issuance of the PUC’s 2024 Inclinations on the Future of Energy in Hawaii, Governor Josh Green’s Executive Order No. 25-01, Accelerating Hawaii’s Transition Toward 100 Percent Renewable Energy, and the Hawaii State Energy Office’s Alternative Fuel, Repowering and Energy Transition Study on the aforementioned plans of the Util ities; • the ability of the Utilities to recover undepreciated cost of fossil fuel generating units, if they are required to be retired before the end of their expected useful life; • capacity and supply constraints or difficulties, especially if generating units (utility-owned or IPP-owned) fail or measures such as demand-side management, distributed generation, combined heat and power or other firm capacity supply-side resources fall short of achieving their forecasted benefits or are otherwise insufficient to reduce or meet peak demand; • high and/or volatile fuel prices, which increases working capital requirements and customer bills, or delivery of adequate fuel by suppliers (including as a result of the Iran war, Russia-Ukraine war and conflicts in the Middle East), which could affect the reliability of utility operations, and the continued availability to the Utilities of their Energy Cost Recovery Clauses (ECRCs); • the continued availability to the Utilities or modifications of other cost recovery mechanisms, including the Purchased Power Adjustment Clauses (PPACs), annual revenue adjustment (ARA) and pension and postretirement benefits other than pensions (OPEB) tracking mechanisms, and the continued decoupling of revenues from sales to mitigate the effects of declining kilowatt-hour sales; • the ability of the Utilities to recover increasing or additional costs (e.g., due to trade policies imposed by the current administration, tariffs, inflation, or other factors impacting prices) and earn a reasonable return on capital investments not covered by the ARA, while providing the customer dividend required by PBR; • the impact from the PUC’s modification of the PBR for the Utilities pursuant to Act 005, Session Laws 2018, including the potential changes to existing and/or addition of new Performance Incentive Mechanisms (PIMs), third-party proposals adopted by the PUC, and the implications of not achieving performance incentive goals; • the impact of fuel price levels and volatility on customer satisfaction and political and regulatory support for the Utilities; • unfavorable changes in economic conditions, such as sustained inflation, higher interest rates or recession, that negatively impact the ability of the Company’s customers to pay their utility bills and increase operating costs of the Utilities that cannot be passed on to, or recovered, from customers; • the risks associated with increasing reliance on renewable energy, including the availability and cost of non-fossil fuel supplies for renewable energy generation and the operational impacts and related cost impacts of adding intermittent sources of renewable energy to the electric grid; • the growing risk that energy production from renewable generating resources may be curtailed and the interconnection of additional resources will be constrained as more generating resources are added to the Utilities’ electric systems and as customers reduce their energy usage; • the ability of IPPs to deliver the firm capacity anticipated in their power purchase agreements (PPAs); • the potential that, as IPP contracts near the end of their terms, there may be less economic incentive for the IPPs to make investments in their units to ensure the availability of their units; • the ability of the Utilities to negotiate, periodically, favorable agreements for significant resources such as fuel supply contracts and collective bargaining agreements and avoid or mitigate labor disputes and work stoppages; 43
Cautionary Note Regarding Forward Looking Statements continued • new technological developments that could affect the operations and prospects of the Utilities or their competitors such as the commercial development of energy storage and microgrids; • the potential that cyber or physical security incidents, including potential incidents at HEI, its subsidiaries (including at electric utility plants), third-party service providers, contractors and customers with whom they have shared data (IPPs, distributed energy resources aggregators and customers enrolled under distributed energy resources programs) and incidents at data processing centers used, to the extent not prevented by physical and cybersecurity protections, could result in operational disruption; the misappropriation or loss of confidential or proprietary assets, information or data, including customer, employee, financial, or operating system information, or intellectual property; corruption of data; or potential costs, lost revenues, litigation, or reputational harm; • failure to achieve remaining cost savings commitment related to the management audit recommendations of $6.6 million per year during the multi-year rate period (MRP) from June 2021 to May 2026, and continuing until the second MRP begins; • federal, state, county and international governmental and regulatory actions, such as existing, new and changes in laws, rules and regulations applicable to HEI and the Utilities (including changes in taxation and tax rates, increases in capital requirements, regulatory policy changes, environmental laws and regulations (including result ing compliance costs and risks of fines and penalties and/or liabilities), the regulation of greenhouse gas emissions, governmental fees and assessments, and potential carbon pricing or “cap and trade” legislation that may fundamentally alter costs to produce electricity and accelerate the move to renewable generation); • the impact from the PUC’s implementation of wheeling for the Utilities, including cost shifting and customer equity considerations, the potential increased competition, and other legal and technical implications, pursuant to Act 266, which authorizes wheeling of renewable energy and requires the PUC to establish associated policies and procedures; • the impact of competitive pressures from third-party alternative generation resources and regulatory changes affecting the Company’s utility franchise may negatively impact its growth prospects, market position, and stock price; • developments in laws, regulations and policies governing protections for historic, archaeological and cultural sites, and plant and animal species and habitats, as well as developments in the implementation and enforcement of such laws, regulations and policies; • discovery of conditions that may be attributable to historical chemical releases, including any necessary investigation and remediation, and any associated enforcement, litigation or regulatory oversight; • decisions by the PUC in rate cases and other proceedings (including the risks of delays in the timing of decisions, adverse changes in final decisions from interim decisions and the disallowance of project costs as a result of adverse regulatory audit reports or otherwise); • decisions by the PUC and by other agencies and courts on land use, environmental and other permitting issues (such as required corrective actions, restrictions and penalties that may arise, such as with respect to environmental conditions or RPS); • the risks associated with the geographic concentration of HEI’s businesses; • changes in accounting principles applicable to HEI and its subsidiaries, including the adoption of new U.S. accounting standards, the potential discontinuance of regulatory accounting related to PBR or other regulatory changes, the effects of potentially required consolidation of variable interest entities (VIEs), or required finance lease or on-balance-sheet operating lease accounting for PPAs with IPPs; • the final outcome of tax positions taken by HEI and its subsidiaries; • the ability to effectively utilize federal and state net operating loss carryforwards; • the ability to service the non-recourse debt of Mahipapa, LLC, the last remaining operating subsidiary of Pacific Current, LLC, a non-regulated subsidiary of the Company, if the Company is unable to complete the sale of Mahipapa, LLC; • the Company’s reliance on third parties and the risk of their non-performance; and • other risks or uncertainties described elsewhere in this report (e.g., Item 1A. Risk Factors) and in other reports previously and subsequently filed by HEI and/or Hawaiian Electric with the Securities and Exchange Commission (SEC). Forward-looking statements speak only as of the date of the report, presentation or filing in which they are made. Except to the extent required by the federal securities laws, HEI, Hawaiian Electric, Pacific Current and their subsidiaries undertake no obligation to publicly update or revise any forward-looking statements, whether written or oral and whether as a result of new information, future events or otherwise. 44
45 Explanation of HEI’s Use of Certain Unaudited Non-GAAP Measures HEI management uses certain non-GAAP measures to evaluate the performance of HEI. Management believes these non-GAAP measures provide useful information and are a better indicator of the companies’ core operating activities. Core earnings per share (EPS), core net income and other financial measures as presented here may not be comparable to similarly titled measures used by other companies. The accompanying tables provide a reconciliation of reported GAAP earnings to non-GAAP Core earnings. The reconciling adjustments from GAAP earnings to Core earnings are limited to the costs related to the Maui wildfires and costs related to the ongoing review of strategic options for Pacific Current. Management does not consider these items to be representative of the company’s fundamental Core earnings.
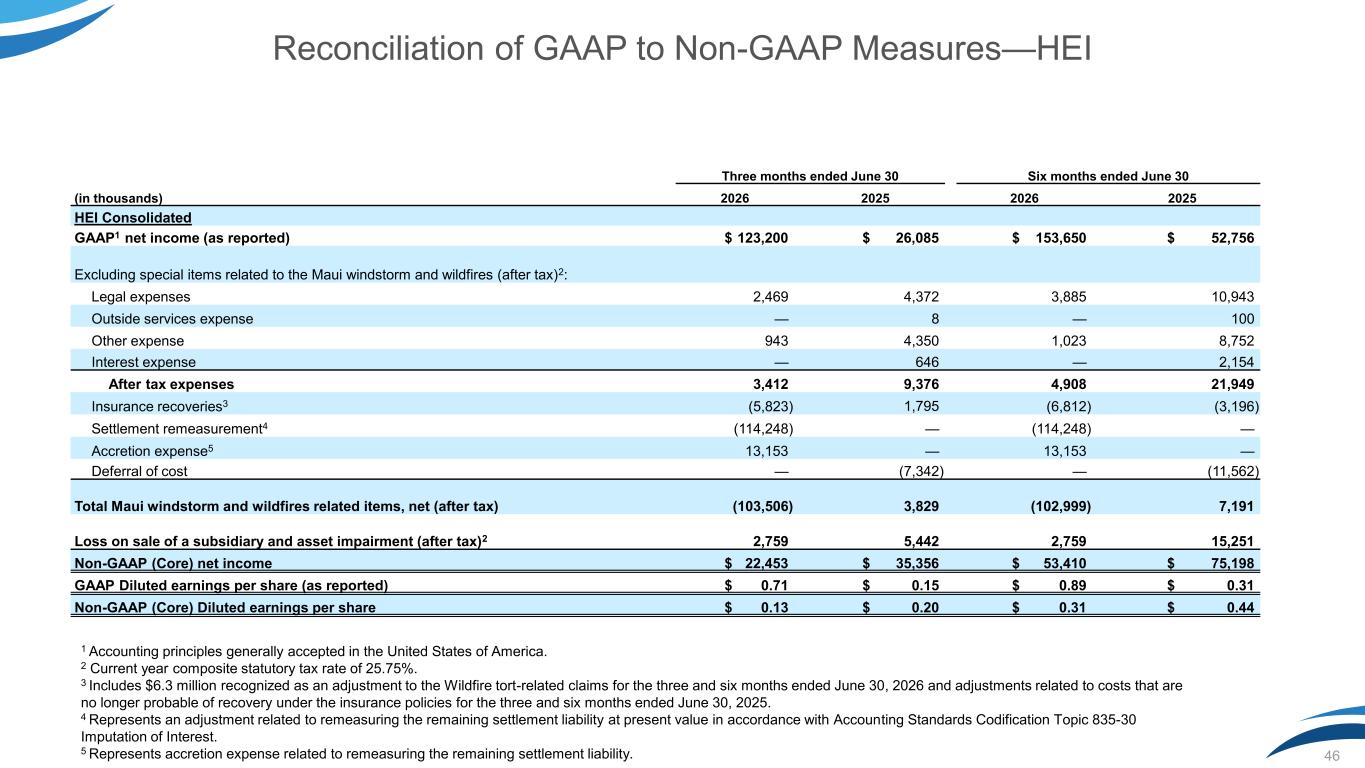
46 Reconciliation of GAAP to Non-GAAP Measures—HEI 1 Accounting principles generally accepted in the United States of America. 2 Current year composite statutory tax rate of 25.75%. 3 Includes $6.3 million recognized as an adjustment to the Wildfire tort-related claims for the three and six months ended June 30, 2026 and adjustments related to costs that are no longer probable of recovery under the insurance policies for the three and six months ended June 30, 2025. 4 Represents an adjustment related to remeasuring the remaining settlement liability at present value in accordance with Accounting Standards Codification Topic 835-30 Imputation of Interest. 5 Represents accretion expense related to remeasuring the remaining settlement liability. Three months ended June 30 Six months ended June 30 (in thousands) 2026 2025 2026 2025 HEI Consolidated GAAP1 net income (as reported) $ 123,200 $ 26,085 $ 153,650 $ 52,756 Excluding special items related to the Maui windstorm and wildfires (after tax)2: Legal expenses 2,469 4,372 3,885 10,943 Outside services expense — 8 — 100 Other expense 943 4,350 1,023 8,752 Interest expense — 646 — 2,154 After tax expenses 3,412 9,376 4,908 21,949 Insurance recoveries3 (5,823) 1,795 (6,812) (3,196) Settlement remeasurement4 (114,248) — (114,248) — Accretion expense5 13,153 — 13,153 — Deferral of cost — (7,342) — (11,562) Total Maui windstorm and wildfires related items, net (after tax) (103,506) 3,829 (102,999) 7,191 Loss on sale of a subsidiary and asset impairment (after tax)2 2,759 5,442 2,759 15,251 Non-GAAP (Core) net income $ 22,453 $ 35,356 $ 53,410 $ 75,198 GAAP Diluted earnings per share (as reported) $ 0.71 $ 0.15 $ 0.89 $ 0.31 Non-GAAP (Core) Diluted earnings per share $ 0.13 $ 0.20 $ 0.31 $ 0.44
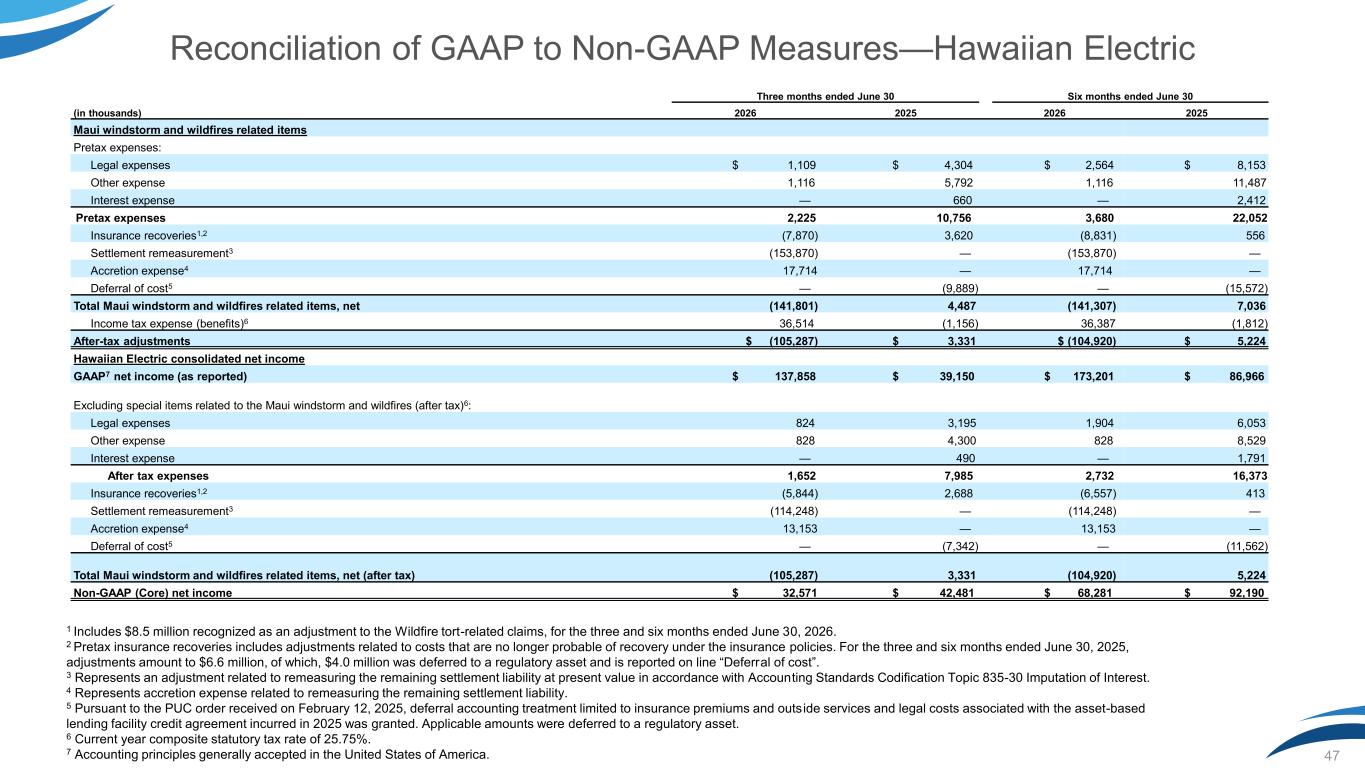
47 Reconciliation of GAAP to Non-GAAP Measures—Hawaiian Electric 1 Includes $8.5 million recognized as an adjustment to the Wildfire tort-related claims, for the three and six months ended June 30, 2026. 2 Pretax insurance recoveries includes adjustments related to costs that are no longer probable of recovery under the insurance policies. For the three and six months ended June 30, 2025, adjustments amount to $6.6 million, of which, $4.0 million was deferred to a regulatory asset and is reported on line “Deferral of cost”. 3 Represents an adjustment related to remeasuring the remaining settlement liability at present value in accordance with Accounting Standards Codification Topic 835-30 Imputation of Interest. 4 Represents accretion expense related to remeasuring the remaining settlement liability. 5 Pursuant to the PUC order received on February 12, 2025, deferral accounting treatment limited to insurance premiums and outside services and legal costs associated with the asset-based lending facility credit agreement incurred in 2025 was granted. Applicable amounts were deferred to a regulatory asset. 6 Current year composite statutory tax rate of 25.75%. 7 Accounting principles generally accepted in the United States of America. Three months ended June 30 Six months ended June 30 (in thousands) 2026 2025 2026 2025 Maui windstorm and wildfires related items Pretax expenses: Legal expenses $ 1,109 $ 4,304 $ 2,564 $ 8,153 Other expense 1,116 5,792 1,116 11,487 Interest expense — 660 — 2,412 Pretax expenses 2,225 10,756 3,680 22,052 Insurance recoveries1,2 (7,870) 3,620 (8,831) 556 Settlement remeasurement3 (153,870) — (153,870) — Accretion expense4 17,714 — 17,714 — Deferral of cost5 — (9,889) — (15,572) Total Maui windstorm and wildfires related items, net (141,801) 4,487 (141,307) 7,036 Income tax expense (benefits)6 36,514 (1,156) 36,387 (1,812) After-tax adjustments $ (105,287) $ 3,331 $ (104,920) $ 5,224 Hawaiian Electric consolidated net income GAAP7 net income (as reported) $ 137,858 $ 39,150 $ 173,201 $ 86,966 Excluding special items related to the Maui windstorm and wildfires (after tax)6: Legal expenses 824 3,195 1,904 6,053 Other expense 828 4,300 828 8,529 Interest expense — 490 — 1,791 After tax expenses 1,652 7,985 2,732 16,373 Insurance recoveries1,2 (5,844) 2,688 (6,557) 413 Settlement remeasurement3 (114,248) — (114,248) — Accretion expense4 13,153 — 13,153 — Deferral of cost5 — (7,342) — (11,562) Total Maui windstorm and wildfires related items, net (after tax) (105,287) 3,331 (104,920) 5,224 Non-GAAP (Core) net income $ 32,571 $ 42,481 $ 68,281 $ 92,190
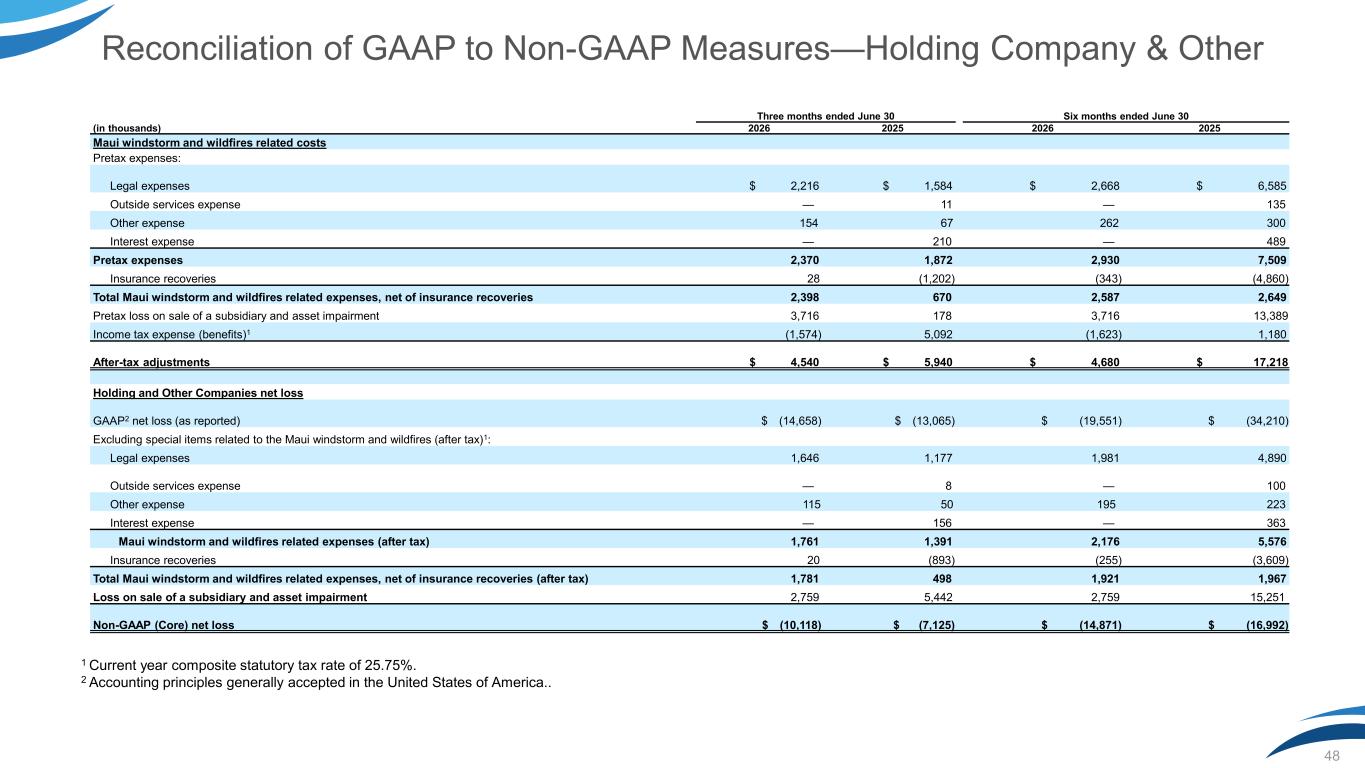
48 Reconciliation of GAAP to Non-GAAP Measures—Holding Company & Other 1 Current year composite statutory tax rate of 25.75%. 2 Accounting principles generally accepted in the United States of America.. Three months ended June 30 Six months ended June 30 (in thousands) 2026 2025 2026 2025 Maui windstorm and wildfires related costs Pretax expenses: Legal expenses $ 2,216 $ 1,584 $ 2,668 $ 6,585 Outside services expense — 11 — 135 Other expense 154 67 262 300 Interest expense — 210 — 489 Pretax expenses 2,370 1,872 2,930 7,509 Insurance recoveries 28 (1,202) (343) (4,860) Total Maui windstorm and wildfires related expenses, net of insurance recoveries 2,398 670 2,587 2,649 Pretax loss on sale of a subsidiary and asset impairment 3,716 178 3,716 13,389 Income tax expense (benefits)1 (1,574) 5,092 (1,623) 1,180 After-tax adjustments $ 4,540 $ 5,940 $ 4,680 $ 17,218 Holding and Other Companies net loss GAAP2 net loss (as reported) $ (14,658) $ (13,065) $ (19,551) $ (34,210) Excluding special items related to the Maui windstorm and wildfires (after tax)1: Legal expenses 1,646 1,177 1,981 4,890 Outside services expense — 8 — 100 Other expense 115 50 195 223 Interest expense — 156 — 363 Maui windstorm and wildfires related expenses (after tax) 1,761 1,391 2,176 5,576 Insurance recoveries 20 (893) (255) (3,609) Total Maui windstorm and wildfires related expenses, net of insurance recoveries (after tax) 1,781 498 1,921 1,967 Loss on sale of a subsidiary and asset impairment 2,759 5,442 2,759 15,251 Non-GAAP (Core) net loss $ (10,118) $ (7,125) $ (14,871) $ (16,992)