
KINS 8-K
Kingstone Companies, Inc. (KINS)
8-K
2020-11-06
For: 2020-11-06
View Original
Added on
April 06, 2026
UNITED STATES
SECURITIES AND EXCHANGE COMMISSION
WASHINGTON, DC 20549
_______
FORM 8-K
CURRENT REPORT
Pursuant
to Section 13 or 15(d) of the
Securities
Exchange Act of 1934
Date of
Report November 6,
2020
(Date
of earliest event reported)
(Exact
Name of Registrant as Specified in Charter)
|
|
|
|
|
|
|
(State
or Other Jurisdiction
of
Incorporation)
|
|
(Commission
File No.)
|
|
(IRS
Employer Identification
Number)
|
|
|
|
|
|
(Address
of Principal Executive Offices)
|
|
(Zip
Code)
|
Registrant's
telephone number, including area code: (845 )
802-7900
Check
the appropriate box below if the Form 8-K filing is intended to
simultaneously satisfy the filing obligation of the registrant
under any of the following provisions:
Securities
registered pursuant to Section 12(b) of the Act:
|
Title
of each class
|
Trading
Symbol(s)
|
Name of
each exchange on which registered
|
|
|
|
|
Indicate
by check mark whether the registrant is an emerging growth company
as defined in Rule 405 of the Securities Act of 1933 (§230.405
of this chapter) or Rule 12b-2 of the Securities Exchange Act of
1934 (§240.12b-2 of this chapter).
Emerging
growth company ☐
If an
emerging growth company, indicate by check mark if the registrant
has elected not to use the extended transition period for complying
with any new or revised financial accounting standards provided
pursuant to Section 13(a) of the Exchange Act. ☐
Item 2.02
Results of Operations and Financial
Condition.
On
November 6, 2020 Kingstone Companies, Inc. (the
“Company”) issued a press release (the “Press
Release”) announcing its financial results for the fiscal period ended September 30,
2020. The Press Release also announced that the Company’s
Board of Directors has declared a $0.04 per share quarterly
dividend payable on December 15, 2020 to stockholders of record at
the close of business on November 30, 2020. A copy of the Press
Release is furnished as Exhibit 99.1 hereto.
The
information furnished with this Item 2.02, including Exhibit 99.1,
shall not be deemed “filed” for purposes of Section 18
of the Securities Exchange Act of 1934, as amended (the
“Exchange Act”), or otherwise subject to liabilities of
that section, nor shall it be deemed incorporated by reference into
any other filing under the Securities Act of 1933, as amended (the
“Securities Act”), or the Exchange Act, except as
expressly set forth by specific reference in such
filing.
Item 7.01
Regulation FD Disclosure.
Attached
as Exhibit 99.2 is additional financial information about the
Company (the “Additional Financial
Information”).
The
information furnished with this Item 7.01, including Exhibit 99.2,
shall not be deemed as “filed” for purposes of Section
18 of the Exchange Act or otherwise subject to the liabilities of
that section, nor shall it be deemed incorporated by reference into
any other filing under the Securities Act, or the Exchange Act,
except as expressly set forth by specific reference in such
filing.
Item 9.01
Financial Statements and
Exhibits.
(d) Exhibits.
Press release,
dated November 6, 2020, issued by Kingstone Companies,
Inc.
Additional
Financial Information for Q3 2020.
SIGNATURES
Pursuant to the
requirements of the Securities Exchange Act of 1934, the registrant
has duly caused this report to be signed on its behalf by the
undersigned hereunto duly authorized.
|
|
KINGSTONE COMPANIES, INC.
|
|
|
|
|
|
|
|
|
Dated:
November 6, 2020
|
By:
|
/s/
Barry B. Goldstein
|
|
|
|
|
Barry
B, Goldstein
|
|
|
|
|
President
and CEO
|
|
|
|
|
|
|
Exhibit 99.1
FOR IMMEDIATE RELEASE
Kingstone
Announces 2020 Third Quarter Financial Results
Company to Host Conference Call on November 9, 2020 at 8:30 a.m.
ET
Kingston, NY —
November 6, 2020 – Kingstone Companies, Inc.
(Nasdaq: KINS) (the
“Company” or “Kingstone”), a Northeast
regional property and casualty insurance holding company, today
announced its financial results for the quarter ended September 30,
2020.
Financial and Operational Highlights
2020 Third Quarter
(All results are compared to prior year period unless otherwise
noted)
●
Catastrophes, primarily Tropical Storm Isaias,
added 31.5% to net loss ratio for the quarter; Net combined ratio
excluding the impact of catastrophes1
was 80.4%
●
Direct written premiums1
from personal lines grew by
6.4%; Direct written
premiums1
including commercial liability lines
in run off decreased by 0.6%
●
Net loss ratio excluding commercial lines in run
off and catastrophe losses1
of 42.1% compared to
53.5%
●
Net operating income (loss) exclusive of
catastrophe losses1
per diluted share of $0.54 compared to
$(.19)
●
Book value per share of $8.37 down $0.03 from Q2
after $0.64 per share impact from catastrophes 1
Quarterly Dividend of $0.04 per share
The Company announced that its Board of Directors declared a
quarterly dividend of $0.04 per share payable on December 15, 2020
to stockholders of record at the close of business on November 30,
2020.
____________________
1 These measures are not based on accounting principles
generally accepted in the United States (“GAAP”) and
are defined and reconciled to the most directly comparable GAAP
measures in Form 8-K Exhibit 99.2 “Additional Financial
Information for Q3 2020” (also available at
www.kingstonecompanies.com).
Management Commentary
Barry Goldstein, Kingstone’s Chief Executive Officer,
elaborated on the Company’s results:
“Our third quarter’s results demonstrate the progress
we’ve made and the resilience of our company. As we announced
on October 7th,
losses and loss adjustment expenses incurred attributable to
Tropical Storm Isaias were sizeable and the most since Superstorm
Sandy in 2012. It led to a full catastrophe retention ($8.125
million pre-tax) being absorbed by Kingstone in the third quarter.
Isaias drove our quarterly combined ratio to a very poor 111.9%.
Peel back the onion just one layer and you’ll find that, by
itself, Isaias’ loss and loss adjustment expense added 29.5
points to the combined ratio.
Apart from catastrophes, we posted an excellent combined ratio of
80.4%. Increased rates are being rolled on and earned in. Our exit
from commercial liability lines is complete; our final policy ran
off at the end of September. No longer will these highly volatile
lines adversely impact our company. Our focus on profitability is
yielding the anticipated results.
Meryl Golden, Kingstone’s Chief Operating Officer,
continued:
“Relative to Isaias, I am happy to report that almost 90% of
these claims are now closed and feel really good about the efforts
of our claims organization in achieving this outcome.
“We are pleased with our x-catastrophe results this quarter
and the improvement we are seeing over the prior year. We are also
in a good place from a reserving perspective. The reserve
strengthening we took last year was appropriate, with our reserves
being solidly in the middle of our outside actuary’s mid-year
review, which was recently completed. The runoff of commercial
liability claims continues to be favorable, and we recorded our
fourth straight quarter of stable prior year loss
development.
I am also happy to share that Kingstone 2.0, our effort to
modernize the Company, continues to progress well. In Q3 we
implemented our new claims system and filed our new Homeowners
program in NY. In Q4, we will file our new Condo/Tenant and
Dwelling Fire programs in NY, introduce a new interface for our
Select Producers and start the conversion to our new policy
management system. We have been able to make these investments
without an increase in expenses, after adjusting for the Quota
Share. We are excited to see the impact on Company performance of
these initiatives.”
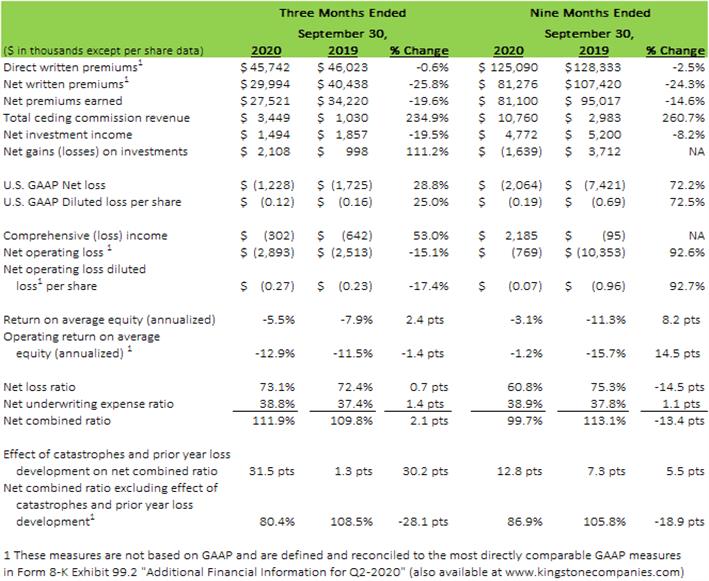
Financial Highlights Table
2020 Third Quarter Financial Review
Net Loss:
There was a net loss of $1.2 million during the three-month period
ended September 30, 2020, compared to net loss of $1.7 million in
the prior year period. The decrease in net loss in the latest
three-month period can be attributed to the increase in ceding
commissions due to the inception of a 25% personal lines quota
share on December 15, 2019 and the dramatic positive swing in
financial markets that have been reversing the unrealized losses
from the first quarter resulting from the impact of the Covid-19
pandemic, offset by the decrease in net premiums earned due to the
inception of 25% personal lines quota share. The net loss ratio for
the latest three-month period increased by 0.7 points compared to
the prior three month period, as described in the ‘Net Loss
Ratio and Underlying Net Loss Ratio Excluding Commercial
Lines’ section below.
Earnings (Loss) per share (“EPS”):
Kingstone reported a loss of $0.12 per diluted share for the three
months ended September 30, 2020, compared to loss of $0.16 per
diluted share for the three months ended September 30, 2019. EPS
for the three-month periods ended September 30, 2020 and 2019 was
based on 10.67 million and 10.78 million weighted average diluted
shares outstanding, respectively.
Direct
Written Premiums1,
Net Written Premiums1
and Net
Premiums Earned (See Definitions and Non-GAAP Measures
below):
Direct written premiums1
for the third quarter of 2020 were
$45.7 million, a decrease of $0.3 million, or 0.6%, from $46.0
million in the prior year period. The increase in premiums from
personal lines was offset by a $2.0 million decrease in premiums
from our commercial lines business as result of our decision in
July 2019 to no longer underwrite this line of business, and a
decrease in premiums from livery physical damage due to a decline
in business from the Covid-19 pandemic. Direct written premiums
from our personal lines business for the third quarter of 2020 were
$43.6 million, an increase of $2.6 million, or 6.4%, from $41.0
million in the prior year period.
We refer to our New York business as “Core”
1
and the business in other states as
“Expansion” 1.
Expansion direct written premiums 1
for the third quarter of 2020 were
$9.2 million, an increase of $1.8 million from the $7.4 million
written in the prior year period.
Net written premiums1
decreased 25.8% to $30.0 million
during the three-month period ended September 30, 2020 from $40.4
million in the prior year period. The decrease in the third quarter
was attributable to the
inception of a 25% personal lines quota share on December 15, 2019
and the decrease in commercial lines premiums which are not subject
to a quota share treaty.
Net premiums earned for the quarter ended September 30, 2020
decreased 19.6% to $27.5 million, compared to $34.2 million for the
quarter ended September 30, 2019. The decrease was attributable to
the inception of a 25% personal lines quota share on December 15,
2019 and the decrease in commercial lines premiums which are not
subject to a quota share treaty. The 10% personal lines quota share
was in run-off for the quarter ended September 30,
2019.
Net Loss Ratio and Underlying Net Loss Ratio Excluding Commercial
Lines1:
For the quarter ended September 30, 2020 (“Three Months
2020”), the net loss ratio increased 0.7 points, from 72.4%
for the quarter ended September 30, 2019 (“Three Months
2019”) to 73.1% in Three Months 2020. The net loss ratio
increased due to the impact of catastrophe events, primarily
related to Tropical Storm Isaias on August 4, 2020. Partially
offsetting the increased catastrophe losses, there was a large
reduction in the impact of prior year loss development compared the
same period in the prior year.
The impact of catastrophe losses was significant in Three Months
2020 when compared to Three Months 2019. In the Three Months 2020,
Tropical Storm Isaias resulted in over 1,700 reported claims and
direct losses exceeded our catastrophe reinsurance retention of $10
million. After quota share reinsurance, the net impact of Isaias is
$8.125 million, or a 29.5 point impact on the quarterly loss ratio.
There were several smaller catastrophe events during the quarter,
and in total the impact of catastrophe events on the loss ratio was
31.5 points for the quarter. This compares to a 1.3 point impact
from catastrophe events in Three Months 2019, or an increase in the
impact from catastrophe events of 30.2 points compared to the prior
period.
Prior year development was slightly favorable in Three Months 2020,
with a 0.4 point favorable impact to the overall loss ratio. This
was the fourth consecutive quarter of stable prior year loss
development. The favorable loss development for Three Months 2020
compares to 14.7 points of unfavorable impact in Three Months 2019.
Prior year loss development in Three Months 2019 was driven by the
completion of reserve adjustments for commercial lines business,
which is now in runoff. As of the end of Three Months 2020, there
are were 189 open commercial lines claims, down from 205 claims
that were open at June 30, 2020. The impact of prior year
development was 15.1 points more favorable in Three Months 2020
compared to the prior year period.
The underlying loss ratio (loss ratio excluding the impact of
catastrophes and prior year development) 1
was 42.0% for Three Months 2020, a
decrease of 14.4 points from the 56.4% underlying loss ratio
recorded for Three Months 2019. The improvement was primarily
due to reduced claim severity in personal lines, driven by a much
lower impact from large fire claims in Three Months 2020 compared
to the prior period. Claim frequency in the livery physical damage
line also continued to show significant improvement over the prior
year period. The impact of commercial lines on the overall loss
ratio continues to decline due to a smaller open claims inventory
and a smaller proportion of net earned premium attributable to
commercial lines. Excluding commercial lines, the underlying loss
ratio improved 8.9 points, from 51.4% for Three Months 2019 to
42.5% for Three Months 2020.
Net Other Underwriting Expense Ratio:
For the quarter ended September 30, 2020, the net underwriting
expense ratio was 38.8% as compared to 37.4% in the prior year
period, an increase of 1.4 percentage points. The 1.4 percentage
point increase in the net underwriting expense ratio is
attributable to the effect that the 25% personal lines quota share
treaty and the elimination of the commercial lines business had on
decreasing net premiums earned.
____________________
1 These measures are not based on GAAP and are defined and
reconciled to the most directly comparable GAAP measures in Form
8-K Exhibit 99.2 “Additional Financial Information for Q3
2020” (also available at www.kingstonecompanies.com).
Balance Sheet / Investment Portfolio
Kingstone’s cash and investment holdings were $220.7 million
at September 30, 2020 compared to $221.6 million at September 30,
2019. The Company’s investment holdings are comprised
primarily of investment grade corporate, mortgage-backed and
municipal securities, with fixed income investments representing
approximately 83.5% of total investments at September 30, 2020 and
86.8% at September 30, 2019. The Company’s effective duration
on its fixed-income portfolio is 4.7 years.
Net investment income decreased 19.5% to $1.49 million for the
third quarter of 2020 from $1.86 million in the prior year
period.
Accumulated Other Comprehensive Income (AOCI)
As of September 30, 2020, AOCI was $9.02 million compared to $4.44
million at September 30, 2019.
Book Value
The Company’s book value per share at September 30, 2020 was
$8.37, an increase of 4.1% compared to $8.04 at September 30,
2019.
FOR ADDITIONAL INFORMATION PLEASE VISIT OUR WEBSITE AT
WWW.KINGSTONECOMPANIES.COM.
Conference Call Details
Management will discuss the Company’s operations and
financial results in a conference call on Monday, November 9, 2020,
at 8:30 a.m. ET.
The dial-in numbers are:
(877) 407-3105 (U.S.)
(201) 493-6794 (International)
Accompanying Webcast
The
call will be simultaneously webcast over the Internet via the
Kingstone website or by clicking on the conference call link:
Third
Quarter 2020 Earnings Conference Call
The
webcast will be archived and accessible for approximately 30
days.
Definitions and Non-GAAP Measures
Direct written premiums represent the total premiums charged on policies
issued by the Company during the respective fiscal period.
Net
premiums written are direct
written premiums less premiums ceded to reinsurers. Net premiums
earned, the GAAP measure most comparable to direct written premiums
and net premiums written, are net premiums written that are
pro-rata earned during the fiscal period presented. All of the
Company’s policies are written for a twelve-month period.
Management uses direct written premiums and net premiums written,
along with other measures, to gauge the Company’s performance
and evaluate results.
Core direct written premiums - represents the total premiums charged on
policies issued by the Company during the respective fiscal period
from its business located in New York.
Expansion direct written premiums - represents the total premiums charged on
policies issued by the Company during the respective fiscal period
from its business located in other states (i.e., outside New
York).
Net operating income (loss) - is net income (loss)
exclusive of realized investment gains (losses), net of tax. Net
income (loss) is the GAAP measure most closely comparable to net
operating income (loss).
Management
uses net operating income (loss) along with other measures to gauge
the Company’s performance and evaluate results, which can be
skewed when including realized investment gains (losses), and may
vary significantly between periods. Net operating income (loss) is
provided as supplemental information, not as a substitute for net
income (loss) and does not reflect the Company’s overall
profitability.
Operating return on average common equity - is net operating
income (loss) divided by average common equity. Return on average
common equity is the GAAP measure most closely comparable to
operating return on average common equity.
Management
uses net operating income (loss) and operating return on average
common equity, along with other measures, to gauge the
Company’s performance and evaluate results, which can be
skewed when including realized investment gains (losses), which may
vary significantly between periods. Net operating income (loss) and
operating return on average common equity are provided as
supplemental information, are not a substitute for net income
(loss) or return on average common equity and do not reflect the
Company’s overall profitability or return on average common
equity.
Underlying net loss ratio - is a non-GAAP ratio, which is computed
as the difference between GAAP net loss ratio and the effect of
catastrophes and prior year loss development on the net loss
ratio.
Underlying net loss ratio excluding Commercial Lines
- is a non-GAAP ratio, which
is computed as the difference between GAAP net loss ratio and the
loss ratio that relates to commercial lines, catastrophes, and
prior year loss development.
Net loss ratio excluding commercial lines - is a non-GAAP ratio, which is computed
as the difference between GAAP net loss ratio and the loss ratio
that relates to commercial lines.
Net loss ratio excluding commercial lines in run-off and
catastrophes - is a
non-GAAP ratio, which is computed as the difference between GAAP
net loss ratio and the loss ratio that relates to commercial lines
in run-off and catastrophes.
Net combined ratio excluding effect of catastrophes and prior year
loss development - is a non-GAAP ratio, which is computed as
the difference between GAAP net combined ratio and the effect of
catastrophes and prior year loss development on the net combined
ratio.
Net combined ratio excluding effect of catastrophes - is a
non-GAAP ratio, which is computed as the difference between GAAP
net combined ratio and the effect of catastrophes on the net
combined ratio.
We
believe that these ratios are useful to investors and they are used
by management to reveal the trends in our business that may be
obscured by catastrophe losses and prior year loss development, as
well as the loss ratio that relates to commercial lines which is in
run off. Catastrophe losses cause our loss ratios to vary
significantly between periods as a result of their incidence of
occurrence and magnitude, and can have a significant impact on the
net loss ratio and net combined ratio. Prior year loss development
can cause our loss ratio to vary significantly between periods and
separating this information allows us to better compare the results
for the current accident period over time. Due to our decision in
July 2019 to no longer underwrite commercial lines, excluding the
loss ratio related to such line of business allows us to compare
our loss ratio with regard to our ongoing lines of business. We
believe these measures are useful for investors to evaluate these
components separately and in the aggregate when reviewing our
underwriting performance. We also provide them to facilitate a
comparison to our outlook on the underlying net loss ratio
excluding commercial lines and net combined ratio excluding the
effect of catastrophes and prior year loss development. The most
directly comparable GAAP measures are the net loss ratio and net
combined ratio. The underlying net loss ratio excluding commercial
lines, net loss ratio excluding commercial lines and net combined
ratio excluding the effect of catastrophes and prior year loss
development should not be considered a substitute for the net loss
ratio and net combined ratio and do not reflect the Company’s
net loss ratio and net combined ratio.
Book value per share exclusive of catastrophes – is a
non-GAAP ratio which is computed as the difference between GAAP
book value per share and the effect of catastrophes on book value
per share.
___________________________________________________________________________________________________
About Kingstone Companies, Inc.
Kingstone
is a northeast regional property and casualty insurance holding
company whose principal operating subsidiary is Kingstone Insurance
Company (“KICO”). KICO is a New York domiciled carrier
writing business through retail and wholesale agents and brokers.
KICO offers primarily personal lines insurance products in New
York, New Jersey, Rhode Island, Massachusetts, and Connecticut.
Kingstone is also licensed in Pennsylvania, New Hampshire and
Maine.
Forward-Looking Statements
Statements
in this press release may contain “forward-looking
statements” within the meaning of the Private Securities
Litigation Reform Act of 1995. All statements, other than
statements of historical facts, may be forward-looking statements.
These statements are based on management’s current
expectations and are subject to uncertainty and changes in
circumstances. These statements involve risks and uncertainties
that could cause actual results to differ materially from those
included in forward-looking statements due to a variety of factors.
For more details on factors that could affect expectations, see
Part I, Item 1A of our Annual Report on Form 10-K for the year
ended December 31, 2019 under “Factors That May Affect Future
Results and Financial Condition” and Part II, Item 1A of our
Quarterly Report on Form 10-Q for the period ended September 30,
2020, to be filed with the Securities and Exchange Commission.
Kingstone undertakes no obligation to publicly update or revise any
forward-looking statements, whether as a result of new information,
future events or otherwise, except as required by law.
CONTACT:
Kingstone Companies, Inc.
Amanda
M. Goldstein
Investor
Relations Director
(516)
960-1319
Exhibit 99.2
Additional Financial Information for Q3 2020
Definitions and Non-GAAP Measures
Direct written premiums represent the total premiums charged on policies
issued by the Company during the respective fiscal period.
Net
premiums written are direct
written premiums less premiums ceded to reinsurers. Net premiums
earned, the GAAP measure most comparable to direct written premiums
and net premiums written, are net premiums written that are
pro-rata earned during the fiscal period presented. All of the
Company’s policies are written for a twelve-month period.
Management uses direct written premiums and net premiums written,
along with other measures, to gauge the Company’s performance
and evaluate results.
Core direct written premiums - represents the total premiums charged on
policies issued by the Company during the respective fiscal period
from its business located in New York.
Expansion direct written premiums - represents the total premiums charged on
policies issued by the Company during the respective fiscal period
from its business located in other states (i.e., outside New
York).
Net operating income (loss) - is net income (loss)
exclusive of realized investment gains (losses), net of tax. Net
income (loss) is the GAAP measure most closely comparable to net
operating income (loss).
Management
uses net operating income (loss) along with other measures to gauge
the Company’s performance and evaluate results, which can be
skewed when including realized investment gains (losses), and may
vary significantly between periods. Net operating income (loss) is
provided as supplemental information, not as a substitute for net
income (loss) and does not reflect the Company’s overall
profitability.
Operating return on average common equity - is net operating
income (loss) divided by average common equity. Return on average
common equity is the GAAP measure most closely comparable to
operating return on average common equity.
Management
uses net operating income (loss) and operating return on average
common equity, along with other measures, to gauge the
Company’s performance and evaluate results, which can be
skewed when including realized investment gains (losses), which may
vary significantly between periods. Net operating income (loss) and
operating return on average common equity are provided as
supplemental information, are not a substitute for net income
(loss) or return on average common equity and do not reflect the
Company’s overall profitability or return on average common
equity.
Underlying net loss ratio - is a non-GAAP ratio, which is computed
as the difference between GAAP net loss ratio and the effect of
catastrophes and prior year loss development on the net loss
ratio.
Underlying net loss ratio excluding Commercial Lines
- is a non-GAAP ratio, which
is computed as the difference between GAAP net loss ratio and the
loss ratio that relates to commercial lines, catastrophes, and
prior year loss development.
Net loss ratio excluding commercial lines - is a non-GAAP ratio, which is computed
as the difference between GAAP net loss ratio and the loss ratio
that relates to commercial lines.
Net loss ratio excluding commercial lines in run-off and
catastrophes - is a
non-GAAP ratio, which is computed as the difference between GAAP
net loss ratio and the loss ratio that relates to commercial lines
in run-off and catastrophes.
Net combined ratio excluding effect of catastrophes and prior year
loss development - is a non-GAAP ratio, which is computed as
the difference between GAAP net combined ratio and the effect of
catastrophes and prior year loss development on the net combined
ratio.
Net combined ratio excluding effect of catastrophes - is a
non-GAAP ratio, which is computed as the difference between GAAP
net combined ratio and the effect of catastrophes on the net
combined ratio.
We
believe that these ratios are useful to investors and they are used
by management to reveal the trends in our business that may be
obscured by catastrophe losses and prior year loss development, as
well as the loss ratio that relates to commercial lines which is in
run off. Catastrophe losses cause our loss ratios to vary
significantly between periods as a result of their incidence of
occurrence and magnitude, and can have a significant impact on the
net loss ratio and net combined ratio. Prior year loss development
can cause our loss ratio to vary significantly between periods and
separating this information allows us to better compare the results
for the current accident period over time. Due to our decision in
July 2019 to no longer underwrite commercial lines, excluding the
loss ratio related to such line of business allows us to compare
our loss ratio with regard to our ongoing lines of business. We
believe these measures are useful for investors to evaluate these
components separately and in the aggregate when reviewing our
underwriting performance. We also provide them to facilitate a
comparison to our outlook on the underlying net loss ratio
excluding commercial lines and net combined ratio excluding the
effect of catastrophes and prior year loss development. The most
directly comparable GAAP measures are the net loss ratio and net
combined ratio. The underlying net loss ratio excluding commercial
lines, net loss ratio excluding commercial lines and net combined
ratio excluding the effect of catastrophes and prior year loss
development should not be considered a substitute for the net loss
ratio and net combined ratio and do not reflect the Company’s
net loss ratio and net combined ratio.
Book value per share exclusive of catastrophes – is a
non-GAAP ratio which is computed as the difference between GAAP
book value per share and the effect of catastrophes on book value
per share.
______________________________________________________________________________________________________
Book Value Per Share
The Company’s book value per share at September 30, 2020 was
$8.40, an increase of 4.1% compared to $8.04 at September 30,
2019.
|
|
30-Sep-20
|
30-Jun-20
|
31-Mar-20
|
31-Dec-19
|
c30-Sep-19
|
|
Book Value Per Share
|
$8.37
|
$8.40
|
$7.13
|
$8.17
|
$8.04
|
|
|
|
|
|
|
|
|
% Increase from specified period to 9/30/20
|
|
-0.4%
|
17.4%
|
2.4%
|
4.1%
|
The table below reconciles direct written premiums and net written
premiums to net premiums earned for the periods
presented:
|
|
For the Three Months Ended
|
For the Nine Months Ended
|
||||||
|
|
September 30,
|
September 30,
|
||||||
|
|
2020
|
2019
|
$ Change
|
% Change
|
2020
|
2019
|
$ Change
|
% Change
|
|
|
|
|
|
|
|
|
|
|
|
(000’s
except percentages)
|
|
|
|
|
|
|
|
|
|
Direct and Net Written Premiums Reconciliation:
|
|
|
|
|
|
|
|
|
|
|
|
|
|
|
|
|
|
|
|
Direct written premiums
|
$45,742
|
$46,023
|
$(281)
|
(0.6)%
|
$125,090
|
$128,333
|
$(3,243)
|
(2.5)%
|
|
Assumed
written premiums
|
-
|
1
|
(1)
|
-%
|
-
|
1
|
(1)
|
-%
|
|
Ceded written
premiums
|
(15,748)
|
(5,586)
|
(10,162)
|
(181.9)%
|
(43,814)
|
(20,914)
|
(22,900)
|
(109.5)%
|
|
|
|
|
|
|
|
|
|
|
|
Net written premiums
|
29,994
|
40,438
|
(10,444)
|
(25.8)%
|
81,276
|
107,420
|
(26,144)
|
(24.3)%
|
|
Change in
unearned premiums
|
(2,473)
|
(6,218)
|
3,745
|
60.2%
|
(176)
|
(12,403)
|
12,227
|
98.6%
|
|
|
|
|
|
|
|
|
|
|
|
Net premiums earned
|
$27,521
|
$34,220
|
$(6,699)
|
(19.6)%
|
$81,100
|
$95,017
|
$(13,917)
|
(14.6)%
|
The table below details the breakdown of direct written premiums
between Core direct written premiums and Expansion direct written
premiums for the periods presented:
|
|
For the Three Months Ended
|
For the Nine Months Ended
|
||||||
|
|
September 30,
|
September 30,
|
||||||
|
|
2020
|
2019
|
$ Change
|
% Change
|
2020
|
2019
|
$ Change
|
% Change
|
|
(000’s
except percentages)
|
|
|
|
|
|
|
|
|
|
Core and Expansion Direct Written Premiums
Reconciliation:
|
|
|
|
|
|
|
|
|
|
|
|
|
|
|
|
|
|
|
|
Core direct written premiums
|
$36,545
|
$38,652
|
$(2,107)
|
(5.5)%
|
$100,797
|
$111,433
|
$(10,636)
|
(9.5)%
|
|
Expansion direct written premiums
|
9,197
|
7,371
|
1,826
|
24.8%
|
24,293
|
16,900
|
7,393
|
43.7%
|
|
Direct written premiums
|
$45,742
|
$46,023
|
$(281)
|
(0.6)%
|
$125,090
|
$128,333
|
$(3,243)
|
(2.5)%
|
The following table reconciles net operating income (loss) to net
income (loss) and operating return on average common equity to
return on average common equity for the periods
indicated:
|
|
Three Months Ended
|
Three Months Ended
|
Nine Months Ended
|
Nine Months Ended
|
||||
|
|
September 30, 2020
|
September 30, 2019
|
September 30, 2020
|
September 30, 2019
|
||||
|
|
|
|
|
|
|
|
|
|
|
|
Amount
|
Diluted loss
per common share
|
Amount
|
Diluted loss
per common share
|
Amount
|
Diluted loss
per common share
|
Amount
|
Diluted loss
per common share
|
|
(000’s
except per common share amounts and
percentages)
|
|
|
|
|
|
|
|
|
|
Net
Operating Loss and Diluted Loss per Common Share
Reconciliation:
|
|
|
|
|
|
|
|
|
|
|
|
|
|
|
|
|
|
|
|
Net loss
|
$(1,228)
|
$(0.12)
|
$(1,725)
|
$(0.16)
|
$(2,064)
|
$(0.19)
|
$(7,421)
|
$(0.69)
|
|
|
|
|
|
|
|
|
|
|
|
Net realized
(gain) loss on investments
|
(2,108)
|
|
(998)
|
|
1,639
|
|
(3,712)
|
|
|
Less tax
(expense) benefit on net realized (gain) loss
|
(443)
|
|
(210)
|
|
344
|
|
(780)
|
|
|
|
|
|
|
|
|
|
|
|
|
Net realized
(gain) loss on investments, net of taxes
|
(1,665)
|
$(0.16)
|
(788)
|
$(0.07)
|
1,295
|
$0.12
|
(2,932)
|
$(0.27)
|
|
|
|
|
|
|
|
|
|
|
|
Net operating loss
|
$(2,893)
|
$(0.27)
|
$(2,513)
|
$(0.23)
|
$(769)
|
$(0.07)
|
$(10,353)
|
$(0.96)
|
|
|
|
|
|
|
|
|
|
|
|
Weighted
average diluted shares outstanding
|
10,673,077
|
|
10,779,641
|
|
10,737,853
|
|
10,769,817
|
|
|
|
|
|
|
|
|
|
|
|
|
Operating Return on Average Common Equity (Annualized)
Reconciliation:
|
|
|
|
|
|
|
|
|
|
|
|
|
|
|
|
|
|
|
|
Net loss
|
$(1,228)
|
|
$(1,725)
|
|
$(2,064)
|
|
$(7,421)
|
|
|
Average common
equity
|
$89,467
|
|
$87,203
|
|
$88,768
|
|
$87,701
|
|
|
Return on average common equity (annualized)
|
-5.5%
|
|
-7.9%
|
|
-3.1%
|
|
-11.3%
|
|
|
|
|
|
|
|
|
|
|
|
|
Net realized
(gain) loss on investments, net of taxes
|
$(1,665)
|
|
$(788)
|
|
$1,295
|
|
$(2,932)
|
|
|
Average common
equity
|
$89,467
|
|
$87,203
|
|
$88,768
|
|
$87,701
|
|
|
Effect of net
realized (gain) loss on investments, net of taxes, on return on
average common equity (annualized)
|
-7.4%
|
|
-3.6%
|
|
1.9%
|
|
-4.5%
|
|
|
|
|
|
|
|
|
|
|
|
|
Net operating loss
|
$(2,893)
|
|
$(2,513)
|
|
$(769)
|
|
$(10,353)
|
|
|
Average common
equity
|
$89,467
|
|
$87,203
|
|
$88,768
|
|
$87,701
|
|
|
|
|
|
|
|
|
|
|
|
|
Operating return on average common equity
(annualized)
|
-12.9%
|
|
-11.5%
|
|
-1.2%
|
|
-15.7%
|
|
The following table reconciles the underlying net loss ratio
excluding commercial lines to the net loss ratio for the periods
presented:
|
|
For the Three Months Ended
|
For the Nine Months Ended
|
||||||
|
|
September 30,
|
September 30,
|
||||||
|
|
|
|
|
|
|
|
|
|
|
|
2020
|
2019
|
Change
|
2020
|
2019
|
Change
|
||
|
Underlying
Net Loss Ratio Excluding Commercial lines
Reconciliation:
|
|
|
|
|
|
|
|
|
|
|
|
|
|
|
|
|
|
|
|
Net loss and
loss adjustment expenses ("Net loss")
|
|
|
|
|
|
|
|
|
|
Underlying Net Loss Excluding Commercial lines
|
$11,597
|
$15,653
|
$(4,056)
|
-25.9%
|
$36,928
|
$44,069
|
$(7,141)
|
-16.2%
|
|
Commercial
lines net loss
|
(44)
|
8,023
|
(8,067)
|
-100.5%
|
2,863
|
18,459
|
(15,596)
|
-84.5%
|
|
Catastrophe
losses excluding commercial lines
|
8,665
|
492
|
8,173
|
1661.2%
|
10,375
|
6,783
|
3,592
|
53.0%
|
|
Prior year
loss development excluding commercial lines
|
(100)
|
613
|
(713)
|
-116.3%
|
(849)
|
2,277
|
(3,126)
|
-137.3%
|
|
Net loss
|
$20,118
|
$24,781
|
$(4,663)
|
-18.8%
|
$49,317
|
$71,588
|
$(22,271)
|
-31.1%
|
|
|
|
|
|
|
|
|
|
|
|
Net premiums
earned
|
|
|
|
|
|
|
|
|
|
Net premiums earned excluding commercial lines
|
27,285
|
30,475
|
(3,190)
|
-10.5%
|
78,387
|
83,981
|
(5,594)
|
-6.7%
|
|
Commercial
lines net premiums earned
|
236
|
3,745
|
(3,509)
|
-93.7%
|
2,712
|
11,036
|
(8,324)
|
-75.4%
|
|
Net premiums earned
|
$27,521
|
$34,220
|
$(6,699)
|
-19.6%
|
$81,099
|
$95,017
|
$(13,918)
|
-14.6%
|
|
|
|
|
|
|
|
|
|
|
|
Underlying net loss ratio excluding commercial
lines
|
42.5%
|
51.4%
|
(8.9)
|
pts
|
47.1%
|
52.5%
|
(5.4)
|
pts
|
|
|
|
|
|
|
|
|
|
|
|
Net loss ratio
|
73.1%
|
72.4%
|
0.7
|
pts
|
60.8%
|
75.3%
|
(14.5)
|
pts
|
The following table reconciles the net loss ratio excluding
commercial lines in run-off and catastrophe losses to the net loss
ratio for the periods presented:
|
|
For the Three Months Ended
|
For the Nine Months Ended
|
||||||
|
|
September 30,
|
September 30,
|
||||||
|
|
|
|
|
|
|
|
|
|
|
|
2020
|
2019
|
Change
|
2020
|
2019
|
Change
|
||
|
Net Loss Ratio Excluding Commercial Lines in Run-off and
Catastrophe Losses Reconciliation:
|
|
|
|
|
|
|
|
|
|
|
|
|
|
|
|
|
|
|
|
Net loss and
loss adjustment expenses ("Net loss")
|
|
|
|
|
|
|
|
|
|
Net Loss Ratio Excluding Commercial Lines in Run-off and
Catastrophe Losses
|
$11,497
|
$16,312
|
$(4,815)
|
-29.5%
|
$36,079
|
$46,182
|
$(10,103)
|
-21.9%
|
|
Commercial
lines net loss
|
(44)
|
8,023
|
(8,067)
|
-100.5%
|
2,863
|
18,459
|
(15,596)
|
-84.5%
|
|
Catastrophe
losses
|
8,665
|
446
|
8,219
|
1842.8%
|
10,375
|
6,947
|
3,428
|
49.3%
|
|
Net loss
|
$20,118
|
$24,781
|
$(4,663)
|
-18.8%
|
$49,317
|
$71,588
|
$(22,271)
|
-31.1%
|
|
|
|
|
|
|
|
|
|
|
|
Net premiums
earned
|
|
|
|
|
|
|
|
|
|
Net premiums earned excluding commercial lines in
run-off
|
27,285
|
30,475
|
(3,190)
|
-10.5%
|
78,387
|
83,981
|
(5,594)
|
-6.7%
|
|
Commercial
lines net premiums earned
|
236
|
3,745
|
(3,509)
|
-93.7%
|
2,712
|
11,036
|
(8,324)
|
-75.4%
|
|
Net premiums earned
|
$27,521
|
$34,220
|
$(6,699)
|
-19.6%
|
$81,099
|
$95,017
|
$(13,918)
|
-14.6%
|
|
|
|
|
|
|
|
|
|
|
|
Net Loss Ratio Excluding Commercial Lines in Run-off and
Catastrophe Losses
|
42.1%
|
53.5%
|
(11.4)
|
pts
|
46.0%
|
55.0%
|
(9.0)
|
pts
|
|
|
|
|
|
|
|
|
|
|
|
Net loss ratio
|
73.1%
|
72.4%
|
0.7
|
pts
|
60.8%
|
75.3%
|
(14.5)
|
pts
|
The following table reconciles the net loss ratio excluding
commercial lines to the net loss ratio for the periods
presented:
|
|
For the Three Months Ended
|
For the Nine Months Ended
|
||||||
|
|
September 30,
|
September 30,
|
||||||
|
|
|
|
|
|
|
|
|
|
|
|
2020
|
2019
|
Change
|
2020
|
2019
|
Change
|
||
|
Net Loss Ratio Excluding Commercial Lines
Reconciliation:
|
|
|
|
|
|
|
|
|
|
|
|
|
|
|
|
|
|
|
|
Net loss and
loss adjustment expenses ("Net loss")
|
|
|
|
|
|
|
|
|
|
Net Loss Excluding Commercial Lines
|
$20,162
|
$16,758
|
$3,404
|
20.3%
|
$46,454
|
$53,129
|
$(6,675)
|
-12.6%
|
|
Commercial
lines net loss
|
(44)
|
8,023
|
(8,067)
|
-100.5%
|
2,863
|
18,459
|
(15,596)
|
-84.5%
|
|
Net loss
|
$20,118
|
$24,781
|
$(4,663)
|
-18.8%
|
$49,317
|
$71,588
|
$(22,271)
|
-31.1%
|
|
|
|
|
|
|
|
|
|
|
|
Net premiums
earned
|
|
|
|
|
|
|
|
|
|
Net premiums earned excluding commercial lines
|
27,285
|
30,475
|
(3,190)
|
-10.5%
|
78,387
|
83,981
|
(5,594)
|
-6.7%
|
|
Commercial
lines net premiums earned
|
236
|
3,745
|
(3,509)
|
-93.7%
|
2,712
|
11,036
|
(8,324)
|
-75.4%
|
|
Net premiums earned
|
$27,521
|
$34,220
|
$(6,699)
|
-19.6%
|
$81,099
|
$95,017
|
$(13,918)
|
-14.6%
|
|
|
|
|
|
|
|
|
|
|
|
Net loss ratio excluding commercial lines
|
73.9%
|
55.0%
|
18.9
|
pts
|
59.3%
|
63.3%
|
(4.0)
|
pts
|
|
|
|
|
|
|
|
|
|
|
|
Net loss ratio
|
73.1%
|
72.4%
|
0.7
|
pts
|
60.8%
|
75.3%
|
(14.5)
|
pts
|
The following table reconciles the net combined ratio excluding
catastrophes and prior year loss development to the net combined
ratio for the periods presented:
|
|
For the Three Months Ended
|
For the Nine Months Ended
|
||||||
|
|
September 30,
|
September 30,
|
||||||
|
|
2020
|
2019
|
Percentage Point Change
|
2020
|
2019
|
Percentage Point Change
|
||
|
Net Combined Ratio Excluding Catastrophes and Prior Year
Development Reconciliation:
|
|
|
|
|
|
|
|
|
|
|
|
|
|
|
|
|
|
|
|
Net Combined Ratio Excluding Catastrophes and Prior Year
Development
|
80.8%
|
93.7%
|
(12.9)
|
pts
|
87.2%
|
94.0%
|
(6.8)
|
pts
|
|
|
|
|
|
|
|
|
|
|
|
Effect
of catastrophe losses and prior year developmen t
|
|
|
|
|
|
|
|
|
|
Catastrophe
losses
|
31.5%
|
1.3%
|
30.2
|
pts
|
12.8%
|
7.3%
|
5.5
|
pts
|
|
Prior year
development
|
-0.4%
|
14.8%
|
(15.2)
|
pts
|
-0.3%
|
11.8%
|
(12.1)
|
pts
|
|
Effect of
catastrophe losses and prior year development on net loss and loss
adjustment expenses
|
31.1%
|
16.1%
|
15.0
|
pts
|
12.5%
|
19.1%
|
(6.6)
|
pts
|
|
Net
underwriting expense ratio
|
0.0%
|
0.0%
|
-
|
pts
|
0.0%
|
0.0%
|
-
|
pts
|
|
Total effect
of catastrophe losses and prior year
development
|
31.1%
|
16.1%
|
15.0
|
pts
|
12.5%
|
19.1%
|
(6.6)
|
pts
|
|
|
|
|
|
|
|
|
|
|
|
Net combined ratio
|
111.9%
|
109.8%
|
2.1
|
pts
|
99.7%
|
113.1%
|
(13.4)
|
pts
|
The following table reconciles the net combined ratio excluding
catastrophes to the net combined ratio for the periods
presented:
|
|
For the Three Months Ended
|
For the Nine Months Ended
|
||||||
|
|
September 30,
|
September 30,
|
||||||
|
|
2020
|
2019
|
Percentage Point Change
|
2020
|
2019
|
Percentage Point Change
|
||
|
Net Combined Ratio Excluding Catastrophes
Reconciliation:
|
|
|
|
|
|
|
|
|
|
|
|
|
|
|
|
|
|
|
|
Net Combined Ratio Excluding Catastrophes
|
80.4%
|
108.5%
|
(28.1)
|
pts
|
86.9%
|
105.8%
|
(18.9)
|
pts
|
|
|
|
|
|
|
|
|
|
|
|
Catastrophe
losses
|
31.5%
|
1.3%
|
30.2
|
pts
|
12.8%
|
7.3%
|
5.5
|
pts
|
|
|
|
|
|
|
|
|
|
|
|
Net combined ratio
|
111.9%
|
109.8%
|
2.1
|
pts
|
99.7%
|
113.1%
|
(13.4)
|
pts
|
The following table reconciles net operating income and diluted
operating earnings per share exclusive of catastrophe and prior
year loss development financial impact to net operating loss and
diluted operating loss per share for the periods
presented:
|
|
For
the Three Months Ended
|
For
the Nine Months Ended
|
||||||
|
|
September
30,
|
September
30,
|
||||||
|
|
2020
|
2019
|
2020
|
2019
|
||||
|
|
|
|
|
|
|
|
|
|
|
|
Amount
|
Diluted (loss) earnings
per common share
|
Amount
|
Diluted (loss) earnings
per common share
|
Amount
|
Diluted (loss) earnings
per common share
|
Amount
|
Diluted (loss) earnings
per common share
|
|
(000’s except per
common share amounts)
|
|
|
|
|
|
|
|
|
|
Net
Operating and Diluted Operating Earnings per Share Exclusive of
Catastrophes and Prior Year Loss Development Financial
Impact:
|
|
|
|
|
|
|
|
|
|
|
|
|
|
|
|
|
|
|
|
Net
operating loss
|
$(2,893)
|
$(0.27)
|
$(2,513)
|
$(0.23)
|
$(769)
|
$(0.07)
|
$(10,353)
|
$(0.96)
|
|
|
|
|
|
|
|
|
|
|
|
Catastrophe and prior year loss development financial
impact
|
|
|
|
|
|
|
|
|
|
Ceding commission
revenue
|
-
|
|
-
|
|
-
|
|
-
|
|
|
Total
expenses
|
8,559
|
|
5,515
|
|
10,095
|
|
18,133
|
|
|
Income from operations
before taxes
|
8,559
|
|
5,515
|
|
10,095
|
|
18,133
|
|
|
Income tax
expense
|
1,797
|
|
1,158
|
|
2,120
|
|
3,808
|
|
|
Total catastrophe and
prior year loss development financial impact
|
6,762
|
$0.63
|
4,357
|
$0.40
|
7,975
|
$0.74
|
14,325
|
$1.33
|
|
|
|
|
|
|
|
|
|
|
|
Net
operating income exclusive of catastrophes and prior year loss
development financial impact
|
$3,869
|
$0.36
|
$1,844
|
$0.17
|
$7,206
|
$0.67
|
$3,972
|
$0.37
|
|
|
|
|
|
|
|
|
|
|
|
Weighted average
diluted shares outstanding
|
10,673,077
|
|
10,779,641
|
|
10,737,853
|
|
10,769,817
|
|
The following table reconciles net operating income (loss) and
diluted operating earnings (loss) per share exclusive of
catastrophe losses to net operating income (loss) and diluted
operating earnings (loss) per share for the periods
presented:
|
|
For the Three Months Ended
|
For the Nine Months Ended
|
||||||
|
|
September 30,
|
September 30,
|
||||||
|
|
2020
|
2019
|
2020
|
2019
|
||||
|
|
|
|
|
|
|
|
|
|
|
|
Amount
|
Diluted (loss)
earnings per common share
|
Amount
|
Diluted loss
per common share
|
Amount
|
Diluted (loss)
earnings per common share
|
Amount
|
Diluted loss
per common share
|
|
(000’s
except per common share amounts)
|
|
|
|
|
|
|
|
|
|
Net
Operating and Diluted Operating Earnings per Share Exclusive of
Catastrophe Losses:
|
|
|
|
|
|
|
|
|
|
|
|
|
|
|
|
|
|
|
|
Net operating loss
|
$(2,893)
|
$(0.27)
|
$(2,513)
|
$(0.23)
|
$(769)
|
$(0.07)
|
$(10,353)
|
$(0.96)
|
|
Catastrophe
losses
|
8,665
|
$0.81
|
446
|
$0.04
|
10,375
|
$0.97
|
6,947
|
$0.65
|
|
|
|
|
|
|
|
|
|
|
|
Net operating income (loss) exclusive of catastrophe
losses
|
$5,772
|
$0.54
|
$(2,067)
|
$(0.19)
|
$9,606
|
$0.90
|
$(3,406)
|
$(0.31)
|
|
|
|
|
|
|
|
|
|
|
|
Weighted
average diluted shares outstanding
|
10,673,077
|
|
10,779,641
|
|
10,737,853
|
|
10,769,817
|
|
The following table reconciles book value per exclusive of
catastrophes to book value per share for the periods
presented:
|
|
For the Three Months Ended
|
For the Nine Months Ended
|
||||||
|
|
September 30,
|
September 30,
|
||||||
|
|
2020
|
2019
|
2020
|
2019
|
||||
|
|
|
|
|
|
|
|
|
|
|
|
Amount
|
Book value per
common share out-standing
|
Amount
|
Book value per
common share out-standing
|
Amount
|
Book value per
common share out-standing
|
Amount
|
Book value per
common share out-standing
|
|
(000’s except per common share amounts)
|
|
|
|
|
|
|
|
|
|
Book Value per Share Exclusive of Catastrophes:
|
|
|
|
|
|
|
|
|
|
|
|
|
|
|
|
|
|
|
|
Stockholders' Equity
|
$89,313
|
$8.37
|
$86,736
|
$8.04
|
$89,313
|
$8.37
|
$86,736
|
$8.04
|
|
|
|
|
|
|
|
|
|
|
|
Catastrophe
losses
|
8,665
|
|
446
|
|
10,375
|
|
6,947
|
|
|
Income tax
expense
|
1,820
|
|
94
|
|
2,179
|
|
1,459
|
|
|
Catastrophe
losses, net of income tax
|
6,845
|
$0.64
|
352
|
$0.03
|
8,196
|
$0.77
|
5,488
|
$0.51
|
|
|
|
|
|
|
|
|
|
|
|
Stockholders' equity exclusive of catastrophes
|
$96,158
|
$9.01
|
$87,088
|
$8.07
|
$97,509
|
$9.14
|
$92,224
|
$8.55
|
|
|
|
|
|
|
|
|
|
|
|
Common shares
outstanding
|
10,675,198
|
|
10,783,572
|
|
10,675,198
|
|
10,783,572
|
|
The following table summarizes gross and net written premiums, net
premiums earned, net loss and loss adjustment expenses and net loss
ratio by major product type, which were determined based primarily
on similar economic characteristics and risks of loss.
|
|
For the Three Months Ended
|
For the Nine Months Ended
|
||
|
|
September 30,
|
September 30,
|
||
|
|
2020
|
2019
|
2020
|
2019
|
|
Gross premiums written:
|
|
|
|
|
|
Personal
lines(3)
|
$43,640,603
|
$40,996,459
|
$119,598,207
|
$109,143,415
|
|
Livery
physical damage
|
2,045,746
|
2,590,434
|
5,466,552
|
8,199,269
|
|
Other(1)
|
62,664
|
401,073
|
192,395
|
535,950
|
|
Total
without commercial lines
|
45,749,013
|
43,987,966
|
125,257,154
|
117,878,634
|
|
Commercial
lines (in run-off effective July 2019)(2)
|
(6,848)
|
2,036,185
|
(167,583)
|
10,455,421
|
|
Total
gross premiums written
|
$45,742,165
|
$46,024,151
|
$125,089,571
|
$128,334,055
|
|
|
|
|
|
|
|
Net premiums written:
|
|
|
|
|
|
Personal
lines(3)
|
$27,916,850
|
$35,442,970
|
$76,231,996
|
$89,287,063
|
|
Livery
physical damage
|
2,045,746
|
2,590,434
|
5,466,552
|
8,199,269
|
|
Other(1)
|
50,626
|
410,317
|
151,784
|
522,596
|
|
Total
without commercial lines
|
30,013,222
|
38,443,721
|
81,850,332
|
98,008,928
|
|
Commercial
lines (in run-off effective July 2019)(2)
|
(18,271)
|
2,004,152
|
(574,228)
|
9,411,053
|
|
Total
net premiums written
|
$29,994,951
|
$40,447,873
|
$81,276,104
|
$107,419,981
|
|
|
|
|
|
|
|
Net premiums earned:
|
|
|
|
|
|
Personal
lines(3)
|
$25,220,883
|
$27,487,526
|
$71,434,757
|
$75,737,374
|
|
Livery
physical damage
|
2,014,458
|
2,712,283
|
6,803,475
|
7,850,822
|
|
Other(1)
|
49,939
|
275,324
|
149,087
|
392,745
|
|
Total
without commercial lines
|
27,285,280
|
30,475,133
|
78,387,319
|
83,980,941
|
|
Commercial
lines (in run-off effective July 2019)(2)
|
235,801
|
3,744,877
|
2,712,068
|
11,036,237
|
|
Total
net premiums earned
|
$27,521,081
|
$34,220,010
|
$81,099,387
|
$95,017,178
|
|
|
|
|
|
|
|
Net loss and loss adjustment expenses(4):
|
|
|
|
|
|
Personal
lines
|
$18,657,325
|
$14,389,168
|
$41,810,950
|
$46,666,275
|
|
Livery
physical damage
|
648,520
|
1,395,630
|
1,798,210
|
3,816,390
|
|
Other(1)
|
29,104
|
246,811
|
5,465
|
573,376
|
|
Unallocated
loss adjustment expenses
|
827,031
|
726,778
|
2,839,359
|
2,072,570
|
|
Total
without commercial lines
|
20,161,980
|
16,758,387
|
46,453,984
|
53,128,611
|
|
Commercial
lines (in run-off effective July 2019)(2)
|
(44,005)
|
8,022,931
|
2,863,443
|
18,459,239
|
|
Total
net loss and loss adjustment expenses
|
$20,117,975
|
$24,781,318
|
$49,317,427
|
$71,587,850
|
|
|
|
|
|
|
|
Net loss ratio(4):
|
|
|
|
|
|
Personal
lines
|
74.0%
|
52.3%
|
58.5%
|
61.6%
|
|
Livery
physical damage
|
32.2%
|
51.5%
|
26.4%
|
48.6%
|
|
Other(1)
|
58.3%
|
89.6%
|
3.7%
|
146.0%
|
|
Total without
commercial lines
|
73.9%
|
55.0%
|
59.3%
|
63.3%
|
|
|
|
|
|
|
|
Commercial
lines (in run-off effective July 2019)(2)
|
-18.7%
|
214.2%
|
105.6%
|
167.3%
|
|
Total
|
73.1%
|
72.4%
|
60.8%
|
75.3%
|
1.
“Other”
includes, among other things, premiums and loss and loss adjustment
expenses from our participation in a mandatory state joint
underwriting association and loss and loss adjustment expenses from
commercial auto.
2.
In July 2019, the
Company decided that it will no longer underwrite Commercial
Liability risks. See discussions above regarding the
discontinuation of this line of business.
3.
See discussion with
regard to “Direct Written Premiums, Net Written Premiums and
Net Premiums Earned” in the Company’s Form 8-K Exhibit
99.1 – Press Release dated November 6, 2020 (also available
at www.kingstonecompanies.com).
4.
See discussions
above with regard to “Net Loss Ratio and Underlying Net Loss
Ratio Excluding Commercial Lines”.
|
KINGSTONE COMPANIES, INC. AND SUBSIDIARIES
|
||||
|
|
|
|
|
|
|
Condensed Consolidated Statements of Operations and Comprehensive
Income (Loss) (Unaudited)
|
||||
|
|
For the Three Months Ended
|
For the Nine Months Ended
|
||
|
|
September 30,
|
September 30,
|
||
|
|
2020
|
2019
|
2020
|
2019
|
|
|
|
|
|
|
|
Revenues
|
|
|
|
|
|
Net
premiums earned
|
$27,521,081
|
$34,220,010
|
$81,099,387
|
$95,017,178
|
|
Ceding
commission revenue
|
3,448,774
|
1,029,582
|
10,760,087
|
2,982,960
|
|
Net
investment income
|
1,494,086
|
1,856,553
|
4,771,936
|
5,200,034
|
|
Net
gains (losses) on investments
|
2,107,876
|
998,162
|
(1,638,674)
|
3,712,180
|
|
Other
income
|
250,654
|
343,391
|
772,672
|
998,927
|
|
Total
revenues
|
34,822,471
|
38,447,698
|
95,765,408
|
107,911,279
|
|
|
|
|
|
|
|
Expenses
|
|
|
|
|
|
Loss and
loss adjustment expenses
|
20,117,975
|
24,781,318
|
49,317,427
|
71,587,850
|
|
Commission
expense
|
8,036,298
|
7,722,825
|
23,652,765
|
21,866,420
|
|
Other
underwriting expenses
|
6,346,846
|
6,430,734
|
19,434,110
|
17,983,174
|
|
Other
operating expenses
|
1,038,453
|
609,924
|
3,364,483
|
2,647,221
|
|
Depreciation
and amortization
|
710,181
|
646,201
|
2,070,435
|
1,876,202
|
|
Interest
expense
|
456,545
|
456,545
|
1,369,635
|
1,369,635
|
|
Total
expenses
|
36,706,298
|
40,647,547
|
99,208,855
|
117,330,502
|
|
|
|
|
|
|
|
Loss
from operations before income taxes
|
(1,883,827)
|
(2,199,849)
|
(3,443,447)
|
(9,419,223)
|
|
Income
tax benefit
|
(655,971)
|
(474,687)
|
(1,379,578)
|
(1,998,251)
|
|
Net loss
|
(1,227,856)
|
(1,725,162)
|
(2,063,869)
|
(7,420,972)
|
|
|
|
|
|
|
|
Other comprehensive income, net of tax
|
|
|
|
|
|
Gross
change in unrealized gains
|
|
|
|
|
|
on
available-for-sale-securities
|
1,778,478
|
1,323,626
|
5,938,600
|
9,191,817
|
|
|
|
|
|
|
|
Reclassification
adjustment for (gains) losses
|
|
|
|
|
|
included
in net loss
|
(606,969)
|
46,841
|
(560,696)
|
81,636
|
|
Net
change in unrealized gains
|
1,171,509
|
1,370,467
|
5,377,904
|
9,273,453
|
|
Income
tax benefit related to items
|
|
|
|
|
|
of other
comprehensive income
|
(246,017)
|
(287,798)
|
(1,129,359)
|
(1,947,424)
|
|
Other comprehensive income, net of tax
|
925,492
|
1,082,669
|
4,248,545
|
7,326,029
|
|
|
|
|
|
|
|
Comprehensive (loss) income
|
$(302,364)
|
$(642,493)
|
$2,184,676
|
$(94,943)
|
|
|
|
|
|
|
|
Loss per common share:
|
|
|
|
|
|
Basic
|
$(0.12)
|
$(0.16)
|
$(0.19)
|
$(0.69)
|
|
Diluted
|
$(0.12)
|
$(0.16)
|
$(0.19)
|
$(0.69)
|
|
|
|
|
|
|
|
Weighted average common shares outstanding
|
|
|
|
|
|
Basic
|
10,673,077
|
10,779,641
|
10,737,853
|
10,769,817
|
|
Diluted
|
10,673,077
|
10,779,641
|
10,737,853
|
10,769,817
|
|
|
|
|
|
|
|
Dividends declared and paid per common share
|
$0.0400
|
$0.0625
|
$0.1425
|
$0.2625
|
|
KINGSTONE COMPANIES, INC. AND SUBSIDIARIES
|
||
|
Condensed Consolidated Balance Sheets
|
||
|
|
September 30,
|
December 31,
|
|
|
2020
|
2019
|
|
|
(unaudited)
|
|
|
Assets
|
|
|
|
Fixed-maturity
securities, held-to-maturity, at amortized cost (fair value
of
|
|
|
|
$7,899,304
at September 30, 2020 and $4,124,767 at December 31,
2019)
|
$7,369,608
|
$3,825,952
|
|
Fixed-maturity
securities, available-for-sale, at fair value (amortized cost
of
|
|
|
|
$145,126,859
at September 30, 2020 and $162,202,355 at December 31,
2019)
|
156,538,589
|
168,236,181
|
|
Equity
securities, at fair value (cost of $30,300,839 at September 30,
2020 and
|
|
|
|
$22,624,668
at December 31, 2019)
|
29,623,267
|
24,661,382
|
|
Other
investments
|
2,829,078
|
2,584,913
|
|
Total
investments
|
196,360,542
|
199,308,428
|
|
Cash and
cash equivalents
|
24,388,103
|
32,391,485
|
|
Premiums
receivable, net
|
13,883,708
|
12,706,411
|
|
Reinsurance
receivables, net
|
55,529,408
|
40,750,538
|
|
Deferred
policy acquisition costs
|
19,916,325
|
20,634,378
|
|
Intangible
assets, net
|
500,000
|
500,000
|
|
Property
and equipment, net
|
7,788,633
|
7,620,636
|
|
Deferred
income taxes, net
|
-
|
311,052
|
|
Other
assets
|
8,992,936
|
6,979,884
|
|
Total assets
|
$327,359,655
|
$321,202,812
|
|
|
|
|
|
Liabilities
|
|
|
|
Loss and
loss adjustment expense reserves
|
$84,979,024
|
$80,498,611
|
|
Unearned
premiums
|
88,167,636
|
90,383,238
|
|
Advance
premiums
|
4,919,256
|
3,191,512
|
|
Reinsurance
balances payable
|
10,062,649
|
11,714,724
|
|
Deferred
ceding commission revenue
|
7,207,142
|
7,735,398
|
|
Accounts
payable, accrued expenses and other liabilities
|
11,134,175
|
9,986,317
|
|
Deferred
income taxes, net
|
1,972,782
|
-
|
|
Long-term
debt, net
|
29,603,566
|
29,471,431
|
|
Total
liabilities
|
238,046,230
|
232,981,231
|
|
|
|
|
|
Commitments and Contingencies
|
|
|
|
|
|
|
|
Stockholders' Equity
|
|
|
|
Preferred
stock, $.01 par value; authorized 2,500,000
shares
|
-
|
-
|
|
Common
stock, $.01 par value; authorized 20,000,000 shares; issued
11,871,307 shares
|
|
|
|
at
September 30, 2020 and 11,824,889 at December 31, 2019;
outstanding
|
|
|
|
10,675,198
shares at September 30, 2020 and 10,797,450 shares at December 31,
2019
|
118,713
|
118,248
|
|
Capital
in excess of par
|
70,372,799
|
69,133,918
|
|
Accumulated
other comprehensive income
|
9,017,415
|
4,768,870
|
|
Retained
earnings
|
13,318,838
|
16,913,097
|
|
|
92,827,765
|
90,934,133
|
|
Treasury
stock, at cost, 1,196,109 shares at September 30,
2020
|
|
|
|
and
1,027,439 shares at December 31, 2019
|
(3,514,340)
|
(2,712,552)
|
|
Total stockholders' equity
|
89,313,425
|
88,221,581
|
|
|
|
|
|
Total liabilities and stockholders'
equity
|
$327,359,655
|
$321,202,812
|