
Lakeland Industries Inc 8-K, filed Sep 9, 2026
Lakeland Industries Inc (LAKE)
About this 8-K
Lakeland Industries Inc filed this 8-K on September 9, 2026.
Items reported
- Item 2.02: Financial results
- Item 7.01: Regulation FD disclosure
- Item 9.01: Financial statements and exhibits
UNITED STATES
SECURITIES AND EXCHANGE COMMISSION
WASHINGTON, D.C. 20549
FORM 8-K
CURRENT REPORT
Pursuant to Section 13 or 15(d) of the Securities Exchange Act of 1934
Date of Report (Date of earliest event reported): |
(Exact name of Registrant as Specified in Its Charter)
(State or Other Jurisdiction |
(Commission File Number) |
(IRS Employer |
||
|
|
|
|
|
|
||||
|
||||
(Address of Principal Executive Offices) |
|
(Zip Code) |
||
Registrant’s Telephone Number, Including Area Code: |
|
(Former Name or Former Address, if Changed Since Last Report)
Check the appropriate box below if the Form 8-K filing is intended to simultaneously satisfy the filing obligation of the registrant under any of the following provisions:
Securities registered pursuant to Section 12(b) of the Act:
|
|
Trading |
|
|
|
|
Indicate by check mark whether the registrant is an emerging growth company as defined in Rule 405 of the Securities Act of 1933 (§ 230.405 of this chapter) or Rule 12b-2 of the Securities Exchange Act of 1934 (§ 240.12b-2 of this chapter).
Emerging growth company
If an emerging growth company, indicate by check mark if the registrant has elected not to use the extended transition period for complying with any new or revised financial accounting standards provided pursuant to Section 13(a) of the Exchange Act. ☐
Item 2.02 Results of Operations and Financial Condition.
On September 9, 2026, Lakeland Industries, Inc. (the “Company”) issued a press release announcing its financial results for the second quarter ended July 31, 2026. A copy of the press release is attached hereto as Exhibit 99.1.
Item 7.01 Regulation FD Disclosure.
The information set forth in Item 2.02, above, is incorporated by reference into this Item 7.01.
In addition, a copy of the supplemental slides which will be discussed during the Company’s earnings call at 4:30 p.m. ET on Wednesday, September 9, 2026 is attached to this report as Exhibit 99.2 and incorporated herein by reference.
Item 9.01 Financial Statements and Exhibits.
(d) Exhibits.
Exhibit Number |
|
Description |
99.1 |
|
|
99.2 |
|
Supplemental slides provided in connection with the Q2 FY2027 earnings call of the Company. |
104 |
|
Cover Page Interactive Data File (embedded within the Inline XBRL document) |
The information included in this Current Report on Form 8-K (including Exhibits 99.1 and 99.2 hereto) is being “furnished” in accordance with Item 2.02 and Item 7.01, as applicable, and shall not be deemed to be “filed” for the purposes of Section 18 of the Securities Exchange Act of 1934, as amended (the “Exchange Act”), or otherwise subject to the liabilities of such section, nor shall such information be deemed incorporated by reference in any filing under the Securities Act of 1933, as amended, or the Exchange Act, except as shall be expressly set forth by specific reference in such a filing.
SIGNATURES
Pursuant to the requirements of the Securities Exchange Act of 1934, the registrant has duly caused this report to be signed on its behalf by the undersigned hereunto duly authorized.
|
|
|
LAKELAND INDUSTRIES, INC. |
|
|
|
|
Date: |
September 9, 2026 |
By: |
/s/ J. Calven Swinea |
|
|
|
J. Calven Swinea |
Exhibit 99.1

Lakeland Fire + Safety Reports Fiscal Second Quarter 2027 Results
Q2 FY27 Net Sales of $50.1 Million; Fire Increased 12% Sequentially
Adjusted EBITDA Excluding FX More Than Doubled Sequentially to $2.7 Million
Tender Momentum Building Across Global Fire Portfolio
Year-to-Date Operating Cash Flow Improved $15.1 Million Year Over Year to $5.4 Million; Inventory Down $15.3 Million
Management to Host Conference Call Today at 4:30 p.m. Eastern Time
HUNTSVILLE, AL – September 9, 2026 - Lakeland Industries, Inc. (“Lakeland Fire + Safety” or “Lakeland”) (NASDAQ: LAKE), a leading global manufacturer of protective clothing and apparel for industry, healthcare and first responders, has reported its financial and operational results for its fiscal second quarter ended July 31, 2026.
Key FY 2027 Second Quarter Financial and Operational Highlights
|
Q2 Comparison |
|
|
1H Comparison |
|||||||||||||||||||||||||
($ in millions) |
FY |
|
|
FY |
|
|
$ Change YoY |
|
|
% Change YoY |
|
|
1H |
|
|
1H |
|
|
$ Change YoY |
|
|
% Change YoY |
|||||||
Net Sales |
$ |
50.1 |
|
|
$ |
52.5 |
|
|
$ |
(2.4 |
) |
|
(4.5%) |
|
|
$ |
97.6 |
|
|
$ |
99.2 |
|
|
$ |
(1.7 |
) |
|
(1.7%) |
|
Gross Profit |
$ |
18.5 |
|
|
$ |
18.8 |
|
|
$ |
(0.3 |
) |
|
(1.5%) |
|
|
$ |
33.4 |
|
|
$ |
34.5 |
|
|
$ |
(1.0 |
) |
|
(3.0%) |
|
Gross Margin |
|
37.0 |
% |
|
|
35.9 |
% |
|
|
— |
|
|
114 BPS |
|
|
|
34.3 |
% |
|
|
34.8 |
% |
|
|
— |
|
|
(46) BPS |
|
Net (loss) income |
$ |
(4.9 |
) |
|
$ |
0.8 |
|
|
$ |
(5.7 |
) |
|
|
— |
|
|
$ |
(4.6 |
) |
|
$ |
(3.1 |
) |
|
$ |
(1.4 |
) |
|
(44.9%) |
Adjusted EBITDA(1) |
$ |
1.4 |
|
|
$ |
5.0 |
|
|
$ |
(3.6 |
) |
|
(72.8%) |
|
|
$ |
1.8 |
|
|
$ |
4.8 |
|
|
$ |
(3.0 |
) |
|
(62.5%) |
|
Adjusted EBITDA ex. FX(1) |
$ |
2.7 |
|
|
$ |
5.1 |
|
|
$ |
(2.4 |
) |
|
(47.1%) |
|
|
$ |
3.8 |
|
|
$ |
5.7 |
|
|
$ |
(1.9 |
) |
|
(33.3%) |
|
|
|
|
|
|
|
|
|
|
|
|
|
|
|
|
|
|
|
|
|
|
|
|
|||||||
|
Q2’27 |
|
|
Q1’27 |
|
|
$ Change QoQ |
|
|
% Change QoQ |
|
|
|
|
|
|
|
|
|
|
|
|
|||||||
Adjusted Gross Margin(1) |
|
37.7 |
% |
|
|
33.6 |
% |
|
|
— |
|
|
410 BPS |
|
|
|
|
|
|
|
|
|
|
|
|
||||
(1)Adjusted EBITDA, Adjusted EBITDA excluding FX, and Adjusted gross margin are non-GAAP financial measures. Reconciliations are provided in the tables of this press release.
Management Commentary
“Our second quarter results provide further evidence that the underlying business is improving,” said Jim Jenkins, President and Chief Executive Officer. “We are seeing momentum in Fire, continued expansion of our Fire Services platform and improving performance across several parts of Industrial. Just as importantly, we are becoming increasingly focused on where we want to invest, where we need to improve and where we need to simplify the business.
“Fire remains at the center of our growth strategy. We have built a differentiated head-to-toe product portfolio, and we are increasingly complementing those Products with Services. We believe bringing Products and Services together strengthens our customer relationships, creates recurring revenue opportunities and gives us a platform that can support sustainable growth over time. We are accelerating our investment in Fire Services, but we are going to do so with discipline. Our priority is to build density in attractive markets, generate appropriate returns on the capital we deploy, and create a Service network that strengthens the broader Fire business. We will continue to evaluate greenfield opportunities and small strategic acquisitions, but improving and growing our existing businesses remains our first priority.
“We are taking a much more deliberate approach to the portfolio. Businesses that are performing and where we see attractive opportunities for growth will receive our capital and management attention. Where returns have not met our expectations, we are taking action on leadership, cost structure and, where appropriate, our level of investment. Our objective is a simpler company with better operating leverage, stronger returns on invested capital, and a greater concentration of resources behind our best opportunities.
“Our priorities from here are straightforward: execute better, improve margins and operating leverage, reduce complexity, and convert more of our earnings into cash. We have made progress, but we are not satisfied with where we are today. We believe the actions underway across the portfolio, combined with the momentum we are seeing in Fire Products and Fire Services, can produce a more consistent, profitable and higher-return business. That is where our attention is focused,” Jenkins concluded.
Fiscal 2027 Second Quarter and Subsequent Operational Highlights
Fiscal 2027 Second Quarter Financial Highlights
(1) Adjusted operating expenses excluding FX, Adjusted EBITDA and Adjusted EBITDA excluding FX are non-GAAP financial measures. Reconciliations are provided in the tables of this press release.
“Net sales were $50.1 million in the second quarter. Gross margin improved to 37.0% from 35.9% in the prior-year quarter and 31.4% in the first quarter, while adjusted EBITDA excluding FX more than doubled sequentially to $2.7 million. Excluding $3.7 million of prior-year revenue from the High Performance FR and High Visibility product lines divested in March 2026, net sales increased 2.8%,” said J. Calven Swinea, Chief Financial Officer.
“Cash flow also improved materially, with $5.4 million of cash generated from operations during the first six months of fiscal 2027, a $15.1 million year-over-year improvement. Inventory declined $7.6 million from fiscal year-end, cash and equivalents increased to $17.9 million, and total debt declined to $28.7 million from $32.3 million at January 31, 2026.
“We also resolved the Monterrey, Mexico lease matter during the quarter, recording a $1.9 million gain on lease settlement and eliminating the remaining lease liability. Foreign exchange had a $1.3 million negative impact during the quarter, and we are evaluating appropriate hedging strategies to mitigate this risk going forward. We also recorded a non-cash goodwill impairment charge of approximately $3.2 million related exclusively to the performance and revised outlook of LHD Germany. The impairment does not represent a cash outflow or affect our liquidity. The Company has taken actions to address the performance of LHD Germany, including leadership and organizational changes, and is executing a broader repositioning of the business focused on improving operating performance, cost structure and long-term returns. LHD’s operations in Australia and Hong Kong continue to perform well, and the impairment charge is not reflective of the performance of those businesses.
“We are focused on sustaining and expanding margins over the balance of fiscal 2027. The margin recovery processes we put in place are working. We now track manufacturing efficiency, revenue conversion and gross margin performance consistently by business, product line and region, and the sequential improvement in adjusted gross margin reflects that discipline. As production volumes improve, the North American inventory build converts to revenue, and recent tender wins and sales opportunities are delivered, we expect margin performance to continue to improve.
“Overall, the second quarter demonstrated sequential progress across revenue, gross margin, adjusted EBITDA and cash generation. With the Monterrey lease matter resolved, the divestiture behind us and a more focused portfolio, we believe we are entering the back half of fiscal 2027 with improving margin discipline and better visibility,” Swinea concluded.
Jenkins added, "Our priorities for the second half are straightforward: convert demand and backlog into revenue, continue improving gross margin, maintain expense discipline and simplify the areas of the business that are not producing acceptable returns. We believe the second half marks the beginning of our return to more consistent growth, although the cadence may vary from quarter to quarter. What remains is disciplined execution: delivering against the demand we see, completing the portfolio and cost actions already underway, and translating growth into stronger earnings and cash generation. Together, these efforts position us to enter fiscal 2028 with a more focused portfolio, a stronger cost structure and greater operating leverage.”
Fiscal Second Quarter 2027 Results Conference Call
Lakeland President, Chief Executive Officer and Executive Chairman Jim Jenkins and Chief Financial Officer Calven Swinea will host the conference call, followed by a question-and-answer period. The conference call will be accompanied by a presentation, which can be viewed during the webcast or accessed via the investor relations section of the Company’s website here.
To access the call, please use the following information:
Date: |
Wednesday, September 9, 2026 |
Time: |
4:30 p.m. Eastern Time (1:30 p.m. Pacific Time) |
Dial-in: |
1-877-407-9208 |
International Dial-in: |
1-201-493-6784 |
Conference Code: |
13761308 |
Webcast: |
https://viavid.webcasts.com/starthere.jsp?ei=1768033&tp_key=12a057c223 |
A telephone replay will be available commencing approximately three hours after the call and will remain available through December 9, 2026, by dialing 1-844-512-2921 from the U.S., or 1-412-317-6671 from international locations, and entering replay pin number: 13761308. The replay can also be viewed through the webcast link above and the presentation utilized during the call will be available via the investor relations section of the Company’s website here.
Non-GAAP Financial Measures
To supplement its consolidated financial statements, which are prepared and presented in accordance with Generally Accepted Accounting Principles (GAAP), the Company uses the following non-GAAP financial measures in this press release: Adjusted EBITDA, Adjusted EBITDA margin, Adjusted EBITDA excluding FX, Adjusted EBITDA excluding FX margin and adjusted operating expenses, excluding FX. The presentation of this financial information is not intended to be considered in isolation or as a substitute for, or superior to, the financial information prepared and presented in accordance with GAAP. The Company uses these non-GAAP financial measures for financial and operational decision-making and as a means to evaluate period-to-period comparisons. The Company believes that these measures provide useful information about operating results, enhance the overall understanding of past financial performance and future prospects, and allow for greater transparency with respect to key metrics used by management in its financial and operational decision-making.
For more information on the non-GAAP financial measures, please see the Reconciliation of GAAP to non-GAAP Financial Measures tables in this press release. These accompanying tables include details on the GAAP financial measures that are most directly comparable to non-GAAP financial measures and the related reconciliations between these financial measures.
LAKELAND INDUSTRIES, INC. AND SUBSIDIARIES
Operating Results ($000) (Unaudited)
Reconciliation of GAAP Results to Non-GAAP Results
|
Three Months Ended |
|
Six Months Ended |
|
||||||||
|
July 31, |
|
July 31, |
|
||||||||
|
2026 |
|
2025 |
|
2026 |
|
2025 |
|
||||
Net (loss) income to EBITDA |
|
|
|
|
|
|
|
|
||||
Net (loss) income |
$ |
(4,929 |
) |
$ |
766 |
|
$ |
(4,560 |
) |
$ |
(3,147 |
) |
Interest expense |
|
525 |
|
|
445 |
|
|
1,139 |
|
|
1,028 |
|
Income tax expense (benefit) |
|
1,206 |
|
|
(5,215 |
) |
|
2,551 |
|
|
(6,413 |
) |
Depreciation and amortization |
|
1,399 |
|
|
1,268 |
|
|
2,690 |
|
|
2,406 |
|
EBITDA |
$ |
(1,799 |
) |
$ |
(2,736 |
) |
$ |
1,820 |
|
$ |
(6,126 |
) |
|
|
|
|
|
|
|
|
|
||||
EBITDA to Adjusted EBITDA (excluding non-cash expenses) |
|
|
|
|
|
|
|
|
||||
EBITDA |
$ |
(1,799 |
) |
$ |
(2,736 |
) |
$ |
1,820 |
|
$ |
(6,126 |
) |
Equity compensation (1) |
|
602 |
|
|
1,411 |
|
|
1,402 |
|
|
1,740 |
|
Other income (2) |
|
(146 |
) |
|
(38 |
) |
|
(186 |
) |
|
(144 |
) |
Acquisition expenses (3) |
|
213 |
|
|
525 |
|
|
815 |
|
|
1,471 |
|
Severance, restructuring and transformation costs (4) |
|
481 |
|
|
402 |
|
|
1,545 |
|
|
1,025 |
|
New Monterrey, Mexico facility start-up costs (5) |
|
175 |
|
|
499 |
|
|
701 |
|
|
1,125 |
|
Litigation (6) |
|
194 |
|
|
182 |
|
|
258 |
|
|
371 |
|
ERP project (7) |
|
126 |
|
|
785 |
|
|
292 |
|
|
944 |
|
Start-up costs for new locations (8) |
|
350 |
|
|
— |
|
|
350 |
|
|
— |
|
Amortization of step-up in inventory basis (9) |
|
— |
|
|
406 |
|
|
— |
|
|
854 |
|
Settlement of lease liability, net (10) |
|
(1,925 |
) |
|
— |
|
|
(1,925 |
) |
|
— |
|
Impairment - Monterrey Lease (11) |
|
— |
|
|
3,577 |
|
|
— |
|
|
3,577 |
|
Impairment - Goodwill (12) |
|
3,176 |
|
|
— |
|
|
3,176 |
|
|
— |
|
Gain on sale of certain assets (13) |
|
— |
|
|
— |
|
|
(6,467 |
) |
|
— |
|
Adjusted EBITDA |
$ |
1,447 |
|
$ |
5,013 |
|
$ |
1,781 |
|
$ |
4,837 |
|
|
|
|
|
|
|
|
|
|
||||
Adjusted EBITDA Margin |
|
|
|
|
|
|
|
|
||||
Adjusted EBITDA |
$ |
1,447 |
|
$ |
5,013 |
|
$ |
1,781 |
|
$ |
4,837 |
|
Divided by net sales |
|
50,139 |
|
|
52,496 |
|
|
97,555 |
|
|
99,242 |
|
Adjusted EBITDA Margin |
|
2.9 |
% |
|
9.6 |
% |
|
1.8 |
% |
|
4.9 |
% |
|
|
|
|
|
|
|
|
|
||||
Adjusted EBITDA to Adjusted EBITDA excluding FX |
|
|
|
|
|
|
|
|
||||
Adjusted EBITDA |
$ |
1,447 |
|
$ |
5,013 |
|
$ |
1,781 |
|
$ |
4,837 |
|
Currency Fluctuation |
|
1,277 |
|
|
43 |
|
|
2,024 |
|
|
822 |
|
Adjusted EBITDA excluding FX |
$ |
2,724 |
|
$ |
5,056 |
|
$ |
3,805 |
|
$ |
5,659 |
|
|
|
|
|
|
|
|
|
|
||||
Adjusted EBITDA Margin to Adjusted EBITDA excluding FX Margin |
|
|
|
|
|
|
|
|
||||
Adjusted EBITDA excluding FX |
$ |
2,724 |
|
$ |
5,056 |
|
$ |
3,805 |
|
$ |
5,659 |
|
Divided by net sales |
|
50,139 |
|
|
52,496 |
|
|
97,555 |
|
|
99,242 |
|
Adjusted EBITDA excluding FX Margin |
|
5.4 |
% |
|
9.6 |
% |
|
3.9 |
% |
|
5.7 |
% |
|
|
|
|
|
|
|
|
|
||||
Operating Expenses to Adjusted Operating Expenses excluding FX |
|
|
|
|
|
|
|
|
||||
Operating expenses |
$ |
20,636 |
|
$ |
19,283 |
|
$ |
39,700 |
|
$ |
39,561 |
|
Depreciation and amortization |
|
(1,028 |
) |
|
(962 |
) |
|
(1,971 |
) |
|
(1,779 |
) |
Equity compensation (1) |
|
(602 |
) |
|
(1,411 |
) |
|
(1,402 |
) |
|
(1,740 |
) |
Acquisition expenses (3) |
|
(213 |
) |
|
(525 |
) |
|
(815 |
) |
|
(1,471 |
) |
Severance, restructuring and transformation costs (4) |
|
(481 |
) |
|
(402 |
) |
|
(895 |
) |
|
(1,025 |
) |
New Monterrey, Mexico facility start-up costs (5) |
|
(175 |
) |
|
(499 |
) |
|
(701 |
) |
|
(1,125 |
) |
Litigation (6) |
|
(194 |
) |
|
(182 |
) |
|
(258 |
) |
|
(371 |
) |
ERP project (7) |
|
(126 |
) |
|
(685 |
) |
|
(263 |
) |
|
(796 |
) |
Start-up costs for new service locations (8) |
|
(350 |
) |
|
— |
|
|
(350 |
) |
|
— |
|
FX |
|
(1,277 |
) |
|
(43 |
) |
|
(2,024 |
) |
|
(822 |
) |
Adjusted Operating Expenses excluding FX |
$ |
16,190 |
|
$ |
14,574 |
|
$ |
31,021 |
|
$ |
30,432 |
|
|
Three Months Ended |
|
Three Months Ended |
|
|||||
|
July 31, |
|
April 30, |
|
|||||
|
2026 |
|
2025 |
|
2026 |
|
|||
Gross profit to adjusted gross profit |
|
|
|
|
|
|
|||
Gross profit |
$ |
18,543 |
|
$ |
18,818 |
|
$ |
14,885 |
|
Depreciation and amortization |
|
371 |
|
|
306 |
|
|
348 |
|
Amortization of step-up in inventory basis |
|
— |
|
|
406 |
|
|
— |
|
Severance, restructuring and transformation costs |
|
— |
|
|
— |
|
|
650 |
|
ERP project |
|
— |
|
|
100 |
|
|
29 |
|
Adjusted Gross Profit |
$ |
18,914 |
|
$ |
19,630 |
|
$ |
15,912 |
|
|
|
|
|
|
|
|
|||
Adjusted gross margin |
|
|
|
|
|
|
|||
Adjusted gross profit |
$ |
18,914 |
|
$ |
19,630 |
|
$ |
15,912 |
|
Divided by net sales |
|
50,139 |
|
|
52,496 |
|
|
47,416 |
|
Adjusted Gross Margin |
|
37.7 |
% |
|
37.4 |
% |
|
33.6 |
% |
The financial data above includes non-GAAP financial measures, including EBITDA, adjusted EBITDA, adjusted EBITDA Margin, Adjusted Gross Profit, Adjusted Gross Margin and Adjusted Operating Expenses. Management excludes from EBITDA and adjusted EBITDA all expenses for interest, taxes, depreciation and amortization, Goodwill impairment, impairment of investment, and Other Income which is comprised of interest income and gains (losses) from equity method investments. For adjusted EBITDA management also excludes equity compensation, acquisition-related expenses, severance, restructuring and transformation costs, costs associated with our Mexican operations, PFAS litigation expenses, ERP Project related costs, start-up costs for new service locations, lease impairment charges, the gain on lease settlement and the gain on sale of certain assets. This press release also discusses (i) Adjusted EBITDA margin, which is calculated by dividing Adjusted EBITDA by GAAP net sales; (ii) Adjusted EBITDA excluding FX, which is calculated by subtracting foreign currency losses from Adjusted EBITDA and (iii) Adjusted EBITDA excluding FX margin, which is calculated by dividing Adjusted EBITDA excluding FX by GAAP net sales.
Management excludes these items principally because such charges or benefits are not directly related to the Company’s ongoing core business operations. We use such non-GAAP measures in order to (1) make more meaningful period-to-period comparisons of the Company’s operations, both internally and externally, (2) guide management in assessing the performance of the business, internally allocating resources and making decisions in furtherance of the Company’s strategic plan, and (3) provide investors with a better understanding of how management plans and measures the business. The material limitations to management’s approach include the fact that the charges, benefits and expenses excluded are nonetheless charges, benefits and expenses required to be recognized under GAAP and, in some cases, consume cash which reduces the Company’s liquidity. Management compensates for these limitations primarily by reviewing GAAP results to obtain a complete picture of the Company’s performance and by including a reconciliation of non-GAAP results to GAAP results in its earnings releases. Non-GAAP financial measures are not alternatives for measures of financial performance prepared in accordance with GAAP and may be different from similarly titled non-GAAP measures presented by other companies, limiting their usefulness as comparative measures.
Additional information regarding the adjustments is provided below.
(1) Adjustments for Equity Compensation, which consist of non-cash expenses for equity awards granted and recognized over their respective service periods.
(2) Adjustments for Other Income, which consist primarily of interest income and gains/(losses) from dispositions of fixed assets.
(3) Adjustments for acquisition-related expenses included advisory fees, due diligence expenses, accounting fees and legal fees related to the Company's acquisitions.
(4) Adjustments for accrued employee severance, restructuring costs and transformation related costs which include expenses associated with strategic transformation initiatives and certification activities.
(5) Adjustments for costs for our Mexican operations consist of external services and legal fees associated with a property-related dispute with the landlord of our manufacturing site in Monterrey, Mexico.
(6) Adjustments for PFAS and shareholder litigation.
(7) Adjustments for the implementation of new ERP consisting of external services and employee-related expenses.
(8) Adjustments for start-up costs associated with new Independent Service Provider service locations.
(9) Adjustments for amortization of the step-up in basis for inventory acquired related to the Company's acquisitions.
(10) The Company recorded a gain on settlement of lease liability in connection with the lease for its Monterrey, Mexico manufacturing site during the second quarter of fiscal 2027.
(11) The Company recorded an impairment in the prior-year period primarily related to the right-of-use asset for the Monterrey, Mexico facility.
(12) The Company recorded an impairment of the remaining goodwill of the LHD reporting unit in Q2 FY27.
(13) The Company recorded a gain related to the sale of certain assets related to the HPFR and HiViz product lines in March 2026.
About Lakeland Fire + Safety
Lakeland Fire + Safety manufactures and sells a comprehensive line of fire products and industrial protective clothing and accessories for the industrial and first responder markets. In addition, we provide decontamination, repair and rental services that complement our fire services portfolio. Our products are sold globally by our in-house sales teams, our customer service group, and authorized independent sales representatives to a strategic global network of selective fire and industrial distributors and wholesale partners. Our authorized distributors supply end users across various industries, including integrated oil, chemical/petrochemical, automobile, transportation, steel, glass, construction, smelting, cleanroom, janitorial, pharmaceutical, and high-tech electronics manufacturers, as well as scientific, medical laboratories, and the utilities industry. In addition, we supply federal, state and local governmental agencies and departments, including fire and law enforcement, airport crash rescue units, the Department of Defense, the Department of Homeland Security and the Centers for Disease Control. Internationally, we sell to a mix of end-users directly and to industrial distributors, depending on the particular country and market. In addition to the United States, sales are made into more than 50 foreign countries, the majority of which were into China, the European Economic Community ("EEC"), Canada, Chile, Argentina, Commonwealth of Independent States (“CIS”) Region, Colombia, Mexico, Ecuador, India, Uruguay, Middle East, Southeast Asia, Australia, Hong Kong and New Zealand.
For more information about Lakeland, please visit the Company's website at www.lakeland.com.
"Safe Harbor" Statement under the Private Securities Litigation Reform Act of 1995
This press release contains estimates, predictions, opinions, goals and other "forward-looking statements" as that phrase is defined in the Private Securities Litigation Reform Act of 1995. Such statements include, without limitation, references to the Company's predictions or expectations of future business or financial performance as well as its goals and objectives for future operations, financial and business trends, business prospects, and management's expectations for earnings, revenues, expenses, inventory levels, capital levels, liquidity levels, or other future financial or business performance, strategies or expectations, including without limitation our expectations of margin improvement. All statements, other than statements of historical facts, which address Lakeland's expectations of sources or uses for capital, or which express the Company's expectation for the future with respect to financial performance or operating strategies, can be identified as forward-looking statements. Forward-looking statements involve risks, uncertainties and assumptions as described from time to time in press releases and Forms 8-K, registration statements, quarterly and annual reports and other reports and filings filed with the Securities and Exchange Commission or made by management. As a result, there can be no assurance that Lakeland's future results will not be materially different from those described herein as "believed," "projected," "planned," "intended," "anticipated," "can," "estimated" or "expected," or other words which reflect the current view of the Company with respect to future events. We caution readers that these forward-looking statements speak only as of the date hereof. The Company hereby expressly disclaims any obligation or undertaking to release publicly any updates or revisions to any such statements to reflect any change in the Company's expectations or any change in events, conditions or circumstances on which such statement is based, except as may be required by law.
Investor Relations
Chris Tyson
Executive Vice President
MZ Group - MZ North America
949-491-8235
LAKE@mzgroup.us
www.mzgroup.us
Lakeland Industries, Inc. and Subsidiaries
CONSOLIDATED STATEMENTS OF OPERATIONS
(UNAUDITED)
($000’s except for share and per share information)
|
|
Three Months Ended |
|
|
Six Months Ended |
|
||||||||||
|
|
2026 |
|
|
2025 |
|
|
2026 |
|
|
2025 |
|
||||
Net sales |
|
$ |
50,139 |
|
|
$ |
52,496 |
|
|
$ |
97,555 |
|
|
$ |
99,242 |
|
Cost of goods sold |
|
|
31,596 |
|
|
|
33,678 |
|
|
|
64,127 |
|
|
|
64,780 |
|
Gross profit |
|
|
18,543 |
|
|
|
18,818 |
|
|
|
33,428 |
|
|
|
34,462 |
|
Operating expenses |
|
|
20,636 |
|
|
|
19,283 |
|
|
|
39,700 |
|
|
|
39,561 |
|
Settlement of lease liability, net |
|
|
(1,925 |
) |
|
|
— |
|
|
|
(1,925 |
) |
|
|
— |
|
Goodwill impairment |
|
|
3,176 |
|
|
|
— |
|
|
|
3,176 |
|
|
|
— |
|
Gain on sale of certain assets |
|
|
— |
|
|
|
— |
|
|
|
(6,467 |
) |
|
|
— |
|
Lease impairment |
|
|
— |
|
|
|
3,577 |
|
|
|
— |
|
|
|
3,577 |
|
Operating loss |
|
|
(3,344 |
) |
|
|
(4,042 |
) |
|
|
(1,056 |
) |
|
|
(8,676 |
) |
Other income, net |
|
|
146 |
|
|
|
38 |
|
|
|
186 |
|
|
|
144 |
|
Interest expense |
|
|
(525 |
) |
|
|
(445 |
) |
|
|
(1,139 |
) |
|
|
(1,028 |
) |
Loss before taxes |
|
|
(3,723 |
) |
|
|
(4,449 |
) |
|
|
(2,009 |
) |
|
|
(9,560 |
) |
Income tax expense (benefit) |
|
|
1,206 |
|
|
|
(5,215 |
) |
|
|
2,551 |
|
|
|
(6,413 |
) |
Net (loss) income |
|
$ |
(4,929 |
) |
|
$ |
766 |
|
|
$ |
(4,560 |
) |
|
$ |
(3,147 |
) |
Net (loss) income per common share: |
|
|
|
|
|
|
|
|
|
|
|
|
||||
Basic |
|
$ |
(0.50 |
) |
|
$ |
0.08 |
|
|
$ |
(0.46 |
) |
|
$ |
(0.33 |
) |
Diluted |
|
$ |
(0.50 |
) |
|
$ |
0.08 |
|
|
$ |
(0.46 |
) |
|
$ |
(0.33 |
) |
Weighted average common shares outstanding: |
|
|
|
|
|
|
|
|
|
|
|
|
||||
Basic |
|
|
9,941,003 |
|
|
|
9,530,082 |
|
|
|
9,859,199 |
|
|
|
9,506,604 |
|
Diluted |
|
|
9,941,003 |
|
|
|
10,093,855 |
|
|
|
9,859,199 |
|
|
|
9,506,604 |
|
Lakeland Industries, Inc. and Subsidiaries
CONSOLIDATED BALANCE SHEETS
(UNAUDITED)
(000’s except for share information)
|
|
July 31, |
|
|
January 31, |
|
||
ASSETS |
|
2026 |
|
|
2026 |
|
||
Current assets |
|
|
|
|
|
|
||
Cash and cash equivalents |
|
$ |
17,901 |
|
|
$ |
12,515 |
|
Accounts receivable, net of allowance for credit losses of $1,101 and $1,064 |
|
|
32,037 |
|
|
|
32,043 |
|
Inventories, net |
|
|
74,931 |
|
|
|
82,542 |
|
Prepaid VAT and other taxes |
|
|
3,077 |
|
|
|
2,429 |
|
Other current assets |
|
|
8,685 |
|
|
|
4,657 |
|
Total current assets |
|
|
136,631 |
|
|
|
134,186 |
|
Property and equipment, net |
|
|
11,634 |
|
|
|
11,640 |
|
Operating leases right-of-use assets |
|
|
9,975 |
|
|
|
11,248 |
|
Deferred tax assets |
|
|
1,148 |
|
|
|
1,149 |
|
Goodwill |
|
|
11,992 |
|
|
|
15,287 |
|
Intangible assets, net |
|
|
30,179 |
|
|
|
31,724 |
|
Other assets |
|
|
4,968 |
|
|
|
4,699 |
|
Total assets |
|
$ |
206,527 |
|
|
$ |
209,933 |
|
LIABILITIES AND STOCKHOLDERS’ EQUITY |
|
|
|
|
|
|
||
Current liabilities |
|
|
|
|
|
|
||
Accounts payable |
|
$ |
17,920 |
|
|
$ |
15,565 |
|
Deferred revenue |
|
|
5,199 |
|
|
|
— |
|
Accrued compensation and benefits |
|
|
5,976 |
|
|
|
4,984 |
|
Other accrued expenses |
|
|
8,743 |
|
|
|
8,964 |
|
Income tax payable |
|
|
2,528 |
|
|
|
1,802 |
|
Current portion of long-term debt |
|
|
1,750 |
|
|
|
1,891 |
|
Current portion of operating lease liabilities |
|
|
3,760 |
|
|
|
4,756 |
|
Total current liabilities |
|
|
45,876 |
|
|
|
37,962 |
|
Deferred income taxes |
|
|
2,116 |
|
|
|
2,198 |
|
Long-term debt |
|
|
26,921 |
|
|
|
30,382 |
|
Long-term portion of operating lease liabilities |
|
|
6,507 |
|
|
|
10,264 |
|
Total liabilities |
|
|
81,420 |
|
|
|
80,806 |
|
Commitments and contingencies |
|
|
|
|
|
|
||
Stockholders’ equity |
|
|
|
|
|
|
||
Preferred stock, $0.01 par; authorized 1,500,000 shares (none issued) |
|
|
— |
|
|
|
— |
|
Common stock, $0.01 par; authorized 20,000,000 shares; issued 11,268,067 |
|
|
112 |
|
|
|
112 |
|
Treasury stock, at cost; 1,358,208 shares at July 31, 2026 and |
|
|
(19,979 |
) |
|
|
(19,979 |
) |
Additional paid-in capital |
|
|
130,743 |
|
|
|
129,391 |
|
Retained earnings |
|
|
19,297 |
|
|
|
23,857 |
|
Accumulated other comprehensive loss |
|
|
(5,066 |
) |
|
|
(4,254 |
) |
Total stockholders' equity |
|
|
125,107 |
|
|
|
129,127 |
|
Total liabilities and stockholders' equity |
|
$ |
206,527 |
|
|
$ |
209,933 |
|
Lakeland Industries, Inc. and Subsidiaries
CONSOLIDATED STATEMENTS OF CASH FLOWS
(UNAUDITED)
($000’s)
|
|
Six Months Ended |
|
|||||
|
|
2026 |
|
|
2025 |
|
||
Cash flows from operating activities: |
|
|
|
|
|
|
||
Net loss |
|
$ |
(4,560 |
) |
|
$ |
(3,147 |
) |
Adjustments to reconcile net loss to net cash used in operating activities |
|
|
|
|
|
|
||
Deferred income taxes |
|
|
(78 |
) |
|
|
(10,279 |
) |
Depreciation and amortization |
|
|
2,690 |
|
|
|
2,406 |
|
Settlement of lease liability, net |
|
|
(1,925 |
) |
|
|
— |
|
Stock based and restricted stock compensation |
|
|
1,402 |
|
|
|
1,740 |
|
Gain on disposal of property and equipment |
|
|
(9 |
) |
|
|
(3 |
) |
Gain on sale of certain assets |
|
|
(6,467 |
) |
|
|
— |
|
Goodwill impairment |
|
|
3,176 |
|
|
|
— |
|
Lease impairments |
|
|
— |
|
|
|
3,577 |
|
Amortization of step-up in inventory basis |
|
|
— |
|
|
|
854 |
|
Change in operating assets and liabilities, net of effect of business acquisitions |
|
|
|
|
|
|
||
Accounts receivable, net |
|
|
(277 |
) |
|
|
(2,589 |
) |
Inventories |
|
|
6,969 |
|
|
|
(6,163 |
) |
Prepaid VAT and other taxes |
|
|
(648 |
) |
|
|
730 |
|
Other assets |
|
|
(2,985 |
) |
|
|
454 |
|
Accounts payable |
|
|
2,476 |
|
|
|
1,846 |
|
Deferred revenue |
|
|
5,199 |
|
|
|
— |
|
Accrued expenses and other liabilities |
|
|
1,982 |
|
|
|
1,146 |
|
Operating lease liabilities |
|
|
(1,548 |
) |
|
|
(232 |
) |
Net cash provided by (used in) operating activities |
|
|
5,397 |
|
|
|
(9,660 |
) |
Cash flows from investing activities: |
|
|
|
|
|
|
||
Purchases of property and equipment |
|
|
(1,434 |
) |
|
|
(2,130 |
) |
Proceeds from sale of certain assets |
|
|
5,066 |
|
|
|
— |
|
Net cash provided by (used in) investing activities: |
|
|
3,632 |
|
|
|
(2,130 |
) |
Cash flows from financing activities: |
|
|
|
|
|
|
||
Term loan borrowings |
|
|
933 |
|
|
|
2,066 |
|
Payments on debt facilities |
|
|
(33,883 |
) |
|
|
(4,101 |
) |
Credit line borrowings |
|
|
29,480 |
|
|
|
13,830 |
|
Proceeds from employee stock purchase plan |
|
|
215 |
|
|
|
— |
|
Shares returned to pay employee taxes under restricted stock program |
|
|
(267 |
) |
|
|
(283 |
) |
Dividends paid |
|
|
— |
|
|
|
(571 |
) |
Net cash (used in) provided by financing activities |
|
|
(3,522 |
) |
|
|
10,941 |
|
Effect of exchange rate changes on cash and cash equivalents |
|
|
(121 |
) |
|
|
1,122 |
|
Net increase in cash and cash equivalents |
|
|
5,386 |
|
|
|
273 |
|
Cash and cash equivalents at beginning of period |
|
|
12,515 |
|
|
|
17,476 |
|
Cash and cash equivalents at end of period |
|
$ |
17,901 |
|
|
$ |
17,749 |
|
Supplemental disclosure of cash flow information: |
|
|
|
|
|
|
||
Cash paid for interest |
|
$ |
1,139 |
|
|
$ |
1,024 |
|
Cash paid for taxes |
|
$ |
2,123 |
|
|
$ |
1,692 |
|

Fiscal Second Quarter 2027 Financial Results Conference Call September 9, 2026 NASDAQ: LAKE Exhibit 99.2
Safe Harbor & Non-GAAP Statements “Safe Harbor” Statement Under the Private Securities Litigation Reform Act of 1995 This presentation contains estimates, predictions, opinions, goals and other “forward-looking statements” as that phrase is defined in the Private Securities Litigation Reform Act of 1995. Such statements include, without limitation, references to the Company's predictions or expectations of future business or financial performance as well as its goals and objectives for future operations, financial and business trends, business prospects, and management's expectations for earnings, revenues, expenses, inventory levels, capital levels, liquidity levels, or other future financial or business performance, strategies or expectations, including without limitation our expectations of margin improvement. All statements, other than statements of historical facts, which address Lakeland's expectations of sources or uses for capital, or which express the Company's expectation for the future with respect to financial performance or operating strategies can be identified as forward-looking statements. Forward-looking statements involve risks, uncertainties and assumptions as described from time to time in press releases and Forms 8-K, presentations, registration statements, quarterly and annual reports and other reports and filings filed with the Securities and Exchange Commission or made by management. As a result, there can be no assurance that Lakeland's future results will not be materially different from those described herein as "believed," "projected," "planned," "intended," "anticipated," "can," "estimated" or "expected," or other words which reflect the current view of the Company with respect to future events. We caution readers that these forward-looking statements speak only as of the date hereof. The Company hereby expressly disclaims any obligation or undertaking to release publicly any updates or revisions to any such statements to reflect any change in the Company's expectations or any change in events, conditions or circumstances on which such statement is based, except as may be required by law. Non-GAAP Financial Measures To supplement its consolidated financial statements, which are prepared and presented in accordance with Generally Accepted Accounting Principles (GAAP), the Company uses the following non-GAAP financial measures in this presentation: Adjusted Gross Profit, Adjusted Gross Margin, Adjusted Operating Expenses, Adjusted EBITDA excluding FX, and Adjusted EBITDA excluding FX margin. The presentation of this financial information is not intended to be considered in isolation or as a substitute for, or superior to, the financial information prepared and presented in accordance with GAAP. The Company uses these non-GAAP financial measures for financial and operational decision-making and as a means to evaluate period-to-period comparisons. The Company believes that these measures provide useful information about operating results, enhance the overall understanding of past financial performance and future prospects, and allow for greater transparency with respect to key metrics used by management in its financial and operational decision-making. The non-GAAP financial measures used by the Company in this presentation may be different from the methods used by other companies. For more information on the non-GAAP financial measures, please see the Reconciliation of GAAP to non-GAAP Financial Measures tables in this presentation. These accompanying tables include details on the GAAP financial measures that are most directly comparable to non-GAAP financial measures and the related reconciliations between these financial measures.

Agenda: On the Call Today: COMPANY UPDATES CLOSING SUMMARY FINANCIAL RESULTS Q&A KEY TAKEAWAYS James M. Jenkins President, Chief Executive Officer & Executive Chairman Calven Swinea Chief Financial Officer Cameron Stokes Chief Commercial Officer, Global Industrials Barry Phillips Chief Revenue Officer Kevin Rae Executive Vice President, EMEA Fire Sales
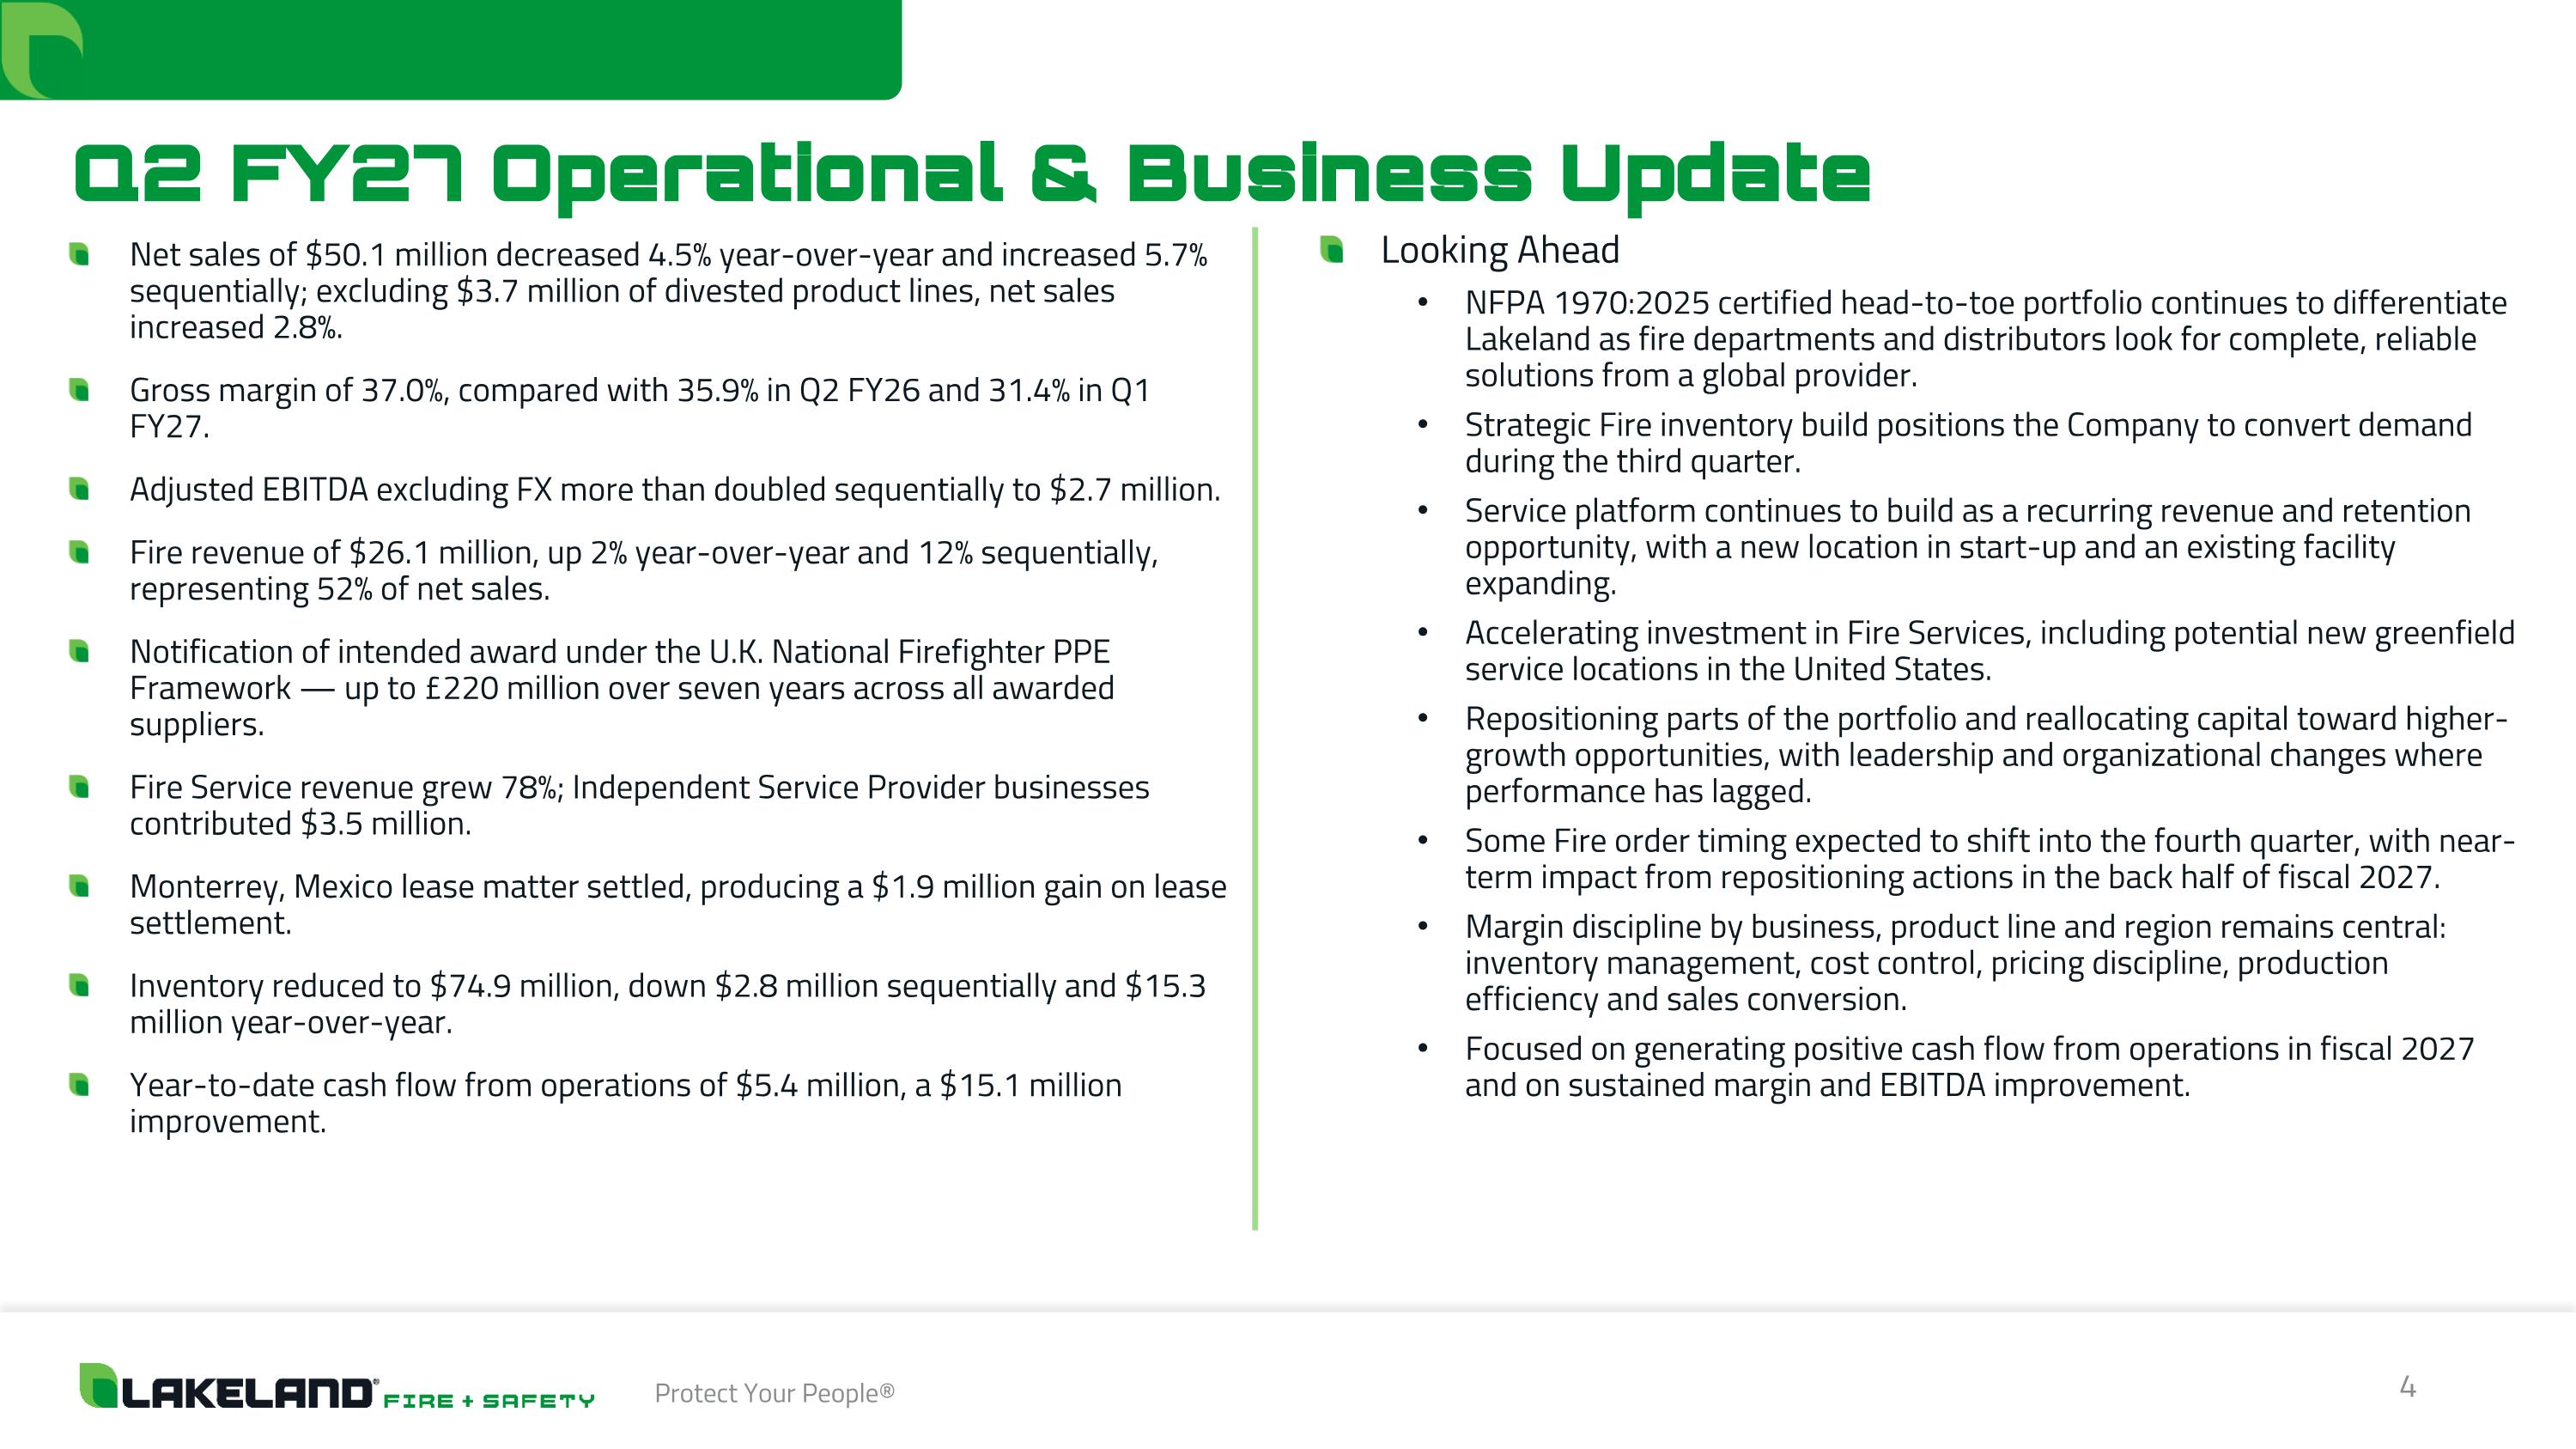
Q2 FY27 Operational & Business Update Net sales of $50.1 million decreased 4.5% year-over-year and increased 5.7% sequentially; excluding $3.7 million of divested product lines, net sales increased 2.8%. Gross margin of 37.0%, compared with 35.9% in Q2 FY26 and 31.4% in Q1 FY27. Adjusted EBITDA excluding FX more than doubled sequentially to $2.7 million. Fire revenue of $26.1 million, up 2% year-over-year and 12% sequentially, representing 52% of net sales. Notification of intended award under the U.K. National Firefighter PPE Framework — up to £220 million over seven years across all awarded suppliers. Fire Service revenue grew 78%; Independent Service Provider businesses contributed $3.5 million. Monterrey, Mexico lease matter settled, producing a $1.9 million gain on lease settlement. Inventory reduced to $74.9 million, down $2.8 million sequentially and $15.3 million year-over-year. Year-to-date cash flow from operations of $5.4 million, a $15.1 million improvement. Looking Ahead NFPA 1970:2025 certified head-to-toe portfolio continues to differentiate Lakeland as fire departments and distributors look for complete, reliable solutions from a global provider. Strategic Fire inventory build positions the Company to convert demand during the third quarter. Service platform continues to build as a recurring revenue and retention opportunity, with a new location in start-up and an existing facility expanding. Accelerating investment in Fire Services, including potential new greenfield service locations in the United States. Repositioning parts of the portfolio and reallocating capital toward higher-growth opportunities, with leadership and organizational changes where performance has lagged. Some Fire order timing expected to shift into the fourth quarter, with near-term impact from repositioning actions in the back half of fiscal 2027. Margin discipline by business, product line and region remains central: inventory management, cost control, pricing discipline, production efficiency and sales conversion. Focused on generating positive cash flow from operations in fiscal 2027 and on sustained margin and EBITDA improvement.
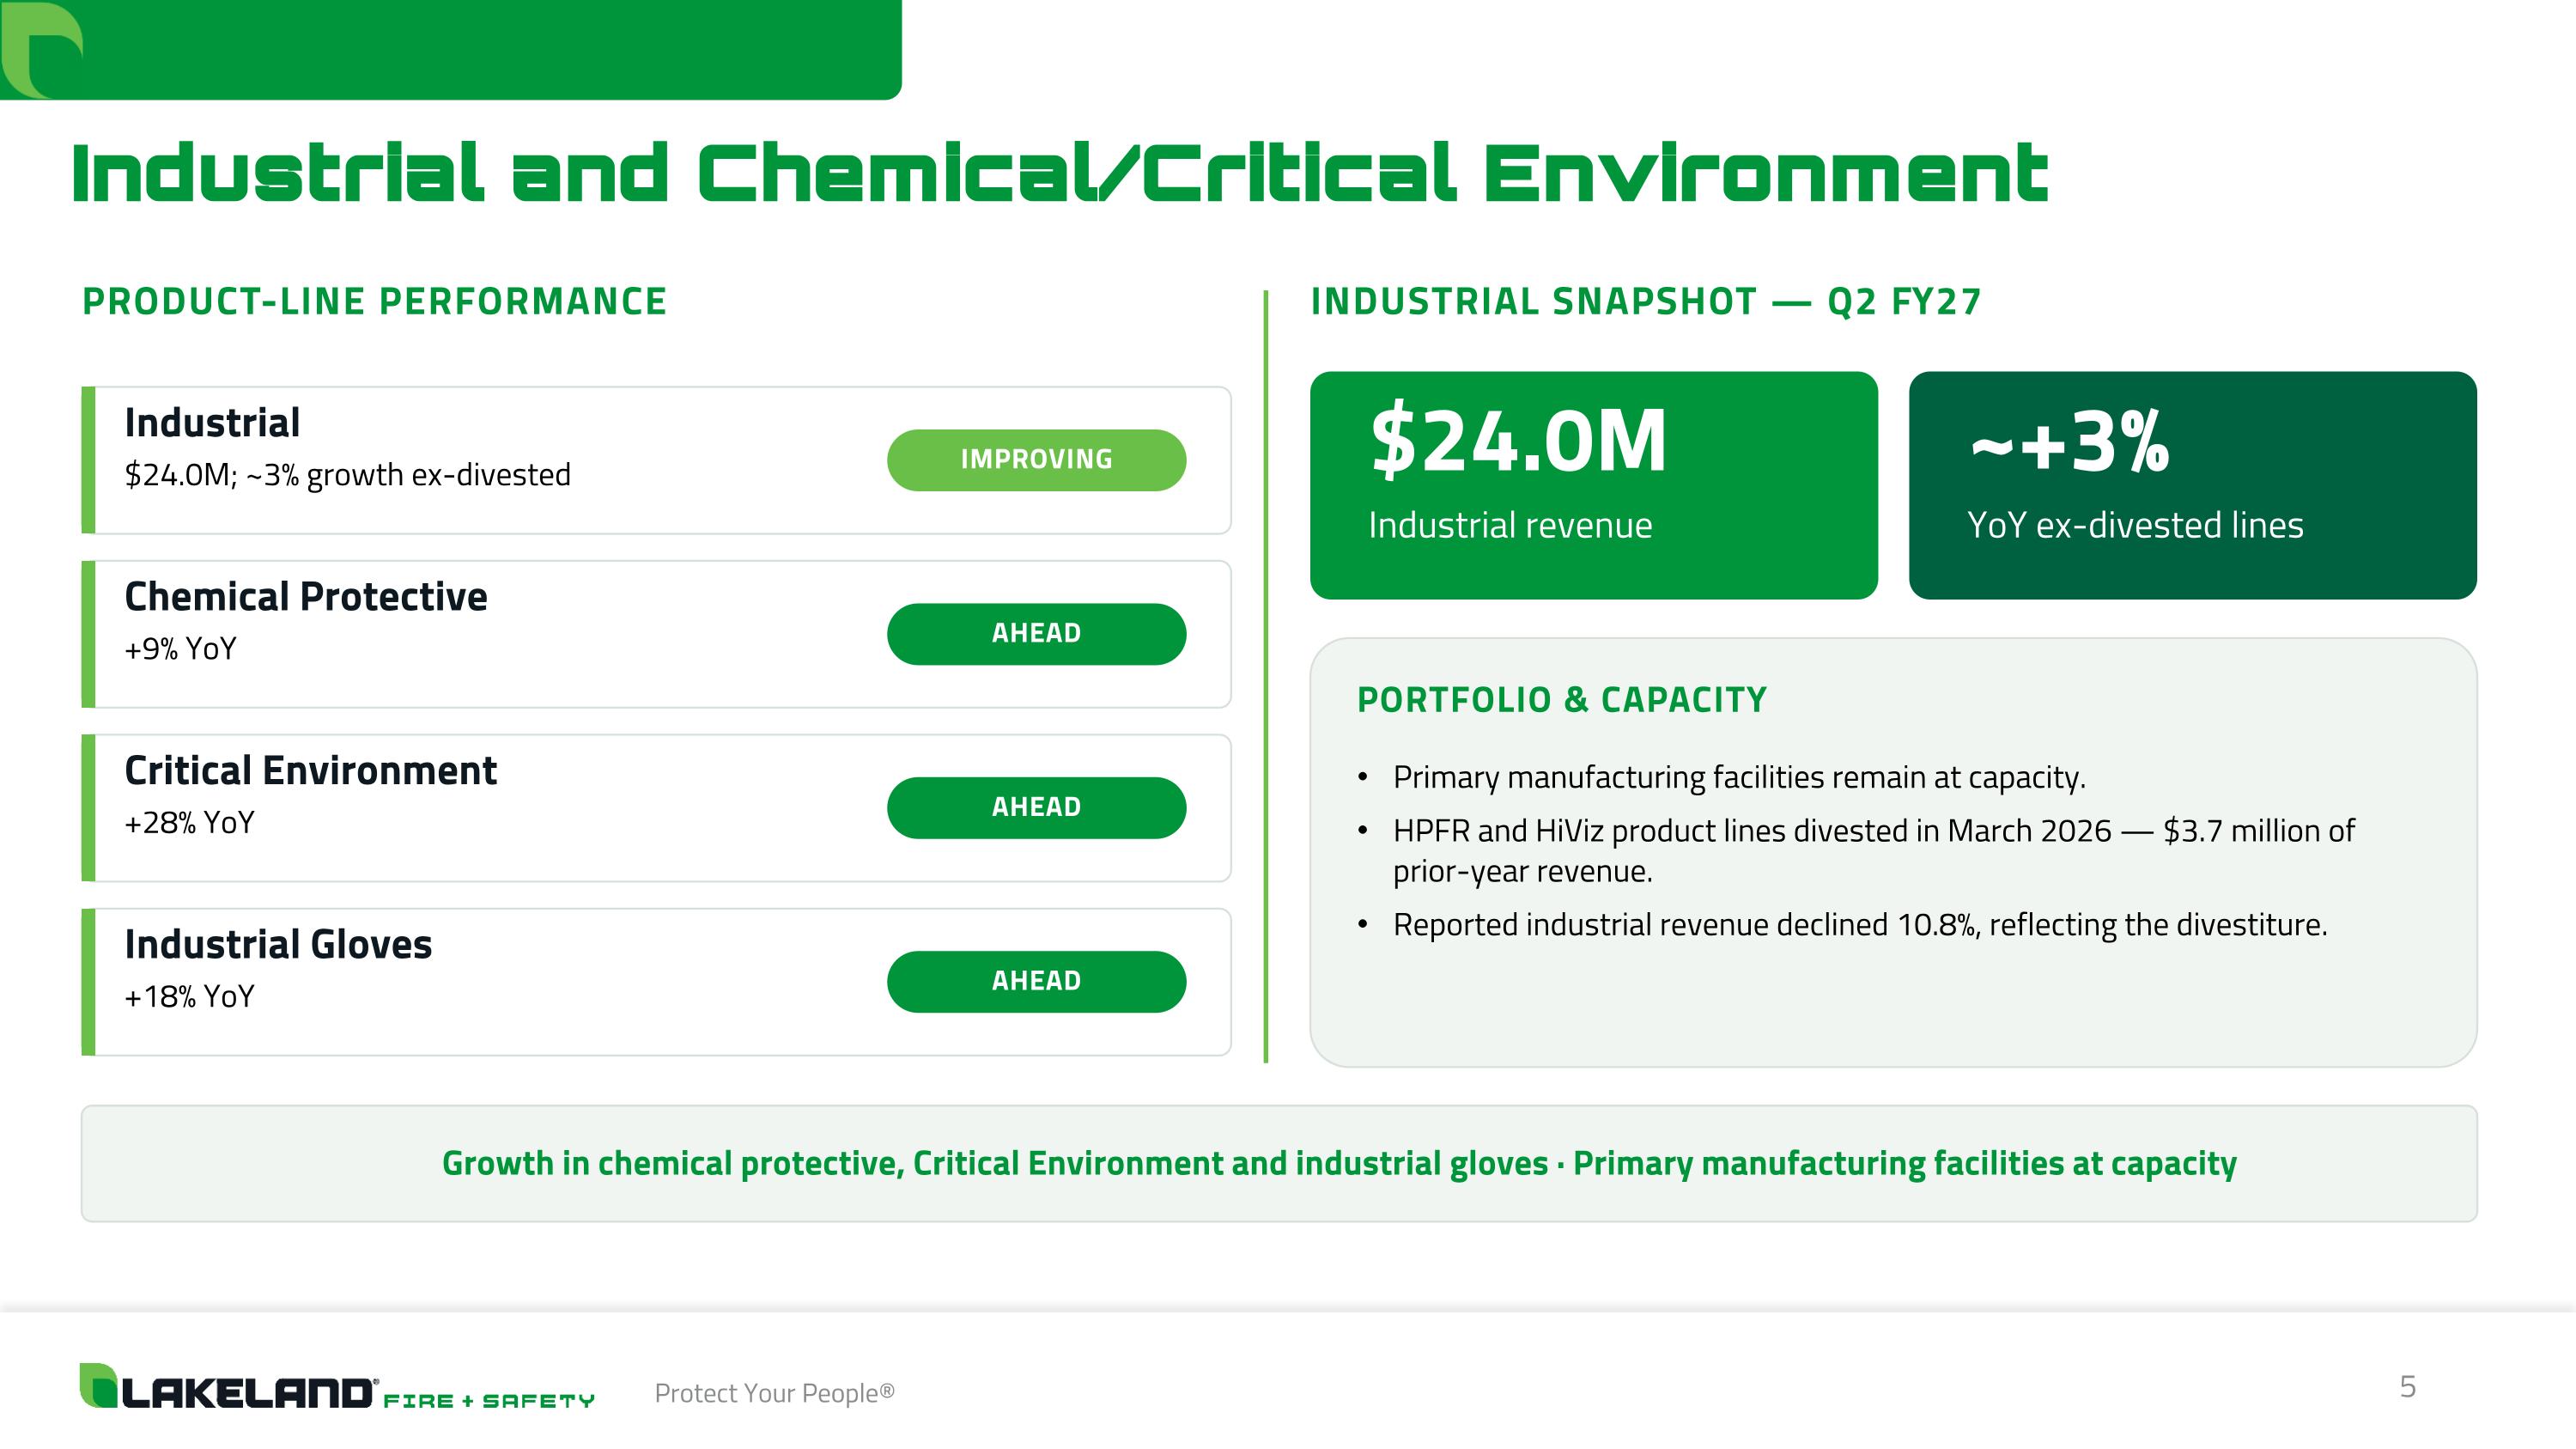
Industrial and Chemical/Critical Environment PRODUCT-LINE PERFORMANCE Industrial $24.0M; ~3% growth ex-divested IMPROVING Chemical Protective +9% YoY AHEAD Critical Environment +28% YoY AHEAD Industrial Gloves +18% YoY AHEAD INDUSTRIAL SNAPSHOT — Q2 FY27 $24.0M Industrial revenue ~+3% YoY ex-divested lines PORTFOLIO & CAPACITY Primary manufacturing facilities remain at capacity. HPFR and HiViz product lines divested in March 2026 — $3.7 million of prior-year revenue. Reported industrial revenue declined 10.8%, reflecting the divestiture. Growth in chemical protective, Critical Environment and industrial gloves · Primary manufacturing facilities at capacity
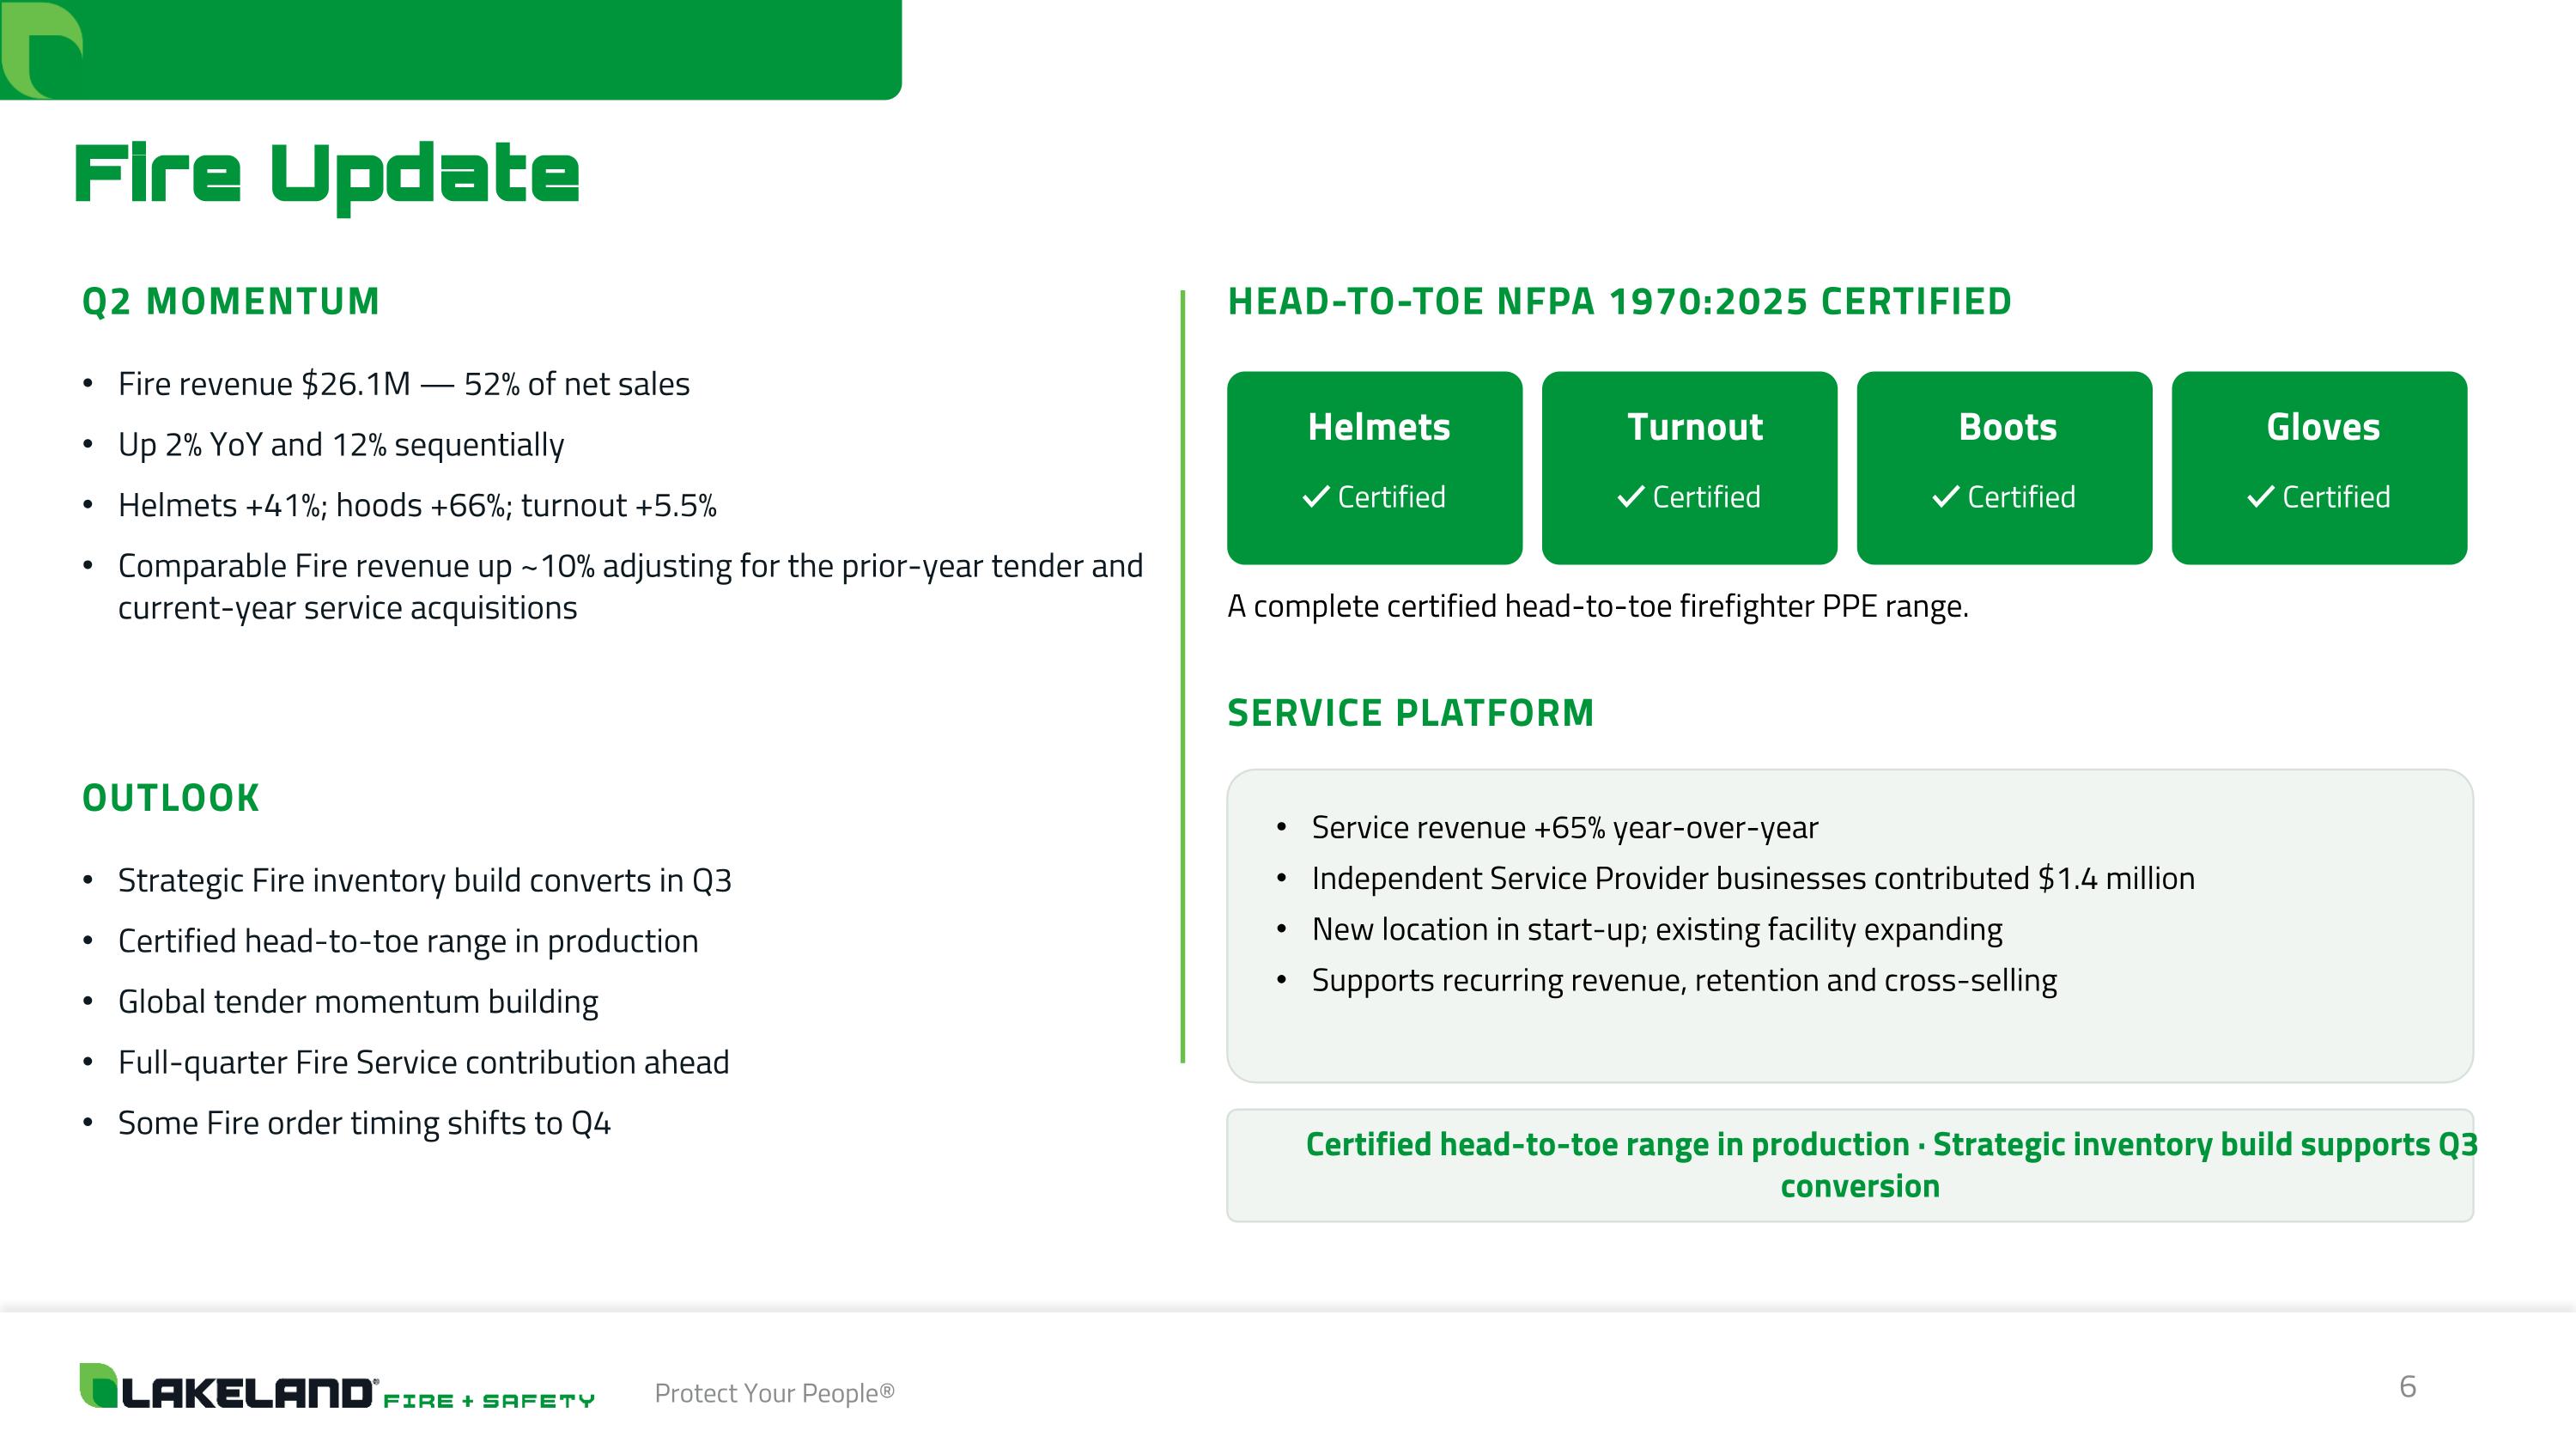
Fire Update Q2 MOMENTUM Fire revenue $26.1M — 52% of net sales Up 2% YoY and 12% sequentially Helmets +41%; hoods +66%; turnout +5.5% Comparable Fire revenue up ~10% adjusting for the prior-year tender and current-year service acquisitions OUTLOOK Strategic Fire inventory build converts in Q3 Certified head-to-toe range in production Global tender momentum building Full-quarter Fire Service contribution ahead Some Fire order timing shifts to Q4 HEAD-TO-TOE NFPA 1970:2025 CERTIFIED Helmets ✓ Certified Turnout ✓ Certified Boots ✓ Certified Gloves ✓ Certified A complete certified head-to-toe firefighter PPE range. SERVICE PLATFORM Service revenue +65% year-over-year Independent Service Provider businesses contributed $1.4 million New location in start-up; existing facility expanding Supports recurring revenue, retention and cross-selling Certified head-to-toe range in production · Strategic inventory build supports Q3 conversion
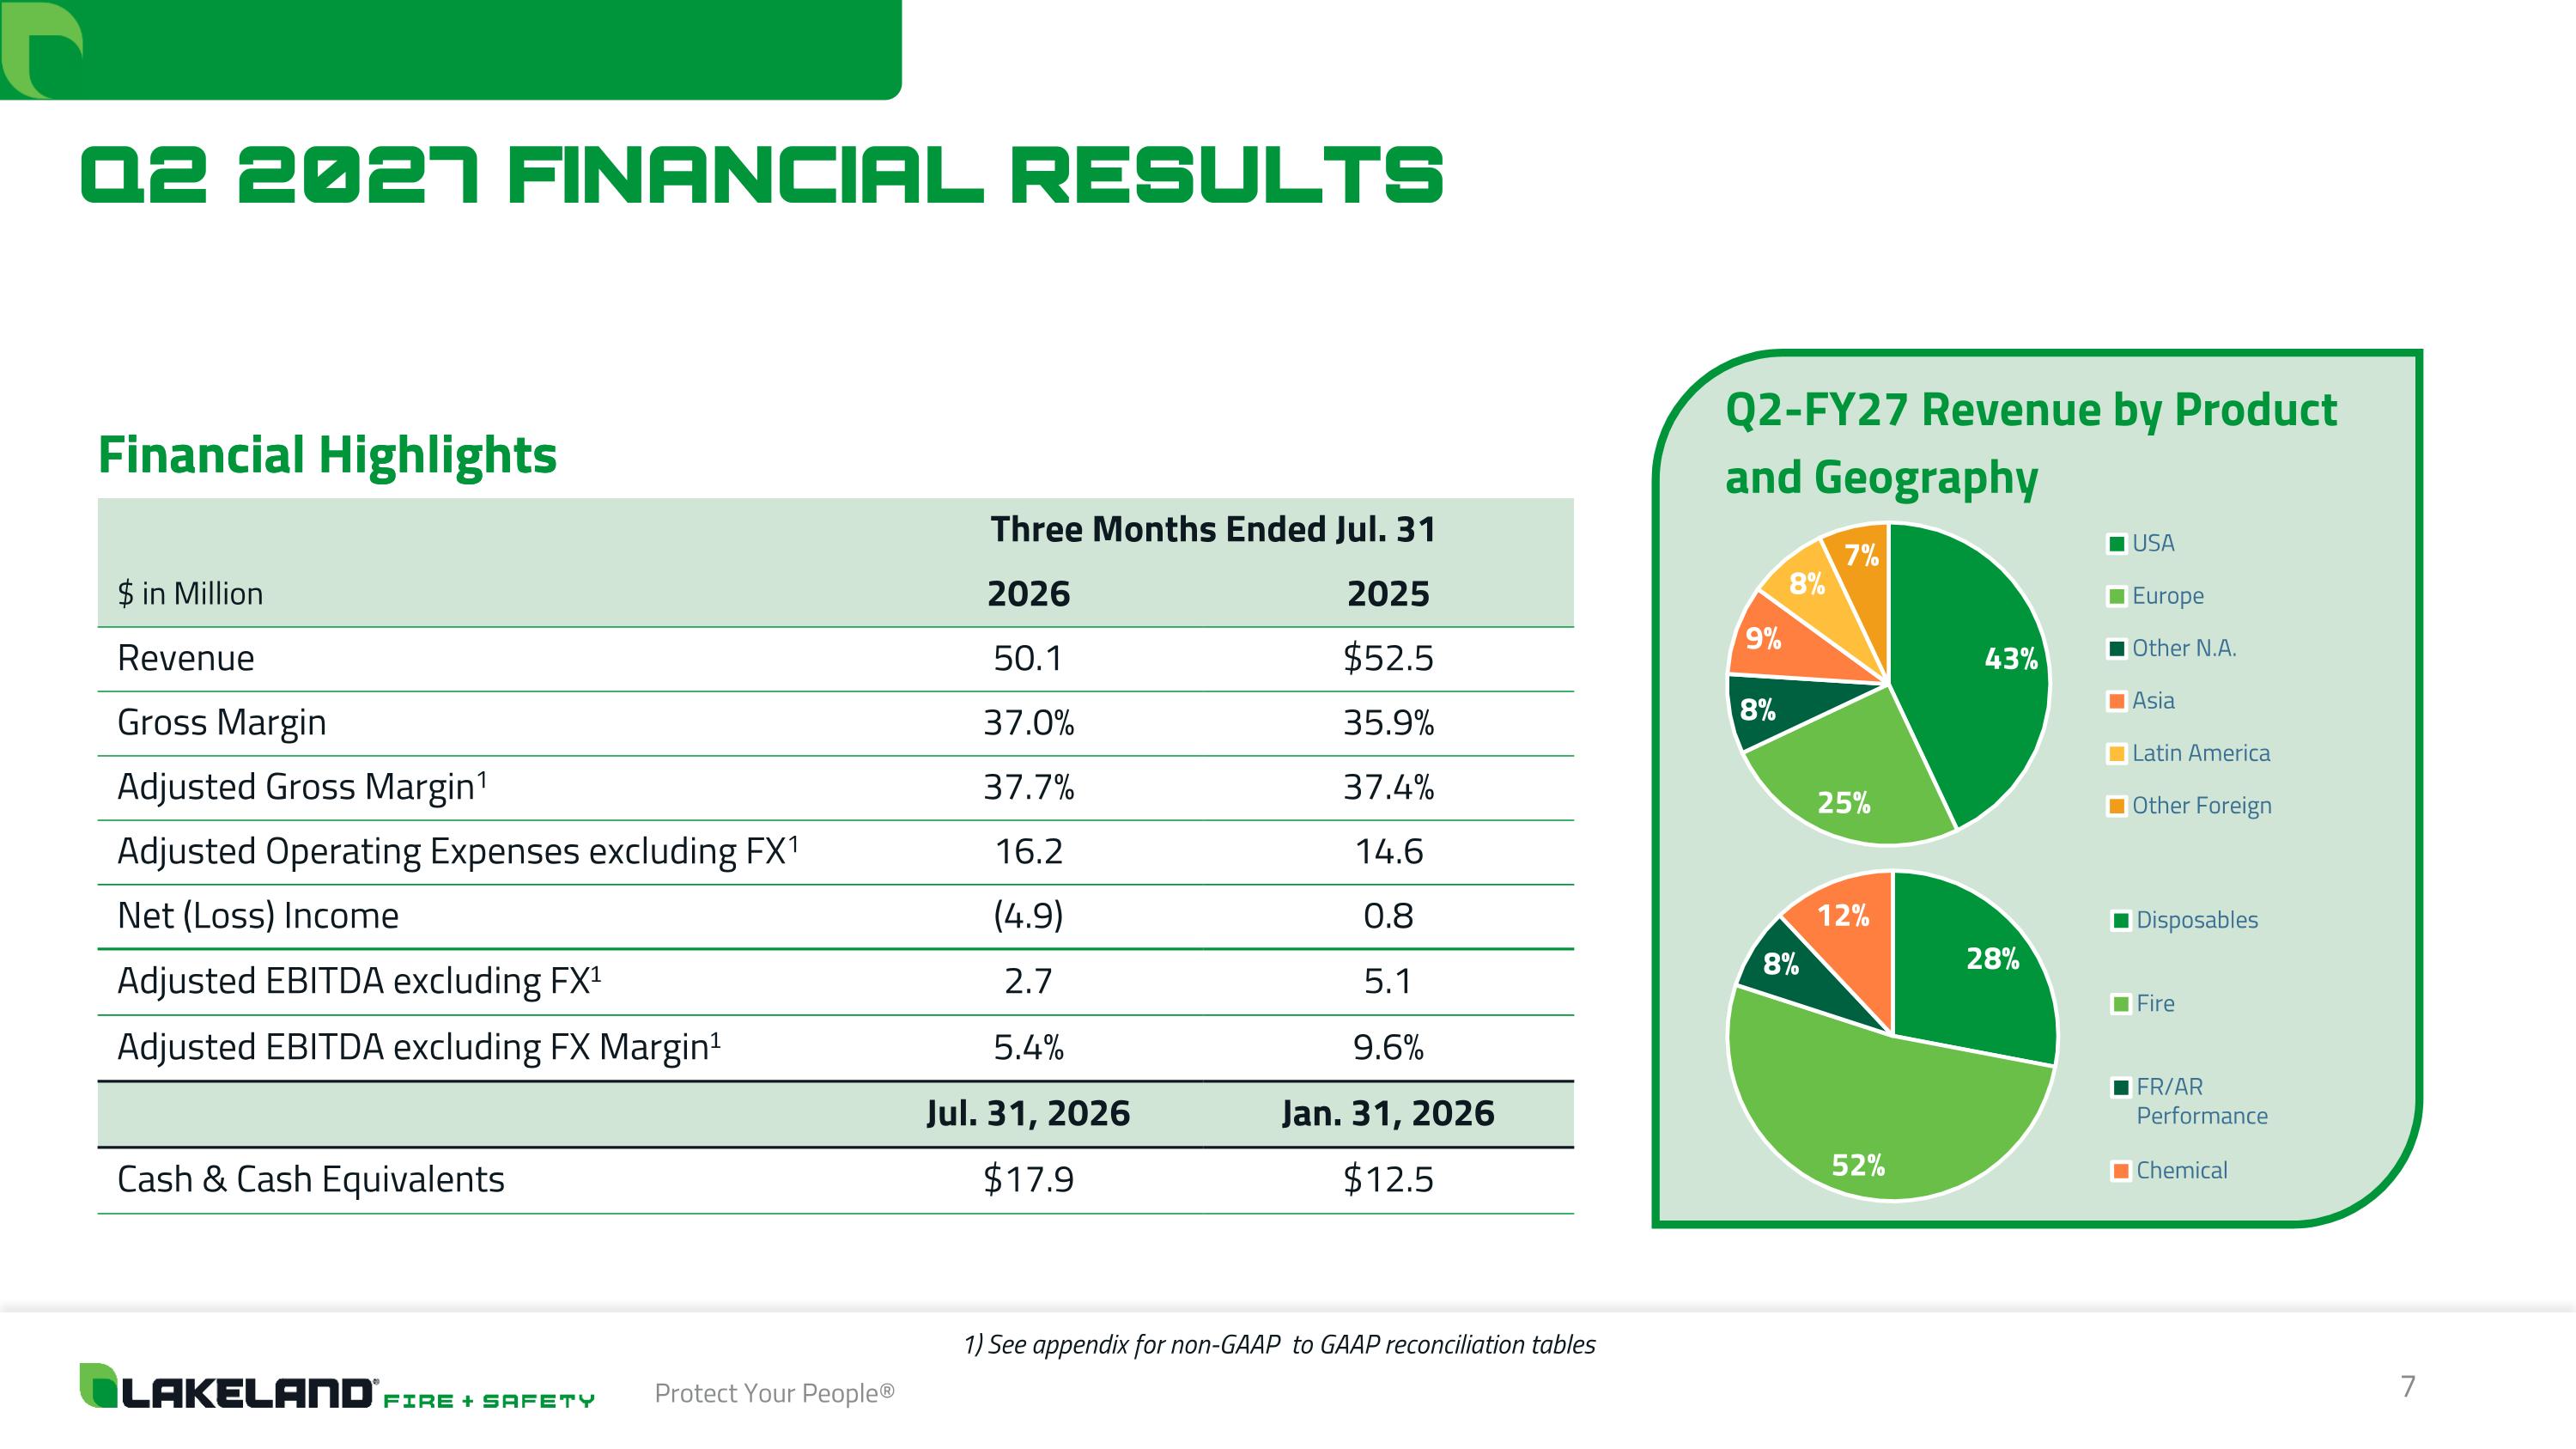
Q2 2027 FINANCIAL RESULTS Financial Highlights Q2-FY27 Revenue by Product and Geography Financial Highlights Three Months Ended Jul. 31 $ in Million 2026 2025 Revenue 50.1 $52.5 Gross Margin 37.0% 35.9% Adjusted Gross Margin1 37.7% 37.4% Adjusted Operating Expenses excluding FX1 16.2 14.6 Net (Loss) Income (4.9) 0.8 Adjusted EBITDA excluding FX1 2.7 5.1 Adjusted EBITDA excluding FX Margin1 5.4% 9.6% Jul. 31, 2026 Jan. 31, 2026 Cash & Cash Equivalents $17.9 $12.5 1) See appendix for non-GAAP to GAAP reconciliation tables
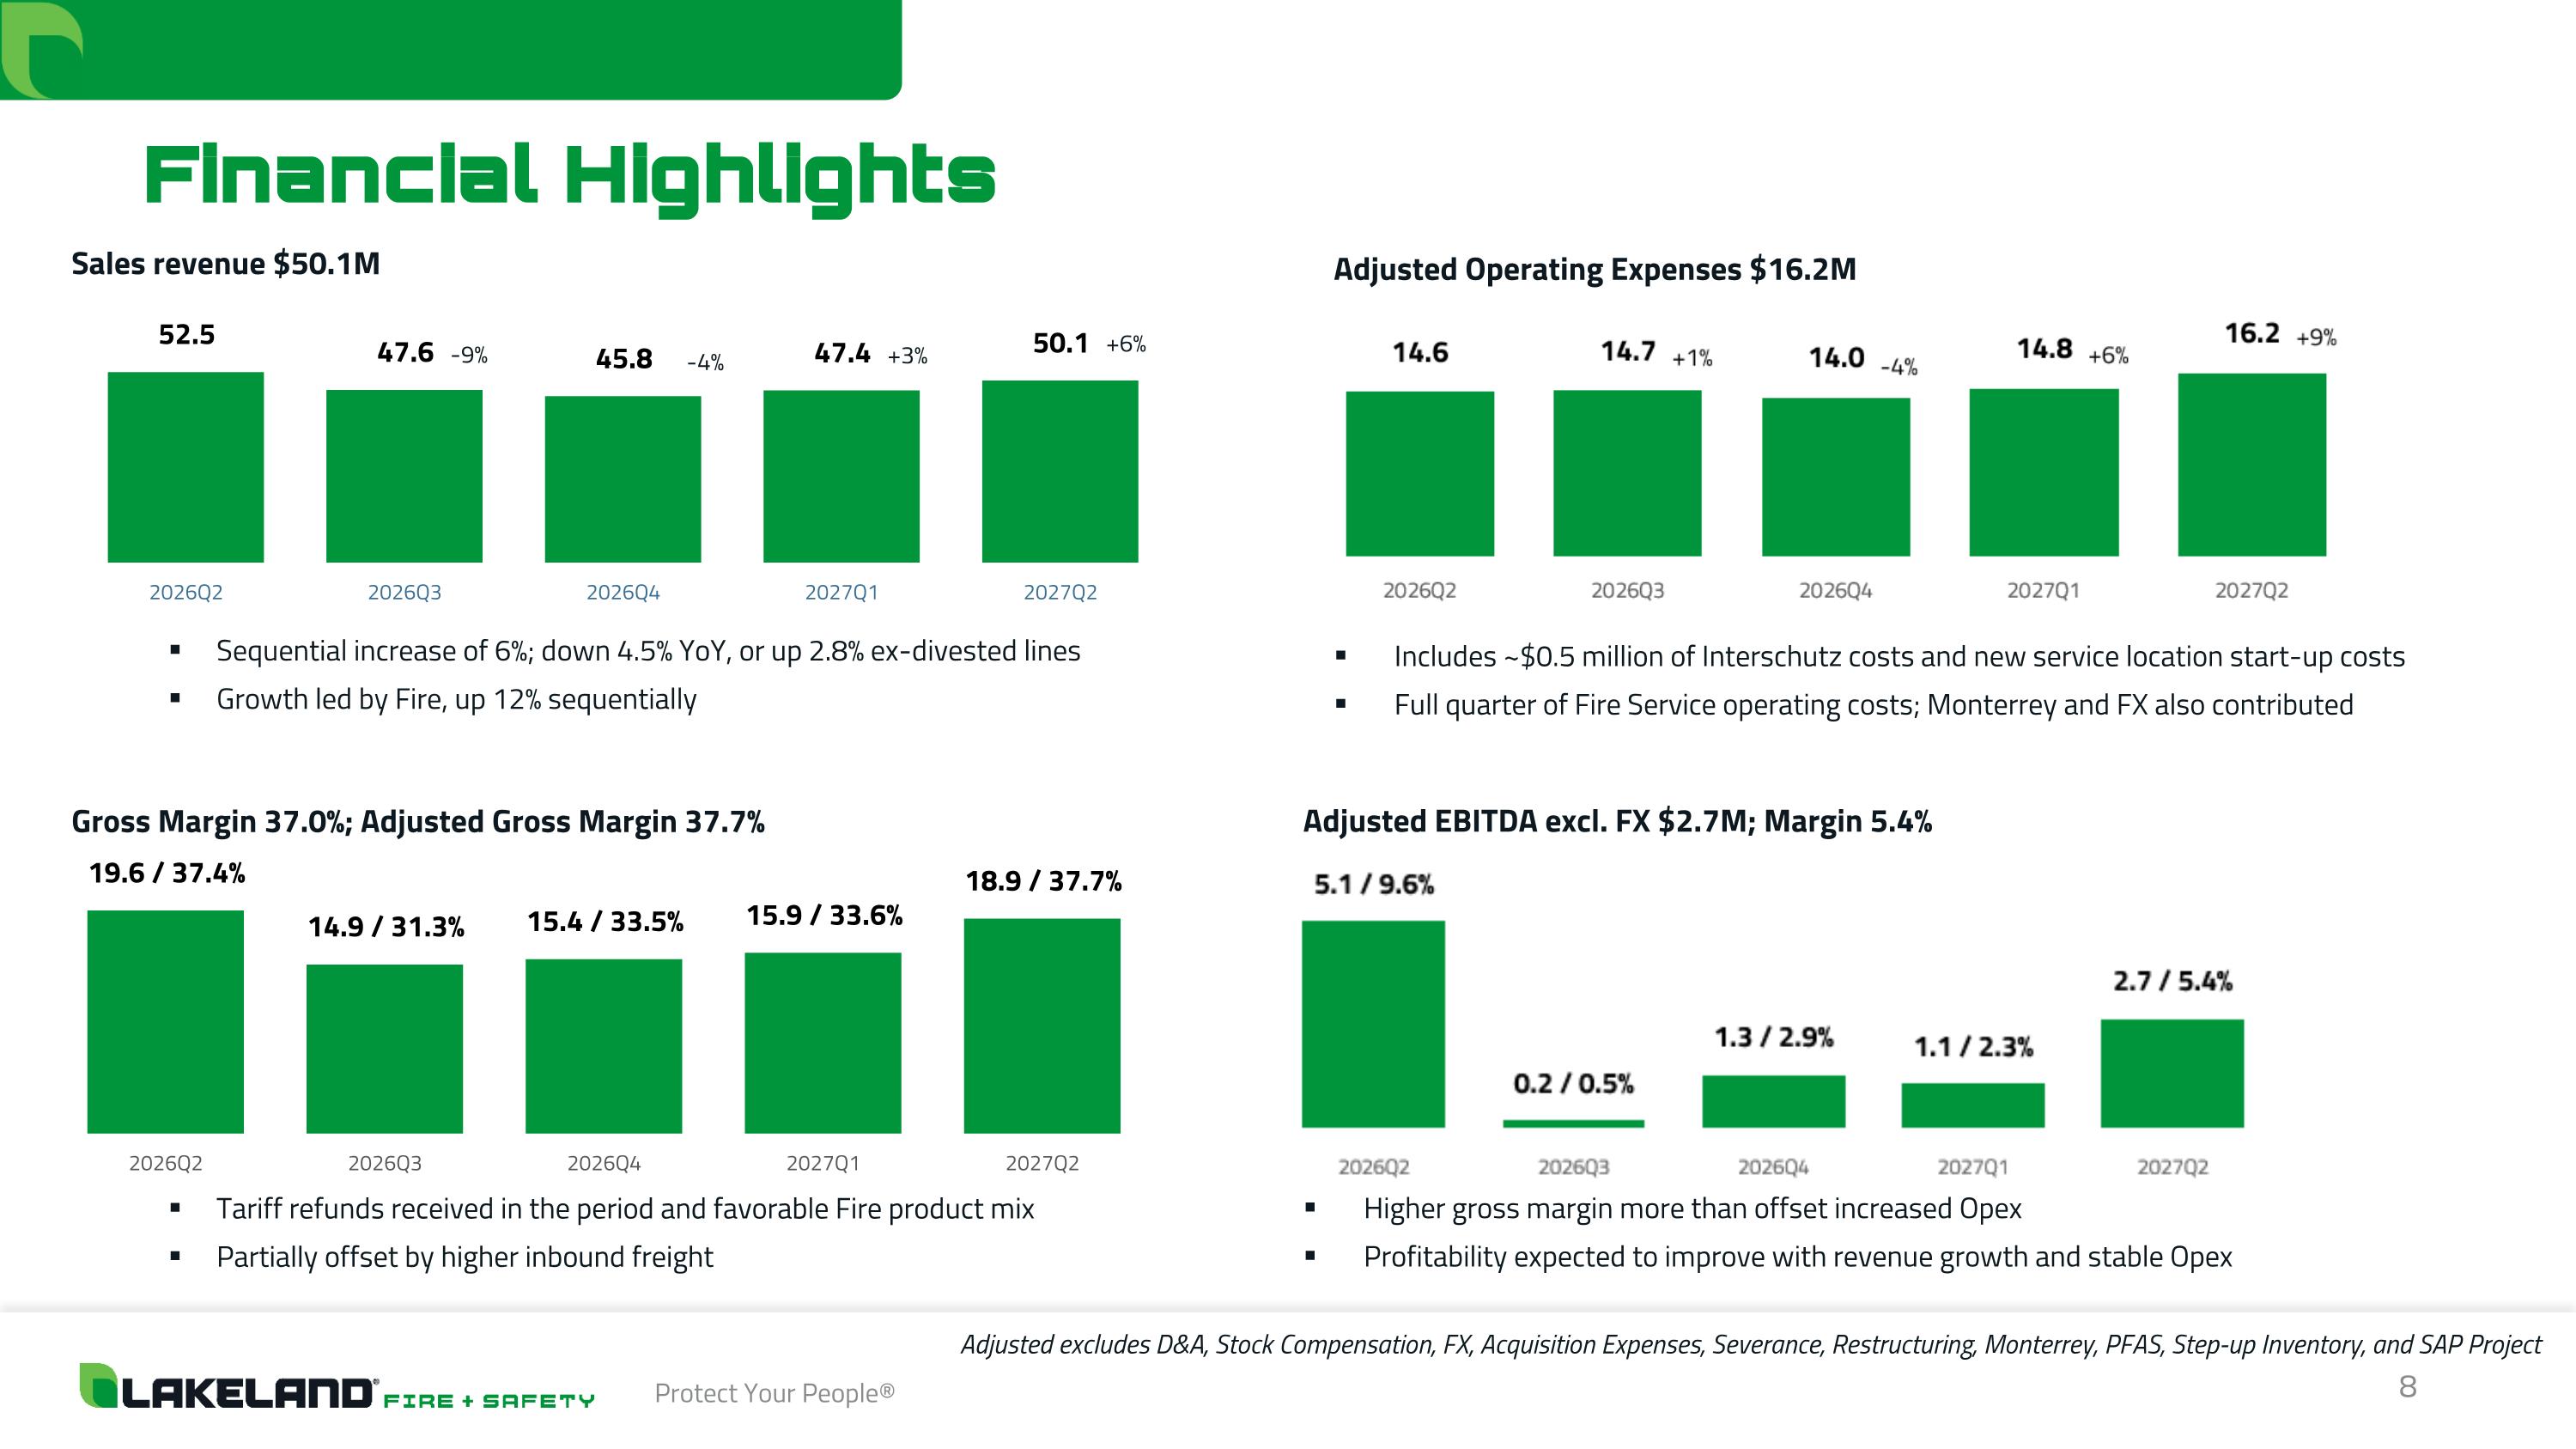
Financial Highlights Adjusted excludes D&A, Stock Compensation, FX, Acquisition Expenses, Severance, Restructuring, Monterrey, PFAS, Step-up Inventory, and SAP Project Adjusted Operating Expenses $16.2M Includes ~$0.5 million of Interschutz costs and new service location start-up costs Full quarter of Fire Service operating costs; Monterrey and FX also contributed Adjusted EBITDA excl. FX $2.7M; Margin 5.4% Higher gross margin more than offset increased Opex Profitability expected to improve with revenue growth and stable Opex Gross Margin 37.0%; Adjusted Gross Margin 37.7% Tariff refunds received in the period and favorable Fire product mix Partially offset by higher inbound freight Sales revenue $50.1M Sequential increase of 6%; down 4.5% YoY, or up 2.8% ex-divested lines Growth led by Fire, up 12% sequentially
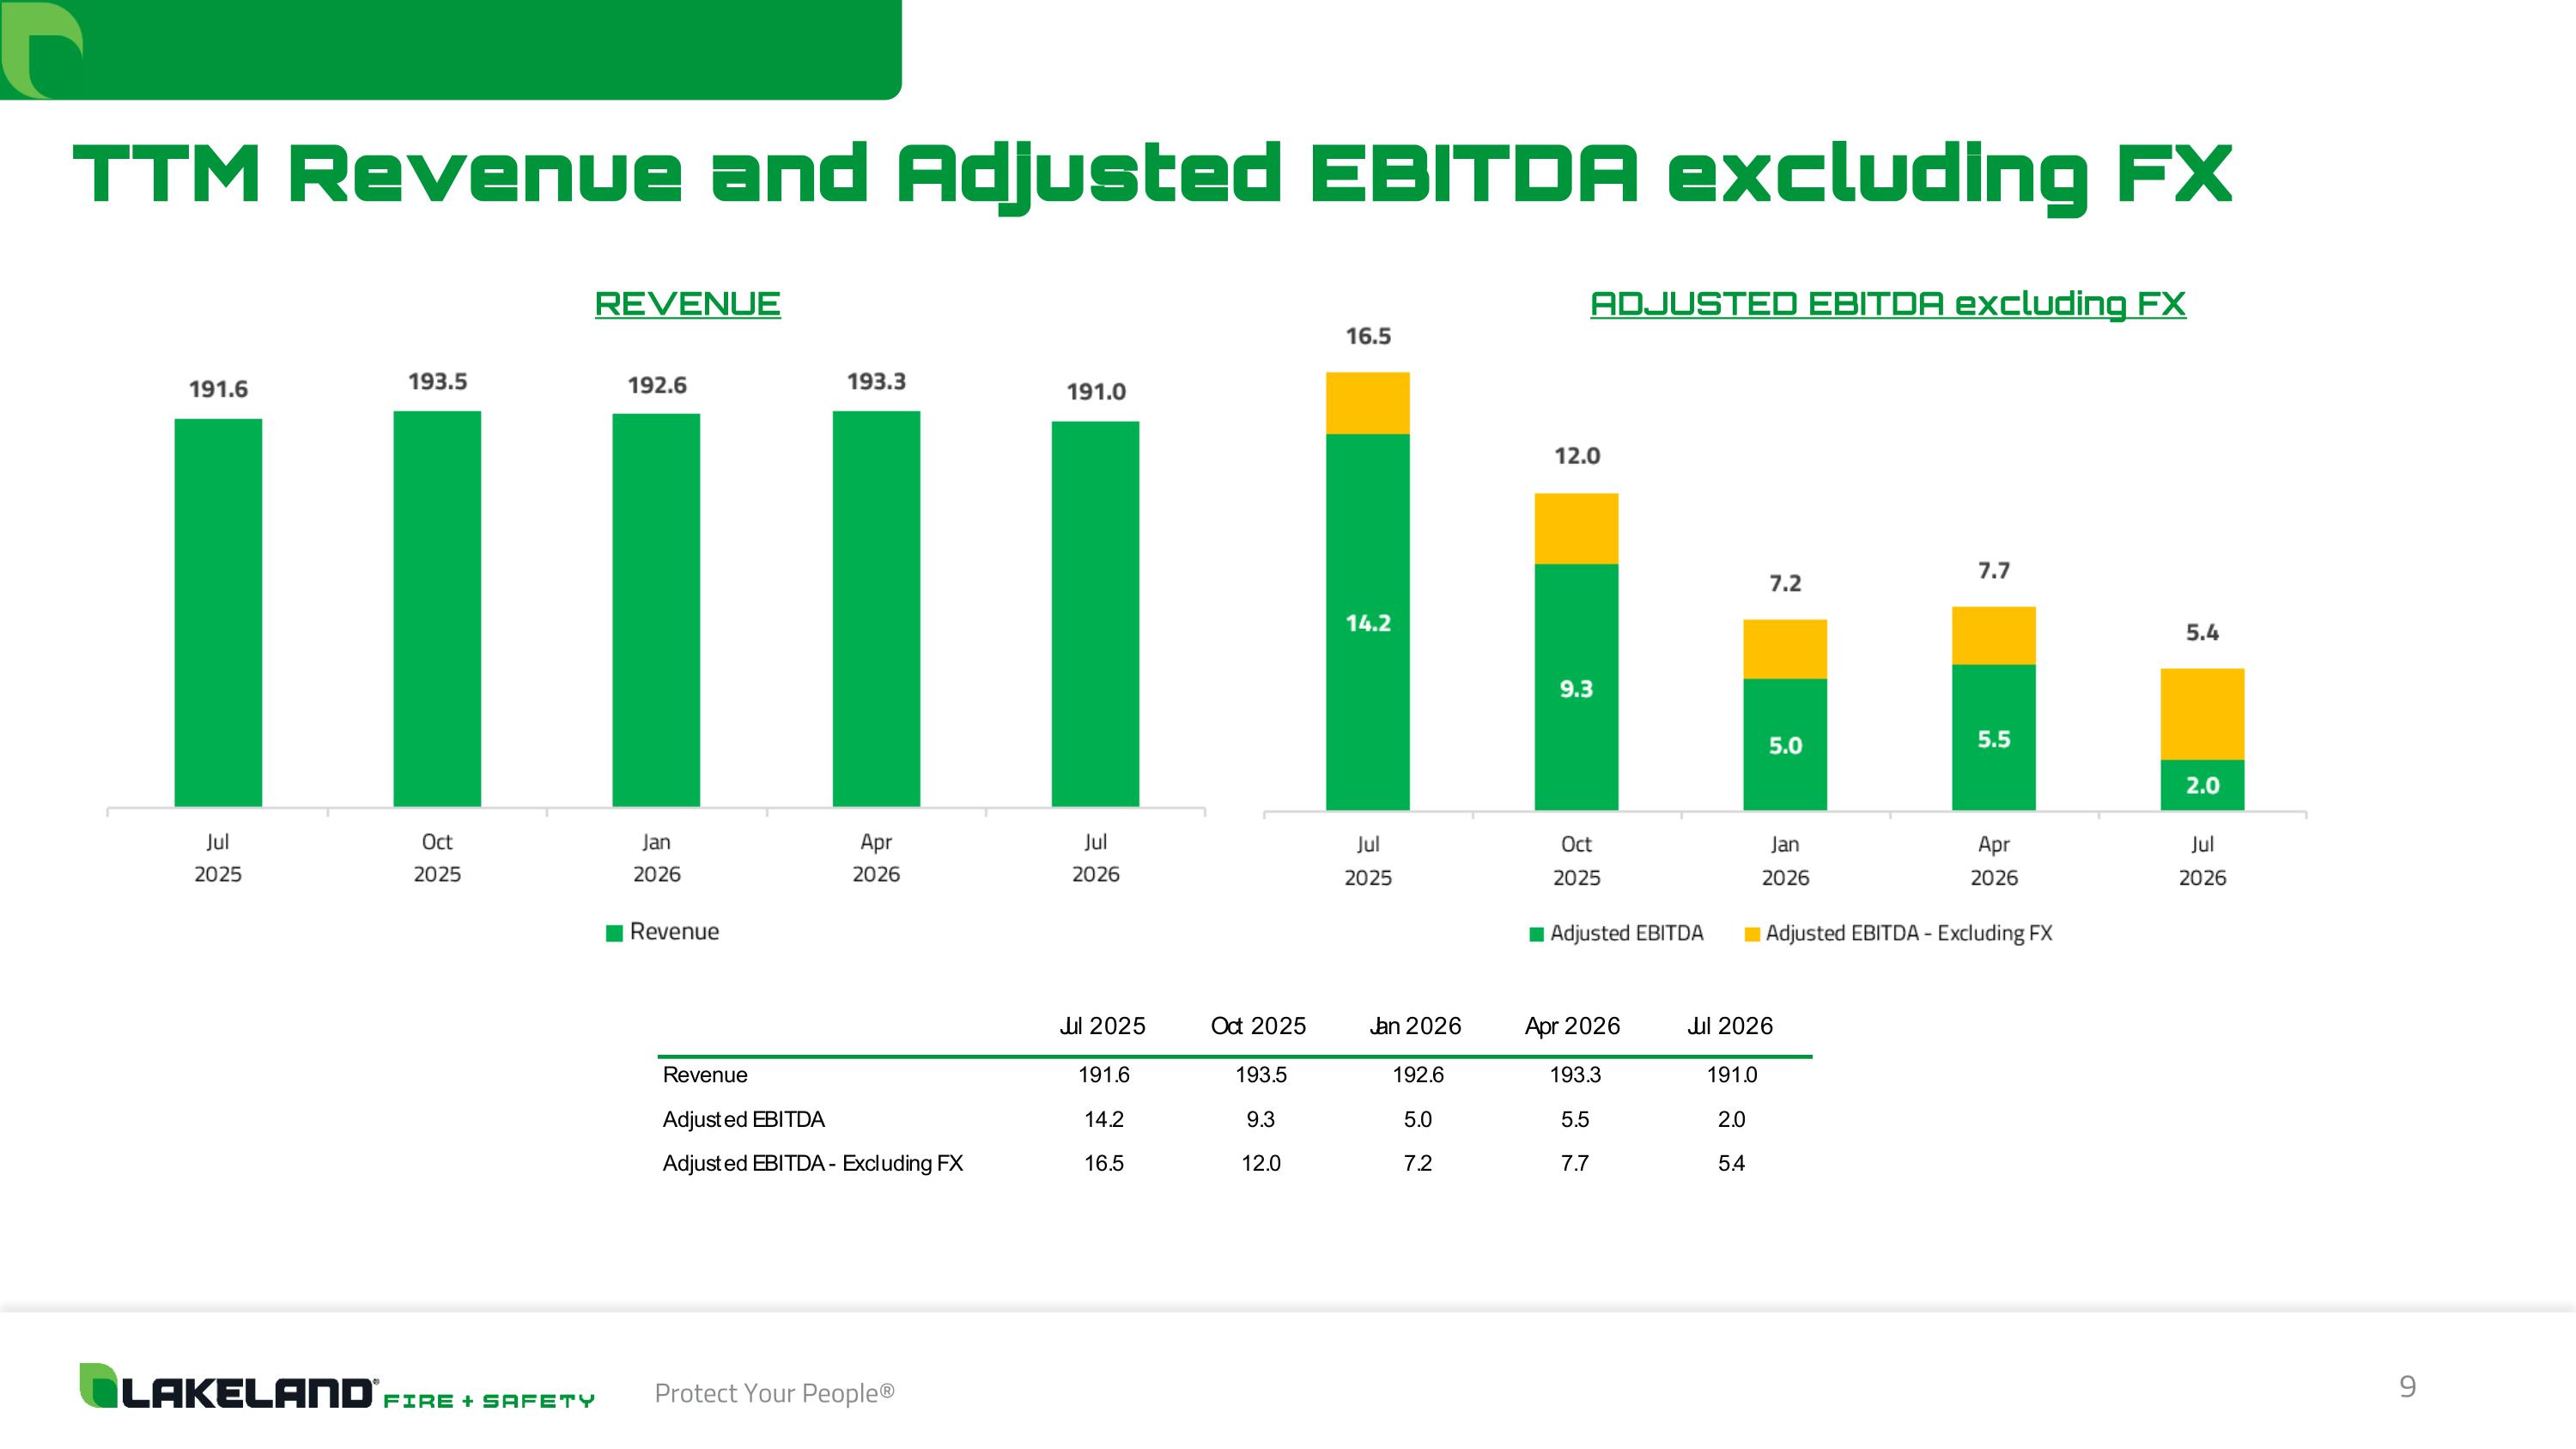
TTM Revenue and Adjusted EBITDA excluding FX REVENUE ADJUSTED EBITDA excluding FX
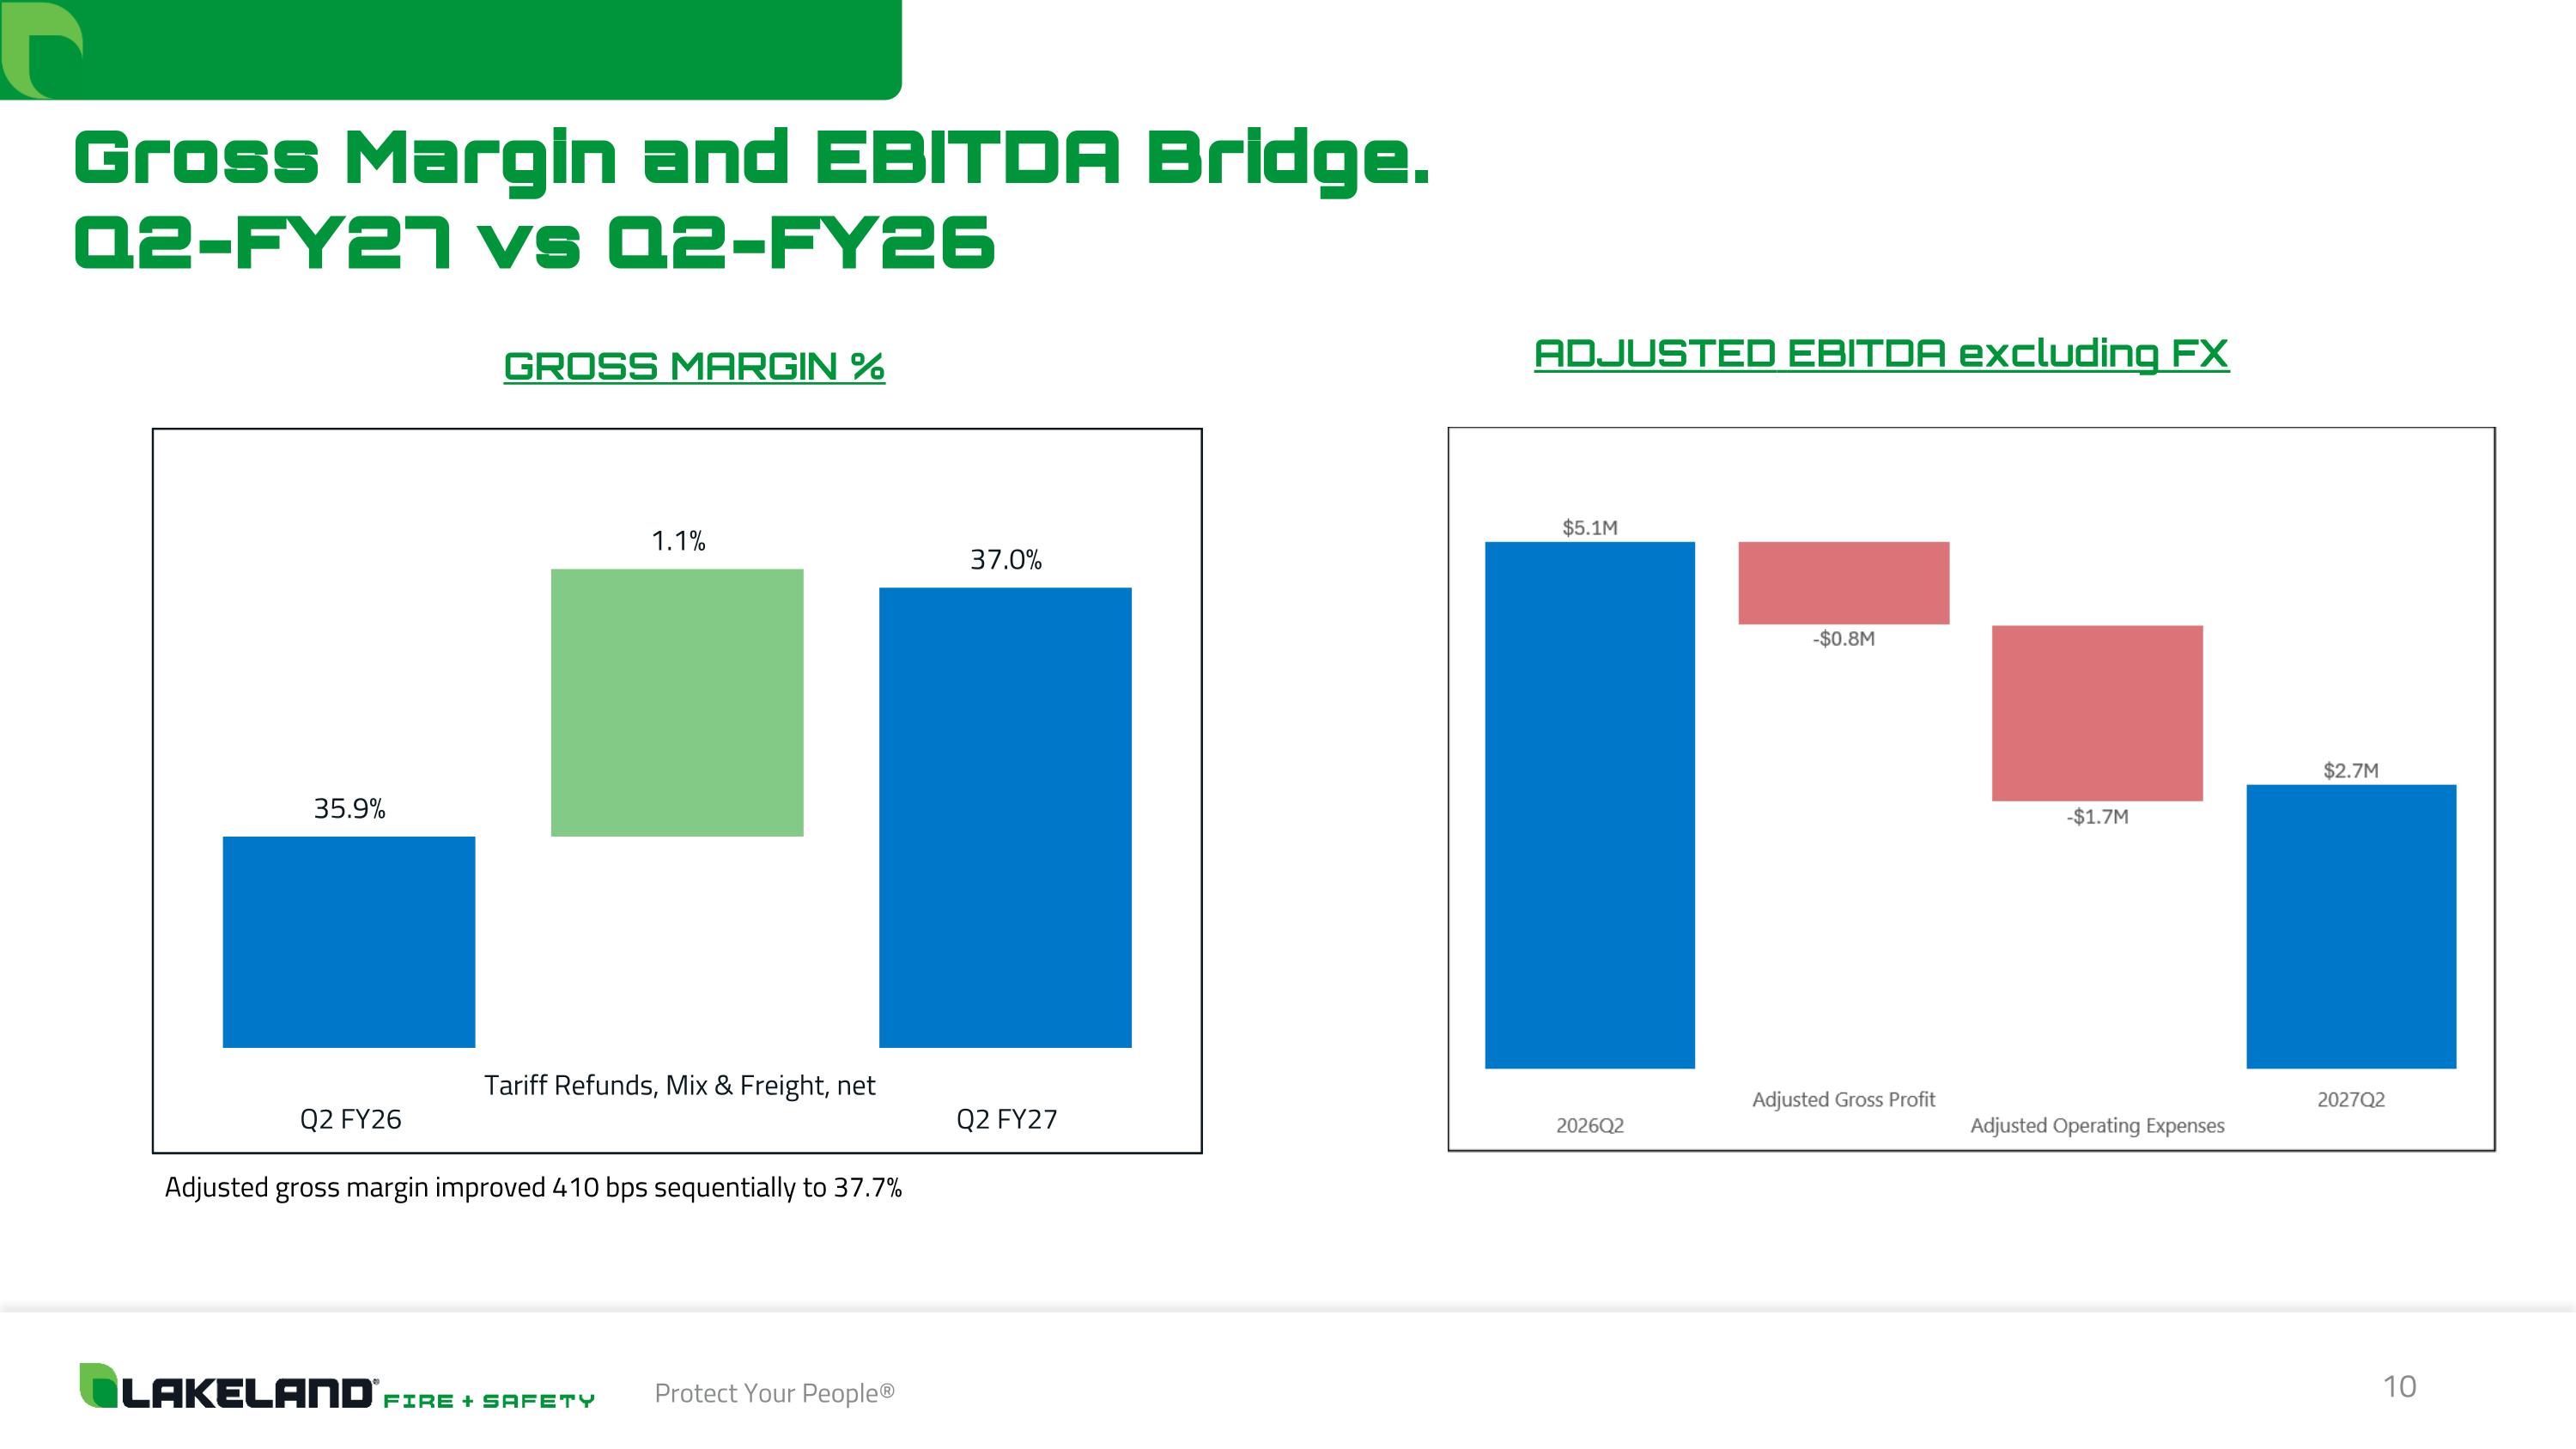
Gross Margin and EBITDA Bridge. Q2-FY27 vs Q2-FY26 GROSS MARGIN % ADJUSTED EBITDA excluding FX Adjusted gross margin improved 410 bps sequentially to 37.7%
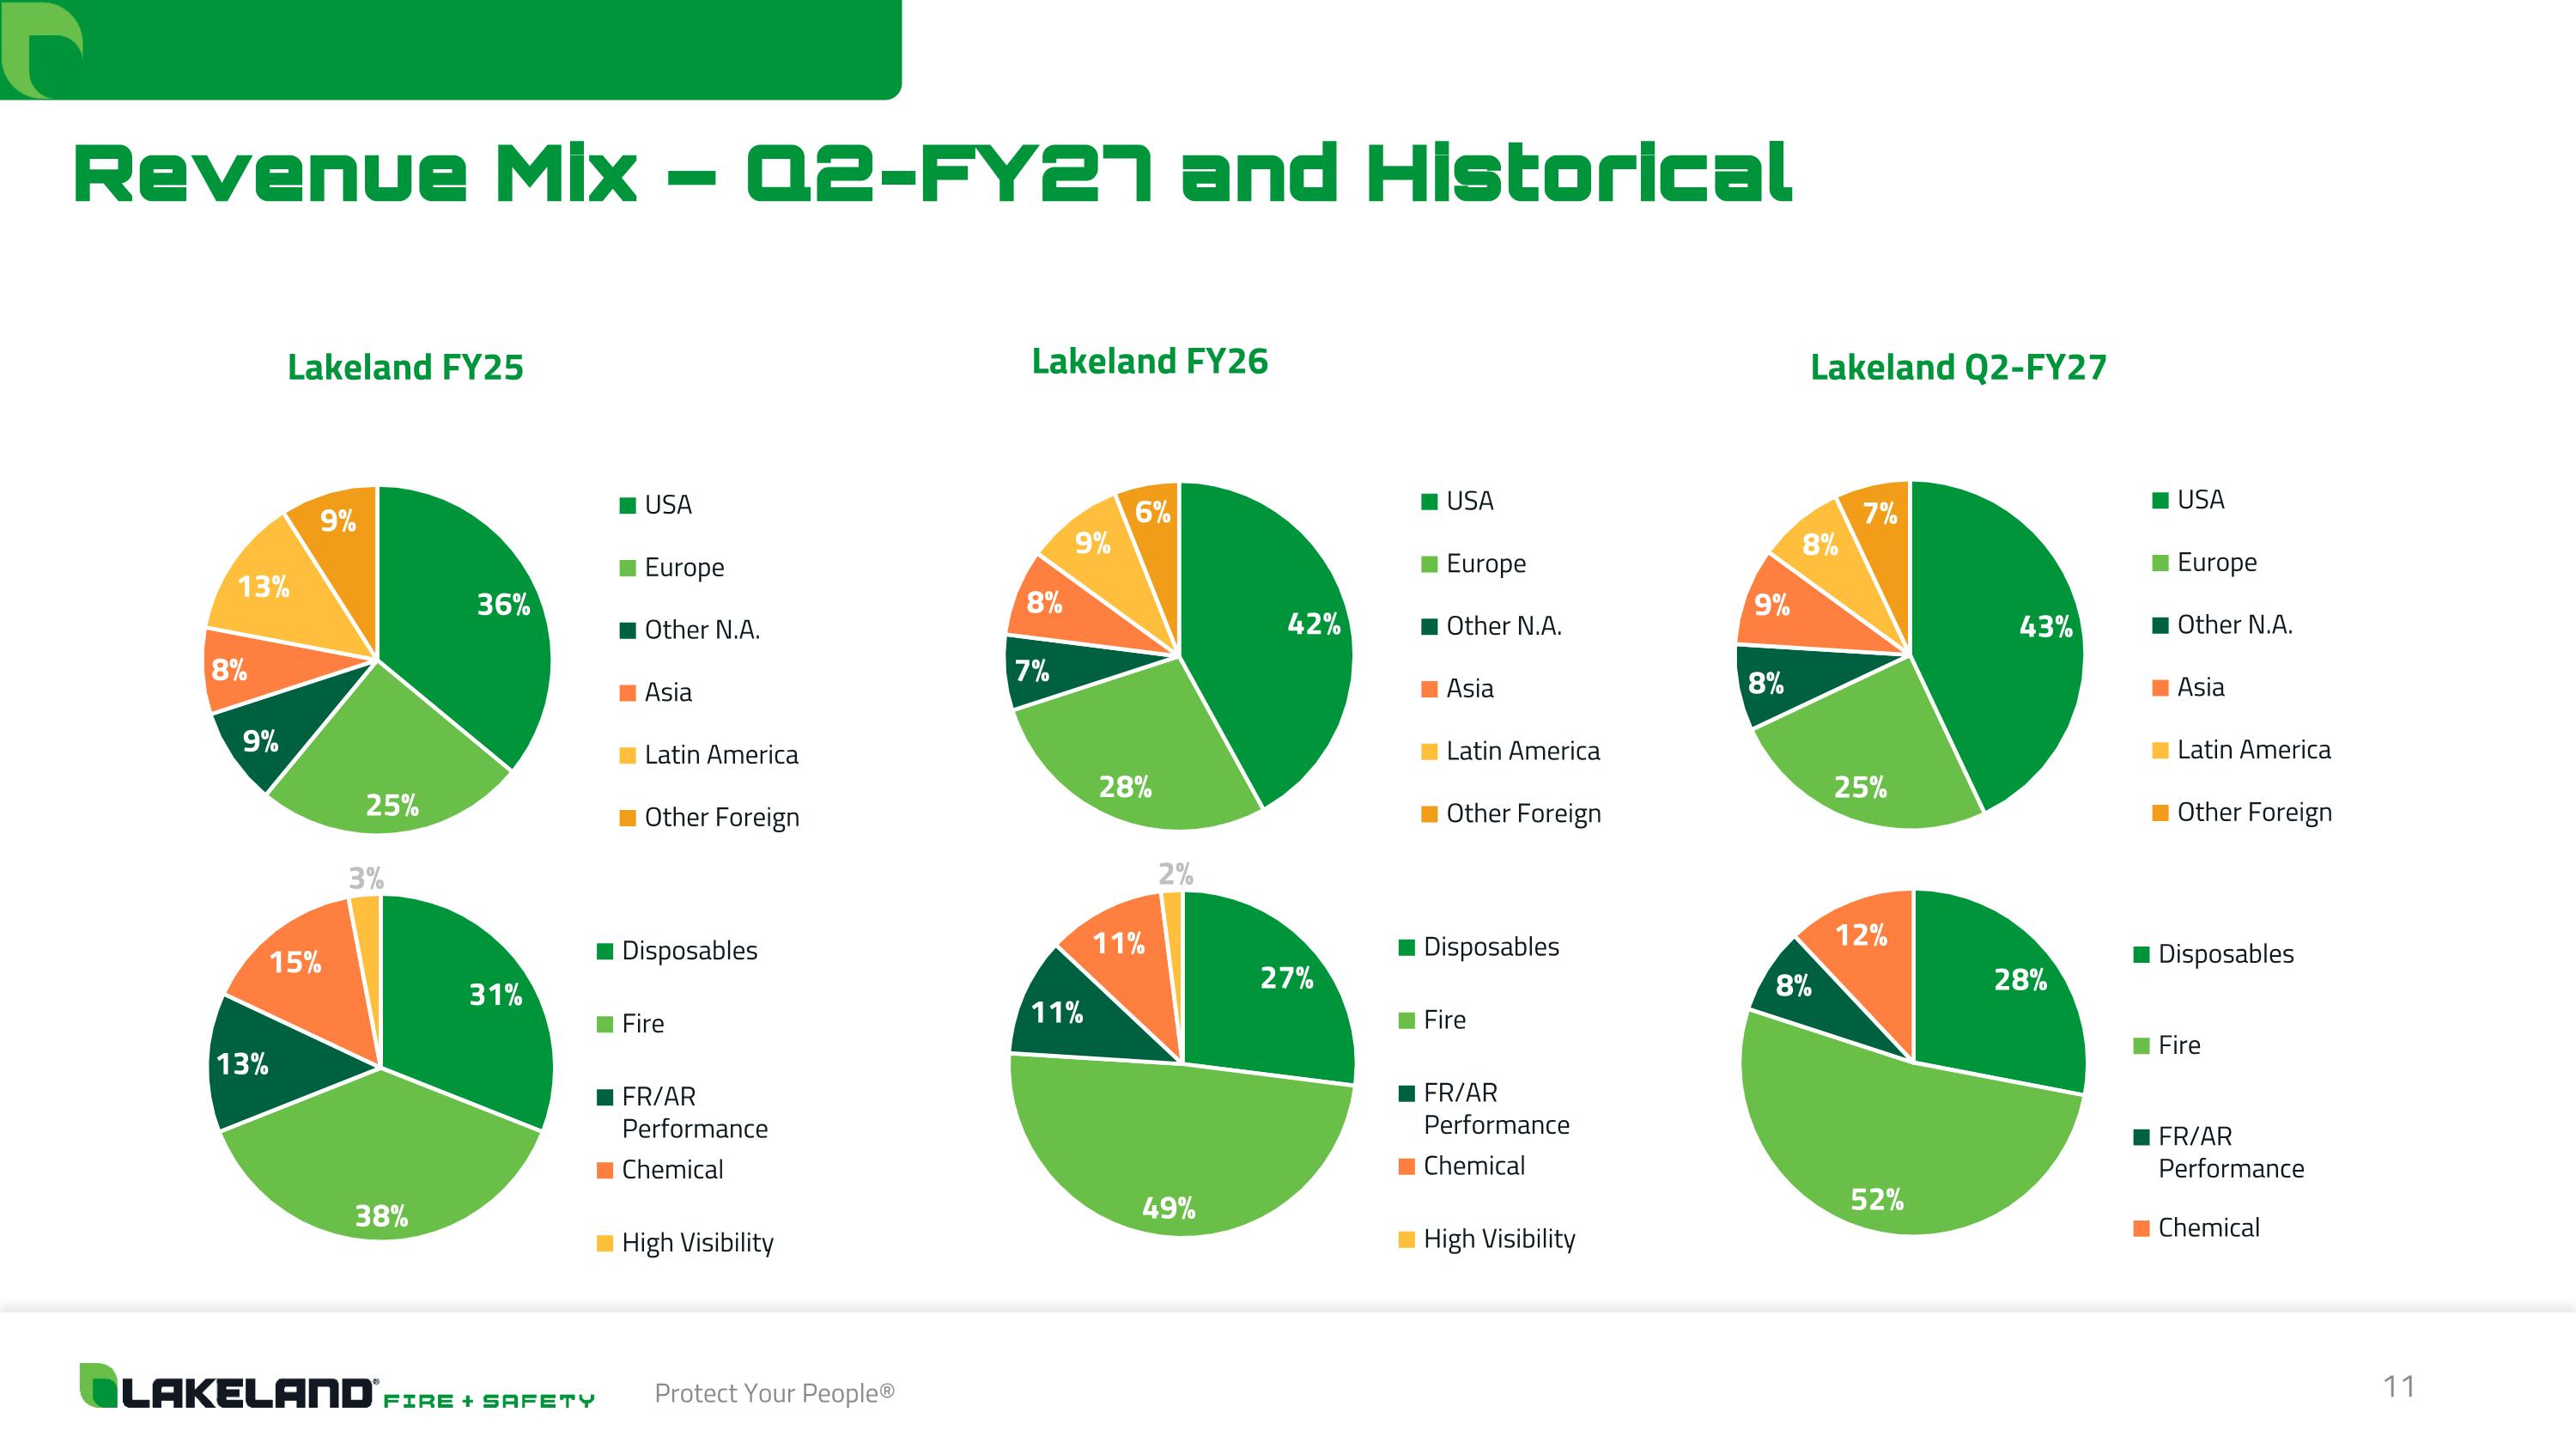
Revenue Mix – Q2-FY27 and Historical Lakeland FY25 Lakeland Q2-FY27 Lakeland FY26
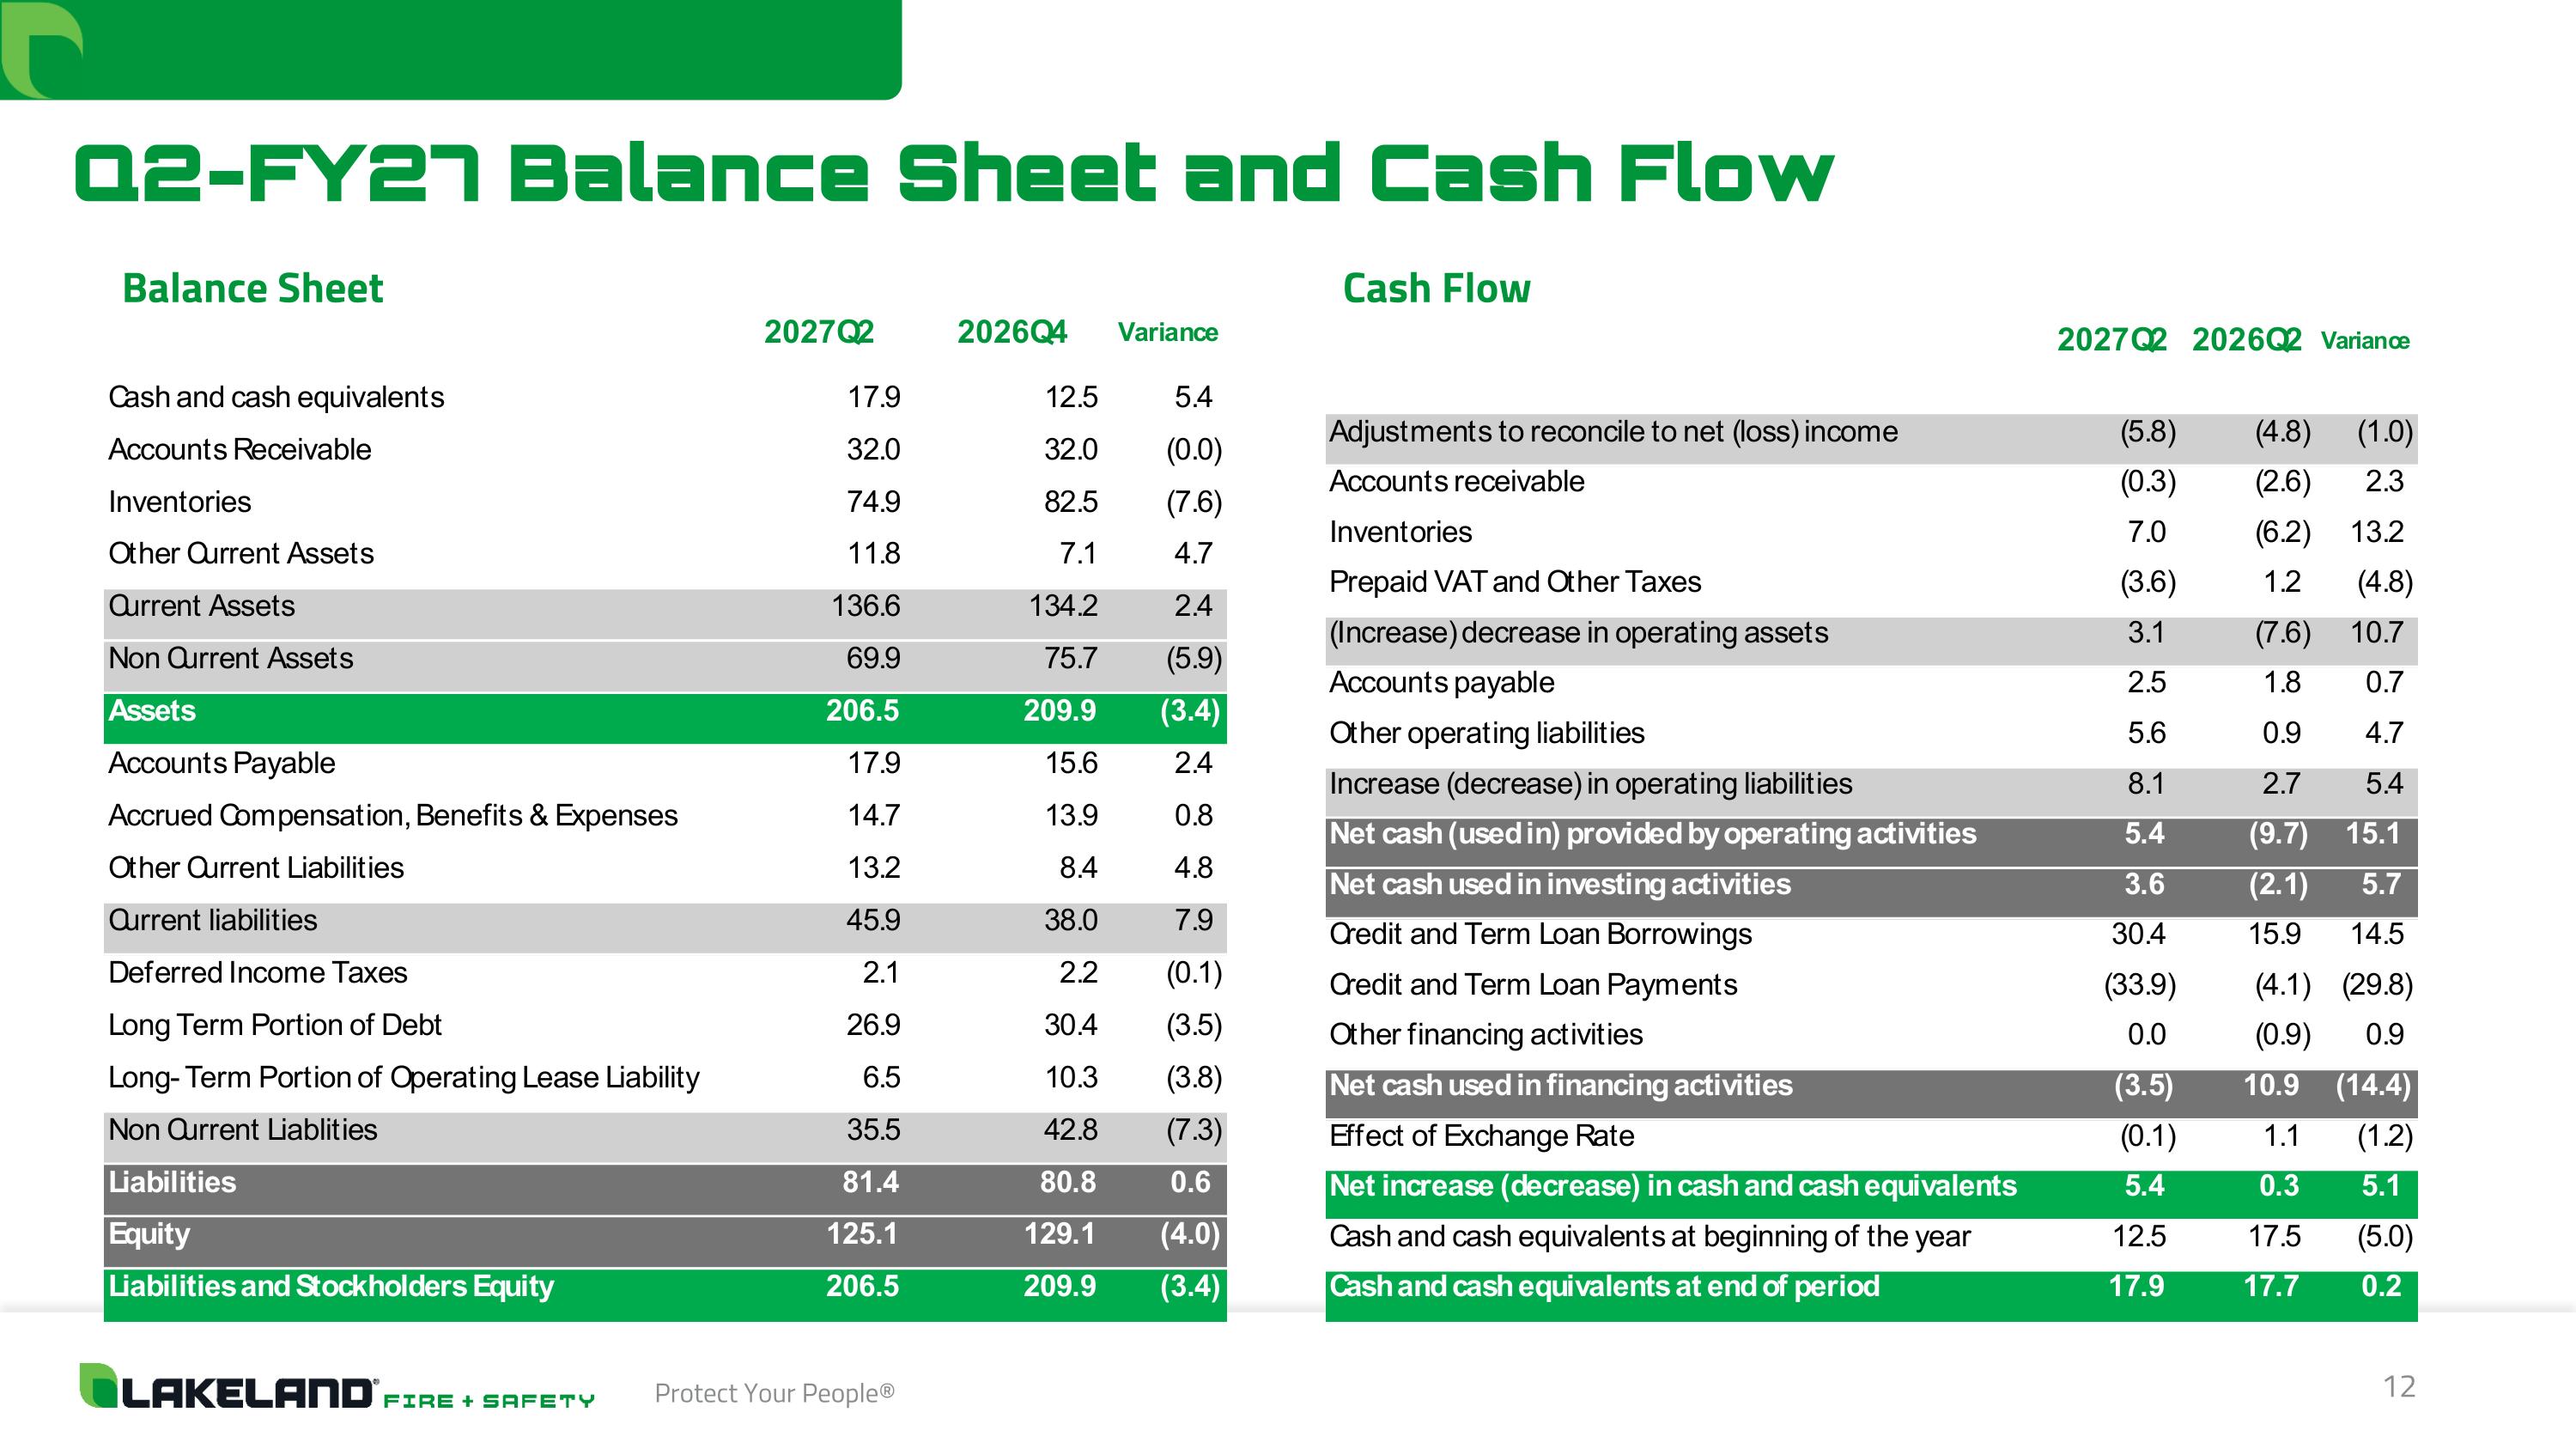
Q2-FY27 Balance Sheet and Cash Flow Balance Sheet Cash Flow
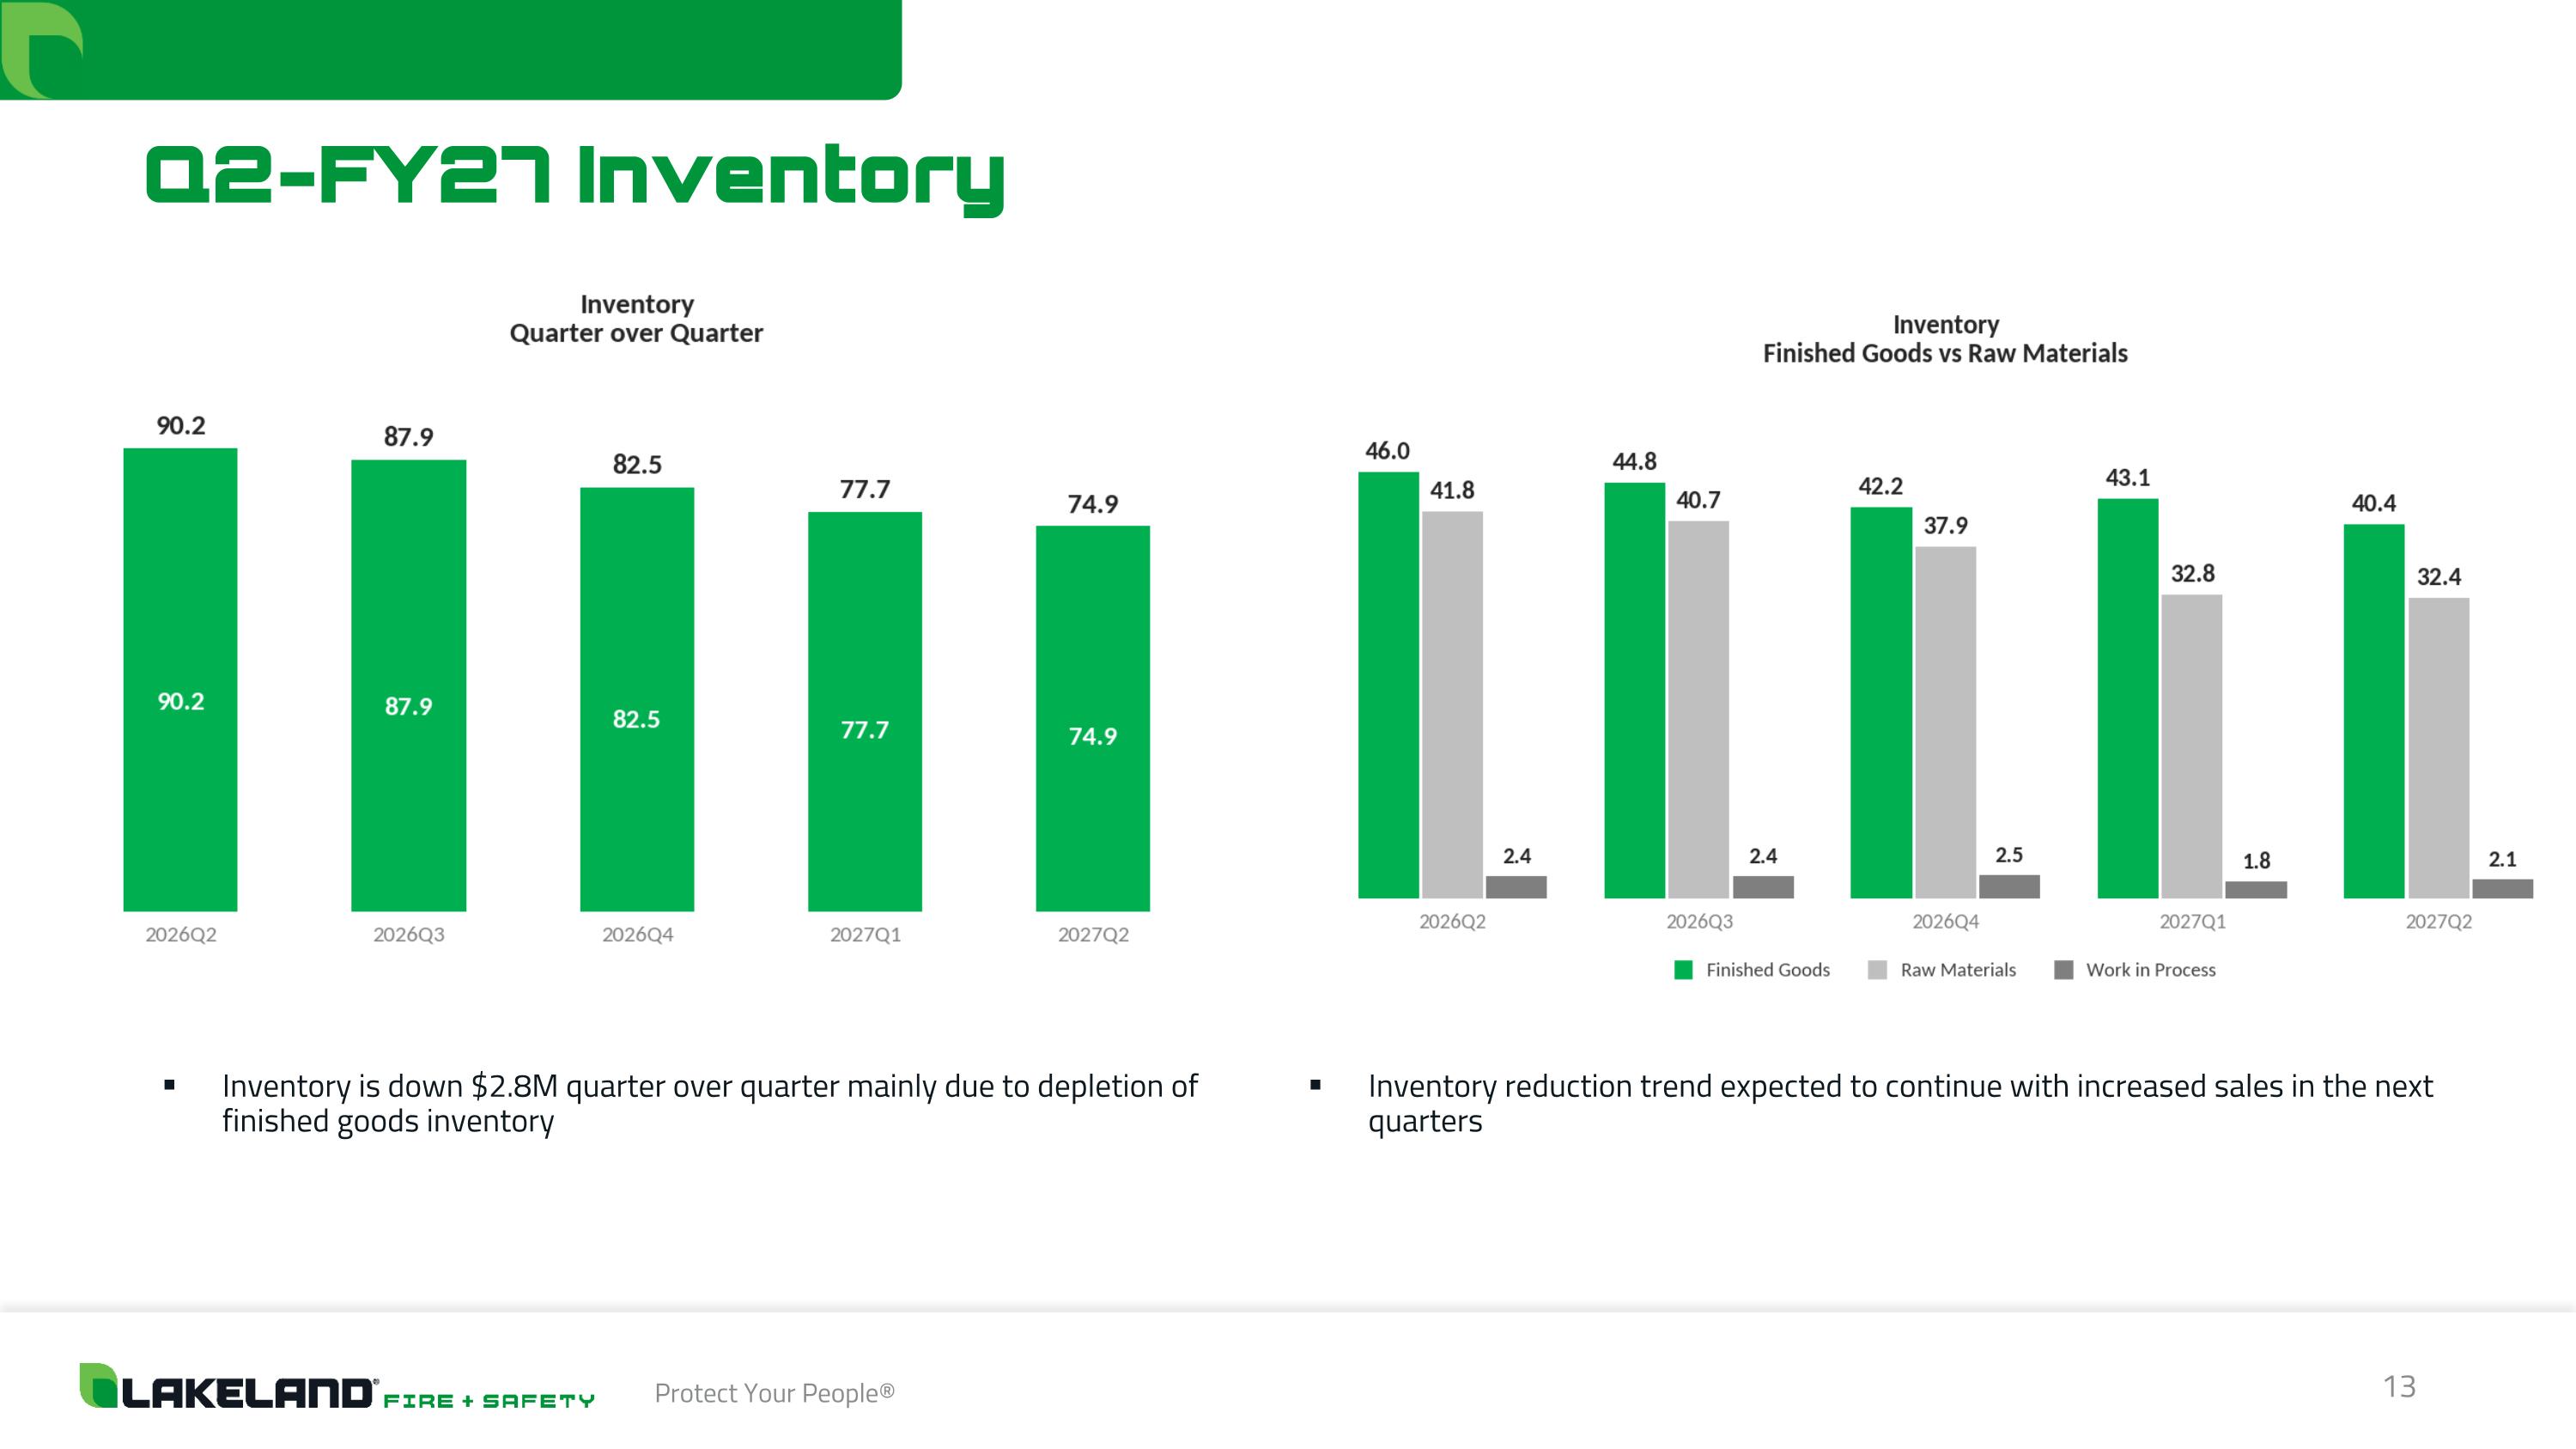
Q2-FY27 Inventory Inventory is down $2.8M quarter over quarter mainly due to depletion of finished goods inventory Inventory reduction trend expected to continue with increased sales in the next quarters
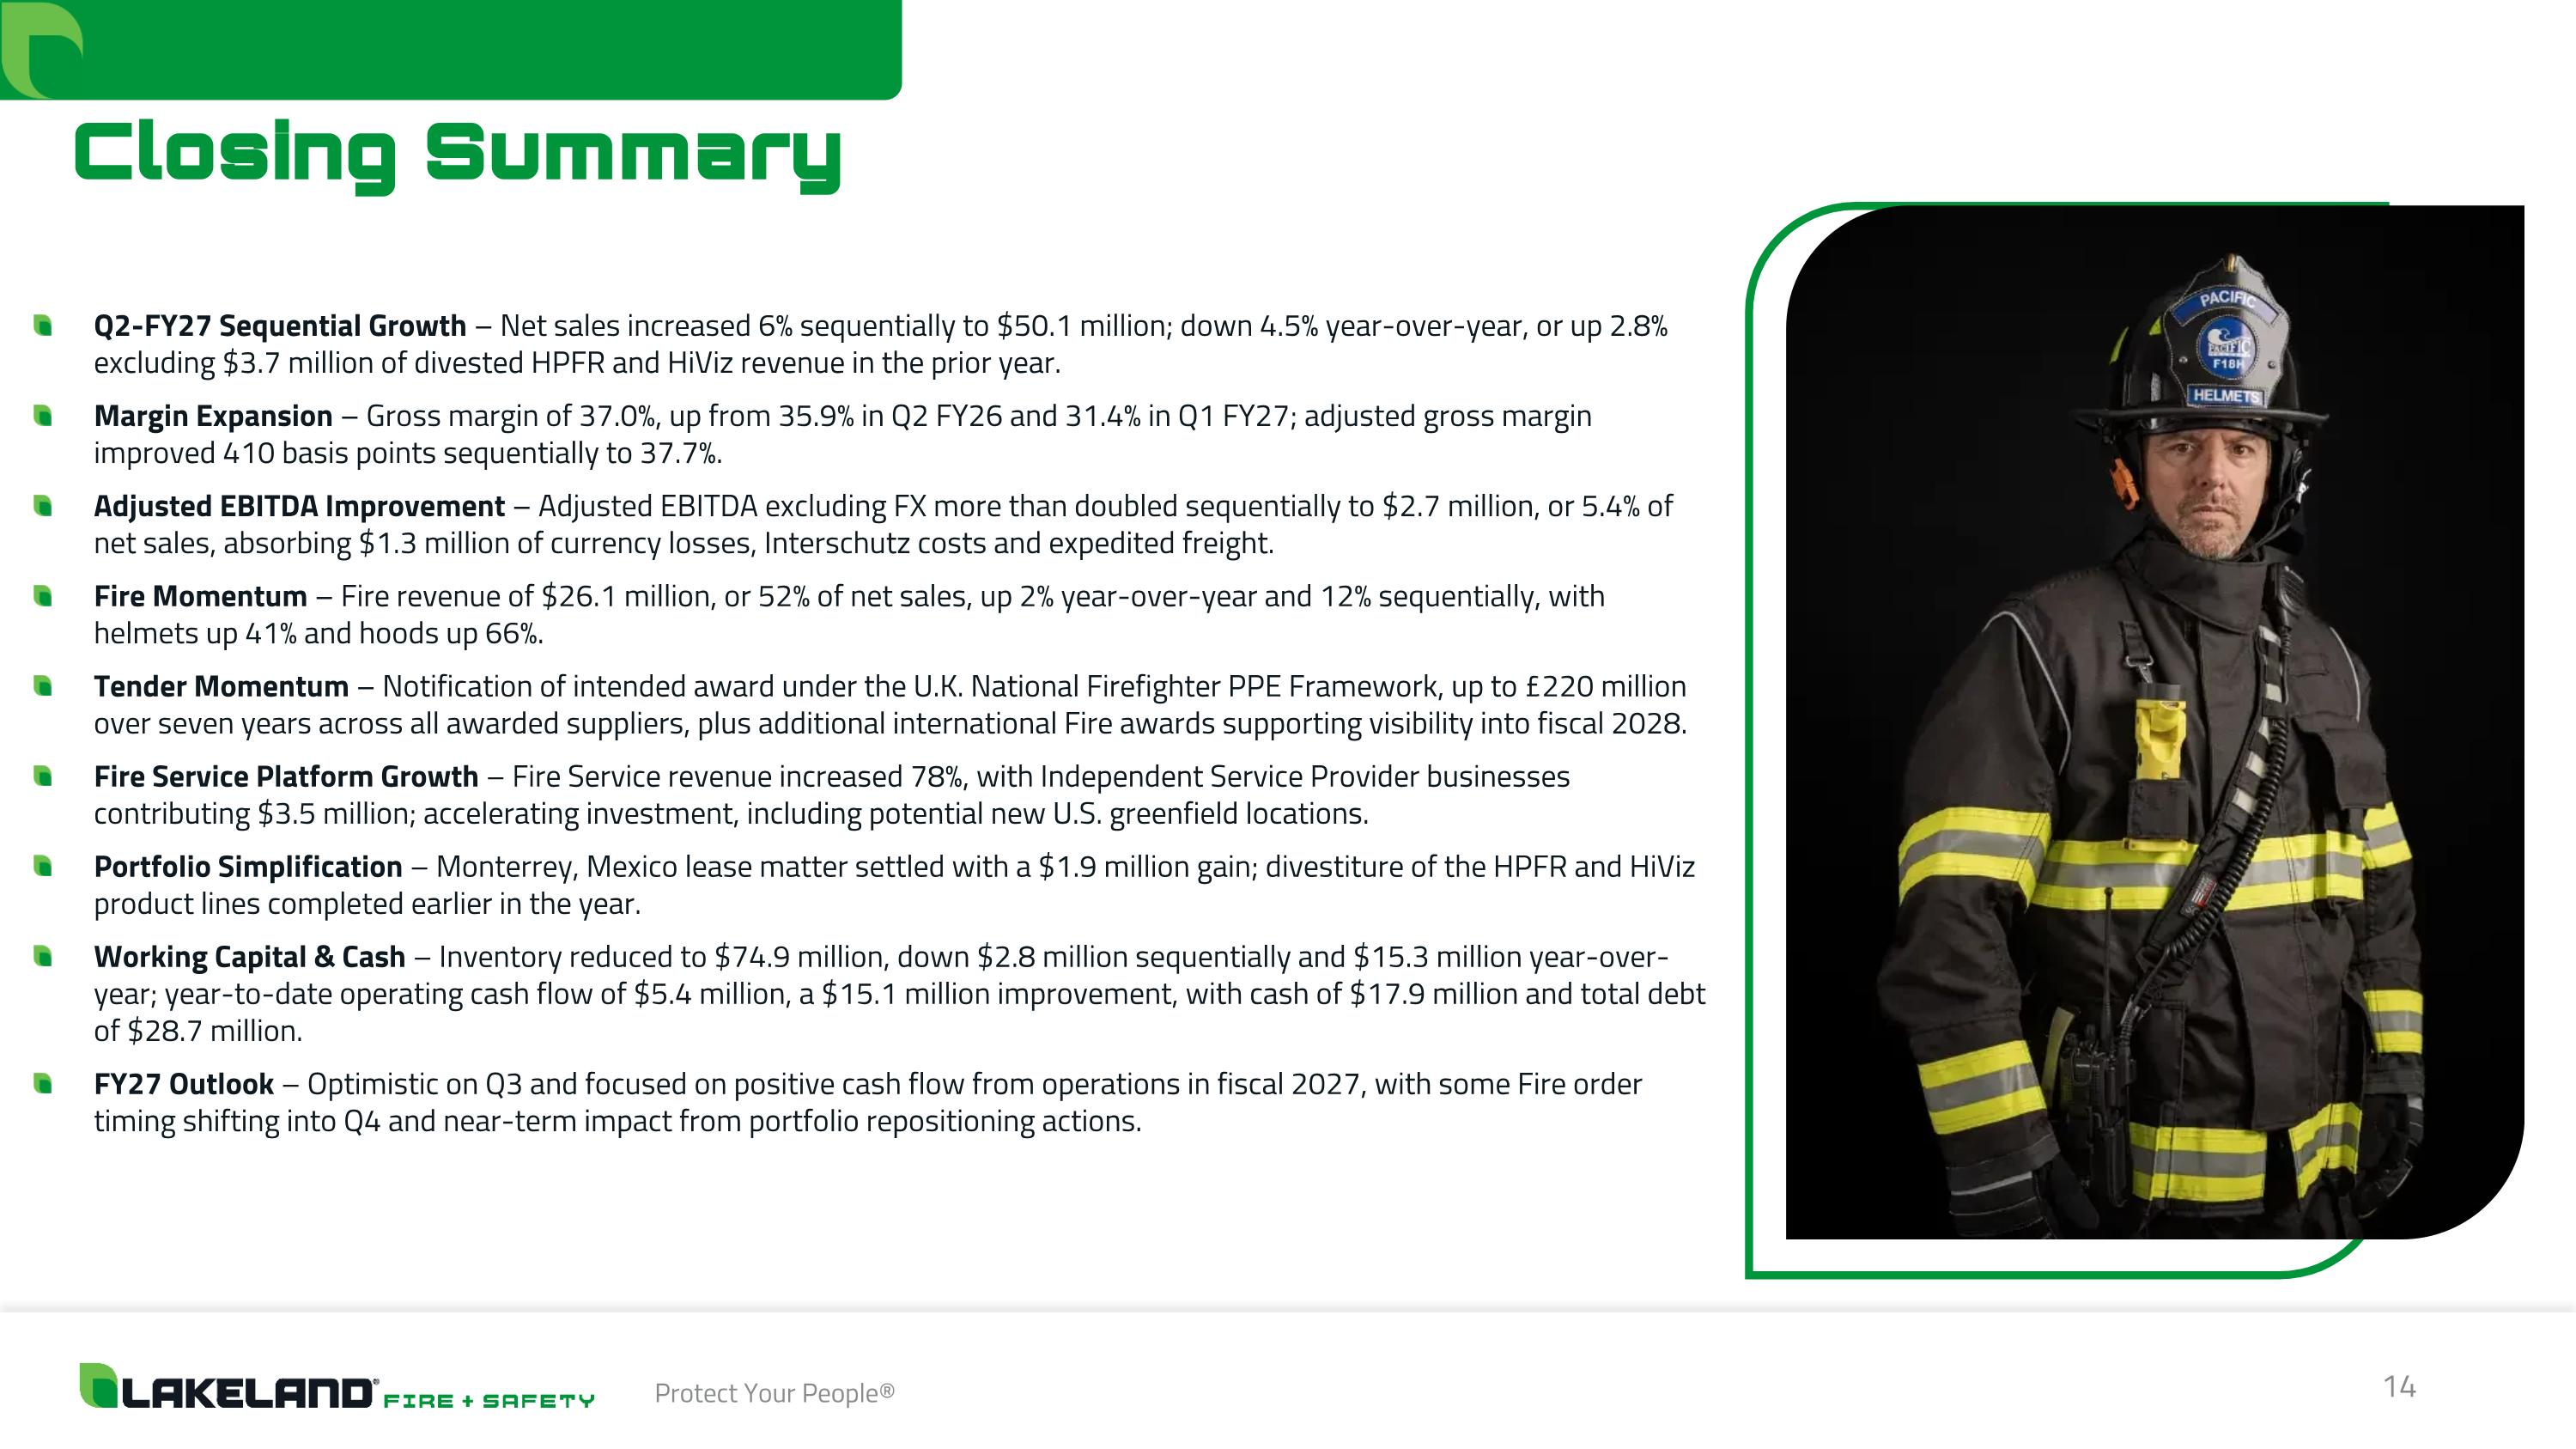
Closing Summary Q2-FY27 Sequential Growth – Net sales increased 6% sequentially to $50.1 million; down 4.5% year-over-year, or up 2.8% excluding $3.7 million of divested HPFR and HiViz revenue in the prior year. Margin Expansion – Gross margin of 37.0%, up from 35.9% in Q2 FY26 and 31.4% in Q1 FY27; adjusted gross margin improved 410 basis points sequentially to 37.7%. Adjusted EBITDA Improvement – Adjusted EBITDA excluding FX more than doubled sequentially to $2.7 million, or 5.4% of net sales, absorbing $1.3 million of currency losses, Interschutz costs and expedited freight. Fire Momentum – Fire revenue of $26.1 million, or 52% of net sales, up 2% year-over-year and 12% sequentially, with helmets up 41% and hoods up 66%. Tender Momentum – Notification of intended award under the U.K. National Firefighter PPE Framework, up to £220 million over seven years across all awarded suppliers, plus additional international Fire awards supporting visibility into fiscal 2028. Fire Service Platform Growth – Fire Service revenue increased 78%, with Independent Service Provider businesses contributing $3.5 million; accelerating investment, including potential new U.S. greenfield locations. Portfolio Simplification – Monterrey, Mexico lease matter settled with a $1.9 million gain; divestiture of the HPFR and HiViz product lines completed earlier in the year. Working Capital & Cash – Inventory reduced to $74.9 million, down $2.8 million sequentially and $15.3 million year-over-year; year-to-date operating cash flow of $5.4 million, a $15.1 million improvement, with cash of $17.9 million and total debt of $28.7 million. FY27 Outlook – Optimistic on Q3 and focused on positive cash flow from operations in fiscal 2027, with some Fire order timing shifting into Q4 and near-term impact from portfolio repositioning actions.

NASDAQ: LAKE www.lakeland.com Investor Relations Chris Tyson MZ Group 949-491-8235 LAKE@mzgroup.us Company 1525 Perimeter Parkway Suite 325 Huntsville, AL 35806
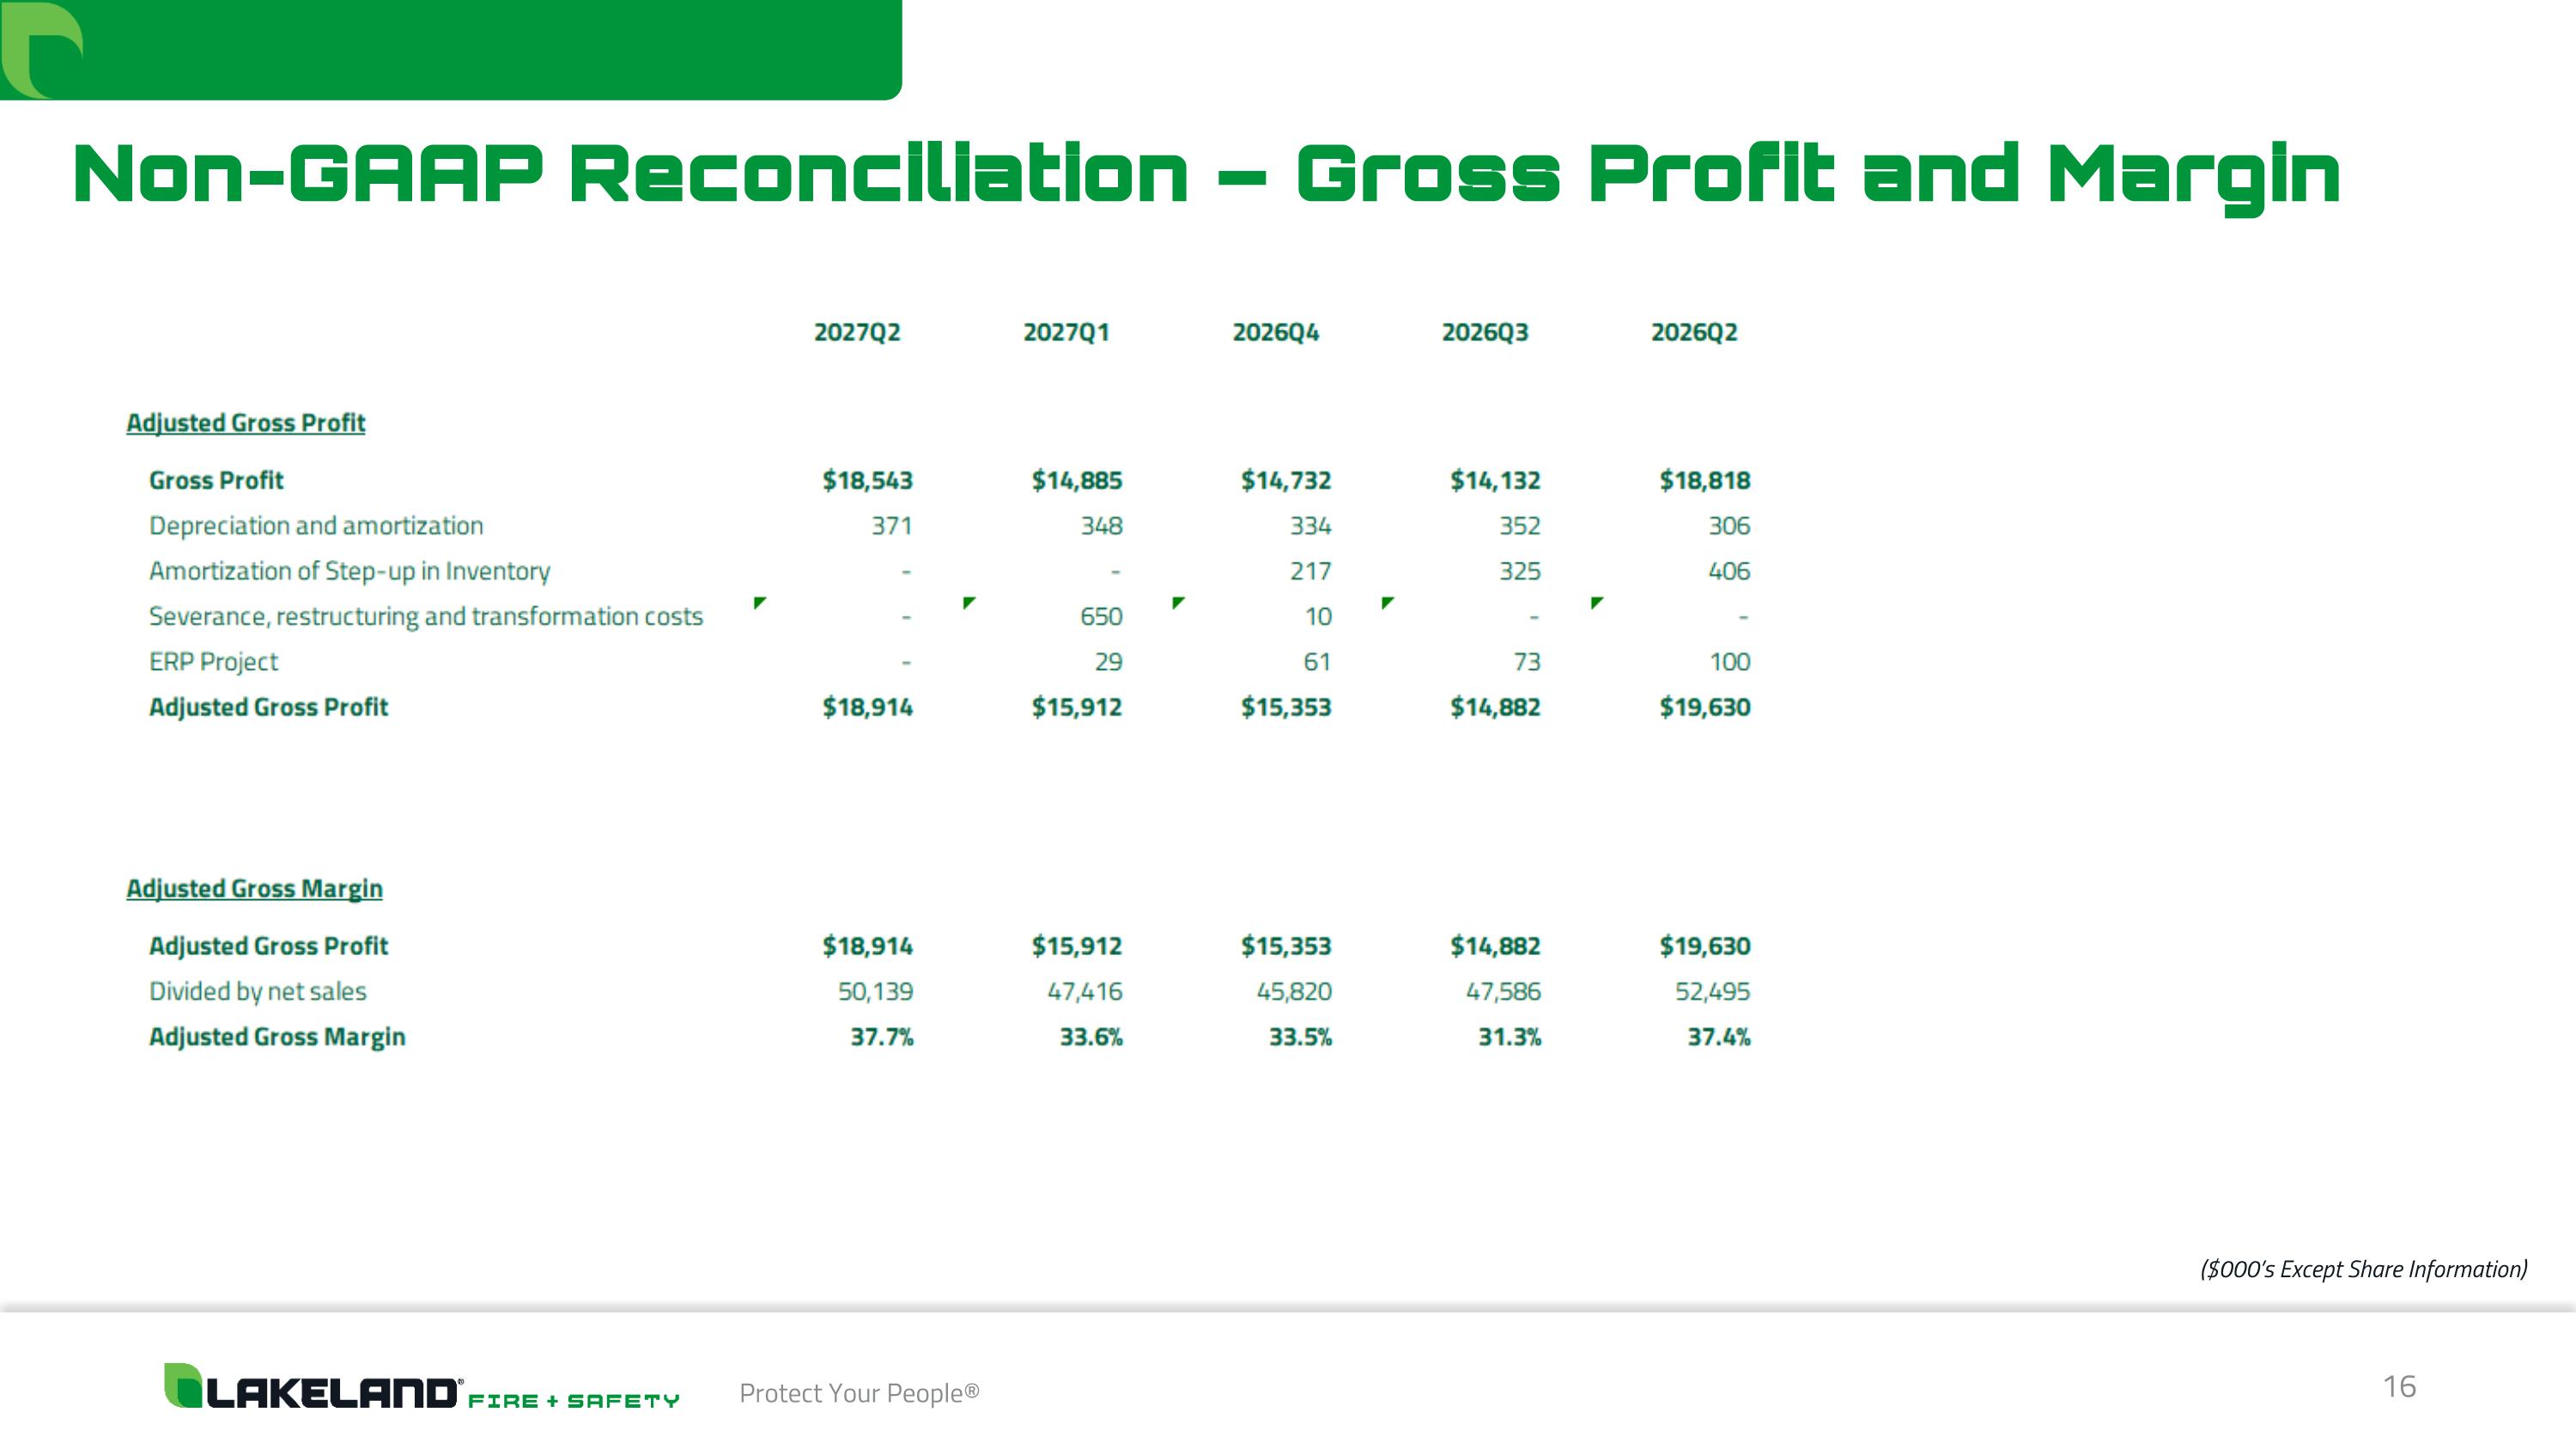
16 Protect Your People® Non-GAAP Reconciliation – Gross Profit and Margin ($000’s Except Share Information)
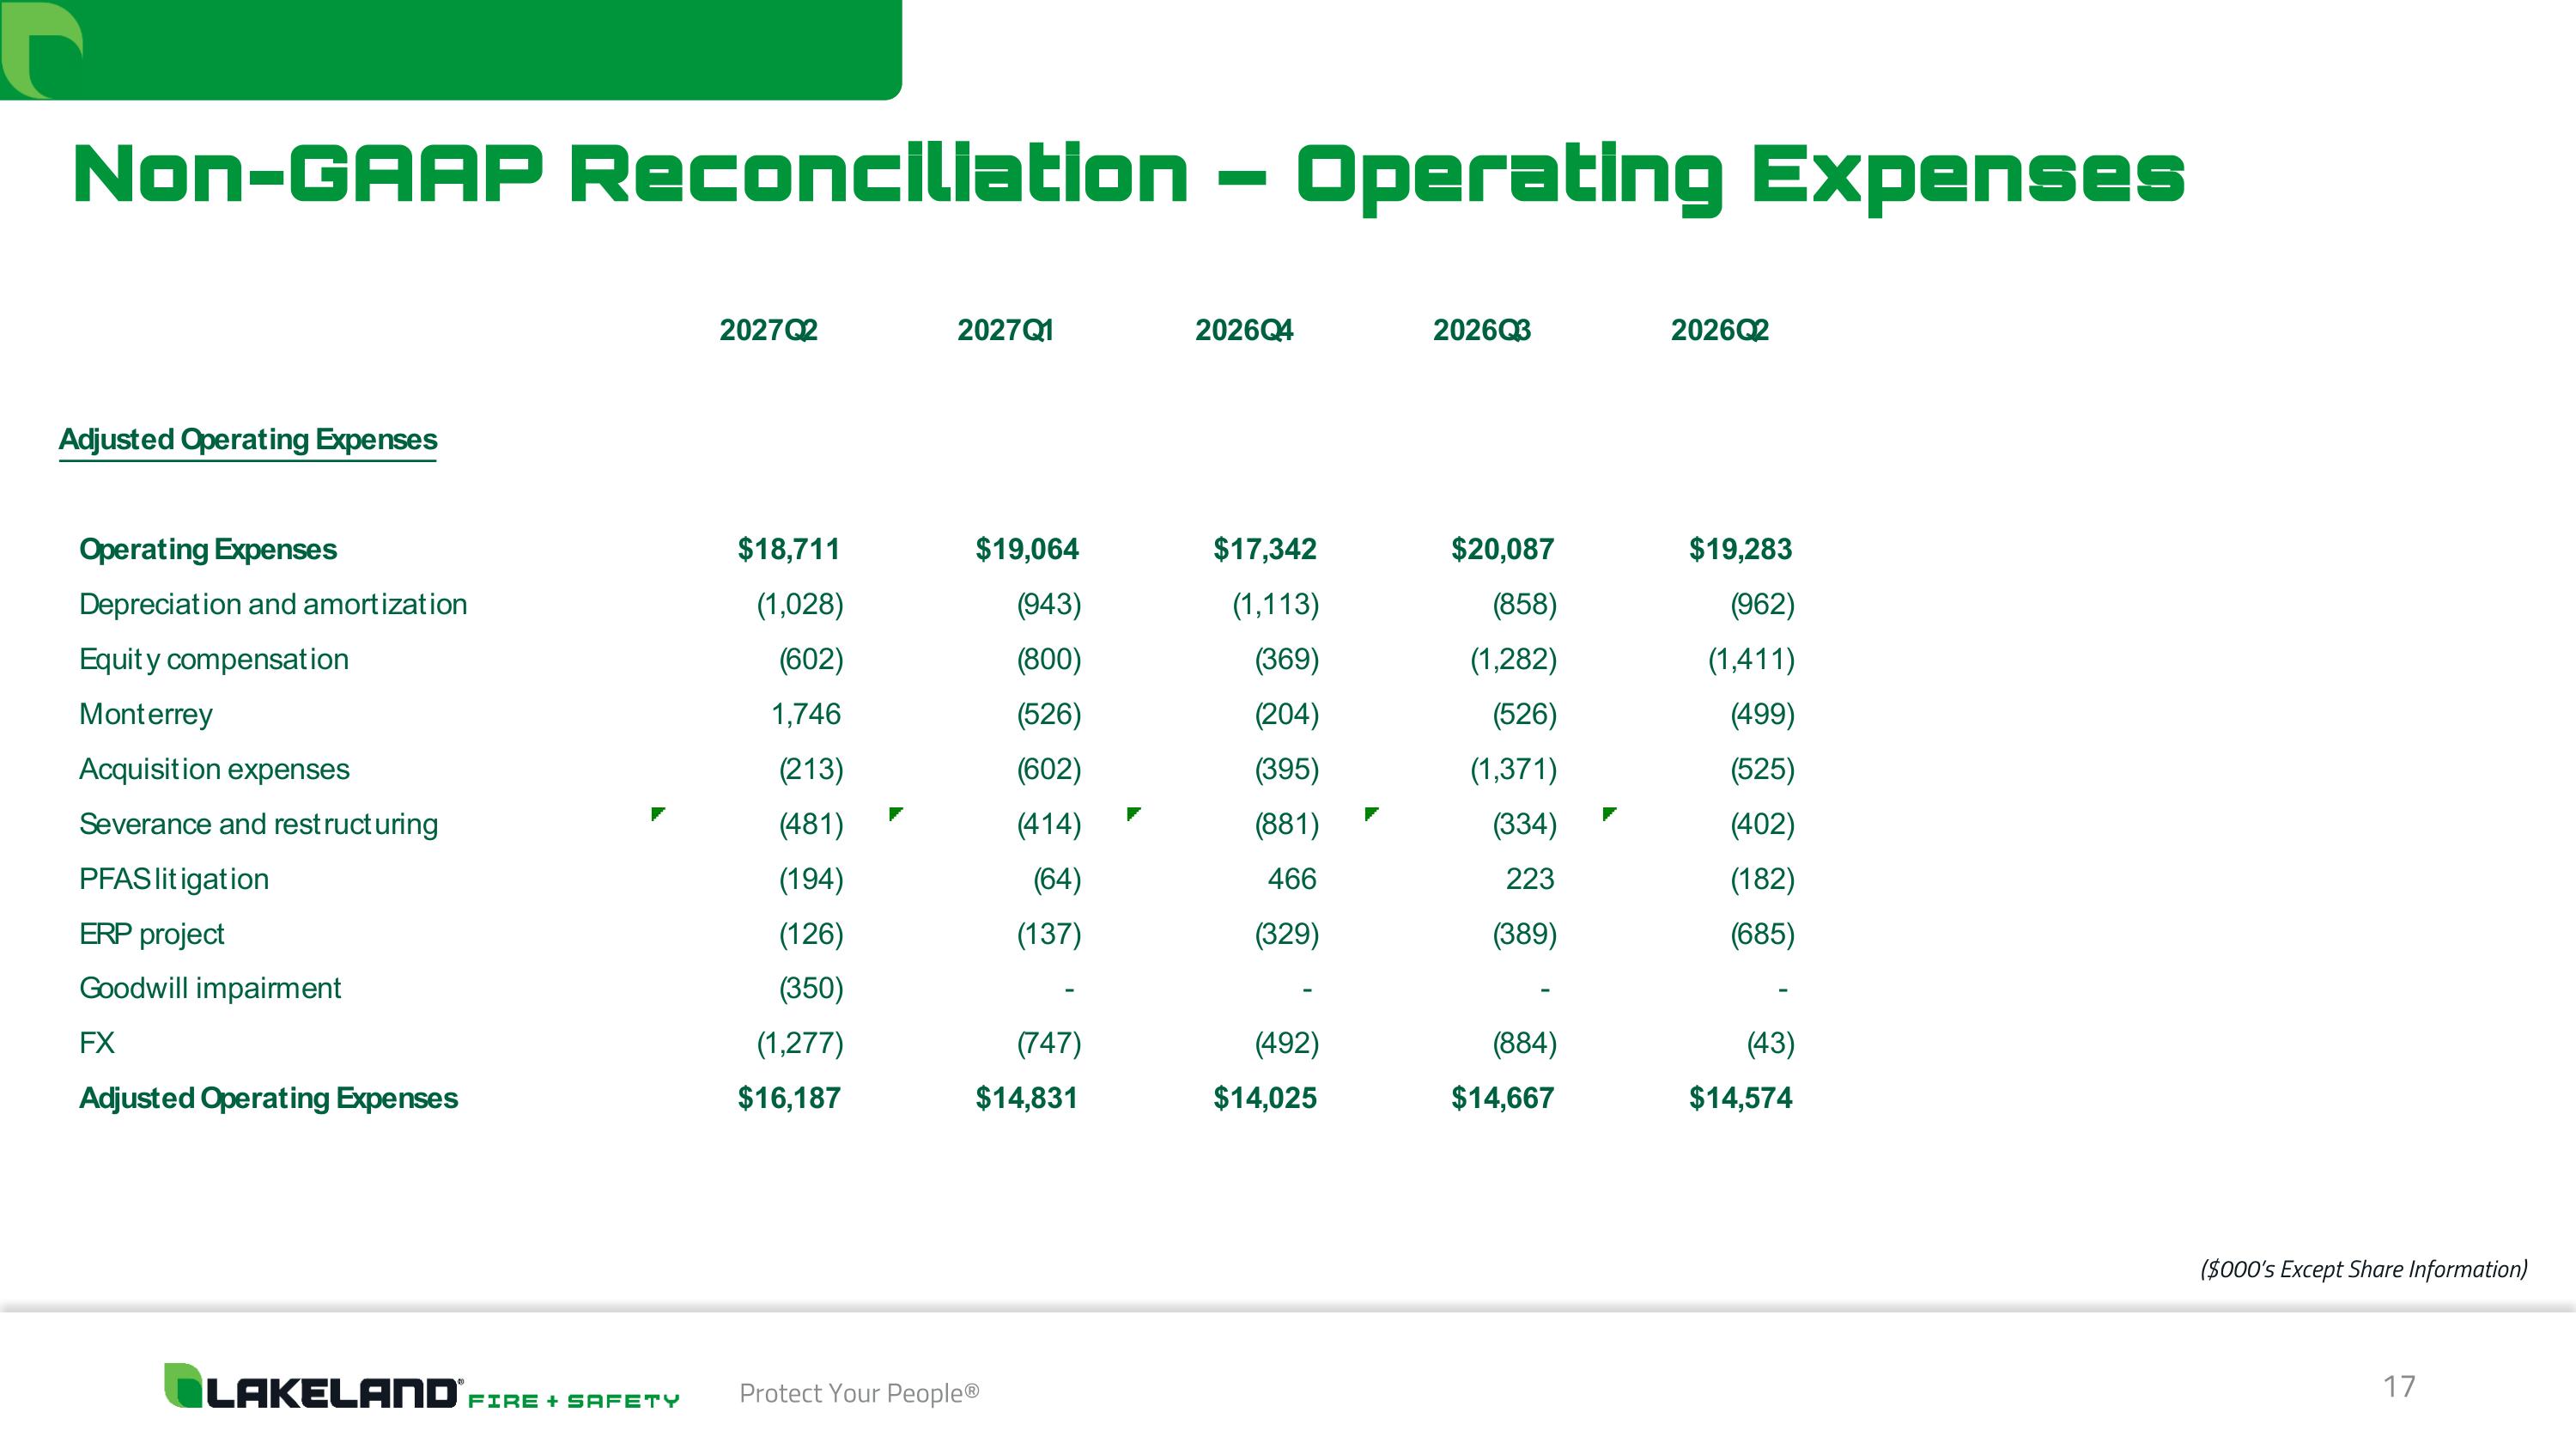
17 Protect Your People® Non-GAAP Reconciliation – Operating Expenses ($000’s Except Share Information)
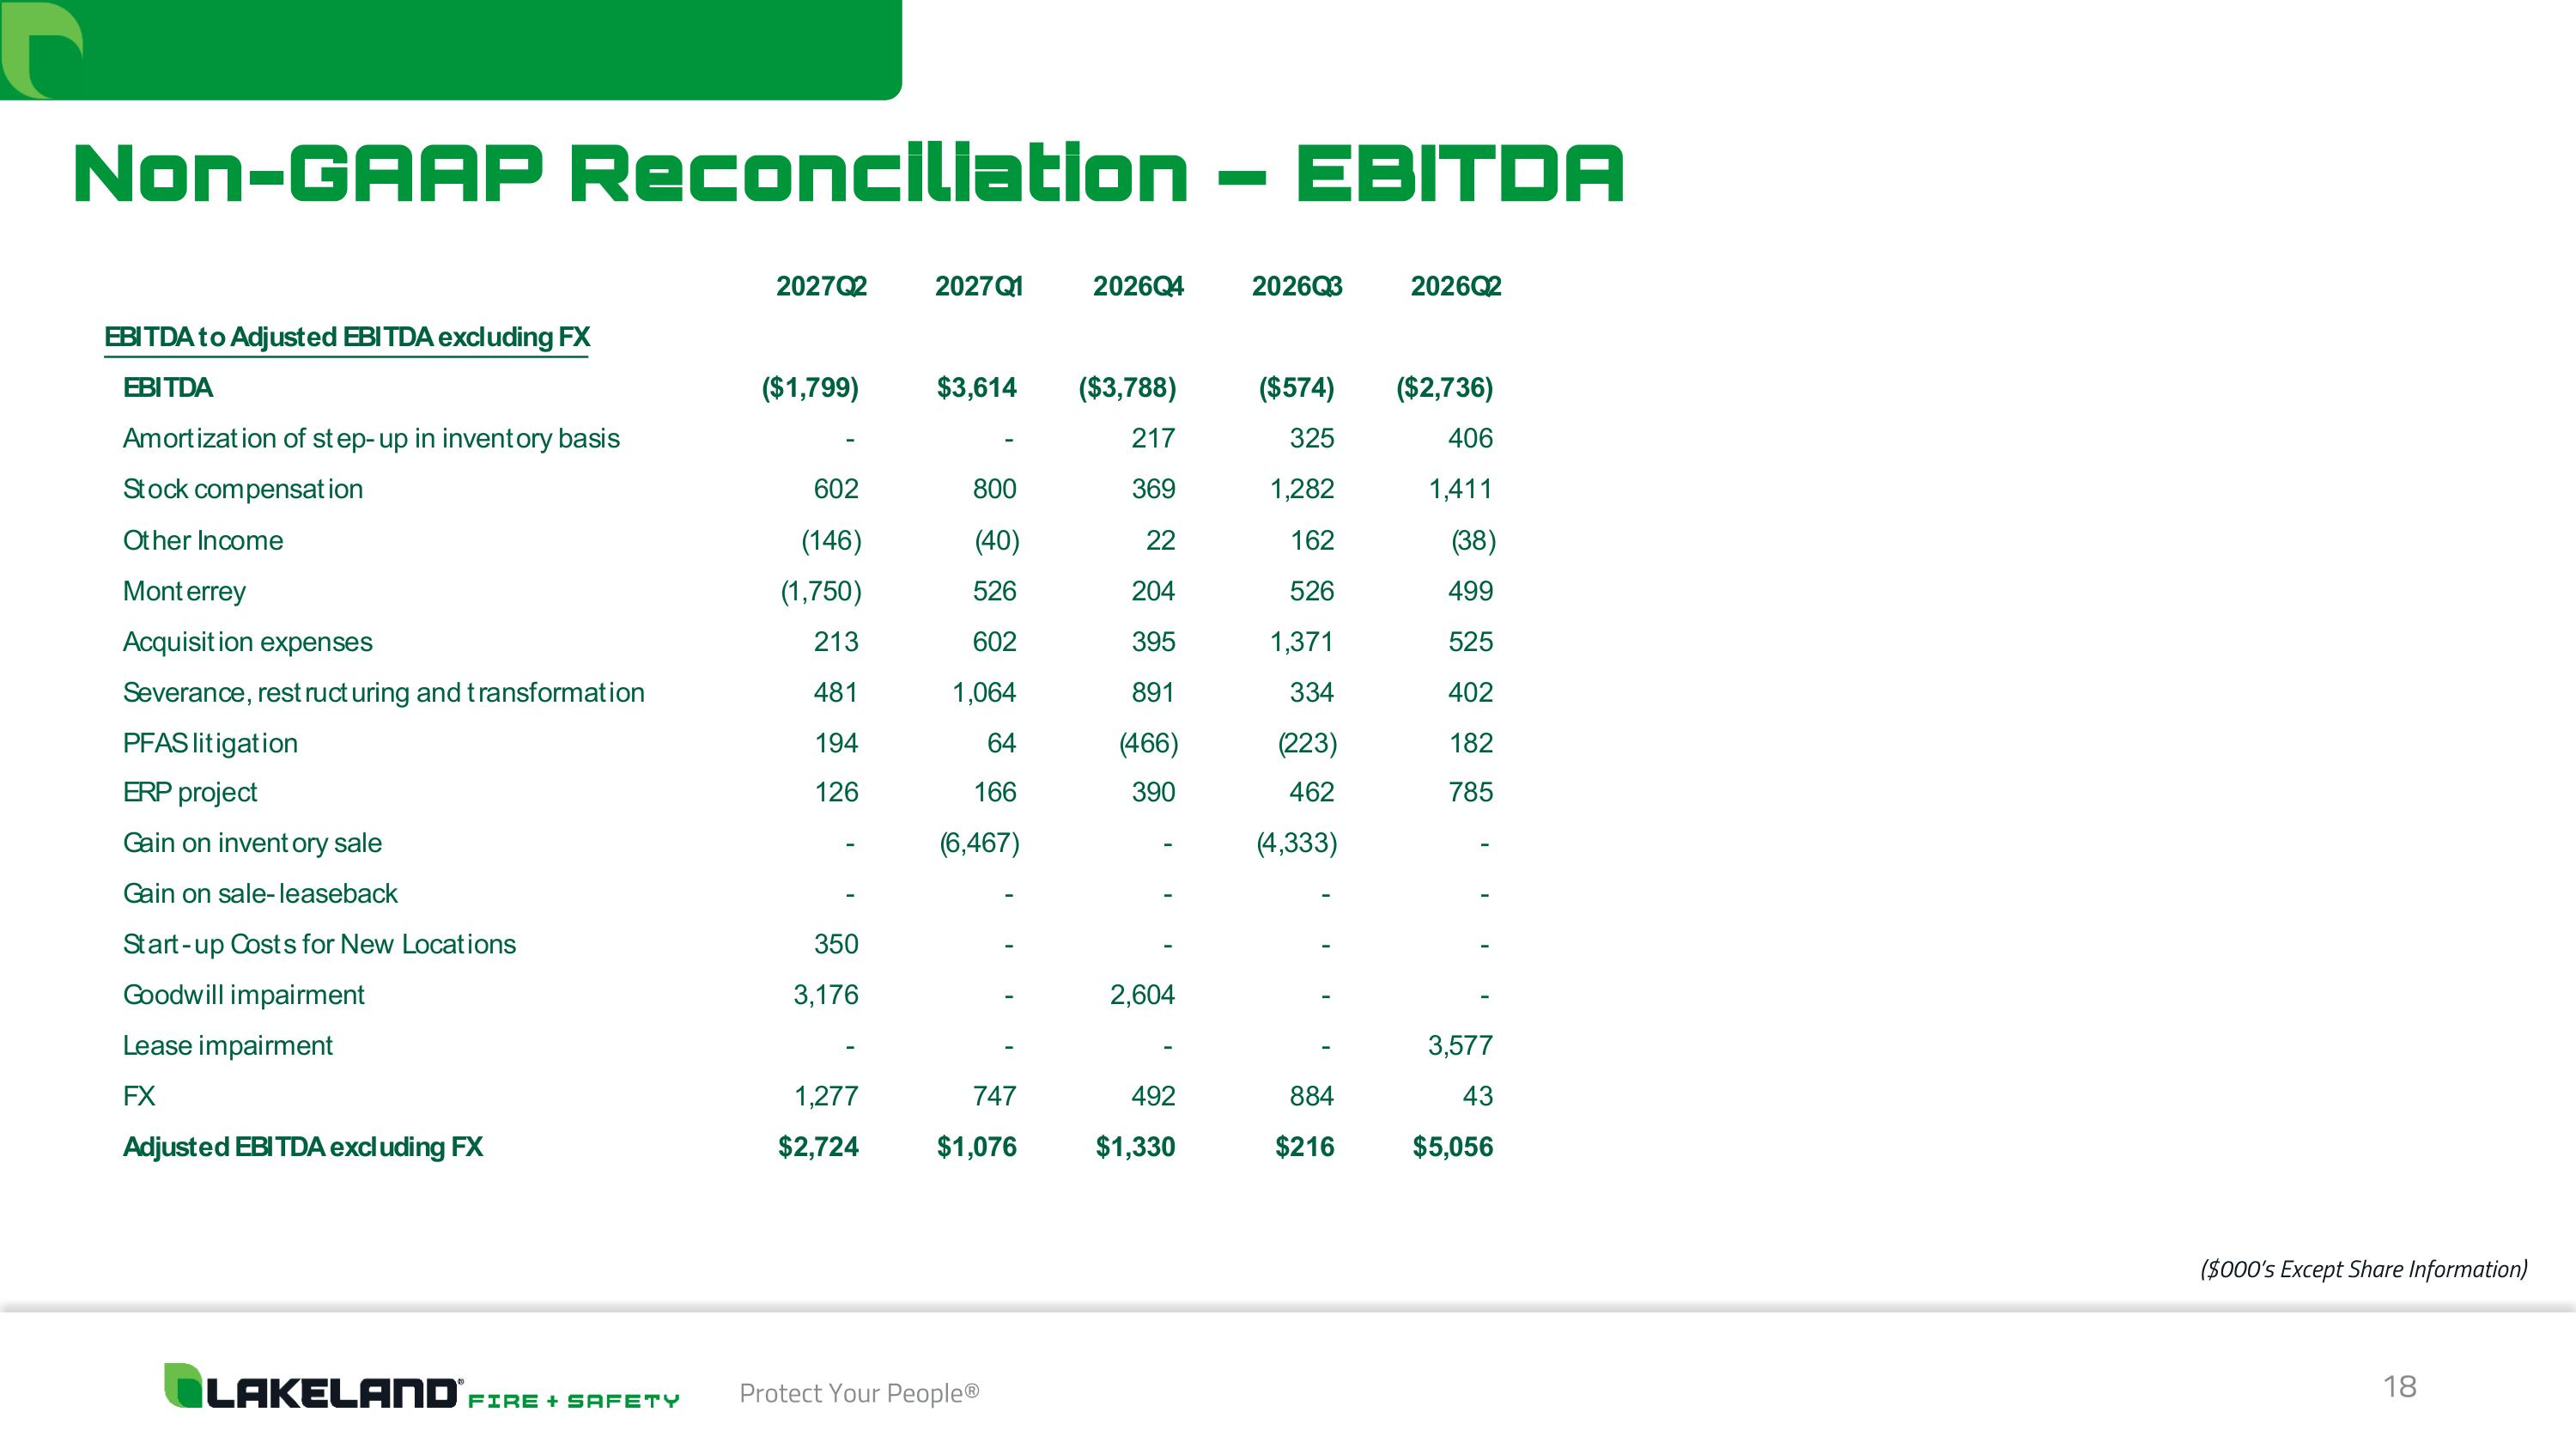
18 Protect Your People® Non-GAAP Reconciliation – EBITDA ($000’s Except Share Information)
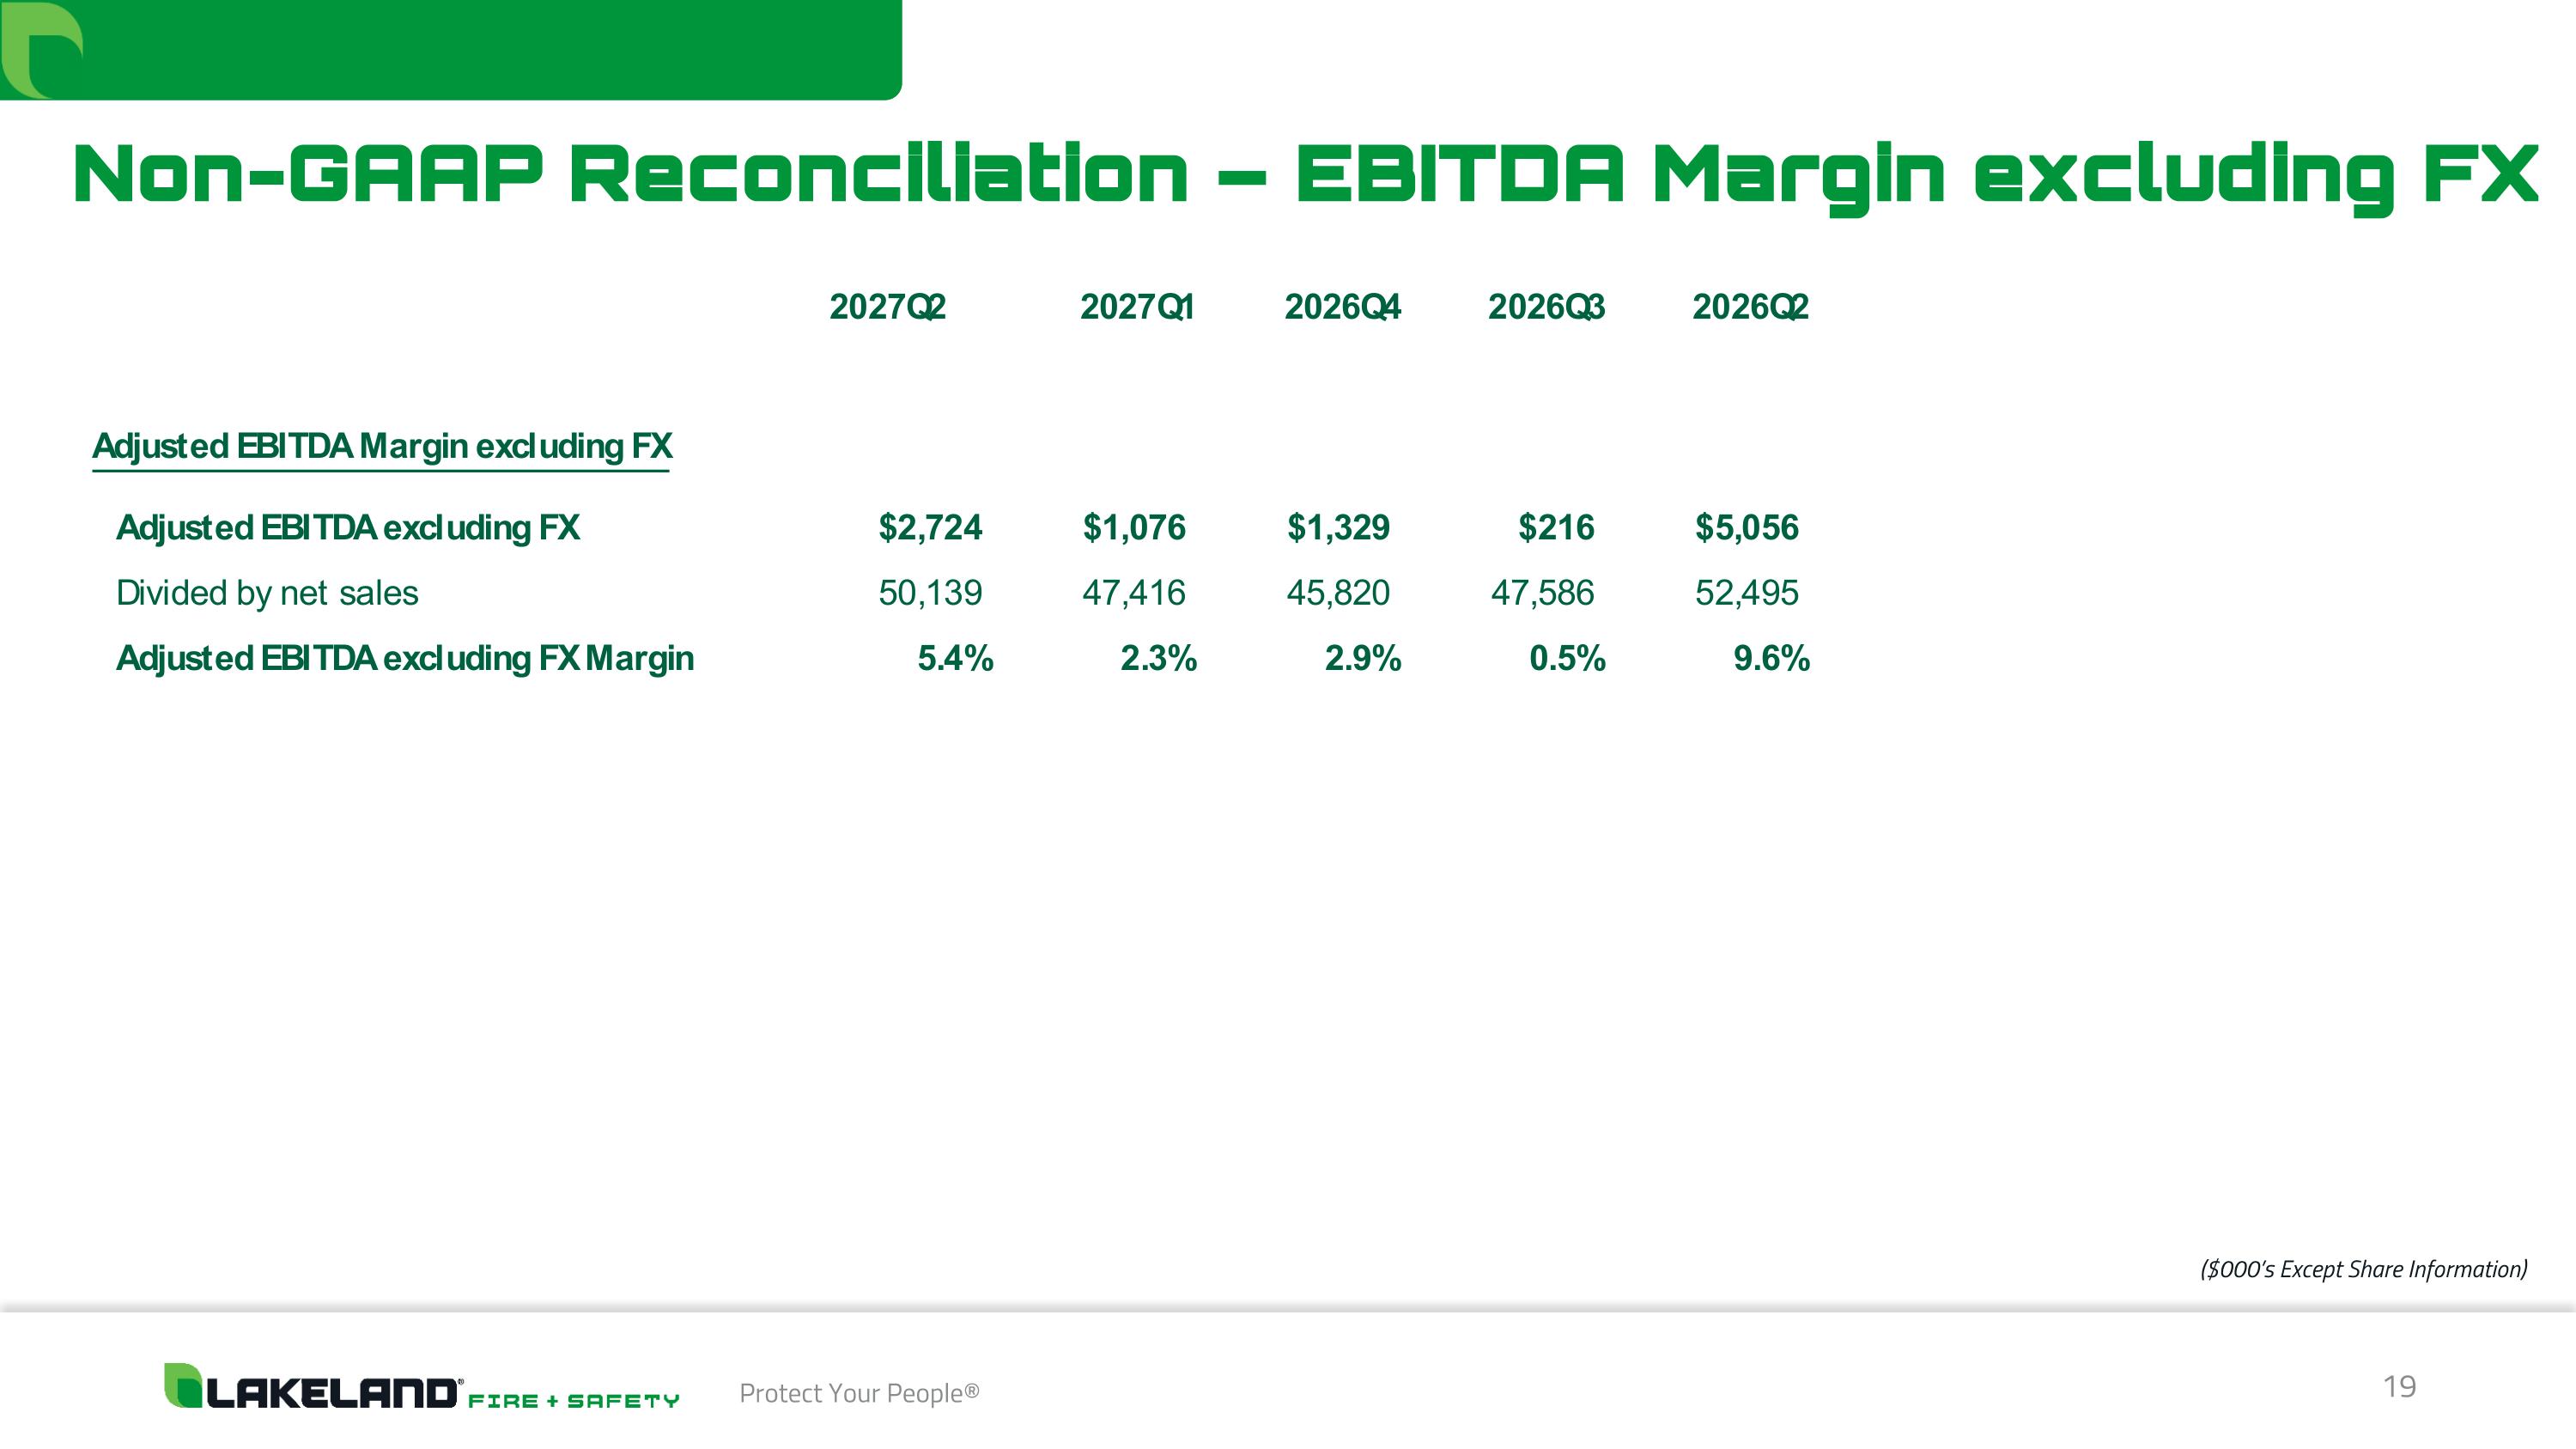
19 Protect Your People® Non-GAAP Reconciliation – EBITDA Margin excluding FX ($000’s Except Share Information)