
LAZRQ 8-K
Luminar Technologies, Inc./DE (LAZRQ)
8-K
2025-05-14
For: 2025-05-14
View Original
Added on
April 10, 2026
UNITED STATES
SECURITIES AND EXCHANGE COMMISSION
Washington, D.C. 20549
FORM 8-K
CURRENT REPORT
Pursuant to Section 13 or 15(d)
of the Securities Exchange Act of 1934
Date of Report (Date of earliest event reported): May 14, 2025
LUMINAR TECHNOLOGIES, INC.
(Exact name of registrant as specified in its charter)
| (State or other jurisdiction of incorporation) | (Commission File Number) | (IRS Employer Identification No.) | ||||||||||||
(Address of principal executive offices, including zip code)
Registrant’s telephone number, including area code: (800 ) 532-2417
N/A
(Former name or former address, if changed since last report.)
Check the appropriate box below if the Form 8-K filing is intended to simultaneously satisfy the filing obligation of the registrant under any of the following provisions:
| Written communications pursuant to Rule 425 under the Securities Act (17 CFR 230.425) | |||||
| Soliciting material pursuant to Rule 14a-12 under the Exchange Act (17 CFR 240.14a-12) | |||||
| Pre-commencement communications pursuant to Rule 14d-2(b) under the Exchange Act (17 CFR 240.14d-2(b)) | |||||
| Pre-commencement communications pursuant to Rule 13e-4(c) under the Exchange Act (17 CFR 240.13e-4(c)) | |||||
Securities registered pursuant to Section 12(b) of the Act:
| Title of each class | Trading symbol | Name of each exchange on which registered | ||||||||||||
Indicate by check mark whether the registrant is an emerging growth company as defined in Rule 405 of the Securities Act of 1933 (§230.405 of this chapter) or Rule 12b-2 of the Securities Exchange Act of 1934 (§240.12b-2 of this chapter).
Emerging growth company ☐
If an emerging growth company, indicate by check mark if the registrant has elected not to use the extended transition period for complying with any new or revised financial accounting standards provided pursuant to Section 13(a) of the Exchange Act. ☐
Item 2.02 Results of Operations and Financial Condition.
On May 14, 2025, Luminar Technologies, Inc. (the “Company”) announced its financial results for the first quarter ended March 31, 2025 by issuing a press release and a business update presentation. The full text of the press release and the business update presentation are furnished as Exhibit 99.1 and Exhibit 99.2 to this Current Report on Form 8-K.
The information in Item 2.02 of this Current Report on Form 8-K (including Exhibits 99.1 and 99.2 furnished herewith) shall not be deemed “filed” for purposes of Section 18 of the Securities Exchange Act of 1934, as amended, (the “Exchange Act”) or otherwise subject to the liabilities of that section, nor shall it be deemed incorporated by reference in any filing under the Securities Act of 1933, as amended, or the Exchange Act, except as expressly set forth by specific reference in such a filing.
Item 9.01 Financial Statements and Exhibits.
(d) Exhibits.
| Exhibit Number | Description | |||||||
| 99.1 | ||||||||
| 99.2 | ||||||||
| 104 | Cover page interactive data file formatted in Inline XBRL. | |||||||
SIGNATURES
Pursuant to the requirements of the Securities Exchange Act of 1934, the registrant has duly caused this report to be signed on its behalf by the undersigned hereunto duly authorized.
| Luminar Technologies, Inc. | ||||||||
| Date: May 14, 2025 | By: | /s/ Thomas J. Fennimore | ||||||
| Name: | Thomas J. Fennimore | |||||||
| Title: | Chief Financial Officer | |||||||
Exhibit 99.1
Luminar Shares New Operating Plan & Reports Strong Q1’25 Financials
Unified Product Architecture Creates New Global LiDAR Standard with Top OEMs & Streamlines Business
Production LiDAR Shipments Up 50% QoQ; Continued OpEx Improvement QoQ
Orlando, Fla. — May 14, 2025 — Today, Luminar (NASDAQ: LAZR), a leading global automotive technology company, shared an updated strategic plan for its business and reported financial results for the first quarter of 2025. Details of this business update were published in a Presentation available on its Investor Relations website at
https://investors.luminartech.com.
New Operating Plan Enabled by Unified Product Architecture
Luminar has collaborated with multiple leading global OEMs including to develop a collective industry standard for LiDAR, which will cover all use cases from advanced safety through full autonomy, eliminating the need to develop custom products for each OEM or vehicle line. Luminar Halo is designed to uniquely meet and exceed these standards, which also enables streamlining of Luminar to its core LiDAR business. This is another step by the company to drive down cost substantially, with quarterly non-GAAP OpEx expected to be reduced by approximately half by the end of FY’25 versus the beginning of FY’24.
“In a world of macro uncertainty and adversity, we’re firing on all cylinders to ramp up production, ramp down costs, and capitalize on the future, as evidenced by our announcements today,” said Austin Russell, Founder & CEO. “This kicks off our new operating plan for Luminar with a unified product platform, enabling radical focus and streamlining of the business, as well as unlocking value throughout our organization.”
2025 Overall Company-Level Business Milestones:
Luminar provided a status update on the following business milestones to be achieved by year-end 2025.
1.Series Production: Ramp series production volume at least 3x year-over-year; Drive economies of scale; Launch additional vehicle models.
•On track. Luminar shipped ~6k LiDARs in Q1’25, up approximately 50% from ~4k in Q4’24, driven entirely by an increase in automotive series production sensor sales. This brings the cumulative production shipments to ~14k.
2.Next-Generation Technology: Progress on Luminar Halo milestones in OEM development contracts.
•On track. Luminar is successfully executing development on its Halo LiDAR product and advancing its work against its OEM contracts.
3.Business Model: Streamline Luminar’s operations with customer transitions to a singular technology platform to drive efficient execution, reduced costs, and accelerated path to profitability.
•On track. Today, Luminar announced an updated strategic plan for the company, enabled by a unified product platform developed in collaboration with key OEMs. This drives focused and efficient execution, substantially reduced costs, and accelerated path to profitability. Further, the company outlined its vision for the business beyond Luminar Halo, expanding its use of partners from manufacturing and industrialization to include certain development and testing efforts, and returning to its roots as a cutting-edge technology innovation powerhouse.
Webcast Details:
Luminar will host a video webcast:
•What: Video webcast featuring first quarter 2025 financials, business update, and live Q&A
•Date: Today, May 14, 2025
•Time: 6:00 p.m. EDT (3:00 p.m. PDT)
•Where: https://www.luminartech.com/quarterlyreview
A replay will be available following the conclusion of the webcast. For additional information or to be added to Luminar's investor distribution list, please visit us at https://investors.luminartech.com/ir-resources/email-alerts.
Contact Information
Investor Relations:
Aileen (Smith) McAdams
Media Relations:
Milin Mehta
Notice of Late Filing
The Company expects to file a notification of late filing on Form 12b-25 with the SEC, which will provide an automatic 5-day extension of the filing deadline for its Quarterly Report on Form 10-Q for the quarterly period
1
ended March 31, 2025 (the “Quarterly Report”), to May 20, 2025. The Company expects to file the Quarterly Report as soon as practicable within the 5-day extension period.
Forward-Looking Statements
This press release contains forward-looking statements within the meaning of the Private Securities Litigation Reform Act of 1995. Forward-looking statements generally are accompanied by words such as “aims,” “believe,” “may,” “will,” “estimate,” “set,” “continue,” “towards,” “anticipate,” “intend,” “expect,” “should,” “would,” “forward,” and similar expressions that predict or indicate future events or trends or that are not statements of historical matters. The forward-looking statements include statements relating to the outlook and business milestone achievements for 2025 and expectations regarding the development, performance and commercialization of Luminar Halo. Forward-looking statements are based on expectations and assumptions by our management and involve a number of risks, uncertainties, and other factors that could cause actual results to differ materially from those stated, including that next-generation sensors and software will be developed successfully or will accelerate automaker adoption, that new automaker agreements will develop successfully into product launches, that per unit sensor economics will be improved, and that cost reduction efforts will continue to result in improved operational and financial efficiency and eventual profitability. More information on these risks and other potential factors that could affect the Company’s business is included in the Company’s periodic filings with the SEC, including in the “Risk Factors” and “Management’s Discussion and Analysis of Financial Condition and Results of Operations” sections of the Company’s reports on Form 10-K and Form 10-Q, including the Company’s Annual Report on Form 10-K for the year ended December 31, 2024 and subsequent reports filed with the SEC. The Company assumes no obligation to update any forward-looking statements, which speak only as of the date they are made.
About Luminar
Luminar is a global automotive technology company ushering in a new era of vehicle safety and autonomy. For the past decade, Luminar has built an advanced hardware and software/AI platform to enable its various partners, ranging from Volvo Cars and Mercedes-Benz to NVIDIA and Mobileye, to develop and deploy the world's most advanced passenger vehicles. Following the launch of the Volvo EX90 as the first global production vehicle to standardize its technology, Luminar is poised to lead the industry in enabling next-generation safety and autonomous capabilities for global production vehicles. For more information please visit www.luminartech.com.
2

Operating Plan, Go-Forward Strategy & Q1’25 Business Update May 14, 2025
Forward-looking statements This presentation of Luminar Technologies, Inc. (“Luminar” or the “company”) includes “forward-looking statements” within the meaning of the “safe harbor” provisions of the U.S. Private securities litigation reform act of 1995. Forward-looking statements may be identified by the use of words such as “future,” “growth,” “opportunity,” "will," “well-positioned,” "forecast," "intend," "seek," "target," “anticipate,” “believe,” “expect,” “estimate,” “plan,” “outlook,” and “project” and other similar expressions that predict or indicate future events or trends or that are not statements of historical matters. These forward- looking statements include, but are not limited to, statements regarding whether next generation sensors and software will be developed successfully or will accelerate automaker adoption, whether new automaker agreements will develop successfully into product launches, whether cost reduction efforts will continue to result in improved operational and financial efficiency, including projected free cash flow generation, expected achievement and timing of manufacturing scale up, OEM production readiness, next-gen LiDAR prototype development, continued software and AI development and performance, program milestones, expected milestones, market size estimates, product efficacy, near-term priorities, including plans to ramp production and ramp down costs, operating expenses and cost of sales, and the financial and business milestone guidance for fiscal 2025. These statements are based on various assumptions, whether or not identified in this presentation, and on the current expectations of Luminar’s management and are not guarantees of actual performance. You are cautioned not to place undue reliance upon any forward-looking statements, including the projections, which speak only as of the date made. Luminar does not undertake any commitment to update or revise the forward-looking statements, whether as a result of new information, future events or otherwise. Accordingly, forward-looking statements, including any projections or analysis, should not be viewed as factual and should not be relied upon as an accurate prediction of future results. The forward-looking statements contained in this presentation are based on the company’s current expectations and beliefs concerning future developments and their potential effects on Luminar. These forward-looking statements involve a number of risks, uncertainties (some of which are beyond our control), or other assumptions that may cause actual results or performance to be materially different from those expressed or implied by these forward-looking statements. Forward-looking statements are subject to a number of risks and uncertainties that could cause actual results to differ materially from the forward-looking statements, including the risks discussed in the “Risk Factors,” and “Management’s Discussion and Analysis of Financial Condition and Results of Operations” sections of Luminar’s most recently filed periodic reports on Form 10-K and Form 10-Q, including Luminar's Annual Report on Form 10-K for the year ended December 31, 2024, and other documents Luminar files with the SEC in the future, including its Quarterly Report on Form 10-Q for the quarter ended March 31, 2025. Should one or more of these risks or uncertainties materialize, or should any of management’s assumptions prove incorrect, actual results may vary in material respects from those projected in these forward- looking statements. Luminar does not undertake any obligation to update or revise any forward-looking statements, whether as a result of new information, future events or otherwise, except as may be required under applicable securities laws. Accordingly, you should not put undue reliance on these statements. Trademarks and trade names Luminar owns or has rights to various trademarks, service marks and trade names that it uses in connection with the operation of its business. This presentation also contains trademarks, service marks and trade names of third parties, which are the property of their respective owners. The use or display of third parties’ trademarks, service marks, trade names or products in this presentation is not intended in, and does not imply, a relationship with Luminar, or an endorsement or sponsorship by or of Luminar. Solely for convenience, the trademarks, service marks and trade names referred to in this presentation may appear without the ®, TM or SM symbols, but such references are not intended to indicate, in any way, that Luminar will not assert, to the fullest extent under applicable law, its rights or the right of the applicable licensor in these trademarks, service marks and trade names. Industry and market data In this presentation, Luminar relies on and refers to information and statistics regarding the sectors in which Luminar competes and other industry data. Luminar obtained this information and statistics from third-party sources, including reports by market research firms. Although Luminar believes these sources are reliable, the company has not independently verified the information and does not guarantee its accuracy and completeness. Luminar has supplemented this information where necessary with information from discussions with Luminar customers and Luminar’s own internal estimates, taking into account publicly available information about other industry participants and Luminar’s management’s best view as to information that is not publicly available. Notice of late filing Luminar expects to file a notification of late filing on Form 12b-25 with the SEC, which will provide an automatic 5-day extension of the filing deadline for its Quarterly Report on Form 10-Q for the quarterly period ended March 31, 2025 (the “Quarterly Report”), to May 20, 2025. Luminar expects to file the Quarterly Report as soon as practicable within the 5-day extension period. Disclaimer & Cautionary Note © 2025 Luminar Technologies, Inc. All rights reserved. | 2
Use of Non-GAAP financial measures The financial information and data contained in this presentation is unaudited and does not conform to regulation S-X promulgated under the securities act of 1933, as amended. Accordingly, such information and data may not be included in, may be adjusted in or may be presented differently in, any filing Luminar makes with the SEC. Luminar has not filed its Form 10-Q for the quarter ended March 31, 2025. As a result, all financial results described in this presentation should be considered preliminary and are subject to change to reflect any necessary adjustments or changes in accounting estimates that are identified prior to the time that Luminar files its Form 10-K. In addition to disclosing financial measures prepared in accordance with U.S. generally accepted accounting principles (GAAP), this presentation contains certain non-GAAP financial measures and certain other metrics. Non-GAAP financial measures and these other metrics do not have any standardized meaning and are therefore unlikely to be comparable to similarly titled measures and metrics presented by other companies. Luminar considers these non-GAAP financial measures and metrics to be important because they provide useful measures of the operating performance of the Company, exclusive of factors that do not directly affect what we consider to be our core operating performance, as well as unusual events. The Company’s management uses these measures and metrics to (i) illustrate underlying trends in the Company’s business that could otherwise be masked by the effect of income or expenses that are excluded from non-GAAP measures, and (ii) establish budgets and operational goals for managing the Company’s business and evaluating its performance. In addition, investors often use similar measures to evaluate the operating performance of a company. Non-GAAP financial measures and metrics are presented only as supplemental information for purposes of understanding the Company’s operating results. The non-GAAP financial measures and metrics should not be considered a substitute for financial information presented in accordance with GAAP. This presentation includes non-GAAP financial measures, including non-GAAP cost of sales, gross loss/gross profit, operating expenses, net loss, and Free Cash Flow. Non-GAAP cost of sales is defined as GAAP cost of sales adjusted for stock-based compensation expense and amortization of intangible assets. Non-GAAP gross loss/gross profit is defined as GAAP gross loss/gross profit adjusted for stock-based compensation expense and amortization of intangible assets. Non-GAAP operating expenses is defined as GAAP operating expenses adjusted for stock-based compensation expense, amortization of intangible assets, impairment of goodwill and intangible assets, and transaction costs relating to acquisition activities. Non-GAAP net loss is defined as GAAP net loss adjusted for stock-based compensation expense, amortization of intangible assets, accelerated depreciation related to certain property, plant, and equipment items, impairment of goodwill and intangible assets, gain on extinguishment of debt, impairment of investments, restructuring costs, gain from certain acquisitions, transaction costs relating to acquisition activities, change in fair value of embedded derivative, and change in fair value of warrant liabilities. Free Cash Flow is defined as operating cash flow less capital expenditures. Footnotes 1 Product development savings: Measured as expected future multi-year budget to develop Luminar Halo with current customer plans versus equivalent prior spending over product life for Iris & Iris+ programs; Savings to compound with each additional customer aligning to unified product platform rather than requiring product customization through development 2 Time to market: Measured as timeframe from finalized concept to production validation and/or measured as time from finalized prototype to series production 3 Cost savings: Referencing cost savings achieved with 2024 Restructuring Plan actions implemented May 2024, specifically reduction in workforce of redundant roles within Luminar as a result of expanded TPK partnership 4 BOM reduction: Measured as estimated Bill of Materials (BOM) cost for Iris as of May 2025 at current volume levels versus estimate for Luminar Halo at product maturity 5 Software: Various Luminar software capabilities are still in development and have not achieved “technology feasibility” or “production ready” status. 6 Non-GAAP metrics: Please refer to Reconciliation of GAAP to Non-GAAP financial measures on slides 26-28. 7 Cash & Liquidity: Includes Cash, cash equivalents, and marketable securities, as well as applicable lines of credit and other facilities. 8 Free Cash Flow: Free cash flow is a non-GAAP measure and is defined as Operating cash flow less Capital expenditures. 9 Change in Cash: Refers to change in cash, cash equivalents, and marketable securities, and excludes incremental liquidity from undrawn line of credit. Disclaimer & Cautionary Note © 2025 Luminar Technologies, Inc. All rights reserved. | 3
Operating Plan & Go-Forward Strategy © 2025 Luminar Technologies, Inc. All rights reserved. | 4
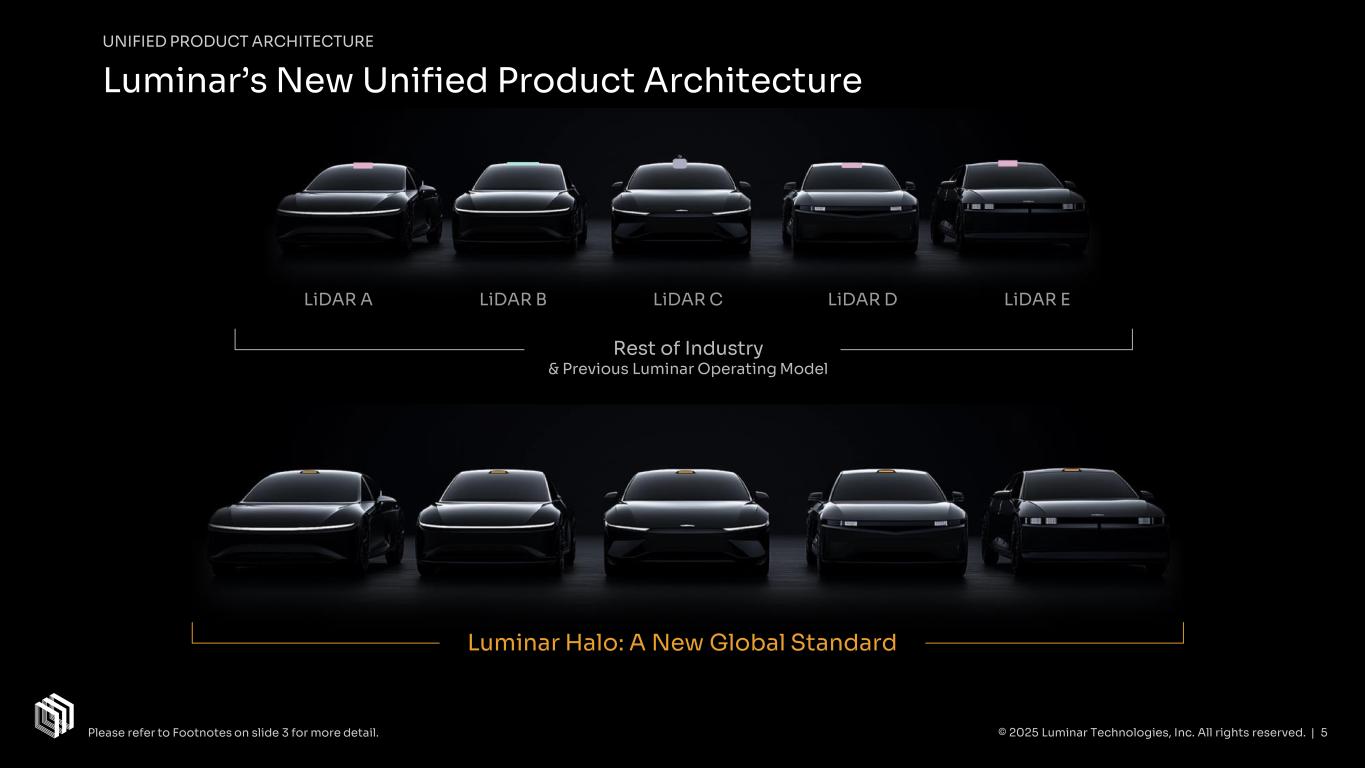
© 2025 Luminar Technologies, Inc. All rights reserved. | 5 LiDAR A LiDAR B LiDAR C LiDAR D LiDAR E Luminar Halo: A New Global Standard Rest of Industry & Previous Luminar Operating Model Luminar’s New Unified Product Architecture UNIFIED PRODUCT ARCHITECTURE Please refer to Footnotes on slide 3 for more detail.
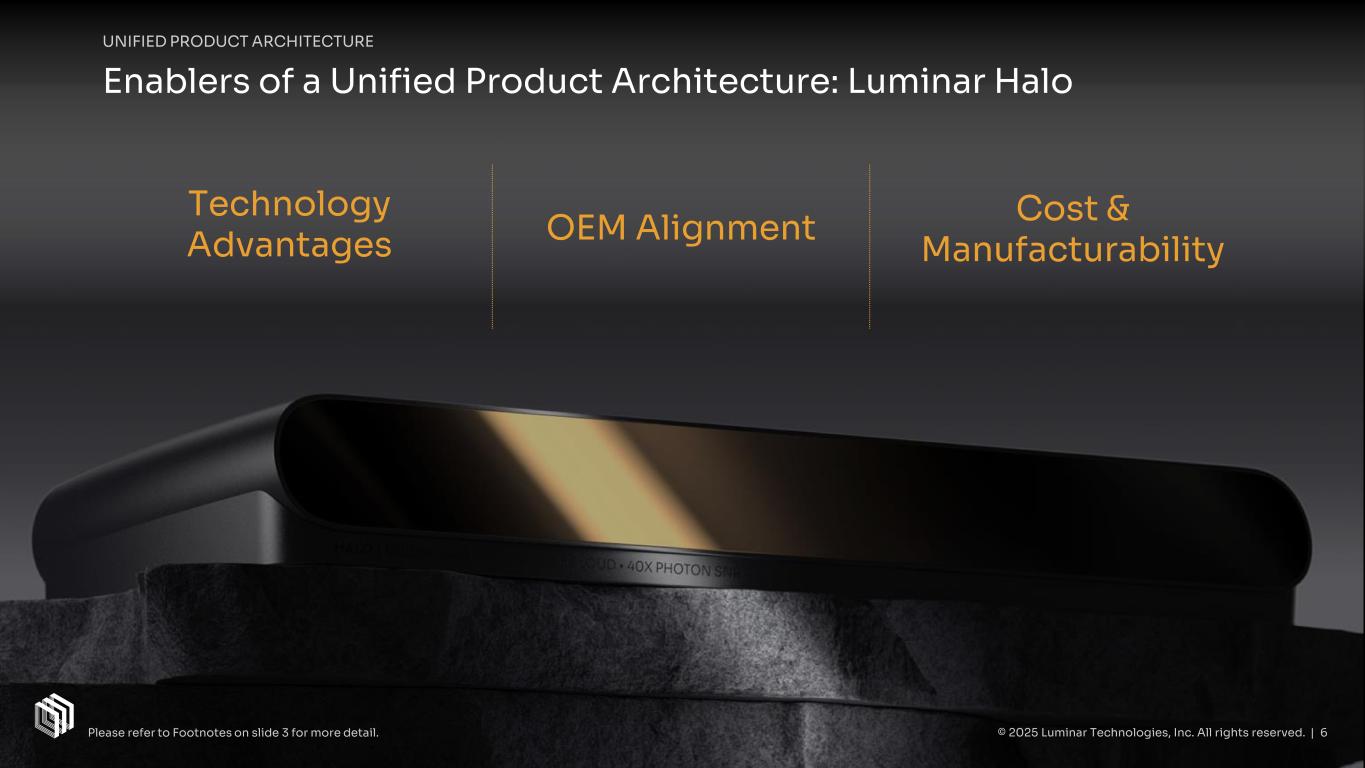
© 2025 Luminar Technologies, Inc. All rights reserved. | 6 UNIFIED PRODUCT ARCHITECTURE Enablers of a Unified Product Architecture: Luminar Halo Cost & Manufacturability OEM Alignment Technology Advantages Please refer to Footnotes on slide 3 for more detail.
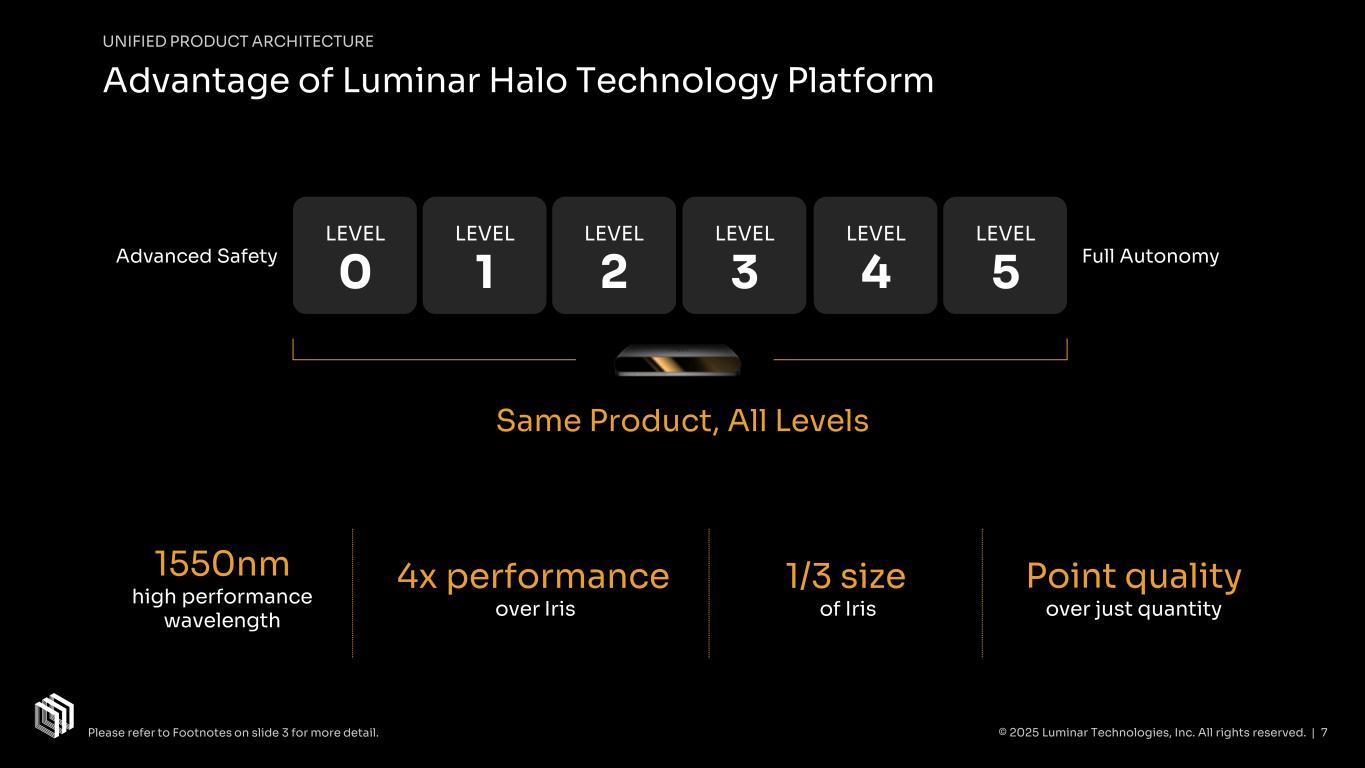
© 2025 Luminar Technologies, Inc. All rights reserved. | 7 UNIFIED PRODUCT ARCHITECTURE Advantage of Luminar Halo Technology Platform 1550nm high performance wavelength 4x performance over Iris Point quality over just quantity LEVEL 0 LEVEL 1 LEVEL 2 LEVEL 4 LEVEL 5 LEVEL 3Advanced Safety Full Autonomy Same Product, All Levels 1/3 size of Iris Please refer to Footnotes on slide 3 for more detail.
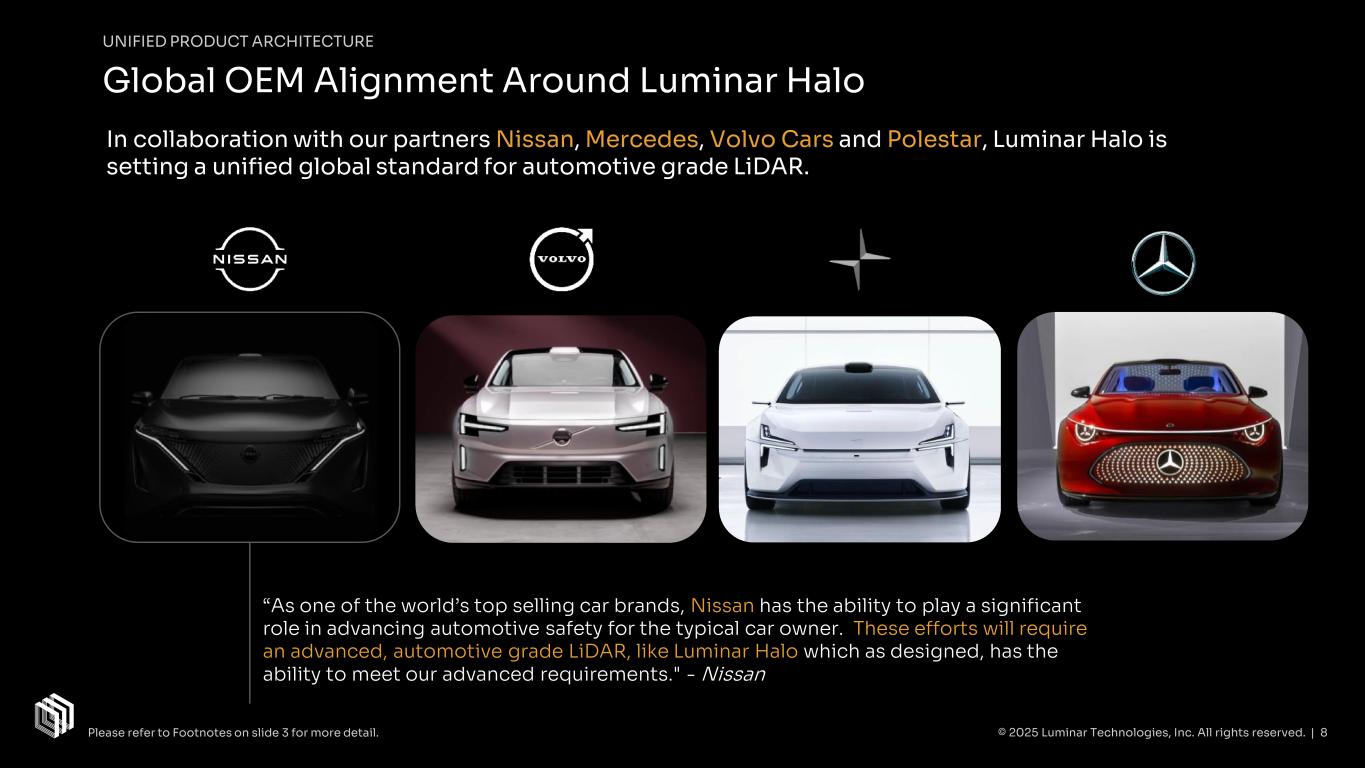
© 2025 Luminar Technologies, Inc. All rights reserved. | 8 UNIFIED PRODUCT ARCHITECTURE Global OEM Alignment Around Luminar Halo In collaboration with our partners Nissan, Mercedes, Volvo Cars and Polestar, Luminar Halo is setting a unified global standard for automotive grade LiDAR. “As one of the world’s top selling car brands, Nissan has the ability to play a significant role in advancing automotive safety for the typical car owner. These efforts will require an advanced, automotive grade LiDAR, like Luminar Halo which as designed, has the ability to meet our advanced requirements." - Nissan Please refer to Footnotes on slide 3 for more detail.
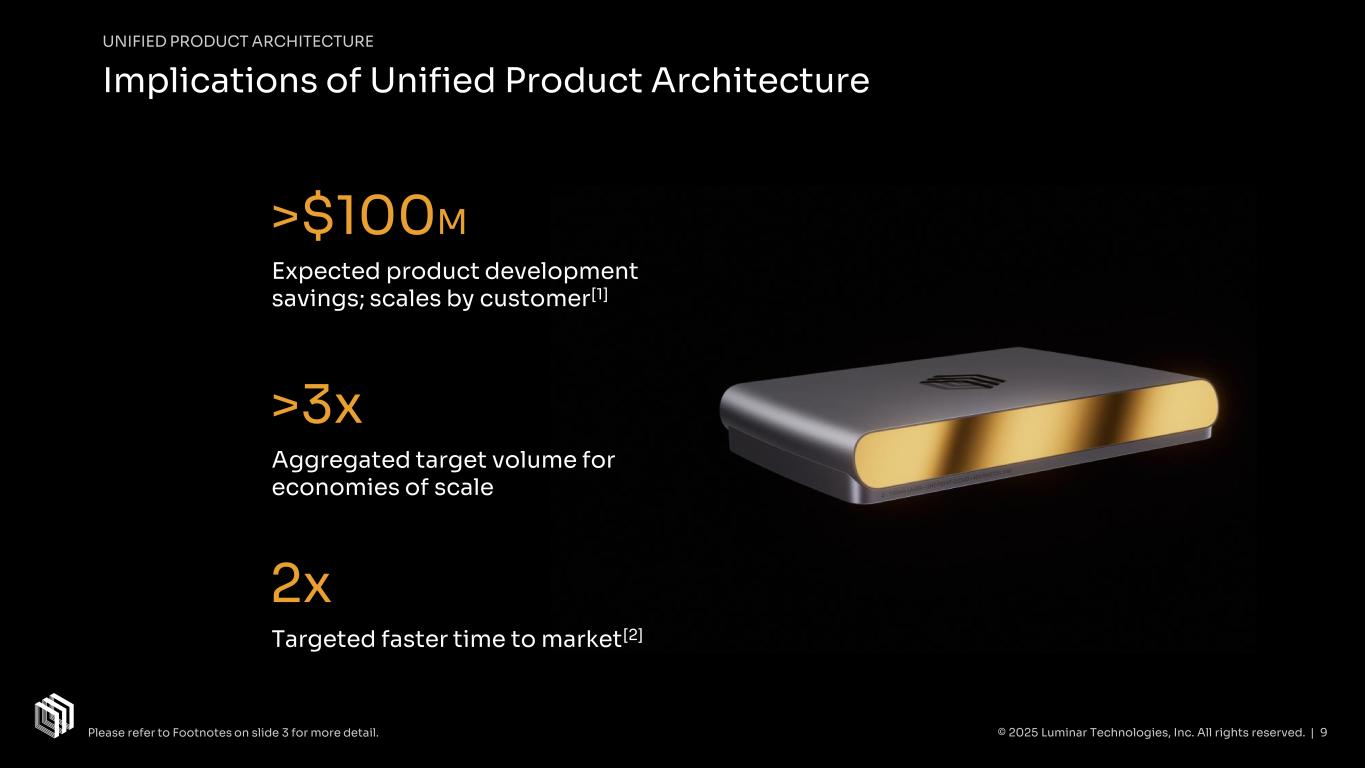
© 2025 Luminar Technologies, Inc. All rights reserved. | 9 UNIFIED PRODUCT ARCHITECTURE Implications of Unified Product Architecture >$100M Expected product development savings; scales by customer[1] Please refer to Footnotes on slide 3 for more detail. >3x Aggregated target volume for economies of scale 2x Targeted faster time to market[2]
Operating Model Beyond Luminar Halo © 2025 Luminar Technologies, Inc. All rights reserved. | 10Please refer to Footnotes on slide 3 for more detail.
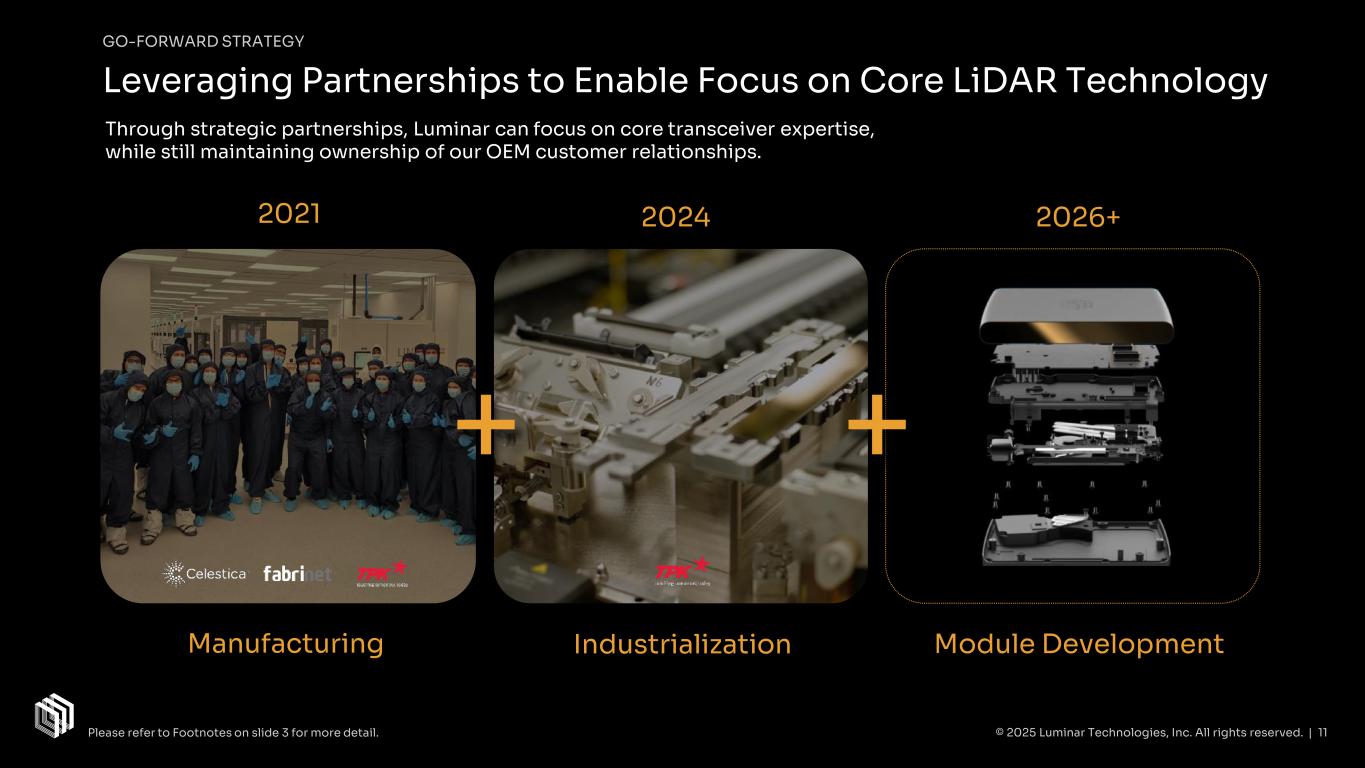
Module DevelopmentManufacturing Industrialization © 2025 Luminar Technologies, Inc. All rights reserved. | 11 GO-FORWARD STRATEGY Leveraging Partnerships to Enable Focus on Core LiDAR Technology + 2021 2024 2026+ Through strategic partnerships, Luminar can focus on core transceiver expertise, while still maintaining ownership of our OEM customer relationships. + Please refer to Footnotes on slide 3 for more detail.
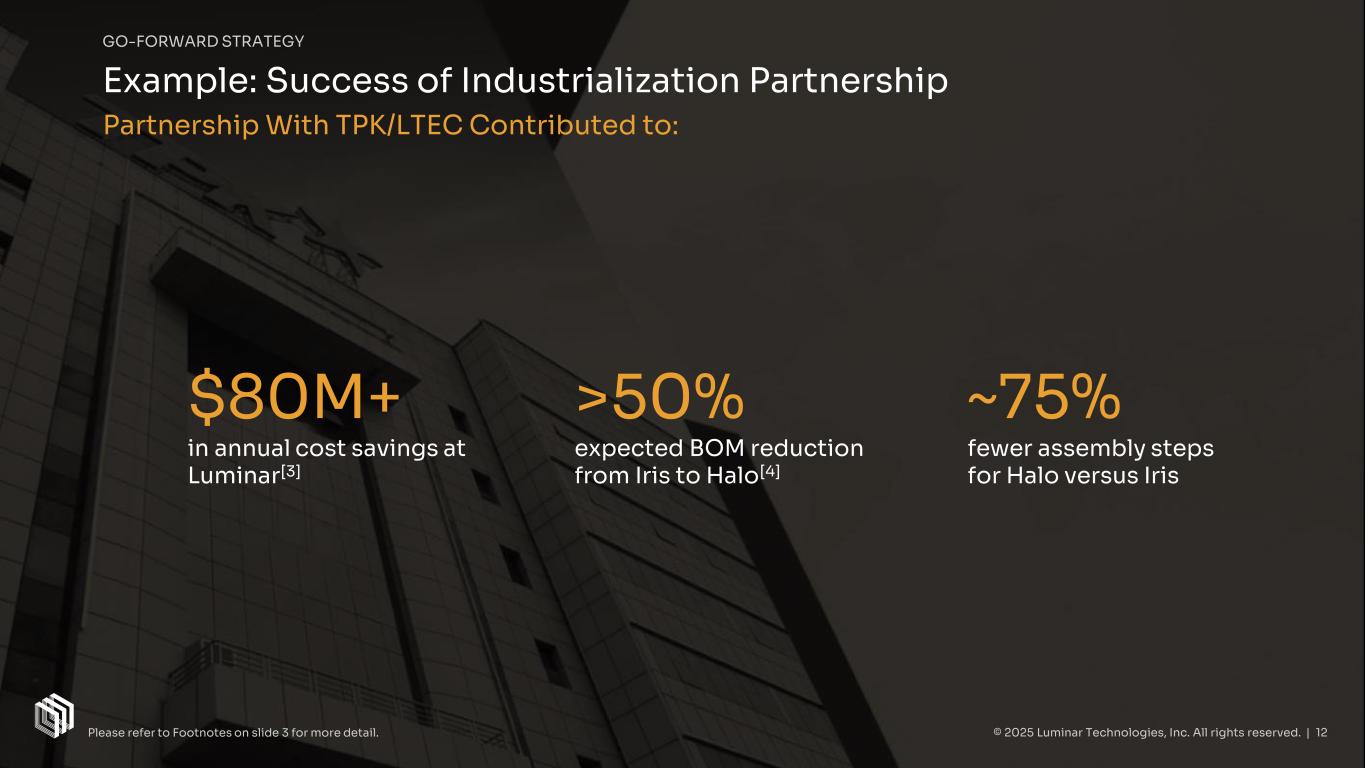
© 2025 Luminar Technologies, Inc. All rights reserved. | 12 GO-FORWARD STRATEGY Example: Success of Industrialization Partnership Partnership With TPK/LTEC Contributed to: $80M+ in annual cost savings at Luminar[3] >50% expected BOM reduction from Iris to Halo[4] ~75% fewer assembly steps for Halo versus Iris Please refer to Footnotes on slide 3 for more detail.
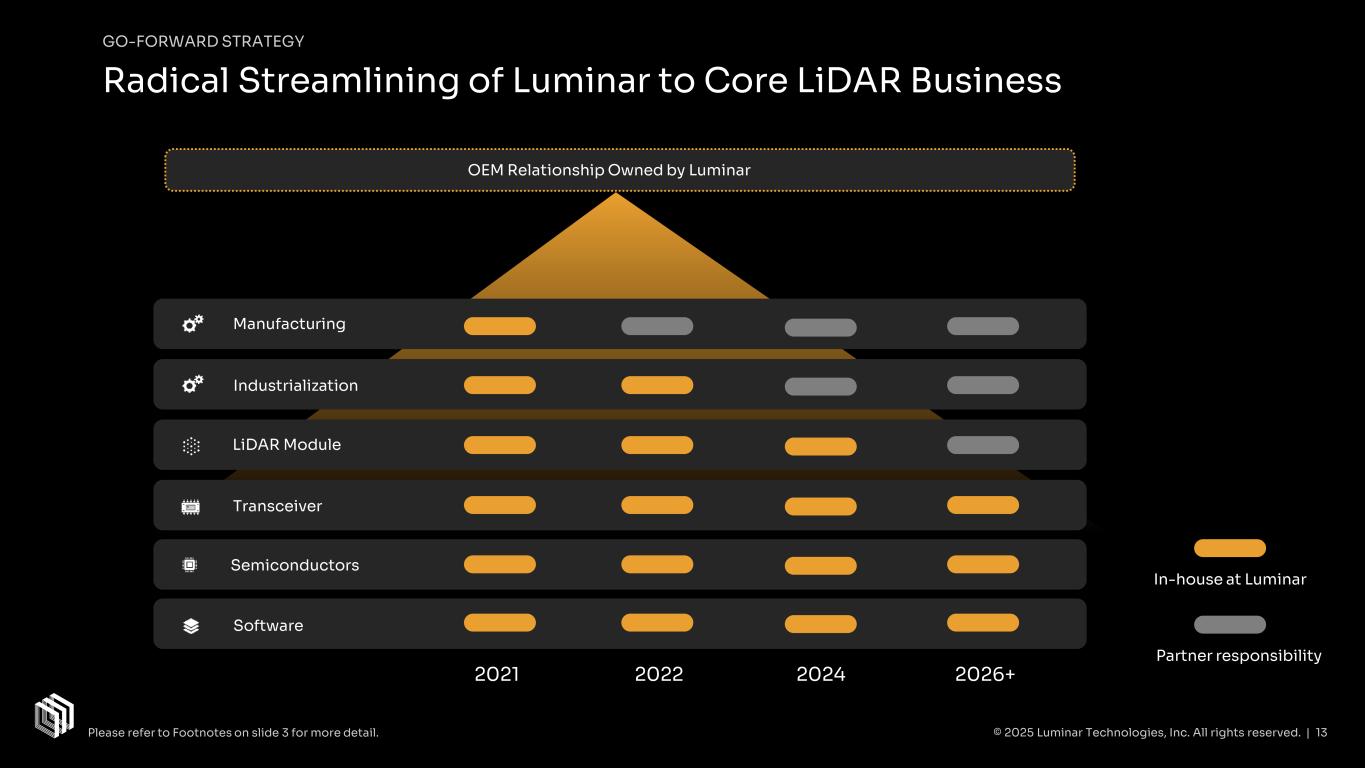
GO-FORWARD STRATEGY © 2025 Luminar Technologies, Inc. All rights reserved. | 13 Transceiver LiDAR Module Semiconductors (Receiver, Laser, Digital ASIC) Industrialization Software Manufacturing 2022 2024 2026+2021 Semiconductors OEM Relationship Owned by Luminar Radical Streamlining of Luminar to Core LiDAR Business In-house at Luminar Partner responsibility Please refer to Footnotes on slide 3 for more detail.
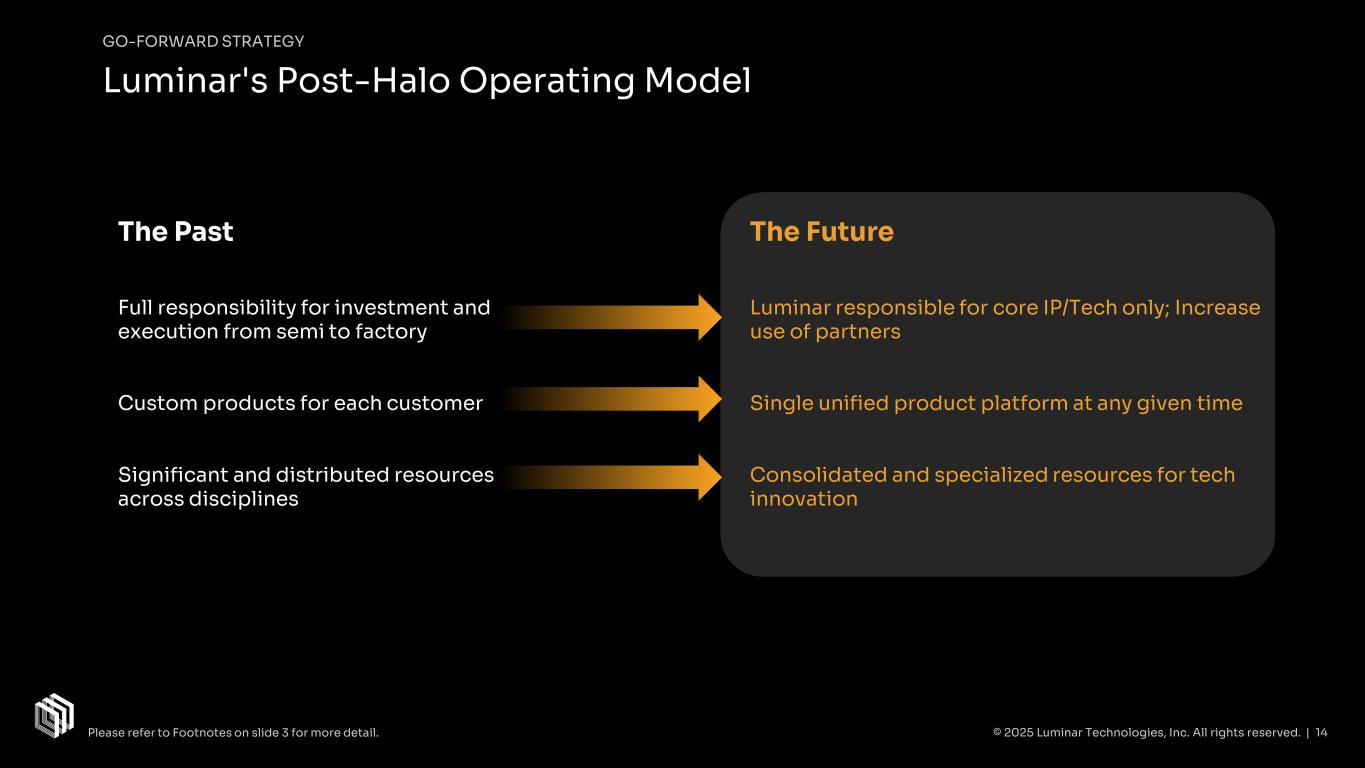
The Future Luminar responsible for core IP/Tech only; Increase use of partners Single unified product platform at any given time Consolidated and specialized resources for tech innovation The Past Full responsibility for investment and execution from semi to factory Custom products for each customer Significant and distributed resources across disciplines © 2025 Luminar Technologies, Inc. All rights reserved. | 14 GO-FORWARD STRATEGY Luminar's Post-Halo Operating Model Please refer to Footnotes on slide 3 for more detail.

Creating advanced LiDAR and software[5] to enable the world’s safest and smartest vehicles. © 2025 Luminar Technologies, Inc. All rights reserved. | 15Please refer to Footnotes on slide 3 for more detail.

Financials & Guidance © 2025 Luminar Technologies, Inc. All rights reserved. | 16
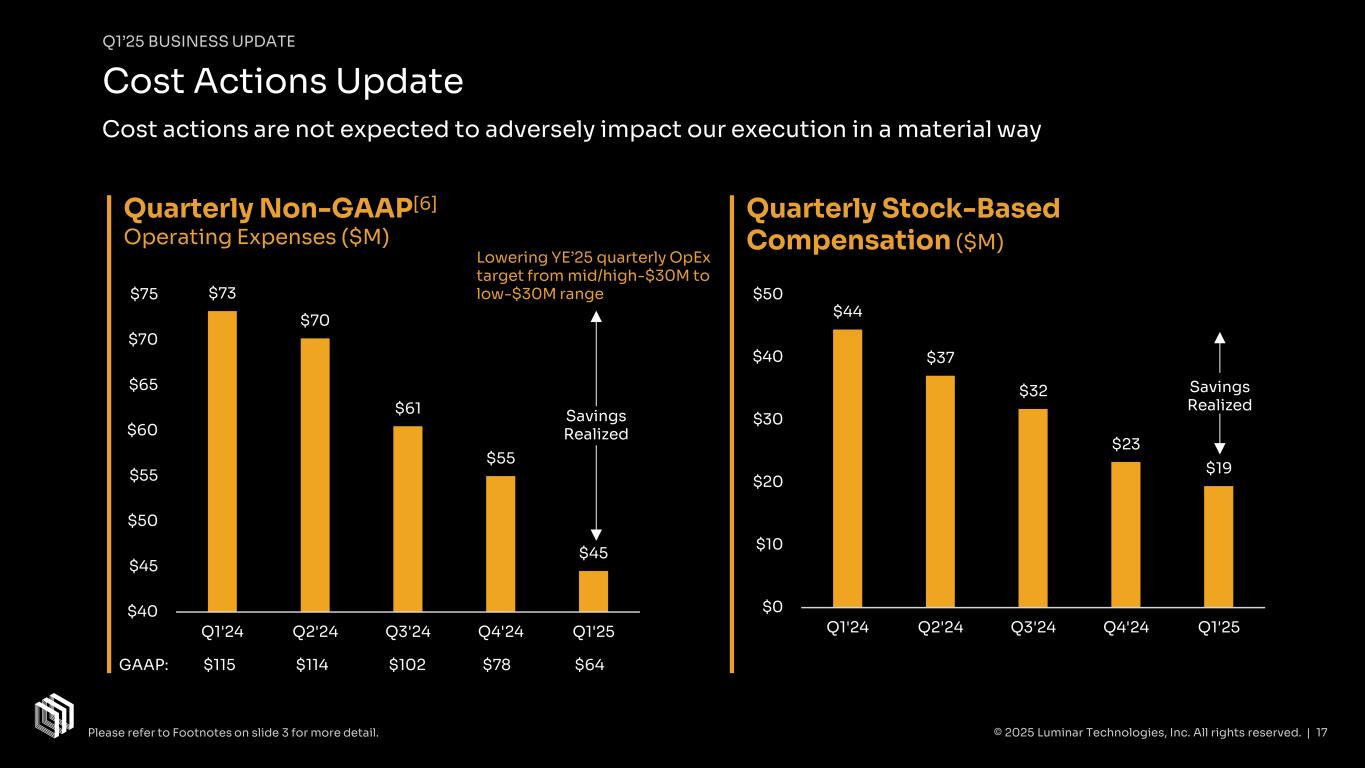
$44 $37 $32 $23 $19 $0 $10 $20 $30 $40 $50 Q1'24 Q2'24 Q3'24 Q4'24 Q1'25 $73 $70 $61 $55 $45 $40 $45 $50 $55 $60 $65 $70 $75 Q1'24 Q2'24 Q3'24 Q4'24 Q1'25 Q1’25 BUSINESS UPDATE Cost Actions Update Cost actions are not expected to adversely impact our execution in a material way Quarterly Non-GAAP[6] Operating Expenses ($M) Quarterly Stock-Based Compensation ($M) Savings Realized © 2025 Luminar Technologies, Inc. All rights reserved. | 17 GAAP: $115 $114 $102 $78 $64 Savings Realized Lowering YE’25 quarterly OpEx target from mid/high-$30M to low-$30M range Please refer to Footnotes on slide 3 for more detail.
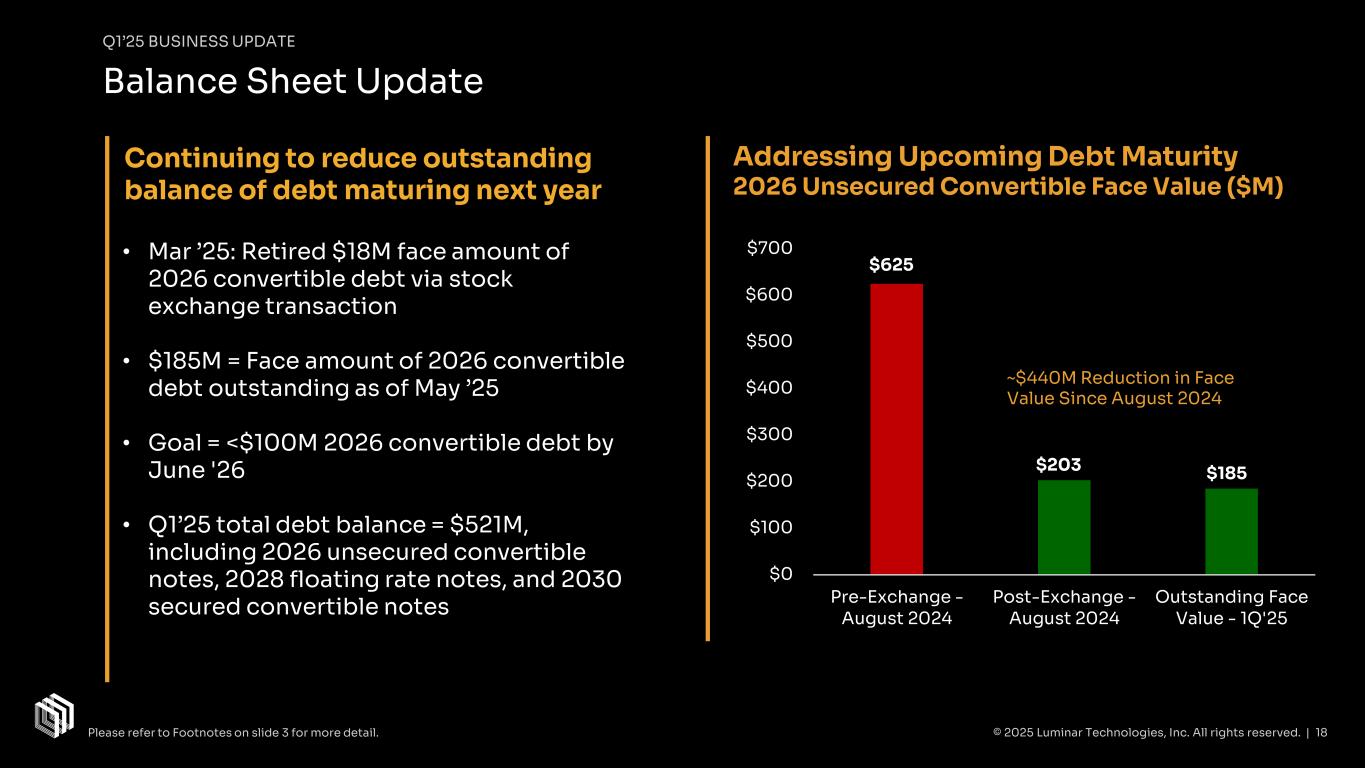
Q1’25 BUSINESS UPDATE Balance Sheet Update © 2025 Luminar Technologies, Inc. All rights reserved. | 18 Continuing to reduce outstanding balance of debt maturing next year • Mar ’25: Retired $18M face amount of 2026 convertible debt via stock exchange transaction • $185M = Face amount of 2026 convertible debt outstanding as of May ’25 • Goal = <$100M 2026 convertible debt by June '26 • Q1’25 total debt balance = $521M, including 2026 unsecured convertible notes, 2028 floating rate notes, and 2030 secured convertible notes Addressing Upcoming Debt Maturity 2026 Unsecured Convertible Face Value ($M) $0 $100 $200 $300 $400 $500 $600 $700 Pre-Exchange - August 2024 Post-Exchange - August 2024 Outstanding Face Value - 1Q'25 $625 $203 $185 ~$440M Reduction in Face Value Since August 2024 Please refer to Footnotes on slide 3 for more detail.
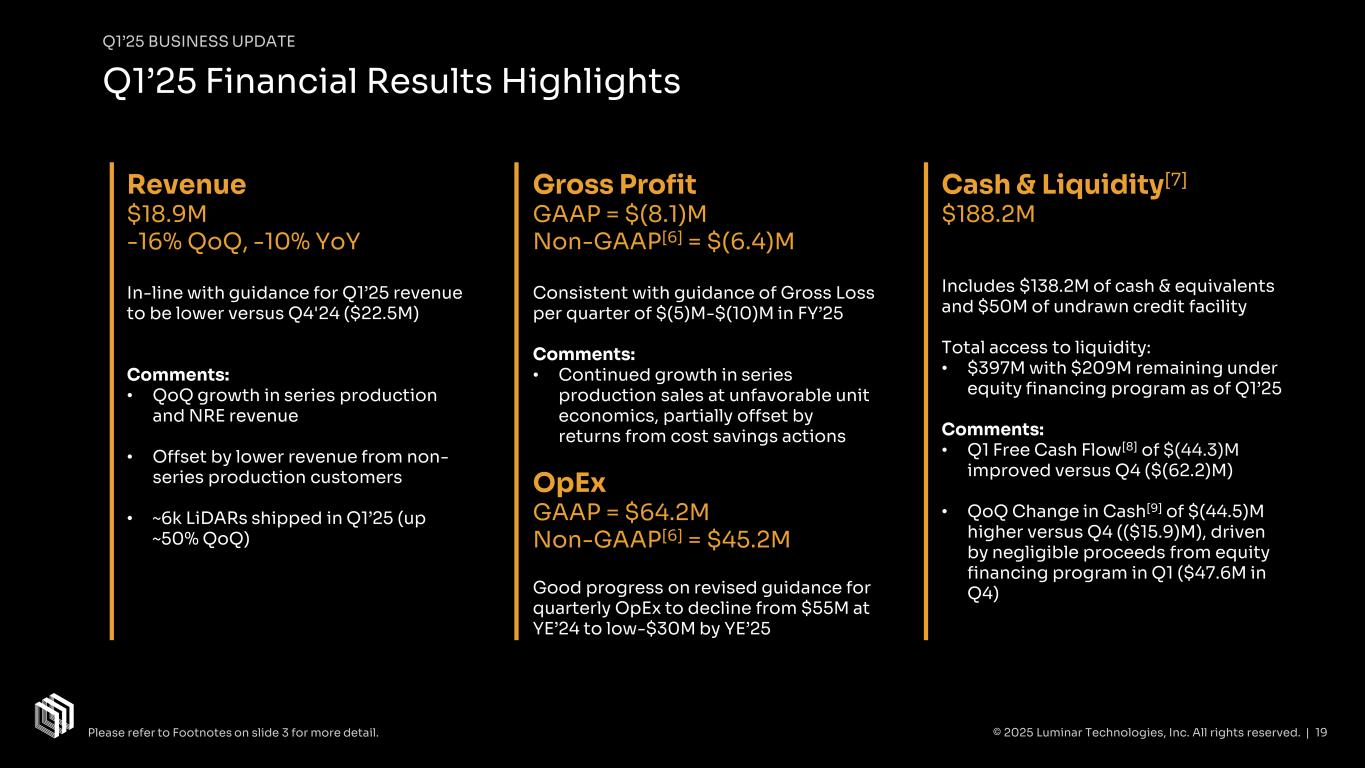
Revenue $18.9M -16% QoQ, -10% YoY In-line with guidance for Q1’25 revenue to be lower versus Q4'24 ($22.5M) Comments: • QoQ growth in series production and NRE revenue • Offset by lower revenue from non- series production customers • ~6k LiDARs shipped in Q1’25 (up ~50% QoQ) Gross Profit GAAP = $(8.1)M Non-GAAP[6] = $(6.4)M Consistent with guidance of Gross Loss per quarter of $(5)M-$(10)M in FY’25 Comments: • Continued growth in series production sales at unfavorable unit economics, partially offset by returns from cost savings actions OpEx GAAP = $64.2M Non-GAAP[6] = $45.2M Good progress on revised guidance for quarterly OpEx to decline from $55M at YE’24 to low-$30M by YE’25 Cash & Liquidity[7] $188.2M Includes $138.2M of cash & equivalents and $50M of undrawn credit facility Total access to liquidity: • $397M with $209M remaining under equity financing program as of Q1’25 Comments: • Q1 Free Cash Flow[8] of $(44.3)M improved versus Q4 ($(62.2)M) • QoQ Change in Cash[9] of $(44.5)M higher versus Q4 (($15.9)M), driven by negligible proceeds from equity financing program in Q1 ($47.6M in Q4) Q1’25 BUSINESS UPDATE Q1’25 Financial Results Highlights © 2025 Luminar Technologies, Inc. All rights reserved. | 19Please refer to Footnotes on slide 3 for more detail.
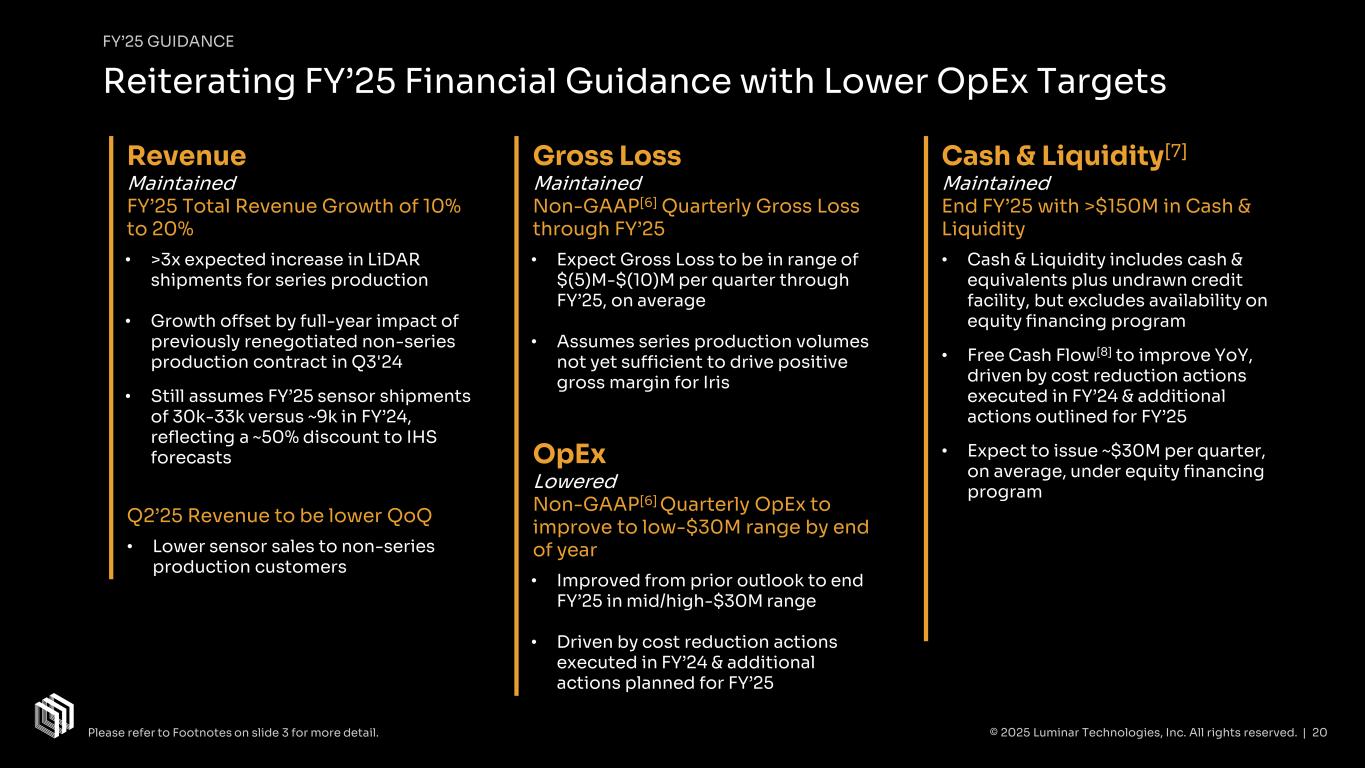
Revenue Maintained FY’25 Total Revenue Growth of 10% to 20% • >3x expected increase in LiDAR shipments for series production • Growth offset by full-year impact of previously renegotiated non-series production contract in Q3'24 • Still assumes FY’25 sensor shipments of 30k-33k versus ~9k in FY’24, reflecting a ~50% discount to IHS forecasts Q2’25 Revenue to be lower QoQ • Lower sensor sales to non-series production customers Gross Loss Maintained Non-GAAP[6] Quarterly Gross Loss through FY’25 • Expect Gross Loss to be in range of $(5)M-$(10)M per quarter through FY’25, on average • Assumes series production volumes not yet sufficient to drive positive gross margin for Iris OpEx Lowered Non-GAAP[6] Quarterly OpEx to improve to low-$30M range by end of year • Improved from prior outlook to end FY’25 in mid/high-$30M range • Driven by cost reduction actions executed in FY’24 & additional actions planned for FY’25 Cash & Liquidity[7] Maintained End FY’25 with >$150M in Cash & Liquidity • Cash & Liquidity includes cash & equivalents plus undrawn credit facility, but excludes availability on equity financing program • Free Cash Flow[8] to improve YoY, driven by cost reduction actions executed in FY’24 & additional actions outlined for FY’25 • Expect to issue ~$30M per quarter, on average, under equity financing program FY’25 GUIDANCE Reiterating FY’25 Financial Guidance with Lower OpEx Targets © 2025 Luminar Technologies, Inc. All rights reserved. | 20Please refer to Footnotes on slide 3 for more detail.
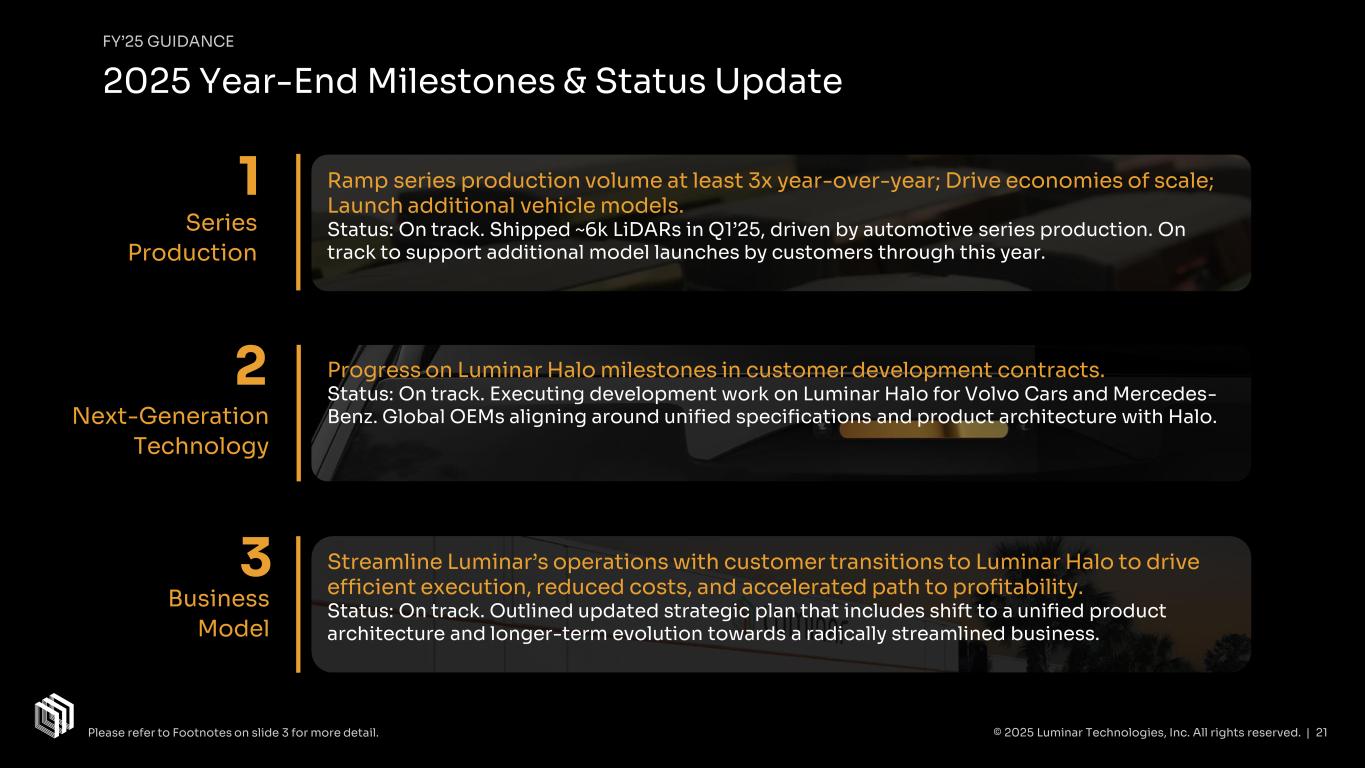
FY’25 GUIDANCE 2025 Year-End Milestones & Status Update Ramp series production volume at least 3x year-over-year; Drive economies of scale; Launch additional vehicle models. Status: On track. Shipped ~6k LiDARs in Q1’25, driven by automotive series production. On track to support additional model launches by customers through this year. Progress on Luminar Halo milestones in customer development contracts. Status: On track. Executing development work on Luminar Halo for Volvo Cars and Mercedes- Benz. Global OEMs aligning around unified specifications and product architecture with Halo. Streamline Luminar’s operations with customer transitions to Luminar Halo to drive efficient execution, reduced costs, and accelerated path to profitability. Status: On track. Outlined updated strategic plan that includes shift to a unified product architecture and longer-term evolution towards a radically streamlined business. Series Production Next-Generation Technology Business Model © 2025 Luminar Technologies, Inc. All rights reserved. | 21 1 2 3 Please refer to Footnotes on slide 3 for more detail.
Appendix © 2025 Luminar Technologies, Inc. All rights reserved. | 22
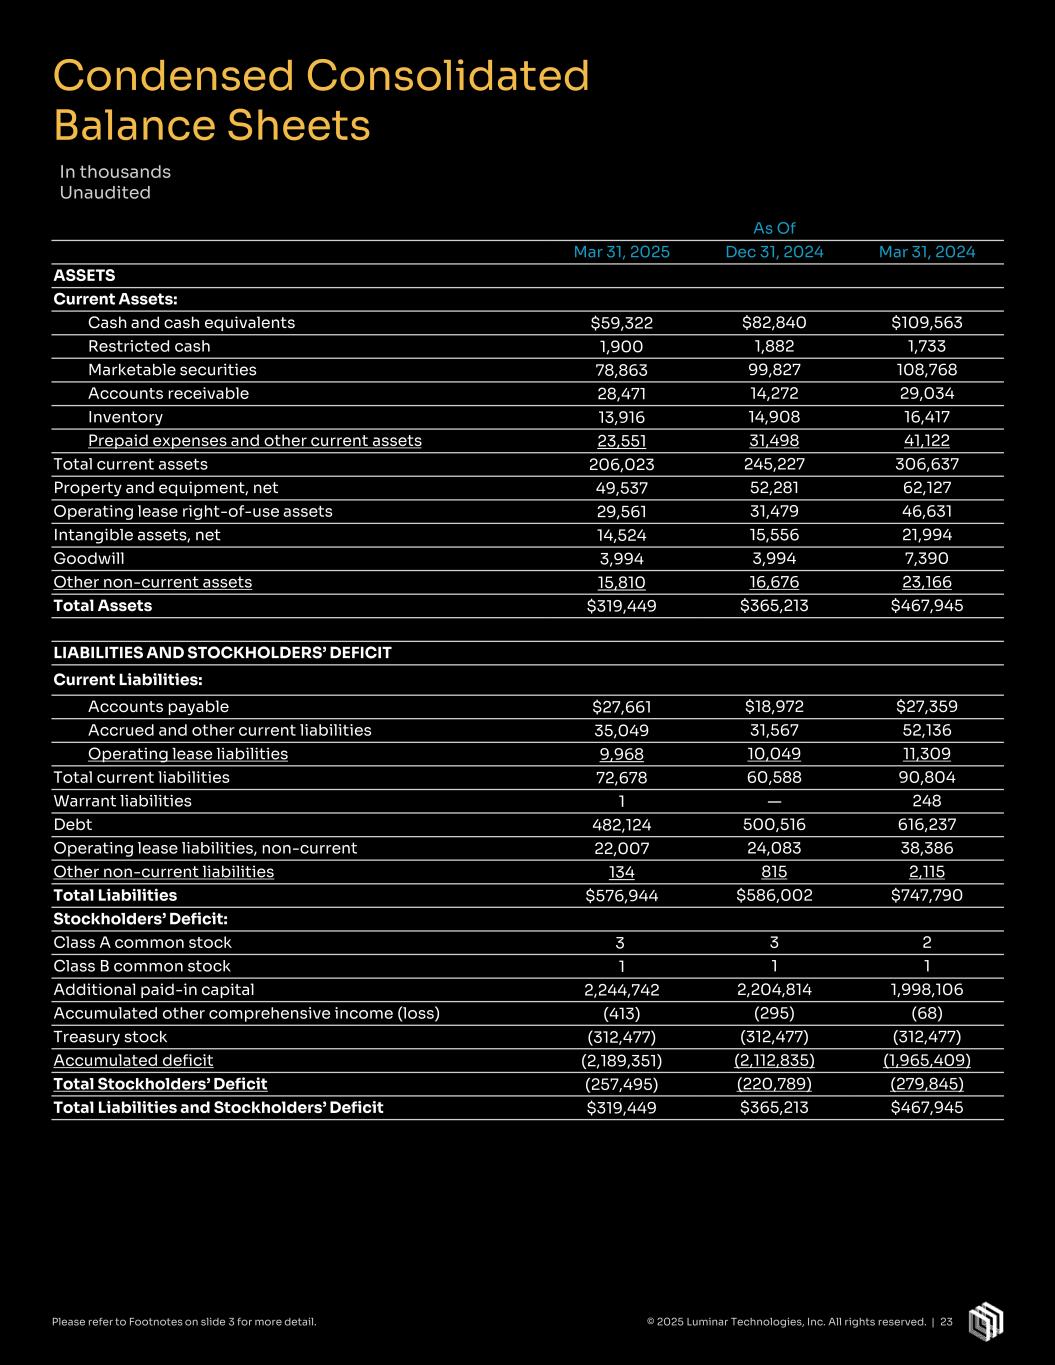
As Of Mar 31, 2025 Dec 31, 2024 Mar 31, 2024 ASSETS Current Assets: Cash and cash equivalents $59,322 $82,840 $109,563 Restricted cash 1,900 1,882 1,733 Marketable securities 78,863 99,827 108,768 Accounts receivable 28,471 14,272 29,034 Inventory 13,916 14,908 16,417 Prepaid expenses and other current assets 23,551 31,498 41,122 Total current assets 206,023 245,227 306,637 Property and equipment, net 49,537 52,281 62,127 Operating lease right-of-use assets 29,561 31,479 46,631 Intangible assets, net 14,524 15,556 21,994 Goodwill 3,994 3,994 7,390 Other non-current assets 15,810 16,676 23,166 Total Assets $319,449 $365,213 $467,945 LIABILITIES AND STOCKHOLDERS’ DEFICIT Current Liabilities: Accounts payable $27,661 $18,972 $27,359 Accrued and other current liabilities 35,049 31,567 52,136 Operating lease liabilities 9,968 10,049 11,309 Total current liabilities 72,678 60,588 90,804 Warrant liabilities 1 — 248 Debt 482,124 500,516 616,237 Operating lease liabilities, non-current 22,007 24,083 38,386 Other non-current liabilities 134 815 2,115 Total Liabilities $576,944 $586,002 $747,790 Stockholders’ Deficit: Class A common stock 3 3 2 Class B common stock 1 1 1 Additional paid-in capital 2,244,742 2,204,814 1,998,106 Accumulated other comprehensive income (loss) (413) (295) (68) Treasury stock (312,477) (312,477) (312,477) Accumulated deficit (2,189,351) (2,112,835) (1,965,409) Total Stockholders’ Deficit (257,495) (220,789) (279,845) Total Liabilities and Stockholders’ Deficit $319,449 $365,213 $467,945 Condensed Consolidated Balance Sheets In thousands Unaudited © 2025 Luminar Technologies, Inc. All rights reserved. | 23Please refer to Footnotes on slide 3 for more detail.
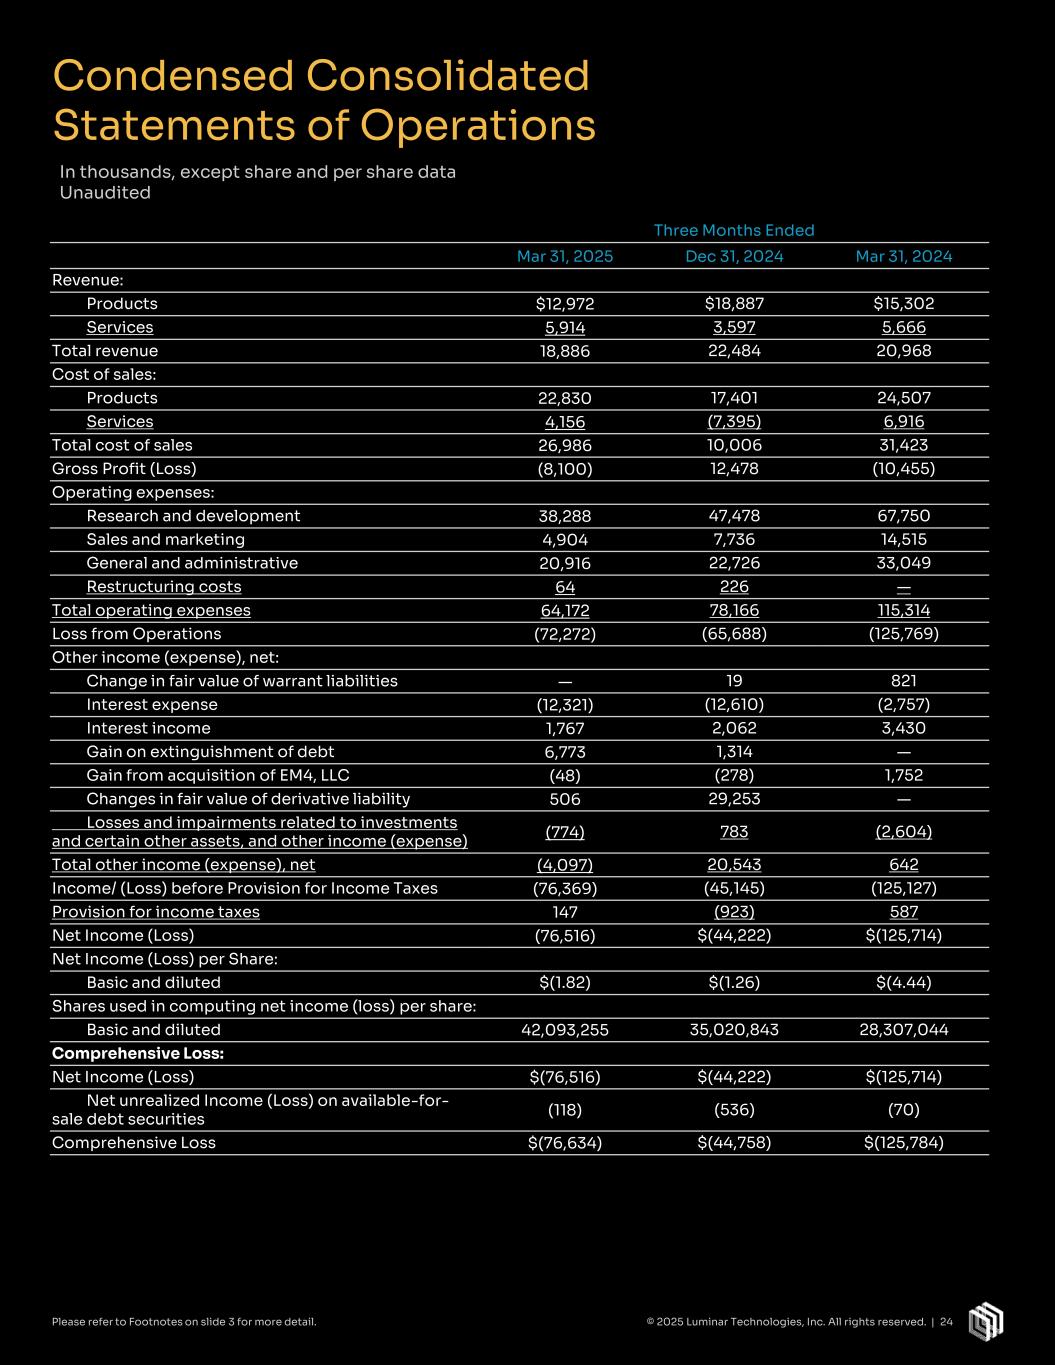
Condensed Consolidated Statements of Operations In thousands, except share and per share data Unaudited Three Months Ended Mar 31, 2025 Dec 31, 2024 Mar 31, 2024 Revenue: Products $12,972 $18,887 $15,302 Services 5,914 3,597 5,666 Total revenue 18,886 22,484 20,968 Cost of sales: Products 22,830 17,401 24,507 Services 4,156 (7,395) 6,916 Total cost of sales 26,986 10,006 31,423 Gross Profit (Loss) (8,100) 12,478 (10,455) Operating expenses: Research and development 38,288 47,478 67,750 Sales and marketing 4,904 7,736 14,515 General and administrative 20,916 22,726 33,049 Restructuring costs 64 226 — Total operating expenses 64,172 78,166 115,314 Loss from Operations (72,272) (65,688) (125,769) Other income (expense), net: Change in fair value of warrant liabilities — 19 821 Interest expense (12,321) (12,610) (2,757) Interest income 1,767 2,062 3,430 Gain on extinguishment of debt 6,773 1,314 — Gain from acquisition of EM4, LLC (48) (278) 1,752 Changes in fair value of derivative liability 506 29,253 — Losses and impairments related to investments and certain other assets, and other income (expense) (774) 783 (2,604) Total other income (expense), net (4,097) 20,543 642 Income/ (Loss) before Provision for Income Taxes (76,369) (45,145) (125,127) Provision for income taxes 147 (923) 587 Net Income (Loss) (76,516) $(44,222) $(125,714) Net Income (Loss) per Share: Basic and diluted $(1.82) $(1.26) $(4.44) Shares used in computing net income (loss) per share: Basic and diluted 42,093,255 35,020,843 28,307,044 Comprehensive Loss: Net Income (Loss) $(76,516) $(44,222) $(125,714) Net unrealized Income (Loss) on available-for- sale debt securities (118) (536) (70) Comprehensive Loss $(76,634) $(44,758) $(125,784) © 2025 Luminar Technologies, Inc. All rights reserved. | 24Please refer to Footnotes on slide 3 for more detail.
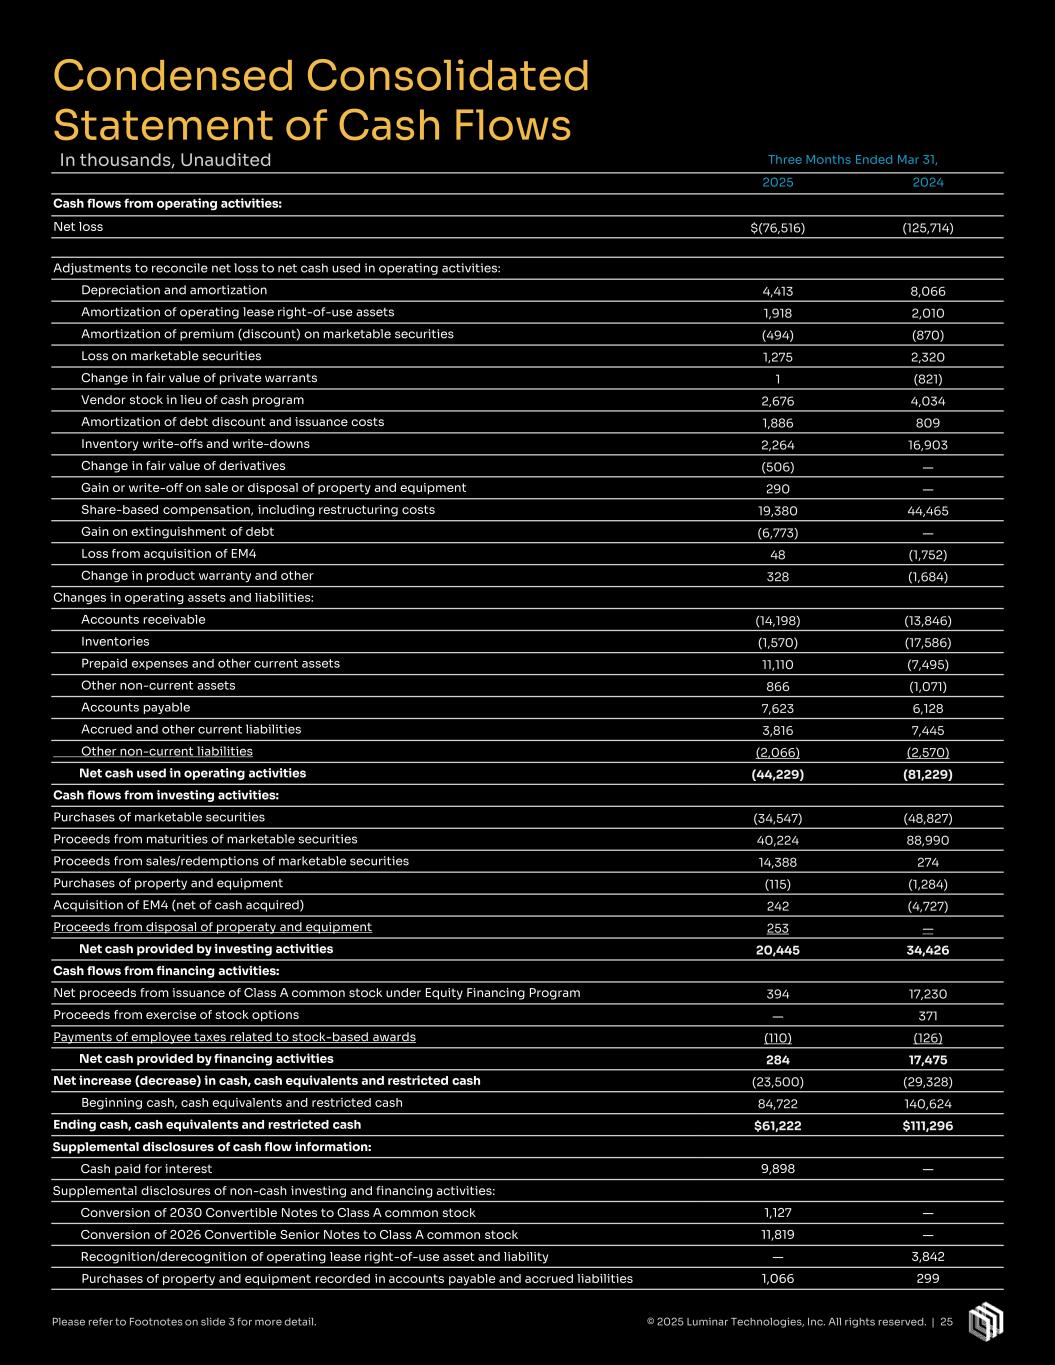
Three Months Ended Mar 31, 2025 2024 Cash flows from operating activities: Net loss $(76,516) (125,714) Adjustments to reconcile net loss to net cash used in operating activities: Depreciation and amortization 4,413 8,066 Amortization of operating lease right-of-use assets 1,918 2,010 Amortization of premium (discount) on marketable securities (494) (870) Loss on marketable securities 1,275 2,320 Change in fair value of private warrants 1 (821) Vendor stock in lieu of cash program 2,676 4,034 Amortization of debt discount and issuance costs 1,886 809 Inventory write-offs and write-downs 2,264 16,903 Change in fair value of derivatives (506) — Gain or write-off on sale or disposal of property and equipment 290 — Share-based compensation, including restructuring costs 19,380 44,465 Gain on extinguishment of debt (6,773) — Loss from acquisition of EM4 48 (1,752) Change in product warranty and other 328 (1,684) Changes in operating assets and liabilities: Accounts receivable (14,198) (13,846) Inventories (1,570) (17,586) Prepaid expenses and other current assets 11,110 (7,495) Other non-current assets 866 (1,071) Accounts payable 7,623 6,128 Accrued and other current liabilities 3,816 7,445 Other non-current liabilities (2,066) (2,570) Net cash used in operating activities (44,229) (81,229) Cash flows from investing activities: Purchases of marketable securities (34,547) (48,827) Proceeds from maturities of marketable securities 40,224 88,990 Proceeds from sales/redemptions of marketable securities 14,388 274 Purchases of property and equipment (115) (1,284) Acquisition of EM4 (net of cash acquired) 242 (4,727) Proceeds from disposal of properaty and equipment 253 — Net cash provided by investing activities 20,445 34,426 Cash flows from financing activities: Net proceeds from issuance of Class A common stock under Equity Financing Program 394 17,230 Proceeds from exercise of stock options — 371 Payments of employee taxes related to stock-based awards (110) (126) Net cash provided by financing activities 284 17,475 Net increase (decrease) in cash, cash equivalents and restricted cash (23,500) (29,328) Beginning cash, cash equivalents and restricted cash 84,722 140,624 Ending cash, cash equivalents and restricted cash $61,222 $111,296 Supplemental disclosures of cash flow information: Cash paid for interest 9,898 — Supplemental disclosures of non-cash investing and financing activities: Conversion of 2030 Convertible Notes to Class A common stock 1,127 — Conversion of 2026 Convertible Senior Notes to Class A common stock 11,819 — Recognition/derecognition of operating lease right-of-use asset and liability — 3,842 Purchases of property and equipment recorded in accounts payable and accrued liabilities 1,066 299 Condensed Consolidated Statement of Cash Flows In thousands, Unaudited © 2025 Luminar Technologies, Inc. All rights reserved. | 25Please refer to Footnotes on slide 3 for more detail.
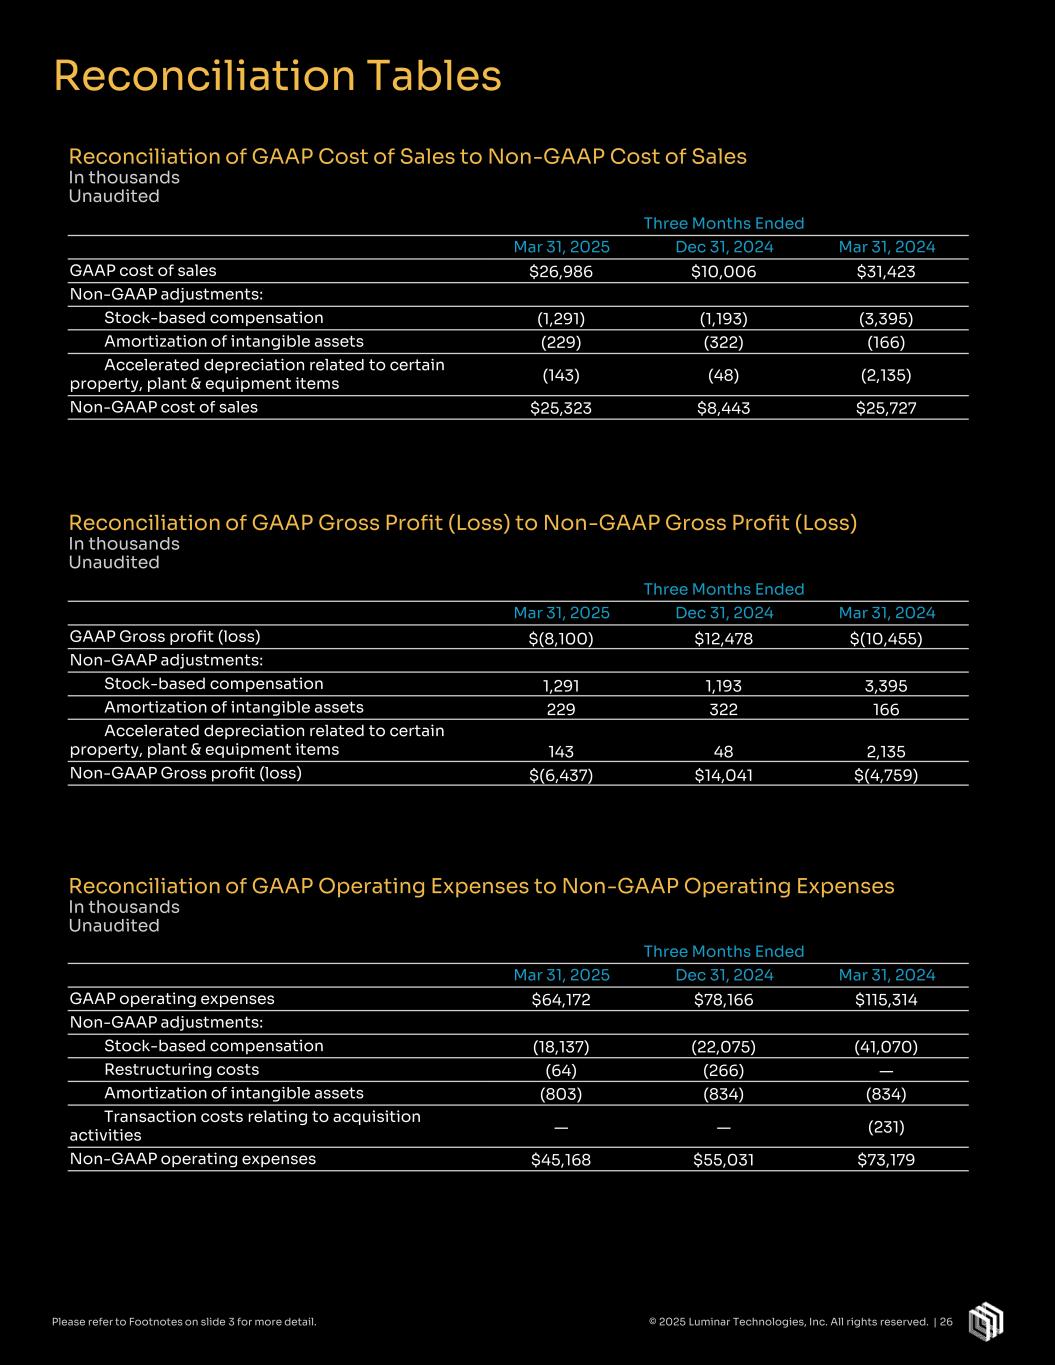
Reconciliation Tables Three Months Ended Mar 31, 2025 Dec 31, 2024 Mar 31, 2024 GAAP Gross profit (loss) $(8,100) $12,478 $(10,455) Non-GAAP adjustments: Stock-based compensation 1,291 1,193 3,395 Amortization of intangible assets 229 322 166 Accelerated depreciation related to certain property, plant & equipment items 143 48 2,135 Non-GAAP Gross profit (loss) $(6,437) $14,041 $(4,759) Reconciliation of GAAP Cost of Sales to Non-GAAP Cost of Sales In thousands Unaudited Reconciliation of GAAP Gross Profit (Loss) to Non-GAAP Gross Profit (Loss) In thousands Unaudited Three Months Ended Mar 31, 2025 Dec 31, 2024 Mar 31, 2024 GAAP operating expenses $64,172 $78,166 $115,314 Non-GAAP adjustments: Stock-based compensation (18,137) (22,075) (41,070) Restructuring costs (64) (266) — Amortization of intangible assets (803) (834) (834) Transaction costs relating to acquisition activities — — (231) Non-GAAP operating expenses $45,168 $55,031 $73,179 Reconciliation of GAAP Operating Expenses to Non-GAAP Operating Expenses In thousands Unaudited Three Months Ended Mar 31, 2025 Dec 31, 2024 Mar 31, 2024 GAAP cost of sales $26,986 $10,006 $31,423 Non-GAAP adjustments: Stock-based compensation (1,291) (1,193) (3,395) Amortization of intangible assets (229) (322) (166) Accelerated depreciation related to certain property, plant & equipment items (143) (48) (2,135) Non-GAAP cost of sales $25,323 $8,443 $25,727 © 2025 Luminar Technologies, Inc. All rights reserved. | 26Please refer to Footnotes on slide 3 for more detail.
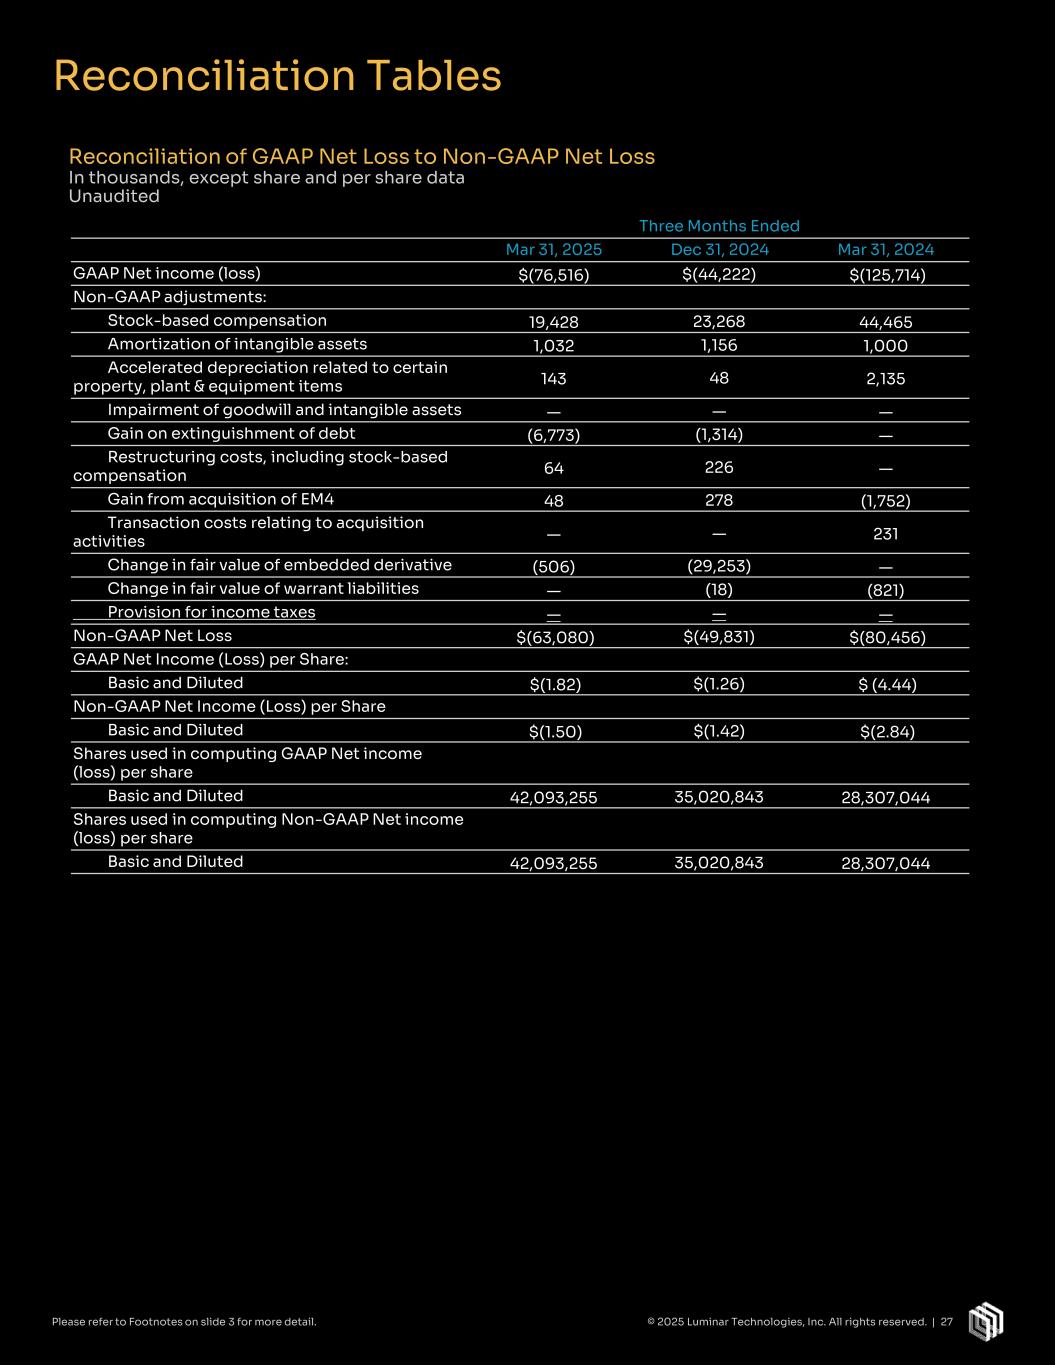
Reconciliation Tables Three Months Ended Mar 31, 2025 Dec 31, 2024 Mar 31, 2024 GAAP Net income (loss) $(76,516) $(44,222) $(125,714) Non-GAAP adjustments: Stock-based compensation 19,428 23,268 44,465 Amortization of intangible assets 1,032 1,156 1,000 Accelerated depreciation related to certain property, plant & equipment items 143 48 2,135 Impairment of goodwill and intangible assets — — — Gain on extinguishment of debt (6,773) (1,314) — Restructuring costs, including stock-based compensation 64 226 — Gain from acquisition of EM4 48 278 (1,752) Transaction costs relating to acquisition activities — — 231 Change in fair value of embedded derivative (506) (29,253) — Change in fair value of warrant liabilities — (18) (821) Provision for income taxes — — — Non-GAAP Net Loss $(63,080) $(49,831) $(80,456) GAAP Net Income (Loss) per Share: Basic and Diluted $(1.82) $(1.26) $ (4.44) Non-GAAP Net Income (Loss) per Share Basic and Diluted $(1.50) $(1.42) $(2.84) Shares used in computing GAAP Net income (loss) per share Basic and Diluted 42,093,255 35,020,843 28,307,044 Shares used in computing Non-GAAP Net income (loss) per share Basic and Diluted 42,093,255 35,020,843 28,307,044 Reconciliation of GAAP Net Loss to Non-GAAP Net Loss In thousands, except share and per share data Unaudited © 2025 Luminar Technologies, Inc. All rights reserved. | 27Please refer to Footnotes on slide 3 for more detail.
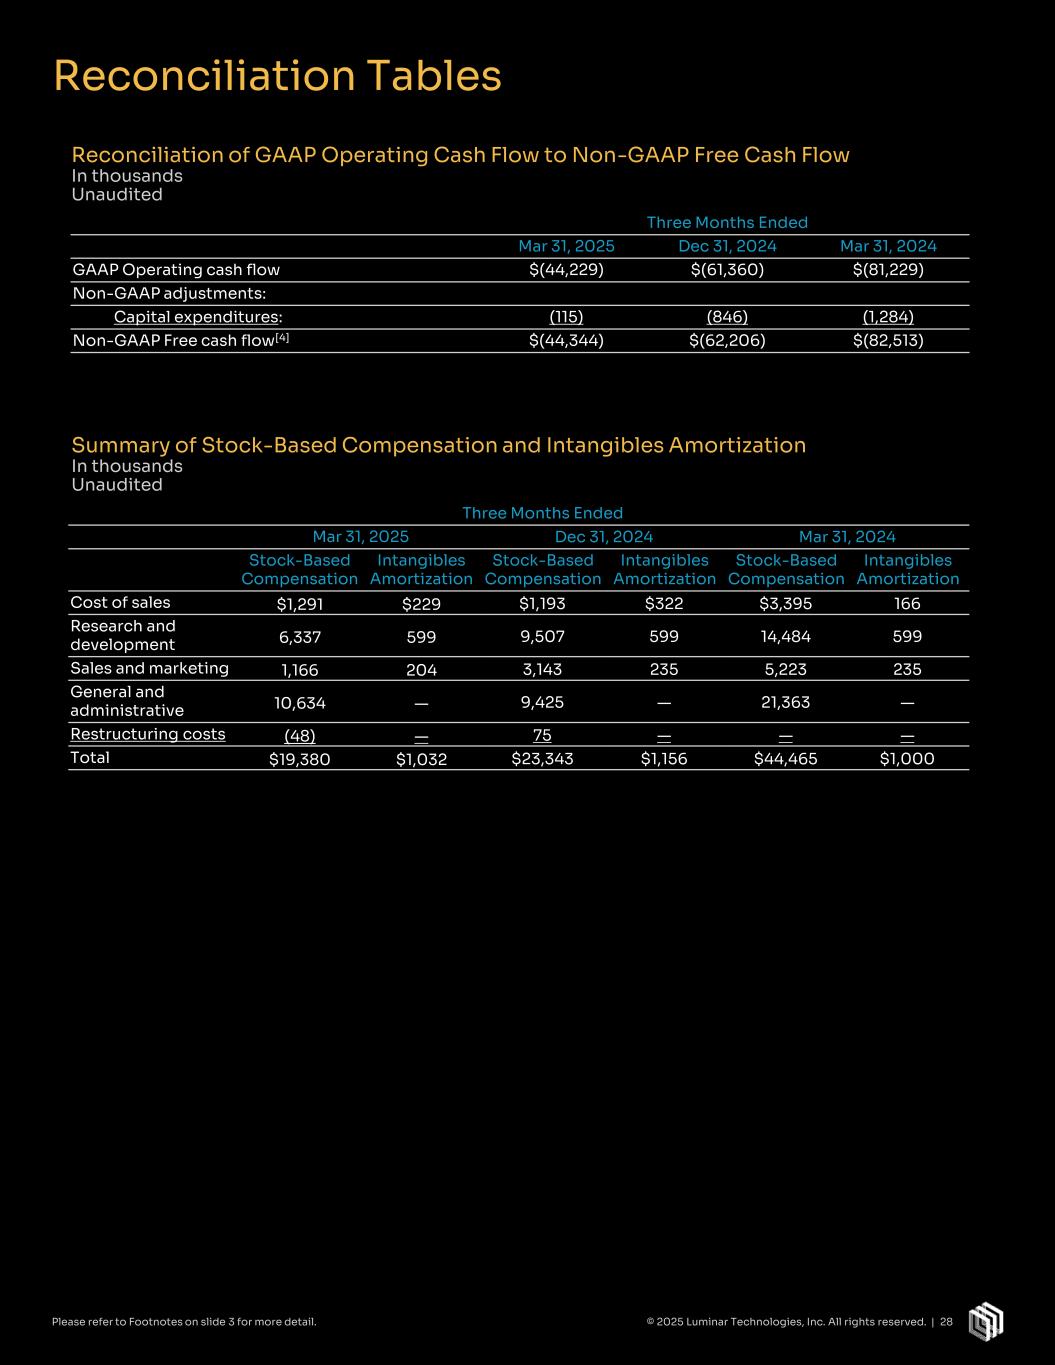
Reconciliation Tables Reconciliation of GAAP Operating Cash Flow to Non-GAAP Free Cash Flow In thousands Unaudited Summary of Stock-Based Compensation and Intangibles Amortization In thousands Unaudited Three Months Ended Mar 31, 2025 Dec 31, 2024 Mar 31, 2024 GAAP Operating cash flow $(44,229) $(61,360) $(81,229) Non-GAAP adjustments: Capital expenditures: (115) (846) (1,284) Non-GAAP Free cash flow[4] $(44,344) $(62,206) $(82,513) Three Months Ended Mar 31, 2025 Dec 31, 2024 Mar 31, 2024 Stock-Based Compensation Intangibles Amortization Stock-Based Compensation Intangibles Amortization Stock-Based Compensation Intangibles Amortization Cost of sales $1,291 $229 $1,193 $322 $3,395 166 Research and development 6,337 599 9,507 599 14,484 599 Sales and marketing 1,166 204 3,143 235 5,223 235 General and administrative 10,634 — 9,425 — 21,363 — Restructuring costs (48) — 75 — — — Total $19,380 $1,032 $23,343 $1,156 $44,465 $1,000 Please refer to Footnotes on slide 3 for more detail. © 2025 Luminar Technologies, Inc. All rights reserved. | 28