
LCII 8-K
Lci Industries (LCII)
8-K
2025-10-30
For: 2025-10-30
View Original
Added on
April 10, 2026
UNITED STATES
SECURITIES AND EXCHANGE COMMISSION
Washington, DC 20549
FORM 8-K
CURRENT REPORT
Pursuant to Section 13 OR 15(d) of the Securities Exchange Act of 1934
Date of Report (Date of earliest event reported): October 30, 2025
| (Exact name of registrant as specified in its charter) | ||||||||||||||
| (State or other jurisdiction of incorporation) | (Commission File Number) | (I.R.S. Employer Identification No.) | ||||||||||||
| (Address of principal executive offices) | (Zip Code) | |||||||||||||
| Registrant's telephone number, including area code: | ||||||||||||||
| N/A | ||||||||||||||
| (Former name or former address, if changed since last report) | ||||||||||||||
Check the appropriate box below if the Form 8-K filing is intended to simultaneously satisfy the filing obligation of the registrant under any of the following provisions (see General Instruction A.2. below):
| Written communications pursuant to Rule 425 under the Securities Act (17 CFR 230.425) | |||||
| Soliciting material pursuant to Rule 14a-12 under the Exchange Act (17 CFR 240.14a-12) | |||||
| Pre-commencement communications pursuant to Rule 14d-2(b) under the Exchange Act (17 CFR 240.14d-2(b)) | |||||
| Pre-commencement communications pursuant to Rule 13e-4(c) under the Exchange Act (17 CFR 240.13e-4(c)) | |||||
Securities registered pursuant to Section 12(b) of the Act:
| Title of each class | Trading Symbol(s) | Name of each exchange on which registered | ||||||
Indicate by check mark whether the registrant is an emerging growth company as defined in Rule 405 of the Securities Act of 1933 (§230.405 of this chapter) or Rule 12b-2 of the Securities Exchange Act of 1934 (§240.12b-2 of this chapter).
Emerging growth company | ||||||||||||||
If an emerging growth company, indicate by check mark if the registrant has elected not to use the extended transition period for complying with any new or revised financial accounting standards provided pursuant to Section 13(a) of the Exchange Act. ☐
Item 2.02 Results of Operations and Financial Condition
On October 30, 2025, LCI Industries issued a press release setting forth LCI Industries' third quarter 2025 results. A copy of the press release is attached hereto as Exhibit 99.1.
An investor presentation that LCI Industries will refer to during its conference call to discuss the results is attached hereto as Exhibit 99.2 and will be posted on LCI Industries' investor relations website in advance of the call.
The foregoing information is furnished pursuant to Item 2.02, "Results of Operations and Financial Condition." Such information, including the Exhibits attached hereto, is being furnished and shall not be deemed "filed" for purposes of Section 18 of the Securities Exchange Act of 1934, nor shall it be deemed incorporated by reference in any filing under the Securities Act of 1933, except as shall be expressly set forth by specific reference in such filing.
Item 9.01 Financial Statements and Exhibits
Exhibit Index:
Press Release dated October 30, 2025 | ||||||||
Investor Presentation dated October 30, 2025 | ||||||||
| 104 | Cover Page Interactive Data File (embedded within the Inline XBRL document). | |||||||
SIGNATURES
Pursuant to the requirements of the Securities Exchange Act of 1934, the registrant has duly caused this report to be signed on its behalf by the undersigned hereunto duly authorized.
LCI INDUSTRIES | |||||
(Registrant) | |||||
By: /s/ Lillian D. Etzkorn Lillian D. Etzkorn Chief Financial Officer | |||||
| Dated: | October 30, 2025 | ||||
FOR IMMEDIATE RELEASE |  | |||||||
Contact: Lillian D. Etzkorn, CFO | ||||||||
Phone: (574) 535-1125 | ||||||||
E Mail: [email protected] | ||||||||
LCI INDUSTRIES REPORTS THIRD QUARTER FINANCIAL RESULTS
Delivered 13% Revenue Growth with Sustained Margin Expansion
Diversification Strategy, Innovation, and Manufacturing Optimization Expected to Continue to Propel Future Gains
Provides Full-Year 2025 and Initial 2026 KPI Outlooks
Third Quarter 2025 Highlights Versus Third Quarter 2024
•Net sales increased 13% to $1.0 billion, driven by organic growth in RV OEM and Aftermarket
•Net income of $62 million, which was 6.0% of net sales, or $2.55 per diluted share, up 75% from $36 million, or $1.39 per diluted share
•Adjusted net income of $48 million, up 35%, to $1.97 per diluted share
•Adjusted EBITDA increased 24% to $106 million, or 10.2% of net sales
•Operating profit margin expanded 140 bps to 7.3% from 5.9%
Other Highlights
•Cash flows from operations of $359 million for the LTM ended September 30, 2025
•$215 million returned to shareholders in the form of dividends and share repurchases year-to-date
•Strong liquidity position of $795 million, comprising $200 million of cash and cash equivalents and $595 million of availability on revolving credit facility at September 30, 2025
•Innovation continues to drive profitable sales growth and share gains with top five new innovative products now projected at $225 million annualized sales run rate
•Continued facility optimization with two additional planned facility consolidations by year-end 2025, resulting in five total for 2025 and targeting 8-10 for 2026
Elkhart, Indiana - October 30, 2025 - LCI Industries (NYSE: LCII), a leading supplier of engineered components to the recreation and transportation markets, today reported third quarter 2025 results.
“Our diversification strategy has continued to fundamentally contribute to our strong performance, as our team’s outstanding efforts resulted in 13% revenue growth, which drove strong margin expansion and a meaningful increase in adjusted earnings per share of 42%. Our leadership teams have worked diligently to optimize our productivity, footprint, and resources, positioning the company for strong performance as the industry begins to recover from this prolonged cycle,” said Jason Lippert, President and Chief Executive Officer. “We continue to strengthen our structural competitive advantages through implementation of operational excellence, while benefitting from our investments in innovation that have created another competitive moat. We are also once again adding outstanding businesses to our flagship brands through disciplined, strategic acquisitions. As we look ahead, we believe Lippert is well-positioned to build on our sustained incremental margin improvement and meaningfully enhance shareholder value over time.”
Third Quarter 2025 Results
Consolidated net sales grew 13.2% to $1,036.5 million from 2024 third quarter net sales of $915.5 million. The increase was primarily due to a $105.6 million increase in net sales of the OEM Segment driven by sales price increases related to material costs, sales from acquired businesses, and higher North American RV sales driven by
market share gains and an increased mix of higher content fifth-wheel units. Net sales from acquisitions completed in the twelve months ended September 30, 2025 contributed $41.9 million in the third quarter of 2025.
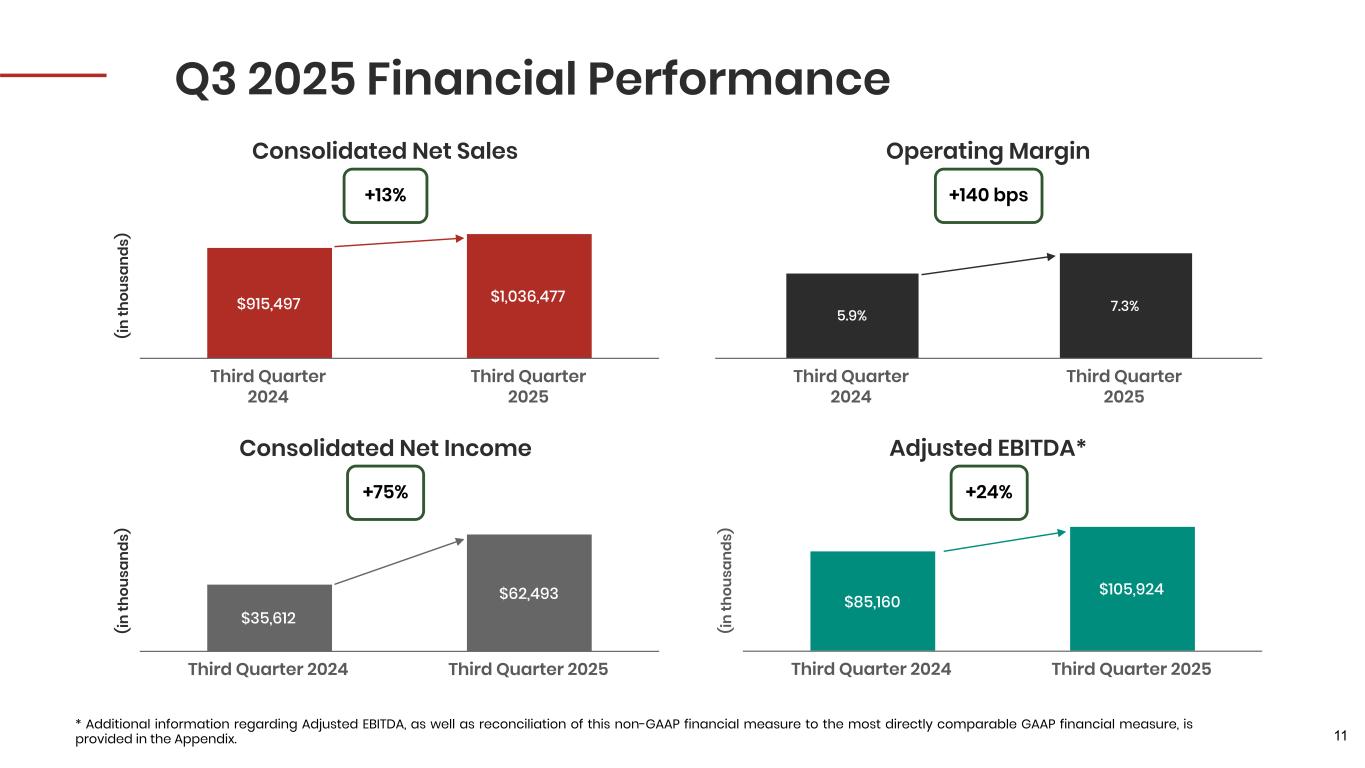
Net income was $62.5 million, or $2.55 per diluted share, up 75%, compared to $35.6 million, or $1.39 per diluted share, in the third quarter of 2024. Adjusted net income increased to $48.1 million, up 35%, to $1.97 per diluted share, excluding loss on extinguishment of debt and gain on sale of real estate, net of tax effect. Adjusted EBITDA grew 24% to $105.9 million, compared to $85.2 million in the third quarter of 2024. Operating profit margin was 7.3 percent in the third quarter of 2025 compared to 5.9 percent in the same period of 2024. The margin expansion was primarily driven by reduced costs from materials sourcing strategies and increased North American RV sales volume related to market share gains and increased sales mix of higher content fifth-wheel units.
*Additional information regarding adjusted net income and Adjusted EBITDA, as well as reconciliations of these non-GAAP financial measures to the most directly comparable GAAP financial measure of net income, is provided in the "Supplementary Information - Reconciliation of Non-GAAP Measures" section below.
OEM Segment - Third Quarter Performance
OEM net sales rose $105.6 million, or 15%, to $790.0 million for the third quarter of 2025, compared to the same period of 2024. RV OEM net sales increased 11% to $470.1 million, primarily driven by sales price increases related to material costs, an increase in RV sales mix toward higher content fifth-wheel units, market share gains, and an increase in North American motorhome RV unit shipments, partially offset by volume decreases in the European RV market. Adjacent Industries OEM net sales grew 22% year-over-year to $319.9 million, driven primarily by sales from acquired businesses and higher sales to North American utility trailer and marine OEMs.
Operating profit of the OEM Segment was $43.6 million in the third quarter of 2025, or 5.5% of net sales, compared to an operating profit of $21.8 million, or 3.2% of net sales, in the same period in 2024. The operating profit margin expansion of the OEM Segment was primarily driven by increases in selling prices for targeted products, primarily related to increased material costs, reduced costs from material sourcing strategies, improved fixed cost absorption, and production labor efficiencies, partially offset by higher material costs on the expense side, which were impacted by tariffs and higher steel, aluminum, and freight costs.
Aftermarket Segment - Third Quarter Performance
Aftermarket net sales grew 7% to $246.5 million compared to the same period of 2024. The increase was primarily driven by product innovations, increased demand for our upgrade and service parts as more units enter the upgrade and repair cycle, and the expanding Camping World relationship within the RV aftermarket, partially offset by lower volumes within the automotive aftermarket. Operating profit of the Aftermarket Segment of $31.9 million was relatively flat compared to the same period of 2024. The operating profit margin of the Aftermarket Segment was 12.9%, compared to 13.9% in the same period in 2024. The operating profit margin change was primarily driven by higher material costs related to tariffs and higher steel, aluminum, and freight costs, lower production volumes in the automotive aftermarket in response to lower retail volumes, and investments in capacity, distribution and logistics technology to support growth of the Aftermarket Segment, partially offset by increases in selling prices for targeted products, primarily related to increased material costs, and reduced costs from material sourcing strategies.
Income Taxes
The Company's effective tax rate was 25.6% for the quarter ended September 30, 2025, compared to 24.8% for the quarter ended September 30, 2024. The increase in the effective tax rate was primarily due to a reduction in federal tax credits.
Balance Sheet and Other Items
At September 30, 2025, the Company's cash and cash equivalents balance was $199.7 million, up from $165.8 million at December 31, 2024. The Company used $128.6 million for share repurchases, $103.0 million for
the acquisitions of businesses, $86.2 million for dividend payments to shareholders, and $38.1 million for capital expenditures in the nine months ended September 30, 2025.
In September 2025, the Company amended its Credit Agreement to reduce the interest rate on the term loans, resulting in a quarter point reduction in the applicable margin on its term loan borrowings. On a go-forward basis, based on the outstanding term loan principal amount at September 30, 2025, this reduction in effective interest rates is expected to save approximately $1.0 million in cash interest expense annually.
The Company's outstanding long-term indebtedness, including current maturities, was $947.8 million at September 30, 2025. As of September 30, 2025, the Company had $595.2 million of borrowing availability under its revolving credit facility.
As part of the Company's footprint optimization efforts, it sold two owned real estate locations during the third quarter of 2025 for combined net cash proceeds of $22.7 million. The sales resulted in a total net gain on the sale of real estate of $19.7 million for the three months ended September 30, 2025.
Outlook
Based on current market and economic conditions along with existing tariffs, the Company expects the following:
•October 2025 net sales projected at approximately $380 million, up 15% from prior year
•On track to deliver an 85 basis point operating profit margin improvement for full-year 2025 as compared to 2024, primarily through optimizing infrastructure
•Exploring divestiture opportunities of approximately $75 million of revenues that are dilutive to the business in 2026
•2026 operating profit margin of 7.0 to 8.0%
•2025 North American RV wholesale shipments of 340,000 - 350,000
•2026 North American RV wholesale shipments of 345,000 - 360,000
Conference Call & Webcast
LCI Industries will host a conference call to discuss its third quarter results on Thursday, October 30, 2025, at 8:30 a.m. Eastern time, which may be accessed by dialing (833) 470-1428 for participants in the U.S. and (929) 526-1599 for participants outside the U.S. using the required conference ID 672247. Due to the high volume of companies reporting earnings at this time, please be prepared for hold times of up to 15 minutes when dialing in to the call. In addition, an online, real-time webcast, as well as a supplemental earnings presentation, can be accessed on the Company's website, www.investors.lci1.com.
A replay of the conference call will be available for two weeks by dialing (866) 813-9403 for participants in the U.S. and (44) 204-525-0658 for participants outside the U.S. and referencing access code 279083. A replay of the webcast will be available on the Company’s website immediately following the conclusion of the call.
About LCI Industries
LCI Industries (NYSE: LCII), through its Lippert subsidiary, is a global leader in supplying engineered components to the outdoor recreation and transportation markets. We believe our innovative culture, advanced manufacturing capabilities, and dedication to enhancing the customer experience have established Lippert as a reliable partner for both OEM and aftermarket customers. For more information, visit www.lippert.com.
Forward-Looking Statements
This press release contains certain "forward-looking statements" with respect to our financial condition, results of operations, profitability, margins, business strategies, operating efficiencies or synergies, competitive position, growth opportunities, acquisitions, plans and objectives of management, markets for the Company's common stock, the impact of legal proceedings, and other matters. Statements in this press release that are not historical facts are
"forward-looking statements" for the purpose of the safe harbor provided by Section 21E of the Securities Exchange Act of 1934, as amended, and Section 27A of the Securities Act of 1933, as amended, and involve a number of risks and uncertainties.
Forward-looking statements, including, without limitation, those relating to production levels, future financial results and business prospects, net sales, expenses and income (loss), operating margins, capital expenditures, tax rate, cash flow, financial condition, liquidity, covenant compliance, retail and wholesale demand and shipments, run rates, integration of acquisitions, planned divestitures and facility consolidations, R&D investments, commodity prices, addressable markets, and industry trends, whenever they occur in this press release are necessarily estimates reflecting the best judgment of the Company's senior management at the time such statements were made. There are a number of factors, many of which are beyond the Company's control, which could cause actual results and events to differ materially from those described in the forward-looking statements. These factors include, in addition to other matters described in this press release, the impacts of costs and availability of, and tariffs on, raw materials (particularly steel and aluminum) and other components, future pandemics, geopolitical tensions, armed conflicts, or natural disasters on the global economy and on the Company's customers, suppliers, team members, business and cash flows, pricing pressures due to domestic and foreign competition, seasonality and cyclicality in the industries to which we sell our products, availability of credit for financing the retail and wholesale purchase of products for which we sell our components, inventory levels of retail dealers and manufacturers, availability of transportation for products for which we sell our components, the financial condition of our customers, the financial condition of retail dealers of products for which we sell our components, retention and concentration of significant customers, the costs, pace of and successful integration of acquisitions and other growth initiatives, availability and costs of production facilities and labor, team member benefits, team member retention, realization and impact of expansion plans, efficiency improvements and cost reductions, the disruption of business resulting from natural disasters or other unforeseen events, the successful entry into new markets, the costs of compliance with environmental laws, laws of foreign jurisdictions in which we operate, other operational and financial risks related to conducting business internationally, and increased governmental regulation and oversight, information technology performance and security, the ability to protect intellectual property, warranty and product liability claims or product recalls, interest rates, oil and gasoline prices, and availability, the impact of international, national and regional economic conditions and consumer confidence on the retail sale of products for which we sell our components, and other risks and uncertainties discussed more fully under the caption "Risk Factors" in the Company's Annual Report on Form 10-K for the year ended December 31, 2024, and in the Company's subsequent filings with the Securities and Exchange Commission. Readers of this press release are cautioned not to place undue reliance on these forward-looking statements, since there can be no assurance that these forward-looking statements will prove to be accurate. The Company disclaims any obligation or undertaking to update forward-looking statements to reflect circumstances or events that occur after the date the forward-looking statements are made, except as required by law.
###
LCI INDUSTRIES
OPERATING RESULTS
(unaudited)
| Three Months Ended September 30, | Nine Months Ended September 30, | Last Twelve | |||||||||||||||||||||||||||
| 2025 | 2024 | 2025 | 2024 | Months | |||||||||||||||||||||||||
| (In thousands, except per share amounts) | |||||||||||||||||||||||||||||
| Net sales | $ | 1,036,477 | $ | 915,497 | $ | 3,189,317 | $ | 2,938,070 | $ | 3,992,455 | |||||||||||||||||||
| Cost of sales | 783,864 | 695,539 | 2,414,934 | 2,227,761 | 3,048,666 | ||||||||||||||||||||||||
| Gross profit | 252,613 | 219,958 | 774,383 | 710,309 | 943,789 | ||||||||||||||||||||||||
| Selling, general and administrative expenses | 177,174 | 166,070 | 529,823 | 508,206 | 683,095 | ||||||||||||||||||||||||
| Operating profit | 75,439 | 53,888 | 244,560 | 202,103 | 260,694 | ||||||||||||||||||||||||
| Interest expense, net | 10,323 | 6,516 | 26,003 | 23,799 | 31,103 | ||||||||||||||||||||||||
| Loss on extinguishment of debt | 806 | — | 8,859 | — | 8,859 | ||||||||||||||||||||||||
| Gain on sale of real estate | (19,716) | — | (19,716) | — | (19,716) | ||||||||||||||||||||||||
| Income before income taxes | 84,026 | 47,372 | 229,414 | 178,304 | 240,448 | ||||||||||||||||||||||||
| Provision for income taxes | 21,533 | 11,760 | 59,848 | 44,984 | 61,335 | ||||||||||||||||||||||||
| Net income | $ | 62,493 | $ | 35,612 | $ | 169,566 | $ | 133,320 | $ | 179,113 | |||||||||||||||||||
| Net income per common share: | |||||||||||||||||||||||||||||
| Basic | $ | 2.56 | $ | 1.40 | $ | 6.79 | $ | 5.24 | $ | 7.06 | |||||||||||||||||||
| Diluted | $ | 2.55 | $ | 1.39 | $ | 6.78 | $ | 5.23 | $ | 7.04 | |||||||||||||||||||
| Weighted average common shares outstanding: | |||||||||||||||||||||||||||||
| Basic | 24,389 | 25,480 | 24,978 | 25,436 | 25,381 | ||||||||||||||||||||||||
| Diluted | 24,466 | 25,558 | 25,004 | 25,477 | 25,431 | ||||||||||||||||||||||||
| Depreciation | $ | 16,706 | $ | 17,390 | $ | 50,195 | $ | 53,911 | $ | 66,677 | |||||||||||||||||||
| Amortization | $ | 13,779 | $ | 13,882 | $ | 40,155 | $ | 42,089 | $ | 53,366 | |||||||||||||||||||
| Capital expenditures | $ | 12,736 | $ | 10,062 | $ | 38,071 | $ | 31,390 | $ | 49,014 | |||||||||||||||||||
LCI INDUSTRIES
SEGMENT RESULTS
(unaudited)
| Three Months Ended September 30, | Nine Months Ended September 30, | Last Twelve | |||||||||||||||||||||||||||
| 2025 | 2024 | 2025 | 2024 | Months | |||||||||||||||||||||||||
| (In thousands) | |||||||||||||||||||||||||||||
| Net sales: | |||||||||||||||||||||||||||||
| OEM Segment: | |||||||||||||||||||||||||||||
| RV OEMs: | |||||||||||||||||||||||||||||
| Travel trailers and fifth-wheels | $ | 412,472 | $ | 369,212 | $ | 1,325,592 | $ | 1,186,324 | $ | 1,653,846 | |||||||||||||||||||
| Motorhomes | 57,635 | 52,800 | 178,615 | 185,258 | 226,423 | ||||||||||||||||||||||||
| Adjacent Industries OEMs | 319,916 | 262,449 | 948,930 | 867,315 | 1,194,421 | ||||||||||||||||||||||||
| Total OEM Segment net sales | 790,023 | 684,461 | 2,453,137 | 2,238,897 | 3,074,690 | ||||||||||||||||||||||||
| Aftermarket Segment: | |||||||||||||||||||||||||||||
| Total Aftermarket Segment net sales | 246,454 | 231,036 | 736,180 | 699,173 | 917,765 | ||||||||||||||||||||||||
| Total net sales | $ | 1,036,477 | $ | 915,497 | $ | 3,189,317 | $ | 2,938,070 | $ | 3,992,455 | |||||||||||||||||||
| Operating profit: | |||||||||||||||||||||||||||||
| OEM Segment | $ | 43,570 | $ | 21,825 | $ | 157,227 | $ | 105,223 | $ | 159,085 | |||||||||||||||||||
| Aftermarket Segment | 31,869 | 32,063 | 87,333 | 96,880 | 101,609 | ||||||||||||||||||||||||
| Total operating profit | $ | 75,439 | $ | 53,888 | $ | 244,560 | $ | 202,103 | $ | 260,694 | |||||||||||||||||||
| Depreciation and amortization: | |||||||||||||||||||||||||||||
| OEM Segment depreciation | $ | 11,992 | $ | 13,270 | $ | 36,488 | $ | 41,038 | $ | 48,934 | |||||||||||||||||||
| Aftermarket Segment depreciation | 4,714 | 4,120 | 13,707 | 12,873 | 17,743 | ||||||||||||||||||||||||
| Total depreciation | $ | 16,706 | $ | 17,390 | $ | 50,195 | $ | 53,911 | $ | 66,677 | |||||||||||||||||||
| OEM Segment amortization | $ | 9,917 | $ | 9,996 | $ | 28,669 | $ | 30,426 | $ | 38,086 | |||||||||||||||||||
| Aftermarket Segment amortization | 3,862 | 3,886 | 11,486 | 11,663 | 15,280 | ||||||||||||||||||||||||
| Total amortization | $ | 13,779 | $ | 13,882 | $ | 40,155 | $ | 42,089 | $ | 53,366 | |||||||||||||||||||
LCI INDUSTRIES
BALANCE SHEET INFORMATION
(unaudited)
| September 30, | December 31, | ||||||||||
| 2025 | 2024 | ||||||||||
| (In thousands) | |||||||||||
| ASSETS | |||||||||||
| Current assets | |||||||||||
| Cash and cash equivalents | $ | 199,721 | $ | 165,756 | |||||||
| Accounts receivable, net | 363,861 | 199,560 | |||||||||
| Inventories, net | 741,279 | 736,604 | |||||||||
| Prepaid expenses and other current assets | 64,271 | 58,318 | |||||||||
| Total current assets | 1,369,132 | 1,160,238 | |||||||||
| Fixed assets, net | 430,505 | 432,728 | |||||||||
| Goodwill | 620,556 | 585,773 | |||||||||
| Other intangible assets, net | 410,396 | 392,018 | |||||||||
| Operating lease right-of-use assets | 235,780 | 224,313 | |||||||||
| Other long-term assets | 102,220 | 99,669 | |||||||||
| Total assets | $ | 3,168,589 | $ | 2,894,739 | |||||||
| LIABILITIES AND STOCKHOLDERS' EQUITY | |||||||||||
| Current liabilities | |||||||||||
| Current maturities of long-term indebtedness | $ | 3,665 | $ | 423 | |||||||
| Accounts payable, trade | 220,735 | 187,684 | |||||||||
| Current portion of operating lease obligations | 40,271 | 38,671 | |||||||||
| Accrued expenses and other current liabilities | 227,505 | 185,275 | |||||||||
| Total current liabilities | 492,176 | 412,053 | |||||||||
| Long-term indebtedness | 944,167 | 756,830 | |||||||||
| Operating lease obligations | 211,434 | 199,929 | |||||||||
| Deferred taxes | 29,175 | 26,110 | |||||||||
| Other long-term liabilities | 129,959 | 112,931 | |||||||||
| Total liabilities | 1,806,911 | 1,507,853 | |||||||||
| Total stockholders' equity | 1,361,678 | 1,386,886 | |||||||||
| Total liabilities and stockholders' equity | $ | 3,168,589 | $ | 2,894,739 | |||||||
LCI INDUSTRIES
SUMMARY OF CASH FLOWS
(unaudited)
| Nine Months Ended September 30, | |||||||||||
| 2025 | 2024 | ||||||||||
| (In thousands) | |||||||||||
| Cash flows from operating activities: | |||||||||||
| Net income | $ | 169,566 | $ | 133,320 | |||||||
| Adjustments to reconcile net income to cash flows provided by operating activities: | |||||||||||
| Depreciation and amortization | 90,350 | 96,000 | |||||||||
| Stock-based compensation expense | 16,868 | 13,961 | |||||||||
| Loss on extinguishment of debt | 8,859 | — | |||||||||
| Gain on sale of real estate | (19,716) | — | |||||||||
| Other non-cash items | 9,860 | 4,927 | |||||||||
| Changes in assets and liabilities, net of acquisitions of businesses: | |||||||||||
| Accounts receivable, net | (145,752) | (102,127) | |||||||||
| Inventories, net | 33,176 | 81,166 | |||||||||
| Prepaid expenses and other assets | 11,069 | (1,491) | |||||||||
| Accounts payable, trade | 24,333 | 8,333 | |||||||||
| Accrued expenses and other liabilities | 53,491 | 29,599 | |||||||||
| Net cash flows provided by operating activities | 252,104 | 263,688 | |||||||||
| Cash flows from investing activities: | |||||||||||
| Capital expenditures | (38,071) | (31,390) | |||||||||
| Acquisitions of businesses | (102,990) | (19,957) | |||||||||
| Proceeds from sale of real estate | 22,674 | — | |||||||||
| Other investing activities | (3,249) | 781 | |||||||||
| Net cash flows used in investing activities | (121,636) | (50,566) | |||||||||
| Cash flows from financing activities: | |||||||||||
| Vesting of stock-based awards, net of shares tendered for payment of taxes | (5,242) | (9,120) | |||||||||
| Proceeds from revolving credit facility | — | 86,248 | |||||||||
| Repayments under revolving credit facility | (19,261) | (87,766) | |||||||||
| Proceeds from term loan borrowings | 391,000 | — | |||||||||
| Repayments under term loan and other borrowings | (282,535) | (26,357) | |||||||||
| Proceeds from issuance of convertible notes | 448,500 | — | |||||||||
| Repurchase of convertible notes | (368,920) | — | |||||||||
| Purchases of convertible note hedge contracts | (67,574) | — | |||||||||
| Proceeds from issuance of warrants concurrent with note hedge contracts | 27,600 | — | |||||||||
| Payment of dividends | (86,215) | (80,191) | |||||||||
| Repurchases of common stock | (128,571) | — | |||||||||
| Other financing activities | (4,998) | (2) | |||||||||
| Net cash flows used in financing activities | (96,216) | (117,188) | |||||||||
| Effect of exchange rate changes on cash and cash equivalents | (287) | (907) | |||||||||
| Net increase in cash and cash equivalents | 33,965 | 95,027 | |||||||||
| Cash and cash equivalents at beginning of period | 165,756 | 66,157 | |||||||||
| Cash and cash equivalents at end of period | $ | 199,721 | $ | 161,184 | |||||||
LCI INDUSTRIES
SUPPLEMENTARY INFORMATION
(unaudited)
| Three Months Ended | Nine Months Ended | |||||||||||||||||||||||||||||||
| September 30, | September 30, | Last Twelve | ||||||||||||||||||||||||||||||
| 2025 | 2024 | 2025 | 2024 | Months | ||||||||||||||||||||||||||||
Industry Data(1) (in thousands of units): | ||||||||||||||||||||||||||||||||
| Industry Wholesale Production: | ||||||||||||||||||||||||||||||||
| Travel trailer and fifth-wheel RVs | 65.7 | 68.5 | 233.5 | 223.9 | 301.2 | |||||||||||||||||||||||||||
| Motorhome RVs | 8.9 | 7.7 | 27.6 | 26.9 | 35.6 | |||||||||||||||||||||||||||
| Industry Retail Sales: | ||||||||||||||||||||||||||||||||
| Travel trailer and fifth-wheel RVs | 88.9 | (2) | 87.8 | 252.2 | 252.3 | 307.6 | (2) | |||||||||||||||||||||||||
| Impact on dealer inventories | (23.2) | (2) | (19.3) | (18.7) | (28.4) | (6.4) | (2) | |||||||||||||||||||||||||
| Motorhome RVs | 9.9 | (2) | 10.4 | 29.7 | 32.1 | 37.6 | (2) | |||||||||||||||||||||||||
| Twelve Months Ended | ||||||||||||||||||||||||||||||||
| September 30, | ||||||||||||||||||||||||||||||||
| 2025 | 2024 | |||||||||||||||||||||||||||||||
| Lippert Content Per Industry Unit Produced: | ||||||||||||||||||||||||||||||||
| Travel trailer and fifth-wheel RV | $ | 5,431 | $ | 5,147 | ||||||||||||||||||||||||||||
| Motorhome RV | $ | 3,839 | $ | 3,768 | ||||||||||||||||||||||||||||
| September 30, | December 31, | |||||||||||||||||||||||||||||||
| 2025 | 2024 | 2024 | ||||||||||||||||||||||||||||||
Balance Sheet Data (debt availability in millions): | ||||||||||||||||||||||||||||||||
Remaining availability under the revolving credit facility (3) | $ | 595.2 | $ | 383.1 | $ | 452.5 | ||||||||||||||||||||||||||
| Days sales in accounts receivable, based on last twelve months | 29.4 | 30.6 | 29.9 | |||||||||||||||||||||||||||||
| Inventory turns, based on last twelve months | 4.2 | 3.9 | 4.0 | |||||||||||||||||||||||||||||
| 2025 | ||||||||||||||||||||||||||||||||
| Estimated Full Year Data: | ||||||||||||||||||||||||||||||||
| Capital expenditures | $45 - $55 million | |||||||||||||||||||||||||||||||
| Depreciation and amortization | $115 - $125 million | |||||||||||||||||||||||||||||||
| Stock-based compensation expense | $21 - $24 million | |||||||||||||||||||||||||||||||
Annual tax rate | 25% - 27% | |||||||||||||||||||||||||||||||
(1) Industry wholesale production data for travel trailer and fifth-wheel RVs and motorhome RVs provided by the Recreation Vehicle Industry Association. Industry retail sales data provided by Statistical Surveys, Inc.
(2) September 2025 retail sales data for RVs has not been published yet, therefore 2025 retail data for RVs includes an estimate for September 2025 retail units. Retail sales data will likely be revised upwards in future months as various states report.
(3) Remaining availability under the revolving credit facility is subject to covenant restrictions.
LCI INDUSTRIES
SUPPLEMENTARY INFORMATION
RECONCILIATION OF NON-GAAP MEASURES
(unaudited)
The following table reconciles net income to Adjusted EBITDA and net income as a percentage of net sales to Adjusted EBITDA as a percentage of net sales.
| Three Months Ended September 30, | Nine Months Ended September 30, | ||||||||||||||||||||||
| 2025 | 2024 | 2025 | 2024 | ||||||||||||||||||||
| (In thousands) | |||||||||||||||||||||||
| Net income | $ | 62,493 | $ | 35,612 | $ | 169,566 | $ | 133,320 | |||||||||||||||
| Interest expense, net | 10,323 | 6,516 | 26,003 | 23,799 | |||||||||||||||||||
| Provision for income taxes | 21,533 | 11,760 | 59,848 | 44,984 | |||||||||||||||||||
| Depreciation expense | 16,706 | 17,390 | 50,195 | 53,911 | |||||||||||||||||||
| Amortization expense | 13,779 | 13,882 | 40,155 | 42,089 | |||||||||||||||||||
| EBITDA | $ | 124,834 | $ | 85,160 | $ | 345,767 | $ | 298,103 | |||||||||||||||
| Loss on extinguishment of debt | 806 | — | 8,859 | — | |||||||||||||||||||
| Gain on sale of real estate | (19,716) | — | (19,716) | — | |||||||||||||||||||
| Executive separation costs | — | — | 3,193 | — | |||||||||||||||||||
| Adjusted EBITDA | $ | 105,924 | $ | 85,160 | $ | 338,103 | $ | 298,103 | |||||||||||||||
| Net sales | $ | 1,036,477 | $ | 915,497 | $ | 3,189,317 | $ | 2,938,070 | |||||||||||||||
| Net income as a percentage of net sales | 6.0 | % | 3.9 | % | 5.3 | % | 4.5 | % | |||||||||||||||
| Adjusted EBITDA as a percentage of net sales | 10.2 | % | 9.3 | % | 10.6 | % | 10.1 | % | |||||||||||||||
The following table reconciles net income to adjusted net income and net income per diluted share to adjusted net income per diluted share.
| Three Months Ended September 30, | Nine Months Ended September 30, | ||||||||||||||||||||||
| 2025 | 2024 | 2025 | 2024 | ||||||||||||||||||||
| (In thousands, except per share amounts) | |||||||||||||||||||||||
| Net income | $ | 62,493 | $ | 35,612 | $ | 169,566 | $ | 133,320 | |||||||||||||||
| Loss on extinguishment of debt | 806 | — | 8,859 | — | |||||||||||||||||||
| Gain on sale of real estate | (19,716) | — | (19,716) | — | |||||||||||||||||||
| Executive separation costs | — | — | 3,193 | — | |||||||||||||||||||
| Tax effect of adjustments | 4,531 | — | 1,836 | — | |||||||||||||||||||
| Adjusted net income | $ | 48,114 | $ | 35,612 | $ | 163,738 | $ | 133,320 | |||||||||||||||
| Net income per common share - diluted | $ | 2.55 | $ | 1.39 | $ | 6.78 | $ | 5.23 | |||||||||||||||
| Loss on extinguishment of debt | 0.03 | — | 0.35 | — | |||||||||||||||||||
| Gain on sale of real estate | (0.80) | — | (0.79) | — | |||||||||||||||||||
| Executive separation costs | — | — | 0.13 | — | |||||||||||||||||||
| Tax effect of adjustments | 0.19 | — | 0.08 | — | |||||||||||||||||||
| Adjusted net income per common share - diluted | $ | 1.97 | $ | 1.39 | $ | 6.55 | $ | 5.23 | |||||||||||||||
| Weighted average common shares outstanding - diluted | 24,466 | 25,558 | 25,004 | 25,477 | |||||||||||||||||||
In addition to reporting financial results in accordance with U.S. GAAP, the Company has provided the non-GAAP performance measures of Adjusted EBITDA, Adjusted EBITDA as a percentage of net sales, adjusted net income, and adjusted net income per diluted common share to illustrate and improve comparability of its results from period to period. Adjusted EBITDA is defined as net income before interest expense, net, provision for income taxes, depreciation expense, amortization expense, loss on extinguishment of debt, gain on sale of real estate, and executive separation costs during the three and nine month periods ended September 30, 2025 and 2024. Adjusted net income is defined as net income adjusted for loss on extinguishment of debt, gain on sale of real estate, and executive separation costs, and the related tax effects during the three and nine month periods ended September 30, 2025. The Company considers these non-GAAP measures in evaluating and managing the Company's operations and believes that discussion of results adjusted for these items is meaningful to investors because it provides a useful analysis of ongoing underlying operating trends. These measures are not in accordance with, nor are they substitutes for, GAAP measures, and they may not be comparable to similarly titled measures used by other companies.

Q 3 2 0 2 5 E a r n i n g s C o n f e r e n c e C a l l 1 0 . 3 0 . 2 0 2 5
This presentation contains certain “forward-looking statements” with respect to our financial condition, results of operations, profitability, margin growth, business strategies, operating efficiencies or synergies, competitive position, growth opportunities, acquisitions, plans and objectives of management, markets for the Company’s common stock, the impact of legal proceedings, and other matters. Statements in this presentation that are not historical facts are “forward-looking statements” for the purpose of the safe harbor provided by Section 21E of the Securities Exchange Act of 1934, as amended, and Section 27A of the Securities Act of 1933, as amended, and involve a number of risks and uncertainties. Forward-looking statements, including, without limitation, those relating to the Company's production levels, future business prospects, net sales, expenses and income (loss), capital expenditures, tax rate, cash flow, financial condition, liquidity, covenant compliance, growth strategy, retail and wholesale demand and shipments, run rates, integration of acquisitions, planned divestitures and facility consolidations, R&D investments, commodity prices, addressable markets, and industry trends, whenever they occur in this presentation are necessarily estimates reflecting the best judgment of the Company's senior management at the time such statements were made. There are a number of factors, many of which are beyond the Company’s control, which could cause actual results and events to differ materially from those described in the forward-looking statements. These factors include, in addition to other matters described in this presentation, the impacts of costs and availability of, and tariffs on, raw materials (particularly steel and aluminum) and other components, future pandemics, geopolitical tensions, armed conflicts, or natural disasters on the global economy and on the Company's customers, suppliers, team members, business and cash flows, pricing pressures due to domestic and foreign competition, seasonality and cyclicality in the industries to which we sell our products, availability of credit for financing the retail and wholesale purchase of products for which we sell our components, inventory levels of retail dealers and manufacturers, availability of transportation for products for which we sell our components, the financial condition of our customers, the financial condition of retail dealers of products for which we sell our components, retention and concentration of significant customers, the costs, pace and successful integration of acquisitions and other growth initiatives, availability and costs of production facilities and labor, team member benefits, team member retention, realization and impact of expansion plans, efficiency improvements and cost reductions, the disruption of business resulting from natural disasters or other unforeseen events, the successful entry into new markets, the costs of compliance with environmental laws, laws of foreign jurisdictions in which we operate, other operational and financial risks related to conducting business internationally, and increased governmental regulation and oversight, information technology performance and security, the ability to protect intellectual property, warranty and product liability claims or product recalls, interest rates, oil and gasoline prices and availability, the impact of international, national and regional economic conditions and consumer confidence on the retail sale of products for which we sell our components, and other risks and uncertainties discussed more fully under the caption “Risk Factors” in the Company’s Annual Report on Form 10-K for the year ended December 31, 2024, and in the Company’s subsequent filings with the Securities and Exchange Commission, including the Company's Quarterly Reports on Form 10-Q. Readers of this presentation are cautioned not to place undue reliance on these forward-looking statements, since there can be no assurance that these forward-looking statements will prove to be accurate. The Company disclaims any obligation or undertaking to update forward-looking statements to reflect circumstances or events that occur after the date the forward-looking statements are made, except as required by law. This presentation includes certain non-GAAP financial measures, such as adjusted net income, adjusted net income per diluted share, adjusted EBITDA, adjusted EBITDA as a percentage of net sales, net debt to EBITDA leverage, and free cash flow. These non-GAAP financial measures should not be considered a substitute for the comparable GAAP financial measures. Reconciliations of these non-GAAP financial measures to the most directly comparable GAAP financial measure are included in the presentation. 2 Forward-Looking Statements
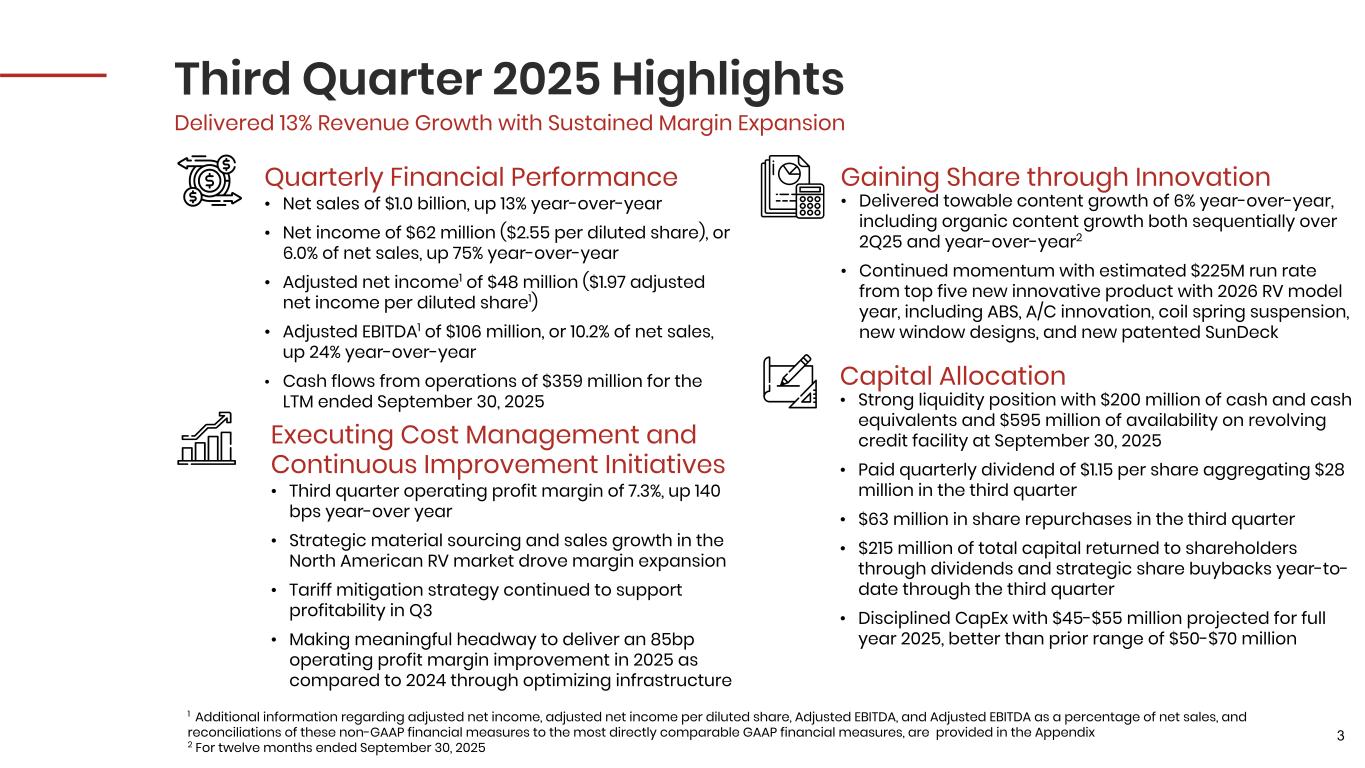
Delivered 13% Revenue Growth with Sustained Margin Expansion Executing Cost Management and Continuous Improvement Initiatives • Third quarter operating profit margin of 7.3%, up 140 bps year-over year • Strategic material sourcing and sales growth in the North American RV market drove margin expansion • Tariff mitigation strategy continued to support profitability in Q3 • Making meaningful headway to deliver an 85bp operating profit margin improvement in 2025 as compared to 2024 through optimizing infrastructure Quarterly Financial Performance • Net sales of $1.0 billion, up 13% year-over-year • Net income of $62 million ($2.55 per diluted share), or 6.0% of net sales, up 75% year-over-year • Adjusted net income1 of $48 million ($1.97 adjusted net income per diluted share1) • Adjusted EBITDA1 of $106 million, or 10.2% of net sales, up 24% year-over-year • Cash flows from operations of $359 million for the LTM ended September 30, 2025 Gaining Share through Innovation • Delivered towable content growth of 6% year-over-year, including organic content growth both sequentially over 2Q25 and year-over-year2 • Continued momentum with estimated $225M run rate from top five new innovative product with 2026 RV model year, including ABS, A/C innovation, coil spring suspension, new window designs, and new patented SunDeck 3 1 Additional information regarding adjusted net income, adjusted net income per diluted share, Adjusted EBITDA, and Adjusted EBITDA as a percentage of net sales, and reconciliations of these non-GAAP financial measures to the most directly comparable GAAP financial measures, are provided in the Appendix 2 For twelve months ended September 30, 2025 Capital Allocation • Strong liquidity position with $200 million of cash and cash equivalents and $595 million of availability on revolving credit facility at September 30, 2025 • Paid quarterly dividend of $1.15 per share aggregating $28 million in the third quarter • $63 million in share repurchases in the third quarter • $215 million of total capital returned to shareholders through dividends and strategic share buybacks year-to- date through the third quarter • Disciplined CapEx with $45-$55 million projected for full year 2025, better than prior range of $50-$70 million Third Quarter 2025 Highlights
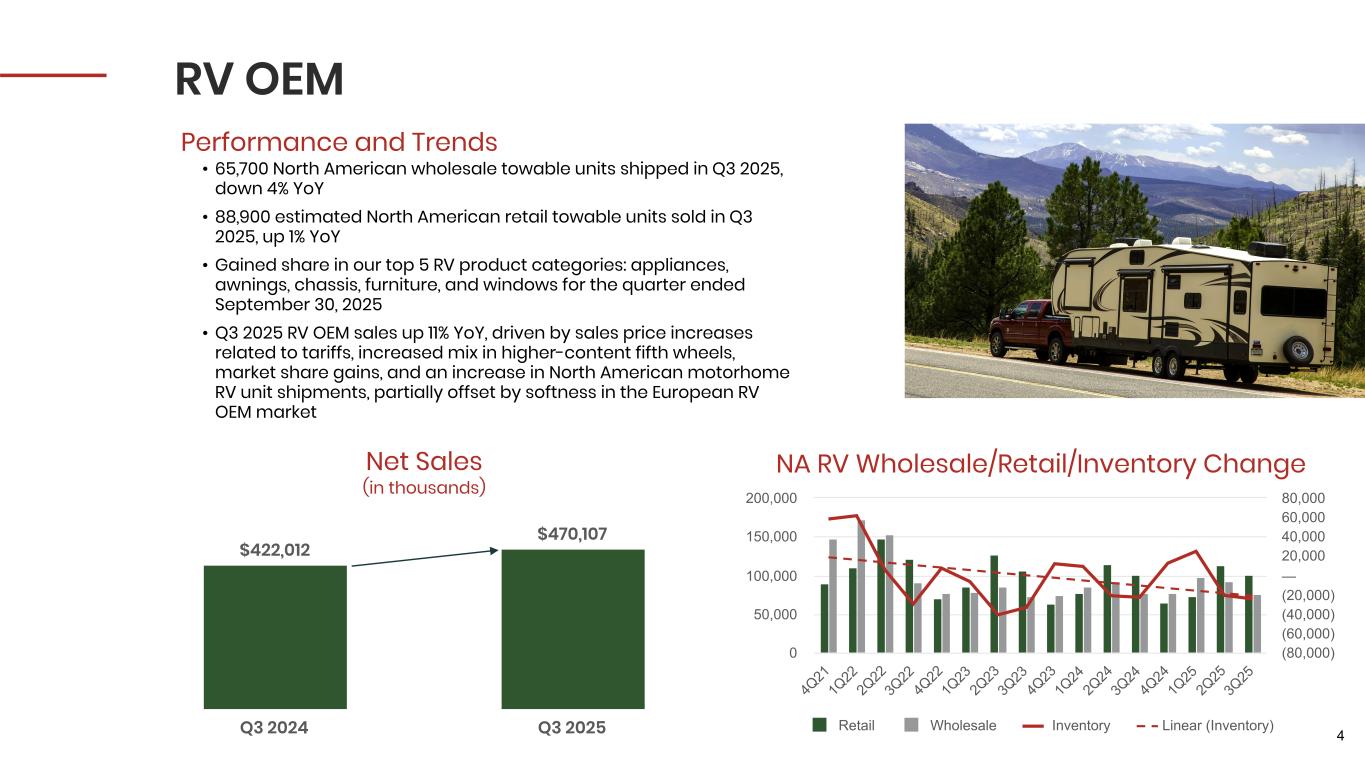
4 RV OEM Performance and Trends • 65,700 North American wholesale towable units shipped in Q3 2025, down 4% YoY • 88,900 estimated North American retail towable units sold in Q3 2025, up 1% YoY • Gained share in our top 5 RV product categories: appliances, awnings, chassis, furniture, and windows for the quarter ended September 30, 2025 • Q3 2025 RV OEM sales up 11% YoY, driven by sales price increases related to tariffs, increased mix in higher-content fifth wheels, market share gains, and an increase in North American motorhome RV unit shipments, partially offset by softness in the European RV OEM market Net Sales (in thousands) $422,012 $470,107 Q3 2024 Q3 2025 NA RV Wholesale/Retail/Inventory Change Retail Wholesale Inventory Linear (Inventory) 4Q 21 1Q 22 2Q 22 3Q 22 4Q 22 1Q 23 2Q 23 3Q 23 4Q 23 1Q 24 2Q 24 3Q 24 4Q 24 1Q 25 2Q 25 3Q 25 0 50,000 100,000 150,000 200,000 (80,000) (60,000) (40,000) (20,000) — 20,000 40,000 60,000 80,000
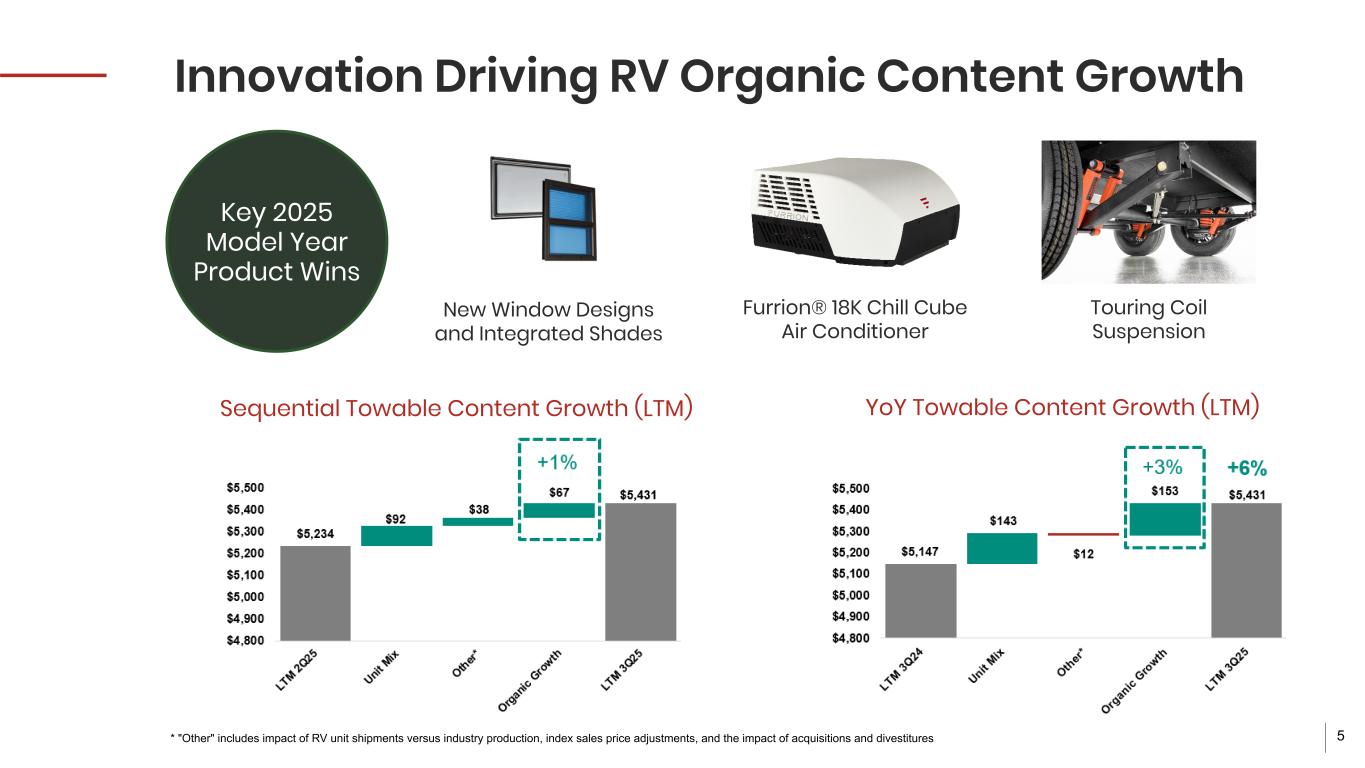
Touring Coil Suspension Furrion® 18K Chill Cube Air Conditioner * "Other" includes impact of RV unit shipments versus industry production, index sales price adjustments, and the impact of acquisitions and divestitures New Window Designs and Integrated Shades Innovation Driving RV Organic Content Growth Sequential Towable Content Growth (LTM) YoY Towable Content Growth (LTM) Key 2025 Model Year Product Wins 5
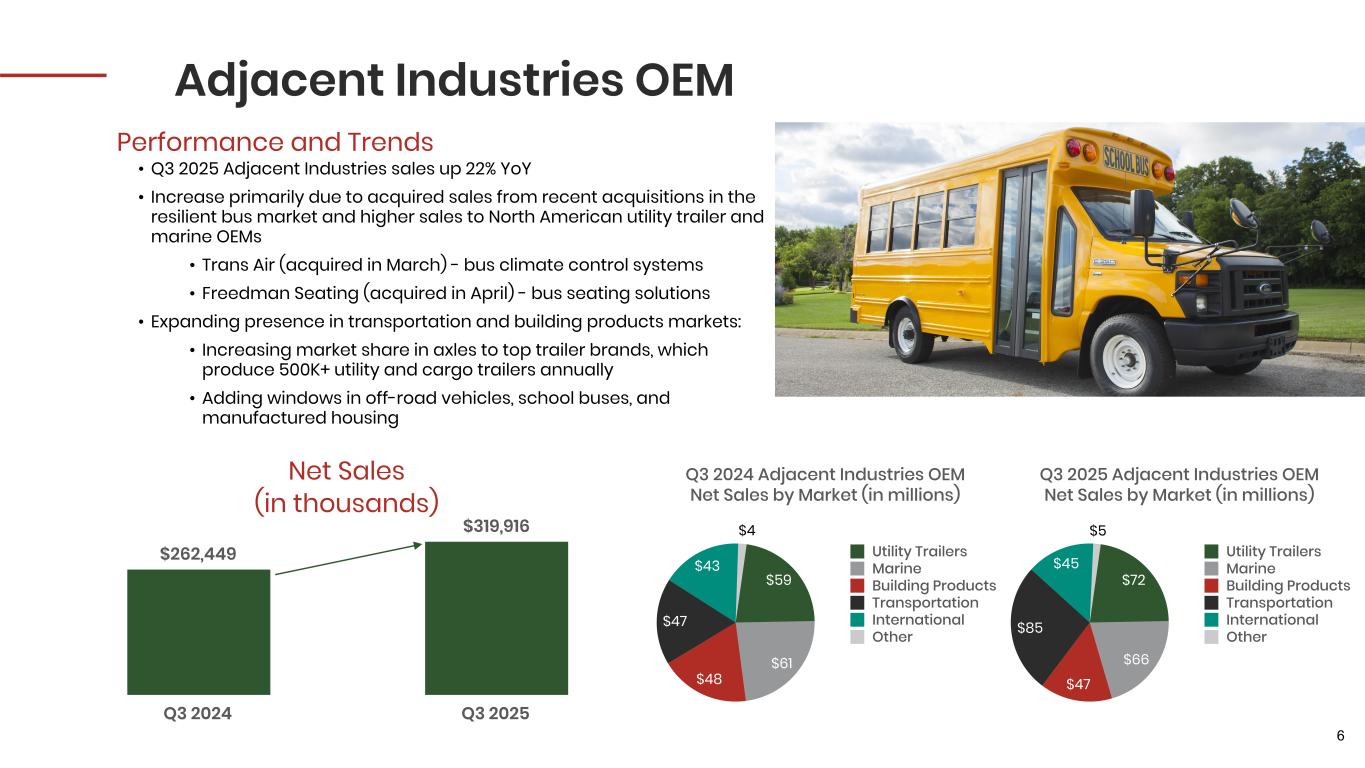
6 Adjacent Industries OEM Performance and Trends • Q3 2025 Adjacent Industries sales up 22% YoY • Increase primarily due to acquired sales from recent acquisitions in the resilient bus market and higher sales to North American utility trailer and marine OEMs • Trans Air (acquired in March) - bus climate control systems • Freedman Seating (acquired in April) - bus seating solutions • Expanding presence in transportation and building products markets: • Increasing market share in axles to top trailer brands, which produce 500K+ utility and cargo trailers annually • Adding windows in off-road vehicles, school buses, and manufactured housing Net Sales (in thousands) $262,449 $319,916 Q3 2024 Q3 2025 Q3 2025 Adjacent Industries OEM Net Sales by Market (in millions) $72 $66 $47 $85 $45 $5 Utility Trailers Marine Building Products Transportation International Other Q3 2024 Adjacent Industries OEM Net Sales by Market (in millions) $59 $61 $48 $47 $43 $4 Utility Trailers Marine Building Products Transportation International Other
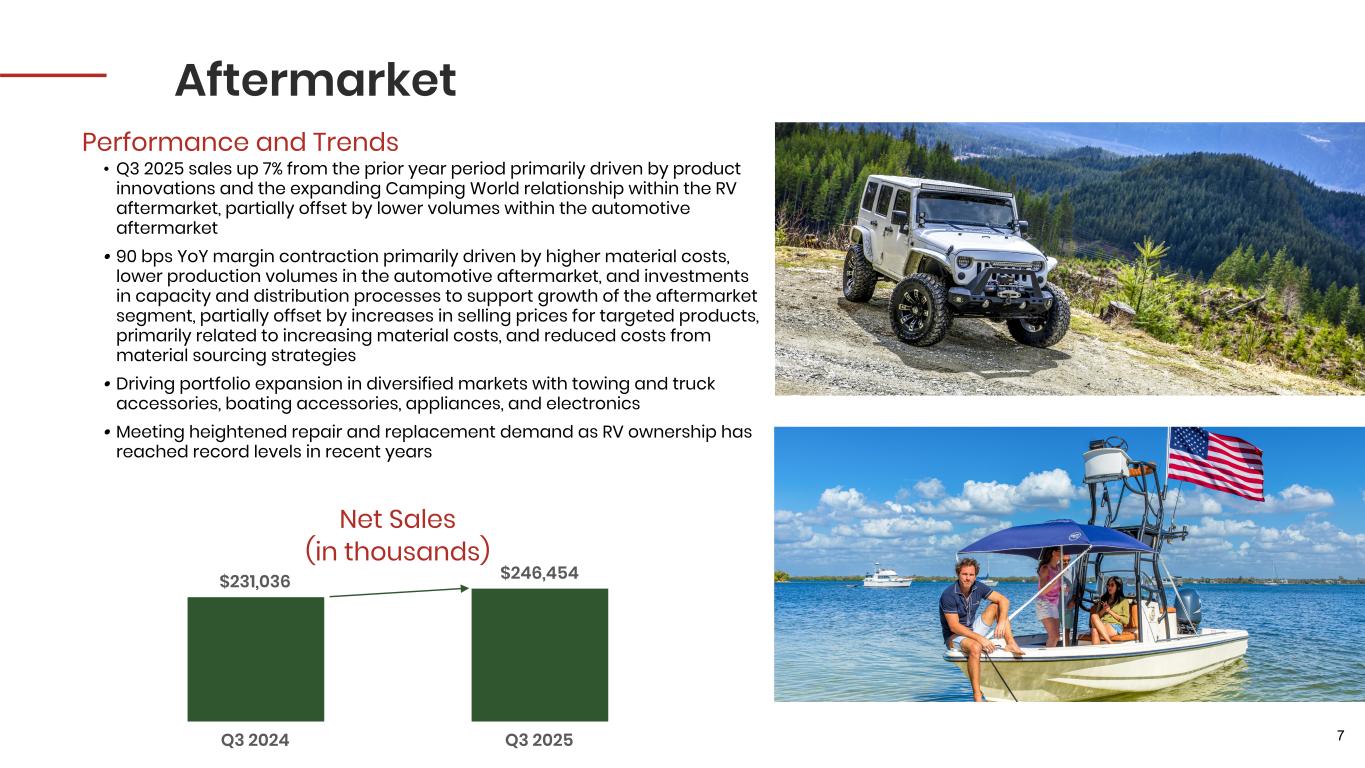
7 Aftermarket Performance and Trends • Q3 2025 sales up 7% from the prior year period primarily driven by product innovations and the expanding Camping World relationship within the RV aftermarket, partially offset by lower volumes within the automotive aftermarket • 90 bps YoY margin contraction primarily driven by higher material costs, lower production volumes in the automotive aftermarket, and investments in capacity and distribution processes to support growth of the aftermarket segment, partially offset by increases in selling prices for targeted products, primarily related to increasing material costs, and reduced costs from material sourcing strategies • Driving portfolio expansion in diversified markets with towing and truck accessories, boating accessories, appliances, and electronics • Meeting heightened repair and replacement demand as RV ownership has reached record levels in recent years Net Sales (in thousands) $231,036 $246,454 Q3 2024 Q3 2025
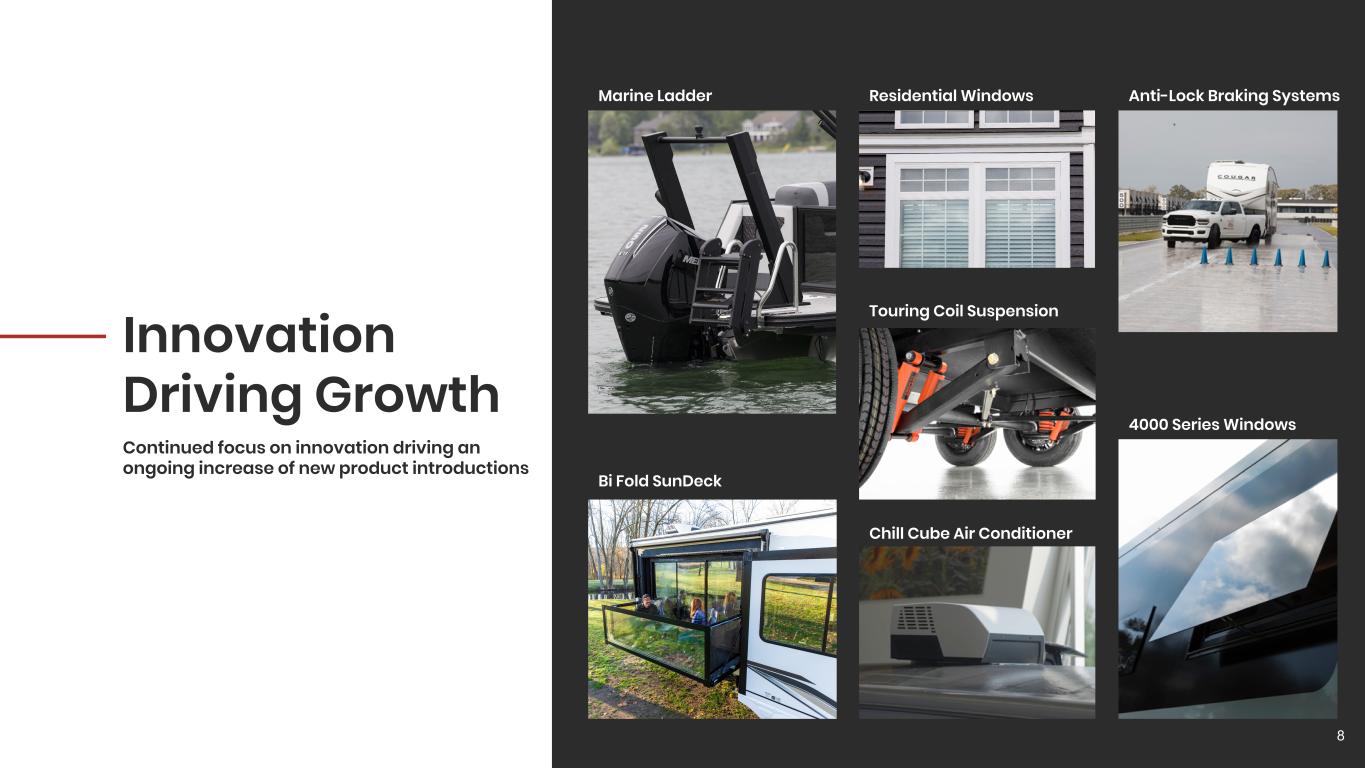
8 Innovation Driving Growth Continued focus on innovation driving an ongoing increase of new product introductions Marine Ladder Bi Fold SunDeck Anti-Lock Braking Systems 4000 Series Windows Chill Cube Air Conditioner Touring Coil Suspension Residential Windows
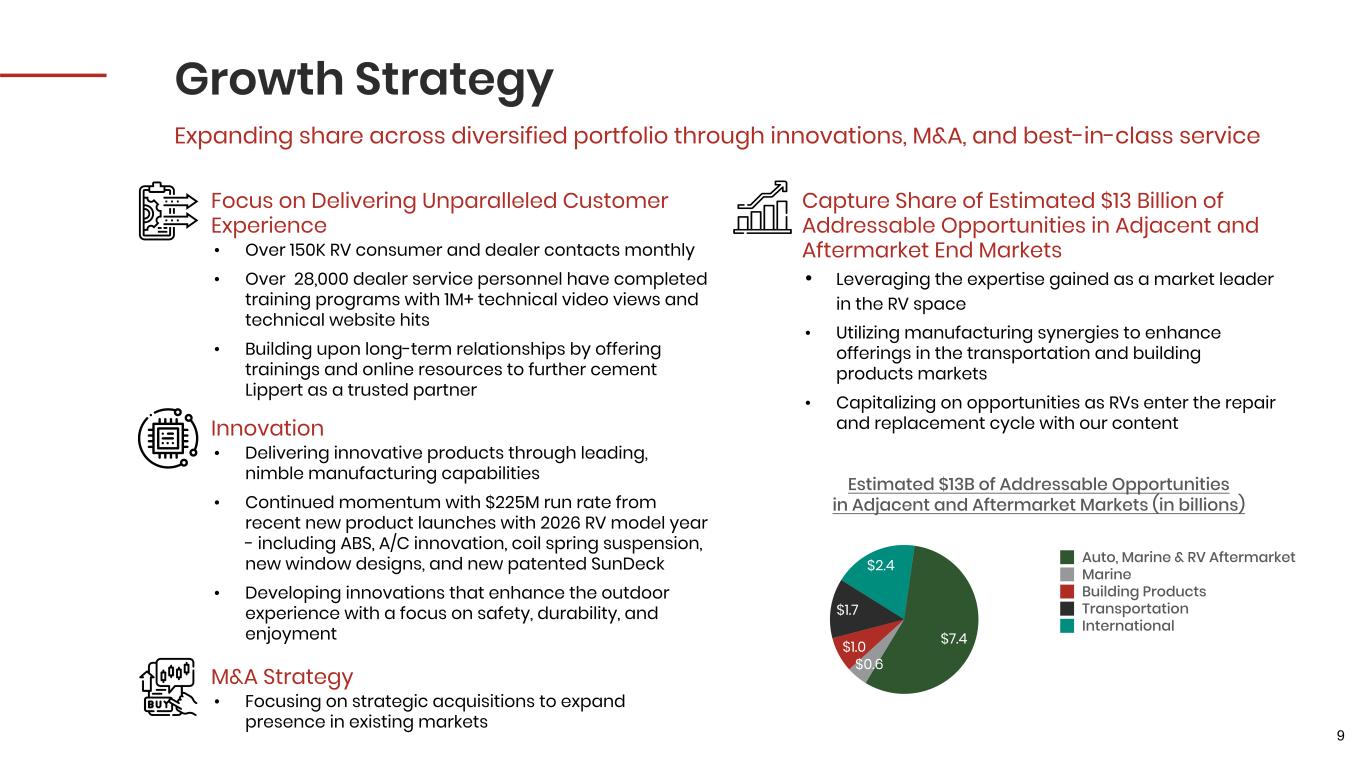
9 Capture Share of Estimated $13 Billion of Addressable Opportunities in Adjacent and Aftermarket End Markets • Leveraging the expertise gained as a market leader in the RV space • Utilizing manufacturing synergies to enhance offerings in the transportation and building products markets • Capitalizing on opportunities as RVs enter the repair and replacement cycle with our content Growth Strategy Expanding share across diversified portfolio through innovations, M&A, and best-in-class service Focus on Delivering Unparalleled Customer Experience • Over 150K RV consumer and dealer contacts monthly • Over 28,000 dealer service personnel have completed training programs with 1M+ technical video views and technical website hits • Building upon long-term relationships by offering trainings and online resources to further cement Lippert as a trusted partner M&A Strategy • Focusing on strategic acquisitions to expand presence in existing markets Estimated $13B of Addressable Opportunities in Adjacent and Aftermarket Markets (in billions) $7.4 $0.6 $1.0 $1.7 $2.4 Auto, Marine & RV Aftermarket Marine Building Products Transportation International Innovation • Delivering innovative products through leading, nimble manufacturing capabilities • Continued momentum with $225M run rate from recent new product launches with 2026 RV model year - including ABS, A/C innovation, coil spring suspension, new window designs, and new patented SunDeck • Developing innovations that enhance the outdoor experience with a focus on safety, durability, and enjoyment
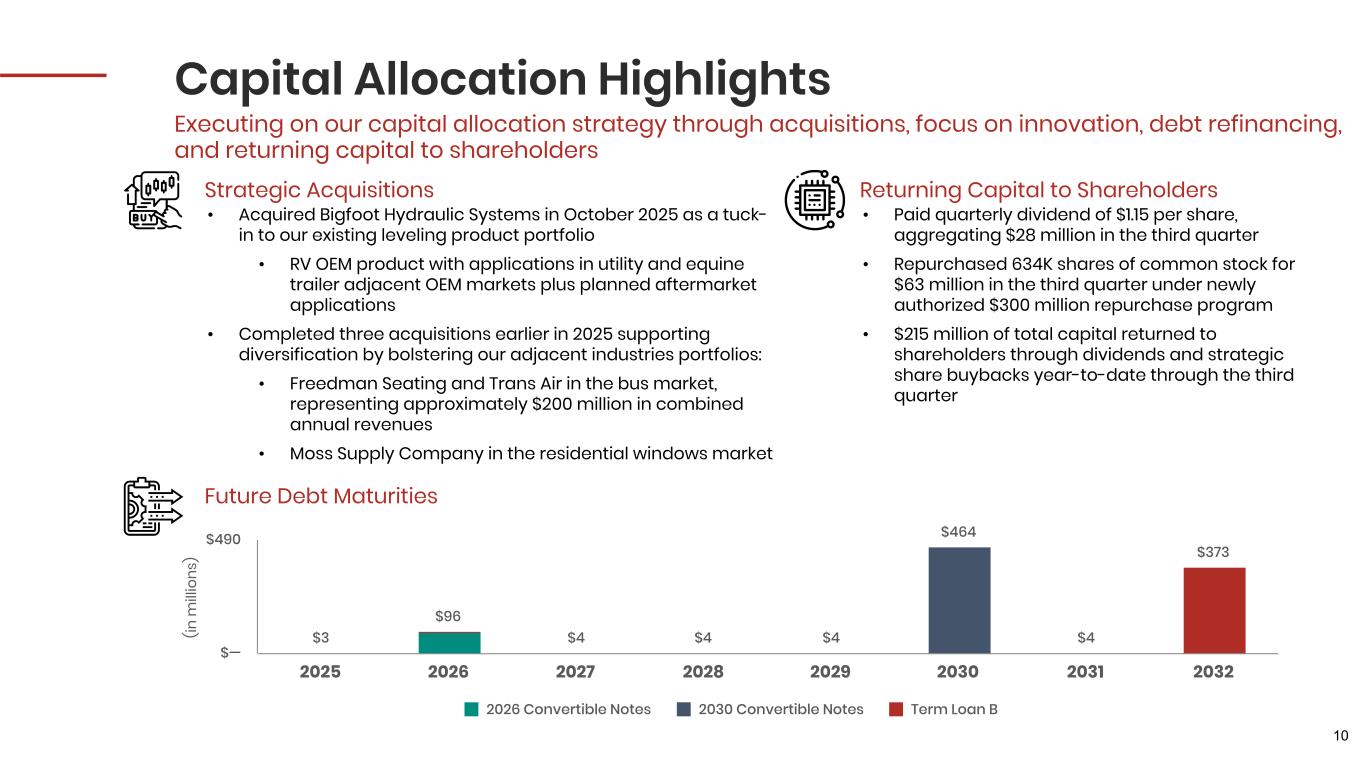
10 Strategic Acquisitions • Acquired Bigfoot Hydraulic Systems in October 2025 as a tuck- in to our existing leveling product portfolio • RV OEM product with applications in utility and equine trailer adjacent OEM markets plus planned aftermarket applications • Completed three acquisitions earlier in 2025 supporting diversification by bolstering our adjacent industries portfolios: • Freedman Seating and Trans Air in the bus market, representing approximately $200 million in combined annual revenues • Moss Supply Company in the residential windows market Capital Allocation Highlights Executing on our capital allocation strategy through acquisitions, focus on innovation, debt refinancing, and returning capital to shareholders Returning Capital to Shareholders • Paid quarterly dividend of $1.15 per share, aggregating $28 million in the third quarter • Repurchased 634K shares of common stock for $63 million in the third quarter under newly authorized $300 million repurchase program • $215 million of total capital returned to shareholders through dividends and strategic share buybacks year-to-date through the third quarter (in m ill io ns ) $3 $96 $4 $4 $4 $464 $4 $373 2026 Convertible Notes 2030 Convertible Notes Term Loan B 2025 2026 2027 2028 2029 2030 2031 2032 $— $490 Future Debt Maturities
11 Q3 2025 Financial Performance Operating Margin 5.9% 7.3% Third Quarter 2024 Third Quarter 2025 (in th ou sa nd s) Consolidated Net Income $35,612 $62,493 Third Quarter 2024 Third Quarter 2025 (in th ou sa nd s) Adjusted EBITDA* $85,160 $105,924 Third Quarter 2024 Third Quarter 2025 * Additional information regarding Adjusted EBITDA, as well as reconciliation of this non-GAAP financial measure to the most directly comparable GAAP financial measure, is provided in the Appendix. (in th ou sa nd s) Consolidated Net Sales $915,497 $1,036,477 Third Quarter 2024 Third Quarter 2025 +13% +140 bps +24%+75%
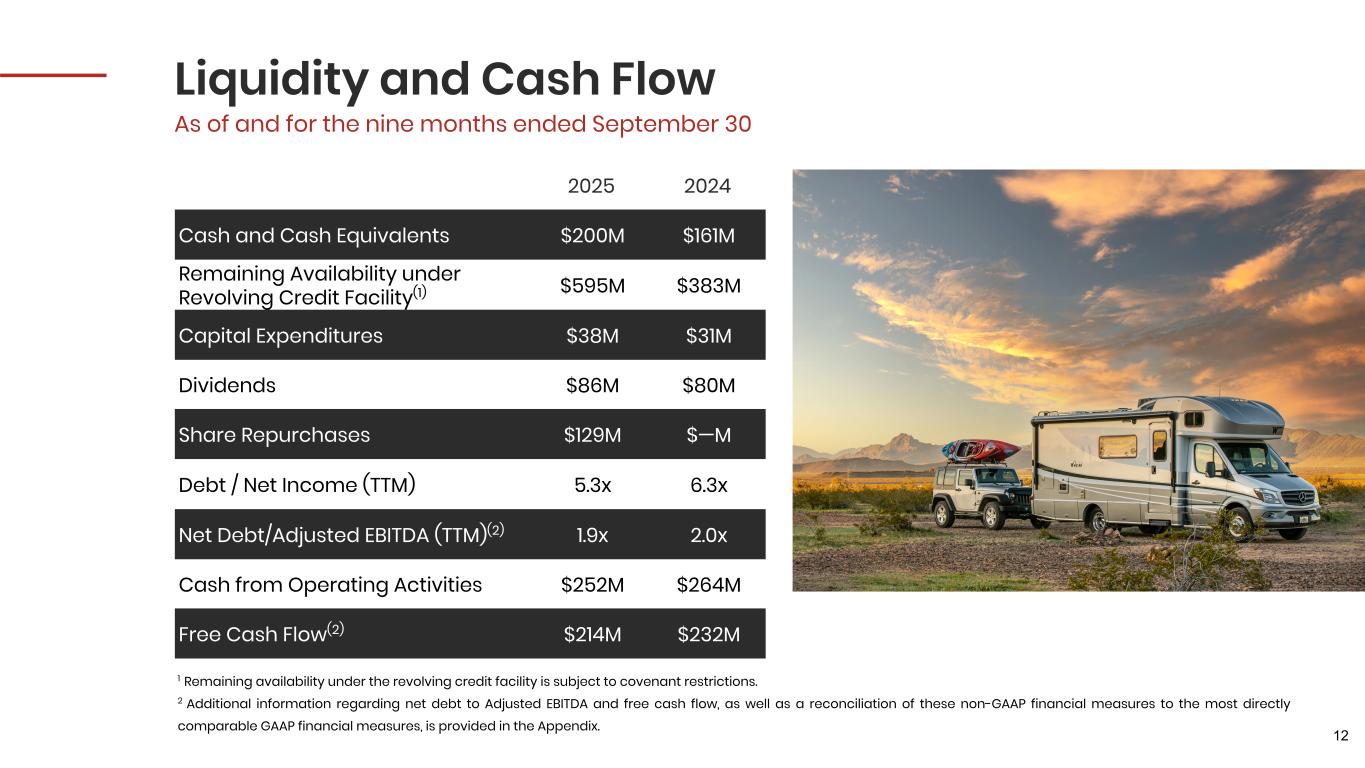
12 Liquidity and Cash Flow As of and for the nine months ended September 30 2025 2024 Cash and Cash Equivalents $200M $161M Remaining Availability under Revolving Credit Facility(1) $595M $383M Capital Expenditures $38M $31M Dividends $86M $80M Share Repurchases $129M $—M Debt / Net Income (TTM) 5.3x 6.3x Net Debt/Adjusted EBITDA (TTM)(2) 1.9x 2.0x Cash from Operating Activities $252M $264M Free Cash Flow(2) $214M $232M 1 Remaining availability under the revolving credit facility is subject to covenant restrictions. 2 Additional information regarding net debt to Adjusted EBITDA and free cash flow, as well as a reconciliation of these non-GAAP financial measures to the most directly comparable GAAP financial measures, is provided in the Appendix.
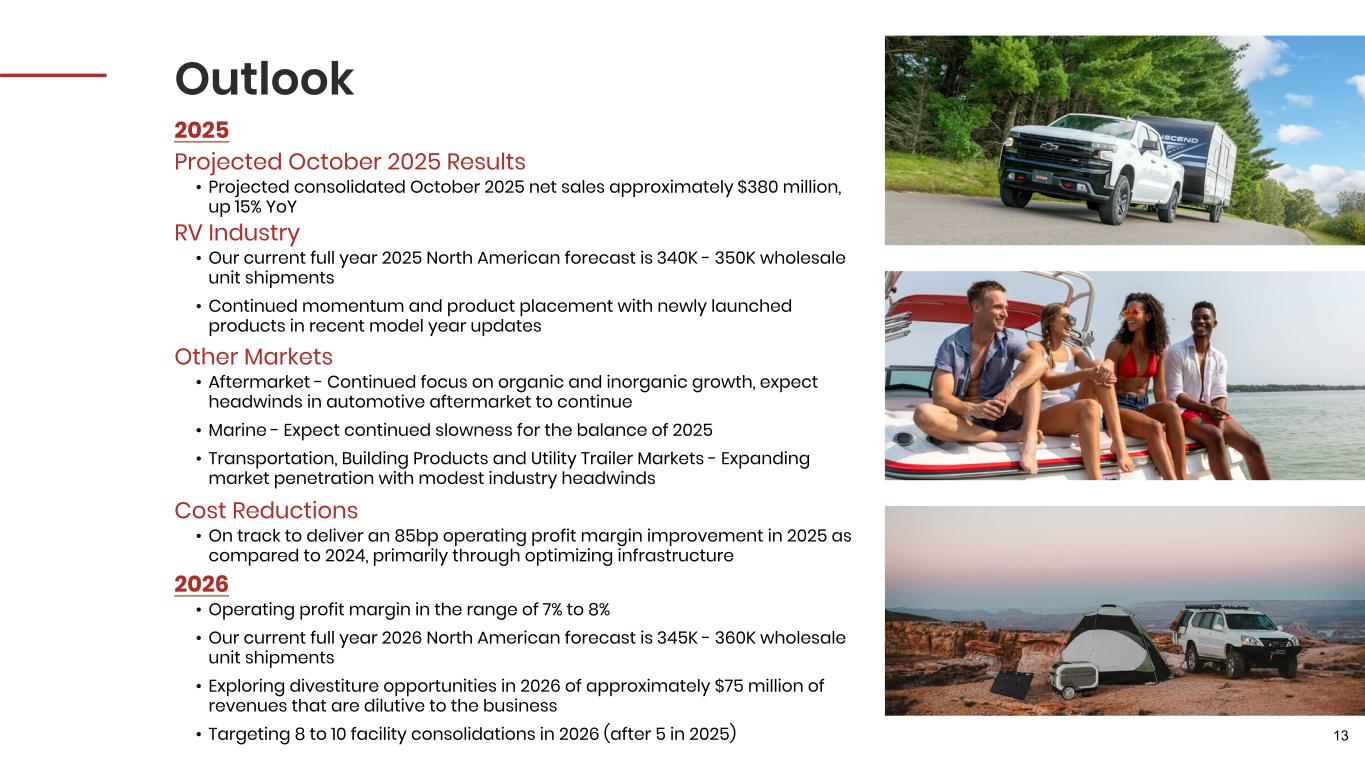
13 Outlook RV Industry • Our current full year 2025 North American forecast is 340K - 350K wholesale unit shipments • Continued momentum and product placement with newly launched products in recent model year updates Other Markets • Aftermarket - Continued focus on organic and inorganic growth, expect headwinds in automotive aftermarket to continue • Marine - Expect continued slowness for the balance of 2025 • Transportation, Building Products and Utility Trailer Markets - Expanding market penetration with modest industry headwinds Cost Reductions • On track to deliver an 85bp operating profit margin improvement in 2025 as compared to 2024, primarily through optimizing infrastructure 2025 2026 • Operating profit margin in the range of 7% to 8% • Our current full year 2026 North American forecast is 345K - 360K wholesale unit shipments • Exploring divestiture opportunities in 2026 of approximately $75 million of revenues that are dilutive to the business • Targeting 8 to 10 facility consolidations in 2026 (after 5 in 2025) Projected October 2025 Results • Projected consolidated October 2025 net sales approximately $380 million, up 15% YoY
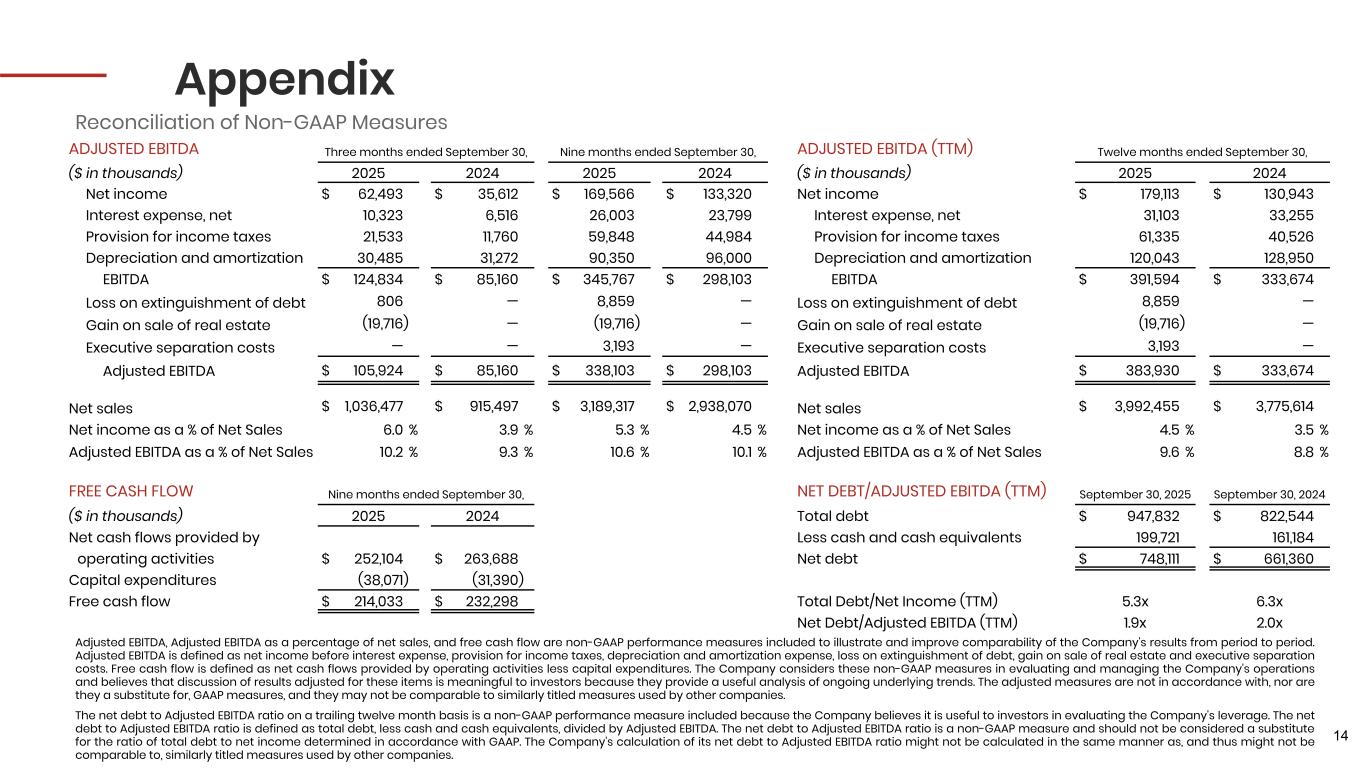
14 Appendix Reconciliation of Non-GAAP Measures ADJUSTED EBITDA Three months ended September 30, Nine months ended September 30, ADJUSTED EBITDA (TTM) Twelve months ended September 30, ($ in thousands) 2025 2024 2025 2024 ($ in thousands) 2025 2024 Net income $ 62,493 $ 35,612 $ 169,566 $ 133,320 Net income $ 179,113 $ 130,943 Interest expense, net 10,323 6,516 26,003 23,799 Interest expense, net 31,103 33,255 Provision for income taxes 21,533 11,760 59,848 44,984 Provision for income taxes 61,335 40,526 Depreciation and amortization 30,485 31,272 90,350 96,000 Depreciation and amortization 120,043 128,950 EBITDA $ 124,834 $ 85,160 $ 345,767 $ 298,103 EBITDA $ 391,594 $ 333,674 Loss on extinguishment of debt 806 — 8,859 — Loss on extinguishment of debt 8,859 — Gain on sale of real estate (19,716) — (19,716) — Gain on sale of real estate (19,716) — Executive separation costs — — 3,193 — Executive separation costs 3,193 — Adjusted EBITDA $ 105,924 $ 85,160 $ 338,103 $ 298,103 Adjusted EBITDA $ 383,930 $ 333,674 Net sales $ 1,036,477 $ 915,497 $ 3,189,317 $ 2,938,070 Net sales $ 3,992,455 $ 3,775,614 Net income as a % of Net Sales 6.0 % 3.9 % 5.3 % 4.5 % Net income as a % of Net Sales 4.5 % 3.5 % Adjusted EBITDA as a % of Net Sales 10.2 % 9.3 % 10.6 % 10.1 % Adjusted EBITDA as a % of Net Sales 9.6 % 8.8 % FREE CASH FLOW Nine months ended September 30, NET DEBT/ADJUSTED EBITDA (TTM) September 30, 2025 September 30, 2024 ($ in thousands) 2025 2024 Total debt $ 947,832 $ 822,544 Net cash flows provided by Less cash and cash equivalents 199,721 161,184 operating activities $ 252,104 $ 263,688 Net debt $ 748,111 $ 661,360 Capital expenditures (38,071) (31,390) Free cash flow $ 214,033 $ 232,298 Total Debt/Net Income (TTM) 5.3x 6.3x Net Debt/Adjusted EBITDA (TTM) 1.9x 2.0x Adjusted EBITDA, Adjusted EBITDA as a percentage of net sales, and free cash flow are non-GAAP performance measures included to illustrate and improve comparability of the Company's results from period to period. Adjusted EBITDA is defined as net income before interest expense, provision for income taxes, depreciation and amortization expense, loss on extinguishment of debt, gain on sale of real estate and executive separation costs. Free cash flow is defined as net cash flows provided by operating activities less capital expenditures. The Company considers these non-GAAP measures in evaluating and managing the Company's operations and believes that discussion of results adjusted for these items is meaningful to investors because they provide a useful analysis of ongoing underlying trends. The adjusted measures are not in accordance with, nor are they a substitute for, GAAP measures, and they may not be comparable to similarly titled measures used by other companies. The net debt to Adjusted EBITDA ratio on a trailing twelve month basis is a non-GAAP performance measure included because the Company believes it is useful to investors in evaluating the Company's leverage. The net debt to Adjusted EBITDA ratio is defined as total debt, less cash and cash equivalents, divided by Adjusted EBITDA. The net debt to Adjusted EBITDA ratio is a non-GAAP measure and should not be considered a substitute for the ratio of total debt to net income determined in accordance with GAAP. The Company's calculation of its net debt to Adjusted EBITDA ratio might not be calculated in the same manner as, and thus might not be comparable to, similarly titled measures used by other companies.
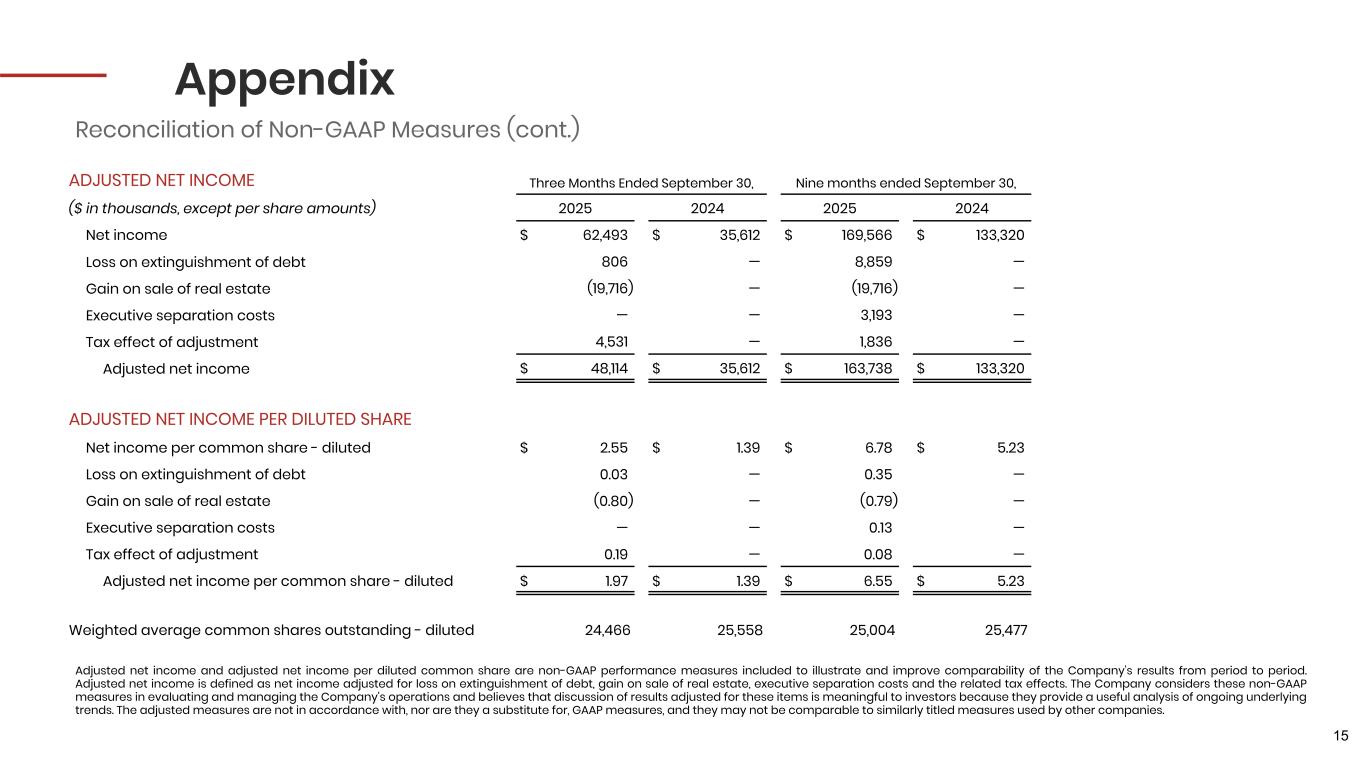
15 Appendix Reconciliation of Non-GAAP Measures (cont.) ADJUSTED NET INCOME Three Months Ended September 30, Nine months ended September 30, ($ in thousands, except per share amounts) 2025 2024 2025 2024 Net income $ 62,493 $ 35,612 $ 169,566 $ 133,320 Loss on extinguishment of debt 806 — 8,859 — Gain on sale of real estate (19,716) — (19,716) — Executive separation costs — — 3,193 — Tax effect of adjustment 4,531 — 1,836 — Adjusted net income $ 48,114 $ 35,612 $ 163,738 $ 133,320 ADJUSTED NET INCOME PER DILUTED SHARE Net income per common share - diluted $ 2.55 $ 1.39 $ 6.78 $ 5.23 Loss on extinguishment of debt 0.03 — 0.35 — Gain on sale of real estate (0.80) — (0.79) — Executive separation costs — — 0.13 — Tax effect of adjustment 0.19 — 0.08 — Adjusted net income per common share - diluted $ 1.97 $ 1.39 $ 6.55 $ 5.23 Weighted average common shares outstanding - diluted 24,466 25,558 25,004 25,477 Adjusted net income and adjusted net income per diluted common share are non-GAAP performance measures included to illustrate and improve comparability of the Company's results from period to period. Adjusted net income is defined as net income adjusted for loss on extinguishment of debt, gain on sale of real estate, executive separation costs and the related tax effects. The Company considers these non-GAAP measures in evaluating and managing the Company's operations and believes that discussion of results adjusted for these items is meaningful to investors because they provide a useful analysis of ongoing underlying trends. The adjusted measures are not in accordance with, nor are they a substitute for, GAAP measures, and they may not be comparable to similarly titled measures used by other companies.
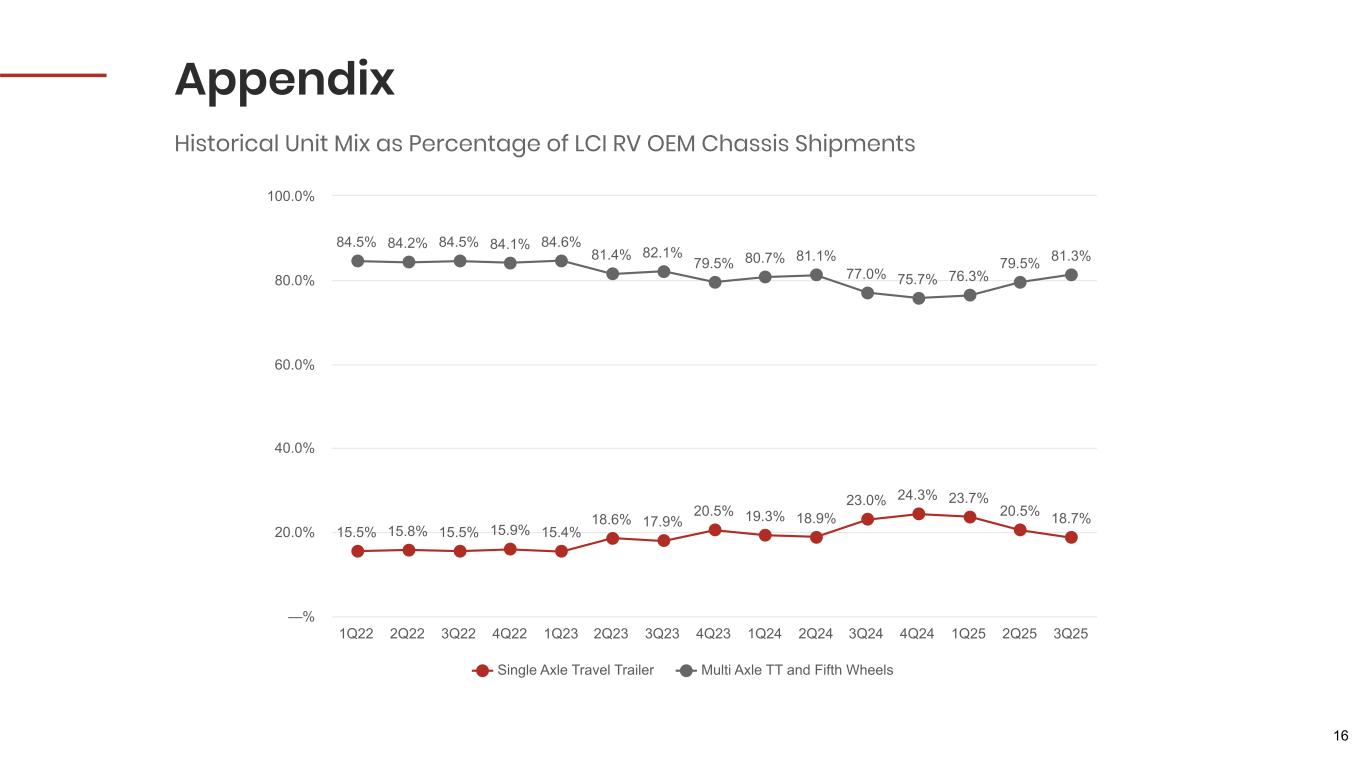
16 Appendix Historical Unit Mix as Percentage of LCI RV OEM Chassis Shipments 15.5% 15.8% 15.5% 15.9% 15.4% 18.6% 17.9% 20.5% 19.3% 18.9% 23.0% 24.3% 23.7% 20.5% 18.7% 84.5% 84.2% 84.5% 84.1% 84.6% 81.4% 82.1% 79.5% 80.7% 81.1% 77.0% 75.7% 76.3% 79.5% 81.3% Single Axle Travel Trailer Multi Axle TT and Fifth Wheels 1Q22 2Q22 3Q22 4Q22 1Q23 2Q23 3Q23 4Q23 1Q24 2Q24 3Q24 4Q24 1Q25 2Q25 3Q25 —% 20.0% 40.0% 60.0% 80.0% 100.0%
Q&A