
LFUS 8-K
Littelfuse Inc /De (LFUS)
8-K
2026-01-28
For: 2026-01-28
View Original
Added on
April 10, 2026
UNITED STATES
SECURITIES AND EXCHANGE COMMISSION
WASHINGTON, D.C. 20579
FORM 8-K
CURRENT REPORT
PURSUANT TO SECTION 13 OR 15(d) OF THE SECURITIES EXCHANGE ACT OF 1934
Date of Report: January 28, 2026
(Date of earliest event reported)
LITTELFUSE, INC.
(Exact name of registrant as specified in its charter)
| (State of other jurisdiction of incorporation) | (Commission File Number) | (IRS Employer Identification No.) | ||||||
(Address of principal executive offices) (Zip Code)
Registrant’s telephone number, including area code: (773 ) 628-1000
Check the appropriate box below if the Form 8-K filing is intended to simultaneously satisfy the filing obligation of the registrant under any of the following provisions:
| Written communications pursuant to Rule 425 under the Securities Act (17 CFR 230.425) | |||||
| Soliciting material pursuant to Rule 14a-12 under the Exchange Act (17 CFR 240.14a-12) | |||||
| Pre-commencement communications pursuant to Rule 14d-2(b) under the Exchange Act (17 CFR 240.14d-2(b)) | |||||
| Pre-commencement communications pursuant to Rule 13e-4(c) under the Exchange Act (17 CFR 240.13e-4(c)) | |||||
Securities registered pursuant to Section 12(b) of the Act:
| Title of Each Class | Trading Symbol | Name of exchange on which registered | ||||||||||||
Indicate by check mark whether the registrant is an emerging growth company as defined in Rule 405 of the Securities Act of 1933 (17 CFR §230.405) or Rule 12b-2 of the Securities Exchange Act of 1934 (17 CFR §240.12b-2).
Emerging growth company ☐
If an emerging growth company, indicate by check mark if the registrant has elected not to use the extended transition period for complying with any new or revised financial accounting standards provided pursuant to Section 13(a) of the Exchange Act. ☐
| Item 2.02 | Results of Operations and Financial Condition | ||||
The information contained within Item 2.02 of this Form 8-K and the Exhibits attached hereto shall not be deemed to be "filed" for purposes of Section 18 of the Securities Exchange Act of 1934, as amended, and shall not be deemed incorporated by reference into any filing under the Securities Act of 1933, as amended, except as shall be expressly set forth by specific reference in such filing.
On January 28, 2026, Littelfuse, Inc. (the “Company”) issued a press release announcing the results of its operations for the quarter and full year ended December 27, 2025. A copy of the press release is attached as Exhibit 99.1 to this Form 8-K and incorporated by reference to this Item 2.02 as if fully set forth herein. A copy of the press release will also be available on the Company’s website.
| Item 7.01 | Regulation FD Disclosure | ||||
To supplement the information in the attached press release, the Company has also prepared a presentation, which will be available on the Company’s website at https://investor.littelfuse.com/events-and-presentations and is attached hereto as Exhibit 99.2 to this Current Report on Form 8-K.
The information contained in the press release and investor presentation attached to this Form 8-K includes forward-looking statements that are intended to be covered by the safe-harbor provisions of the Private Securities Litigation Reform Act of 1995. These forward-looking statements include but are not limited to comments with respect to the objectives and strategies, financial condition, results of operations and business of the Company. These forward-looking statements involve numerous assumptions, inherent risks and uncertainties, both general and specific, and the risk that predictions and other forward-looking statements will not be achieved. The Company cautions you not to place undue reliance on these forward-looking statements as a number of important factors could cause actual future results to differ materially from the plans, objectives, expectations, estimates and intentions expressed in such forward-looking statements.
A copy of the press release is also posted on the Company’s website.
| Item 9.01 | Financial Statements and Exhibits. | ||||
| (d) | Exhibits | ||||
| The following exhibits are furnished with this Form 8-K: | |||||
| 104 Cover Page Interactive Data File (embedded within the Inline XBRL document) | |||||
Signature
Pursuant to the requirements of the Securities Exchange Act of 1934, the Registrant has duly caused this report to be signed on its behalf by the undersigned thereunto duly authorized.
| Littelfuse, Inc. | |||||
| Date: January 28, 2026 | By: /s/ Abhishek Khandelwal | ||||
| Abhishek Khandelwal Executive Vice President and Chief Financial Officer | |||||
Exhibit 99.1
 |  | ||||
FOR IMMEDIATE RELEASE David Kelley 224-727-2535 | |||||
Littelfuse Reports Fourth Quarter and Full Year 2025 Results
Fourth Quarter Highlights:
(Year-over-year comparisons unless otherwise noted)
•Net sales of $594 million, +12%; organic growth contributed +7%
•Cash flow from operations of $139 million and free cash flow of $120 million
•Recorded non-cash goodwill impairment charge of $301 million related to the Semiconductor Products business within the Electronics Segment
•GAAP diluted loss per share of ($9.72); Adjusted diluted earnings per share of $2.69
•GAAP operating margin of (-37.5%); Adjusted EBITDA margin of 20.5%, +480 bps
Full Year Highlights:
(Year-over-year comparisons unless otherwise noted)
•Net sales of $2,386 million, +9%; organic growth contributed +6%
•Cash flow from operations of $434 million and free cash flow of $366 million
•GAAP diluted loss per share of ($2.89), which includes a non-cash goodwill impairment charge of $301 million related to the Semiconductor Products business within the Electronics Segment
•Adjusted diluted earnings per share of $10.68, +34%
•GAAP operating margin of 1.6%; Adjusted EBITDA margin of 20.9%, +260 bps
CHICAGO, January 28, 2026 - Littelfuse, Inc. (NASDAQ: LFUS), a leader in developing smart solutions that enable safe and efficient electrical energy transfer, today reported financial results for its fourth quarter ended December 27, 2025:
“I am proud of our teams as we finished the year with significant momentum, delivering fourth quarter results above our guidance range and successfully closing the acquisition of Basler Electric,” said Greg Henderson, Littelfuse President and Chief Executive Officer. “Throughout 2025, we remained disciplined in executing our strategic priorities, which is reflected in our solid full year revenue growth and margin expansion. Across our segments, we are entering 2026 from a position of strength as we leverage our leadership in safe and efficient electrical energy transfer to accelerate growth, broaden our solutions for an expanding customer base, and drive continued operational enhancements.”
-more-
| Littelfuse Inc. 6133 North River Road, Suite 500 Rosemont, Illinois 60018 p: (773) 628-1000 www.littelfuse.com | |||||
First Quarter of 2026*
“Looking ahead to the first quarter, we expect approximately 15% total revenue growth versus the prior year, supported by our strengthening backlog, deepening customer engagement, and contributions from the Basler acquisition. As our end markets continue to evolve requiring higher power and energy density solutions, we remain committed to driving technology innovations to help our customers solve increasingly complex challenges. Our focus is on executing our strategic priorities and scaling the company to deliver leading long term performance and shareholder value.”
Based on current market conditions, for the first quarter the company expects,
•Net sales in the range of $625 - $645 million, adjusted diluted EPS in the range of $2.70 – $2.90 and an adjusted effective tax rate of 24%
*Littelfuse provides guidance on a non-GAAP (adjusted) basis. GAAP items excluded from guidance may include the after-tax impact of items including acquisition and integration costs, restructuring, impairment and other charges, certain purchase accounting adjustments, non-operating foreign exchange adjustments and significant and unusual items. These items are uncertain, depend on various factors, and could be material to results computed in accordance with GAAP. Littelfuse is not able to forecast the excluded items in order to provide the most directly comparable GAAP financial measure without unreasonable efforts.
Fourth Quarter 2025 Segment Performance Highlights
Electronics Segment
•Net sales for the fourth quarter 2025 increased +21%. Organic sales increased +14% driven by improved passive products (+23% organic) sales. Semiconductor product (+6% organic) sales also contributed to growth driven by increased protection semiconductor demand which more than offset lower power semiconductor volumes. The Dortmund Fab acquisition and favorable FX contributed +4% and +2% to growth, respectively.
•Adjusted EBITDA margin for the fourth quarter 2025 increased to 23.7% (+370 bps) primarily due to strong passive products and protection volume leverage which more than offset continued soft power semiconductor volumes.
•The fourth quarter 2025 includes a non-cash goodwill impairment charge of $301 million related to the Semiconductor product business reflecting weaker sales and profitability than original expectations amid persistent soft market conditions.
Transportation Segment
•Net sales for the fourth quarter 2025 increased +1% as favorable FX impact of +2% offset lower organic sales. Organic sales decreased -1% as improved passenger vehicle organic sales (+2% organic) was more than offset by lower commercial vehicle sales (-4% organic). Passenger vehicle strength was driven by solid demand for core passenger car products, more than offsetting lower global passenger car builds and sensor declines in the fourth quarter. Lower commercial vehicle sales reflected the previously disclosed exit of the marine business as well as continued soft on-highway, off-road and agriculture end market demand.
•Adjusted EBITDA margin for the fourth quarter 2025 increased to 16.0% (+830 bps) driven by improved operational execution and a favorable year-over-year comparison against a prior-year cumulative out-of-period adjustment ($11.1 million), which more than offset lower volume and unfavorable mix.
-more-
| Littelfuse Inc. 6133 North River Road, Suite 500 Rosemont, Illinois 60018 p: (773) 628-1000 www.littelfuse.com | |||||
Industrial Segment
•Net sales for the fourth quarter 2025 increased +4%. Organic sales decreased 1% as improved energy storage, utility & grid infrastructure, renewables and data center demand was more than offset by lower HVAC demand. The Basler acquisition and favorable FX also contributed +5% and +1% to growth, respectively.
•Adjusted EBITDA margin for the fourth quarter 2025 was flat at 16.2% as improved productivity and mix as well as a favorable year-over-year comparison against a prior-year cumulative out-of-period adjustment ($4.1 million) was offset by lower volume.
Full Year 2025 Segment Performance Highlights
Electronics Segment
•Net sales for the full year 2025 increased +13%. Organic sales increased +8% driven by improved passive products (+17% organic) sales. Semiconductor product organic sales were flat as improved protection semiconductor demand was offset by lower power semiconductor volumes. The Dortmund Fab acquisition and favorable FX also contributed +4% and +1% to growth, respectively.
•Adjusted EBITDA margin for the full year 2025 increased to 22.9% (+190 bps) primarily due to strong passive products and protection volume leverage, which more than offset continued soft power semiconductor volumes.
Transportation Segment
•Net sales for the full year 2025 increased +1% as favorable FX impact of +1% offset lower organic sales. Organic sales decreased -1% as flat passenger vehicle organic sales was more than offset by lower commercial vehicle sales (-1% organic). Flat full year passenger vehicle sales reflects solid core passenger car products growth offset by sensor declines. Lower commercial vehicle sales reflected soft on-highway, off-road and agriculture end market demand.
•Adjusted EBITDA margin for the full year 2025 increased to 17.7% (+370 bps) driven by improved operational execution and a favorable year-over-year comparison against a prior-year cumulative out-of-period adjustment ($11.1 million), which more than offset lower volume.
Industrial Segment
•Net sales for the full year 2025 increased +10%. Organic sales increased 9% driven by growth from energy storage, renewables, data center and HVAC end markets. The Basler acquisition also contributed +1% to growth.
•Adjusted EBITDA margin for the full year 2025 increased to 19.5% (+220 bps) driven by improved volume leverage and a favorable year-over-year comparison against a prior-year cumulative out-of-period adjustment ($4.1 million).
Dividend
•The company will pay a cash dividend on its common stock of $0.75 per share on March 5, 2026, to shareholders of record as of February 19, 2026.
-more-
| Littelfuse Inc. 6133 North River Road, Suite 500 Rosemont, Illinois 60018 p: (773) 628-1000 www.littelfuse.com | |||||
Conference Call and Webcast Information
Littelfuse will host a conference call on Wednesday, January 28, 2026, at 8:00 a.m. Central Time to discuss the results. The call will be broadcast and available for replay at Littelfuse.com. A slide presentation is available in the Investor Relations section of the company’s website at Littelfuse.com.
About Littelfuse
Littelfuse, Inc. (NASDAQ: LFUS) is a diversified, industrial technology manufacturing company empowering a sustainable, connected, and safer world. Across more than 20 countries, and with approximately 17,000 global associates, we partner with customers to design and deliver innovative, reliable solutions. Serving over 100,000 end customers, our products are found in a variety of industrial, transportation and electronics end markets – everywhere, every day. Learn more at Littelfuse.com.
“Safe Harbor” Statement under the Private Securities Litigation Reform Act of 1995
The statements in this press release that are not historical facts are intended to constitute "forward-looking statements" entitled to the safe-harbor provisions of the Private Securities Litigation Reform Act. Such statements are based on Littelfuse, Inc.’s (“Littelfuse” or the “Company”) current expectations and are subject to a number of factors and uncertainties, which could cause actual results to differ materially from those described in the forward-looking statements. These risks, uncertainties and other factors include, but are not limited to, risks and uncertainties relating to general economic conditions; product demand and market acceptance; economic conditions; the impact of competitive products and pricing; product quality problems or product recalls; capacity and supply difficulties or constraints; coal mining exposures reserves; cybersecurity matters; failure of an indemnification for environmental liability; changes in import and export duty and tariff rates; exchange rate fluctuations; commodity price fluctuations; the effect of the Company's accounting policies; labor disputes and shortages; restructuring costs in excess of expectations; pension plan asset returns less than assumed; uncertainties related to political or regulatory changes; integration of acquisitions may not be achieved in a timely manner, or at all; limited realization of the expected benefits from investment and strategic plans; the risk that expected benefits, synergies and growth prospects of the transaction with Basler may not be achieved in a timely manner, or at all; and other risks which may be detailed in the company's Securities and Exchange Commission filings. Should one or more of these risks or uncertainties materialize or should the underlying assumptions prove incorrect, actual results and outcomes may differ materially from those indicated or implied in the forward-looking statements. This release should be read in conjunction with information provided in the financial statements appearing in the company's Annual Report on Form 10-K for the year ended December 28, 2024.
Further discussion of the risk factors of the company can be found under the caption "Risk Factors" in the company's Annual Report on Form 10-K for the year ended December 28, 2024, and in other filings and submissions with the SEC, each of which are available free of charge on the company’s investor relations website at investor.littelfuse.com and on the SEC’s website at www.sec.gov. These forward-looking statements are made as of the date hereof. The company does not undertake any obligation to update, amend or clarify these forward-looking statements to reflect events or circumstances after the date hereof or to reflect the availability of new information.
-more-
| Littelfuse Inc. 6133 North River Road, Suite 500 Rosemont, Illinois 60018 p: (773) 628-1000 www.littelfuse.com | |||||
Non-GAAP Financial Measures
The information included in this press release and other materials filed with the SEC may include non-GAAP financial measures including organic net sales (decline) growth, adjusted operating income, adjusted operating margin, adjusted EBITDA, adjusted EBITDA margin, adjusted diluted earnings per share, adjusted income taxes, adjusted effective tax rate, free cash flow, net debt, consolidated EBITDA, and consolidated net leverage ratio (as defined in the credit agreement). Many of these non-GAAP financial measures exclude the effect of certain expenses and income not related directly to the underlying performance of our fundamental business operations. A reconciliation of these non-GAAP financial measures to the most directly comparable GAAP financial measures is set forth in the attached schedules. The company believes that organic net sales (decline) growth, adjusted operating income, adjusted operating margin, adjusted EBITDA, adjusted EBITDA margin, adjusted diluted earnings per share, adjusted income taxes, and adjusted effective tax rate provide useful information to investors regarding its operational performance because they enhance an investor’s overall understanding of the company’s core financial performance and facilitate comparisons to historical results of operations, by excluding items that are not related directly to the underlying performance of its fundamental business operations or were not part of the company’s business operations during a comparable period. The company believes that free cash flow is a useful measure of its ability to generate cash. The company believes that net debt, consolidated EBITDA, and consolidated net leverage ratio are useful measures of its credit position. The company believes that all of these non-GAAP financial measures are commonly used by financial analysts and others in the industries in which we operate, and thus further provide useful information to investors. Management additionally uses these measures when assessing the performance of the business and for business planning purposes. Note that the company’s definitions of these non-GAAP financial measures may differ from those terms as defined or used by other companies.
LFUS-F
###
| Littelfuse Inc. 6133 North River Road, Suite 500 Rosemont, Illinois 60018 p: (773) 628-1000 www.littelfuse.com | |||||
LITTELFUSE, INC.
CONSOLIDATED BALANCE SHEETS
| (in thousands) | December 27, 2025 | December 28, 2024 | |||||||||
| (Unaudited) | |||||||||||
| ASSETS | |||||||||||
| Current assets: | |||||||||||
| Cash and cash equivalents | $ | 563,391 | $ | 724,924 | |||||||
| Short-term investments | 287 | 976 | |||||||||
| Trade receivables, less allowances of $77,073 and $69,990, respectively | 363,215 | 294,371 | |||||||||
| Inventories | 416,472 | 416,273 | |||||||||
| Prepaid income taxes and income taxes receivable | 6,137 | 11,749 | |||||||||
| Prepaid expenses and other current assets | 85,832 | 103,716 | |||||||||
| Total current assets | 1,435,334 | 1,552,009 | |||||||||
| Net property, plant, and equipment | 540,640 | 477,068 | |||||||||
| Intangible assets, net of amortization | 634,907 | 482,118 | |||||||||
| Goodwill | 1,171,411 | 1,228,502 | |||||||||
| Investments | 20,010 | 23,245 | |||||||||
| Deferred income taxes | 5,255 | 4,899 | |||||||||
| Right of use lease assets | 86,263 | 72,211 | |||||||||
| Other long-term assets | 62,976 | 51,727 | |||||||||
| Total assets | $ | 3,956,796 | $ | 3,891,779 | |||||||
| LIABILITIES AND EQUITY | |||||||||||
| Current liabilities: | |||||||||||
| Accounts payable | $ | 211,079 | $ | 188,359 | |||||||
| Accrued liabilities | 199,271 | 148,276 | |||||||||
| Accrued income taxes | 26,186 | 29,658 | |||||||||
| Current portion of long-term debt | 96,233 | 67,612 | |||||||||
| Total current liabilities | 532,769 | 433,905 | |||||||||
| Long-term debt, less current portion | 706,394 | 788,502 | |||||||||
| Deferred income taxes | 102,335 | 95,532 | |||||||||
| Accrued post-retirement benefits | 38,733 | 29,836 | |||||||||
| Non-current lease liabilities | 71,765 | 60,559 | |||||||||
| Other long-term liabilities | 78,766 | 69,833 | |||||||||
| Total equity | 2,426,034 | 2,413,612 | |||||||||
| Total liabilities and equity | $ | 3,956,796 | $ | 3,891,779 | |||||||
6
LITTELFUSE, INC.
CONSOLIDATED STATEMENTS OF NET (LOSS) INCOME
(Unaudited)
| Three Months Ended | Fiscal Year Ended | |||||||||||||||||||||||||
| (in thousands, except per share data) | December 27, 2025 | December 28, 2024 | December 27, 2025 | December 28, 2024 | ||||||||||||||||||||||
| Net sales | $ | 593,934 | $ | 529,505 | $ | 2,386,294 | $ | 2,190,768 | ||||||||||||||||||
| Cost of sales | 368,189 | 352,667 | 1,480,251 | 1,403,226 | ||||||||||||||||||||||
| Gross profit | 225,745 | 176,838 | 906,043 | 787,542 | ||||||||||||||||||||||
| Selling, general, and administrative expenses | 98,978 | 87,026 | 381,773 | 350,421 | ||||||||||||||||||||||
| Research and development expenses | 27,118 | 26,490 | 106,899 | 107,773 | ||||||||||||||||||||||
| Amortization of intangibles | 15,573 | 14,709 | 59,793 | 62,127 | ||||||||||||||||||||||
| Restructuring, impairment, and other charges | 306,892 | 98,112 | 320,050 | 108,441 | ||||||||||||||||||||||
| Total operating expenses | 448,561 | 226,337 | 868,515 | 628,762 | ||||||||||||||||||||||
| Operating (loss) income | (222,816) | (49,499) | 37,528 | 158,780 | ||||||||||||||||||||||
| Interest expense | 8,282 | 9,359 | 34,303 | 38,717 | ||||||||||||||||||||||
| Foreign exchange loss (gain) | 1,146 | (13,503) | 16,612 | (9,230) | ||||||||||||||||||||||
| Other income, net | (2,974) | (2,654) | (16,994) | (22,570) | ||||||||||||||||||||||
| (Loss) income before income taxes | (229,270) | (42,701) | 3,607 | 151,863 | ||||||||||||||||||||||
| Income taxes | 12,865 | 9,085 | 75,307 | 51,673 | ||||||||||||||||||||||
| Net (loss) income | $ | (242,135) | $ | (51,786) | $ | (71,700) | $ | 100,190 | ||||||||||||||||||
| (Loss) income per share: | ||||||||||||||||||||||||||
| Basic | $ | (9.72) | $ | (2.09) | $ | (2.89) | $ | 4.04 | ||||||||||||||||||
| Diluted | $ | (9.72) | $ | (2.09) | $ | (2.89) | $ | 4.00 | ||||||||||||||||||
| Weighted-average shares and equivalent shares outstanding: | ||||||||||||||||||||||||||
| Basic | 24,909 | 24,818 | 24,817 | 24,821 | ||||||||||||||||||||||
| Diluted | 24,909 | 24,818 | 24,817 | 25,039 | ||||||||||||||||||||||
| Comprehensive (loss) income | $ | (233,130) | $ | (147,365) | $ | 69,278 | $ | 9,646 | ||||||||||||||||||
7
LITTELFUSE, INC.
CONDENSED CONSOLIDATED STATEMENTS OF CASH FLOWS
| Year Ended | |||||||||||
| (in thousands) | December 27, 2025 | December 28, 2024 | |||||||||
| OPERATING ACTIVITIES | |||||||||||
| Net (loss) income | $ | (71,700) | $ | 100,190 | |||||||
| Adjustments to reconcile net (loss) income to net cash provided by operating activities | 478,580 | 237,143 | |||||||||
| Changes in operating assets and liabilities: | |||||||||||
| Trade receivables | (36,401) | (15,347) | |||||||||
| Inventories | 40,181 | 47,143 | |||||||||
| Accounts payable | 11,342 | 16,260 | |||||||||
| Accrued liabilities and income taxes | 4,095 | (34,560) | |||||||||
| Prepaid expenses and other assets | 7,667 | 16,792 | |||||||||
| Net cash provided by operating activities | 433,764 | 367,621 | |||||||||
| INVESTING ACTIVITIES | |||||||||||
| Acquisitions of businesses, net of cash acquired | (407,718) | — | |||||||||
| Purchases of property, plant, and equipment | (67,637) | (75,877) | |||||||||
| Net proceeds from sale of property, plant, and equipment | 5,806 | 10,836 | |||||||||
| Other | 689 | (741) | |||||||||
| Net cash used in investing activities | (468,860) | (65,782) | |||||||||
| FINANCING ACTIVITIES | |||||||||||
| Net payments of credit facility and senior notes | (65,000) | (7,500) | |||||||||
| Cash dividends paid | (71,991) | (67,061) | |||||||||
| Purchases of common stock | (27,553) | (40,862) | |||||||||
| All other cash provided by financing activities | 15,271 | 2,987 | |||||||||
| Net cash used in financing activities | (149,273) | (112,436) | |||||||||
| Effect of exchange rate changes on cash, cash equivalents, and restricted cash | 23,036 | (20,089) | |||||||||
| (Decrease) increase in cash, cash equivalents, and restricted cash | (161,333) | 169,314 | |||||||||
| Cash, cash equivalents, and restricted cash at beginning of period | 726,437 | 557,123 | |||||||||
| Cash, cash equivalents, and restricted cash at end of period | $ | 565,104 | $ | 726,437 | |||||||
8
LITTELFUSE, INC.
NET SALES AND OPERATING INCOME BY SEGMENT
(Unaudited)
| Fourth Quarter | Year-to-Date | |||||||||||||||||||||||||||||||||||||
| (in thousands) | 2025 | 2024 | % Growth / (Decline) | 2025 | 2024 | % Growth / (Decline) | ||||||||||||||||||||||||||||||||
| Net sales | ||||||||||||||||||||||||||||||||||||||
| Electronics | $ | 345,150 | $ | 285,841 | 20.7 | % | $ | 1,345,522 | $ | 1,186,773 | 13.4 | % | ||||||||||||||||||||||||||
| Transportation | 163,804 | 161,723 | 1.3 | % | 676,377 | 672,434 | 0.6 | % | ||||||||||||||||||||||||||||||
| Industrial | 84,980 | 81,941 | 3.7 | % | 364,395 | 331,561 | 9.9 | % | ||||||||||||||||||||||||||||||
| Total net sales | $ | 593,934 | $ | 529,505 | 12.2 | % | $ | 2,386,294 | $ | 2,190,768 | 8.9 | % | ||||||||||||||||||||||||||
| Operating (loss) income | ||||||||||||||||||||||||||||||||||||||
| Electronics | $ | 59,799 | $ | 37,034 | 61.5 | % | $ | 220,066 | $ | 169,893 | 29.5 | % | ||||||||||||||||||||||||||
| Transportation | 17,602 | 3,653 | 381.9 | % | 84,780 | 58,578 | 44.7 | % | ||||||||||||||||||||||||||||||
| Industrial | 10,168 | 10,277 | (1.1) | % | 59,023 | 42,331 | 39.4 | % | ||||||||||||||||||||||||||||||
| Other (a) | (310,385) | (100,463) | N.M. | (326,341) | (112,022) | N.M. | ||||||||||||||||||||||||||||||||
| Total operating (loss) income | $ | (222,816) | $ | (49,499) | (350.1) | % | $ | 37,528 | $ | 158,780 | (76.4) | % | ||||||||||||||||||||||||||
| Operating Margin | (37.5) | % | (9.3) | % | 1.6 | % | 7.2 | % | ||||||||||||||||||||||||||||||
| Interest expense | 8,282 | 9,359 | 34,303 | 38,717 | ||||||||||||||||||||||||||||||||||
| Foreign exchange loss (gain) | 1,146 | (13,503) | 16,612 | (9,230) | ||||||||||||||||||||||||||||||||||
| Other income, net | (2,974) | (2,654) | (16,994) | (22,570) | ||||||||||||||||||||||||||||||||||
| (Loss) income before income taxes | $ | (229,270) | $ | (42,701) | (436.9) | % | $ | 3,607 | $ | 151,863 | (97.6) | % | ||||||||||||||||||||||||||
(a)"other" typically includes non-GAAP adjustments such as acquisition-related and integration costs, purchase accounting inventory adjustments and restructuring and impairment charges. (See Supplemental Financial Information for details.)
N.M. - Not meaningful
| Fourth Quarter | Year-to-Date | |||||||||||||||||||||||||||||||||||||
| (in thousands) | 2025 | 2024 | % Growth (decline) | 2025 | 2024 | % Growth | ||||||||||||||||||||||||||||||||
| Operating Margin | ||||||||||||||||||||||||||||||||||||||
| Electronics | 17.3 | % | 13.0 | % | 4.3 | % | 16.4 | % | 14.3 | % | 2.1 | % | ||||||||||||||||||||||||||
| Transportation | 10.7 | % | 2.3 | % | 8.4 | % | 12.5 | % | 8.7 | % | 3.8 | % | ||||||||||||||||||||||||||
| Industrial | 12.0 | % | 12.5 | % | (0.5) | % | 16.2 | % | 12.8 | % | 3.4 | % | ||||||||||||||||||||||||||
9
LITTELFUSE, INC.
SUPPLEMENTAL FINANCIAL INFORMATION
(In millions of USD except per share amounts - unaudited)
| Non-GAAP EPS reconciliation | ||||||||||||||||||||||||||
| Q4-25 | Q4-24 | YTD-25 | YTD-24 | |||||||||||||||||||||||
| GAAP (loss per share)/ diluted EPS | $ | (9.72) | $ | (2.09) | $ | (2.89) | $ | 4.00 | ||||||||||||||||||
| EPS impact of Non-GAAP adjustments (below) | 12.41 | 3.61 | 13.57 | 3.97 | ||||||||||||||||||||||
| Adjusted diluted EPS | $ | 2.69 | $ | 1.53 | $ | 10.68 | $ | 7.97 | ||||||||||||||||||
| Non-GAAP adjustments - (income) / expense | ||||||||||||||||||||||||||
| Q4-25 | Q4-24 | YTD-25 | YTD-24 | |||||||||||||||||||||||
| Acquisition-related and integration costs (a) | $ | 2.4 | $ | 2.4 | $ | 5.4 | $ | 5.1 | ||||||||||||||||||
| Purchase accounting inventory adjustments (b) | 1.1 | — | 0.6 | — | ||||||||||||||||||||||
| Restructuring, impairment and other charges (c) | 306.9 | 98.1 | 320.1 | 108.4 | ||||||||||||||||||||||
| Gain on sale of fixed assets (d) | — | — | — | (1.5) | ||||||||||||||||||||||
| Loss on sale of the Marine business (e) | — | — | 0.3 | — | ||||||||||||||||||||||
| Non-GAAP adjustments to operating (loss) income | 310.4 | 100.5 | 326.4 | 112.0 | ||||||||||||||||||||||
| Other expense (income), net (f) | 0.6 | 1.6 | 0.6 | 1.3 | ||||||||||||||||||||||
| Non-operating foreign exchange loss (gain) | 1.1 | (13.5) | 16.6 | (9.2) | ||||||||||||||||||||||
| Non-GAAP adjustments to (loss) income before income taxes | 312.2 | 88.5 | 343.6 | 104.1 | ||||||||||||||||||||||
| Income taxes (g) | 2.4 | (1.5) | 4.6 | 4.7 | ||||||||||||||||||||||
| Non-GAAP adjustments to net (loss) income | $ | 309.8 | $ | 90.0 | $ | 339.0 | $ | 99.4 | ||||||||||||||||||
| Total EPS impact | $ | 12.41 | $ | 3.61 | $ | 13.57 | $ | 3.97 | ||||||||||||||||||
| Adjusted operating margin / Adjusted EBITDA reconciliation | ||||||||||||||||||||||||||
| Q4-25 | Q4-24 | YTD-25 | YTD-24 | |||||||||||||||||||||||
| Net (loss) income | $ | (242.1) | $ | (51.8) | $ | (71.7) | $ | 100.2 | ||||||||||||||||||
| Add: | ||||||||||||||||||||||||||
| Income taxes | 12.9 | 9.1 | 75.3 | 51.7 | ||||||||||||||||||||||
| Interest expense | 8.3 | 9.4 | 34.3 | 38.7 | ||||||||||||||||||||||
| Foreign exchange loss (gain) | 1.1 | (13.5) | 16.6 | (9.2) | ||||||||||||||||||||||
| Other income, net | (3.0) | (2.7) | (17.0) | (22.6) | ||||||||||||||||||||||
| GAAP operating (loss) income | $ | (222.8) | $ | (49.5) | $ | 37.5 | $ | 158.8 | ||||||||||||||||||
| Non-GAAP adjustments to operating (loss) income | 310.4 | 100.5 | 326.4 | 112.0 | ||||||||||||||||||||||
| Adjusted operating income | $ | 87.6 | $ | 51.0 | $ | 363.9 | $ | 270.8 | ||||||||||||||||||
| Amortization of intangibles | 15.5 | 14.7 | 59.8 | 62.1 | ||||||||||||||||||||||
| Depreciation expense | 18.5 | 17.3 | 74.9 | 68.3 | ||||||||||||||||||||||
| Adjusted EBITDA | $ | 121.6 | $ | 83.0 | $ | 498.6 | $ | 401.2 | ||||||||||||||||||
| Net sales | $ | 593.9 | $ | 529.5 | $ | 2,386.3 | $ | 2,190.8 | ||||||||||||||||||
| Net (loss) income as a percentage of net sales | (40.8) | % | (9.8) | % | (3.0) | % | 4.6 | % | ||||||||||||||||||
| Operating margin | (37.5) | % | (9.3) | % | 1.6 | % | 7.2 | % | ||||||||||||||||||
| Adjusted operating margin | 14.7 | % | 9.6 | % | 15.2 | % | 12.4 | % | ||||||||||||||||||
| Adjusted EBITDA margin | 20.5 | % | 15.7 | % | 20.9 | % | 18.3 | % | ||||||||||||||||||
10
| Adjusted EBITDA by Segment | Q4-25 | Q4-24 | ||||||||||||||||||||||||||||||||||||
| Electronics | Transportation | Industrial | Electronics | Transportation | Industrial | |||||||||||||||||||||||||||||||||
| GAAP operating income | $ | 59.8 | $ | 17.6 | $ | 10.2 | $ | 37.0 | $ | 3.7 | $ | 10.3 | ||||||||||||||||||||||||||
| Add: | ||||||||||||||||||||||||||||||||||||||
| Add back amortization | 10.2 | 3.3 | 2.0 | 9.8 | 3.4 | 1.5 | ||||||||||||||||||||||||||||||||
| Add back depreciation | 11.7 | 5.2 | 1.6 | 10.4 | 5.4 | 1.5 | ||||||||||||||||||||||||||||||||
| Adjusted EBITDA | $ | 81.7 | $ | 26.1 | $ | 13.8 | $ | 57.2 | $ | 12.5 | $ | 13.3 | ||||||||||||||||||||||||||
| Adjusted EBITDA Margin | 23.7 | % | 16.0 | % | 16.2 | % | 20.0 | % | 7.7 | % | 16.2 | % | ||||||||||||||||||||||||||
| Adjusted EBITDA by Segment | YTD-25 | YTD-24 | ||||||||||||||||||||||||||||||||||||
| Electronics | Transportation | Industrial | Electronics | Transportation | Industrial | |||||||||||||||||||||||||||||||||
| GAAP operating income | $ | 220.1 | $ | 84.8 | $ | 59.0 | $ | 169.9 | $ | 58.6 | $ | 42.3 | ||||||||||||||||||||||||||
| Add: | ||||||||||||||||||||||||||||||||||||||
| Add back amortization | 40.4 | 13.5 | 5.9 | 39.4 | 13.5 | 9.2 | ||||||||||||||||||||||||||||||||
| Add back depreciation | 47.6 | 21.2 | 6.1 | 40.4 | 22.1 | 5.8 | ||||||||||||||||||||||||||||||||
| Adjusted EBITDA | $ | 308.1 | $ | 119.5 | $ | 71.0 | $ | 249.7 | $ | 94.2 | $ | 57.3 | ||||||||||||||||||||||||||
| Adjusted EBITDA Margin | 22.9 | % | 17.7 | % | 19.5 | % | 21.0 | % | 14.0 | % | 17.3 | % | ||||||||||||||||||||||||||
| Net sales reconciliation | Q4-25 vs. Q4-24 | |||||||||||||||||||||||||
| Electronics | Transportation | Industrial | Total | |||||||||||||||||||||||
| Net sales growth | 21 | % | 1 | % | 4 | % | 12 | % | ||||||||||||||||||
| Less: | ||||||||||||||||||||||||||
| Acquisitions | 4 | % | — | % | 5 | % | 3 | % | ||||||||||||||||||
| FX impact | 2 | % | 2 | % | 1 | % | 2 | % | ||||||||||||||||||
| Organic net sales growth (decline) | 14 | % | (1) | % | (1) | % | 7 | % | ||||||||||||||||||
| Electronics segment net sales reconciliation | Q4-25 vs. Q4-24 | |||||||||||||||||||
| Electronics - Semiconductor | Electronics - Passive Products and Sensors | Total Electronics | ||||||||||||||||||
| Net sales growth | 17 | % | 25 | % | 21 | % | ||||||||||||||
| Less: | ||||||||||||||||||||
| Acquisitions | 9 | % | — | % | 4 | % | ||||||||||||||
| FX impact | 2 | % | 2 | % | 2 | % | ||||||||||||||
| Organic net sales growth | 6 | % | 23 | % | 14 | % | ||||||||||||||
| Transportation segment net sales reconciliation | Q4-25 vs. Q4-24 | |||||||||||||||||||||||||
| Commercial Vehicle Products | Passenger Car Products (1) | Auto Sensor Products (1) | Total Transportation | |||||||||||||||||||||||
| Net sales (decline) growth | (3) | % | 8 | % | (7) | % | 1 | % | ||||||||||||||||||
| Less: | ||||||||||||||||||||||||||
| FX impact | 1 | % | 3 | % | 5 | % | 2 | % | ||||||||||||||||||
| Organic net sales (decline) growth | (4) | % | 5 | % | (12) | % | (1) | % | ||||||||||||||||||
(1) Passenger vehicle business (PVB) includes passenger car and auto sensor products.
11
| Net sales reconciliation | YTD-25 vs. YTD-24 | |||||||||||||||||||||||||
| Electronics | Transportation | Industrial | Total | |||||||||||||||||||||||
| Net sales growth | 13 | % | 1 | % | 10 | % | 9 | % | ||||||||||||||||||
| Less: | ||||||||||||||||||||||||||
| Acquisitions | 4 | % | — | % | 1 | % | 2 | % | ||||||||||||||||||
| FX impact | 1 | % | 1 | % | — | % | 1 | % | ||||||||||||||||||
| Organic net sales growth (decline) | 8 | % | (1) | % | 9 | % | 6 | % | ||||||||||||||||||
| Electronics segment net sales reconciliation | YTD-25 vs. YTD-24 | |||||||||||||||||||
| Electronics - Semiconductor | Electronics - Passive Products and Sensors | Total Electronics | ||||||||||||||||||
| Net sales growth | 9 | % | 18 | % | 13 | % | ||||||||||||||
| Less: | ||||||||||||||||||||
| Acquisitions | 8 | % | — | % | 4 | % | ||||||||||||||
| FX impact | 1 | % | 1 | % | 1 | % | ||||||||||||||
| Organic net sales growth | — | % | 17 | % | 8 | % | ||||||||||||||
| Transportation segment net sales reconciliation | YTD-25 vs. YTD-24 | |||||||||||||||||||||||||
| Commercial Vehicle Products | Passenger Car Products (1) | Auto Sensor Products (1) | Total Transportation | |||||||||||||||||||||||
| Net sales growth (decline) | — | % | 6 | % | (15) | % | 1 | % | ||||||||||||||||||
| Less: | ||||||||||||||||||||||||||
| FX impact | 1 | % | 1 | % | 2 | % | 1 | % | ||||||||||||||||||
| Organic net sales (decline) growth | (1) | % | 5 | % | (18) | % | (1) | % | ||||||||||||||||||
(1) Passenger vehicle business (PVB) includes passenger car and auto sensor products.
| Income tax reconciliation | ||||||||||||||||||||||||||
| Q4-25 | Q4-24 | YTD-25 | YTD-24 | |||||||||||||||||||||||
| Income taxes | $ | 12.9 | $ | 9.1 | $ | 75.3 | $ | 51.7 | ||||||||||||||||||
| Effective rate | (5.6) | % | (21.3) | % | 2,088.2 | % | 34.0 | % | ||||||||||||||||||
| Non-GAAP adjustments - income taxes | 2.4 | (1.5) | 4.6 | 4.7 | ||||||||||||||||||||||
| Adjusted income taxes | $ | 15.3 | $ | 7.6 | $ | 79.9 | $ | 56.4 | ||||||||||||||||||
| Adjusted effective rate | 18.4 | % | 16.6 | % | 23.0 | % | 22.0 | % | ||||||||||||||||||
| Free cash flow reconciliation | ||||||||||||||||||||||||||
| Q4-25 | Q4-24 | YTD-25 | YTD-24 | |||||||||||||||||||||||
| Net cash provided by operating activities | $ | 138.7 | $ | 160.6 | $ | 433.8 | $ | 367.6 | ||||||||||||||||||
| Less: Purchases of property, plant and equipment | (18.9) | (25.8) | (67.6) | (75.9) | ||||||||||||||||||||||
| Free cash flow | $ | 119.7 | $ | 134.8 | $ | 366.1 | $ | 291.7 | ||||||||||||||||||
12
| Consolidated Total Debt | As of December 27, 2025 | |||||||
| Consolidated Total Debt | $ | 802.6 | ||||||
| Unamortized debt issuance costs | 1.8 | |||||||
| Finance lease liability | 0.2 | |||||||
| Consolidated funded indebtedness | $ | 804.6 | ||||||
| Cash held in U.S. (up to $400 million) | 144.3 | |||||||
| Net debt | $ | 660.3 | ||||||
| Consolidated EBITDA | Twelve Months Ended December 27, 2025 | |||||||
| Net loss | $ | (71.9) | ||||||
| Interest expense | 34.3 | |||||||
| Income taxes | 75.3 | |||||||
| Depreciation | 74.9 | |||||||
| Amortization | 59.8 | |||||||
| Non-cash additions: | ||||||||
| Stock-based compensation expense | 27.3 | |||||||
| Purchase accounting inventory step-up charge | 0.6 | |||||||
| Unrealized loss on investments | 3.6 | |||||||
| Impairment charges | 302.1 | |||||||
| Other | 38.5 | |||||||
| Consolidated EBITDA (1) | $ | 544.5 | ||||||
| Consolidated Net Leverage Ratio (as defined in the Credit Agreement) * | 1.2x | |||||||
* Our Credit Agreement and Private Placement Note with maturities ranging from 2024 to 2032, contain financial ratio covenants providing that if, as of the last day of each fiscal quarter, the Consolidated Net Leverage ratio at such time for the then most recently concluded period of four consecutive fiscal quarters of the Company exceeds 3.50:1.00, an Event of Default (as defined in the Credit Agreement and Private Placement Senior Notes) is triggered.
The Credit Agreement and Private Placement Senior Notes were amended in Q2 2022 and now allow for the addition of acquisition and integration costs up to 15% of Consolidated EBITDA and the netting of up to $400M of Available Cash (Cash held by US Subsidiaries).
(1) Represents Consolidated EBITDA as defined in our Credit Agreement and Private Placement Senior Notes and is calculated using the most recently concluded period of four consecutive quarters.
Note: Total will not always foot due to rounding.
(a) reflected in selling, general and administrative expenses ("SG&A").
(b) reflected in cost of sales.
(c) reflected in restructuring, impairment and other charges. In the fourth quarter of 2025, the Company recorded a $301.2 million non-cash goodwill impairment charge related to the Electronics-Semiconductor reporting unit within the Electronics segment. The Company recognized impairment charges of $0.5 million and $0.4 million related to certain machinery and equipment in the commercial vehicle business within the Transportation segment and the electronics products business within the Electronics segment, respectively. In the fourth quarter of 2024, the Company recorded $92.6 million of non-cash impairment charges, which included $47.8 million for the impairment of intangible assets primarily related to certain acquired customer relationships, developed technology, and tradename in the Industrial controls and sensors reporting unit within the Industrial segment, and $36.1 million and $8.6 million non-cash goodwill impairment charge associated with the Industrial controls and sensors reporting unit within the Industrial segment and the Automotive sensors reporting unit within the Transportation segment, respectively. In addition, during the first quarter of 2024, the Company recognized a $0.9 million impairment related to certain machinery and equipment in the commercial vehicle business within the Transportation segment.
(d) 2024 amount reflected a gain of $0.5 million recorded for the sale of a land use right within the Electronics segment and a gain of $1.0 million for the sale of two buildings within the Transportation segment.
(e) 2025 amount reflected $0.3 million loss related to the sale of the Marine business within the Transportation segment.
13
(f) 2025 included $0.6 million increase in coal mining reserves. 2024 included $1.8 million increase in coal mining reserves, partially offset by a reversal of $0.5 million for an asset retirement obligation charge related the disposal of a business in 2019.
(g) reflected the tax impact associated with the non-GAAP adjustments.
###
14

Q4 2025 Earnings Release January 28, 2026
2Littelfuse, Inc. © 2026 DISCLAIMERS Important Information About Littelfuse, Inc. This presentation does not constitute or form part of, and should not be construed as, an offer or solicitation to purchase or sell securities of Littelfuse, Inc. and no investment decision should be made based upon the information provided herein. Littelfuse strongly urges you to review its filings with the Securities and Exchange Commission, which can be found at investor.littelfuse.com. This website also provides additional information about Littelfuse. “Safe Harbor” Statement Under the Private Securities Litigation Reform Act of 1995. These risks, uncertainties and other factors include, but are not limited to, risks and uncertainties relating to general economic conditions; product demand and market acceptance; economic conditions; the impact of competitive products and pricing; product quality problems or product recalls; capacity and supply difficulties or constraints; coal mining exposures reserves; cybersecurity matters; failure of an indemnification for environmental liability; changes in import and export duty and tariff rates; exchange rate fluctuations; commodity price fluctuations; the effect of the Company's accounting policies; labor disputes and shortages; restructuring costs in excess of expectations; pension plan asset returns less than assumed; uncertainties related to political or regulatory changes; integration of acquisitions may not be achieved in a timely manner, or at all; limited realization of the expected benefits from investment and strategic plans; the risk that expected benefits, synergies and growth prospects of the Basler acquisition may not be achieved in a timely manner, or at all; the risk that Basler’s business may not be successfully integrated with Littelfuse business following the closing; the risk that Littelfuse and Basler will be unable to retain and hire key personnel; the risk that disruption from the acquisition may adversely affect Littelfuse or Basler business and its relationships with its customers, suppliers or employees; and other risks which may be detailed in the company's Securities and Exchange Commission filings. Should one or more of these risks or uncertainties materialize or should the underlying assumptions prove incorrect, actual results and outcomes may differ materially from those indicated or implied in the forward-looking statements. This presentation should be read in conjunction with information provided in the financial statements appearing in the company's Annual Report on Form 10-K for the year ended December 28, 2024. Further discussion of the risk factors of the company can be found under the caption "Risk Factors" in the company's Annual Report on Form 10-K for the year ended December 28, 2024, and in other filings and submissions with the SEC, each of which are available free of charge on the company’s investor relations website at investor.littelfuse.com and on the SEC’s website at http://www.sec.gov. These forward-looking statements are made as of the date hereof. The company does not undertake any obligation to update, amend or clarify these forward-looking statements to reflect events or circumstances after the date hereof or to reflect the availability of new information. Non-GAAP Financial Measures. The information included in this presentation includes the non-GAAP financial measures of organic net sales growth, adjusted operating margin, adjusted EBITDA margin, adjusted diluted earnings per share, adjusted effective tax rate, free cash flow, and consolidated net leverage ratio (as defined in the credit agreement). A reconciliation of these non-GAAP financial measures to the most directly comparable GAAP financial measures are set forth in the appendix. The company believes that these non-GAAP financial measures provide useful information to investors regarding its operational performance, ability to generate cash and its credit position enhancing an investor’s overall understanding of its core financial performance. The company believes that free cash flow is a useful measure of its ability to generate cash. The company believes that these non-GAAP financial measures are commonly used by financial analysts and provide useful information to analysts. Management uses these measures when assessing the performance of the business and for business planning purposes. Note that the definitions of these non-GAAP financial measures may differ from those terms as defined or used by other companies.

3Littelfuse, Inc. © 2026 SAVE THE DATE INVESTOR DAY May 14, 2026 | New York City A formal invitation to register for in-person or virtual attendance will be provided in the coming weeks. Due to space availability, the number of in-person participants will be limited and advance registration is required. Littelfuse, Inc. © 2026
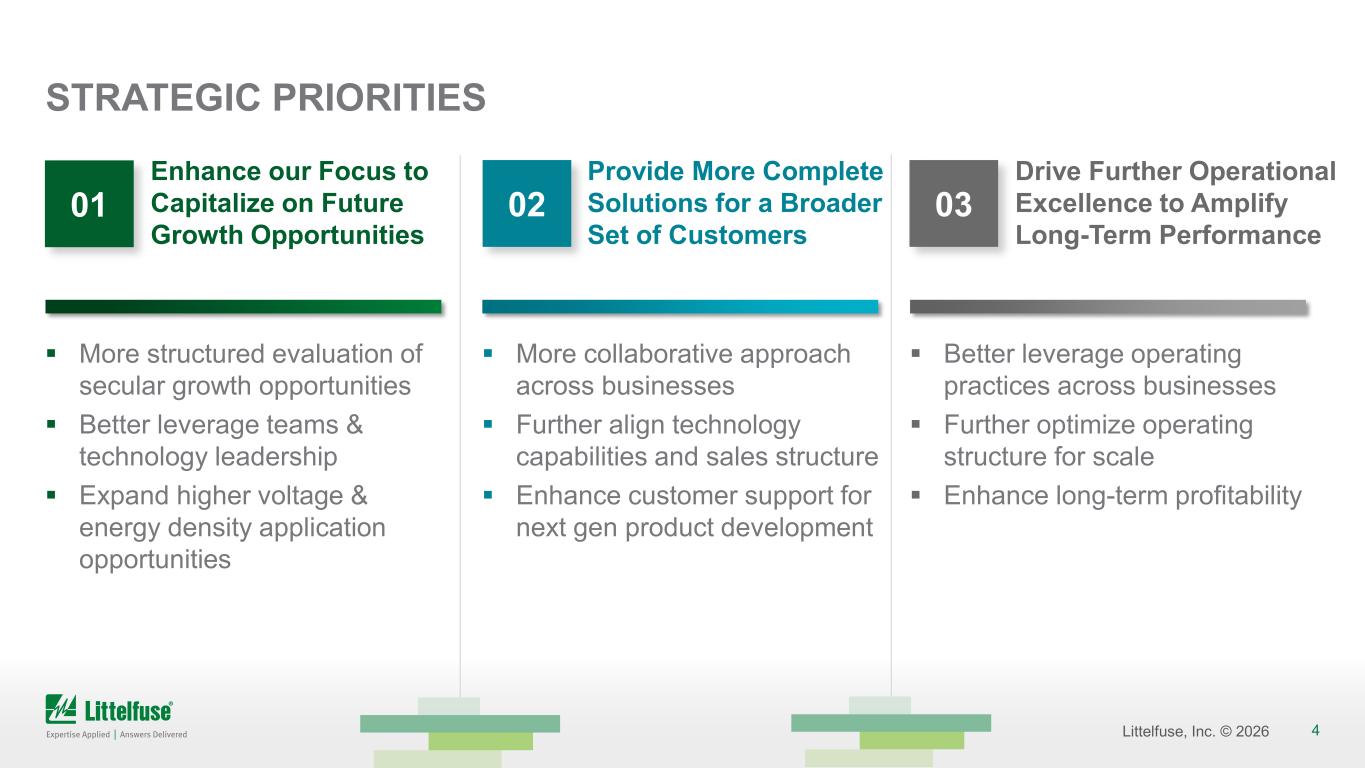
4Littelfuse, Inc. © 2026 STRATEGIC PRIORITIES Enhance our Focus to Capitalize on Future Growth Opportunities Provide More Complete Solutions for a Broader Set of Customers Drive Further Operational Excellence to Amplify Long-Term Performance More structured evaluation of secular growth opportunities Better leverage teams & technology leadership Expand higher voltage & energy density application opportunities More collaborative approach across businesses Further align technology capabilities and sales structure Enhance customer support for next gen product development Better leverage operating practices across businesses Further optimize operating structure for scale Enhance long-term profitability 01 02 03
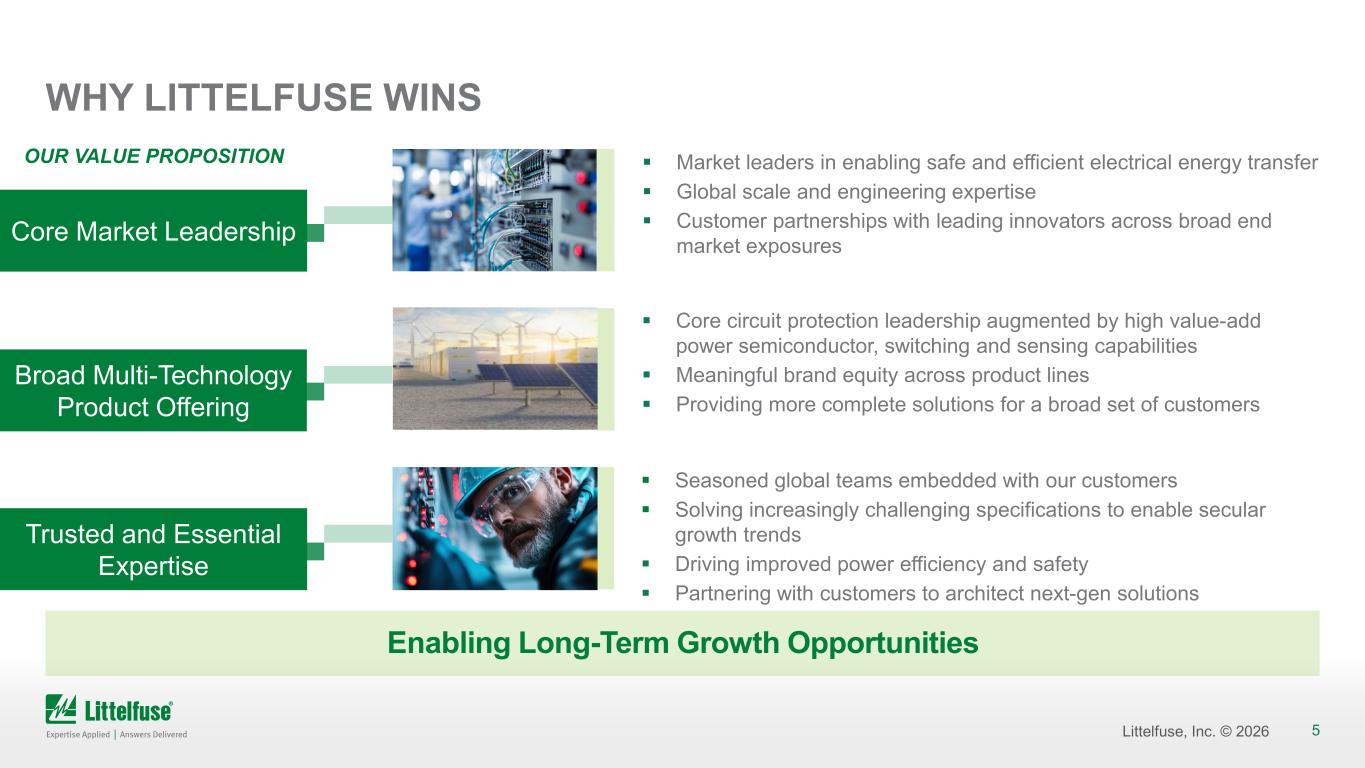
5Littelfuse, Inc. © 2026 WHY LITTELFUSE WINS Enabling Long-Term Growth Opportunities Core Market Leadership Market leaders in enabling safe and efficient electrical energy transfer Global scale and engineering expertise Customer partnerships with leading innovators across broad end market exposures Broad Multi-Technology Product Offering Core circuit protection leadership augmented by high value-add power semiconductor, switching and sensing capabilities Meaningful brand equity across product lines Providing more complete solutions for a broad set of customers Trusted and Essential Expertise Seasoned global teams embedded with our customers Solving increasingly challenging specifications to enable secular growth trends Driving improved power efficiency and safety Partnering with customers to architect next-gen solutions OUR VALUE PROPOSITION
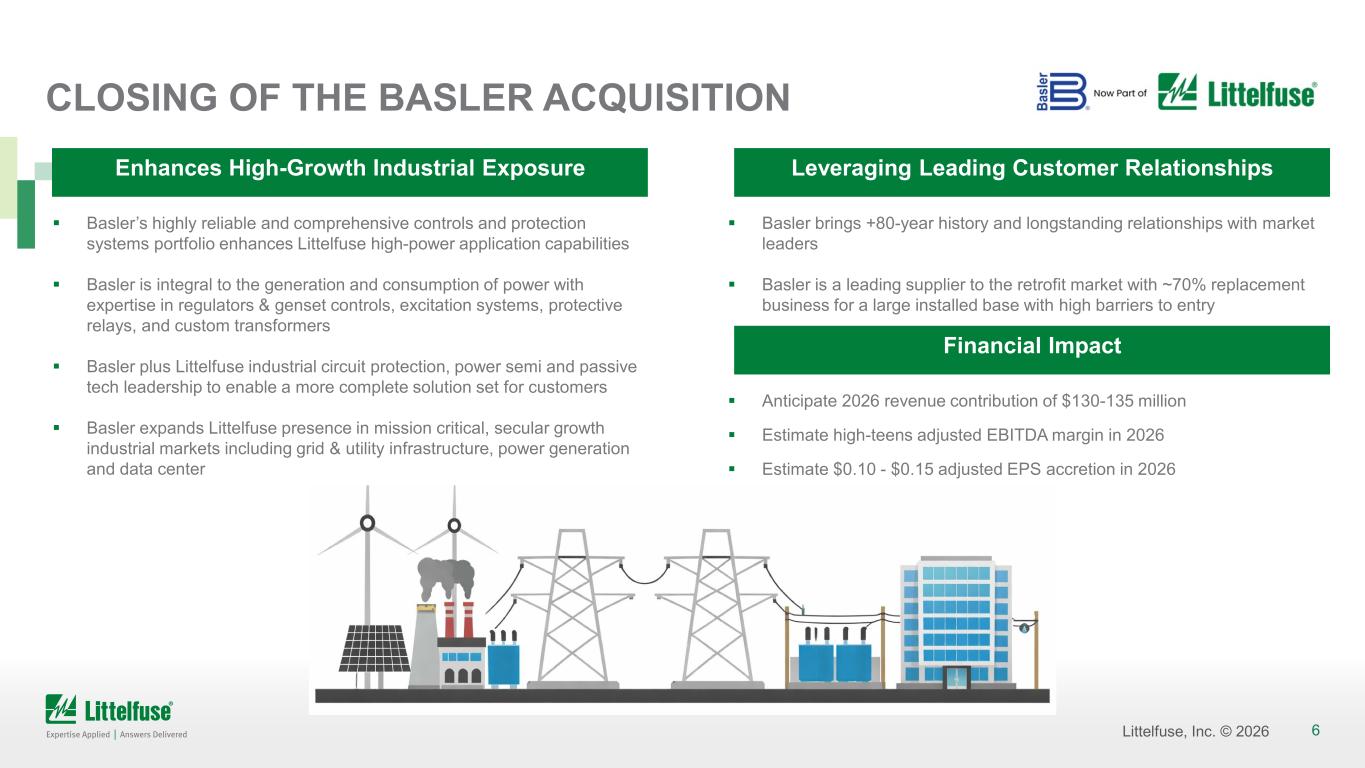
6Littelfuse, Inc. © 2026 CLOSING OF THE BASLER ACQUISITION Enhances High-Growth Industrial Exposure Basler’s highly reliable and comprehensive controls and protection systems portfolio enhances Littelfuse high-power application capabilities Basler is integral to the generation and consumption of power with expertise in regulators & genset controls, excitation systems, protective relays, and custom transformers Basler plus Littelfuse industrial circuit protection, power semi and passive tech leadership to enable a more complete solution set for customers Basler expands Littelfuse presence in mission critical, secular growth industrial markets including grid & utility infrastructure, power generation and data center Basler brings +80-year history and longstanding relationships with market leaders Basler is a leading supplier to the retrofit market with ~70% replacement business for a large installed base with high barriers to entry Leveraging Leading Customer Relationships Financial Impact Anticipate 2026 revenue contribution of $130-135 million Estimate high-teens adjusted EBITDA margin in 2026 Estimate $0.10 - $0.15 adjusted EPS accretion in 2026
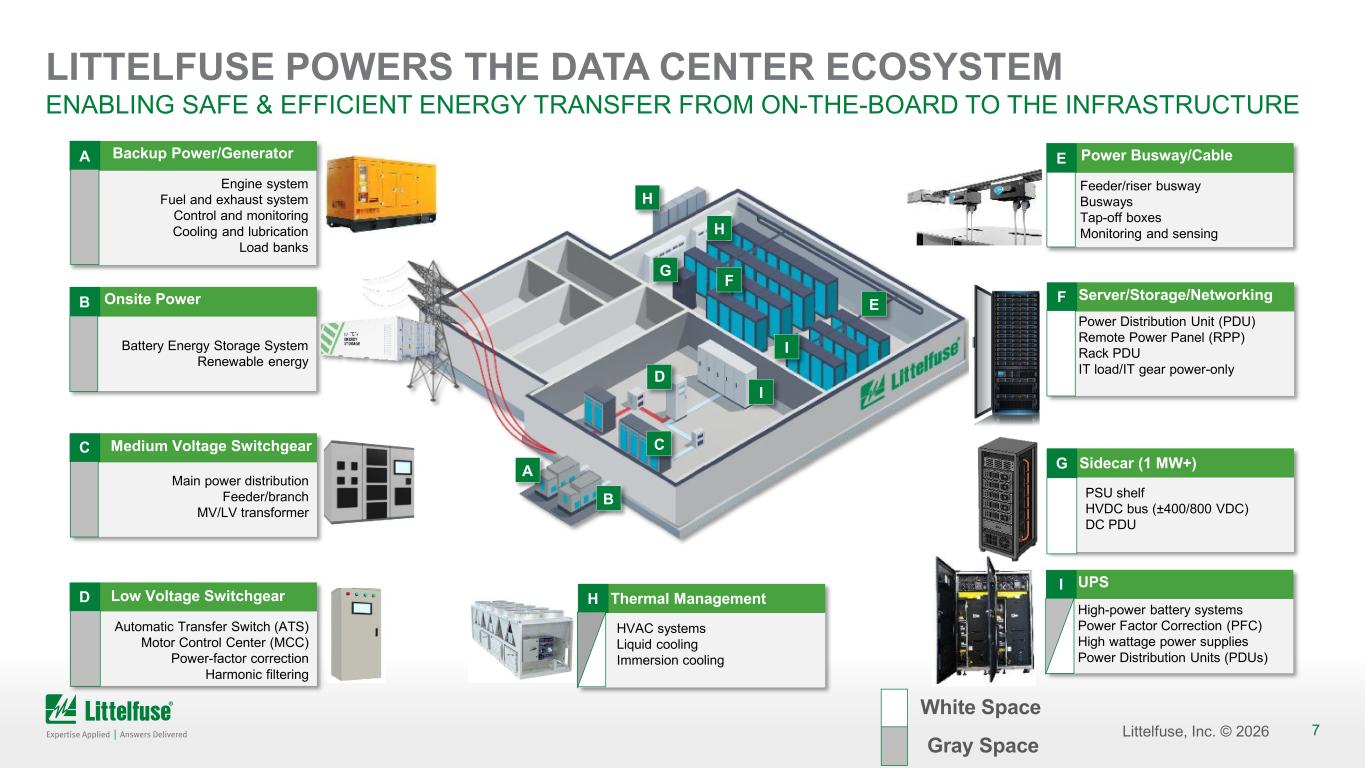
7Littelfuse, Inc. © 2026 H D C A B I G F E LITTELFUSE POWERS THE DATA CENTER ECOSYSTEM ENABLING SAFE & EFFICIENT ENERGY TRANSFER FROM ON-THE-BOARD TO THE INFRASTRUCTURE Server/Storage/NetworkingF Power Distribution Unit (PDU) Remote Power Panel (RPP) Rack PDU IT load/IT gear power-only Thermal Management HVAC systems Liquid cooling Immersion cooling HLow Voltage Switchgear Automatic Transfer Switch (ATS) Motor Control Center (MCC) Power-factor correction Harmonic filtering D Medium Voltage Switchgear Main power distribution Feeder/branch MV/LV transformer C UPS High-power battery systems Power Factor Correction (PFC) High wattage power supplies Power Distribution Units (PDUs) I A Backup Power/Generator Engine system Fuel and exhaust system Control and monitoring Cooling and lubrication Load banks E Power Busway/Cable Feeder/riser busway Busways Tap-off boxes Monitoring and sensing B Onsite Power Battery Energy Storage System Renewable energy Sidecar (1 MW+) PSU shelf HVDC bus (±400/800 VDC) DC PDU G I H White Space Gray Space
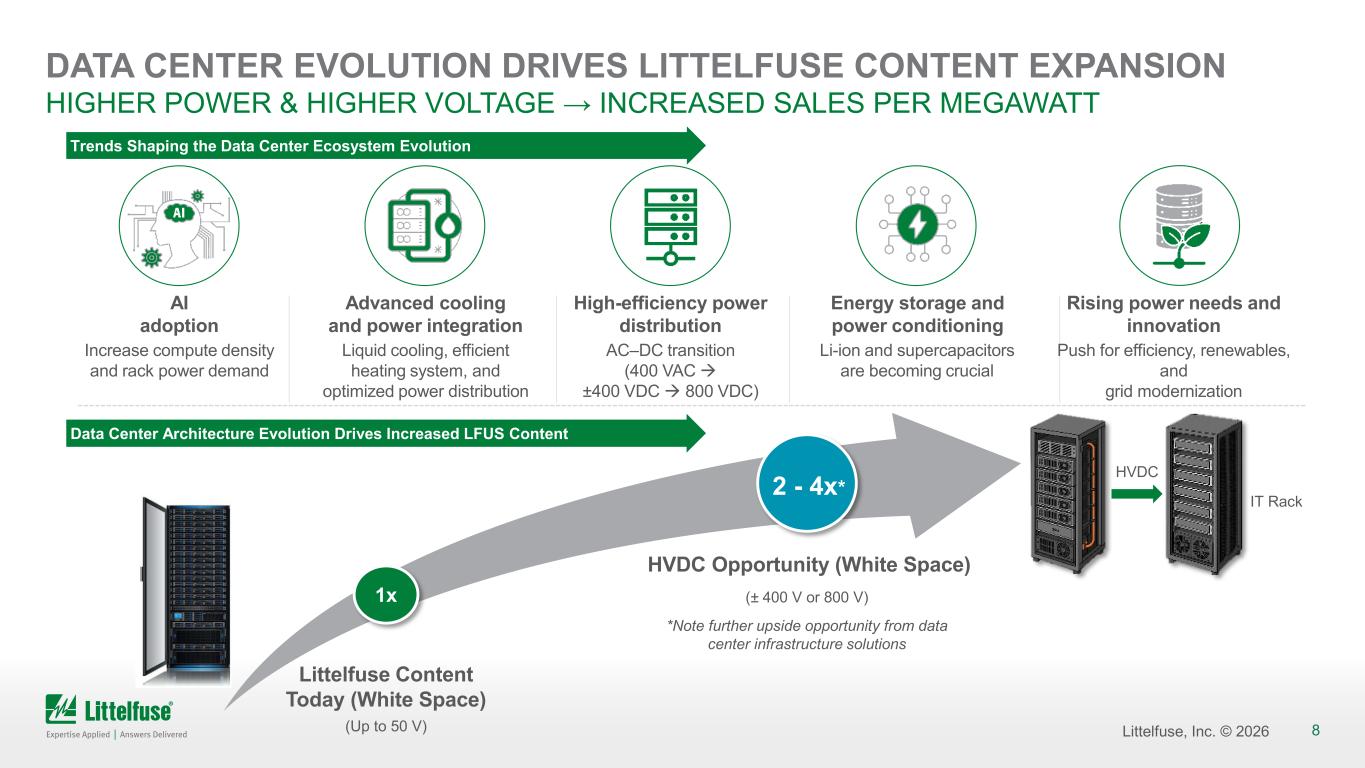
8Littelfuse, Inc. © 2026 DATA CENTER EVOLUTION DRIVES LITTELFUSE CONTENT EXPANSION HIGHER POWER & HIGHER VOLTAGE → INCREASED SALES PER MEGAWATT AI adoption Advanced cooling and power integration High-efficiency power distribution Energy storage and power conditioning Rising power needs and innovation Increase compute density and rack power demand Liquid cooling, efficient heating system, and optimized power distribution AC–DC transition (400 VAC ±400 VDC 800 VDC) Li-ion and supercapacitors are becoming crucial Push for efficiency, renewables, and grid modernization IT Rack HVDC 1x Littelfuse Content Today (White Space) (Up to 50 V) Trends Shaping the Data Center Ecosystem Evolution Data Center Architecture Evolution Drives Increased LFUS Content HVDC Opportunity (White Space) (± 400 V or 800 V) *Note further upside opportunity from data center infrastructure solutions 2 - 4x*
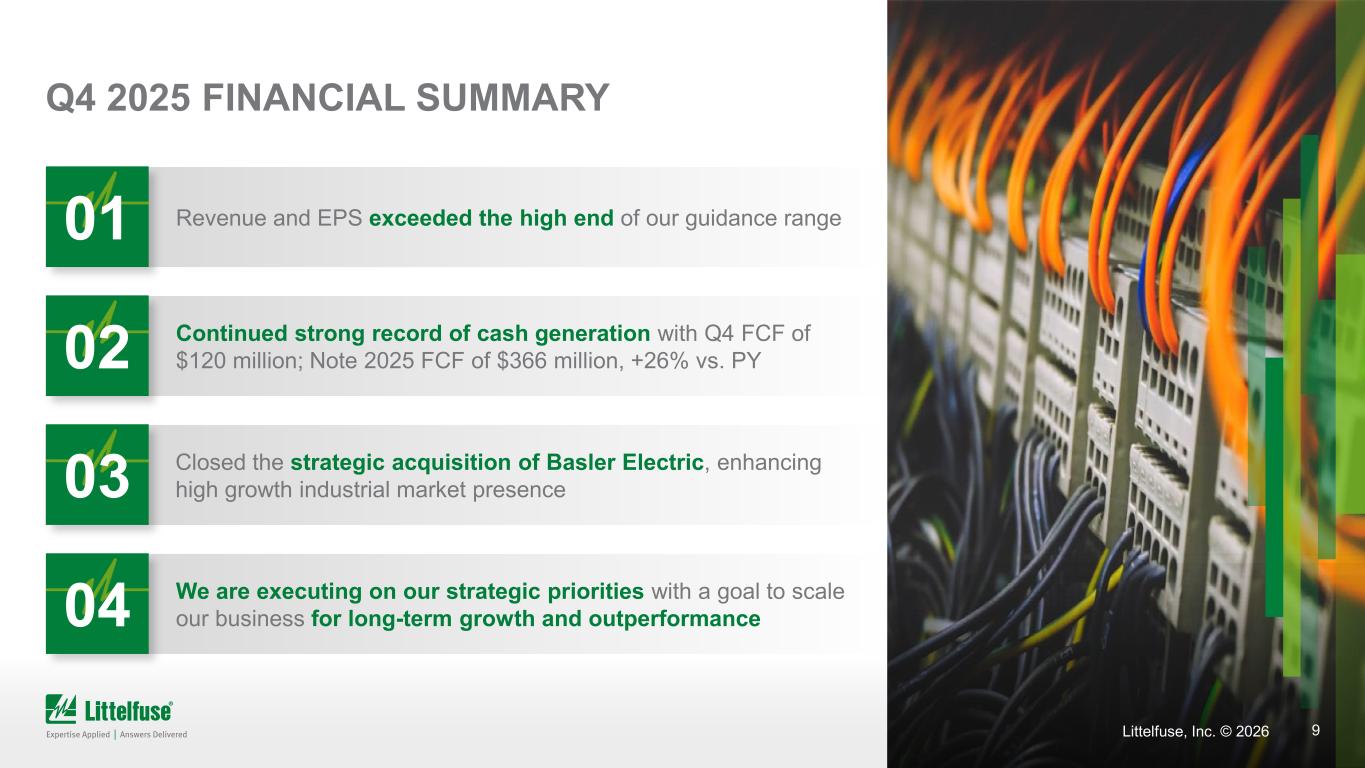
9Littelfuse, Inc. © 2026 Q4 2025 FINANCIAL SUMMARY Revenue and EPS exceeded the high end of our guidance range01 Continued strong record of cash generation with Q4 FCF of $120 million; Note 2025 FCF of $366 million, +26% vs. PY02 Closed the strategic acquisition of Basler Electric, enhancing high growth industrial market presence03 We are executing on our strategic priorities with a goal to scale our business for long-term growth and outperformance04
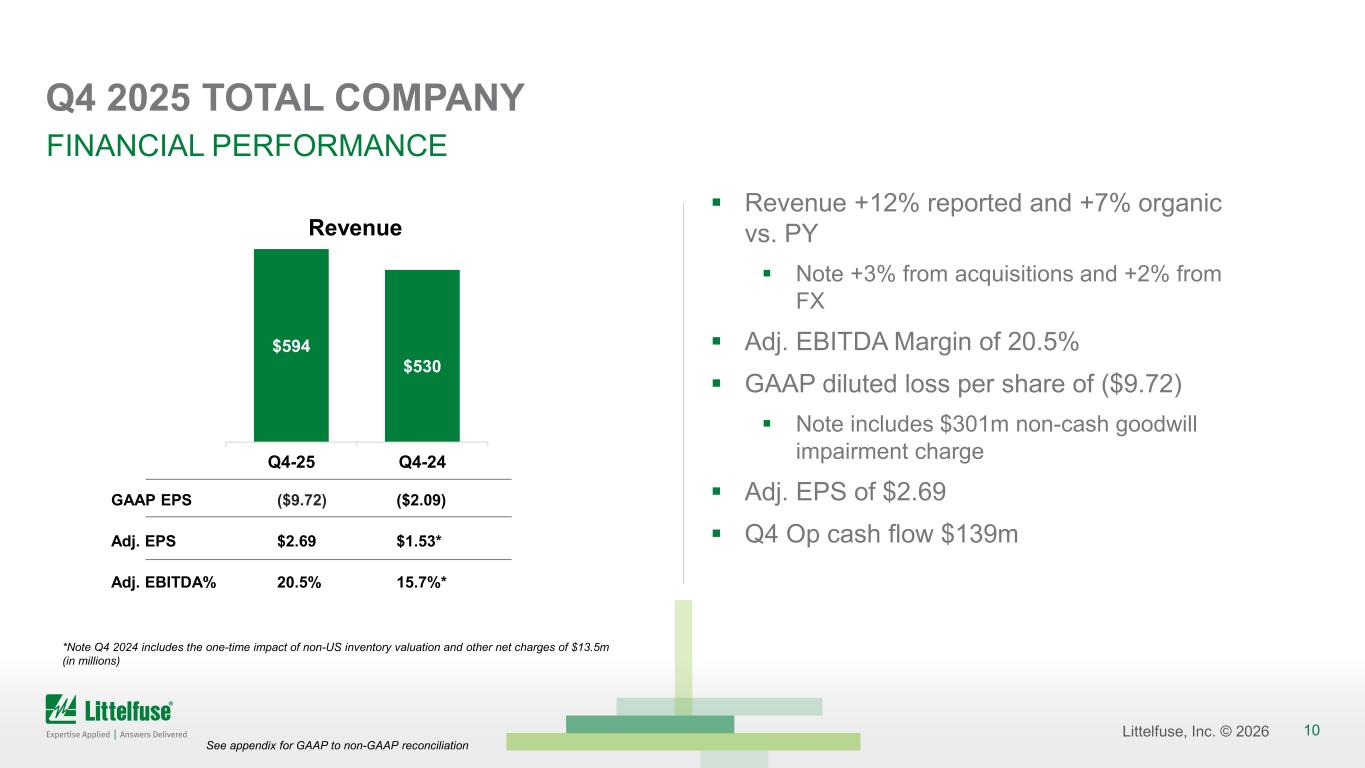
10Littelfuse, Inc. © 2026 Q4 2025 TOTAL COMPANY Revenue +12% reported and +7% organic vs. PY Note +3% from acquisitions and +2% from FX Adj. EBITDA Margin of 20.5% GAAP diluted loss per share of ($9.72) Note includes $301m non-cash goodwill impairment charge Adj. EPS of $2.69 Q4 Op cash flow $139m FINANCIAL PERFORMANCE GAAP EPS ($9.72) ($2.09) Adj. EPS $2.69 $1.53* Adj. EBITDA% 20.5% 15.7%* $594 $530 Q4-25 Q4-24 Revenue *Note Q4 2024 includes the one-time impact of non-US inventory valuation and other net charges of $13.5m (in millions) See appendix for GAAP to non-GAAP reconciliation
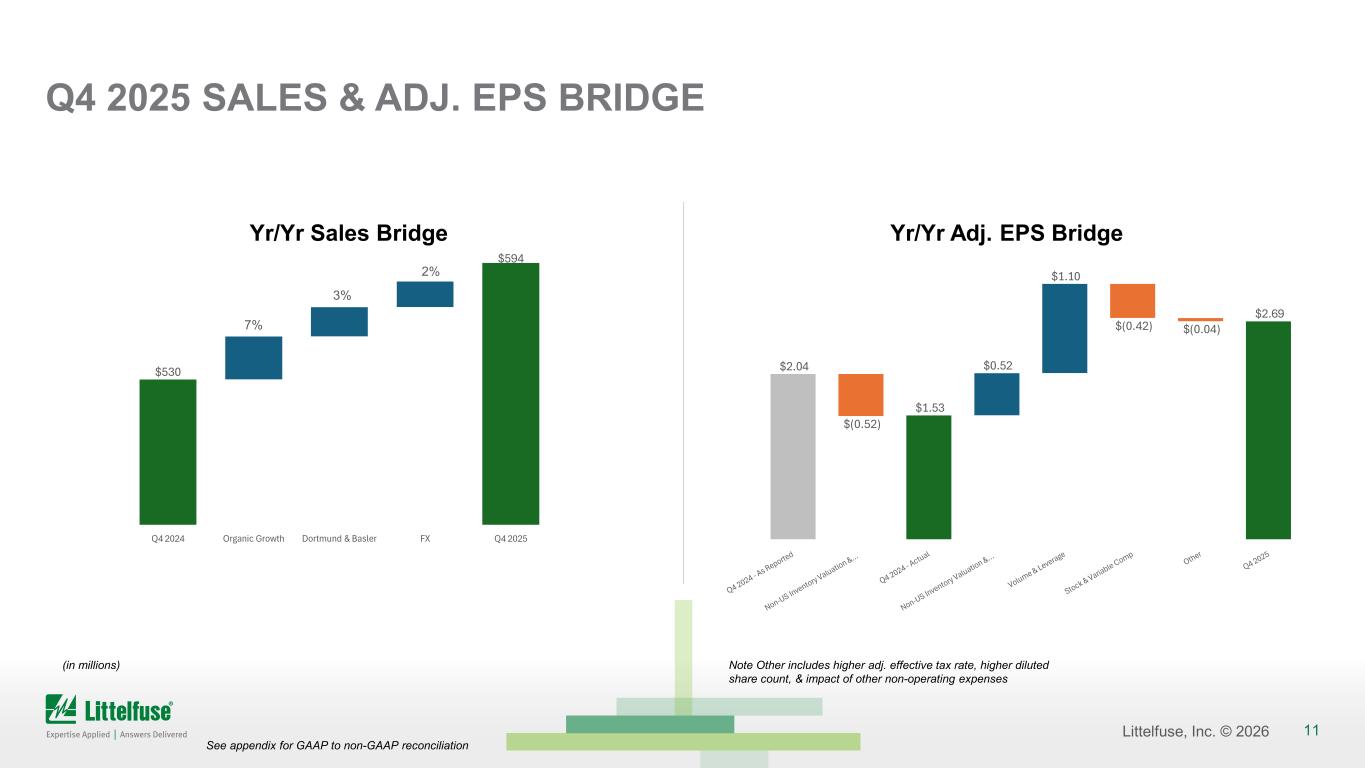
11Littelfuse, Inc. © 2026 $530 $594 Q4 2024 Organic Growth Dortmund & Basler FX Q4 2025 Q4 2025 SALES & ADJ. EPS BRIDGE (in millions) See appendix for GAAP to non-GAAP reconciliation Yr/Yr Sales Bridge 7% 3% 2% Yr/Yr Adj. EPS Bridge Note Other includes higher adj. effective tax rate, higher diluted share count, & impact of other non-operating expenses $2.04 $(0.52) $1.53 $0.52 $1.10 $(0.42) $(0.04) $2.69
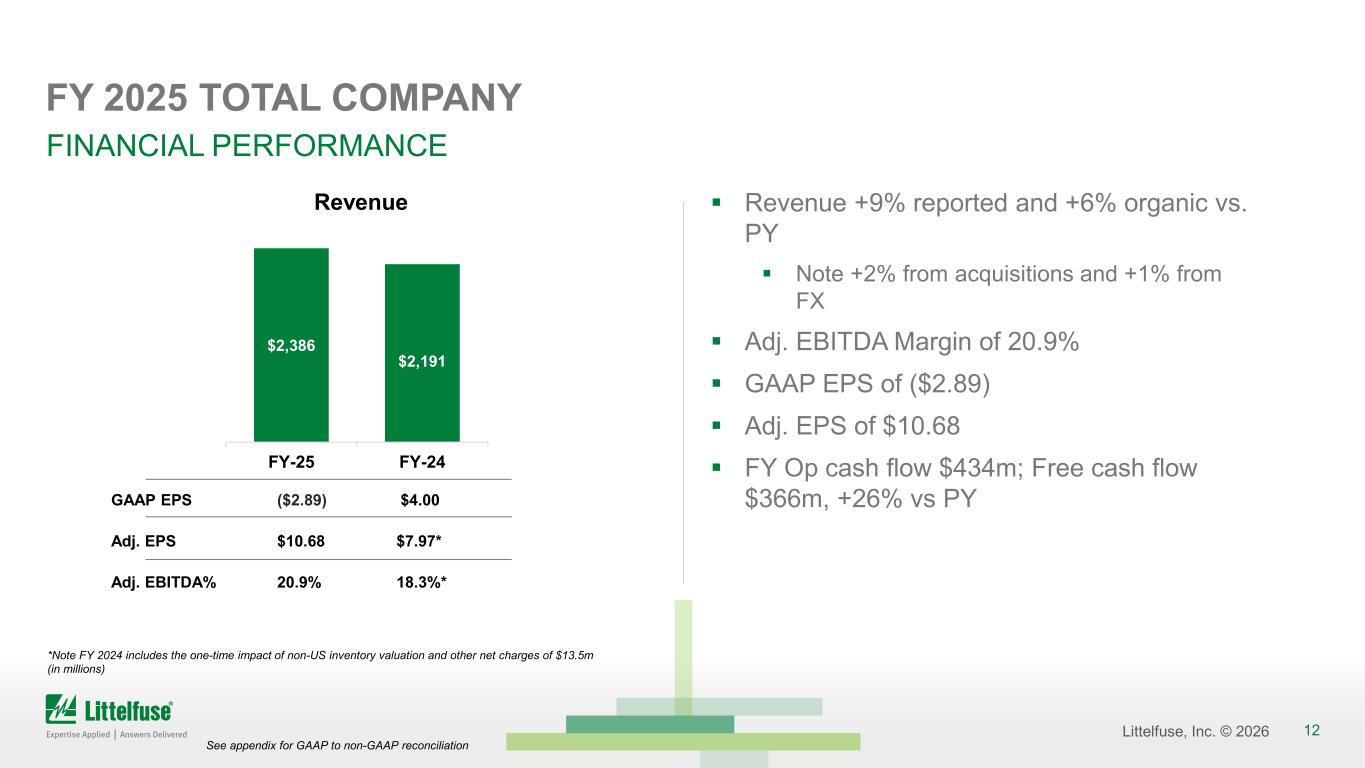
12Littelfuse, Inc. © 2026 FY 2025 TOTAL COMPANY Revenue +9% reported and +6% organic vs. PY Note +2% from acquisitions and +1% from FX Adj. EBITDA Margin of 20.9% GAAP EPS of ($2.89) Adj. EPS of $10.68 FY Op cash flow $434m; Free cash flow $366m, +26% vs PY FINANCIAL PERFORMANCE GAAP EPS ($2.89) $4.00 Adj. EPS $10.68 $7.97* Adj. EBITDA% 20.9% 18.3%* $2,386 $2,191 FY-25 FY-24 Revenue See appendix for GAAP to non-GAAP reconciliation *Note FY 2024 includes the one-time impact of non-US inventory valuation and other net charges of $13.5m (in millions)
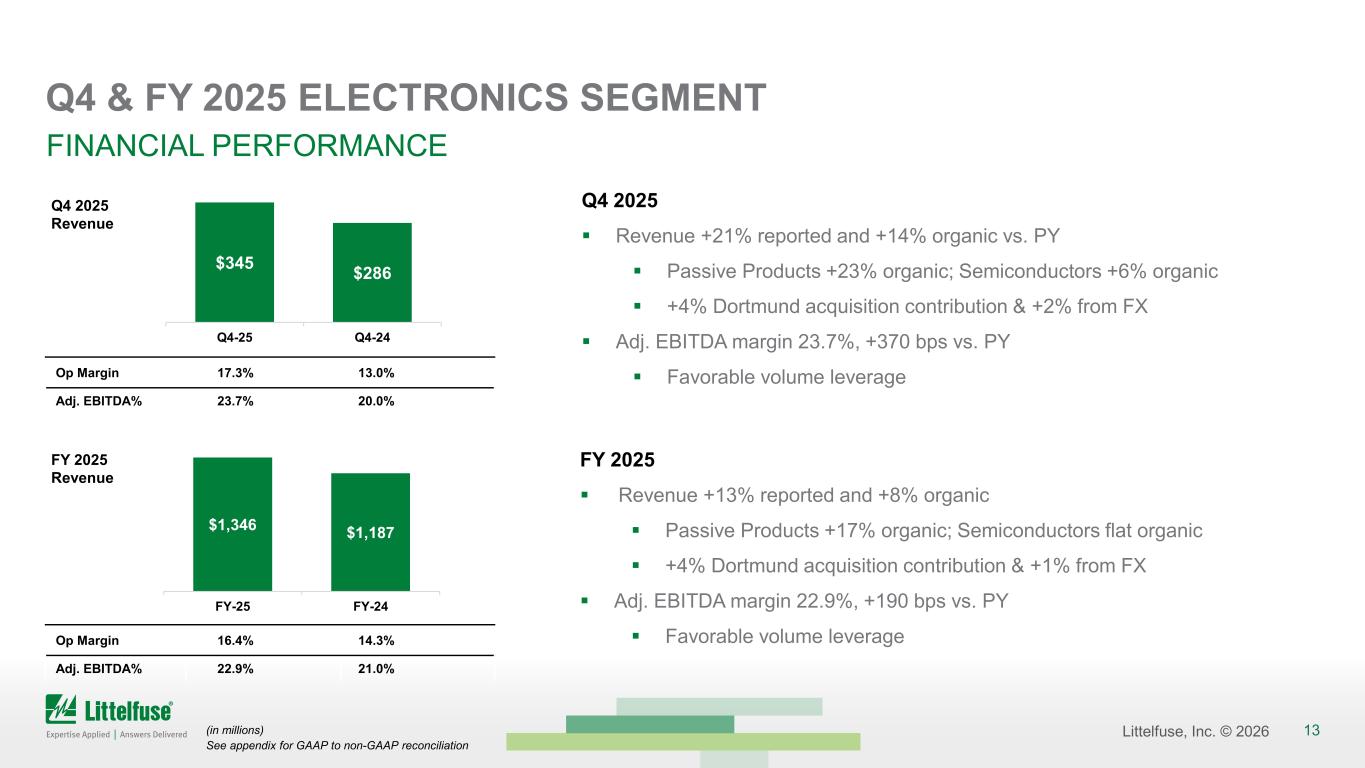
13Littelfuse, Inc. © 2026 Q4 & FY 2025 ELECTRONICS SEGMENT FINANCIAL PERFORMANCE Op Margin 17.3% 13.0% Adj. EBITDA% 23.7% 20.0% $345 $286 Q4-25 Q4-24 See appendix for GAAP to non-GAAP reconciliation $1,346 $1,187 FY-25 FY-24 Op Margin 16.4% 14.3% Adj. EBITDA% 22.9% 21.0% Q4 2025 Revenue +21% reported and +14% organic vs. PY Passive Products +23% organic; Semiconductors +6% organic +4% Dortmund acquisition contribution & +2% from FX Adj. EBITDA margin 23.7%, +370 bps vs. PY Favorable volume leverage FY 2025 Revenue +13% reported and +8% organic Passive Products +17% organic; Semiconductors flat organic +4% Dortmund acquisition contribution & +1% from FX Adj. EBITDA margin 22.9%, +190 bps vs. PY Favorable volume leverage (in millions) Q4 2025 Revenue FY 2025 Revenue
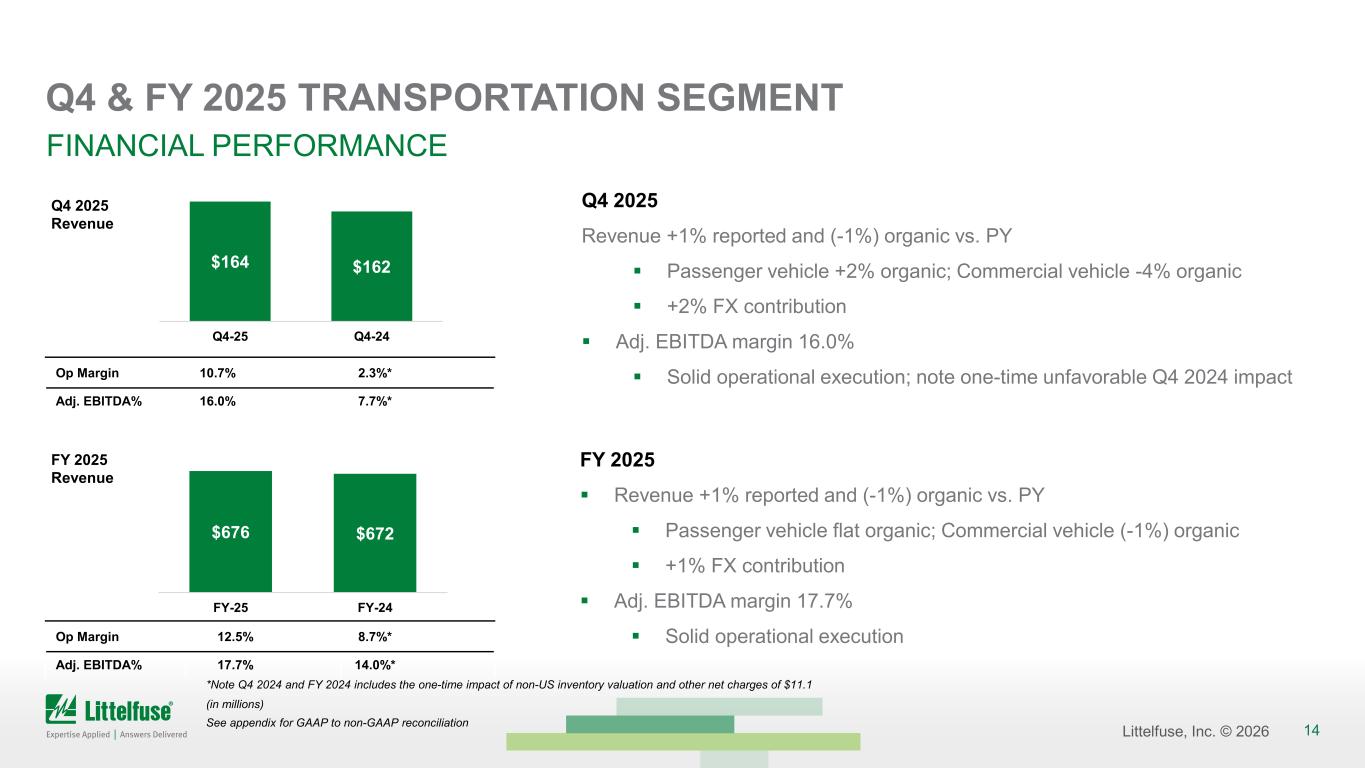
14Littelfuse, Inc. © 2026 Q4 & FY 2025 TRANSPORTATION SEGMENT FINANCIAL PERFORMANCE Op Margin 10.7% 2.3%* Adj. EBITDA% 16.0% 7.7%* (in millions) See appendix for GAAP to non-GAAP reconciliation Op Margin 12.5% 8.7%* Adj. EBITDA% 17.7% 14.0%* Q4 2025 Revenue +1% reported and (-1%) organic vs. PY Passenger vehicle +2% organic; Commercial vehicle -4% organic +2% FX contribution Adj. EBITDA margin 16.0% Solid operational execution; note one-time unfavorable Q4 2024 impact FY 2025 Revenue +1% reported and (-1%) organic vs. PY Passenger vehicle flat organic; Commercial vehicle (-1%) organic +1% FX contribution Adj. EBITDA margin 17.7% Solid operational execution *Note Q4 2024 and FY 2024 includes the one-time impact of non-US inventory valuation and other net charges of $11.1 $676 $672 FY-25 FY-24 $164 $162 Q4-25 Q4-24 Q4 2025 Revenue FY 2025 Revenue
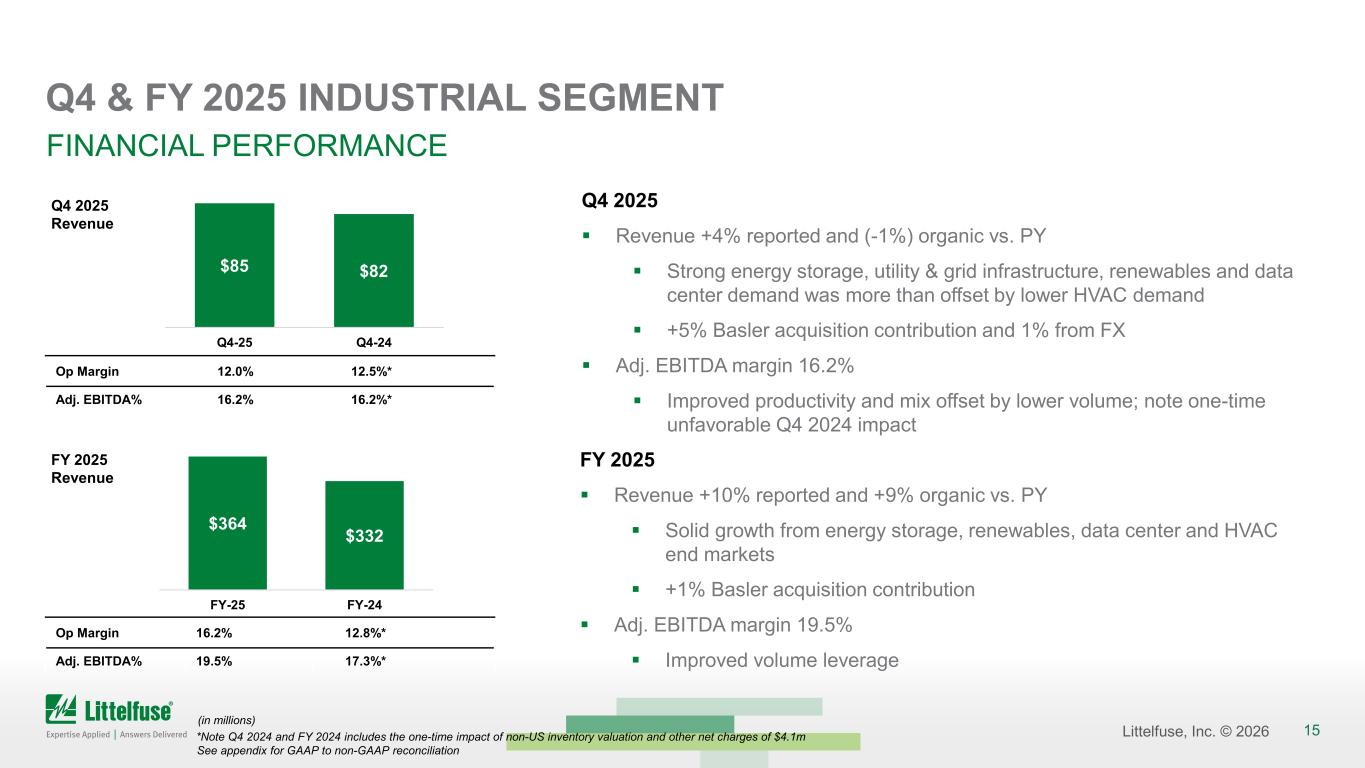
15Littelfuse, Inc. © 2026 Q4 & FY 2025 INDUSTRIAL SEGMENT FINANCIAL PERFORMANCE Op Margin 12.0% 12.5%* Adj. EBITDA% 16.2% 16.2%* See appendix for GAAP to non-GAAP reconciliation Op Margin 16.2% 12.8%* Adj. EBITDA% 19.5% 17.3%* Q4 2025 Revenue +4% reported and (-1%) organic vs. PY Strong energy storage, utility & grid infrastructure, renewables and data center demand was more than offset by lower HVAC demand +5% Basler acquisition contribution and 1% from FX Adj. EBITDA margin 16.2% Improved productivity and mix offset by lower volume; note one-time unfavorable Q4 2024 impact FY 2025 Revenue +10% reported and +9% organic vs. PY Solid growth from energy storage, renewables, data center and HVAC end markets +1% Basler acquisition contribution Adj. EBITDA margin 19.5% Improved volume leverage (in millions) *Note Q4 2024 and FY 2024 includes the one-time impact of non-US inventory valuation and other net charges of $4.1m $85 $82 Q4-25 Q4-24 $364 $332 FY-25 FY-24 Q4 2025 Revenue FY 2025 Revenue
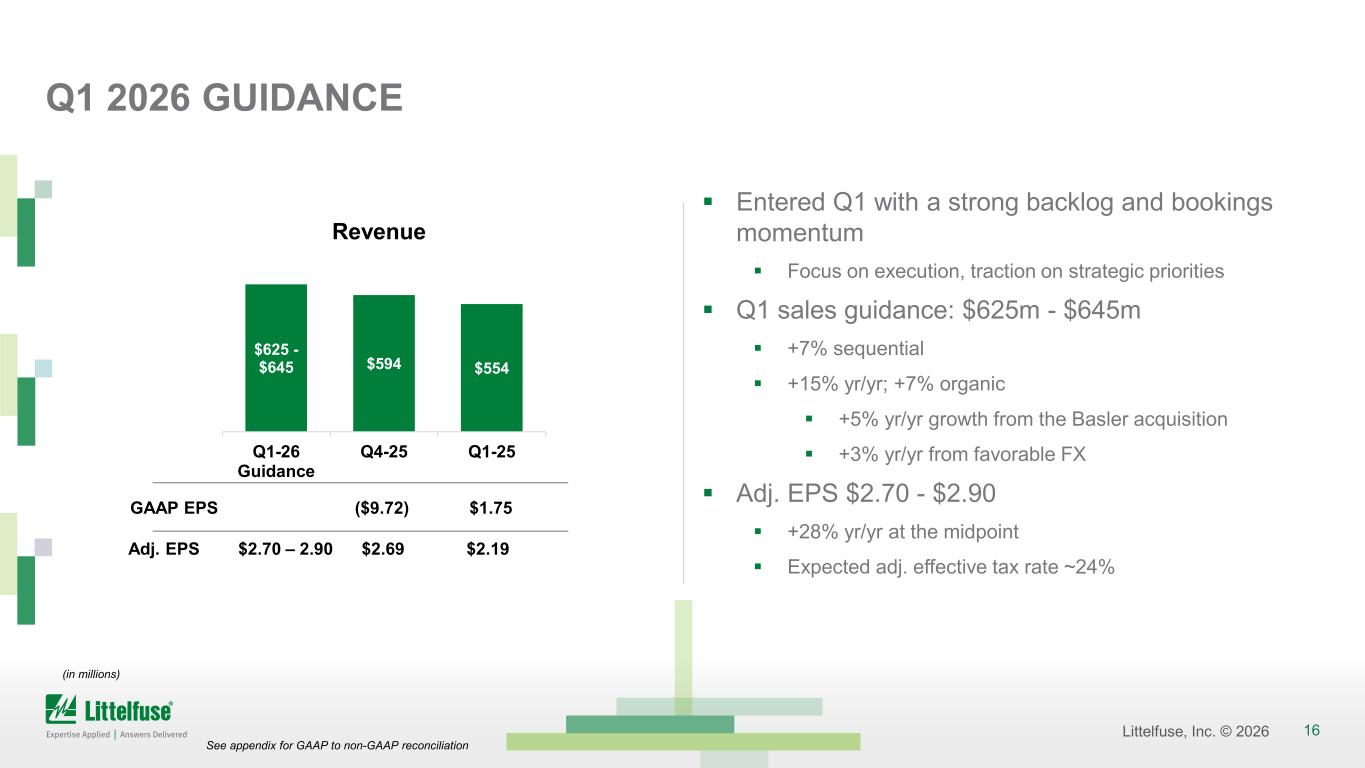
16Littelfuse, Inc. © 2026 Q1 2026 GUIDANCE Entered Q1 with a strong backlog and bookings momentum Focus on execution, traction on strategic priorities Q1 sales guidance: $625m - $645m +7% sequential +15% yr/yr; +7% organic +5% yr/yr growth from the Basler acquisition +3% yr/yr from favorable FX Adj. EPS $2.70 - $2.90 +28% yr/yr at the midpoint Expected adj. effective tax rate ~24% (in millions) $625 - $645 $594 $554 Q1-26 Guidance Q4-25 Q1-25 Revenue Adj. EPS $2.70 – 2.90 $2.69 $2.19 GAAP EPS ($9.72) $1.75 See appendix for GAAP to non-GAAP reconciliation
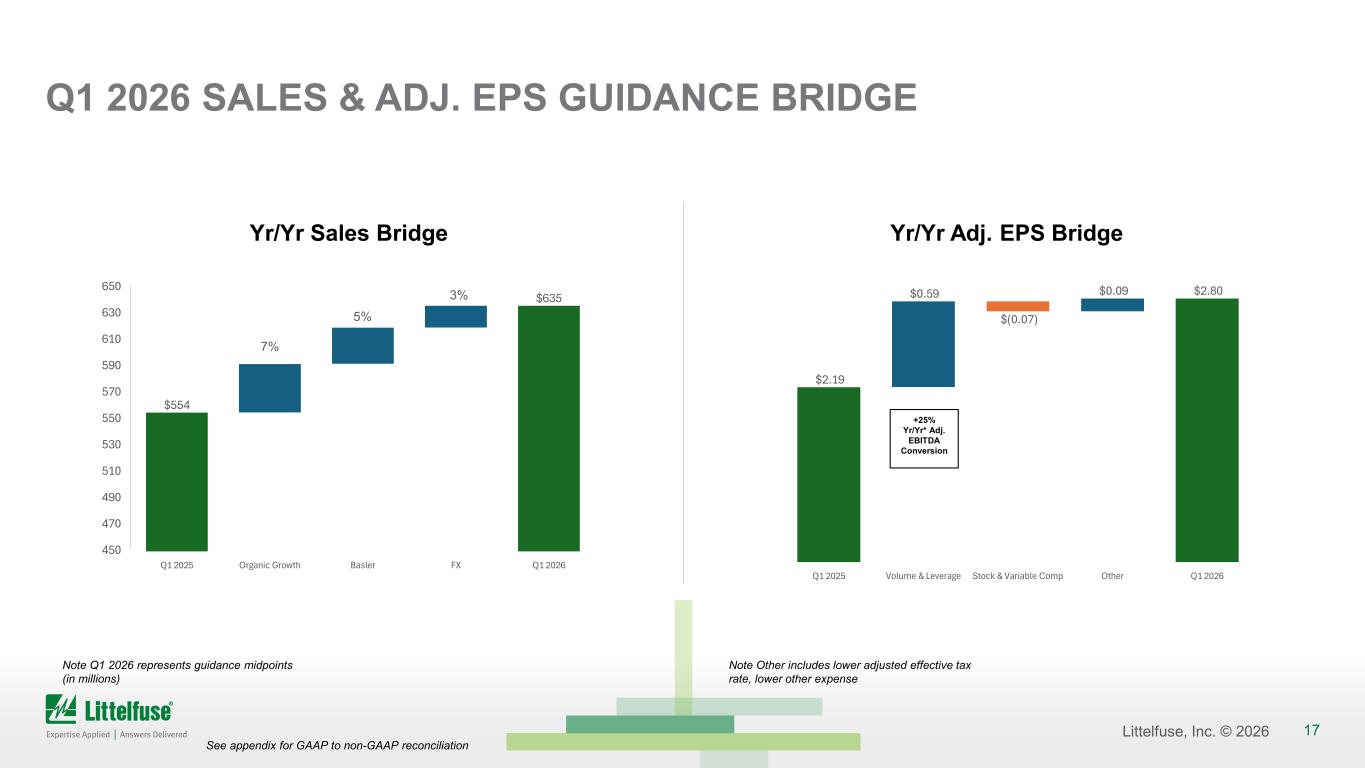
17Littelfuse, Inc. © 2026 $2.19 $0.59 $(0.07) $0.09 $2.80 Q1 2025 Volume & Leverage Stock & Variable Comp Other Q1 2026 $554 $635 Q1 2025 Organic Growth Basler FX Q1 2026 450 470 490 510 530 550 570 590 610 630 650 Q1 2026 SALES & ADJ. EPS GUIDANCE BRIDGE Note Q1 2026 represents guidance midpoints (in millions) See appendix for GAAP to non-GAAP reconciliation Yr/Yr Sales Bridge 7% 5% 3% Yr/Yr Adj. EPS Bridge +25% Yr/Yr* Adj. EBITDA Conversion Note Other includes lower adjusted effective tax rate, lower other expense
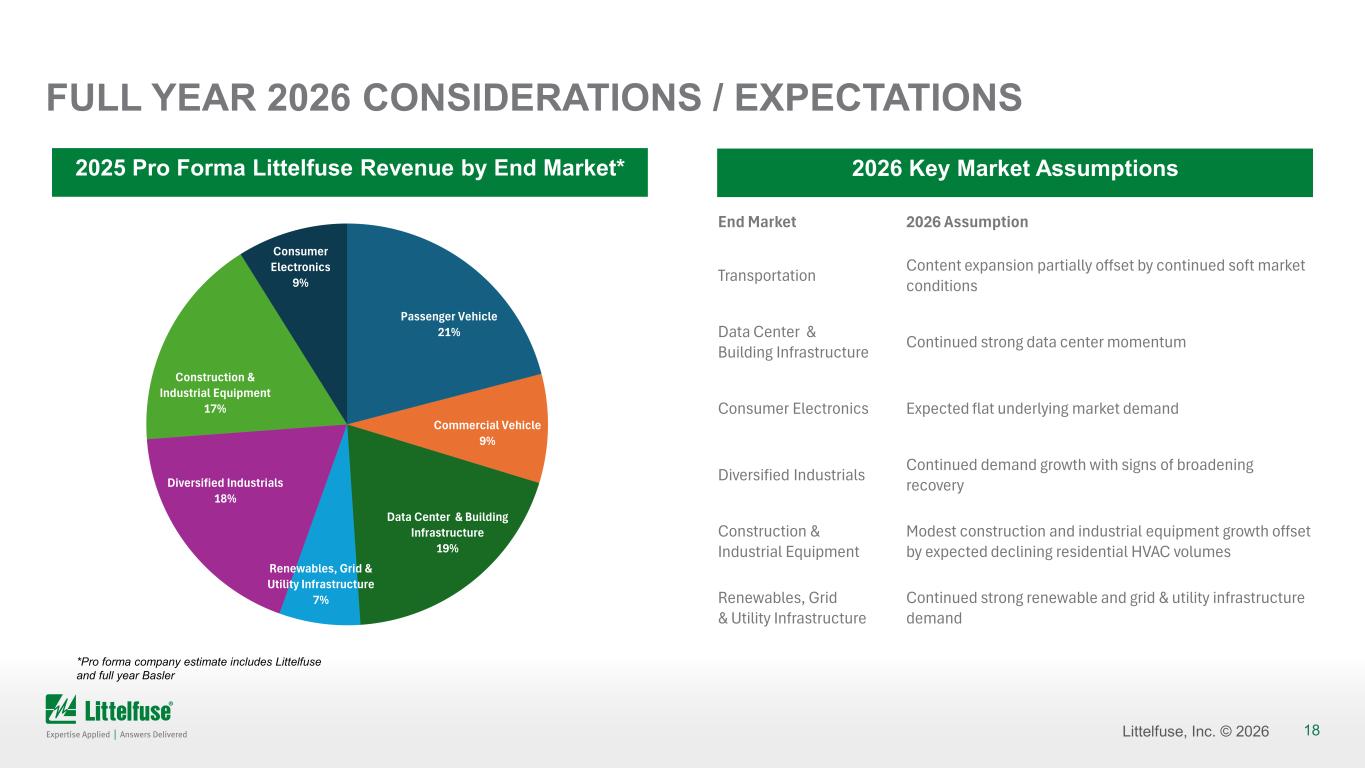
18Littelfuse, Inc. © 2026 FULL YEAR 2026 CONSIDERATIONS / EXPECTATIONS 2025 Pro Forma Littelfuse Revenue by End Market* 2026 Key Market Assumptions *Pro forma company estimate includes Littelfuse and full year Basler End Market 2026 Assumption Transportation Content expansion partially offset by continued soft market conditions Data Center & Building Infrastructure Continued strong data center momentum Consumer Electronics Expected flat underlying market demand Diversified Industrials Continued demand growth with signs of broadening recovery Construction & Industrial Equipment Modest construction and industrial equipment growth offset by expected declining residential HVAC volumes Renewables, Grid & Utility Infrastructure Continued strong renewable and grid & utility infrastructure demand Passenger Vehicle 21% Commercial Vehicle 9% Data Center & Building Infrastructure 19% Renewables, Grid & Utility Infrastructure 7% Diversified Industrials 18% Construction & Industrial Equipment 17% Consumer Electronics 9%

19Littelfuse, Inc. © 2026 APPENDIX
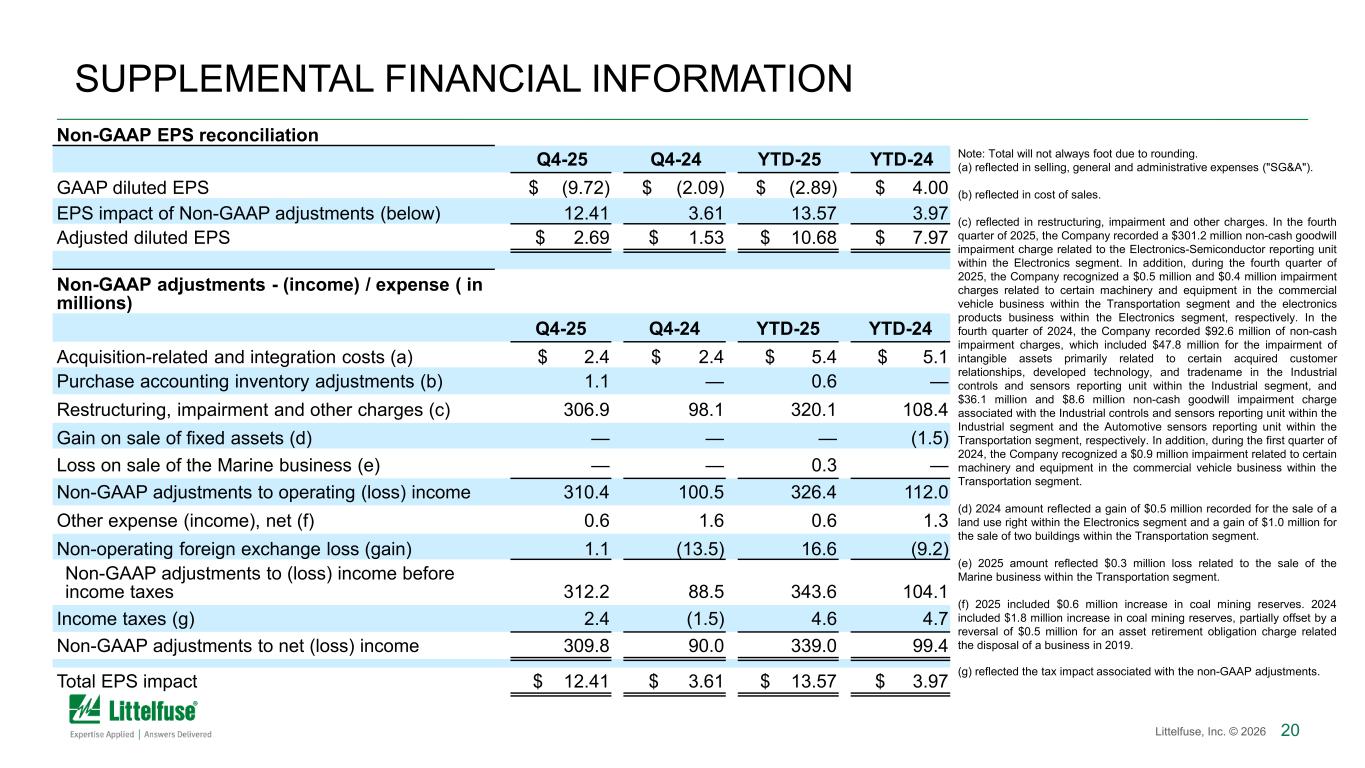
20Littelfuse, Inc. © 2026 SUPPLEMENTAL FINANCIAL INFORMATION Non-GAAP EPS reconciliation Q4-25 Q4-24 YTD-25 YTD-24 GAAP diluted EPS $ (9.72) $ (2.09) $ (2.89) $ 4.00 EPS impact of Non-GAAP adjustments (below) 12.41 3.61 13.57 3.97 Adjusted diluted EPS $ 2.69 $ 1.53 $ 10.68 $ 7.97 Non-GAAP adjustments - (income) / expense ( in millions) Q4-25 Q4-24 YTD-25 YTD-24 Acquisition-related and integration costs (a) $ 2.4 $ 2.4 $ 5.4 $ 5.1 Purchase accounting inventory adjustments (b) 1.1 — 0.6 — Restructuring, impairment and other charges (c) 306.9 98.1 320.1 108.4 Gain on sale of fixed assets (d) — — — (1.5) Loss on sale of the Marine business (e) — — 0.3 — Non-GAAP adjustments to operating (loss) income 310.4 100.5 326.4 112.0 Other expense (income), net (f) 0.6 1.6 0.6 1.3 Non-operating foreign exchange loss (gain) 1.1 (13.5) 16.6 (9.2) Non-GAAP adjustments to (loss) income before income taxes 312.2 88.5 343.6 104.1 Income taxes (g) 2.4 (1.5) 4.6 4.7 Non-GAAP adjustments to net (loss) income 309.8 90.0 339.0 99.4 Total EPS impact $ 12.41 $ 3.61 $ 13.57 $ 3.97 Note: Total will not always foot due to rounding. (a) reflected in selling, general and administrative expenses ("SG&A"). (b) reflected in cost of sales. (c) reflected in restructuring, impairment and other charges. In the fourth quarter of 2025, the Company recorded a $301.2 million non-cash goodwill impairment charge related to the Electronics-Semiconductor reporting unit within the Electronics segment. In addition, during the fourth quarter of 2025, the Company recognized a $0.5 million and $0.4 million impairment charges related to certain machinery and equipment in the commercial vehicle business within the Transportation segment and the electronics products business within the Electronics segment, respectively. In the fourth quarter of 2024, the Company recorded $92.6 million of non-cash impairment charges, which included $47.8 million for the impairment of intangible assets primarily related to certain acquired customer relationships, developed technology, and tradename in the Industrial controls and sensors reporting unit within the Industrial segment, and $36.1 million and $8.6 million non-cash goodwill impairment charge associated with the Industrial controls and sensors reporting unit within the Industrial segment and the Automotive sensors reporting unit within the Transportation segment, respectively. In addition, during the first quarter of 2024, the Company recognized a $0.9 million impairment related to certain machinery and equipment in the commercial vehicle business within the Transportation segment. (d) 2024 amount reflected a gain of $0.5 million recorded for the sale of a land use right within the Electronics segment and a gain of $1.0 million for the sale of two buildings within the Transportation segment. (e) 2025 amount reflected $0.3 million loss related to the sale of the Marine business within the Transportation segment. (f) 2025 included $0.6 million increase in coal mining reserves. 2024 included $1.8 million increase in coal mining reserves, partially offset by a reversal of $0.5 million for an asset retirement obligation charge related the disposal of a business in 2019. (g) reflected the tax impact associated with the non-GAAP adjustments.
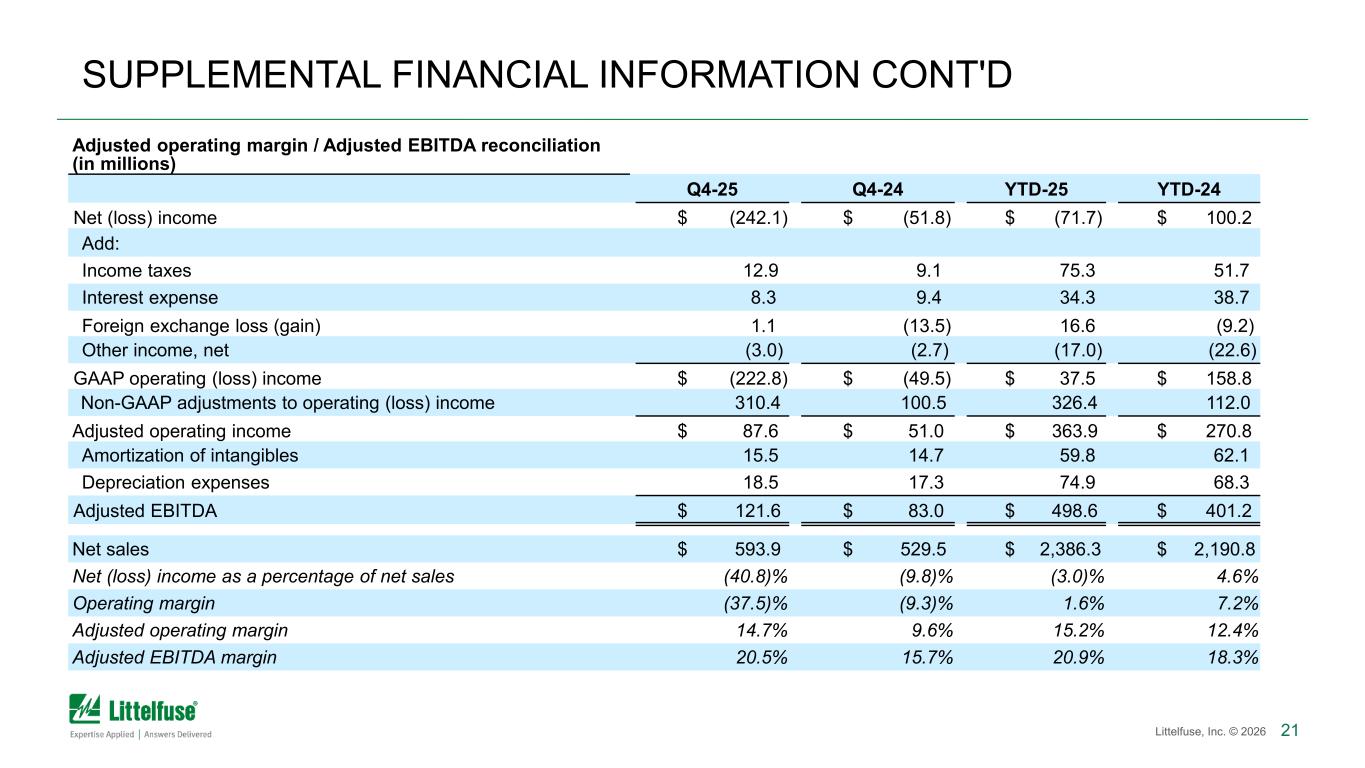
21Littelfuse, Inc. © 2026 SUPPLEMENTAL FINANCIAL INFORMATION CONT'D Adjusted operating margin / Adjusted EBITDA reconciliation (in millions) Q4-25 Q4-24 YTD-25 YTD-24 Net (loss) income $ (242.1) $ (51.8) $ (71.7) $ 100.2 Add: Income taxes 12.9 9.1 75.3 51.7 Interest expense 8.3 9.4 34.3 38.7 Foreign exchange loss (gain) 1.1 (13.5) 16.6 (9.2) Other income, net (3.0) (2.7) (17.0) (22.6) GAAP operating (loss) income $ (222.8) $ (49.5) $ 37.5 $ 158.8 Non-GAAP adjustments to operating (loss) income 310.4 100.5 326.4 112.0 Adjusted operating income $ 87.6 $ 51.0 $ 363.9 $ 270.8 Amortization of intangibles 15.5 14.7 59.8 62.1 Depreciation expenses 18.5 17.3 74.9 68.3 Adjusted EBITDA $ 121.6 $ 83.0 $ 498.6 $ 401.2 Net sales $ 593.9 $ 529.5 $ 2,386.3 $ 2,190.8 Net (loss) income as a percentage of net sales (40.8)% (9.8)% (3.0)% 4.6% Operating margin (37.5)% (9.3)% 1.6% 7.2% Adjusted operating margin 14.7% 9.6% 15.2% 12.4% Adjusted EBITDA margin 20.5% 15.7% 20.9% 18.3%
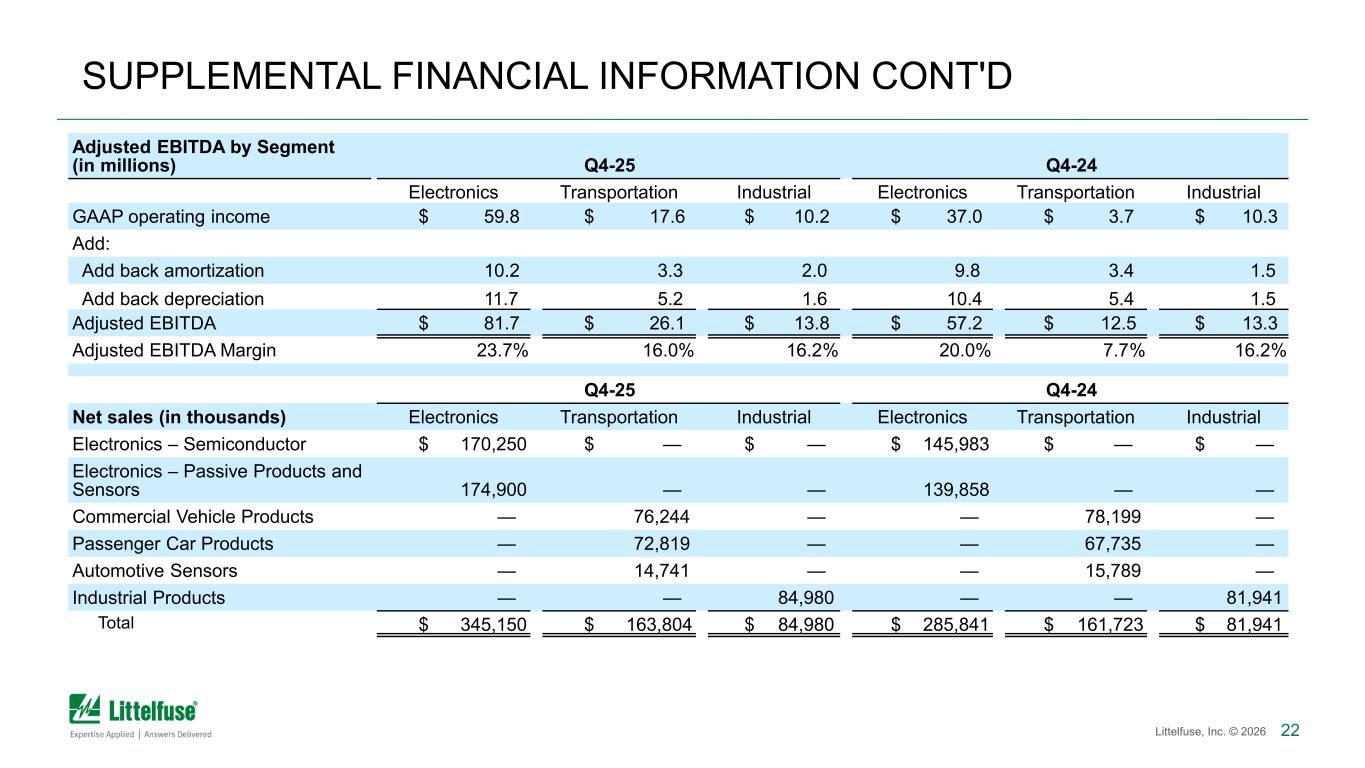
22Littelfuse, Inc. © 2026 SUPPLEMENTAL FINANCIAL INFORMATION CONT'D Adjusted EBITDA by Segment (in millions) Q4-25 Q4-24 Electronics Transportation Industrial Electronics Transportation Industrial GAAP operating income $ 59.8 $ 17.6 $ 10.2 $ 37.0 $ 3.7 $ 10.3 Add: Add back amortization 10.2 3.3 2.0 9.8 3.4 1.5 Add back depreciation 11.7 5.2 1.6 10.4 5.4 1.5 Adjusted EBITDA $ 81.7 $ 26.1 $ 13.8 $ 57.2 $ 12.5 $ 13.3 Adjusted EBITDA Margin 23.7% 16.0% 16.2% 20.0% 7.7% 16.2% Q4-25 Q4-24 Net sales (in thousands) Electronics Transportation Industrial Electronics Transportation Industrial Electronics – Semiconductor $ 170,250 $ — $ — $ 145,983 $ — $ — Electronics – Passive Products and Sensors 174,900 — — 139,858 — — Commercial Vehicle Products — 76,244 — — 78,199 — Passenger Car Products — 72,819 — — 67,735 — Automotive Sensors — 14,741 — — 15,789 — Industrial Products — — 84,980 — — 81,941 Total $ 345,150 $ 163,804 $ 84,980 $ 285,841 $ 161,723 $ 81,941
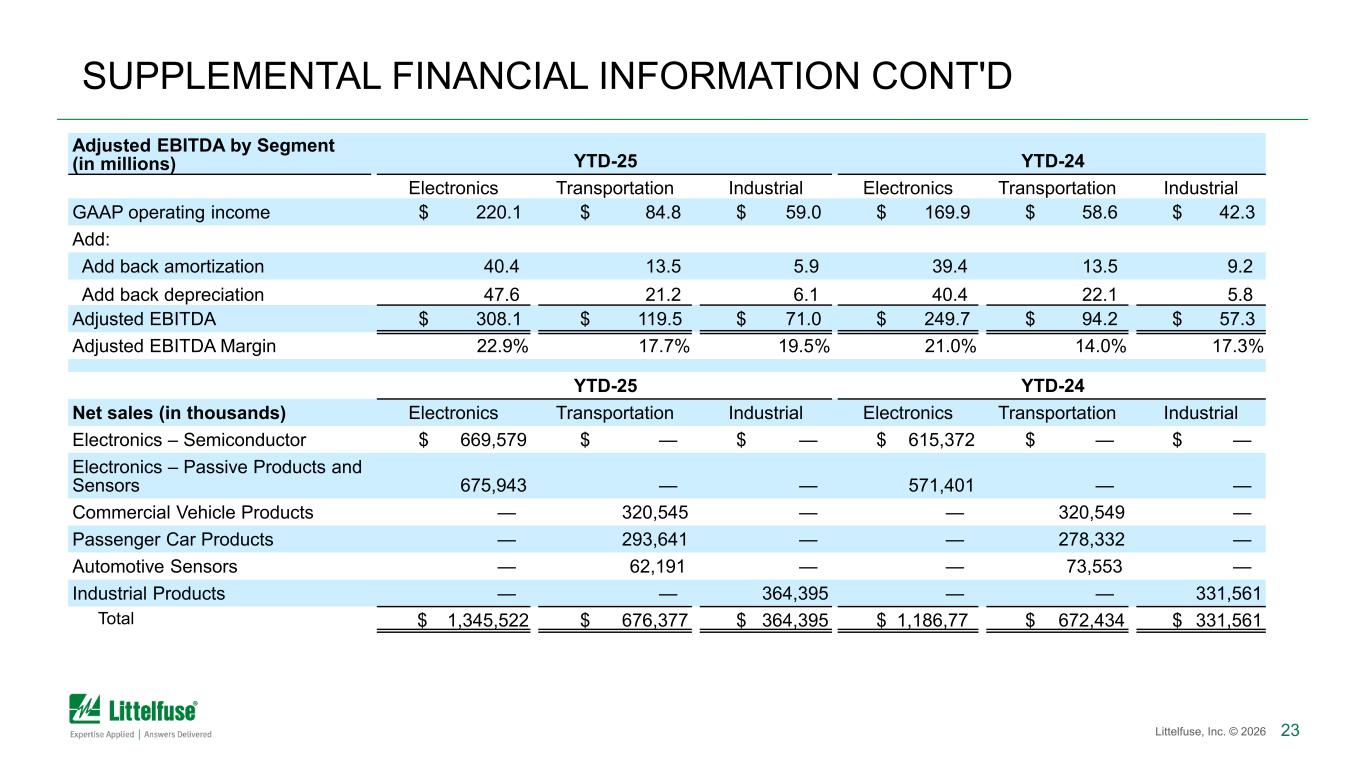
23Littelfuse, Inc. © 2026 SUPPLEMENTAL FINANCIAL INFORMATION CONT'D Adjusted EBITDA by Segment (in millions) YTD-25 YTD-24 Electronics Transportation Industrial Electronics Transportation Industrial GAAP operating income $ 220.1 $ 84.8 $ 59.0 $ 169.9 $ 58.6 $ 42.3 Add: Add back amortization 40.4 13.5 5.9 39.4 13.5 9.2 Add back depreciation 47.6 21.2 6.1 40.4 22.1 5.8 Adjusted EBITDA $ 308.1 $ 119.5 $ 71.0 $ 249.7 $ 94.2 $ 57.3 Adjusted EBITDA Margin 22.9% 17.7% 19.5% 21.0% 14.0% 17.3% YTD-25 YTD-24 Net sales (in thousands) Electronics Transportation Industrial Electronics Transportation Industrial Electronics – Semiconductor $ 669,579 $ — $ — $ 615,372 $ — $ — Electronics – Passive Products and Sensors 675,943 — — 571,401 — — Commercial Vehicle Products — 320,545 — — 320,549 — Passenger Car Products — 293,641 — — 278,332 — Automotive Sensors — 62,191 — — 73,553 — Industrial Products — — 364,395 — — 331,561 Total $ 1,345,522 $ 676,377 $ 364,395 $ 1,186,77 $ 672,434 $ 331,561
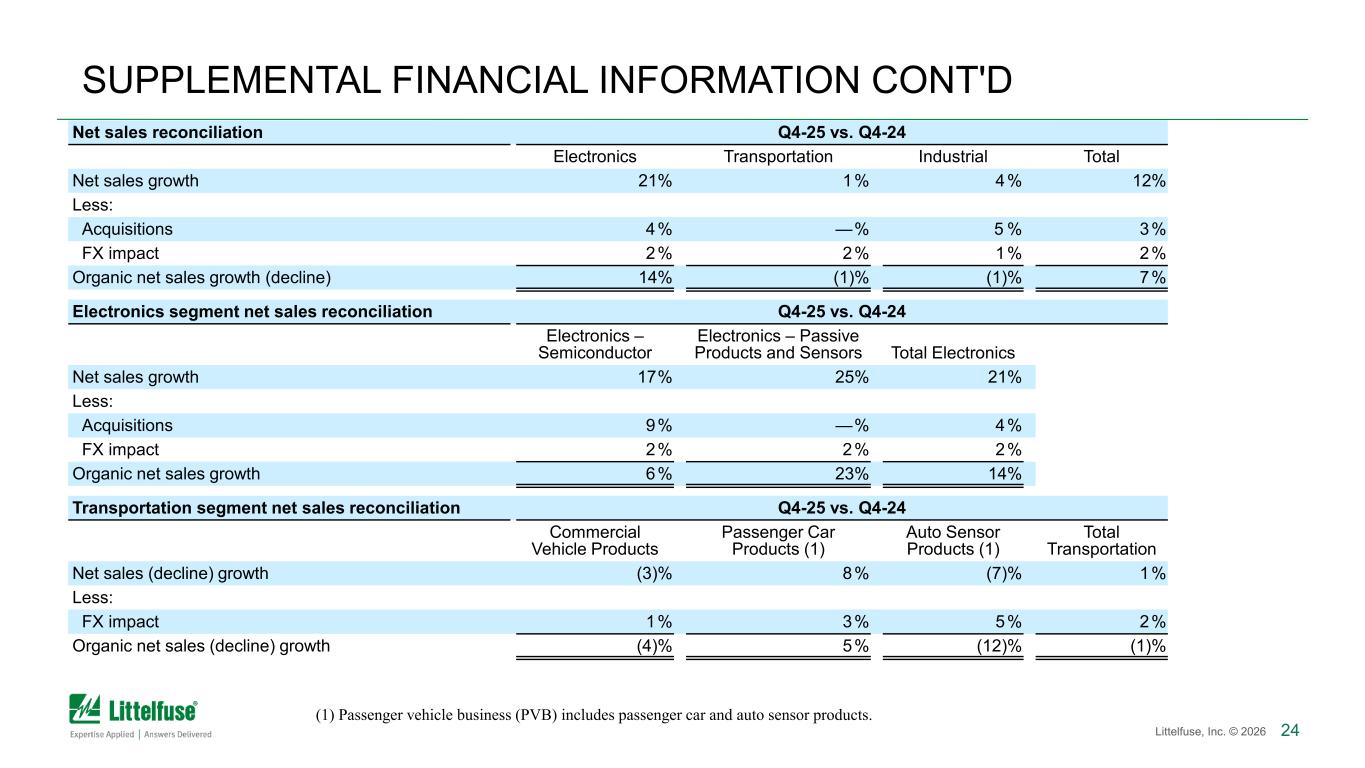
24Littelfuse, Inc. © 2026 SUPPLEMENTAL FINANCIAL INFORMATION CONT'D Net sales reconciliation Q4-25 vs. Q4-24 Electronics Transportation Industrial Total Net sales growth 21% 1% 4% 12% Less: Acquisitions 4% —% 5 % 3% FX impact 2% 2% 1% 2% Organic net sales growth (decline) 14% (1)% (1)% 7% Electronics segment net sales reconciliation Q4-25 vs. Q4-24 Electronics – Semiconductor Electronics – Passive Products and Sensors Total Electronics Net sales growth 17% 25% 21% Less: Acquisitions 9% —% 4% FX impact 2% 2% 2% Organic net sales growth 6% 23% 14% Transportation segment net sales reconciliation Q4-25 vs. Q4-24 Commercial Vehicle Products Passenger Car Products (1) Auto Sensor Products (1) Total Transportation Net sales (decline) growth (3)% 8% (7)% 1% Less: FX impact 1% 3% 5% 2% Organic net sales (decline) growth (4)% 5% (12)% (1)% (1) Passenger vehicle business (PVB) includes passenger car and auto sensor products.
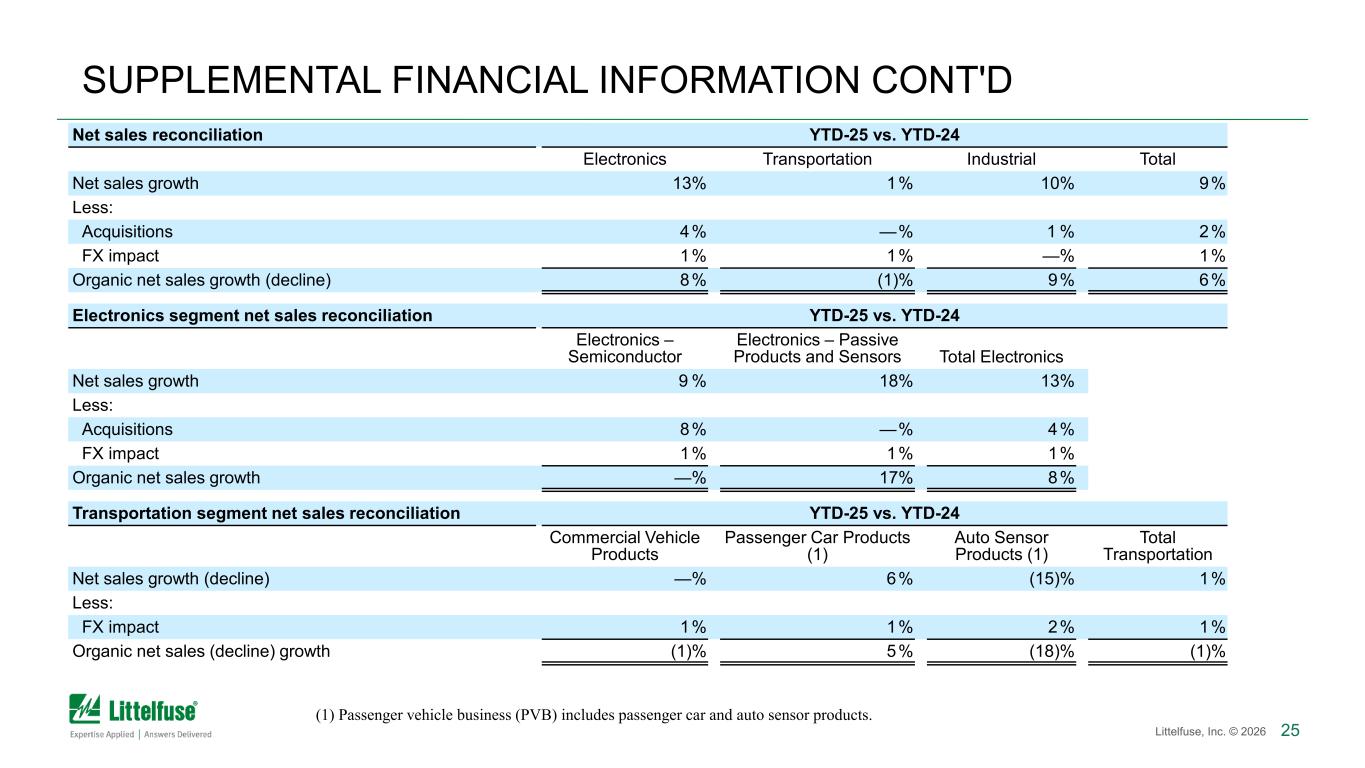
25Littelfuse, Inc. © 2026 SUPPLEMENTAL FINANCIAL INFORMATION CONT'D Net sales reconciliation YTD-25 vs. YTD-24 Electronics Transportation Industrial Total Net sales growth 13% 1% 10% 9% Less: Acquisitions 4% —% 1 % 2% FX impact 1% 1% —% 1% Organic net sales growth (decline) 8% (1)% 9% 6% Electronics segment net sales reconciliation YTD-25 vs. YTD-24 Electronics – Semiconductor Electronics – Passive Products and Sensors Total Electronics Net sales growth 9 % 18% 13% Less: Acquisitions 8% —% 4% FX impact 1% 1% 1% Organic net sales growth —% 17% 8% Transportation segment net sales reconciliation YTD-25 vs. YTD-24 Commercial Vehicle Products Passenger Car Products (1) Auto Sensor Products (1) Total Transportation Net sales growth (decline) —% 6% (15)% 1% Less: FX impact 1% 1% 2% 1% Organic net sales (decline) growth (1)% 5% (18)% (1)% (1) Passenger vehicle business (PVB) includes passenger car and auto sensor products.
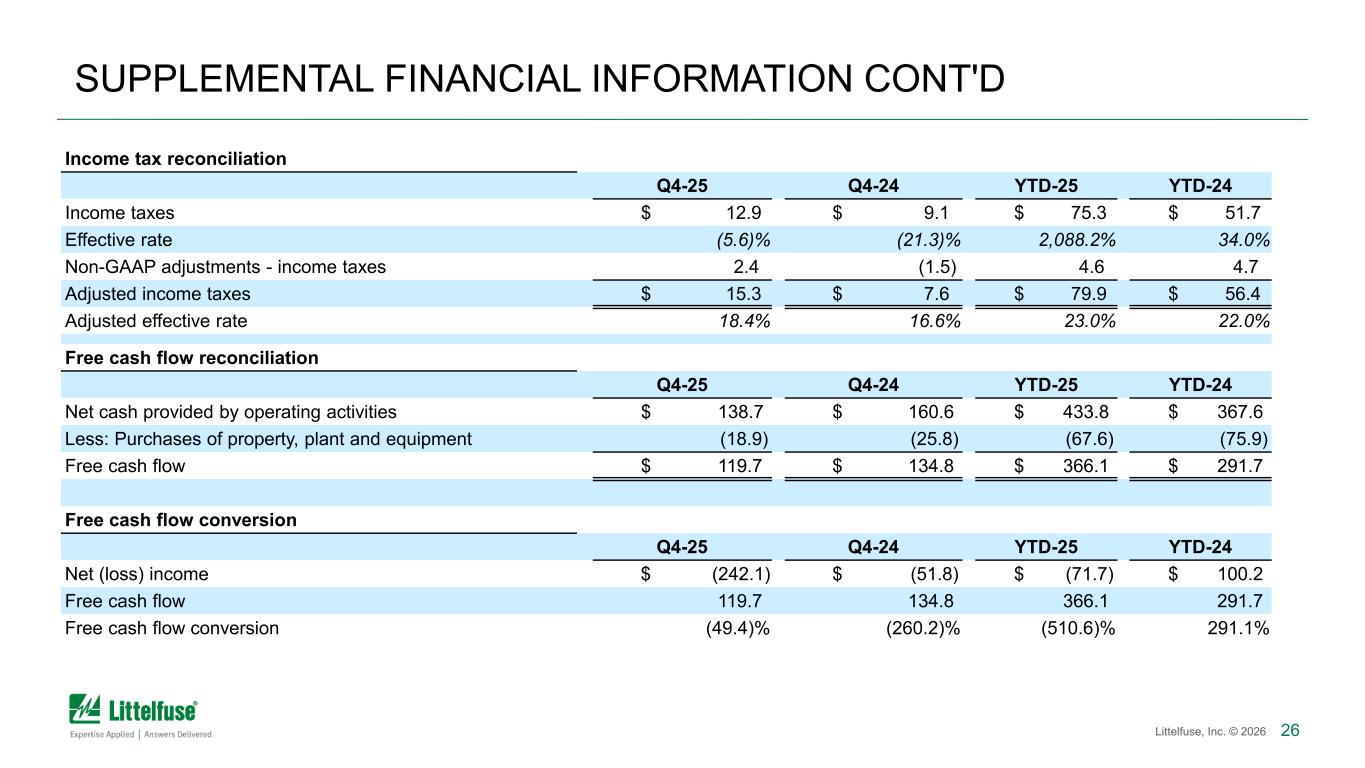
26Littelfuse, Inc. © 2026 SUPPLEMENTAL FINANCIAL INFORMATION CONT'D Income tax reconciliation Q4-25 Q4-24 YTD-25 YTD-24 Income taxes $ 12.9 $ 9.1 $ 75.3 $ 51.7 Effective rate (5.6)% (21.3)% 2,088.2% 34.0% Non-GAAP adjustments - income taxes 2.4 (1.5) 4.6 4.7 Adjusted income taxes $ 15.3 $ 7.6 $ 79.9 $ 56.4 Adjusted effective rate 18.4% 16.6% 23.0% 22.0% Free cash flow reconciliation Q4-25 Q4-24 YTD-25 YTD-24 Net cash provided by operating activities $ 138.7 $ 160.6 $ 433.8 $ 367.6 Less: Purchases of property, plant and equipment (18.9) (25.8) (67.6) (75.9) Free cash flow $ 119.7 $ 134.8 $ 366.1 $ 291.7 Free cash flow conversion Q4-25 Q4-24 YTD-25 YTD-24 Net (loss) income $ (242.1) $ (51.8) $ (71.7) $ 100.2 Free cash flow 119.7 134.8 366.1 291.7 Free cash flow conversion (49.4)% (260.2)% (510.6)% 291.1%
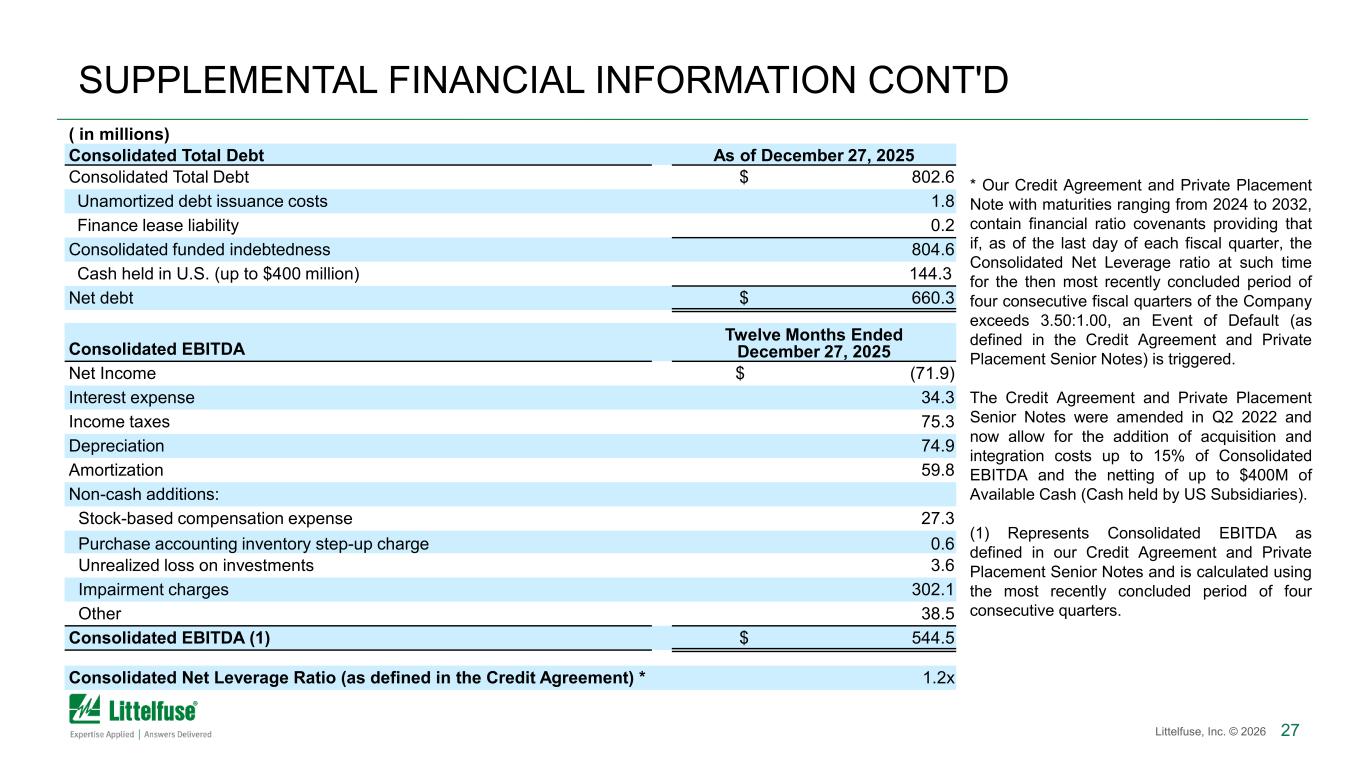
27Littelfuse, Inc. © 2026 SUPPLEMENTAL FINANCIAL INFORMATION CONT'D ( in millions) Consolidated Total Debt As of December 27, 2025 Consolidated Total Debt $ 802.6 Unamortized debt issuance costs 1.8 Finance lease liability 0.2 Consolidated funded indebtedness 804.6 Cash held in U.S. (up to $400 million) 144.3 Net debt $ 660.3 Consolidated EBITDA Twelve Months Ended December 27, 2025 Net Income $ (71.9) Interest expense 34.3 Income taxes 75.3 Depreciation 74.9 Amortization 59.8 Non-cash additions: Stock-based compensation expense 27.3 Purchase accounting inventory step-up charge 0.6 Unrealized loss on investments 3.6 Impairment charges 302.1 Other 38.5 Consolidated EBITDA (1) $ 544.5 Consolidated Net Leverage Ratio (as defined in the Credit Agreement) * 1.2x * Our Credit Agreement and Private Placement Note with maturities ranging from 2024 to 2032, contain financial ratio covenants providing that if, as of the last day of each fiscal quarter, the Consolidated Net Leverage ratio at such time for the then most recently concluded period of four consecutive fiscal quarters of the Company exceeds 3.50:1.00, an Event of Default (as defined in the Credit Agreement and Private Placement Senior Notes) is triggered. The Credit Agreement and Private Placement Senior Notes were amended in Q2 2022 and now allow for the addition of acquisition and integration costs up to 15% of Consolidated EBITDA and the netting of up to $400M of Available Cash (Cash held by US Subsidiaries). (1) Represents Consolidated EBITDA as defined in our Credit Agreement and Private Placement Senior Notes and is calculated using the most recently concluded period of four consecutive quarters.
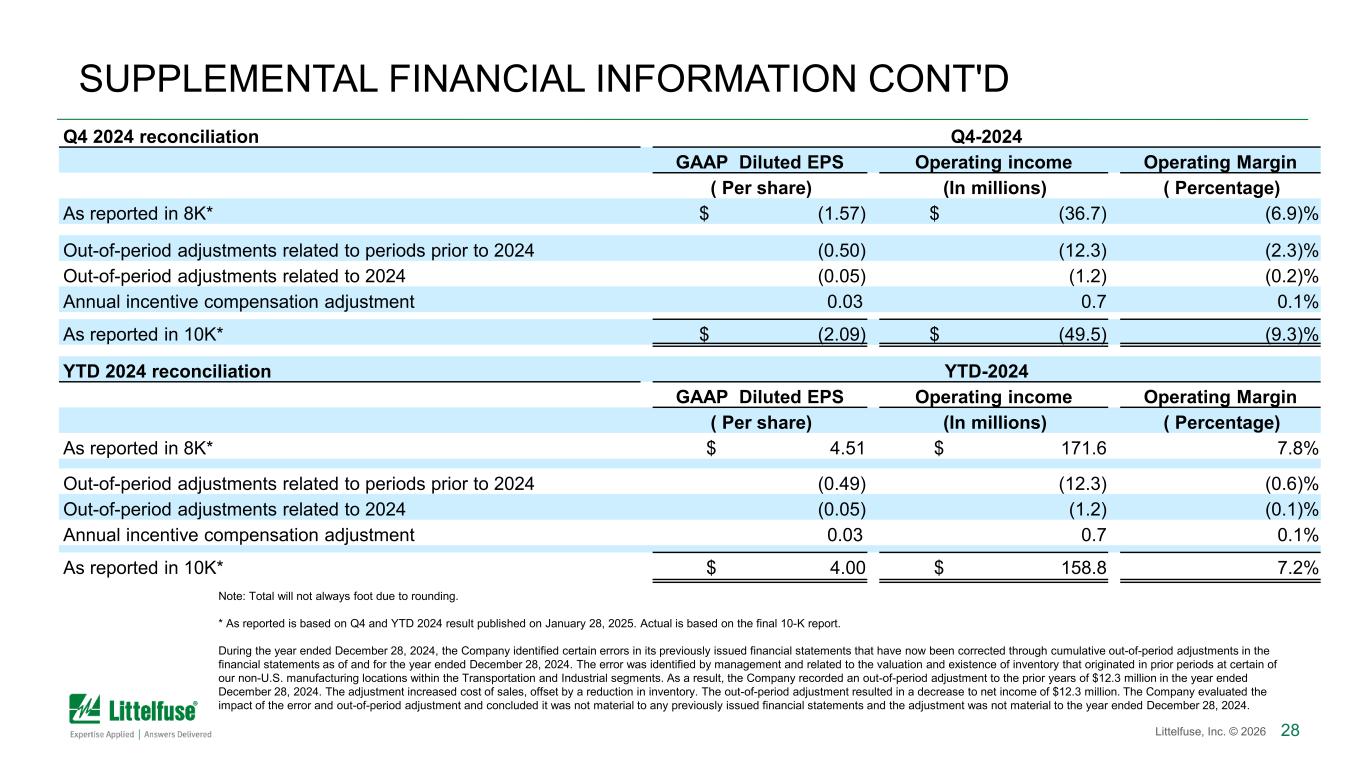
28Littelfuse, Inc. © 2026 SUPPLEMENTAL FINANCIAL INFORMATION CONT'D Q4 2024 reconciliation Q4-2024 GAAP Diluted EPS Operating income Operating Margin ( Per share) (In millions) ( Percentage) As reported in 8K* $ (1.57) $ (36.7) (6.9)% Out-of-period adjustments related to periods prior to 2024 (0.50) (12.3) (2.3)% Out-of-period adjustments related to 2024 (0.05) (1.2) (0.2)% Annual incentive compensation adjustment 0.03 0.7 0.1% As reported in 10K* $ (2.09) $ (49.5) (9.3)% YTD 2024 reconciliation YTD-2024 GAAP Diluted EPS Operating income Operating Margin ( Per share) (In millions) ( Percentage) As reported in 8K* $ 4.51 $ 171.6 7.8% Out-of-period adjustments related to periods prior to 2024 (0.49) (12.3) (0.6)% Out-of-period adjustments related to 2024 (0.05) (1.2) (0.1)% Annual incentive compensation adjustment 0.03 0.7 0.1% As reported in 10K* $ 4.00 $ 158.8 7.2% Note: Total will not always foot due to rounding. * As reported is based on Q4 and YTD 2024 result published on January 28, 2025. Actual is based on the final 10-K report. During the year ended December 28, 2024, the Company identified certain errors in its previously issued financial statements that have now been corrected through cumulative out-of-period adjustments in the financial statements as of and for the year ended December 28, 2024. The error was identified by management and related to the valuation and existence of inventory that originated in prior periods at certain of our non-U.S. manufacturing locations within the Transportation and Industrial segments. As a result, the Company recorded an out-of-period adjustment to the prior years of $12.3 million in the year ended December 28, 2024. The adjustment increased cost of sales, offset by a reduction in inventory. The out-of-period adjustment resulted in a decrease to net income of $12.3 million. The Company evaluated the impact of the error and out-of-period adjustment and concluded it was not material to any previously issued financial statements and the adjustment was not material to the year ended December 28, 2024.
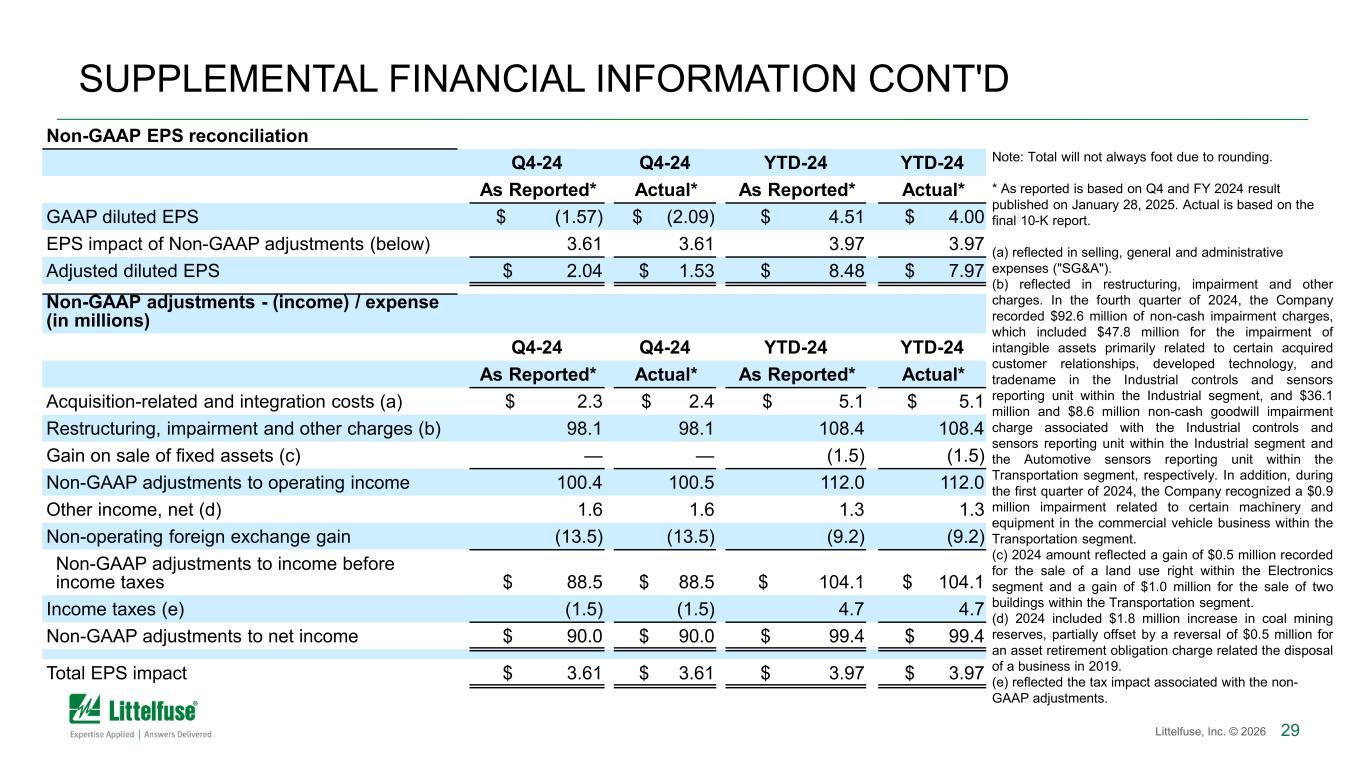
29Littelfuse, Inc. © 2026 SUPPLEMENTAL FINANCIAL INFORMATION CONT'D Non-GAAP EPS reconciliation Q4-24 Q4-24 YTD-24 YTD-24 As Reported* Actual* As Reported* Actual* GAAP diluted EPS $ (1.57) $ (2.09) $ 4.51 $ 4.00 EPS impact of Non-GAAP adjustments (below) 3.61 3.61 3.97 3.97 Adjusted diluted EPS $ 2.04 $ 1.53 $ 8.48 $ 7.97 Non-GAAP adjustments - (income) / expense (in millions) Q4-24 Q4-24 YTD-24 YTD-24 As Reported* Actual* As Reported* Actual* Acquisition-related and integration costs (a) $ 2.3 $ 2.4 $ 5.1 $ 5.1 Restructuring, impairment and other charges (b) 98.1 98.1 108.4 108.4 Gain on sale of fixed assets (c) — — (1.5) (1.5) Non-GAAP adjustments to operating income 100.4 100.5 112.0 112.0 Other income, net (d) 1.6 1.6 1.3 1.3 Non-operating foreign exchange gain (13.5) (13.5) (9.2) (9.2) Non-GAAP adjustments to income before income taxes $ 88.5 $ 88.5 $ 104.1 $ 104.1 Income taxes (e) (1.5) (1.5) 4.7 4.7 Non-GAAP adjustments to net income $ 90.0 $ 90.0 $ 99.4 $ 99.4 Total EPS impact $ 3.61 $ 3.61 $ 3.97 $ 3.97 Note: Total will not always foot due to rounding. * As reported is based on Q4 and FY 2024 result published on January 28, 2025. Actual is based on the final 10-K report. (a) reflected in selling, general and administrative expenses ("SG&A"). (b) reflected in restructuring, impairment and other charges. In the fourth quarter of 2024, the Company recorded $92.6 million of non-cash impairment charges, which included $47.8 million for the impairment of intangible assets primarily related to certain acquired customer relationships, developed technology, and tradename in the Industrial controls and sensors reporting unit within the Industrial segment, and $36.1 million and $8.6 million non-cash goodwill impairment charge associated with the Industrial controls and sensors reporting unit within the Industrial segment and the Automotive sensors reporting unit within the Transportation segment, respectively. In addition, during the first quarter of 2024, the Company recognized a $0.9 million impairment related to certain machinery and equipment in the commercial vehicle business within the Transportation segment. (c) 2024 amount reflected a gain of $0.5 million recorded for the sale of a land use right within the Electronics segment and a gain of $1.0 million for the sale of two buildings within the Transportation segment. (d) 2024 included $1.8 million increase in coal mining reserves, partially offset by a reversal of $0.5 million for an asset retirement obligation charge related the disposal of a business in 2019. (e) reflected the tax impact associated with the non- GAAP adjustments.
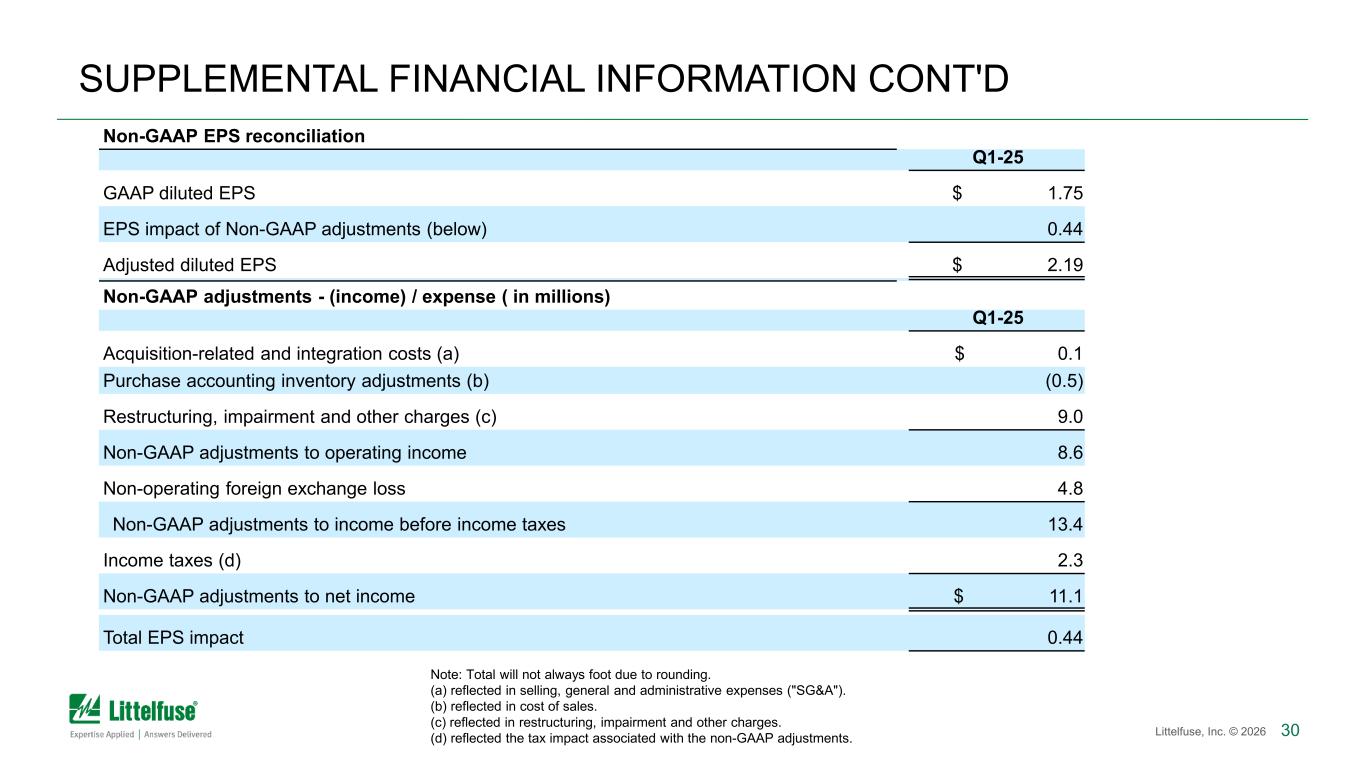
30Littelfuse, Inc. © 2026 SUPPLEMENTAL FINANCIAL INFORMATION CONT'D Non-GAAP EPS reconciliation Q1-25 GAAP diluted EPS $ 1.75 EPS impact of Non-GAAP adjustments (below) 0.44 Adjusted diluted EPS $ 2.19 Non-GAAP adjustments - (income) / expense ( in millions) Q1-25 Acquisition-related and integration costs (a) $ 0.1 Purchase accounting inventory adjustments (b) (0.5) Restructuring, impairment and other charges (c) 9.0 Non-GAAP adjustments to operating income 8.6 Non-operating foreign exchange loss 4.8 Non-GAAP adjustments to income before income taxes 13.4 Income taxes (d) 2.3 Non-GAAP adjustments to net income $ 11.1 Total EPS impact 0.44 Note: Total will not always foot due to rounding. (a) reflected in selling, general and administrative expenses ("SG&A"). (b) reflected in cost of sales. (c) reflected in restructuring, impairment and other charges. (d) reflected the tax impact associated with the non-GAAP adjustments.