
LNN 8-K
Lindsay Corp (LNN)
UNITED STATES
SECURITIES AND EXCHANGE COMMISSION
Washington, D.C. 20549
FORM
CURRENT REPORT
Pursuant to Section 13 OR 15(d)
of The Securities Exchange Act of 1934
Date of Report (Date of earliest event reported):
(Exact name of registrant as specified in its charter)
| (State of Incorporation) |
(Commission File Number) |
(IRS Employer Identification Number) |
| |
||
| (Address of principal executive offices) | (Zip Code) |
(Registrant’s telephone number, including area code)
Not applicable
(Former name or former address, if changed since last report)
Check the appropriate box below if the Form 8-K filing is intended to simultaneously satisfy the filing obligation of the registrant under any of the following provisions:
| Written communications pursuant to Rule 425 under the Securities Act (17 CFR 230.425) |
| Soliciting material pursuant to Rule 14a-12 under the Exchange Act (17 CFR 240.14a-12) |
| Pre-commencement communications pursuant to Rule 14d-2(b) under the Exchange Act (17 CFR 240.14d-2(b)) |
| Pre-commencement communications pursuant to Rule 13e-4(c) under the Exchange Act (17 CFR 240.13e-4(c)) |
Securities registered pursuant to Section 12(b) of the Act:
| Title of each class |
Trading Symbol(s) |
Name of each exchange on which registered | ||
Indicate by check mark whether the registrant is an emerging growth company as defined in Rule 405 of the Securities Act of 1933 (§230.405 of this chapter) or Rule 12b-2 of the Securities Exchange Act of 1934 (§240.12b-2 of this chapter).
Emerging growth company
If an emerging growth company, indicate by check mark if the registrant has elected not to use the extended transition period for complying with any new or revised financial accounting standards provided pursuant to Section 13(a) of the Exchange Act. ☐
| Item 2.02. | Results of Operations and Financial Condition. |
On January 7, 2021, Lindsay Corporation (the “Company”) issued a press release announcing the Company’s results of operations for its first quarter ended November 30, 2020. A copy of the press release is furnished herewith as Exhibit 99.1.
In addition, a copy of the slide presentation to be used during the Company’s fiscal 2021 first quarter investor conference call at 11:00 a.m. Eastern Time on January 7, 2021 is furnished herewith as Exhibit 99.2.
In accordance with General Instruction B.2 of Form 8-K, the information contained in this Item 2.02, including Exhibits 99.1 and 99.2 attached hereto, is being “furnished” and, as such, shall not be deemed to be “filed” for purposes of Section 18 of the Securities and Exchange Act of 1934, as amended (the “Exchange Act”), or otherwise subject to the liabilities of that Section, nor shall it be deemed incorporated by reference into any filing under the Securities Act of 1933, as amended, or the Exchange Act, except as shall be expressly set forth by specific reference in such filing.
| Item 5.07. | Submission of Matters to a Vote of Security Holders. |
On January 5, 2021, the Company held its annual meeting of stockholders (the “Fiscal 2021 Annual Meeting”). A total of 9,650,752 shares of the Company’s common stock, or 88.82% of the 10,865,246 shares entitled to vote, were represented in person or by proxy at the Fiscal 2021 Annual Meeting.
The final results for each of the matters submitted to a stockholder vote at the Fiscal 2021 Annual Meeting are set forth below.
| 1. | The stockholders elected two directors with terms expiring at the fiscal 2024 annual meeting of stockholders, based on the following voting results: |
| Votes For | Votes Withheld | Broker Non-Votes | ||||||||||
| Election of Directors |
||||||||||||
| Robert E. Brunner |
8,752,669 | 470,994 | 427,089 | |||||||||
| Randy A. Wood |
9,127,576 | 96,087 | 427,089 | |||||||||
| 2. | The stockholders approved the 2021 Employee Stock Purchase Plan, based on the following voting results: |
| Votes For | Votes Against | Abstentions | Broker Non-Votes | |||||||||||||
| Approval of 2021 Employee Stock Purchase Plan |
9,170,182 | 31,117 | 22,364 | 427,089 | ||||||||||||
| 3. | The stockholders ratified the appointment of KPMG LLP as the Company’s independent registered public accounting firm for the fiscal year ending August 31, 2021, based on the following voting results: |
| Votes For | Votes Against | Abstentions | ||||||||||
| Ratification of Independent Registered Public Accounting Firm |
9,485,017 | 142,972 | 22,763 | |||||||||
| 4. | The stockholders approved, on an advisory basis, the compensation of the Company’s named executive officers, based on the following voting results: |
| Votes For | Votes Against | Abstentions | Broker Non-Votes | |||||||||||||
| Advisory Vote on Executive Compensation |
8,822,578 | 373,883 | 27,202 | 427,089 | ||||||||||||
| Item 9.01. | Financial Statements and Exhibits. |
| 99.1 | Press Release, dated January 7, 2021, issued by the Company. | |
| 99.2 | Slide Presentation for Fiscal 2021 First Quarter Investor Conference Call on January 7, 2021. | |
| 104 | Cover Page Interactive Data File (embedded within the Inline XBRL document). | |
SIGNATURES
Pursuant to the requirements of the Securities Exchange Act of 1934, the registrant has duly caused this report to be signed on its behalf by the undersigned hereunto duly authorized.
| Dated: January 7, 2021 | LINDSAY CORPORATION | |||||
| By: | /s/ Brian L. Ketcham | |||||
| Brian L. Ketcham, Senior Vice President and | ||||||
| Chief Financial Officer | ||||||
Exhibit 99.1

|
18135 BURKE ST. OMAHA, NE 68022 TEL: 402-829-6800 FAX: 402-829-6836 |
For further information, contact:
| LINDSAY CORPORATION: |
THREE PART ADVISORS: | |
| Brian Ketcham |
Hala Elsherbini | |
| Senior Vice President & Chief Financial Officer |
972-458-8000 | |
|
402-827-6579 |
Lindsay Corporation Reports Fiscal 2021 First Quarter Results
| • | Improving market conditions support irrigation revenue and earnings growth |
| • | Strong irrigation system order flow in North America leads to large backlog |
| • | Significant increase in raw material costs creates short-term margin headwinds |
| • | Solid infrastructure results lower compared to a strong prior year first quarter |
OMAHA, Neb., January 7, 2021—Lindsay Corporation (NYSE: LNN), a leading global manufacturer and distributor of irrigation and infrastructure equipment and technology, today announced results for its first quarter of fiscal 2021, which ended on November 30, 2020.
First Quarter Summary
Revenues for the first quarter of fiscal 2021 were $108.5 million, a decrease of $0.9 million, or 1 percent, compared to revenues of $109.4 million in the prior year first quarter. Net earnings for the quarter were $7.1 million, or $0.65 per diluted share, compared with net earnings of $8.3 million, or $0.77 per diluted share, for the prior year first quarter. Net earnings for the quarter include an income tax benefit of approximately $1.7 million, or $0.16 per diluted share, related to the release of a valuation allowance in a foreign jurisdiction.
“Irrigation market conditions improved during the quarter with rising agricultural commodity prices and higher projected net farm income. This resulted in stronger than expected order flow for irrigation equipment, particularly in the latter part of the quarter.” said Randy Wood, President and Chief Executive Officer. “Our infrastructure business performed well, although results were lower than a very strong first quarter in the prior year.”
First Quarter Segment Results
Irrigation segment revenues for the first quarter of fiscal 2021 increased $4.1 million, or 5 percent to $87.4 million, compared to $83.3 million in the prior year first quarter. North America irrigation revenues of $52.8 million decreased $0.8 million, or 2 percent, compared to the prior year first quarter. The decrease resulted primarily from lower engineering services revenue related to a project in the prior year that did not repeat that was partially offset by higher irrigation equipment unit volume. International irrigation revenues of $34.6 million increased $4.8 million, or 16 percent, compared to the prior year first quarter. The increase resulted from higher unit sales volumes in several regions which were partially offset by the unfavorable effects of foreign currency translation of approximately $2.4 million compared to the prior year first quarter.
Irrigation segment operating margin was 12.2 percent of sales, compared to 11.7 percent of sales in the prior year first quarter. The increase resulted primarily from the impact of higher irrigation system unit volume and was partially offset by the impact of higher raw material and freight costs.
Infrastructure segment revenues for the first quarter of fiscal 2021 were $21.1 million, a decrease of $5.0 million, or 19 percent, compared to $26.1 million in the prior year first quarter. The decrease resulted primarily from a large order delivered in the prior year that did not repeat and from lower road construction activity in the current year.
Infrastructure segment operating margin was 20.1 percent of sales, compared to 33.5 percent of sales in the prior year first quarter. The decrease resulted primarily from lower revenue in higher margin product lines and an increase in raw material and other costs compared to the prior year.
The backlog of unfilled orders at November 30, 2020 was $89.2 million compared with $69.2 million at November 30, 2019. Included in these backlogs are amounts of $5.4 million and $5.2 million, respectively, that are not expected to be fulfilled within the subsequent twelve months. The increase in backlog is primarily attributable to higher order activity in North America irrigation.
Outlook
“Our backlog of irrigation equipment orders in North America supports solid revenue growth for our second quarter. We also expect improved activity levels to continue in international irrigation markets. At the same time, we are seeing rapid and significant increases in steel and freight costs that will pressure margins in the short term until pricing actions are fully implemented.” said Mr. Wood. “In our infrastructure business, we continue to be encouraged by the quality of our Road Zipper® sales funnel. However, the timing of those projects can be difficult to predict, particularly in the current environment with coronavirus-related effects on road construction activity.
“Our financial position remains strong, providing support for our innovation growth strategy across our businesses that address global megatrends and provide solutions that conserve natural resources.”
First Quarter Conference Call
Lindsay’s fiscal 2021 first quarter investor conference call is scheduled for 11:00 a.m. Eastern Time today. Interested investors may participate in the call by dialing (833) 535-2202 in the U.S., or (412) 902-6745 internationally, and requesting the Lindsay Corporation call. Additionally, the conference call will be simulcast live on the Internet and can be accessed via the investor relations section of the Company’s Web site, www.lindsay.com. Replays of the conference call will remain on our Web site through the next quarterly earnings release. The Company will have a slide presentation available to augment management’s formal presentation, which will also be accessible via the Company’s Web site.
About the Company
Lindsay Corporation (NYSE: LNN) is a leading global manufacturer and distributor of irrigation and infrastructure equipment and technology. Established in 1955, the company has been at the forefront of research and development of innovative solutions to meet the food, fuel, fiber and transportation needs of the world’s rapidly growing population. The Lindsay family of irrigation brands includes Zimmatic® center pivot and lateral move agricultural irrigation systems and FieldNET® remote irrigation management and scheduling technology, as well as irrigation consulting and design and industrial IoT solutions. Also a global leader in the transportation industry, Lindsay Transportation Solutions manufactures equipment to improve road safety and keep traffic moving on the world’s roads, bridges and tunnels, through the Barrier Systems®, Road Zipper® and Snoline™ brands. For more information about Lindsay Corporation, visit www.lindsay.com.
Concerning Forward-looking Statements
This release contains forward-looking statements that are subject to risks and uncertainties and which reflect management’s current beliefs and estimates of future economic circumstances, industry conditions, Company performance and financial results. You can find a discussion of many of these risks and uncertainties in the annual, quarterly and current reports that the Company files with the Securities and Exchange Commission. Forward-looking statements include information concerning possible or assumed future results of operations and planned financing of the Company and those statements preceded by, followed by or including the words “anticipate,” “estimate,” “believe,” “intend,” “expect,” “outlook,” “could,” “may,” “should,” “will,” or similar expressions. For these statements, the Company claims the protection of the safe harbor for forward-looking statements contained in the Private Securities Litigation Reform Act of 1995. The Company undertakes no obligation to update any forward-looking information contained in this press release.
2
LINDSAY CORPORATION AND SUBSIDIARIES
CONDENSED CONSOLIDATED STATEMENTS OF EARNINGS
(Unaudited)
| Three months ended | ||||||||
| (in thousands, except per share amounts) |
November 30, 2020 |
November 30, 2019 |
||||||
| Operating revenues |
$ | 108,485 | $ | 109,393 | ||||
| Cost of operating revenues |
77,077 | 75,319 | ||||||
|
|
|
|
|
|||||
| Gross profit |
31,408 | 34,074 | ||||||
|
|
|
|
|
|||||
| Operating expenses: |
||||||||
| Selling expense |
7,331 | 6,492 | ||||||
| General and administrative expense |
13,452 | 11,804 | ||||||
| Engineering and research expense |
3,090 | 3,502 | ||||||
|
|
|
|
|
|||||
| Total operating expenses |
23,873 | 21,798 | ||||||
|
|
|
|
|
|||||
| Operating income |
7,535 | 12,276 | ||||||
| Other (expense) income: |
||||||||
| Interest expense |
(1,201 | ) | (1,186 | ) | ||||
| Interest income |
303 | 615 | ||||||
| Other income (expense), net |
246 | (450 | ) | |||||
|
|
|
|
|
|||||
| Total other (expense) income |
(652 | ) | (1,021 | ) | ||||
|
|
|
|
|
|||||
| Earnings before income taxes |
6,883 | 11,255 | ||||||
| Income tax (benefit) expense |
(212 | ) | 2,910 | |||||
|
|
|
|
|
|||||
| Net earnings |
$ | 7,095 | $ | 8,345 | ||||
|
|
|
|
|
|||||
| Earnings per share: |
||||||||
| Basic |
$ | 0.65 | $ | 0.77 | ||||
| Diluted |
$ | 0.65 | $ | 0.77 | ||||
| Shares used in computing earnings per share: |
||||||||
| Basic |
10,845 | 10,795 | ||||||
| Diluted |
10,888 | 10,828 | ||||||
| Cash dividends declared per share |
$ | 0.32 | $ | 0.31 | ||||
3
LINDSAY CORPORATION AND SUBSIDIARIES
SUMMARY OPERATING RESULTS
(Unaudited)
| Three months ended | ||||||||
| (in thousands) |
November 30, 2020 |
November 30, 2019 |
||||||
| Operating revenues: |
||||||||
| Irrigation: |
||||||||
| North America |
$ | 52,790 | $ | 53,588 | ||||
| International |
34,566 | 29,739 | ||||||
|
|
|
|
|
|||||
| Irrigation segment |
87,356 | 83,327 | ||||||
| Infrastructure segment |
21,129 | 26,066 | ||||||
|
|
|
|
|
|||||
| Total operating revenues |
$ | 108,485 | $ | 109,393 | ||||
|
|
|
|
|
|||||
| Operating income (loss): |
||||||||
| Irrigation segment |
$ | 10,633 | $ | 9,784 | ||||
| Infrastructure segment |
4,256 | 8,741 | ||||||
| Corporate |
(7,354 | ) | (6,249 | ) | ||||
|
|
|
|
|
|||||
| Total operating income |
$ | 7,535 | $ | 12,276 | ||||
|
|
|
|
|
|||||
The Company manages its business activities in two reportable segments as follows:
Irrigation – This reporting segment includes the manufacture and marketing of center pivot, lateral move and hose reel irrigation systems and large diameter steel tubing as well as various innovative technology solutions such as GPS positioning and guidance, variable rate irrigation, remote irrigation management and scheduling technology, irrigation consulting and design and industrial IoT solutions.
Infrastructure – This reporting segment includes the manufacture and marketing of moveable barriers, specialty barriers, crash cushions and end terminals, and road marking and road safety equipment.
Certain immaterial reclassifications have been made to the prior year operating results to conform with current year presentation, as revenues and operating income from certain product lines previously included within the Infrastructure reporting segment are now included within the Irrigation reporting segment.
4
LINDSAY CORPORATION AND SUBSIDIARIES
CONDENSED CONSOLIDATED BALANCE SHEETS
(Unaudited)
| (in thousands) |
November 30, 2020 |
November 30, 2019 |
August 31, 2020 |
|||||||||
| ASSETS |
||||||||||||
| Current assets: |
||||||||||||
| Cash and cash equivalents |
$ | 126,802 | $ | 120,910 | $ | 121,403 | ||||||
| Marketable securities |
19,624 | — | 19,511 | |||||||||
| Receivables, net |
74,909 | 79,317 | 84,604 | |||||||||
| Inventories, net |
114,278 | 97,284 | 104,792 | |||||||||
| Assets held-for-sale |
— | 2,744 | — | |||||||||
| Other current assets, net |
20,837 | 16,376 | 17,625 | |||||||||
|
|
|
|
|
|
|
|||||||
| Total current assets |
356,450 | 316,631 | 347,935 | |||||||||
|
|
|
|
|
|
|
|||||||
| Property, plant, and equipment, net |
81,295 | 70,305 | 79,581 | |||||||||
| Intangibles, net |
22,817 | 23,739 | 23,477 | |||||||||
| Goodwill |
68,027 | 64,358 | 68,004 | |||||||||
| Operating lease right-of-use assets |
26,008 | 25,764 | 27,457 | |||||||||
| Deferred income tax assets |
9,924 | 9,902 | 9,935 | |||||||||
| Other noncurrent assets, net |
10,681 | 16,112 | 14,137 | |||||||||
|
|
|
|
|
|
|
|||||||
| Total assets |
$ | 575,202 | $ | 526,811 | $ | 570,526 | ||||||
|
|
|
|
|
|
|
|||||||
| LIABILITIES AND SHAREHOLDERS’ EQUITY |
||||||||||||
| Current liabilities: |
||||||||||||
| Accounts payable |
$ | 36,263 | $ | 30,097 | $ | 29,554 | ||||||
| Current portion of long-term debt |
214 | 210 | 195 | |||||||||
| Other current liabilities |
65,910 | 54,494 | 72,646 | |||||||||
|
|
|
|
|
|
|
|||||||
| Total current liabilities |
102,387 | 84,801 | 102,395 | |||||||||
|
|
|
|
|
|
|
|||||||
| Pension benefits liabilities |
6,293 | 5,948 | 6,374 | |||||||||
| Long-term debt |
115,641 | 115,805 | 115,682 | |||||||||
| Operating lease liabilities |
24,863 | 25,323 | 25,862 | |||||||||
| Deferred income tax liabilities |
902 | 845 | 889 | |||||||||
| Other noncurrent liabilities |
21,215 | 21,089 | 20,806 | |||||||||
|
|
|
|
|
|
|
|||||||
| Total liabilities |
271,301 | 253,811 | 272,008 | |||||||||
|
|
|
|
|
|
|
|||||||
| Shareholders’ equity: |
||||||||||||
| Preferred stock |
— | — | — | |||||||||
| Common stock |
18,948 | 18,897 | 18,918 | |||||||||
| Capital in excess of stated value |
78,026 | 71,706 | 77,686 | |||||||||
| Retained earnings |
503,342 | 479,732 | 499,724 | |||||||||
| Less treasury stock - at cost |
(277,238 | ) | (277,238 | ) | (277,238 | ) | ||||||
| Accumulated other comprehensive loss, net |
(19,177 | ) | (20,097 | ) | (20,572 | ) | ||||||
|
|
|
|
|
|
|
|||||||
| Total shareholders’ equity |
303,901 | 273,000 | 298,518 | |||||||||
|
|
|
|
|
|
|
|||||||
| Total liabilities and shareholders’ equity |
$ | 575,202 | $ | 526,811 | $ | 570,526 | ||||||
|
|
|
|
|
|
|
|||||||
5
LINDSAY CORPORATION AND SUBSIDIARIES
CONDENSED CONSOLIDATED STATEMENTS OF CASH FLOWS
(Unaudited)
| Three months ended | ||||||||
| (in thousands) |
November 30, 2020 |
November 30, 2019 |
||||||
| CASH FLOWS FROM OPERATING ACTIVITIES: |
||||||||
| Net earnings |
$ | 7,095 | $ | 8,345 | ||||
| Adjustments to reconcile net earnings to net cash provided by operating activities: |
||||||||
| Depreciation and amortization |
5,140 | 4,748 | ||||||
| Provision for uncollectible accounts receivable |
158 | 248 | ||||||
| Deferred income taxes |
140 | 1,987 | ||||||
| Share-based compensation expense |
1,583 | 1,160 | ||||||
| Foreign currency transaction (gain) loss |
(203 | ) | 668 | |||||
| Other, net |
36 | (294 | ) | |||||
| Changes in assets and liabilities: |
||||||||
| Receivables |
8,896 | (4,122 | ) | |||||
| Inventories |
(8,294 | ) | (4,931 | ) | ||||
| Other current assets |
(3,068 | ) | (2,466 | ) | ||||
| Accounts payable |
7,286 | 725 | ||||||
| Other current liabilities |
(7,146 | ) | (1,901 | ) | ||||
| Other noncurrent assets and liabilities |
3,750 | (2,626 | ) | |||||
|
|
|
|
|
|||||
| Net cash provided by operating activities |
15,373 | 1,541 | ||||||
|
|
|
|
|
|||||
| CASH FLOWS FROM INVESTING ACTIVITIES: |
||||||||
| Purchases of property, plant, and equipment |
(5,614 | ) | (4,322 | ) | ||||
| Purchases of marketable securities available-for-sale |
(3,844 | ) | — | |||||
| Proceeds from maturities of marketable securities available-for-sale |
3,616 | — | ||||||
| Proceeds from settlement of net investment hedges |
— | 1,092 | ||||||
| Other investing activities, net |
— | 24 | ||||||
|
|
|
|
|
|||||
| Net cash used in investing activities |
(5,842 | ) | (3,206 | ) | ||||
|
|
|
|
|
|||||
| CASH FLOWS FROM FINANCING ACTIVITIES: |
||||||||
| Proceeds from exercise of stock options |
56 | — | ||||||
| Common stock withheld for payroll tax obligations |
(1,269 | ) | (1,111 | ) | ||||
| Principal payments on long-term debt |
(35 | ) | (52 | ) | ||||
| Dividends paid |
(3,477 | ) | (3,353 | ) | ||||
|
|
|
|
|
|||||
| Net cash used in financing activities |
(4,725 | ) | (4,516 | ) | ||||
|
|
|
|
|
|||||
| Effect of exchange rate changes on cash and cash equivalents |
593 | (113 | ) | |||||
|
|
|
|
|
|||||
| Net change in cash and cash equivalents |
5,399 | (6,294 | ) | |||||
| Cash and cash equivalents, beginning of period |
121,403 | 127,204 | ||||||
|
|
|
|
|
|||||
| Cash and cash equivalents, end of period |
$ | 126,802 | $ | 120,910 | ||||
|
|
|
|
|
|||||
6
1st Quarter Fiscal 2021 Earnings Slide Deck Exhibit 99.2
Safe-Harbor Statement This presentation contains forward-looking statements that are subject to risks and uncertainties and which reflect management’s current beliefs and estimates of future economic circumstances, industry conditions, Company performance, financial results and planned financing. You can find a discussion of many of these risks and uncertainties in the annual, quarterly and current reports that the Company files with the Securities and Exchange Commission. Investors should understand that a number of factors could cause future economic and industry conditions, and the Company’s actual financial condition and results of operations, to differ materially from management’s beliefs expressed in the forward-looking statements contained in this presentation. These factors include those outlined in the “Risk Factors” section of the Company’s most recent annual report on Form 10-K filed with the Securities and Exchange Commission, and investors are urged to review these factors when considering the forward-looking statements contained in this presentation. For these statements, the Company claims the protection of the safe harbor for forward-looking statements contained in the Private Securities Litigation Reform Act of 1995. For full financial statement information, please see the Company’s earnings release dated January 7, 2021.
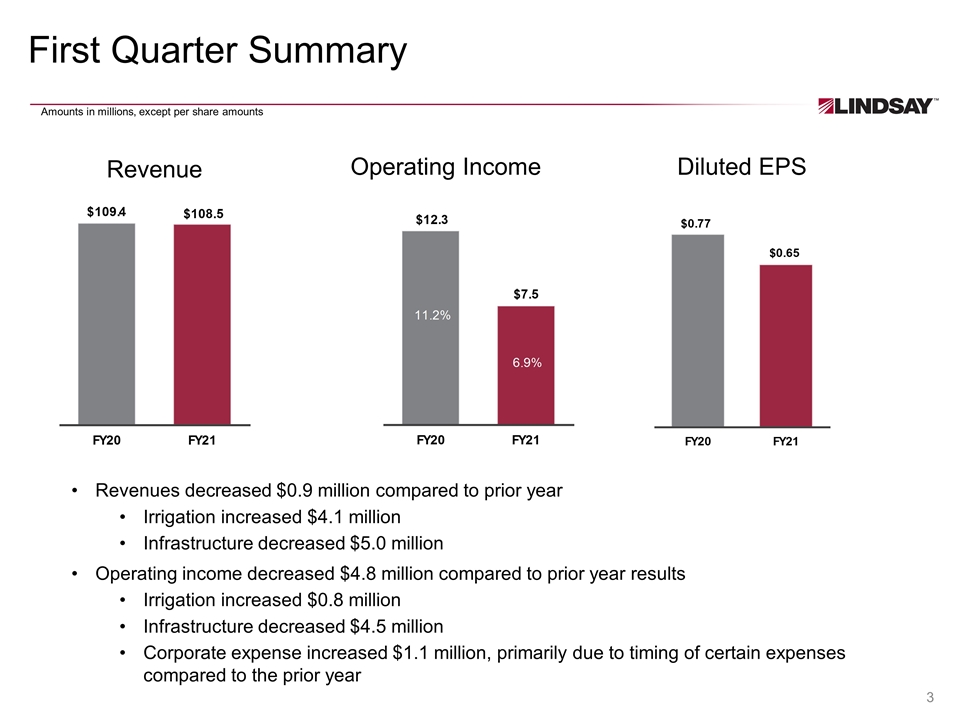
First Quarter Summary Revenue Operating Income Diluted EPS Revenues decreased $0.9 million compared to prior year Irrigation increased $4.1 million Infrastructure decreased $5.0 million Operating income decreased $4.8 million compared to prior year results Irrigation increased $0.8 million Infrastructure decreased $4.5 million Corporate expense increased $1.1 million, primarily due to timing of certain expenses compared to the prior year Amounts in millions, except per share amounts
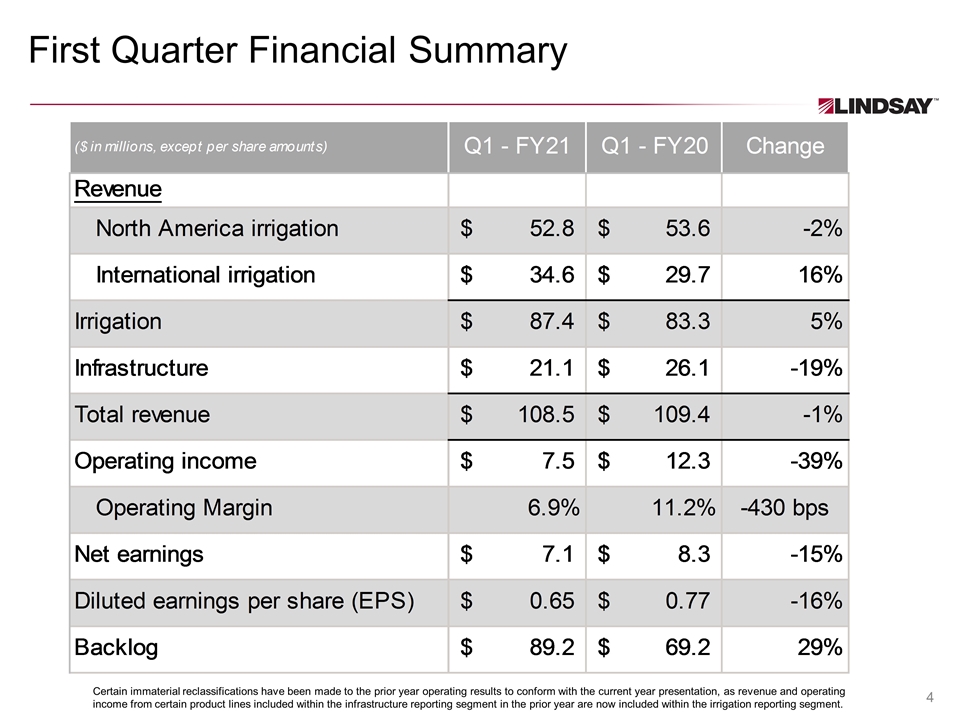
First Quarter Financial Summary Certain immaterial reclassifications have been made to the prior year operating results to conform with the current year presentation, as revenue and operating income from certain product lines included within the infrastructure reporting segment in the prior year are now included within the irrigation reporting segment.
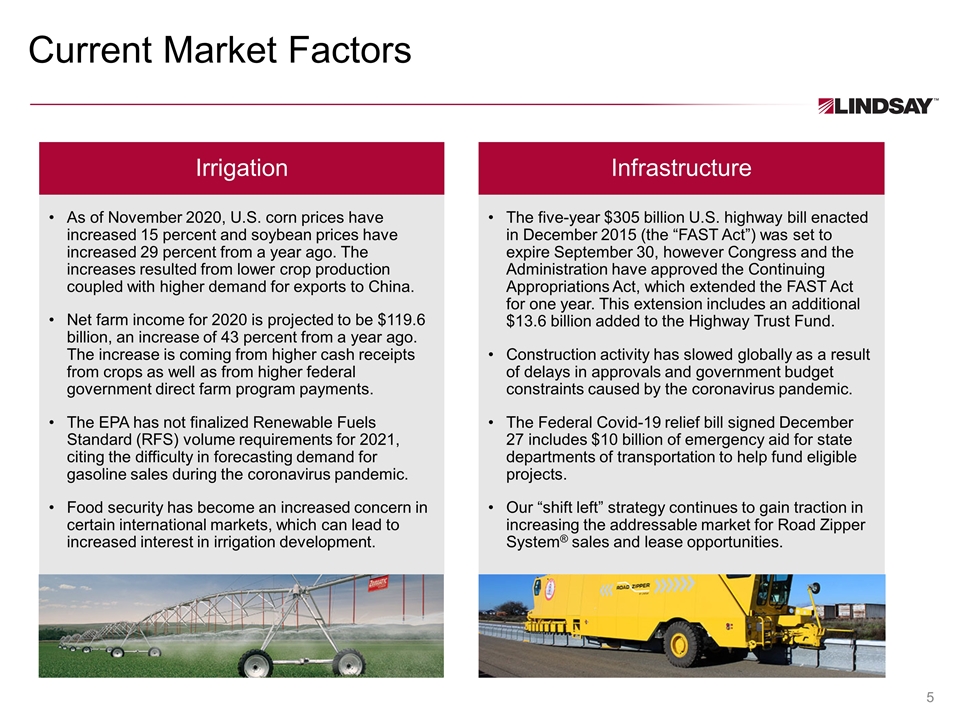
Current Market Factors As of November 2020, U.S. corn prices have increased 15 percent and soybean prices have increased 29 percent from a year ago. The increases resulted from lower crop production coupled with higher demand for exports to China. Net farm income for 2020 is projected to be $119.6 billion, an increase of 43 percent from a year ago. The increase is coming from higher cash receipts from crops as well as from higher federal government direct farm program payments. The EPA has not finalized Renewable Fuels Standard (RFS) volume requirements for 2021, citing the difficulty in forecasting demand for gasoline sales during the coronavirus pandemic. Food security has become an increased concern in certain international markets, which can lead to increased interest in irrigation development. Irrigation Infrastructure The five-year $305 billion U.S. highway bill enacted in December 2015 (the “FAST Act”) was set to expire September 30, however Congress and the Administration have approved the Continuing Appropriations Act, which extended the FAST Act for one year. This extension includes an additional $13.6 billion added to the Highway Trust Fund. Construction activity has slowed globally as a result of delays in approvals and government budget constraints caused by the coronavirus pandemic. The Federal Covid-19 relief bill signed December 27 includes $10 billion of emergency aid for state departments of transportation to help fund eligible projects. Our “shift left” strategy continues to gain traction in increasing the addressable market for Road Zipper System® sales and lease opportunities.
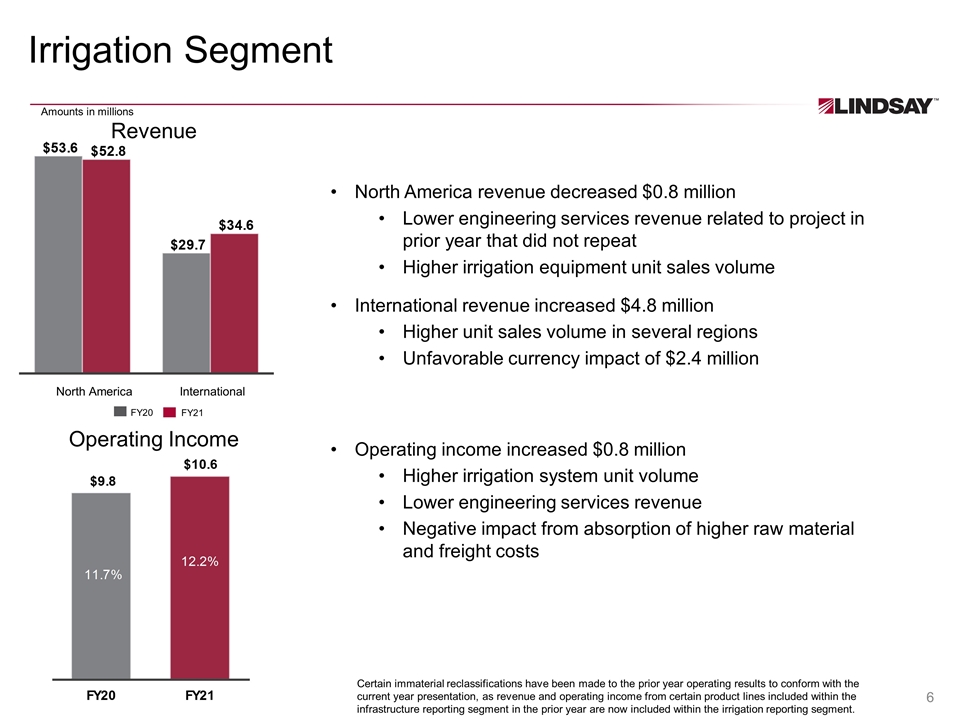
Irrigation Segment North America revenue decreased $0.8 million Lower engineering services revenue related to project in prior year that did not repeat Higher irrigation equipment unit sales volume International revenue increased $4.8 million Higher unit sales volume in several regions Unfavorable currency impact of $2.4 million Operating income increased $0.8 million Higher irrigation system unit volume Lower engineering services revenue Negative impact from absorption of higher raw material and freight costs Revenue Operating Income North America International FY20 FY21 Amounts in millions Certain immaterial reclassifications have been made to the prior year operating results to conform with the current year presentation, as revenue and operating income from certain product lines included within the infrastructure reporting segment in the prior year are now included within the irrigation reporting segment.
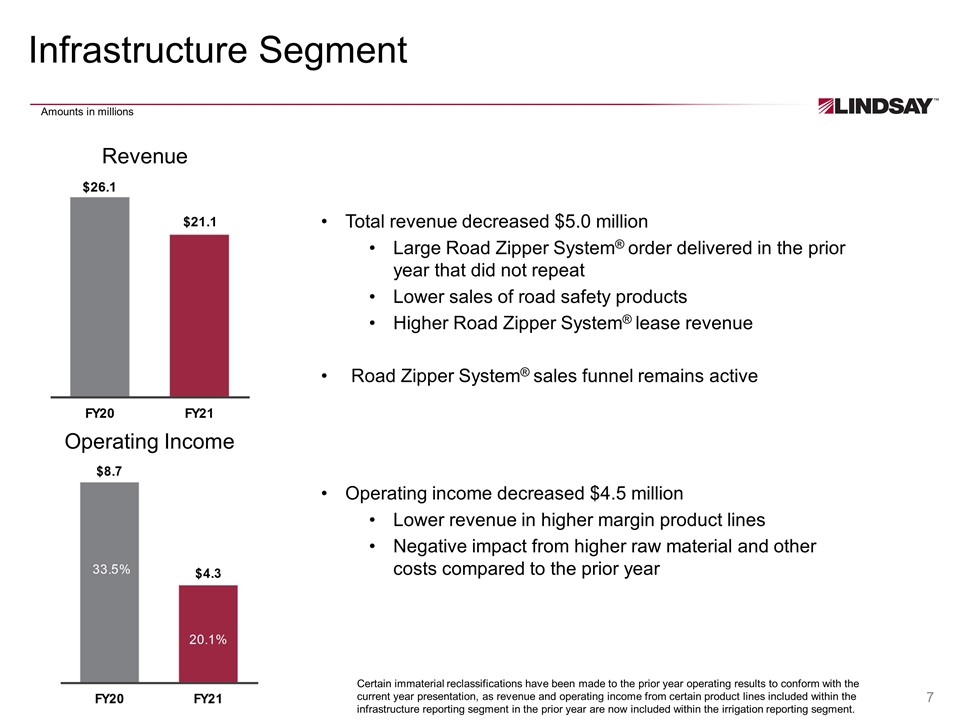
Infrastructure Segment Total revenue decreased $5.0 million Large Road Zipper System® order delivered in the prior year that did not repeat Lower sales of road safety products Higher Road Zipper System® lease revenue Road Zipper System® sales funnel remains active Operating income decreased $4.5 million Lower revenue in higher margin product lines Negative impact from higher raw material and other costs compared to the prior year Revenue Operating Income Amounts in millions Certain immaterial reclassifications have been made to the prior year operating results to conform with the current year presentation, as revenue and operating income from certain product lines included within the infrastructure reporting segment in the prior year are now included within the irrigation reporting segment.
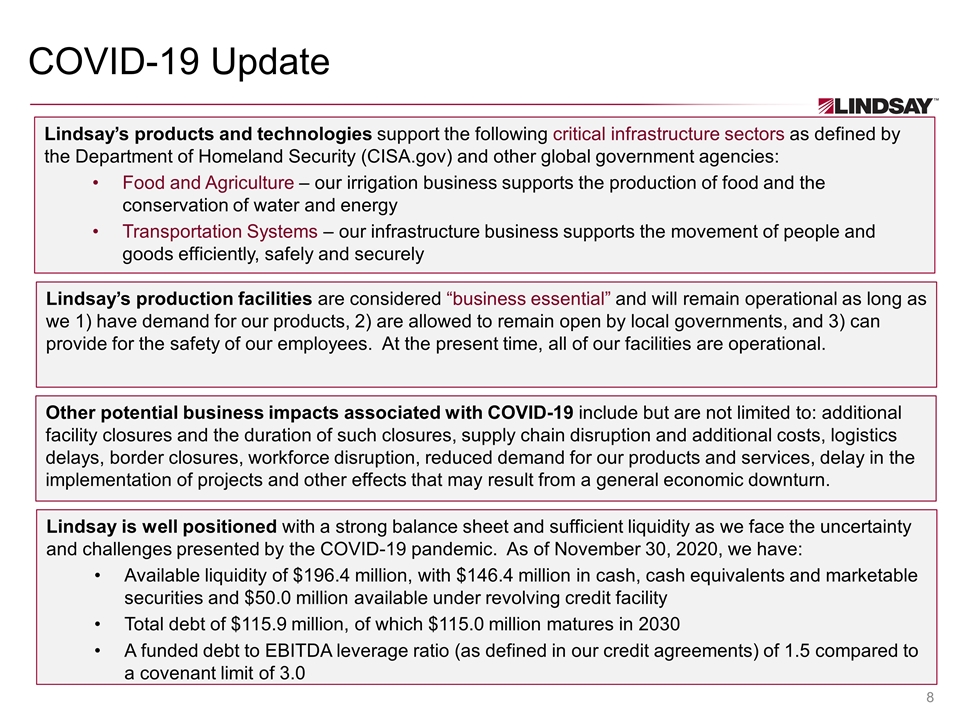
COVID-19 Update Innovative Market Leader – Sustainable Solutions Lindsay’s products and technologies support the following critical infrastructure sectors as defined by the Department of Homeland Security (CISA.gov) and other global government agencies: Food and Agriculture – our irrigation business supports the production of food and the conservation of water and energy Transportation Systems – our infrastructure business supports the movement of people and goods efficiently, safely and securely Lindsay’s production facilities are considered “business essential” and will remain operational as long as we 1) have demand for our products, 2) are allowed to remain open by local governments, and 3) can provide for the safety of our employees. At the present time, all of our facilities are operational. Other potential business impacts associated with COVID-19 include but are not limited to: additional facility closures and the duration of such closures, supply chain disruption and additional costs, logistics delays, border closures, workforce disruption, reduced demand for our products and services, delay in the implementation of projects and other effects that may result from a general economic downturn. Lindsay is well positioned with a strong balance sheet and sufficient liquidity as we face the uncertainty and challenges presented by the COVID-19 pandemic. As of November 30, 2020, we have: Available liquidity of $196.4 million, with $146.4 million in cash, cash equivalents and marketable securities and $50.0 million available under revolving credit facility Total debt of $115.9 million, of which $115.0 million matures in 2030 A funded debt to EBITDA leverage ratio (as defined in our credit agreements) of 1.5 compared to a covenant limit of 3.0
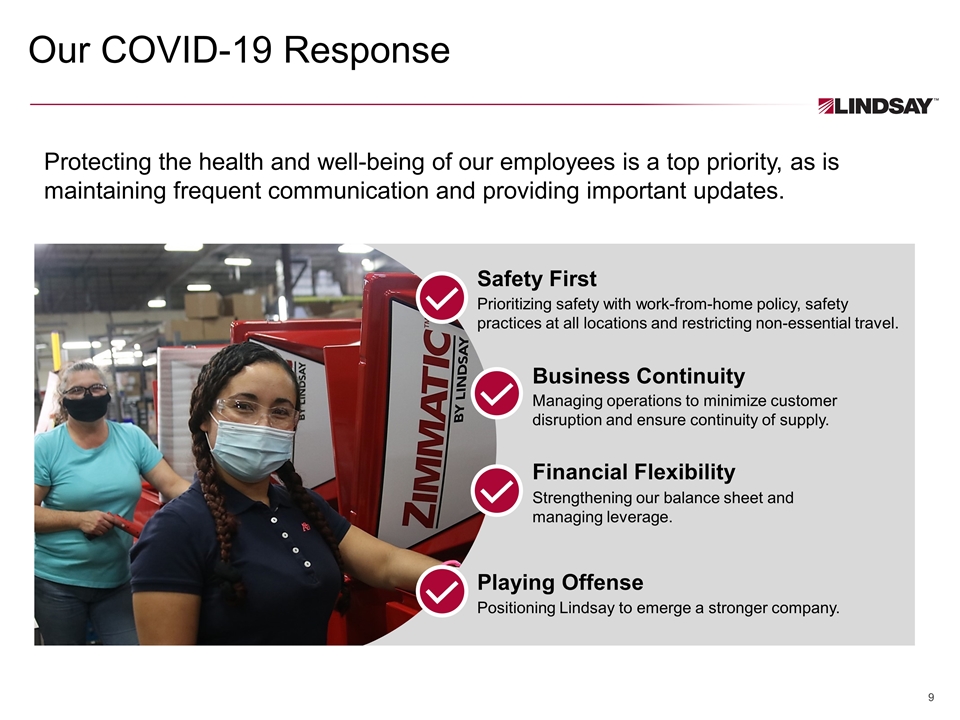
Financial Flexibility Strengthening our balance sheet and managing leverage. Managing operations to minimize customer disruption and ensure continuity of supply. Business Continuity Safety First Prioritizing safety with work-from-home policy, safety practices at all locations and restricting non-essential travel. Playing Offense Positioning Lindsay to emerge a stronger company. Our COVID-19 Response Protecting the health and well-being of our employees is a top priority, as is maintaining frequent communication and providing important updates.
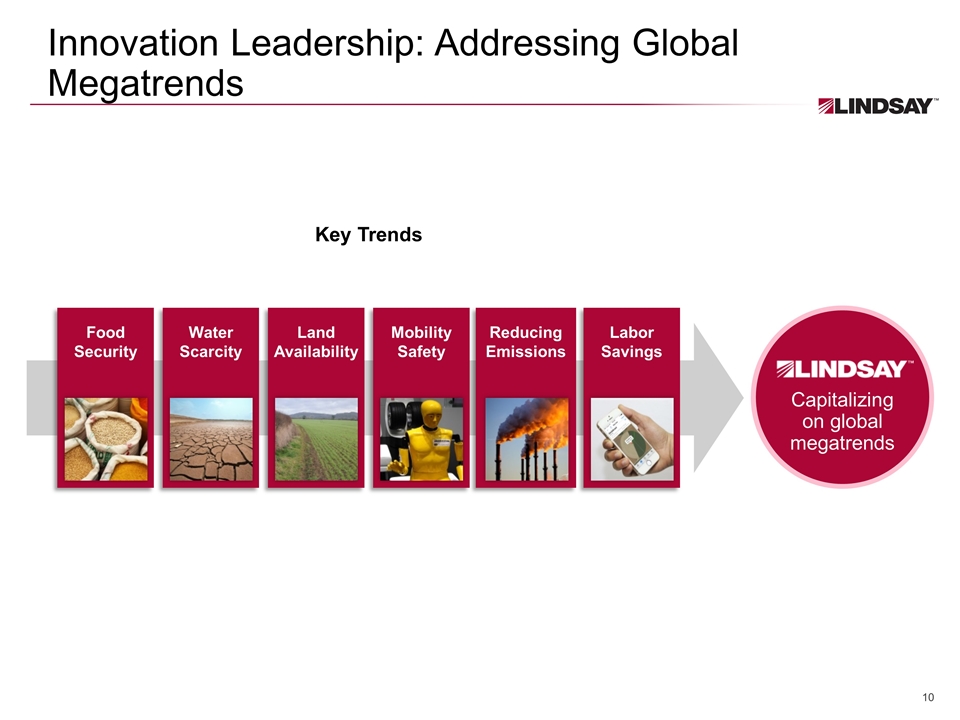
Innovation Leadership: Addressing Global Megatrends Capitalizing on global megatrends Key Trends Food Security Water Scarcity Land Availability Mobility Safety Reducing Emissions Labor Savings
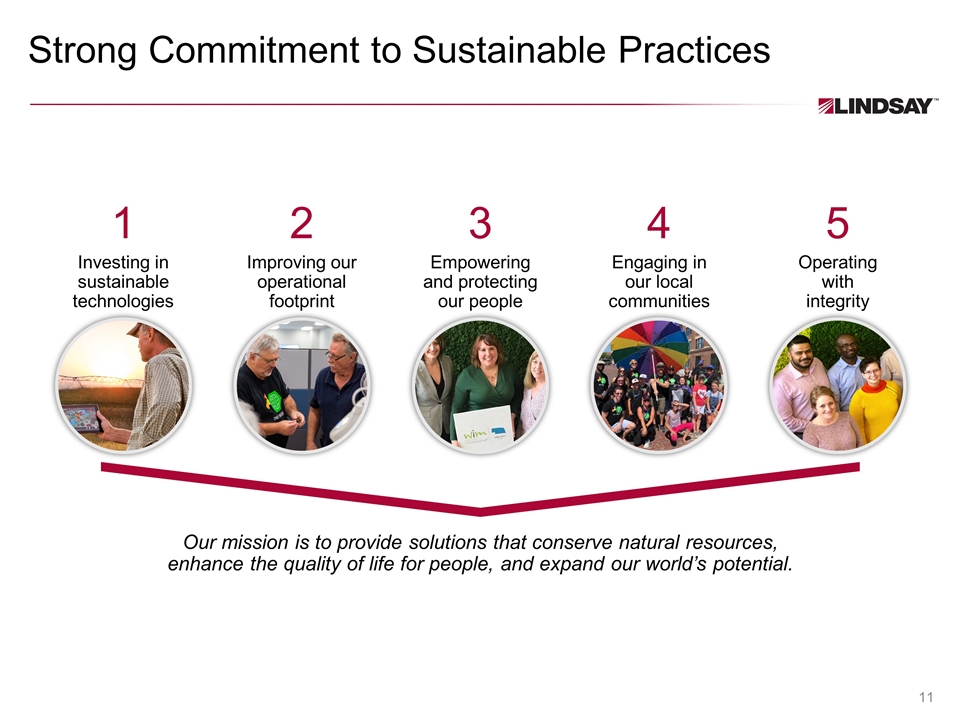
Strong Commitment to Sustainable Practices Our mission is to provide solutions that conserve natural resources, enhance the quality of life for people, and expand our world’s potential. Investing in sustainable technologies Improving our operational footprint Empowering and protecting our people Engaging in our local communities Operating with integrity 1 2 3 4 5
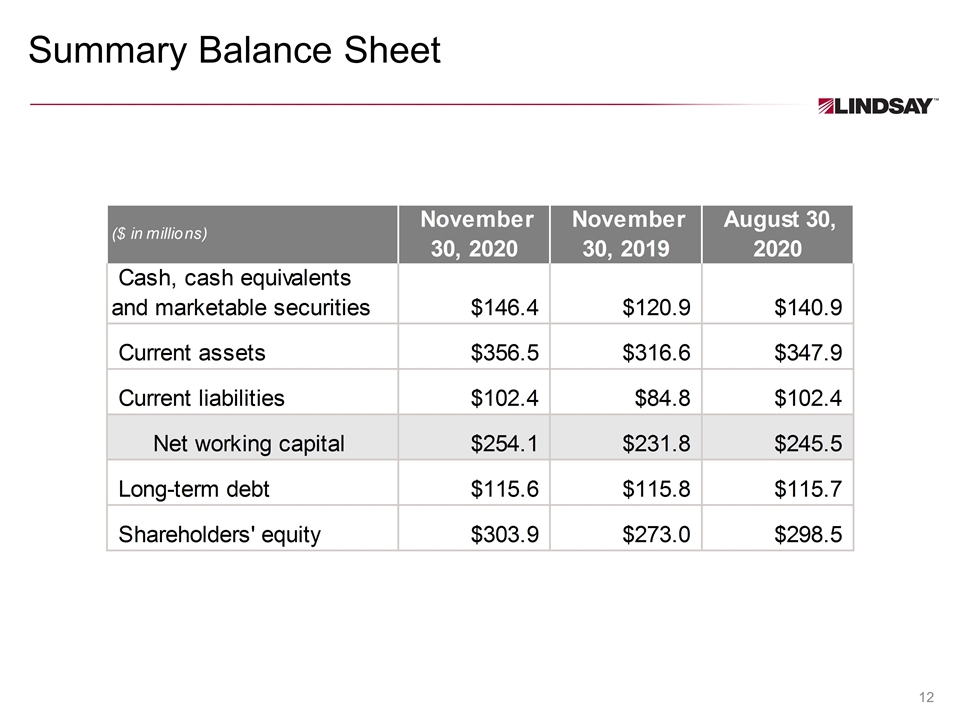
Summary Balance Sheet
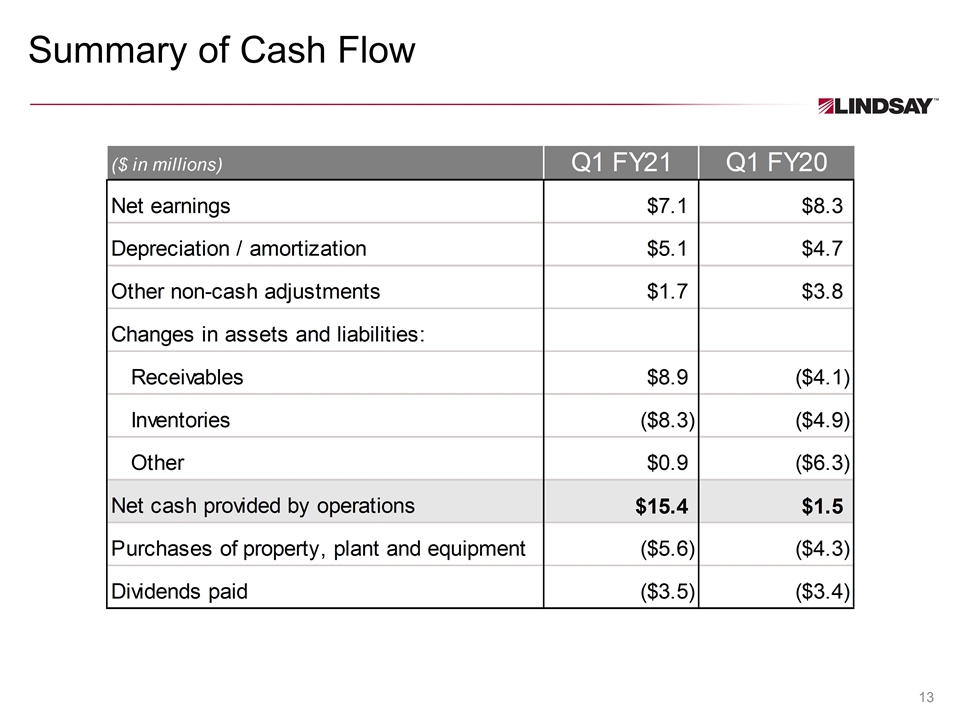
Summary of Cash Flow
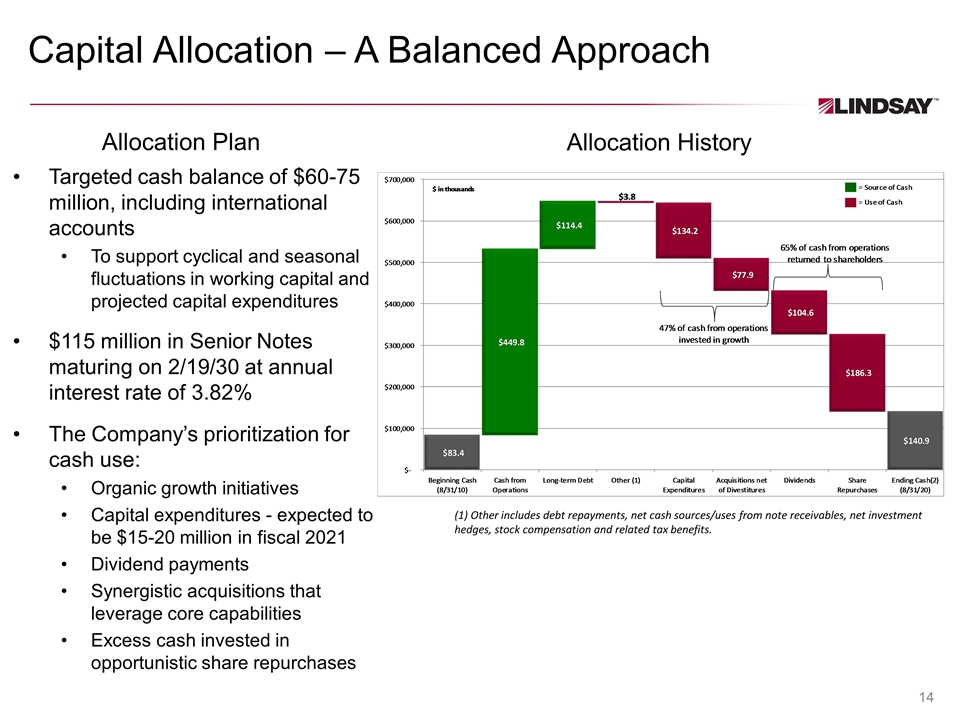
Capital Allocation – A Balanced Approach Allocation History (1) Other includes debt repayments, net cash sources/uses from note receivables, net investment hedges, stock compensation and related tax benefits. Targeted cash balance of $60-75 million, including international accounts To support cyclical and seasonal fluctuations in working capital and projected capital expenditures $115 million in Senior Notes maturing on 2/19/30 at annual interest rate of 3.82% The Company’s prioritization for cash use: Organic growth initiatives Capital expenditures - expected to be $15-20 million in fiscal 2021 Dividend payments Synergistic acquisitions that leverage core capabilities Excess cash invested in opportunistic share repurchases Allocation Plan