
LUMN 8-K
Lumen Technologies, Inc. (LUMN)
8-K
2026-05-05
For: 2026-05-05
View Original
Added on
July 04, 2026
UNITED STATES
SECURITIES AND EXCHANGE COMMISSION
WASHINGTON, D.C. 20549
FORM 8-K
CURRENT REPORT
Pursuant to Section 13 or 15(d) of the Securities Exchange Act of 1934
Date of Report (Date of earliest event reported):

(Exact name of registrant as specified in its charter)
| (State or other jurisdiction of incorporation) | (Commission File Number) | (IRS Employer Identification No.) | ||||||||||||||||||
| (Address of principal executive offices) | (Zip Code) | ||||||||||
(318 ) 388-9000
(Telephone number, including area code)
Check the appropriate box below if the Form 8-K filing is intended to simultaneously satisfy the filing obligations of any registrant under any of the following provisions:
| Written communications pursuant to Rule 425 under the Securities Act (17 CFR 230.425) | |||||
| Soliciting material pursuant to Rule 14a-12 under the Exchange Act (17 CFR 240.14a-12) | |||||
| Pre-commencement communications pursuant to Rule 14d-2(b) under the Exchange Act (17 CFR 240.14d-2(b)) | |||||
| Pre-commencement communications pursuant to Rule 13e-4(c) under the Exchange Act (17 CFR 240.13e-4(c)) | |||||
Securities registered pursuant to Section 12(b) of the Act:
| Title of Each Class | Trading Symbol | Name of Each Exchange on Which Registered | ||||||||||||
Indicate by check mark whether the registrant is an emerging growth company as defined in Rule 405 of the Securities Act of 1933 (§230.405 of this chapter) or Rule 12b-2 of the Securities Exchange Act of 1934 (§240.12b-2 of this chapter).
Emerging growth company | |||||
If an emerging growth company, indicate by check mark if the registrant has elected not to use the extended transition period for complying with any new or revised financial accounting standards provided pursuant to Section 13(a) of the Exchange Act. ☐
| Item 2.02. | Results of Operations and Financial Condition. | ||||
On May 5, 2026, Lumen Technologies, Inc. (the “Company” or “we” or “us”) issued a press release announcing financial results for the first quarter ended March 31, 2026 (the "Earnings Release"). A copy of the Earnings Release is furnished herewith as Exhibit 99.1 and is incorporated into this Current Report on Form 8-K by reference. More complete information about our financial results will be included in our Quarterly Report on Form 10-Q for the quarter ended March 31, 2026, which we expect to file in the near term with the U.S. Securities and Exchange Commission.
The information contained in Item 2.02 of this Current Report on Form 8-K, including Exhibit 99.1, shall not be incorporated by reference into any filing of the Company, whether made before or after the date hereof, regardless of any general incorporation language in such filing, unless expressly incorporated by specific reference to such filing, and shall not be deemed to be "filed" for purposes of Section 18 of the Securities Exchange Act of 1934, as amended, or otherwise subject to the liabilities of that section.
Item 7.01. | Regulation FD Disclosure. | ||||
A copy of the earnings presentation that the Company will present regarding its financial results during the teleconference beginning at 5:00 p.m. Eastern time on May 5, 2026 is attached to this Current Report on Form 8-K as Exhibit 99.2. The earnings presentation is also available on the “Investors” page of the Company’s website (http://www.lumen.com).
The information contained in Item 7.01 of this Current Report on Form 8-K, including Exhibit 99.2, shall not be incorporated by reference into any filing of the Company, whether made before or after the date hereof, regardless of any general incorporation language in such filing, unless expressly incorporated by specific reference to such filing, and shall not be deemed to be “filed” for purposes of Section 18 of the Securities Exchange Act of 1934, as amended, or otherwise subject to the liabilities of that section.
Forward-Looking Statements
Except for historical and factual information, the statements set forth in Exhibit 99.1 and Exhibit 99.2 are forward-looking within the meaning of the Private Securities Litigation Reform Act of 1995. These forward-looking statements are not guarantees of future results and are based on current expectations only, and are subject to various uncertainties. Actual events and results may differ materially from those anticipated by us in those statements. Factors that could cause our actual results to differ materially from the expectations expressed in our forward-looking statements are described in our Annual Report on Form 10-K, as updated by our most recent Quarterly Report on Form 10-Q and our other filings with the SEC. We may change our intentions or plans discussed in our forward-looking statements without notice at any time and for any reason.
| Item 9.01. | Financial Statements and Exhibits. | ||||
(d)The following exhibits are furnished with this Current Report on Form 8-K:
| Exhibit No. | Description | |||||||
| Exhibit 99.1 | ||||||||
Exhibit 99.2 | ||||||||
| Exhibit 104 | Cover page formatted as Inline XBRL and contained in Exhibit 101. | |||||||
2
SIGNATURES
Pursuant to the requirements of the Securities Exchange Act of 1934, the registrant has duly caused this report to be signed on its behalf by the undersigned hereunto duly authorized.
| LUMEN TECHNOLOGIES, INC. | ||||||||
Date: May 5, 2026 | By: | /s/ Donald Holt | ||||||
| Donald Holt | ||||||||
| Chief Accounting Officer and Controller | ||||||||
3
| NEWS RELEASE |  | |||||||
Lumen Technologies Reports Solid First Quarter 2026 Results
Delivers revenue and adjusted EBITDA in line with expectations as the Company advances its transformation strategy rooted in an unmatched physical infrastructure, programmable network, and connected ecosystem
DENVER, May 5, 2026 — Lumen Technologies, Inc. (NYSE: LUMN) today reported results for the first quarter, demonstrating continued progress in its transformation and positioning Lumen for sustainable growth in the AI-driven enterprise market. The Company also announced it has entered into an agreement to acquire Alkira, extending Lumen's leadership in programmable networking for global enterprises.
Among the Company’s highlights from the quarter:
•Financial Performance: At 51% of total business revenue (up from 49% in the fourth quarter), Strategic revenue officially surpassed Legacy revenue, despite Legacy outperforming expectations. Expanded disclosures provide greater visibility into digital revenue progression.
•Operational Execution: Advanced key transformation milestones by successfully implementing Phase 2 of ERP, continuing to deliver on our Modernization and Simplification initiatives, and proactively improved liquidity through a revolver refinancing.
•Growth Pivot: Remain on track towards full year guidance and long-term framework from Investor Day. Lumen’s digital platform continues to gain traction; Network-as-a-Service customer count, port adoption, and service count all grew meaningfully quarter over quarter.
•Alkira Agreement: The acquisition will unite Lumen’s physical infrastructure and programmable network with Alkira’s cloud-native Network-as-a-Service (NaaS) control plane, delivering a single, digital platform.
“Our strategy is working and we continue to progress towards our key financial goals we set out at Investor Day,” said Lumen CEO Kate Johnson. “The planned Alkira acquisition accelerates our digital platform strategy by extending the programmable capabilities customers need to support AI workloads.”
“First-quarter results were in line with our expectations, reflecting continued progress against our financial and strategic goals. We strengthened our balance sheet, reduced leverage below 4x following the fiber to the home sale, and continued to simplify our internal systems,” said Lumen President and CFO Chris Stansbury. “Strategic revenue now represents more than half of our business revenue, and we are pleased with increasing customer interest in our programmable network solutions. The pending Alkira acquisition reflects a disciplined and opportunistic capital allocation strategy that supports our path to revenue growth outlined at Investor Day, while remaining on track to meet full-year guidance.”
1
First Quarter 2026 Highlights
•Reported revenues of $2.899 billion for the first quarter 2026
•Reported Net Cash Provided by Operating Activities of $1.323 billion1 for the first quarter 2026 compared to Net Cash Provided by Operating Activities of $1.095 billion for the first quarter 2025
•Generated Free Cash Flow1,2 of $756 million for the first quarter 2026, excluding cash paid for Special Items2 of $376 million, compared to Free Cash Flow2 of $354 million for the first quarter 2025, excluding cash paid for Special Items2 of $50 million
•Reported Net Loss of $(200) million for the first quarter 2026, compared to Net Loss of $(201) million for the first quarter 2025
•Reported diluted loss per share of $(0.20) for the first quarter 2026, compared to diluted loss per share of $(0.20) for the first quarter 2025. Excluding Special Items2, diluted loss per share was $(0.47) for the first quarter 2026, compared to $(0.13) diluted loss per share for the first quarter 2025
•Generated Adjusted EBITDA2 of $849 million for the first quarter 2026, compared to $929 million for the first quarter 2025, excluding the effects of Special Items2 of $(430) million and $99 million, respectively
1 Includes $729 million of proceeds from the Mass Markets Fiber-to-the-Home divestiture for the allocated fair value associated with contractual credits and commercial agreements that are classified as cash flow from operations and the impact of a $101 million voluntary pension contribution in Q1 2026.
2 Represents a non-GAAP financial measure as later defined below under "Non-GAAP Financial Measures".
2
Financial Results
| Metric, as reported | First Quarter | |||||||
| ($ in millions, except per share data) | 2026 | 2025 | ||||||
Large Enterprise | $ | 778 | 769 | |||||
| Mid-Market Enterprise | 439 | 487 | ||||||
| Public Sector | 506 | 481 | ||||||
| North America Enterprise Channels | 1,723 | 1,737 | ||||||
| Wholesale | 648 | 703 | ||||||
| North America Business Revenue | 2,371 | 2,440 | ||||||
International and Other | 73 | 84 | ||||||
Business Revenue | 2,444 | 2,524 | ||||||
Mass Markets Revenue | 455 | 658 | ||||||
Total Revenue | $ | 2,899 | 3,182 | |||||
| Cost of Services and Products | 1,435 | 1,687 | ||||||
| Selling, General and Administrative Expenses | 794 | 675 | ||||||
Net Gain on Sale of Business | (596) | — | ||||||
Stock-based Compensation Expense | 13 | 10 | ||||||
Net Loss | (200) | (201) | ||||||
Net Loss, Excluding Special Items(1)(2) | (467) | (129) | ||||||
Adjusted EBITDA(1) | 1,279 | 830 | ||||||
Adjusted EBITDA, Excluding Special Items(1)(3) | 849 | 929 | ||||||
Net Loss Margin | (6.9) | % | (6.3) | % | ||||
Net Loss Margin, Excluding Special Items(1)(2) | (16.1) | % | (4.1) | % | ||||
Adjusted EBITDA Margin(1) | 44.1 | % | 26.1 | % | ||||
Adjusted EBITDA Margin, Excluding Special Items(1)(3) | 29.3 | % | 29.2 | % | ||||
Net Cash Provided by Operating Activities(4) | 1,323 | 1,095 | ||||||
Capital Expenditures | 943 | 791 | ||||||
Capital Expenditures, Excluding Special Items(1)(5) | 859 | 753 | ||||||
Unlevered Cash Flow(1)(4) | 616 | 563 | ||||||
Unlevered Cash Flow, Excluding Special Items(1)(4)(6) | 992 | 613 | ||||||
Free Cash Flow(1)(4) | 380 | 304 | ||||||
Free Cash Flow, Excluding Special Items(1)(4)(6) | 756 | 354 | ||||||
Net Loss per Common Share - Diluted | $ | (0.20) | (0.20) | |||||
Net Loss per Common Share - Diluted, Excluding Special Items(1)(2) | $ | (0.47) | (0.13) | |||||
| Weighted Average Shares Outstanding (in millions) - Diluted | 998.9 | 991.3 | ||||||
(1) See the attached schedules for definitions of non-GAAP financial measures and reconciliations to GAAP figures. | ||||||||
(2) Excludes Special Items (net of the income tax effect thereof), in the amounts of $(267) million and $72 million for the first quarter of 2026 and 2025, respectively. | ||||||||
(3) Excludes Special Items in the amounts of $(430) million and $99 million for the first quarter of 2026 and 2025, respectively. | ||||||||
(4) Includes $729 million of proceeds from the Mass Markets Fiber-to-the-Home divestiture for the allocated fair value associated with contractual credits and commercial agreements that are classified as cash flow from operations and the impact of a $101 million voluntary pension contribution in Q1 2026. | ||||||||
(5) Excludes Special Items in the amounts of $84 million and $38 million for the first quarter of 2026 and 2025, respectively. | ||||||||
(6) Excludes Special Items in the amounts of $376 million and $50 million for the first quarter of 2026 and 2025, respectively. | ||||||||
3
Revenue | First Quarter | Fourth Quarter | QoQ Percent | First Quarter | YoY Percent | ||||||||||||
| ($ in millions) | 2026 | 2025 | Change | 2025 | Change | ||||||||||||
| Revenue By Sales Channel | |||||||||||||||||
| Large Enterprise | $ | 778 | 787 | (1)% | 769 | 1% | |||||||||||
| Mid-Market Enterprise | 439 | 448 | (2)% | 487 | (10)% | ||||||||||||
| Public Sector | 506 | 458 | 10% | 481 | 5% | ||||||||||||
| North America Enterprise Channels | 1,723 | 1,693 | 2% | 1,737 | (1)% | ||||||||||||
| Wholesale | 648 | 656 | (1)% | 703 | (8)% | ||||||||||||
| North America Business Revenue | 2,371 | 2,349 | 1% | 2,440 | (3)% | ||||||||||||
| International and Other | 73 | 76 | (4)% | 84 | (13)% | ||||||||||||
Business Revenue | 2,444 | 2,425 | 1% | 2,524 | (3)% | ||||||||||||
Mass Markets Revenue | 455 | 616 | (26)% | 658 | (31)% | ||||||||||||
Total Revenue | $ | 2,899 | 3,041 | (5)% | 3,182 | (9)% | |||||||||||
Business Revenue by Product Category | |||||||||||||||||
Strategic | $ | 1,246 | 1,190 | 5% | 1,139 | 9% | |||||||||||
Legacy | 1,198 | 1,235 | (3)% | 1,385 | (14)% | ||||||||||||
Business Revenue | $ | 2,444 | 2,425 | 1% | 2,524 | (3)% | |||||||||||
Revenue
Total Revenue was $2.899 billion for the first quarter 2026, compared to $3.182 billion for the first quarter 2025.
Cash Flow
Net Cash Provided by Operating Activities was $1.323 billion3 in the first quarter 2026, compared to $1.095 billion in the first quarter 2025.
Free Cash Flow, excluding Special Items2,3, was $756 million in the first quarter 2026, compared to $354 million in the first quarter 2025.
Liquidity
As of Mar. 31, 2026, Lumen had cash and cash equivalents of $1.625 billion.
3 Includes $729 million of proceeds from the Mass Markets Fiber-to-the-Home divestiture for the allocated fair value associated with contractual credits and commercial agreements that are classified as cash flow from operations and the impact of a $101 million voluntary pension contribution in Q1 2026.
4
2026 Financial Outlook
The Company updated its full-year 2026 financial outlook, which is detailed below:
Metric (1)(2)(3) | Current Outlook | Previous Outlook | ||||||
Adjusted EBITDA | $3.1 to $3.3 billion | $3.1 to $3.3 billion | ||||||
Free Cash Flow(4) | $1.9 to $2.1 billion | $1.2 to $1.4 billion | ||||||
Net Cash Interest | $650 to $750 million | $650 to $750 million | ||||||
Capital Expenditures | $3.2 to $3.4 billion | $3.2 to $3.4 billion | ||||||
Cash Income Taxes (Refunded) Paid | ($350) to ($450) million | ($350) to ($450) million | ||||||
(1) For definitions of non-GAAP financial measures and reconciliations to GAAP figures as applicable, see the attached schedules and our Investor Relations website. | ||||||||
(2) Outlook measures in this chart and the accompanying schedules (i) exclude the effects of Special Items, goodwill impairment, future changes in our operating or capital allocation plans, unforeseen changes in regulation, laws or litigation, and other unforeseen events or circumstances impacting our financial performance and (ii) speak only as of May 5, 2026. See “Forward-Looking Statements.” | ||||||||
(3) Reflects our expectation of receiving a $400 million refund from recent tax legislation in the first half of 2026. Excludes the taxes related to the Mass Markets Fiber-to-the-Home divestiture. | ||||||||
(4) Revised Free Cash Flow guidance for 2026 now includes $729 million of cash proceeds from the Mass Markets Fiber-to-the-Home divestiture for the allocated fair value associated with contractual credits and commercial agreements that are classified as cash flow from operations. Free Cash Flow for the first quarter of 2026 as reported includes this $729 million. The cash proceeds from the divestiture have primarily been used to pay down debt in the first quarter of 2026. | ||||||||
5
Investor Call
Lumen’s management team will host a conference call at 5:00 p.m. ET today, May 5, 2026. The conference call will be streamed live over the Lumen website at ir.lumen.com. Additional information regarding first quarter 2026 results, including the presentation materials, will be available on the Investor Relations website prior to the call. A webcast replay of the call will also be available on our website for one year.
Media Relations Contacts: | Investor Relations Contact: | |||||||
Anita Gomes | Jim Breen, CFA | |||||||
| +1 858-229-8538 | +1 603-404-7003 | |||||||
About Lumen Technologies:
Lumen is unleashing the world's digital potential. We ignite business growth by connecting people, data, and applications – quickly, securely, and effortlessly. As the trusted network for AI, Lumen uses the scale of our network to help companies realize AI's full potential. From metro connectivity to long-haul data transport to our edge cloud, security, managed service, and digital platform capabilities, we meet our customers’ needs today and as they build for tomorrow.
For news and insights visit news.lumen.com, LinkedIn: /lumentechnologies, X: @lumentechco, Facebook: /lumentechnologies, Instagram: @lumentechnologies and YouTube: /lumentechnologies. Lumen and Lumen Technologies are registered trademarks of Lumen Technologies LLC in the United States. Lumen Technologies LLC is a wholly-owned affiliate of Lumen Technologies, Inc.
6
Forward-Looking Statements
Except for historical and factual information, the matters set forth in this release and our other oral or written statements identified by words such as “estimates,” “expects,” “anticipates,” “believes,” “plans,” “intends,” “will,” and similar expressions with respect to the future are forward-looking statements as defined by the federal securities laws, and are subject to the “safe harbor” protections thereunder. The forward-looking statements included in this press release including without limitation statements regarding our future financial results of operations, cash flows, or financial condition, our transformation strategy, and our modernization efforts and related target cost savings, the sale of our Mass Markets Fiber-to-the-Home business, statements regarding the pending acquisition of Alkira and the closing and expected benefits thereof, and the assumptions on which they are based are not guarantees of future results and are based on current expectations only, are inherently speculative, and are subject to a number of risks and uncertainties, many of which are beyond our control. These risks and uncertainties include those described in our Securities and Exchange Commission ("SEC") filings, including those set forth in the Risk Factors section and under the heading "Special Note Regarding Forward-Looking Statements" in our most recently filed Annual Report on Form 10-K, our Quarterly Report on Form 10-Q for the quarterly period ended March 31, 2026 to be filed with the SEC, and in our other filings with the SEC. Additional factors or risks that we currently deem immaterial, that are not presently known to us, or that arise in the future could also cause our actual results to differ materially from our expected results. Given these uncertainties, investors are cautioned not to unduly rely upon our forward-looking statements, which speak only as of the date made. We undertake no obligation to publicly update or revise any forward-looking statements for any reason, whether as a result of new information, future events or developments, changed circumstances, or otherwise. If we update one or more forward-looking statements, no inference should be drawn that we will make additional updates with respect to those or other forward-looking statements. Furthermore, any information about our intentions contained in any of our forward-looking statements reflects our intentions as of the date of such forward-looking statement, and is based upon, among other things, our assessment of regulatory, technological, industry, competitive, economic, or market conditions as of such date. We may change our intentions, strategies or plans (including our capital allocation plans) at any time and without notice, based upon any changes in such factors or otherwise, and we undertake no obligation to make any public announcement of such changed intentions, except to the extent required by applicable law.
7
| Lumen Technologies, Inc. | |||||||||||||||||
| CONSOLIDATED STATEMENTS OF OPERATIONS | |||||||||||||||||
| THREE MONTHS ENDED MARCH 31, 2026 AND 2025 | |||||||||||||||||
| (UNAUDITED) | |||||||||||||||||
| ($ in millions, except per share amounts; shares in thousands) | |||||||||||||||||
| Three months ended March 31, | (Decrease) / Increase | ||||||||||||||||
| 2026 | 2025 | ||||||||||||||||
| OPERATING REVENUE | $ | 2,899 | 3,182 | (9) | % | ||||||||||||
| OPERATING EXPENSES | |||||||||||||||||
| Cost of services and products (exclusive of depreciation and amortization) | 1,435 | 1,687 | (15) | % | |||||||||||||
| Selling, general and administrative | 794 | 675 | 18 | % | |||||||||||||
Net gain on sale of business | (596) | — | nm | ||||||||||||||
| Depreciation and amortization | 664 | 713 | (7) | % | |||||||||||||
| Total operating expenses | 2,297 | 3,075 | (25) | % | |||||||||||||
OPERATING INCOME | 602 | 107 | nm | ||||||||||||||
OTHER (EXPENSE) INCOME | |||||||||||||||||
| Interest expense | (225) | (347) | (35) | % | |||||||||||||
Net loss on early retirement of debt | (226) | (35) | nm | ||||||||||||||
Other income, net | 26 | 30 | (13) | % | |||||||||||||
Total other expense, net | (425) | (352) | 21 | % | |||||||||||||
Income tax (expense) benefit | (377) | 44 | nm | ||||||||||||||
NET LOSS | $ | (200) | (201) | — | % | ||||||||||||
BASIC LOSS PER SHARE | $ | (0.20) | (0.20) | — | % | ||||||||||||
DILUTED LOSS PER SHARE | $ | (0.20) | (0.20) | — | % | ||||||||||||
| WEIGHTED AVERAGE SHARES OUTSTANDING | |||||||||||||||||
| Basic | 998,891 | 991,269 | 1 | % | |||||||||||||
| Diluted | 998,891 | 991,269 | 1 | % | |||||||||||||
| nm - Percentages greater than 200% and comparisons between positive and negative values are considered not meaningful. | |||||||||||||||||
8
| Lumen Technologies, Inc. | |||||||||||
| CONSOLIDATED BALANCE SHEETS | |||||||||||
AS OF MARCH 31, 2026 AND DECEMBER 31, 2025 | |||||||||||
| (UNAUDITED) | |||||||||||
| ($ in millions) | |||||||||||
| March 31, 2026 | December 31, 2025 | ||||||||||
| ASSETS | |||||||||||
| CURRENT ASSETS | |||||||||||
| Cash and cash equivalents | $ | 1,625 | 1,003 | ||||||||
Accounts receivable, less allowance of $74 and $67 | 1,603 | 1,314 | |||||||||
Assets held for sale | — | 4,285 | |||||||||
| Other | 893 | 1,307 | |||||||||
| Total current assets | 4,121 | 7,909 | |||||||||
Property, plant and equipment, net of accumulated depreciation of $24,042 and $23,744 | 19,926 | 19,575 | |||||||||
| GOODWILL AND OTHER ASSETS | |||||||||||
| Other intangible assets, net | 4,240 | 4,463 | |||||||||
| Other, net | 2,335 | 2,395 | |||||||||
| Total goodwill and other assets | 6,575 | 6,858 | |||||||||
| TOTAL ASSETS | $ | 30,622 | 34,342 | ||||||||
LIABILITIES AND STOCKHOLDERS' (DEFICIT) EQUITY | |||||||||||
| CURRENT LIABILITIES | |||||||||||
| Current maturities of long-term debt | $ | 35 | 88 | ||||||||
| Accounts payable | 1,227 | 1,508 | |||||||||
| Accrued expenses and other liabilities | |||||||||||
| Salaries and benefits | 635 | 854 | |||||||||
| Income and other taxes | 587 | 279 | |||||||||
| Current operating lease liabilities | 290 | 266 | |||||||||
| Interest | 113 | 149 | |||||||||
| Other | 229 | 203 | |||||||||
Liabilities held for sale | — | 38 | |||||||||
| Current portion of deferred revenue | 1,055 | 1,005 | |||||||||
| Total current liabilities | 4,171 | 4,390 | |||||||||
| LONG-TERM DEBT | 12,925 | 17,353 | |||||||||
| DEFERRED CREDITS AND OTHER LIABILITIES | |||||||||||
| Deferred income taxes, net | 1,887 | 2,270 | |||||||||
| Benefit plan obligations, net | 1,966 | 2,103 | |||||||||
| Deferred revenue | 8,008 | 6,406 | |||||||||
| Other | 2,982 | 2,937 | |||||||||
| Total deferred credits and other liabilities | 14,843 | 13,716 | |||||||||
STOCKHOLDERS' DEFICIT | |||||||||||
Common stock | 19,165 | 19,185 | |||||||||
| Accumulated other comprehensive loss | (581) | (601) | |||||||||
Accumulated deficit | (19,901) | (19,701) | |||||||||
Total stockholders' deficit | (1,317) | (1,117) | |||||||||
TOTAL LIABILITIES AND STOCKHOLDERS' DEFICIT | $ | 30,622 | 34,342 | ||||||||
9
| Lumen Technologies, Inc. | |||||||||||
| CONDENSED CONSOLIDATED STATEMENTS OF CASH FLOWS | |||||||||||
| THREE MONTHS ENDED MARCH 31, 2026 AND 2025 | |||||||||||
| (UNAUDITED) | |||||||||||
| ($ in millions) | |||||||||||
| Three months ended March 31, | |||||||||||
| 2026 | 2025 | ||||||||||
| OPERATING ACTIVITIES | |||||||||||
Net loss | $ | (200) | (201) | ||||||||
Adjustments to reconcile net loss to net cash provided by operating activities: | |||||||||||
| Depreciation and amortization | 664 | 713 | |||||||||
Net gain on sale of business | (596) | — | |||||||||
| Deferred income taxes | (383) | (168) | |||||||||
| Provision for uncollectible accounts | 12 | 13 | |||||||||
Net loss on early retirement of debt | 226 | 35 | |||||||||
| Stock-based compensation | 13 | 10 | |||||||||
| Changes in current assets and liabilities, net | 35 | 134 | |||||||||
| Retirement benefits | (114) | (2) | |||||||||
Change in deferred revenue | 1,602 | 493 | |||||||||
Changes in other assets and liabilities, net | 70 | 30 | |||||||||
| Other, net | (6) | 38 | |||||||||
Net cash provided by operating activities | 1,323 | 1,095 | |||||||||
| INVESTING ACTIVITIES | |||||||||||
| Capital expenditures | (943) | (791) | |||||||||
Proceeds from sale of business | 4,977 | — | |||||||||
Proceeds from sale of property, plant and equipment, and other assets | 16 | 14 | |||||||||
| Other, net | — | 8 | |||||||||
Net cash provided by (used in) investing activities | 4,050 | (769) | |||||||||
| FINANCING ACTIVITIES | |||||||||||
| Net proceeds from issuance of long-term debt | 656 | 2,279 | |||||||||
| Payments of long-term debt | (5,375) | (2,502) | |||||||||
Debt issuance and extinguishment costs and related fees | — | (80) | |||||||||
| Other, net | (32) | (11) | |||||||||
Net cash used in financing activities | (4,751) | (314) | |||||||||
Net increase in cash, cash equivalents and restricted cash | 622 | 12 | |||||||||
| Cash, cash equivalents and restricted cash at beginning of period | 1,014 | 1,900 | |||||||||
| Cash, cash equivalents and restricted cash at end of period | $ | 1,636 | 1,912 | ||||||||
| Cash, cash equivalents and restricted cash: | |||||||||||
| Cash and cash equivalents | $ | 1,625 | 1,900 | ||||||||
| Restricted cash | 11 | 12 | |||||||||
| Total | $ | 1,636 | 1,912 | ||||||||
10
Non-GAAP Financial Measures
In addition to providing key metrics for management to evaluate the Company's performance, the Company believes that the non-GAAP financial measures described below and included in this release and which may be referred to on the conference call discussing the Company's first quarter 2026 financial results assist investors in their understanding of period-to-period operating performance and in identifying historical and prospective trends.
Non-GAAP financial measures are not presented to be replacements or alternatives to the measures prepared in accordance with accounting principles generally accepted in the United States (GAAP), and investors are urged to consider these non-GAAP financial measures in addition to, and not in substitution for, or superior to, financial measures prepared in accordance with GAAP. Lumen may calculate its non-GAAP financial measures differently from similarly titled measures presented by other companies.
Reconciliations of non-GAAP financial measures to the most comparable GAAP measures are included in the attached financial schedules and our Investor Relations website.
Special Items. We use the term Special Items to describe items that impacted a period’s statement of operations or cash flows which the Company believes do not relate to the ordinary course of the Company's business and do not reflect the Company's underlying business performance. As described herein, the Company presents certain GAAP and non-GAAP financial measures both including and excluding the effects of Special Items.
The largest components of our Special Items reflected in this release are net gain on sale of business related to the sale of our Mass Markets Fiber-to-the-Home business to AT&T and net losses associated with the early retirement of debt. The other main components of our Special Items include Modernization and Simplification costs, Transaction and Separation costs, and Income from Transition and Separation Services. Modernization and Simplification costs are associated with a multi-year transformation initiative to streamline our network infrastructure, product portfolio, and IT systems, and to modernize our workforce, designed to deliver $1 billion in annualized cost savings on a run-rate basis exiting 2027. Transaction and Separation costs reflect transaction and separation costs associated with the sale of our Mass Markets Fiber-to-the-Home business to AT&T and additional transaction and separation costs associated with supporting transition and separation services of our previous divestitures. Income from Transition and Separations Services includes charges we billed for transitional services and IT professional services provided to the purchasers in connection with our recent divestitures. Other items impacting Adjusted EBITDA and Net Loss include remittance of awards and associated fees related to the voluntary relinquishment of our program awards under the FCC's Rural Digital Opportunity Fund (“RDOF”), and certain charges primarily related to the recognition of losses on disposal of certain operating assets related to our divestitures and certain charges or payments related to litigation‑related expenses arising from specific matters that are not indicative of normal, recurring business activities.
Net Loss Excluding Special Items ($) is defined as Net Loss from the Statements of Operations excluding Special Items impacting Net Loss, which are further described above and detailed in the attached schedules. The Company also presents Diluted Net Loss per Share excluding Special Items, calculated as Net Loss per Share excluding Special Items divided by the weighted average of the diluted number of common shares outstanding in the relevant period.
11
Net Loss Excluding Special Items (%) is defined as Net Loss excluding Special Items divided by total revenue.
Management believes that Net Loss excluding Special Items, Net Loss Margin excluding Special Items and Diluted Net Loss Per Share excluding Special Items are relevant and useful metrics to provide to investors.
There are material limitations to using these non-GAAP financial measures, including the difficulty associated with comparing companies that use similarly-titled performance measures whose calculations may differ from our calculations. Additionally, by excluding Special Items, these non-GAAP financial measures may exclude items that investors believe are important components of our performance. Such measures should not be considered a substitute for, or superior to, other measures of financial performance reported in accordance with GAAP.
Adjusted EBITDA ($) is defined as Net loss from the Statements of Operations before Income tax expense (benefit), Total other expense, net (which represents the net impact of interest expense, net loss on early retirement of debt, and other income, net), depreciation and amortization expense, and stock-based compensation expense. The Company also presents Adjusted EBITDA excluding Special Items, which are further described above.
Adjusted EBITDA Margin (%) is defined as Adjusted EBITDA divided by total revenue. The Company also presents Adjusted EBITDA Margin excluding Special Items, which are further described above.
Management believes that Adjusted EBITDA and Adjusted EBITDA Margin (with and without Special Items) are relevant and useful metrics to provide to investors, as they are an important part of our internal reporting and are key measures used by management to evaluate profitability and operating performance of Lumen and to make resource allocation decisions. Management believes such measures are especially important in a capital-intensive industry such as telecommunications. Management also uses Adjusted EBITDA and Adjusted EBITDA Margin (and similarly uses these terms excluding Special Items) to compare our performance to that of our competitors and to eliminate certain non-cash and non-operating items in order to consistently measure from period to period our ability to fund capital expenditures and growth, service debt, and determine bonuses. Adjusted EBITDA excludes stock-based compensation expense because of the non-cash nature of this item. Adjusted EBITDA also excludes Total other expense, net (which represents the net impact of interest expense, net loss on early retirement of debt, and other income, net) and Income tax expense (benefit).
There are material limitations to using Adjusted EBITDA and Adjusted EBITDA margin (in each case, with and without Special Items) as a financial measure, including the difficulty associated with comparing companies that use similarly-titled performance measures whose calculations may differ from our calculations. Additionally, by excluding the above-listed items, Adjusted EBITDA and Adjusted EBITDA margin (in each case, with and without Special Items) may exclude items that investors believe are important components of our performance. Adjusted EBITDA and Adjusted EBITDA Margin (either with or without Special Items) should not be considered a substitute for, or superior to, other measures of financial performance reported in accordance with GAAP.
Capital Expenditures excluding Special Items is defined as Capital Expenditures from the Statements of Cash Flows excluding Special Items.
Management believes that Capital Expenditures excluding Special Items is a relevant and useful metric to provide investors.
12
There are material limitations to using Capital Expenditures excluding Special Items, including the difficulty associated with comparing companies that use similarly-titled performance measures whose calculations may differ from our calculations. Additionally, by excluding Special Items, this non-GAAP financial measures may exclude items that investors believe are important components of our performance. Capital Expenditures excluding Special Items should not be considered a substitute for, or superior to, other measures of financial performance reported in accordance with GAAP.
Unlevered Cash Flow is defined as net cash provided by (used in) operating activities less capital expenditures, plus cash interest paid and less interest income, all as disclosed in the Statements of Cash Flows. Management believes that Unlevered Cash Flow is a relevant metric to provide to investors, because it reflects the operational performance of Lumen and, measured over time, enables management and investors to monitor the underlying business’ growth pattern and ability to generate cash. The Company also presents Unlevered Cash Flow excluding Special Items, which are further described above.
There are material limitations to using Unlevered Cash Flow (with or without Special Items) to measure our cash performance as it excludes certain material items that investors may believe are important components of our cash flows. Comparisons of our Unlevered Cash Flow to that of some of our competitors may be of limited usefulness as other companies may use similarly-titled performance measures whose calculations may differ from our calculations. Additionally, this financial measure is subject to variability quarter over quarter as a result of the timing of payments related to accounts receivable, accounts payable, payroll, and capital expenditures. Unlevered Cash Flow (with or without Special Items) should not be considered a substitute for, or superior to, other measures of liquidity reported in accordance with GAAP.
Free Cash Flow is defined as net cash provided by (used in) operating activities less capital expenditures as disclosed in the Statements of Cash Flows. Management believes that Free Cash Flow is a relevant metric to provide to investors, as it is an indicator of our ability to generate cash to service our debt. The Company also presents Free Cash Flow excluding Special Items, which are further described above.
There are material limitations to using Free Cash Flow (with or without Special Items) to measure our performance as it excludes certain material items that investors may believe are important components of our cash flows. Comparisons of our Free Cash Flow to that of some of our competitors may be of limited usefulness as other companies may use similarly-titled performance measures whose calculations may differ from our calculations. Additionally, this financial measure is subject to variability quarter over quarter as a result of the timing of payments related to interest expense, accounts receivable, accounts payable, payroll and capital expenditures. Free Cash Flow (either with or without Special Items) should not be considered a substitute for, or superior to, other measures of liquidity reported in accordance with GAAP.
13
| Lumen Technologies, Inc. | ||||||||
| Non-GAAP Special Items | ||||||||
| (UNAUDITED) | ||||||||
| ($ in millions) | ||||||||
| Actual QTD | ||||||||
| Special Items Impacting Adjusted EBITDA | 1Q26 | 1Q25 | ||||||
Net gain on sale of business | $ | (596) | — | |||||
Transaction and separation costs(1) | 53 | 16 | ||||||
Modernization and simplification(2) | 106 | 50 | ||||||
Other(3) | 7 | 33 | ||||||
| Total Special Items impacting Adjusted EBITDA | $ | (430) | 99 | |||||
| Actual QTD | ||||||||
Special Items Impacting Net Loss | 1Q26 | 1Q25 | ||||||
Net gain on sale of business | $ | (596) | — | |||||
Transaction and separation costs(1) | 53 | 16 | ||||||
Modernization and simplification(2) | 106 | 50 | ||||||
Other(3) | 7 | 33 | ||||||
Net loss on early retirement of debt(4) | 226 | 35 | ||||||
Income from transition and separation services(5) | (41) | (37) | ||||||
Total Special Items impacting Net Loss | (245) | 97 | ||||||
Income tax effect of Special Items(6) | (22) | (25) | ||||||
Total Special Items impacting Net Loss, net of tax | $ | (267) | 72 | |||||
| Actual QTD | ||||||||
| Special Items Impacting Cash Flows | 1Q26 | 1Q25 | ||||||
Transaction and separation costs(1) | $ | 84 | 16 | |||||
Modernization and simplification(2)(7) | 110 | 38 | ||||||
Capital expenditures for modernization and simplification(8) | 84 | 38 | ||||||
Income from transition and separation services(5) | (14) | (54) | ||||||
Other(9) | 13 | 12 | ||||||
RDOF Relinquishment Payment(10) | 99 | — | ||||||
Total Special Items impacting Cash Flows | $ | 376 | 50 | |||||
(1) Primarily reflects transaction and separation costs associated with (i) the Q1 2026 sale of our Mass Markets fiber-to-the-home business to AT&T, and (ii) additional transaction and separation costs associated with supporting transition and separation services of our previous divestitures. | ||||||||
(2) Includes costs incurred related to network infrastructure, product portfolio, IT systems, and workforce modernization designed to deliver $1 billion annualized in cost savings on a run-rate basis exiting 2027. | ||||||||
(3) Includes primarily the recognition of a loss on disposal of certain operating assets in Q1 2025 related to our divestitures. | ||||||||
(4) Reflects net loss as a result of cash tender offers and refinancing of certain debt instrument and credit facilities. | ||||||||
(5) Reflects income from transition and separation services and includes charges we billed for transition services and IT professional services provided to the purchasers in connection with our divestitures. | ||||||||
(6) Tax effect calculated using the annualized effective statutory tax rate, excluding any non-recurring discrete items, which was 25.0% for Q1 2026 and 26.0% for Q1 2025. | ||||||||
(7) Includes the related cash payments of expenses captured as described in footnote 2 above. | ||||||||
(8) Includes primarily the related cash payments for capital expenditures incurred under the programs described in footnote 2 above. | ||||||||
(9) Includes primarily payments related to litigation‑related expenses arising from specific matters that are not indicative of normal, recurring business activities. | ||||||||
(10) Reflects the Q1 2026 payment for remittance of awards and associated fees related to the voluntary relinquishment of our RDOF awards. As a result, we will no longer receive funding through the RDOF program. | ||||||||
14
| Lumen Technologies, Inc. | ||||||||
| Non-GAAP Cash Flow Reconciliation | ||||||||
| (UNAUDITED) | ||||||||
| ($ in millions) | ||||||||
| Actual QTD | ||||||||
| 1Q26 | 1Q25 | |||||||
Net cash provided by operating activities(1) | $ | 1,323 | 1,095 | |||||
| Capital expenditures | (943) | (791) | ||||||
Free Cash Flow(1) | 380 | 304 | ||||||
| Cash interest paid | 249 | 280 | ||||||
| Interest income | (13) | (21) | ||||||
Unlevered Cash Flow(1) | $ | 616 | 563 | |||||
Free Cash Flow(1) | $ | 380 | 304 | |||||
Transaction and separation costs(2) | 84 | 16 | ||||||
Modernization and simplification(2) | 110 | 38 | ||||||
Capital expenditures for modernization and simplification | 84 | 38 | ||||||
Income from transition and separation services(2) | (14) | (54) | ||||||
Other(2) | 13 | 12 | ||||||
RDOF Relinquishment Payment(2) | 99 | — | ||||||
Free Cash Flow excluding Special Items(1) | $ | 756 | 354 | |||||
Unlevered Cash Flow(1) | $ | 616 | 563 | |||||
Transaction and separation costs(2) | 84 | 16 | ||||||
Modernization and simplification(2) | 110 | 38 | ||||||
Capital expenditures for modernization and simplification | 84 | 38 | ||||||
Income from transition and separation services(2) | (14) | (54) | ||||||
Other(2) | 13 | 12 | ||||||
RDOF Relinquishments Payment(2) | 99 | — | ||||||
Unlevered Cash Flow excluding Special Items(1) | $ | 992 | 613 | |||||
Capital expenditures | $ | (943) | (791) | |||||
Capital expenditures for modernization and simplification(2) | 84 | 38 | ||||||
Capital expenditures excluding Special Items | $ | (859) | (753) | |||||
(1) Includes $729 million of proceeds from the Mass Markets Fiber-to-the-Home divestiture for the allocated fair value associated with contractual credits and commercial agreements that are classified as cash flow from operations and the impact of a $101 million voluntary pension contribution in Q1 2026. | ||||||||
(2) Refer to Non-GAAP Special Items table for details of the Special Items impacting cash flows included above. | ||||||||
15
| Lumen Technologies, Inc. | ||||||||
Adjusted EBITDA and Reconciliation of Non-GAAP Financial Measures | ||||||||
| (UNAUDITED) | ||||||||
| ($ in millions) | ||||||||
| Actual QTD | ||||||||
| 1Q26 | 1Q25 | |||||||
Net loss | $ | (200) | (201) | |||||
| Income tax expense (benefit) | 377 | (44) | ||||||
| Total other expense, net | 425 | 352 | ||||||
| Depreciation and amortization expense | 664 | 713 | ||||||
| Stock-based compensation expense | 13 | 10 | ||||||
Adjusted EBITDA | $ | 1,279 | 830 | |||||
Net gain on sale of business(1) | (596) | — | ||||||
Transaction and separation costs(1) | 53 | 16 | ||||||
Modernization and simplification(1) | 106 | 50 | ||||||
Other(1) | 7 | 33 | ||||||
Adjusted EBITDA excluding Special Items | $ | 849 | 929 | |||||
Net loss | $ | (200) | (201) | |||||
Net gain on sale of business(1) | (596) | — | ||||||
Transaction and separation costs(1) | 53 | 16 | ||||||
Modernization and simplification(1) | 106 | 50 | ||||||
Other(1) | 7 | 33 | ||||||
Net loss on early retirement of debt(1) | 226 | 35 | ||||||
Income from transition and separation services(1) | (41) | (37) | ||||||
Income tax effect of Special Items(1) | (22) | (25) | ||||||
Net loss excluding Special Items(1) | $ | (467) | (129) | |||||
| Total revenue | $ | 2,899 | 3,182 | |||||
Net loss margin | (6.9) | % | (6.3) | % | ||||
Net loss margin, excluding special items and income tax effect thereof | (16.1) | % | (4.1) | % | ||||
Adjusted EBITDA margin | 44.1 | % | 26.1 | % | ||||
Adjusted EBITDA margin excluding special items | 29.3 | % | 29.2 | % | ||||
| Net Loss per Common Share - Diluted | $ | (0.20) | (0.20) | |||||
Net Loss per Common Share - Diluted, Excluding Special Items(1) | $ | (0.47) | (0.13) | |||||
| Weighted Average Shares Outstanding (in millions) - Diluted | 998.9 | 991.3 | ||||||
(1) Refer to Non-GAAP Special Items table for details of the Special Items included above. | ||||||||
16
| Lumen Technologies, Inc. | |||||||||||
2026 OUTLOOK RECONCILIATION (1) (2) (3) (4) | |||||||||||
| (UNAUDITED) | |||||||||||
| ($ in millions) | |||||||||||
| Adjusted EBITDA Outlook | |||||||||||
Twelve Months Ended December 31, 2026 | |||||||||||
| Range | |||||||||||
| Low | High | ||||||||||
Net loss | $ | (1,320) | (545) | ||||||||
| Income tax expense | 200 | 45 | |||||||||
| Total other expense, net | 1,300 | 1,100 | |||||||||
| Depreciation and amortization expense | 2,800 | 2,600 | |||||||||
| Stock-based compensation expense | 120 | 100 | |||||||||
| Adjusted EBITDA | $ | 3,100 | 3,300 | ||||||||
| Free Cash Flow Outlook | |||||||||||
Twelve Months Ended December 31, 2026 | |||||||||||
| Range | |||||||||||
| Low | High | ||||||||||
Net cash provided by operating activities(5) | $ | 5,100 | 5,500 | ||||||||
| Capital expenditures | (3,200) | (3,400) | |||||||||
Free Cash Flow(5) | $ | 1,900 | 2,100 | ||||||||
(1) For definitions of non-GAAP financial measures and reconciliation to GAAP figures, see the above schedules and our Investor Relations website.
(2) Outlook measures in this chart (i) exclude the effects of Special Items, goodwill impairments, future changes in our operating or capital allocation plans, unforeseen changes in regulation, laws or litigation, and other unforeseen events or circumstances impacting our financial performance and (ii) speak only as of May 5, 2026. See “Forward-Looking Statements.”
(3) Reflects our expectation of receiving a $400 million refund from recent tax legislation in the first half of 2026. Excludes the taxes related to the Mass Markets Fiber-to-the-Home divestiture.
(4) Actual results of the GAAP components of the reconciliation are subject to a number of risks and uncertainties and may vary and fall outside the estimated ranges. See "Forward-Looking Statements".
(5) Revised Free Cash Flow guidance for 2026 now includes $729 million of cash proceeds from the Mass Markets Fiber-to-the-Home divestiture for the allocated fair value associated with contractual credits and commercial agreements that are classified as cash flow from operations. Free Cash Flow for the first quarter of 2026 as reported includes this $729 million. The cash proceeds from the divestiture have primarily been used to pay down debt in the first quarter of 2026.
17
First Quarter 2026 Results May 5, 2026

© 2026 Lumen Technologies. All Rights Reserved. 1 Forward-Looking Statements Except for historical and factual information, the matters set forth in this presentation and our other oral or written statements identified by words such as “estimates,” “expects,” “anticipates,” “believes,” “plans,” “intends,” “will,” and similar expressions with respect to the future are forward-looking statements as defined by the federal securities laws, and are subject to the “safe harbor” protections thereunder. The forward-looking statements included in this presentation including without limitation statements regarding our future financial results of operations, cash flows, or financial condition, our transformation strategy, and our modernization efforts and related target cost savings, the sale of our Mass Markets Fiber-to-the-Home business, statements regarding the pending acquisition of Alkira and the closing and expected benefits thereof, the expected size of Lumen’s total addressable market after closing of the Alkira acquisition, and the assumptions on which they are based are not guarantees of future results and are based on current expectations only, are inherently speculative, and are subject to a number of risks and uncertainties, many of which are beyond our control. These risks and uncertainties include those described in our Securities and Exchange Commission ("SEC") filings, including those set forth in the Risk Factors section and under the heading "Special Note Regarding Forward-Looking Statements" in our most recently filed Annual Report on Form 10-K, our Quarterly Report on Form 10-Q for the quarterly period ended March 31, 2026 to be filed with the SEC, and in our other filings with the SEC. Additional factors or risks that we currently deem immaterial, that are not presently known to us, or that arise in the future could also cause our actual results to differ materially from our expected results. Given these uncertainties, investors are cautioned not to unduly rely upon our forward-looking statements, which speak only as of the date made. We undertake no obligation to publicly update or revise any forward-looking statements for any reason, whether as a result of new information, future events or developments, changed circumstances, or otherwise. If we update one or more forward-looking statements, no inference should be drawn that we will make additional updates with respect to those or other forward-looking statements. Furthermore, any information about our intentions contained in any of our forward-looking statements reflects our intentions as of the date of such forward-looking statement, and is based upon, among other things, our assessment of regulatory, technological, industry, competitive, economic, or market conditions as of such date. We may change our intentions, strategies or plans (including our capital allocation plans) at any time and without notice, based upon any changes in such factors or otherwise, and we undertake no obligation to make any public announcement of such changed intentions, except to the extent required by applicable law. Total Addressable Market: The size of our current total addressable market included in this presentation represents management’s estimate of the domestic market opportunity for Lumen’s current products and services within defined categories and use cases. The expected size of our total addressable market after closing of the acquisition of Alkira represents management’s estimate of the global combined market opportunity for Lumen’s and Alkira’s products and services within defined categories and use cases, subject to closing and successful integration of Alkira. These estimates are based on a combination of third-party market research, publicly available industry data, and internal analysis. While we believe our assumptions and the data underlying our estimates are reasonable, these assumptions and estimates may not be correct. As a result, our estimates of our current and potential future total addressable market may prove to be incorrect. If, among other things, the volume of data traffic and applications is lower than we estimate, or if our potential customers spend less on cloud and other infrastructure than we estimate, our current and/or future total addressable markets may be smaller than we expect.
© 2026 Lumen Technologies. All Rights Reserved. 2 This presentation includes certain historical and forward-looking non-GAAP financial measures, including but not limited to adjusted EBITDA, as well as adjusted EBITDA, adjusted EBITDA margin, free cash flow and capital expenditures excluding the effects of special items. In addition to providing key metrics for management to evaluate the company’s performance, we believe these measurements assist investors in their understanding of period-to-period operating performance and in identifying historical and prospective trends. Non-GAAP financial measures are not presented to be replacements or alternatives to the measures prepared in accordance with accounting principles generally accepted in the United States (GAAP), and investors are urged to consider these non-GAAP financial measures in addition to, and not in substitution for, or superior to, financial measures prepared in accordance with GAAP. Lumen may calculate its non-GAAP financial measures differently from similarly titled measures presented by other companies. Reconciliations of non-GAAP financial measures to the most comparable GAAP measures are included in the financial schedules to the Company’s accompanying earnings release. Reconciliation of information and additional non-GAAP historical financial measures that may be discussed during the call, along with further descriptions of non-GAAP financial measures, will be available in the Investor Relations portion of the company’s website at http://ir.lumen.com. Non-GAAP Financial Measures

© 2026 Lumen Technologies. All Rights Reserved. 3 KATE JOHNSON CEO
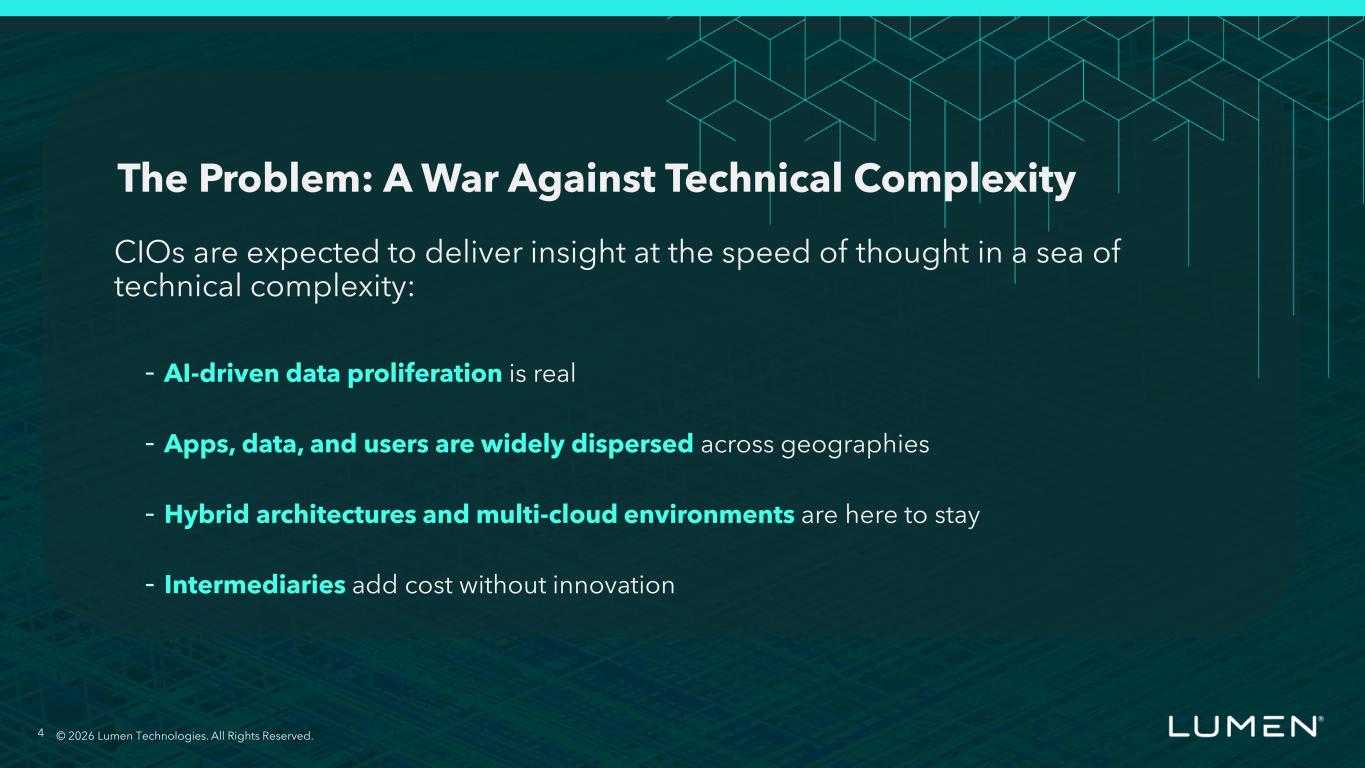
© 2025 Lumen Technologies. All Rights Reserved. 4 CIOs are expected to deliver insight at the speed of thought in a sea of technical complexity: - AI-driven data proliferation is real - Apps, data, and users are widely dispersed across geographies - Hybrid architectures and multi-cloud environments are here to stay - Intermediaries add cost without innovation The Problem: A War Against Technical Complexity © 2026 Lumen Technologies. All Rights Reserved.
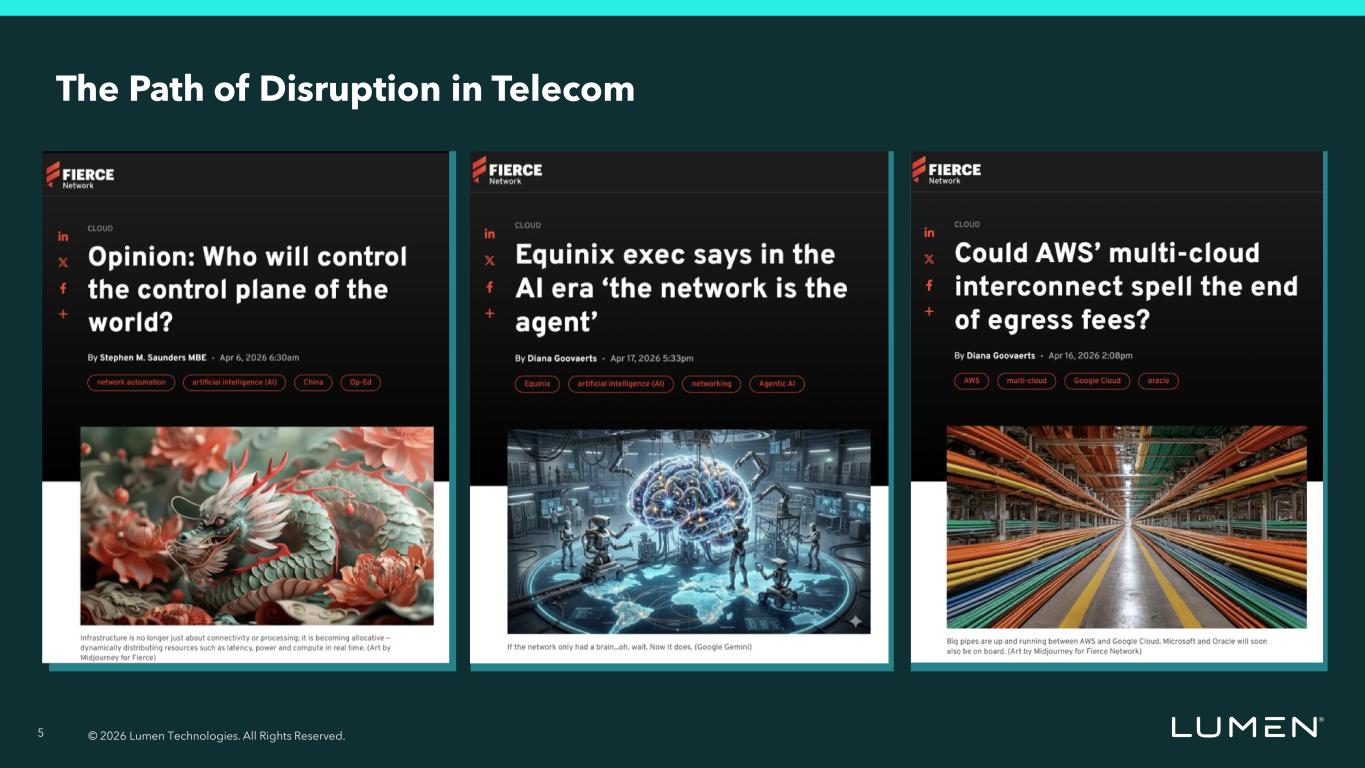
© 2026 Lumen Technologies. All Rights Reserved. 5 The Path of Disruption in Telecom
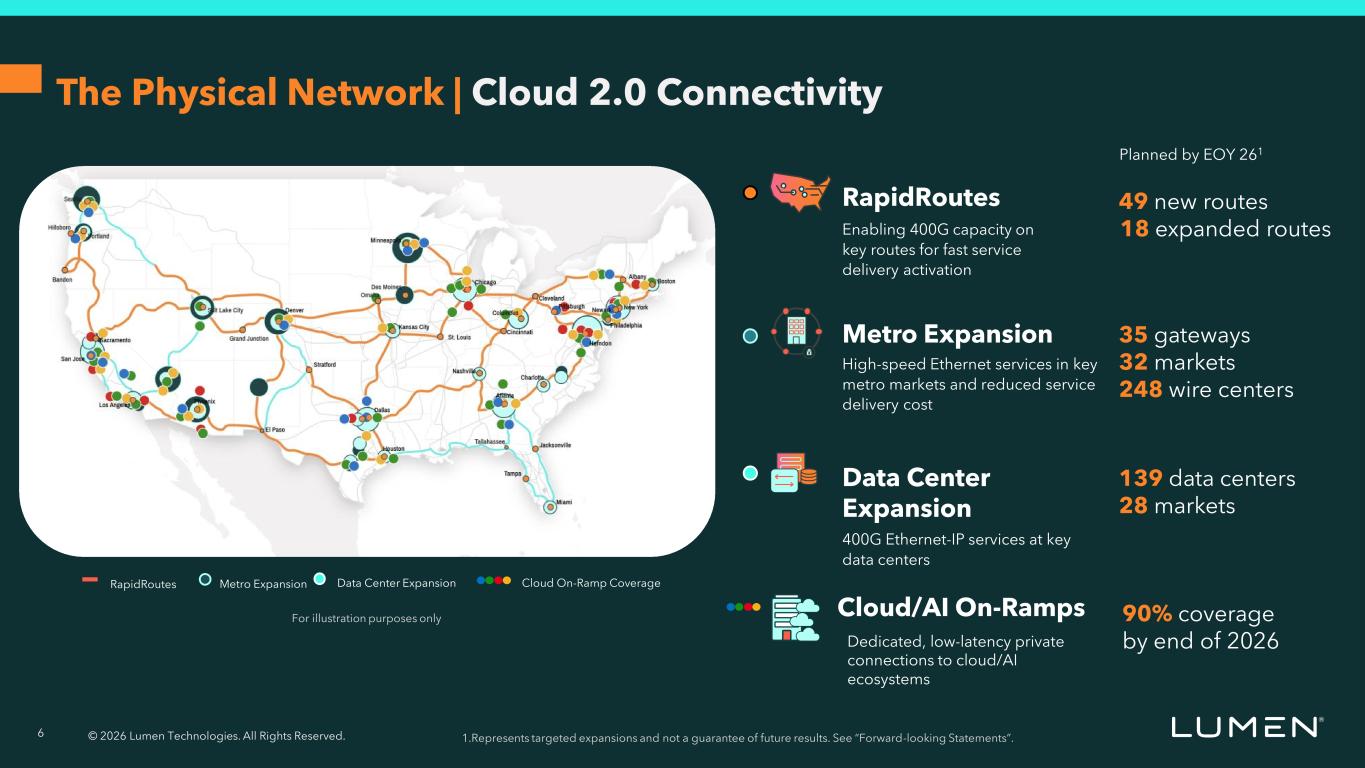
© 2026 Lumen Technologies. All Rights Reserved. 6 The Physical Network | Cloud 2.0 Connectivity RapidRoutes Metro Expansion Data Center Expansion Cloud On-Ramp Coverage 139 data centers 28 markets 35 gateways 32 markets 248 wire centers 90% coverage by end of 2026 49 new routes 18 expanded routes Planned by EOY 261 Data Center Expansion 400G Ethernet-IP services at key data centers High-speed Ethernet services in key metro markets and reduced service delivery cost Metro Expansion RapidRoutes Enabling 400G capacity on key routes for fast service delivery activation Dedicated, low-latency private connections to cloud/AI ecosystems Cloud/AI On-Ramps 1.Represents targeted expansions and not a guarantee of future results. See “Forward-looking Statements”. For illustration purposes only
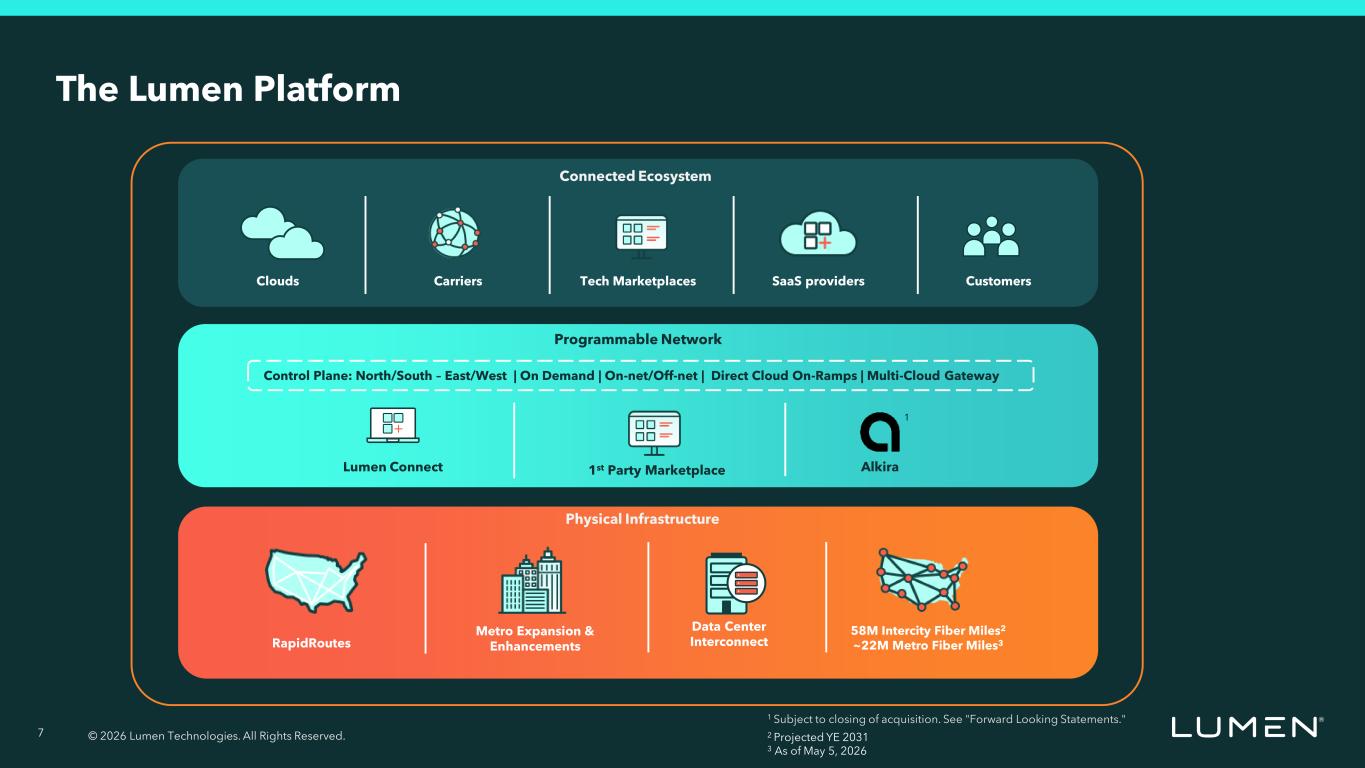
© 2026 Lumen Technologies. All Rights Reserved. 7 1st Party MarketplaceLumen Connect Alkira Physical Infrastructure Programmable Network Connected Ecosystem 58M Intercity Fiber Miles2 ~22M Metro Fiber Miles3RapidRoutes Metro Expansion & Enhancements Data Center Interconnect The Lumen Platform 2 Projected YE 2031 3 As of May 5, 2026 Control Plane: North/South – East/West | On Demand | On-net/Off-net | Direct Cloud On-Ramps | Multi-Cloud Gateway CustomersSaaS providersTech MarketplacesCarriersClouds 1 Subject to closing of acquisition. See "Forward Looking Statements." 1
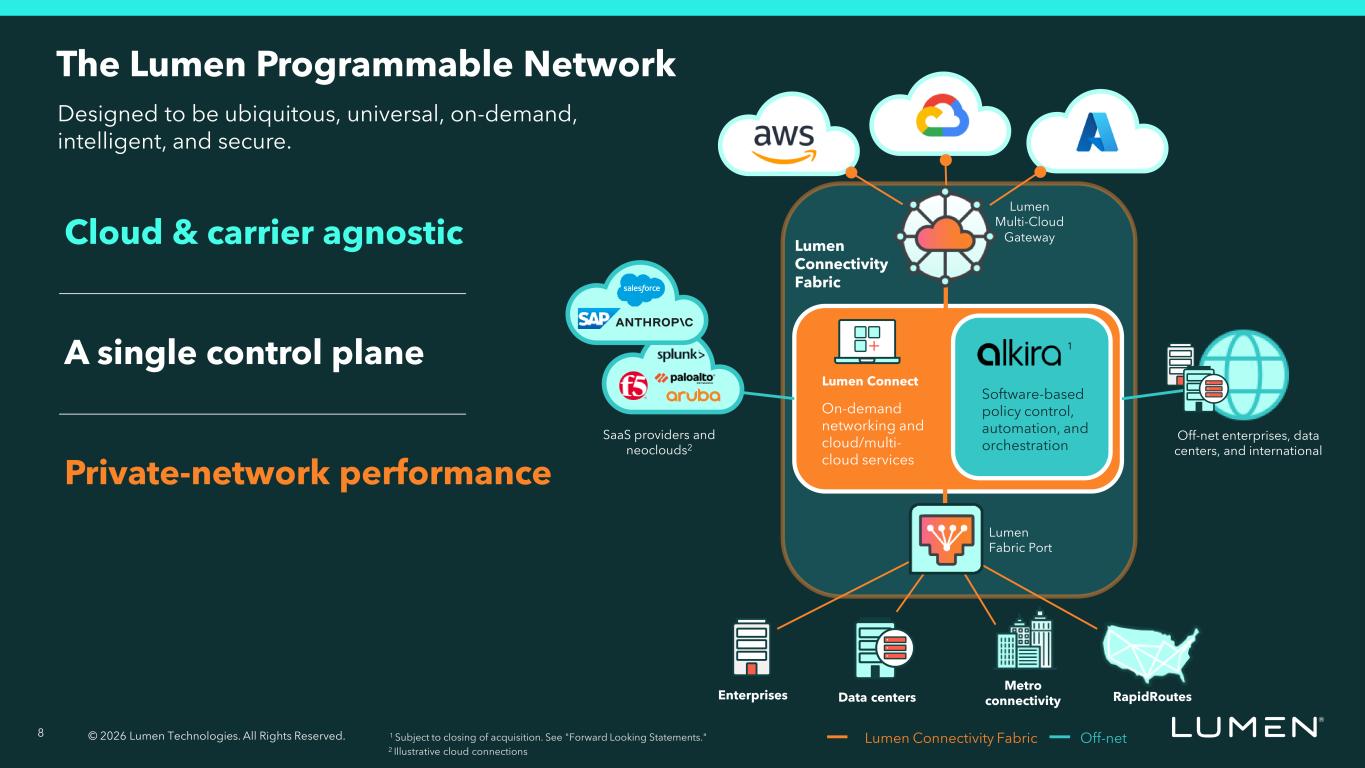
© 2026 Lumen Technologies. All Rights Reserved. 8 Cloud & carrier agnostic Private-network performance A single control plane Lumen Multi-Cloud Gateway SaaS providers and neoclouds2 The Lumen Programmable Network Metro connectivityData centers RapidRoutes Lumen Fabric Port Enterprises Off-net enterprises, data centers, and international Lumen Connectivity Fabric Off-net Lumen Connectivity Fabric On-demand networking and cloud/multi- cloud services Software-based policy control, automation, and orchestration Lumen Connect Designed to be ubiquitous, universal, on-demand, intelligent, and secure. 1 Subject to closing of acquisition. See "Forward Looking Statements." 1 2 Illustrative cloud connections
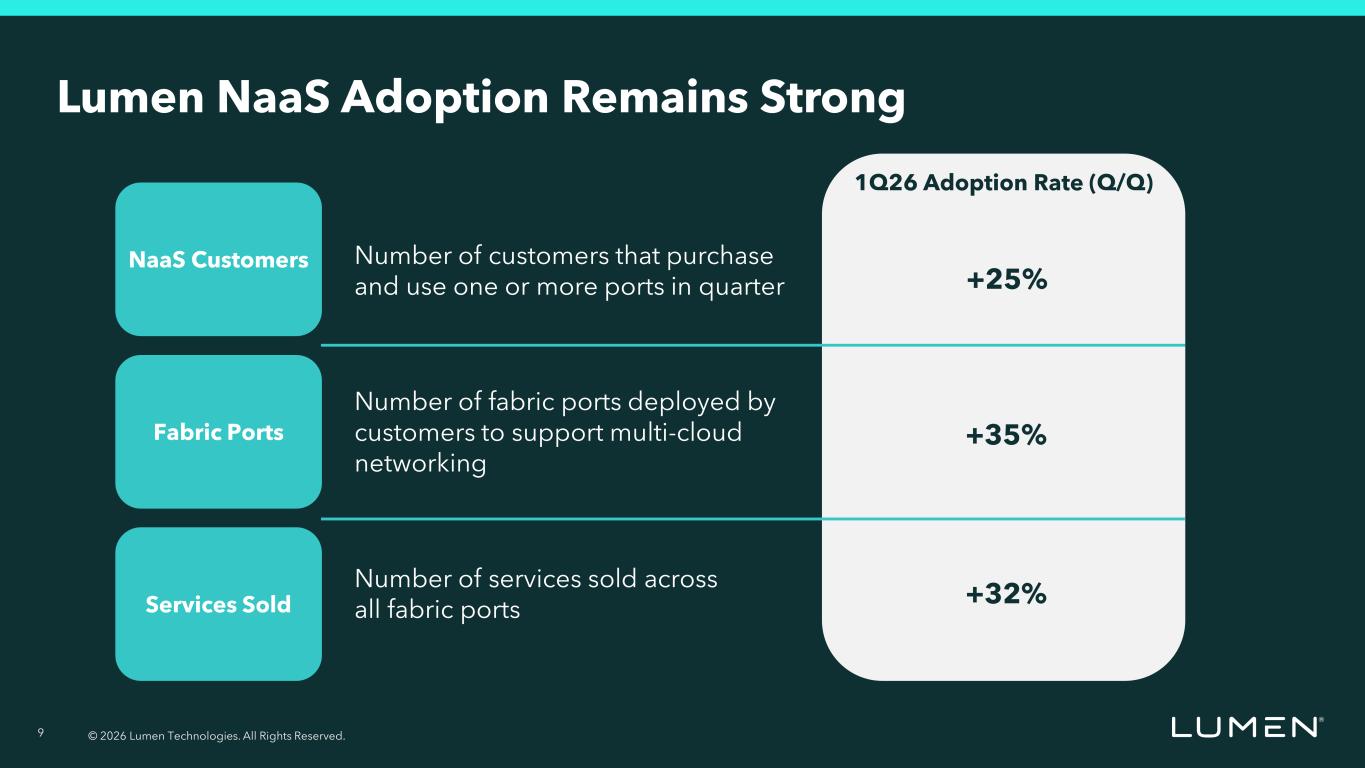
© 2026 Lumen Technologies. All Rights Reserved. 9 NaaS Customers Services Sold Fabric Ports 1Q26 Adoption Rate (Q/Q) +25% +32% +35% Number of customers that purchase and use one or more ports in quarter Number of fabric ports deployed by customers to support multi-cloud networking Number of services sold across all fabric ports Lumen NaaS Adoption Remains Strong
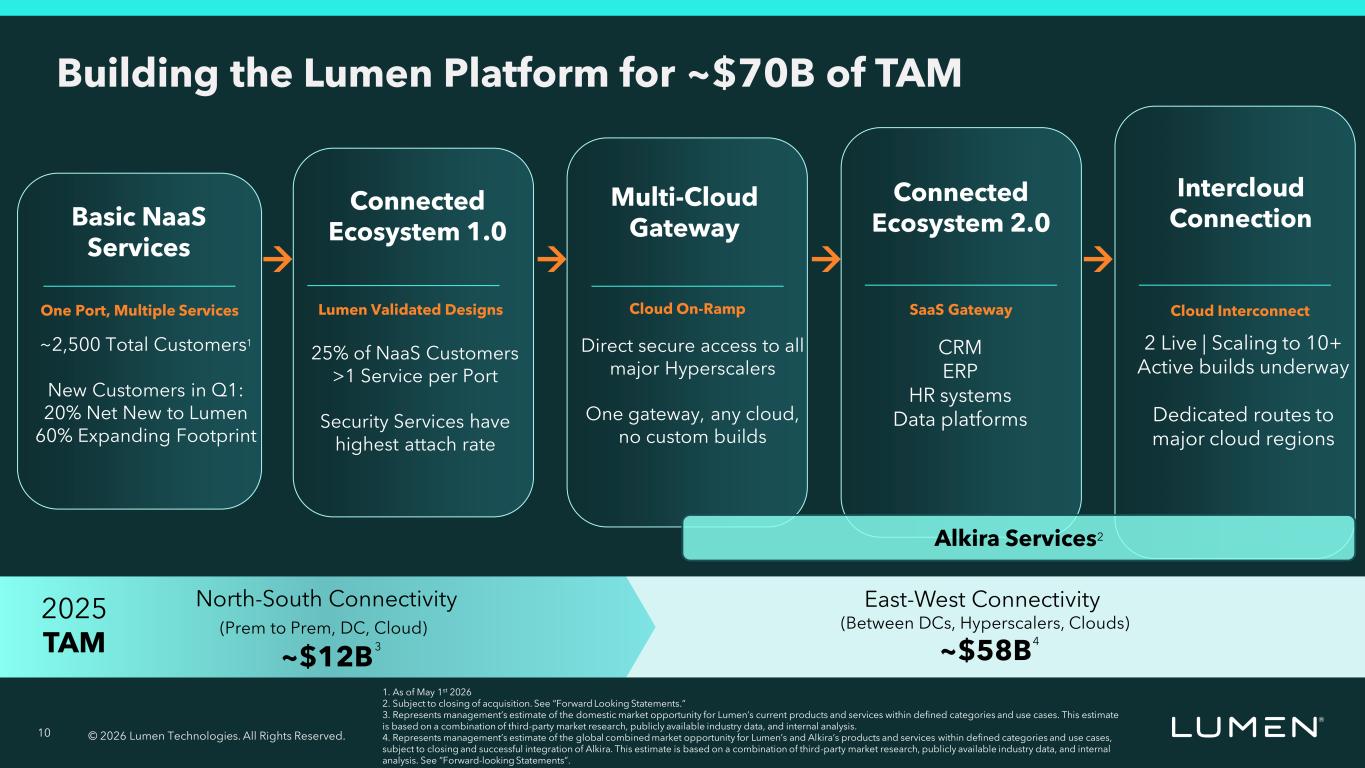
© 2026 Lumen Technologies. All Rights Reserved. 10 Building the Lumen Platform for ~$70B of TAM Lumen Validated Designs Basic NaaS Services Connected Ecosystem 1.0 Multi-Cloud Gateway Intercloud Connection Connected Ecosystem 2.0 Cloud On-RampOne Port, Multiple Services Cloud InterconnectSaaS Gateway ~2,500 Total Customers1 New Customers in Q1: 20% Net New to Lumen 60% Expanding Footprint 25% of NaaS Customers >1 Service per Port Security Services have highest attach rate Direct secure access to all major Hyperscalers One gateway, any cloud, no custom builds CRM ERP HR systems Data platforms 2 Live | Scaling to 10+ Active builds underway Dedicated routes to major cloud regions → → → → 2025 TAM North-South Connectivity (Prem to Prem, DC, Cloud) ~$12B East-West Connectivity (Between DCs, Hyperscalers, Clouds) ~$58B Alkira Services2 1. As of May 1st 2026 2. Subject to closing of acquisition. See “Forward Looking Statements.” 3. Represents management’s estimate of the domestic market opportunity for Lumen’s current products and services within defined categories and use cases. This estimate is based on a combination of third-party market research, publicly available industry data, and internal analysis. 4. Represents management’s estimate of the global combined market opportunity for Lumen’s and Alkira’s products and services within defined categories and use cases, subject to closing and successful integration of Alkira. This estimate is based on a combination of third-party market research, publicly available industry data, and internal analysis. See “Forward-looking Statements”. 43
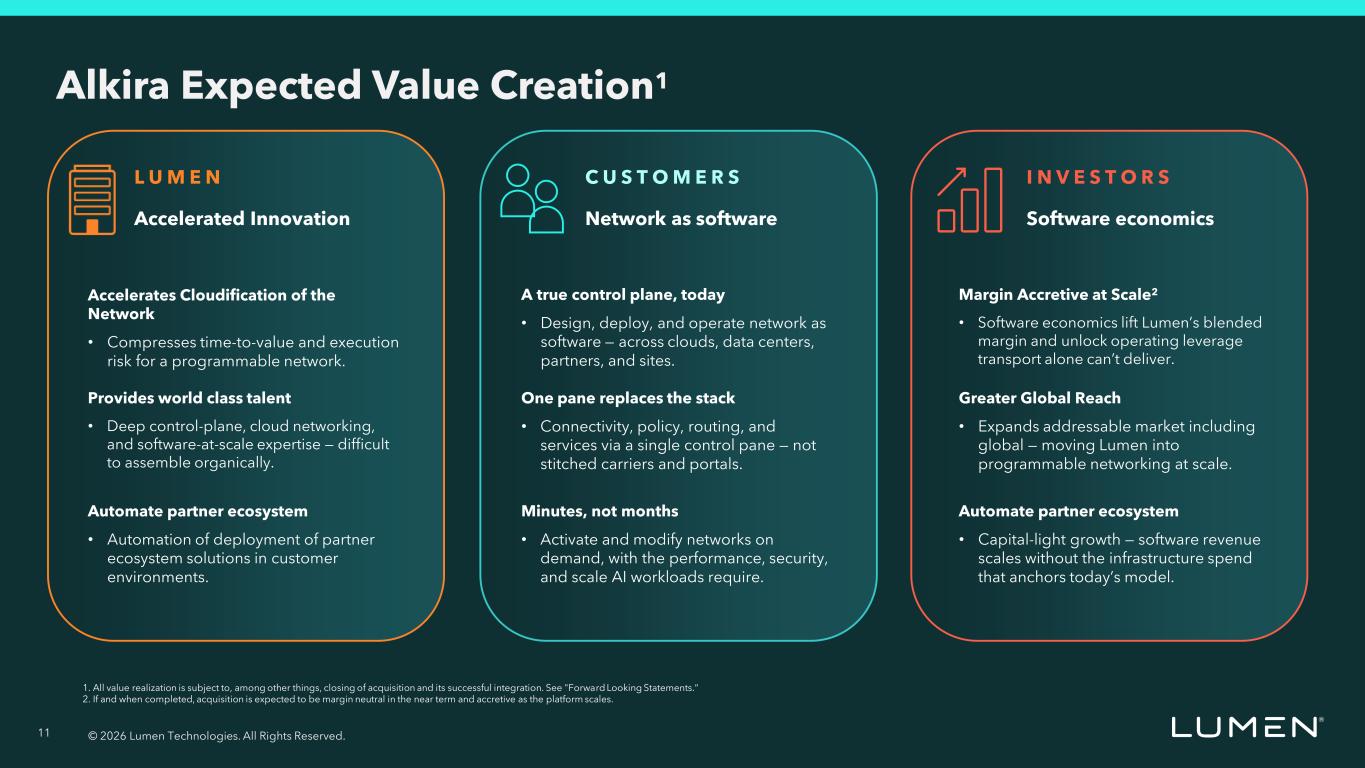
© 2026 Lumen Technologies. All Rights Reserved. 11 Alkira Expected Value Creation1 Network as software C U S T O M E R S A true control plane, today • Design, deploy, and operate network as software — across clouds, data centers, partners, and sites. One pane replaces the stack • Connectivity, policy, routing, and services via a single control pane — not stitched carriers and portals. Minutes, not months • Activate and modify networks on demand, with the performance, security, and scale AI workloads require. Software economics I N V E S T O R S Margin Accretive at Scale2 • Software economics lift Lumen’s blended margin and unlock operating leverage transport alone can’t deliver. Greater Global Reach • Expands addressable market including global — moving Lumen into programmable networking at scale. Automate partner ecosystem • Capital-light growth — software revenue scales without the infrastructure spend that anchors today’s model. Accelerated Innovation L U M E N Accelerates Cloudification of the Network • Compresses time-to-value and execution risk for a programmable network. Provides world class talent • Deep control-plane, cloud networking, and software-at-scale expertise — difficult to assemble organically. Automate partner ecosystem • Automation of deployment of partner ecosystem solutions in customer environments. 1. All value realization is subject to, among other things, closing of acquisition and its successful integration. See "Forward Looking Statements.“ 2. If and when completed, acquisition is expected to be margin neutral in the near term and accretive as the platform scales.

© 2026 Lumen Technologies. All Rights Reserved. 12 CHRIS STANSBURY PRESIDENT & CFO
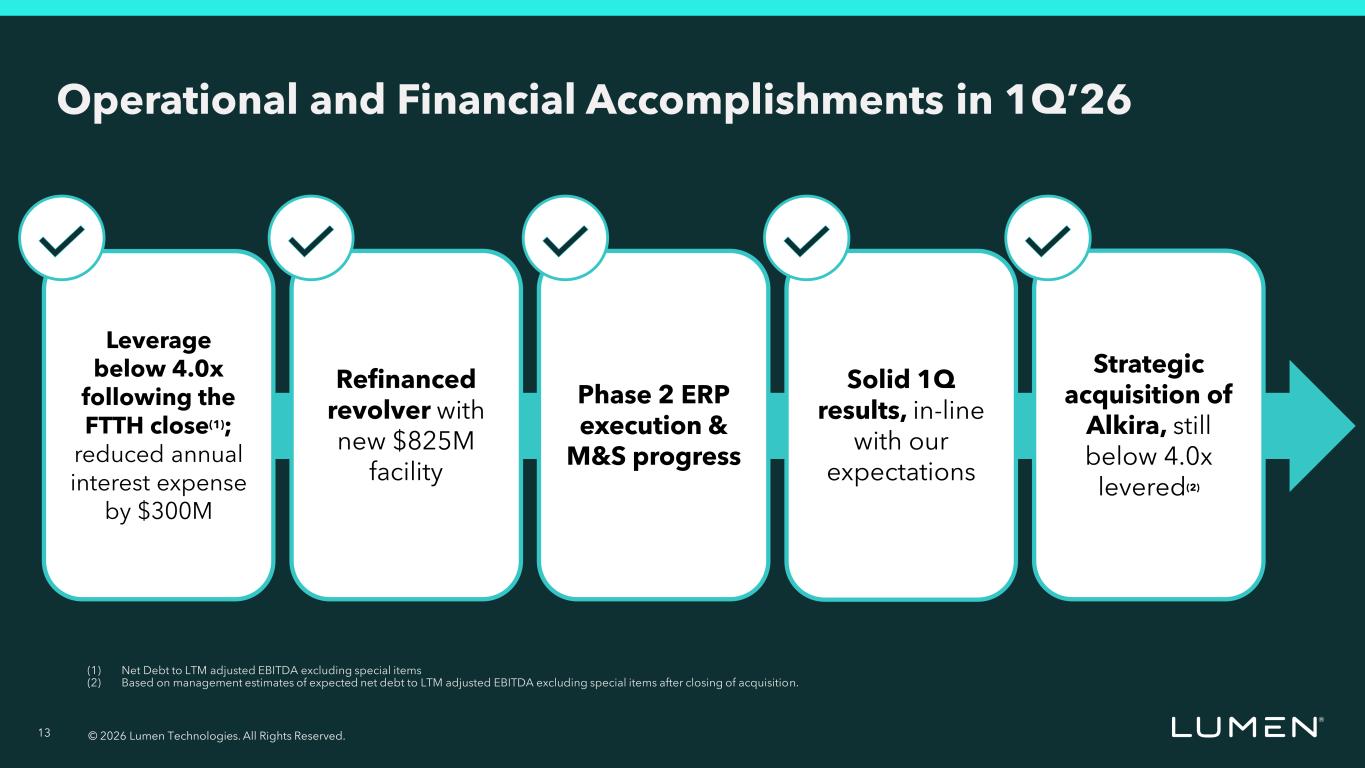
© 2026 Lumen Technologies. All Rights Reserved. 13 Operational and Financial Accomplishments in 1Q’26 Leverage below 4.0x following the FTTH close(1); reduced annual interest expense by $300M Phase 2 ERP execution & M&S progress Solid 1Q results, in-line with our expectations Strategic acquisition of Alkira, still below 4.0x levered(2) Refinanced revolver with new $825M facility (1) Net Debt to LTM adjusted EBITDA excluding special items (2) Based on management estimates of expected net debt to LTM adjusted EBITDA excluding special items after closing of acquisition.
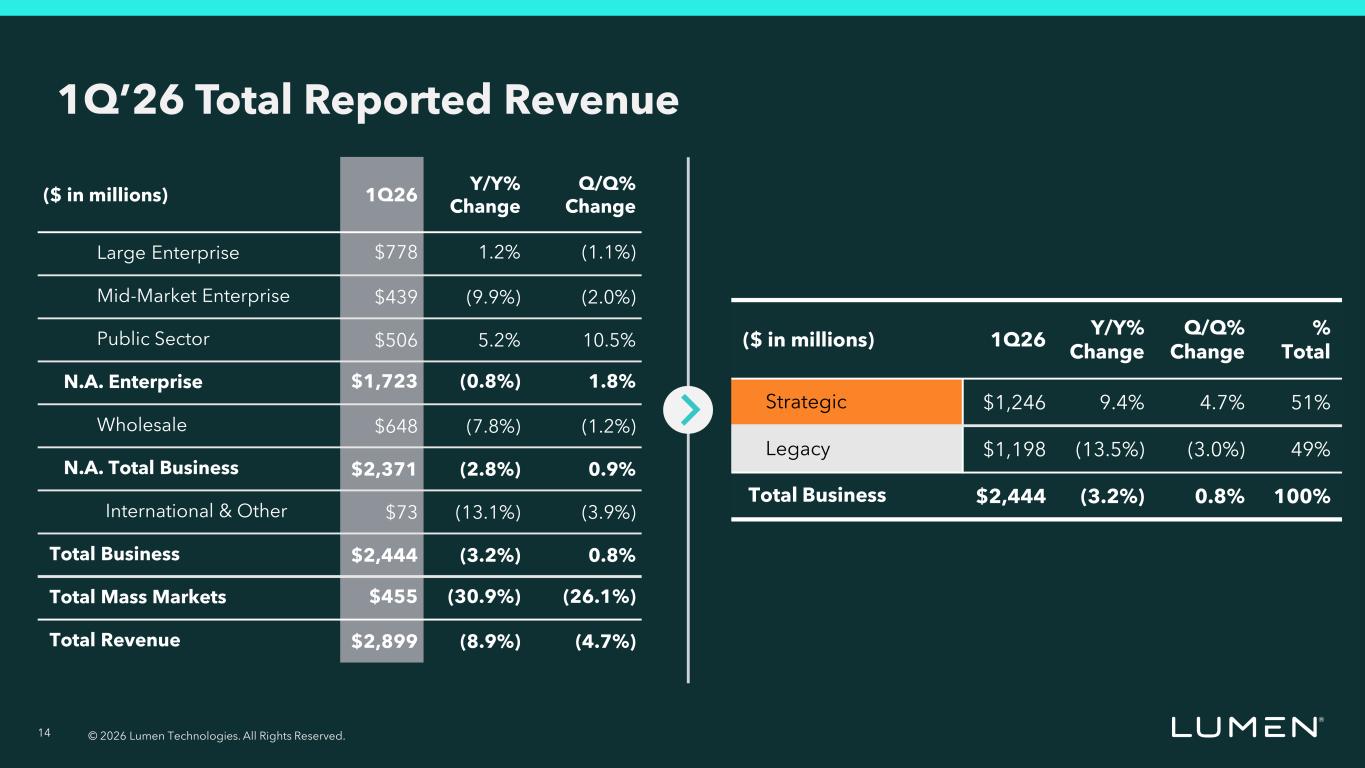
© 2026 Lumen Technologies. All Rights Reserved. 14 Q/Q% Change Y/Y% Change 1Q26($ in millions) (1.1%)1.2%$778Large Enterprise (2.0%)(9.9%)$439Mid-Market Enterprise 10.5%5.2%$506Public Sector 1.8%(0.8%)$1,723N.A. Enterprise (1.2%)(7.8%)$648Wholesale 0.9%(2.8%)$2,371N.A. Total Business (3.9%)(13.1%)$73International & Other 0.8%(3.2%)$2,444Total Business (26.1%)(30.9%)$455Total Mass Markets (4.7%)(8.9%)$2,899Total Revenue 1Q’26 Total Reported Revenue % Total Q/Q% Change Y/Y% Change 1Q26($ in millions) 51%4.7%9.4%$1,246Strategic 49%(3.0%)(13.5%) $1,198Legacy 100%0.8%(3.2%)$2,444Total Business
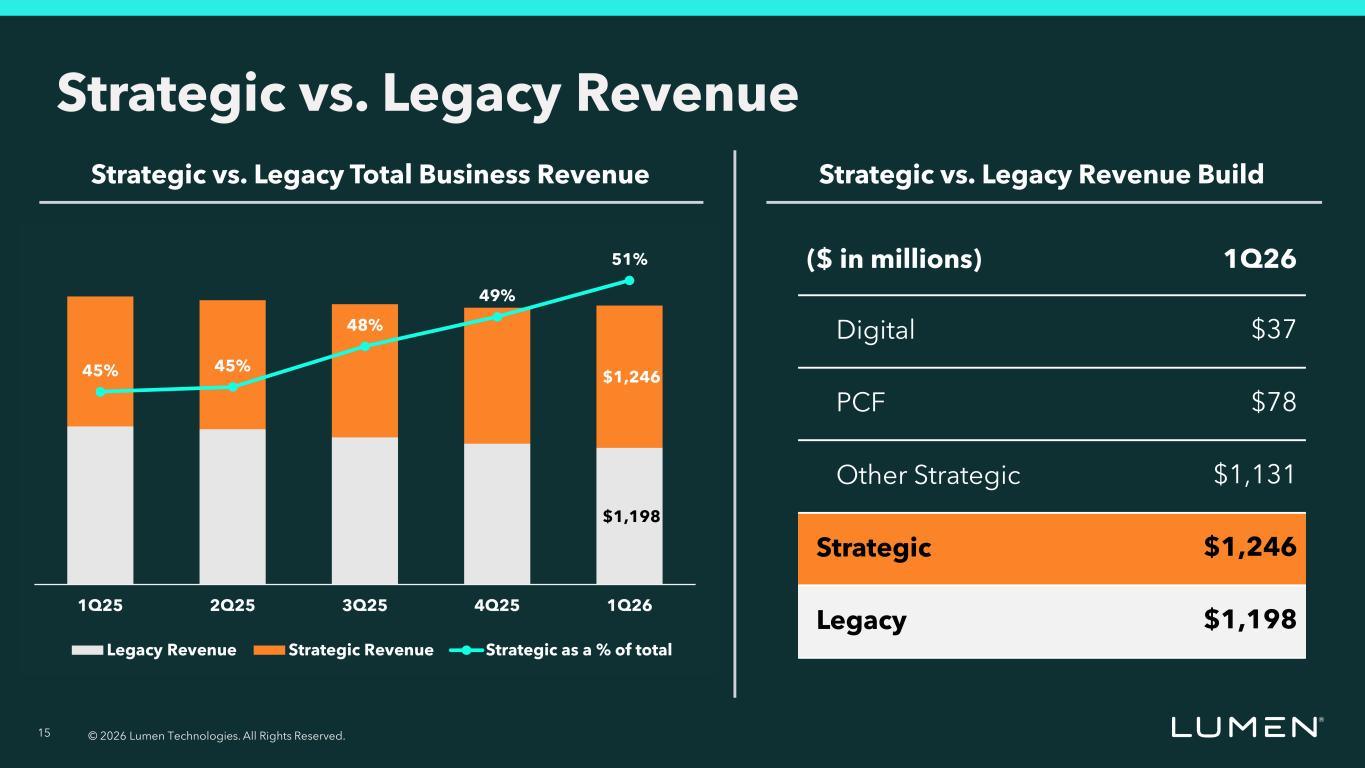
© 2026 Lumen Technologies. All Rights Reserved. 15 Strategic vs. Legacy Revenue 1Q26($ in millions) $37Digital $78PCF $1,131Other Strategic $1,246Strategic $1,198Legacy Strategic vs. Legacy Total Business Revenue Strategic vs. Legacy Revenue Build $1,198 $1,246 45% 45% 48% 49% 51% 1Q25 2Q25 3Q25 4Q25 1Q26 Legacy Revenue Strategic Revenue Strategic as a % of total
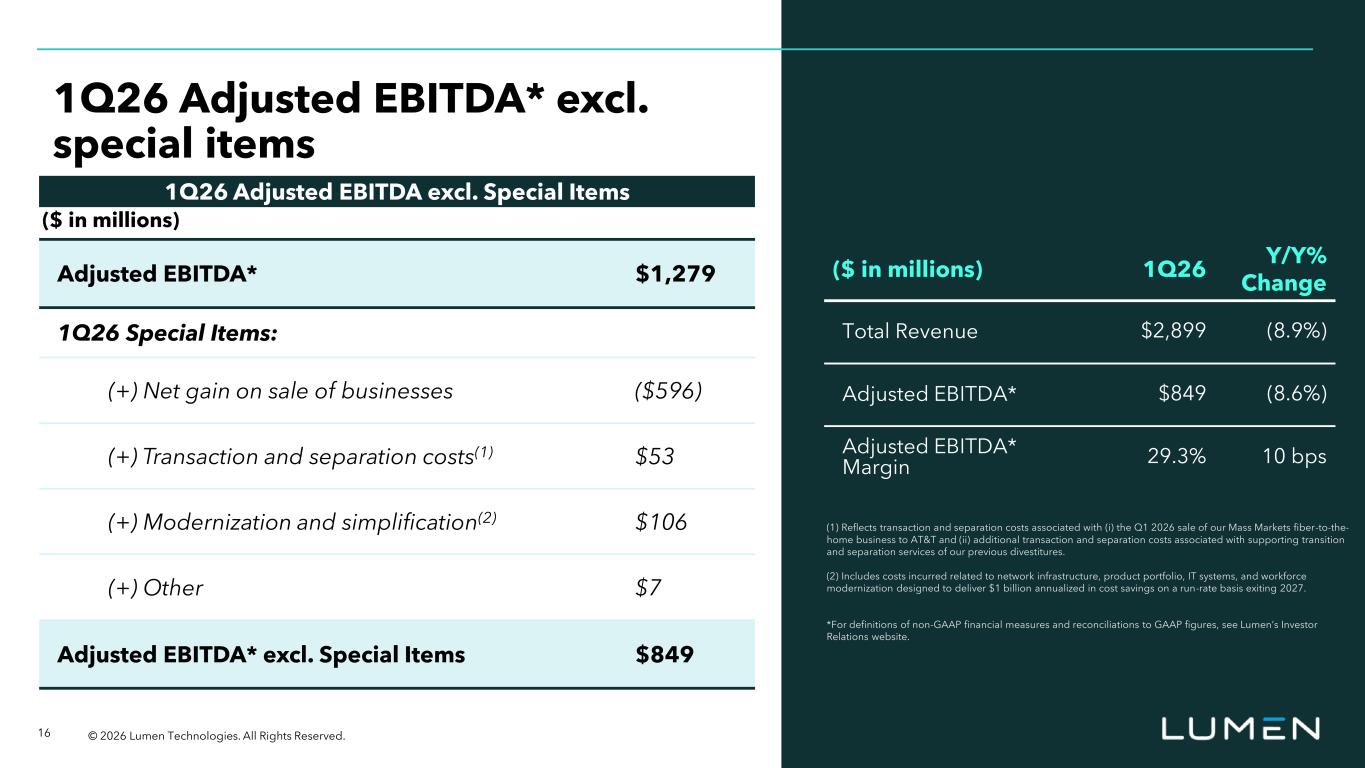
© 2026 Lumen Technologies. All Rights Reserved. 16 1Q26 Adjusted EBITDA* excl. special items Y/Y% Change 1Q26($ in millions) (8.9%)$2,899Total Revenue (8.6%)$849Adjusted EBITDA* 10 bps29.3%Adjusted EBITDA* Margin $1,279Adjusted EBITDA* 1Q26 Special Items: ($596)(+) Net gain on sale of businesses $53(+) Transaction and separation costs(1) $106(+) Modernization and simplification(2) $7(+) Other $849Adjusted EBITDA* excl. Special Items 1Q26 Adjusted EBITDA excl. Special Items ($ in millions) (1) Reflects transaction and separation costs associated with (i) the Q1 2026 sale of our Mass Markets fiber-to-the- home business to AT&T and (ii) additional transaction and separation costs associated with supporting transition and separation services of our previous divestitures. (2) Includes costs incurred related to network infrastructure, product portfolio, IT systems, and workforce modernization designed to deliver $1 billion annualized in cost savings on a run-rate basis exiting 2027. *For definitions of non-GAAP financial measures and reconciliations to GAAP figures, see Lumen’s Investor Relations website.
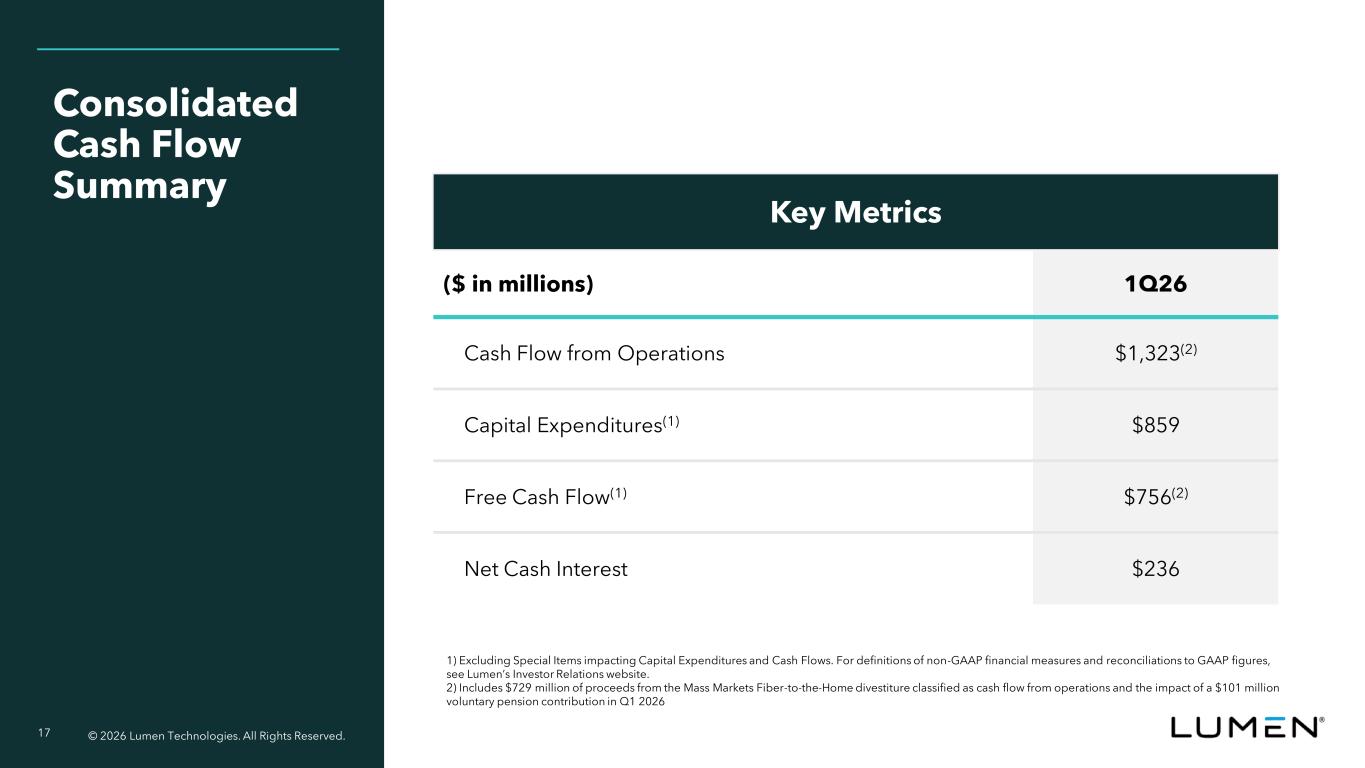
© 2026 Lumen Technologies. All Rights Reserved. 17 Consolidated Cash Flow Summary 1Q26($ in millions) $1,323(2)Cash Flow from Operations $859Capital Expenditures(1) $756(2)Free Cash Flow(1) $236Net Cash Interest Key Metrics 1) Excluding Special Items impacting Capital Expenditures and Cash Flows. For definitions of non-GAAP financial measures and reconciliations to GAAP figures, see Lumen’s Investor Relations website. 2) Includes $729 million of proceeds from the Mass Markets Fiber-to-the-Home divestiture classified as cash flow from operations and the impact of a $101 million voluntary pension contribution in Q1 2026
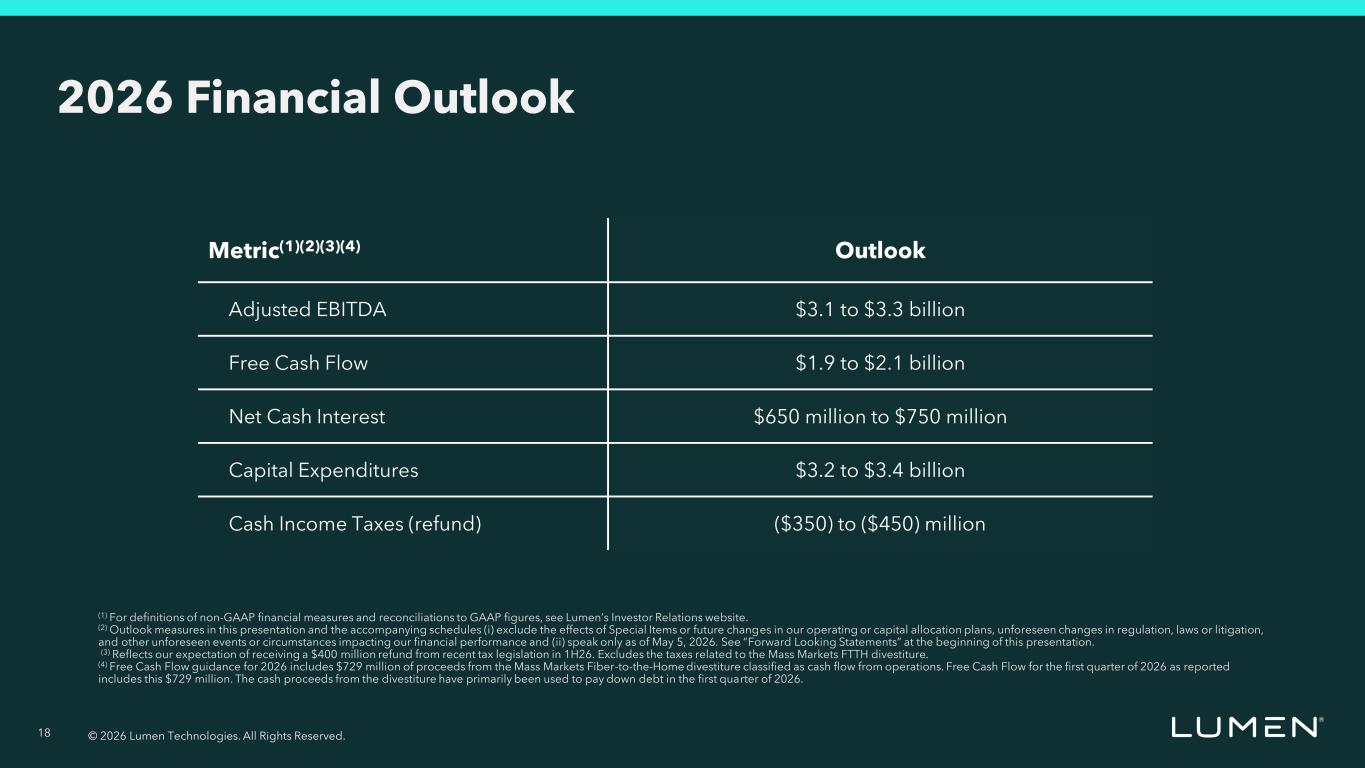
© 2026 Lumen Technologies. All Rights Reserved. 18 2026 Financial Outlook OutlookMetric(1)(2)(3)(4) $3.1 to $3.3 billionAdjusted EBITDA $1.9 to $2.1 billionFree Cash Flow $650 million to $750 millionNet Cash Interest $3.2 to $3.4 billionCapital Expenditures ($350) to ($450) millionCash Income Taxes (refund) (1) For definitions of non-GAAP financial measures and reconciliations to GAAP figures, see Lumen’s Investor Relations website. (2) Outlook measures in this presentation and the accompanying schedules (i) exclude the effects of Special Items or future changes in our operating or capital allocation plans, unforeseen changes in regulation, laws or litigation, and other unforeseen events or circumstances impacting our financial performance and (ii) speak only as of May 5, 2026. See “Forward Looking Statements” at the beginning of this presentation. (3) Reflects our expectation of receiving a $400 million refund from recent tax legislation in 1H26. Excludes the taxes related to the Mass Markets FTTH divestiture. (4) Free Cash Flow guidance for 2026 includes $729 million of proceeds from the Mass Markets Fiber-to-the-Home divestiture classified as cash flow from operations. Free Cash Flow for the first quarter of 2026 as reported includes this $729 million. The cash proceeds from the divestiture have primarily been used to pay down debt in the first quarter of 2026.
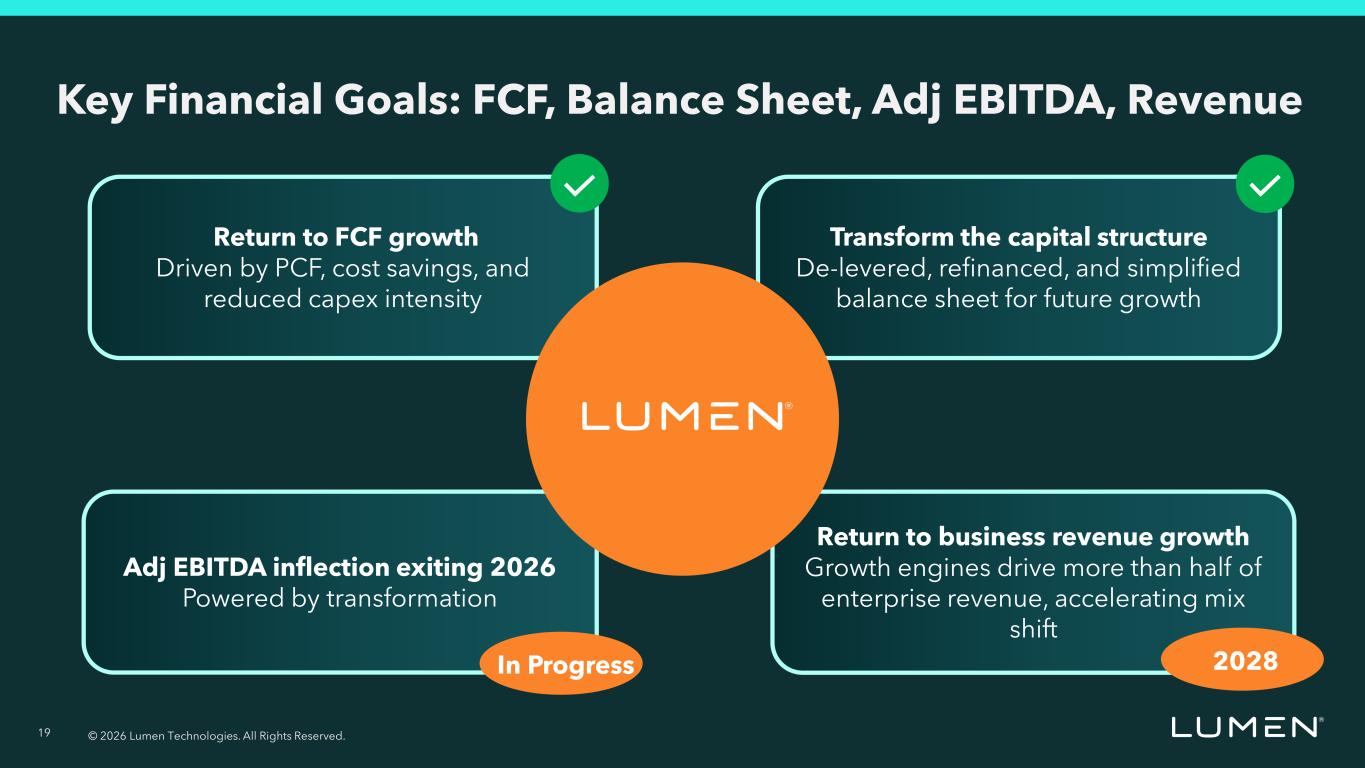
© 2026 Lumen Technologies. All Rights Reserved. 19 Key Financial Goals: FCF, Balance Sheet, Adj EBITDA, Revenue Adj EBITDA inflection exiting 2026 Powered by transformation Transform the capital structure De-levered, refinanced, and simplified balance sheet for future growth Return to business revenue growth Growth engines drive more than half of enterprise revenue, accelerating mix shift Return to FCF growth Driven by PCF, cost savings, and reduced capex intensity In Progress 2028

© 2025 Lumen Technologies. All Rights Reserved. 20