
Mfa Financial, Inc 8-K, filed Aug 6, 2020
Mfa Financial, Inc. (MFA)
About this 8-K
Mfa Financial, Inc filed this 8-K on August 6, 2020.
Items reported
- Item 2.02: Financial results
- Item 7.01: Regulation FD disclosure
UNITED STATES
SECURITIES AND EXCHANGE COMMISSION
Washington, D.C. 20549
FORM
CURRENT REPORT
Pursuant to Section 13 or
15(d) of the
Securities Exchange Act of 1934
Date of Report (Date of earliest event
reported):
(Exact name of registrant as specified in its charter)
(State
or other jurisdiction of |
(Commission
File |
(IRS
Employer Identification |
| (Address of principal executive offices) | (Zip Code) |
Registrant's telephone number, including
area code: (
Not Applicable
(Former name or former address, if changed since last report)
Check the appropriate box below if the Form 8-K filing is intended to simultaneously satisfy the filing obligation of the registrant under any of the following provisions(see General Instruction A.2. below):
| Written communications pursuant to Rule 425 under the Securities Act (17 CFR 230.425) | |
| Soliciting material pursuant to Rule 14a-12 under the Exchange Act (17 CFR 240.14a-12) | |
| Pre-commencement communications pursuant to Rule 14d-2(b) under the Exchange Act (17 CFR 240.14d-2(b)) | |
| Pre-commencement communications pursuant to Rule 13e-4(c) under the Exchange Act (17 CFR 240.13e-4(c)) |
Securities registered pursuant to Section 12(b) of the Act:
| Title of each class: | Trading Symbols: |
Name
of each exchange on |
Indicate by check mark whether the registrant is an emerging growth company as defined in Rule 405 of the Securities Act of 1933 (§230.405 of this chapter) or Rule 12b-2 of the Securities Exchange Act of 1934 (§240.12b-2 of this chapter).
Emerging
growth company
If an emerging growth company, indicate by check mark if the registrant has elected not to use the extended transition period for complying with any new or revised financial accounting standards provided pursuant to Section 13(a) of the Exchange Act. ¨
Item 2.02 Results of Operations and Financial Condition and
Item 7.01 Regulation FD Disclosure
MFA Financial, Inc. (the “Company” or “MFA”) issued a press release, dated August 6, 2020, announcing its financial results for the quarter ended June 30, 2020, which is attached hereto as Exhibit 99.1 and is incorporated herein by reference. In addition, in conjunction with the announcement of its financial results, MFA issued additional information relating to its 2020 second quarter financial results. Such additional information is attached to this report as Exhibit 99.2 and is incorporated herein by reference.
The information referenced in this Current Report on Form 8-K (including Exhibits 99.1 and 99.2) is being “furnished” and, as such, shall not be deemed to be “filed” for the purposes of Section 18 of the Securities Exchange Act of 1934, as amended (the “Exchange Act”), or otherwise subject to the liabilities of that Section. The information set forth in this Current Report on Form 8-K (including Exhibits 99.1 and 99.2) is and will not be incorporated by reference into any registration statement or other document filed by MFA pursuant to the Securities Act of 1933, as amended and the rules and regulations promulgated thereunder (the “Securities Act”), except as may be expressly set forth by specific reference in such filing.
As discussed therein, the press release contains forward-looking statements within the meaning of the Securities Act and the Exchange Act and, as such, may involve known and unknown risks, uncertainties and assumptions. These forward-looking statements relate to MFA’s current expectations and are subject to the limitations and qualifications set forth in the press release as well as in MFA’s other documents filed with the SEC, including, without limitation, that actual events and/or results may differ materially from those projected in such forward-looking statements.
Exhibit
| 99.1 | Press Release, dated August 6, 2020, announcing MFA’s financial results for the quarter ended June 30, 2020. |
| 99.2 | Additional information relating to the financial results of MFA for the quarter ended June 30, 2020. |
| 104 | Cover Page Interactive Data File (formatted as Inline XBRL). |
SIGNATURE
Pursuant to the requirements of the Securities Exchange Act of 1934, the registrant has duly caused this report to be signed on its behalf by the undersigned hereunto duly authorized.
| MFA FINANCIAL, INC. | ||
| (REGISTRANT) | ||
| By: | /s/ Harold E. Schwartz | |
| Name:Harold E. Schwartz | ||
| Title: Senior Vice President and General Counsel | ||
| Date: August 6, 2020 | ||
EXHIBIT INDEX
| Exhibit No. | Description | |
| 99.1 | Press Release, dated August 6, 2020, announcing MFA Financial Inc.’s financial results for the quarter ended June 30, 2020. |
| 99.2 | Additional information relating to the financial results of MFA Financial, Inc. for the quarter ended June 30, 2020. | |
| 104 | Cover Page Interactive Data File (formatted as Inline XBRL). |
Exhibit 99.1

MFA
FINANCIAL, INC.
350 Park Avenue
New York, New York 10022
| PRESS RELEASE | FOR IMMEDIATE RELEASE |
| August 6, 2020 | NEW YORK METRO |
| INVESTOR CONTACT: | InvestorRelations@mfafinancial.com | NYSE: MFA |
| 212-207-6488 | ||
| www.mfafinancial.com |
| MEDIA CONTACT: | Abernathy MacGregor | |
| Tom Johnson | ||
| 212-371-5999 |
MFA Financial, Inc. Announces Second Quarter 2020 Financial Results and declares $0.05 common dividend
NEW YORK - MFA Financial, Inc. (NYSE:MFA) today provided its financial results for the second quarter ended June 30, 2020.
Second Quarter 2020 financial results update:
| · | MFA generated second quarter net income of $88.4 million, or $0.19 per common share. |
| · | During the second quarter, we continued to take actions to preserve book value, reduce leverage, generate liquidity and stabilize our financial position. MFA sold approximately $3.2 billion of residential mortgage assets, realizing net gains of $49.5 million for the quarter. In addition, overall asset prices recovered appreciably during this period, resulting in a partial recovery of the significant losses recorded in the first quarter. Unrealized gains on residential mortgage securities accounted for at fair value were $64.4 million during the quarter and the overall price appreciation of residential mortgage assets drove the positive changes in our book value. |
1
| · | As previously announced, on June 26, 2020 we finalized a number of financing transactions, including a $500 million capital raise through a private senior secured loan agreement and approximately $2.0 billion of non-mark-to-market term borrowing facilities. In conjunction with the completion of the transactions, we also entered into agreements to reinstate our repurchase agreement financings with certain of our financing counterparties on an ongoing basis on renegotiated terms and to terminate the forbearance agreements we initially entered into on April 10, 2020. |
| · | After taking into consideration dividends payable on our Series B and Series C Preferred Stock that were reinstated and declared on July 1, 2020 and paid on July 31, 2020, estimated undistributed REIT taxable income as of June 30, 2020 is $0.16 per common share. |
| · | GAAP book value at June 30, 2020 was $4.51 per common share, while Economic book value, a non-GAAP financial measure of MFA’s financial position that adjusts GAAP book value by the amount of unrealized market value changes in residential whole loans held at carrying value for GAAP reporting, was $4.46 per common share at quarter-end. |
| · | MFA also announced today that it has declared a regular cash dividend of $0.05 per share of common stock. The dividend will be paid on October 30, 2020, to stockholders of record on September 30, 2020. |
Commenting on the second quarter 2020 results, Craig Knutson, MFA’s CEO and President said, “The second quarter of 2020 was anything but “business as usual” for MFA Financial. The global COVID-19 pandemic led to unprecedented market conditions late in the first quarter of this year, and as we entered the second quarter, we were negotiating with our lender counterparties to seek forbearance, while simultaneously working to raise liquidity and de-lever our portfolio. We entered into an initial forbearance agreement on April 10, at which time we had already reduced our repurchase obligations to $5.8 billion from $9.5 billion on March 20. Through the rest of April and into May, we continued to generate liquidity and reduce our exposure to mark-to-market financing by selling assets. The initial forbearance period was extended on April 27 to June 1, and again on June 1 to June 26. When we emerged from forbearance on June 26, our balance sheet was materially different than at the beginning of the quarter, and our assets are now primarily comprised of residential whole loans. On the liability side, we have profoundly altered the nature of our financings to be more durable, with approximately two-thirds of our asset-based (secured) financing now containing non-mark-to-market collateral provisions.”
Mr. Knutson continued, “While MFA spent nearly the entire second quarter in forbearance, these agreements enabled us to liquidate assets at higher prices than would have been achievable in late March, through more judicious and orderly sales. Sales of residential mortgage securities and MSR-related assets in the second quarter generated net gains of approximately $177.5 million versus their March 31 marks, preserving significant book value relative to a sale of these securities in March. In addition, we were able to sell a large pool of Non-QM whole loans in the second quarter through a broad and competitive process. While this sale generated a significant loss of $127.2 million ($57.0 million of which was reflected in second quarter earnings), this sale process likely produced an execution that was significantly better than would have been achieved through a less orderly and non-competitive process, again preserving book value. Finally, the patience afforded us through forbearance also benefited the Company and its shareholders by permitting us to conduct a very competitive third party capital search that resulted not only in a capital investment, but also a strategic and collaborative partnership with Apollo and Athene.”
2
Mr. Knutson added, “MFA’s second quarter financial results were overwhelmingly driven by unusual events and transactions. In addition to the significant realized gains and losses through asset sales, we incurred substantial expenses associated with our capital raise, exit from forbearance and balance sheet restructuring. Further, we recognized losses associated with the termination of our interest rate swap position and we recorded a partial reversal of allowance for credit loss. It should also be noted that MFA’s interest expense for the second quarter was driven by expensive forbearance interest expense that is not indicative of borrowing expense on an ongoing basis. GAAP book value was up largely due to earnings for the quarter, but Economic book value was also up as a result of continued asset price appreciation on our residential whole loans held at carrying value. Finally, we are pleased to report that in addition to reinstating preferred stock dividends, we will resume paying a common stock dividend, as today we declared a cash dividend of $0.05 per share, payable on October 30, 2020 to stockholders of record on September 30, 2020.”
Q2 2020 Portfolio Activity
MFA’s residential mortgage investment portfolio decreased by $3.4 billion during the second quarter, primarily due to asset sales and portfolio run-off. Assets with an amortized cost basis totaling $3.2 billion were sold for $3.3 billion, resulting in net realized gains of $49.5 million.
At June 30, 2020, the net carrying value of our investments in residential whole loans totaled $5.9 billion. Of this amount, $4.7 billion is recorded at carrying value and $1.2 billion is recorded at fair value on our consolidated balance sheet. Loans held at carrying value generated an overall yield of 5.15% during the quarter, with purchased performing loans generating a yield of 5.17% and purchased credit deteriorated loans generating a yield of 5.07%. Rehabilitation loans that were more than 60 days delinquent increased to 21.1% at June 30, 2020, from 11.3% at March 31, 2020. The amount of purchased credit deteriorated loans that were more than 90 days delinquent, measured as a percentage of the unpaid principal balance, increased during the quarter and was 15.3% at June 30, 2020, compared to 12.4% at March 31, 2020. During the quarter loans held at carrying value with an amortized cost basis of $955.4 million were sold, realizing a loss of $127.2 million. However, after the reversal of a $70.2 million valuation allowance that was recorded at the end of the first quarter on certain loans that were designated as held for sale, the resulting net loss for the second quarter on the sale of loans was $57.0 million.
Net gains for the quarter on residential whole loans measured at fair value through earnings were $20.3 million, including unrealized gains in the fair value of the underlying loans of $2.0 million, and $18.3 million of coupon interest payments and other gains realized during the quarter. The percentage amount of fair value loans that were more than 90 days delinquent marginally increased to 48.8% at June 30, 2020 from 48.2% at March 31, 2020.
3
In addition, as of the end of the quarter, we held approximately $349 million of REO properties, which has decreased from $411 million as of the end of the first quarter as foreclosure activity slowed, while asset sales continued. MFA’s proactive asset management team has been able to shorten liquidation timelines and increase property sale proceeds, leading to improved outcomes and better returns.
During the quarter, the Company disposed of approximately $1.0 billion of Legacy Non-Agency MBS, realizing net gains of $163.8 million. In addition, the Company sold $535.7 million of Agency MBS, realizing a gain of $3.6 million. With these sales, MFA has exited its remaining Agency MBS and the substantial majority of its Legacy Non-Agency MBS.
At the end of the second quarter, MFA held approximately $51.5 million of RPL/NPL MBS. During the quarter, the Company sold $37.0 million of these securities, realizing a loss of $12.7 million. In addition, our investments in MSR-related assets totaled $254.2 million at June 30, 2020. During the quarter, the Company sold $574.9 million of term notes backed by MSR-related collateral, realizing a gain of $53.3 million. Our investments in CRT securities totaled $94.1 million at June 30, 2020. During the quarter the Company sold $207.4 million of CRT securities, realizing a loss of $25.0 million.
Included in Other income, net for the second quarter are $49.9 million of losses transferred from other comprehensive income, a component of shareholders’ equity, on previously unwound swaps that had been designated as a hedge for accounting purposes. These losses were required to be recognized in earnings as the Company concluded that due to the closing of new term financing transactions late in the second quarter, certain repurchase agreement financing repricings on a monthly basis that were expected to occur in future periods and that were intended to be hedged, are no longer considered probable of occurring.
For the second quarter, a reversal of the provision for credit losses of $15.2 million was recorded on residential whole loans held at carrying value. In addition, the valuation allowance to reduce the carrying value of Non-QM loans designated as held for sale at the end of the first quarter of $70.2 million was reversed as this loan sale was completed during the second quarter. The total allowance for credit losses recorded on residential whole loans held at carrying value at June 30, 2020 was $136.6 million. In addition, as of June 30, 2020, reserves for credit losses totaling approximately $2.1 million were recorded related to undrawn commitments on loans held at carrying value.
General and Administrative and other expenses
For the three months ended June 30, 2020, MFA’s costs for compensation and benefits and other general and administrative expenses were $16.2 million, or an annualized 2.64% of average stockholders’ equity for the quarter ended June 30, 2020. In addition, professional services and other costs of $40.0 million were incurred during the quarter related to negotiating forbearance arrangements with our lenders, entering into new financing arrangements and reinstating prior financing arrangements on the exit from forbearance. Going forward, we do not anticipate incurring any significant additional expenses related to exiting forbearance or refinancing activity.
4
The following table presents MFA’s asset allocation as of June 30, 2020, and the second quarter 2020 yield on average interest-earning assets, average cost of funds and net interest rate spread for the various asset types.
Table 1 - Asset Allocation
| At June 30, 2020 | Residential Whole Loans, at Carrying Value (1) | Residential Whole Loans, at Fair Value | Non-Agency MBS | Credit Risk Transfer Securities | MSR-Related Assets | Other, net (2) | Total | |||||||||||||||||||||
| ($ in Millions) | ||||||||||||||||||||||||||||
| Fair Value/Carrying Value | $ | 4,677 | $ | 1,201 | $ | 54 | $ | 94 | $ | 254 | $ | 1,253 | $ | 7,533 | ||||||||||||||
| Financing Agreements with non-mark-to-market collateral provisions | (1,779 | ) | (258 | ) | — | — | — | — | (2,037 | ) | ||||||||||||||||||
| Financing Agreements with mark-to-market collateral provisions | (1,190 | ) | (196 | ) | (31 | ) | (54 | ) | (147 | ) | (38 | ) | (1,656 | ) | ||||||||||||||
| Less Senior secured credit agreement | — | — | — | — | — | (481 | ) | (481 | ) | |||||||||||||||||||
| Less Securitized Debt | (117 | ) | (399 | ) | — | — | — | — | (516 | ) | ||||||||||||||||||
| Less Convertible Senior Notes | — | — | — | — | — | (225 | ) | (225 | ) | |||||||||||||||||||
| Less Senior Notes | — | — | — | — | — | (97 | ) | (97 | ) | |||||||||||||||||||
| Net Equity Allocated | $ | 1,591 | $ | 348 | $ | 23 | $ | 40 | $ | 107 | $ | 412 | $ | 2,521 | ||||||||||||||
| Debt/Net Equity Ratio (3) | 1.9 | x | 2.5 | x | 1.3 | x | 1.4 | x | 1.4 | x | 2.0 | x | ||||||||||||||||
| For the Quarter Ended June 30, 2020 | ||||||||||||||||||||||||||||
| Yield on Average Interest Earning Assets (4)(5) | 5.15 | % | N/A | 9.11 | % | 4.85 | % | 9.96 | % | 5.29 | % | |||||||||||||||||
| Less Average Cost of Funds (6) | (6.30 | ) | (5.55 | ) | (5.51 | ) | (4.95 | ) | (6.21 | ) | (6.19 | ) | ||||||||||||||||
| Net Interest Rate Spread | (1.15 | )% | N/A | 3.60 | % | (0.10 | )% | 3.75 | % | (0.90 | )% | |||||||||||||||||
5
| (1) | Includes $2.5 billion of Non-QM loans, $832.9 million of Rehabilitation loans, $487.3 million of Single-family rental loans, $155.1 million of Seasoned performing loans and $658.4 million of Purchased Credit Deteriorated Loans. At June 30, 2020, the total fair value of these loans is estimated to be approximately $4.7 billion. | |
| (2) | Includes cash and cash equivalents and restricted cash, other assets and other liabilities. | |
| (3) | Total Debt/Net Equity ratio represents the sum of borrowings under our financing agreements noted above as a multiple of net equity allocated. | |
| (4) | Yields reported on our interest earning assets are calculated based on the interest income recorded and the average amortized cost for the quarter of the respective asset. At June 30, 2020, the amortized cost of our interest earning assets were as follows: Legacy Non-Agency MBS - $2.3 million; RPL/NPL MBS - $51.0 million; Credit Risk Transfer securities - $85.5 million; Residential Whole Loans at carrying value - $4.8 billion; and MSR-related assets - $216.2 million. In addition, the yield for residential whole loans at carrying value was 5.10%, net of 5 basis points of servicing fee expense incurred during the quarter. For GAAP reporting purposes, such expenses are included in Loan servicing and other related operating expenses in our statement of operations. | |
| (5) | Interest payments received on residential whole loans at fair value is reported in Other Income as Net (loss)/gain on residential whole loans measured at fair value through earnings in our statement of operations. Accordingly, no yield is presented as such loans are not included in interest earning assets for reporting purposes. | |
| (6) | Average cost of funds includes interest on repurchase agreements, the cost of swaps, Convertible Senior Notes, Senior Notes, securitized debt, Secured Term notes and Non-mark-to-market term-asset based financing. Cost of funding for the quarter ended June 30, 2020 includes the impact of amortization of losses previously recorded in OCI related to Swaps unwound during the quarter ended March 31, 2020 that had been previously designated as hedges for accounting purposes. The amortization of these losses increased the funding costs for total Residential whole loans, at carrying value and RPL/NPL MBS by 115 basis points and 174 basis points, respectively, for the quarter ended June 30, 2020. |
The following table presents the activity for our residential mortgage asset portfolio for the three months ended June 30, 2020:
Table 2 - Investment Portfolio Activity Q2 2020
| (In Millions) | March 31, 2020 | Runoff (1) | Sales | Other (2) | June 30, 2020 | Change | ||||||||||||||||||
| Residential whole loans and REO | $ | 7,371 | $ | (412 | ) | $ | (974 | ) | $ | 241 | $ | 6,226 | $ | (1,145 | ) | |||||||||
| RPL/NPL MBS | 80 | (2 | ) | (50 | ) | 24 | 52 | (28 | ) | |||||||||||||||
| MSR-related assets | 738 | (6 | ) | (522 | ) | 44 | 254 | (484 | ) | |||||||||||||||
| CRT securities | 254 | (4 | ) | (232 | ) | 76 | 94 | (160 | ) | |||||||||||||||
| Legacy Non-Agency MBS | 1,040 | (22 | ) | (853 | ) | (162 | ) | 3 | (1,037 | ) | ||||||||||||||
| Agency MBS | 553 | (14 | ) | (532 | ) | (7 | ) | — | (553 | ) | ||||||||||||||
| Totals | $ | 10,036 | $ | (460 | ) | $ | (3,163 | ) | $ | 216 | $ | 6,629 | $ | (3,407 | ) | |||||||||
| (1) | Primarily includes principal repayments, cash collections on Purchased Credit Deteriorated Loans and sales of REO. | |
| (2) | Primarily includes changes in fair value, net premium amortization/discount accretion and adjustments to record lower of cost or estimated fair value adjustments on REO. Also includes an adjustment to reflect the closing of a loan purchase transaction that was entered into in a prior period. |
6
The following tables present information on our investments in residential whole loans.
Residential Whole Loans, at Carrying Value at June 30, 2020 and December 31, 2019:
Table 4 - Portfolio composition
| (Dollars In Thousands) | June 30, 2020 | December 31, 2019 | ||||||
| Purchased Performing Loans: | ||||||||
| Non-QM loans | $ | 2,574,184 | $ | 3,707,245 | ||||
| Rehabilitation loans | 862,895 | 1,026,097 | ||||||
| Single-family rental loans | 494,248 | 460,742 | ||||||
| Seasoned performing loans | 155,279 | 176,569 | ||||||
| Total Purchased Performing Loans | 4,086,606 | 5,370,653 | ||||||
| Purchased Credit Deteriorated Loans (1) | 726,513 | 698,717 | ||||||
| Total Residential whole loans, at carrying value | $ | 4,813,119 | $ | 6,069,370 | ||||
| Allowance for credit losses on residential whole loans held at carrying value | (136,589 | ) | (3,025 | ) | ||||
| Total Residential whole loans at carrying value, net | $ | 4,676,530 | $ | 6,066,345 | ||||
| Number of loans | 14,689 | 17,082 | ||||||
| (1) | The amortized cost basis of Purchased Credit Deteriorated Loans was increased by $62.6 million on January 1, 2020 in connection with the adoption of ASU 2016-13. |
7
Table 5 - Yields and average balances
| For the Three-Month Period Ended | ||||||||||||||||||||||||||||||||||||
| June 30, 2020 | March 31, 2020 | June 30, 2019 | ||||||||||||||||||||||||||||||||||
| (Dollars in Thousands) | Interest | Average Balance | Average Yield | Interest | Average Balance | Average Yield | Interest | Average Balance | Average Yield | |||||||||||||||||||||||||||
| Purchased Performing Loans: | ||||||||||||||||||||||||||||||||||||
| Non-QM loans | $ | 37,259 | $ | 3,061,828 | 4.87 | % | $ | 49,070 | $ | 4,132,283 | 4.75 | % | $ | 26,578 | $ | 2,056,705 | 5.17 | % | ||||||||||||||||||
| Rehabilitation loans | 13,312 | 929,921 | 5.73 | % | 15,327 | 1,035,738 | 5.92 | % | 13,256 | 757,299 | 7.00 | % | ||||||||||||||||||||||||
| Single-family rental loans | 7,268 | 500,846 | 5.80 | % | 7,343 | 489,338 | 6.00 | % | 3,926 | 258,589 | 6.07 | % | ||||||||||||||||||||||||
| Seasoned performing loans | 2,253 | 160,695 | 5.61 | % | 2,600 | 171,726 | 6.06 | % | 3,122 | 211,280 | 5.91 | % | ||||||||||||||||||||||||
| Total Purchased Performing Loans | 60,092 | 4,653,290 | 5.17 | % | 74,340 | 5,829,085 | 5.10 | % | 46,882 | 3,283,873 | 5.71 | % | ||||||||||||||||||||||||
| Purchased Credit Deteriorated Loans | 9,335 | 736,225 | 5.07 | % | 9,146 | 755,453 | 4.84 | % | 10,997 | 764,740 | 5.75 | % | ||||||||||||||||||||||||
| Total Residential whole loans, at carrying value | $ | 69,427 | $ | 5,389,515 | 5.15 | % | $ | 83,486 | $ | 6,584,538 | 5.07 | % | $ | 57,879 | $ | 4,048,613 | 5.72 | % | ||||||||||||||||||
Table 6 - Credit related metrics
June 30, 2020
| Weighted | ||||||||||||||||||||||||||||||||||||||||||||
| Unpaid | Weighted | Average | Weighted | Weighted | Aging by Amortized Cost Basis | |||||||||||||||||||||||||||||||||||||||
| Principal | Average | Term to | Average | Average | Past Due Days | |||||||||||||||||||||||||||||||||||||||
| Carrying | Amortized | Balance | Coupon | Maturity | LTV | Original | ||||||||||||||||||||||||||||||||||||||
| (Dollars In Thousands) | Value | Cost Basis | (“UPB”) | (1) | (Months) | Ratio (2) | FICO (3) | Current | 30-59 | 60-89 | 90+ | |||||||||||||||||||||||||||||||||
| Purchased Performing Loans: | ||||||||||||||||||||||||||||||||||||||||||||
| Non-QM loans (4) | $ | 2,542,831 | $ | 2,574,184 | $ | 2,501,547 | 5.87 | % | 354 | 64 | % | 712 | $ | 2,502,521 | $ | 24,927 | $ | 23,192 | $ | 23,544 | ||||||||||||||||||||||||
| Rehabilitation loans (4) | 832,895 | 862,895 | 862,895 | 7.26 | 6 | 63 | 720 | 620,315 | 60,762 | 65,226 | 116,592 | |||||||||||||||||||||||||||||||||
| Single-family rental loans (4) | 487,317 | 494,248 | 489,947 | 6.28 | 321 | 70 | 734 | 444,308 | 25,428 | 12,730 | 11,782 | |||||||||||||||||||||||||||||||||
| Seasoned performing loans (4) | 155,055 | 155,279 | 169,469 | 3.76 | 176 | 42 | 723 | 150,800 | 1,740 | 442 | 2,297 | |||||||||||||||||||||||||||||||||
| Purchased Credit Deteriorated Loans (4)(5) | 658,432 | 726,513 | 838,673 | 4.46 | 291 | 79 | N/A | N/M | N/M | N/M | 105,536 | |||||||||||||||||||||||||||||||||
| Residential whole loans, at carrying value, total or weighted average | $ | 4,676,530 | $ | 4,813,119 | $ | 4,862,531 | 5.86 | % | 272 | |||||||||||||||||||||||||||||||||||
December 31, 2019
| Weighted | ||||||||||||||||||||||||||||||||||||||||||||
| Unpaid | Weighted | Average | Weighted | Weighted | Aging by UPB | |||||||||||||||||||||||||||||||||||||||
| Principal | Average | Term to | Average | Average | Past Due Days | |||||||||||||||||||||||||||||||||||||||
| Carrying | Amortized | Balance | Coupon | Maturity | LTV | Original | ||||||||||||||||||||||||||||||||||||||
| (Dollars In Thousands) | Value | Cost Basis | (“UPB”) | (1) | (Months) | Ratio (2) | FICO (3) | Current | 30-59 | 60-89 | 90+ | |||||||||||||||||||||||||||||||||
| Purchased Performing Loans: | ||||||||||||||||||||||||||||||||||||||||||||
| Non-QM loans (4) | $ | 3,706,857 | $ | 3,707,245 | $ | 3,592,701 | 5.96 | % | 368 | 67 | % | 716 | $ | 3,492,533 | $ | 59,963 | $ | 19,605 | $ | 20,600 | ||||||||||||||||||||||||
| Rehabilitation loans (4) | 1,023,766 | 1,026,097 | 1,026,097 | 7.30 | 8 | 64 | 717 | 868,281 | 67,747 | 27,437 | 62,632 | |||||||||||||||||||||||||||||||||
| Single-family rental loans (4) | 460,679 | 460,741 | 457,146 | 6.29 | 324 | 70 | 734 | 432,936 | 15,948 | 2,047 | 6,215 | |||||||||||||||||||||||||||||||||
| Seasoned performing loans | 176,569 | 176,569 | 192,151 | 4.24 | 181 | 46 | 723 | 187,683 | 2,164 | 430 | 1,874 | |||||||||||||||||||||||||||||||||
| Purchased Credit Impaired Loans (5) | 698,474 | 698,718 | 873,326 | 4.46 | 294 | 81 | N/A | N/M | N/M | N/M | 108,998 | |||||||||||||||||||||||||||||||||
| Residential whole loans, at carrying value, total or weighted average | $ | 6,066,345 | $ | 6,069,370 | $ | 6,141,421 | 5.96 | % | 288 | |||||||||||||||||||||||||||||||||||
8
| (1) | Weighted average is calculated based on the interest bearing principal balance of each loan within the related category. For loans acquired with servicing rights released by the seller, interest rates included in the calculation do not reflect loan servicing fees. For loans acquired with servicing rights retained by the seller, interest rates included in the calculation are net of servicing fees. |
| (2) | LTV represents the ratio of the total unpaid principal balance of the loan to the estimated value of the collateral securing the related loan as of the most recent date available, which may be the origination date. For Rehabilitation loans, the LTV presented is the ratio of the maximum unpaid principal balance of the loan, including unfunded commitments, to the estimated “after repaired” value of the collateral securing the related loan, where available. For certain Rehabilitation loans, totaling $280.6 million and $269.2 million at June 30, 2020 and December 31, 2019, respectively, an after repaired valuation was not obtained and the loan was underwritten based on an “as is” valuation. The weighted average LTV of these loans based on the current unpaid principal balance and the valuation obtained during underwriting, is 68% and 69% at June 30, 2020 and December 31, 2019, respectively. Excluded from the calculation of weighted average LTV are certain low value loans secured by vacant lots, for which the LTV ratio is not meaningful. |
| (3) | Excludes loans for which no Fair Isaac Corporation (“FICO”) score is available. |
| (4) | At June 30, 2020 and December 31, 2019 the difference between the Carrying Value and Amortized Cost Basis represents the related allowance for credit losses. |
| (5) | Purchased Credit Deteriorated Loans tend to be characterized by varying performance of the underlying borrowers over time, including loans where multiple months of payments are received in a period to bring the loan to current status, followed by months where no payments are received. Accordingly, delinquency information is presented for loans that are more than 90 days past due that are considered to be seriously delinquent. |
Table 7 - Credit related metrics
The following table presents a roll-forward of the allowance for credit losses on the Company’s Residential Whole Loans, at Carrying Value:
| Six Months Ended June 30, 2020 | ||||||||||||||||||||||||
| (Dollars In Thousands) | Non-QM Loans | Rehabilitation Loans (1)(2) |
Single-family Rental Loans |
Seasoned Performing Loans |
Purchased Credit Deteriorated Loans (3) |
Totals | ||||||||||||||||||
| Allowance for credit losses at December 31, 2019 | $ | 388 | $ | 2,331 | $ | 62 | $ | — | $ | 244 | $ | 3,025 | ||||||||||||
| Transition adjustment on adoption of ASU 2016-13 (4) | 6,904 | 517 | 754 | 19 | 62,361 | 70,555 | ||||||||||||||||||
| Current provision | 26,358 | 33,213 | 6,615 | 230 | 8,481 | 74,897 | ||||||||||||||||||
| Write-offs | — | (428 | ) | — | — | (219 | ) | (647 | ) | |||||||||||||||
| Valuation adjustment on loans held for sale | 70,181 | — | — | — | — | 70,181 | ||||||||||||||||||
| Allowance for credit and valuation losses at March 31, 2020 | $ | 103,831 | $ | 35,633 | $ | 7,431 | $ | 249 | $ | 70,867 | $ | 218,011 | ||||||||||||
| Current provision/(reversal) | (2,297 | ) | (5,213 | ) | (500 | ) | (25 | ) | (2,579 | ) | (10,614 | ) | ||||||||||||
| Write-offs | — | (420 | ) | — | — | (207 | ) | (627 | ) | |||||||||||||||
| Valuation adjustment on loans held for sale | (70,181 | ) | — | — | — | — | (70,181 | ) | ||||||||||||||||
| Allowance for credit losses at June 30, 2020 | $ | 31,353 | $ | 30,000 | $ | 6,931 | $ | 224 | $ | 68,081 | $ | 136,589 | ||||||||||||
| Six Months Ended June 30, 2019 | ||||||||||||||||||||||||
| (Dollars In Thousands) | Non-QM Loans | Rehabilitation Loans |
Single-family Rental Loans |
Seasoned Performing Loans |
Purchased Credit Deteriorated Loans |
Totals | ||||||||||||||||||
| Allowance for credit losses at December 31, 2018 | $ | — | $ | — | $ | — | $ | — | $ | 968 | $ | 968 | ||||||||||||
| Current provision | — | 500 | — | — | 183 | 683 | ||||||||||||||||||
| Write-offs | — | — | — | — | — | — | ||||||||||||||||||
| Allowance for credit losses at March 31, 2019 | $ | — | $ | 500 | $ | — | $ | — | $ | 1,151 | $ | 1,651 | ||||||||||||
| Current provision | — | — | — | — | 385 | 385 | ||||||||||||||||||
| Write-offs | — | (50 | ) | — | — | — | (50 | ) | ||||||||||||||||
| Allowance for credit losses at June 30, 2019 | $ | — | $ | 450 | $ | — | $ | — | $ | 1,536 | $ | 1,986 | ||||||||||||
9
| (1) | In connection with purchased Rehabilitation loans, the Company had unfunded commitments of $94.5 million, with an allowance for credit losses of $2.1 million at June 30, 2020. Such allowance is included in “Other liabilities” in the Company’s consolidated balance sheets (see Note 9). |
| (2) | Includes $181.8 million of loans that were assessed for credit losses based on a collateral dependent methodology. |
| (3) | Includes $100.0 million of loans that were assessed for credit losses based on a collateral dependent methodology. |
| (4) | Of the $70.6 million of reserves recorded on adoption of ASU 2016-13, $8.3 million was recorded as an adjustment to stockholders’ equity and $62.4 million was recorded as a “gross up” of the amortized cost basis of Purchased Credit Deteriorated Loans. |
Residential Whole Loans, at fair value at June 30, 2020 and December 31, 2019:
Table 8 - Credit related metrics
| (Dollars in Thousands) | June 30, 2020 | December 31, 2019 | ||||||
| Less than 60 Days Past Due: | ||||||||
| Outstanding principal balance | $ | 593,389 | $ | 666,026 | ||||
| Aggregate fair value | $ | 545,953 | $ | 641,616 | ||||
| Weighted Average LTV Ratio (1) | 74.64 | % | 76.69 | % | ||||
| Number of loans | 2,981 | 3,159 | ||||||
| 60 Days to 89 Days Past Due: | ||||||||
| Outstanding principal balance | $ | 79,684 | $ | 58,160 | ||||
| Aggregate fair value | $ | 69,303 | $ | 53,485 | ||||
| Weighted Average LTV Ratio (1) | 82.43 | % | 79.48 | % | ||||
| Number of loans | 342 | 313 | ||||||
| 90 Days or More Past Due: | ||||||||
| Outstanding principal balance | $ | 694,590 | $ | 767,320 | ||||
| Aggregate fair value | $ | 585,725 | $ | 686,482 | ||||
| Weighted Average LTV Ratio (1) | 88.06 | % | 89.69 | % | ||||
| Number of loans | 2,642 | 2,983 | ||||||
| Total Residential whole loans, at fair value | $ | 1,200,981 | $ | 1,381,583 | ||||
10
| (1) | LTV represents the ratio of the total unpaid principal balance of the loan, to the estimated value of the collateral securing the related loan. Excluded from the calculation of weighted average LTV are certain low value loans secured by vacant lots, for which the LTV ratio is not meaningful. |
Table 9 - Net (loss)/gain on residential whole loans measured at fair value through earnings
| Three Months Ended June 30, |
Six Months Ended June 30, | |||||||||||||||
| (In Thousands) | 2020 | 2019 | 2020 | 2019 | ||||||||||||
| Coupon payments, realized gains, and other income received (1) | $ | 18,171 | $ | 24,007 | $ | 37,207 | $ | 45,763 | ||||||||
| Net unrealized gains/(losses) | 2,010 | 21,188 | (72,546 | ) | 20,128 | |||||||||||
| Net gain on transfers to REO | 139 | 6,278 | 2,899 | 10,849 | ||||||||||||
| Total | $ | 20,320 | $ | 51,473 | $ | (32,440 | ) | $ | 76,740 | |||||||
| (1) | Primarily includes gains on liquidation of non-performing loans, including the recovery of delinquent interest payments, recurring coupon interest payments received on mortgage loans that are contractually current, and cash payments received from private mortgage insurance on liquidated loans. |
Webcast
MFA Financial, Inc. plans to host a live audio webcast of its investor conference call on Thursday, August 6, 2020, at 11:30 a.m. (Eastern Time) to discuss its second quarter 2020 financial results. The live audio webcast will be accessible to the general public over the internet at http://www.mfafinancial.com through the “Webcasts & Presentations” link on MFA’s home page. To listen to the conference call over the internet, please go to the MFA website at least 15 minutes before the call to register and to download and install any needed audio software. Earnings presentation materials will be posted on the MFA website prior to the conference call and an audio replay will be available on the website following the call.
Cautionary Language Regarding Forward-Looking Statements
When used in this press release or other written or oral communications, statements which are not historical in nature, including those containing words such as “will,” “believe,” “expect,” “anticipate,” “estimate,” “plan,” “continue,” “intend,” “should,” “could,” “would,” “may,” the negative of these words or similar expressions, are intended to identify “forward-looking statements” within the meaning of Section 27A of the Securities Act of 1933, as amended, and Section 21E of the Securities Exchange Act of 1934, as amended, and, as such, may involve known and unknown risks, uncertainties and assumptions. These forward-looking statements include information about possible or assumed future results with respect to our business, financial condition, liquidity, results of operations, plans and objectives. Statements regarding the following subjects, among others, may be forward-looking: risks related to the ongoing spread of the novel coronavirus and the COVID-19 pandemic, including its effect on the general economy and our business, financial position and results of operations (including, among other potential effects, increased delinquencies and greater than expected losses in our whole loan portfolio);changes in interest rates and the market (i.e., fair) value of MFA’s residential whole loans, MBS and other assets; changes in the prepayment rates on residential mortgage assets, an increase of which could result in a reduction of the yield on certain investments in its portfolio and could require MFA to reinvest the proceeds received by it as a result of such prepayments in investments with lower coupons, while a decrease in which could result in an increase in the interest rate duration of certain investments in MFA’s portfolio making their valuation more sensitive to changes in interest rates and could result in lower forecasted cash flows; credit risks underlying MFA’s assets, including changes in the default rates and management’s assumptions regarding default rates on the mortgage loans in MFA’s residential whole loan portfolio; MFA’s ability to borrow to finance its assets and the terms, including the cost, maturity and other terms, of any such borrowings; implementation of or changes in government regulations or programs affecting MFA’s business; MFA’s estimates regarding taxable income, the actual amount of which is dependent on a number of factors, including, but not limited to, changes in the amount of interest income and financing costs, the method elected by MFA to accrete the market discount on residential whole loans and the extent of prepayments, realized losses and changes in the composition of MFA’s residential whole loan portfolios that may occur during the applicable tax period, including gain or loss on any MBS disposals and whole loan modifications, foreclosures and liquidations; the timing and amount of distributions to stockholders, which are declared and paid at the discretion of MFA’s Board and will depend on, among other things, MFA’s taxable income, its financial results and overall financial condition and liquidity, maintenance of its REIT qualification and such other factors as MFA’s Board deems relevant; MFA’s ability to maintain its qualification as a REIT for federal income tax purposes; MFA’s ability to maintain its exemption from registration under the Investment Company Act of 1940, as amended (or the “Investment Company Act”), including statements regarding the concept release issued by the Securities and Exchange Commission (“SEC”) relating to interpretive issues under the Investment Company Act with respect to the status under the Investment Company Act of certain companies that are engaged in the business of acquiring mortgages and mortgage-related interests; MFA’s ability to continue growing its residential whole loan portfolio, which is dependent on, among other things, the supply of loans offered for sale in the market; expected returns on MFA’s investments in nonperforming residential whole loans (“NPLs”), which are affected by, among other things, the length of time required to foreclose upon, sell, liquidate or otherwise reach a resolution of the property underlying the NPL, home price values, amounts advanced to carry the asset (e.g., taxes, insurance, maintenance expenses, etc. on the underlying property) and the amount ultimately realized upon resolution of the asset; targeted or expected returns on MFA’s investments in recently-originated loans, the performance of which is, similar to MFA’s other mortgage loan investments, subject to, among other things, differences in prepayment risk, credit risk and financing cost associated with such investments; risks associated with MFA’s investments in MSR-related assets, including servicing, regulatory and economic risks, risks associated with our investments in loan originators, and risks associated with investing in real estate assets, including changes in business conditions and the general economy. These and other risks, uncertainties and factors, including those described in the annual, quarterly and current reports that MFA files with the SEC, could cause MFA’s actual results to differ materially from those projected in any forward-looking statements it makes. All forward-looking statements are based on beliefs, assumptions and expectations of MFA’s future performance, taking into account all information currently available. Readers are cautioned not to place undue reliance on these forward-looking statements, which speak only as of the date on which they are made. New risks and uncertainties arise over time and it is not possible to predict those events or how they may affect MFA. Except as required by law, MFA is not obligated to, and does not intend to, update or revise any forward-looking statements, whether as a result of new information, future events or otherwise.
11
MFA FINANCIAL, INC.
CONSOLIDATED BALANCE SHEETS
| (In Thousands, Except Per Share Amounts) | June 30, 2020 | December 31, 2019 | ||||||
| (Unaudited) | ||||||||
| Assets: | ||||||||
| Residential whole loans: | ||||||||
| Residential whole loans, at carrying value ($4,556,213 and $4,847,782 pledged as collateral, respectively) (1) | $ | 4,813,119 | $ | 6,069,370 | ||||
| Residential whole loans, at fair value ($691,660 and $794,684 pledged as collateral, respectively) (1) | 1,200,981 | 1,381,583 | ||||||
| Allowance for credit losses on residential whole loans held at carrying value | (136,589 | ) | (3,025 | ) | ||||
| Total residential whole loans, net | 5,877,511 | 7,447,928 | ||||||
| Residential mortgage securities, at fair value ($148,210 and $3,966,591 pledged as collateral, respectively) | 148,343 | 3,983,519 | ||||||
| Mortgage servicing rights (“MSR”) related assets ($255,035 and $1,217,002 pledged as collateral, respectively) | 254,228 | 1,217,002 | ||||||
| Cash and cash equivalents | 666,172 | 70,629 | ||||||
| Restricted cash | 7,680 | 64,035 | ||||||
| Other assets | 613,474 | 784,251 | ||||||
| Total Assets | $ | 7,567,408 | $ | 13,567,364 | ||||
| Liabilities: | ||||||||
| Financing agreements ($4,194,324 and $0 held at fair value, respectively) | $ | 5,011,356 | $ | 10,031,606 | ||||
| Other liabilities | 35,001 | 151,806 | ||||||
| Total Liabilities | $ | 5,046,357 | $ | 10,183,412 | ||||
| Stockholders’ Equity: | ||||||||
| Preferred stock, $.01 par value; 7.50% Series B cumulative redeemable; 8,050 shares authorized; 8,000 shares issued and outstanding ($200,000 aggregate liquidation preference) | $ | 80 | $ | 80 | ||||
| Preferred stock, $.01 par value; 6.50% Series C fixed-to-floating rate cumulative redeemable; 12,650 shares authorized; 11,000 shares issued and outstanding ($275,000 aggregate liquidation preference) | 110 | — | ||||||
| Common stock, $.01 par value; 874,300 and 886,950 shares authorized; 453,244 and 452,369 shares issued and outstanding, respectively | 4,532 | 4,524 | ||||||
| Additional paid-in capital, in excess of par | 3,922,399 | 3,640,341 | ||||||
| Accumulated deficit | (1,451,783 | ) | (631,040 | ) | ||||
| Accumulated other comprehensive income | 45,713 | 370,047 | ||||||
| Total Stockholders’ Equity | $ | 2,521,051 | $ | 3,383,952 | ||||
| Total Liabilities and Stockholders’ Equity | $ | 7,567,408 | $ | 13,567,364 | ||||
| (1) | Includes approximately $181.4 million and $186.4 million of Residential whole loans, at carrying value and $506.7 million and $567.4 million of Residential whole loans, at fair value transferred to consolidated VIEs at June 30, 2020 and December 31, 2019, respectively. Such assets can be used only to settle the obligations of each respective VIE. |
13
MFA FINANCIAL, INC.
CONSOLIDATED STATEMENTS OF OPERATIONS
| Three Months Ended June 30, | Six Months Ended June 30, | |||||||||||||||
| (In Thousands, Except Per Share Amounts) | 2020 | 2019 | 2020 | 2019 | ||||||||||||
| (Unaudited) | ||||||||||||||||
| Interest Income: | ||||||||||||||||
| Residential whole loans held at carrying value | $ | 69,427 | $ | 57,879 | $ | 152,913 | $ | 107,499 | ||||||||
| Residential mortgage securities | 4,975 | 72,395 | 49,349 | 151,037 | ||||||||||||
| MSR-related assets | 9,741 | 12,338 | 23,948 | 22,958 | ||||||||||||
| Other interest-earning assets | 3,165 | 1,287 | 6,072 | 2,593 | ||||||||||||
| Cash and cash equivalent investments | 60 | 1,036 | 546 | 1,800 | ||||||||||||
| Interest Income | $ | 87,368 | $ | 144,935 | $ | 232,828 | $ | 285,887 | ||||||||
| Interest Expense: | ||||||||||||||||
| Asset-backed and other collateralized financing arrangements | $ | 82,085 | $ | 81,826 | $ | 159,945 | $ | 158,841 | ||||||||
| Other interest expense | 5,906 | 3,218 | 11,805 | 5,229 | ||||||||||||
| Interest Expense | $ | 87,991 | $ | 85,044 | $ | 171,750 | $ | 164,070 | ||||||||
| Net Interest (Expense)/Income | $ | (623 | ) | $ | 59,891 | $ | 61,078 | $ | 121,817 | |||||||
| Reversal/(Provision) for credit
and valuation losses on residential whole loans and other financial instruments | $ | 85,377 | $ | (385 | ) | $ | (65,334 | ) | $ | (1,190 | ) | |||||
| Net Interest Income/(Expense)
after Provision for Credit and Valuation Losses | $ | 84,754 | $ | 59,506 | $ | (4,256 | ) | $ | 120,627 | |||||||
| Other Income, net: | ||||||||||||||||
| Impairment and other losses on securities available-for-sale and other assets | $ | (5,094 | ) | $ | — | $ | (424,745 | ) | $ | — | ||||||
| Net realized gain/(loss) on sales of residential mortgage securities and residential whole loans | 49,485 | 7,710 | (188,895 | ) | 32,319 | |||||||||||
| Net unrealized gain/(loss) on residential mortgage securities measured at fair value through earnings | 64,438 | — | (13,523 | ) | 8,672 | |||||||||||
| Net gain/(loss) on residential whole loans measured at fair value through earnings | 20,320 | 51,473 | (32,440 | ) | 76,740 | |||||||||||
| Loss on terminated swaps previously designated as hedges for accounting purposes | (49,857 | ) | — | (49,857 | ) | — | ||||||||||
| Other, net | (2,935 | ) | (2,321 | ) | (4,946 | ) | (9,700 | ) | ||||||||
| Other Income/(Loss), net | $ | 76,357 | $ | 56,862 | $ | (714,406 | ) | $ | 108,031 | |||||||
| Operating and Other Expense: | ||||||||||||||||
| Compensation and benefits | $ | 8,578 | $ | 7,841 | $ | 17,477 | $ | 16,395 | ||||||||
| Other general and administrative expense | 7,652 | 5,934 | 12,227 | 10,579 | ||||||||||||
| Loan servicing and other related operating expenses | 8,337 | 9,553 | 19,617 | 19,787 | ||||||||||||
| Costs associated with restructuring/forbearance agreement | 39,966 | — | 44,434 | $ | — | |||||||||||
| Operating and Other Expense | $ | 64,533 | $ | 23,328 | $ | 93,755 | $ | 46,761 | ||||||||
| Net Income/(Loss) | $ | 96,578 | $ | 93,040 | $ | (812,417 | ) | $ | 181,897 | |||||||
| Less Preferred Stock Dividend Requirement | $ | 8,144 | $ | 3,750 | $ | 13,359 | 7,500 | |||||||||
| Net Income/(Loss) Available to Common Stock and Participating Securities | $ | 88,434 | $ | 89,290 | $ | (825,776 | ) | $ | 174,397 | |||||||
| Basic Earnings/(Loss) per Common Share | $ | 0.19 | $ | 0.20 | $ | (1.82 | ) | $ | 0.39 | |||||||
| Diluted Earnings/(Loss) per Common Share | $ | 0.19 | $ | 0.20 | $ | (1.82 | ) | $ | 0.38 | |||||||
14
Reconciliation of GAAP Book Value per Common Share to non-GAAP Economic Book Value per Common Share
“Economic book value” is a non-GAAP financial measure of our financial position. To calculate our Economic book value, our portfolios of Residential whole loans at carrying value are adjusted to their fair value, rather than the carrying value that is required to be reported under the GAAP accounting model applied to these loans. This adjustment is also reflected in our end of period stockholders’ equity in the table below. Management considers that Economic book value provides investors with a useful supplemental measure to evaluate our financial position as it reflects the impact of fair value changes for all of our residential mortgage assets, irrespective of the accounting model applied for GAAP reporting purposes. Economic book value does not represent and should not be considered as a substitute for Stockholders’ Equity, as determined in accordance with GAAP, and our calculation of this measure may not be comparable to similarly titled measures reported by other companies.
The following table provides a reconciliation of our GAAP book value per common share to our non-GAAP Economic book value per common share for the quarterly periods below:
| (In Millions, Except Per Share Amounts) | June 30, 2020 | March 31, 2020 | December 31, 2019 | September 30, 2019 | June 30, 2019 | |||||||||||||||
| GAAP Total Stockholders’ Equity | $ | 2,521.1 | $ | 2,440.7 | $ | 3,384.0 | $ | 3,403.4 | $ | 3,403.4 | ||||||||||
| Preferred Stock, liquidation preference | (475.0 | ) | (475.0 | ) | (200.0 | ) | (200.0 | ) | (200.0 | ) | ||||||||||
| GAAP Stockholders’ Equity for book value per common share | 2,046.1 | 1,965.7 | 3,184.0 | 3,203.4 | 3,203.4 | |||||||||||||||
| Adjustments: | ||||||||||||||||||||
| Fair value adjustment to Residential whole loans, at carrying value | (25.3 | ) | (113.5 | ) | 182.4 | 145.8 | 131.2 | |||||||||||||
| Stockholders’ Equity including fair value adjustment to Residential whole loans, at carrying value (Economic book value) | $ | 2,020.8 | $ | 1,852.2 | $ | 3,366.4 | $ | 3,349.2 | $ | 3,334.6 | ||||||||||
| GAAP book value per common share | $ | 4.51 | $ | 4.34 | $ | 7.04 | $ | 7.09 | $ | 7.11 | ||||||||||
| Economic book value per common share | $ | 4.46 | $ | 4.09 | $ | 7.44 | $ | 7.41 | $ | 7.40 | ||||||||||
| Number of shares of common stock outstanding | 453.2 | 453.1 | 452.4 | 451.7 | 450.6 | |||||||||||||||
15
Exhibit 99.2
 |
Second Quarter 2020 Earnings Presentation |
 |
Forward looking statements When used in this presentation or other written or oral communications, statements which are not historical in nature, including those containing words such as “will,” “believe,” “expect,” “anticipate,” “estimate,” “plan,” “continue,” “intend,” “should,” “could,” “would,” “may,” the negative of these words or similar expressions, are intended to identify “forward-looking statements” within the meaning of Section 27A of the 1933 Act and Section 21E of the 1934 Act and, as such, may involve known and unknown risks, uncertainties and assumptions. These forward-looking statements include information about possible or assumed future results with respect to our business, financial condition, liquidity, results of operations, plans and objectives. Statements regarding the following subjects, among others, may be forward-looking: risks related to the ongoing spread of the novel coronavirus and the COVID-19 pandemic, including its effects on the general economy and our business, financial position and results of operations (including, among other potential effects, increased delinquencies and greater than expected losses in our whole loan portfolio); changes in interest rates and the market (i.e., fair) value of MFA’s residential whole loans, MBS and other assets; changes in the prepayment rates on residential mortgage assets, an increase of which could result in a reduction of the yield on certain investments in its portfolio and could require MFA to reinvest the proceeds received by it as a result of such prepayments in investments with lower coupons, while a decrease in which could result in an increase in the interest rate duration of certain investments in MFA’s portfolio making their valuation more sensitive to changes in interest rates and could result in lower forecasted cash flows, credit risks underlying MFA’s assets, including changes in the default rates and management’s assumptions regarding default rates on the mortgage loans in MFA’s residential whole loan portfolio; MFA’s ability to borrow to finance its assets and the terms, including the cost, maturity and other terms, of any such borrowings; implementation of or changes in government regulations or programs affecting MFA’s business; MFA’s estimates regarding taxable income, the actual amount of which is dependent on a number of factors, including, but not limited to, changes in the amount of interest income and financing costs, the method elected by MFA to accrete the market discount on residential whole loans and the extent of prepayments, realized losses and changes in the composition of MFA’s residential whole loan portfolios that may occur during the applicable tax period, including gain or loss on any MBS disposals and whole loan modifications, foreclosures and liquidations; the timing and amount of distributions to stockholders, which are declared and paid at the discretion of MFA’s Board of Directors and will depend on, among other things, MFA’s taxable income, its financial results and overall financial condition and liquidity, maintenance of its REIT qualification and such other factors as MFA’s Board of Directors deems relevant; MFA’s ability to maintain its qualification as a REIT for federal income tax purposes; MFA’s ability to maintain its exemption from registration under the Investment Company Act of 1940, as amended (or the Investment Company Act), including statements regarding the Concept Release issued by the Securities and Exchange Commission (SEC) relating to interpretive issues under the Investment Company Act with respect to the status under the Investment Company Act of certain companies that are engaged in the business of acquiring mortgages and mortgage-related interests; MFA’s ability to continue growing its residential whole loan portfolio which is dependent on, among other things, the supply of loans offered for sale in the market; expected returns on MFA’s investments in non-performing residential whole loans (NPLs), which are affected by, among other things, the length of time required to foreclose upon, sell, liquidate or otherwise reach a resolution of the property underlying the NPL, home price values, amounts advanced to carry the asset (e.g., taxes, insurance, maintenance expenses, etc. on the underlying property) and the amount ultimately realized upon resolution of the asset; targeted or expected returns on MFA’s investments in recently-originated loans, the performance of which is, similar to MFA’s other mortgage loan investments, subject to, among other things, differences in prepayment risk, credit risk and financing cost associated with such investments; risks associated with MFA’s investments in MSR-related assets, including servicing, regulatory and economic risks, risks associated with our investments in loan originators, and risks associated with investing in real estate assets, including changes in business conditions and the general economy. These and other risks, uncertainties and factors, including those described in the annual, quarterly and current reports that MFA files with the SEC, could cause MFA’s actual results to differ materially from those projected in any forward-looking statements it makes. All forward-looking statements are based on beliefs, assumptions and expectations of MFA’s future performance, taking into account all information currently available. Readers are cautioned not to place undue reliance on these forward-looking statements, which speak only as of the date on which they are made. New risks and uncertainties arise over time and it is not possible to predict those events or how they may affect MFA. Except as required by law, MFA is not obligated to, and does not intend to, update or revise any forward-looking statements, whether as a result of new infor future events or otherwise. mation, 2 |
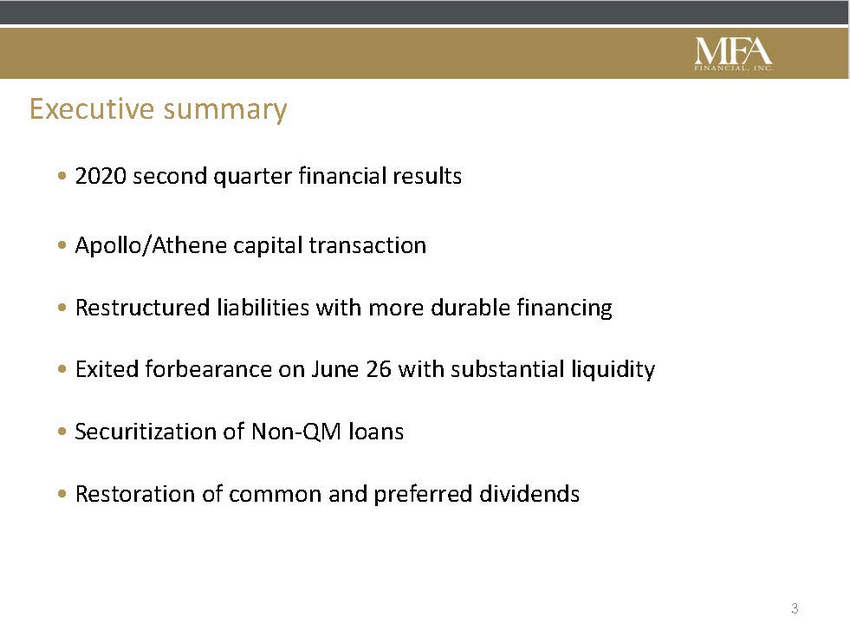 |
Executive summary • 2020 second quarter financial results • Apollo/Athene capital transaction • Restructured liabilities with more durable financing • Exited forbearance on June 26 with substantial liquidity • Securitization of Non-QM loans • Restoration of common and preferred dividends 3 |
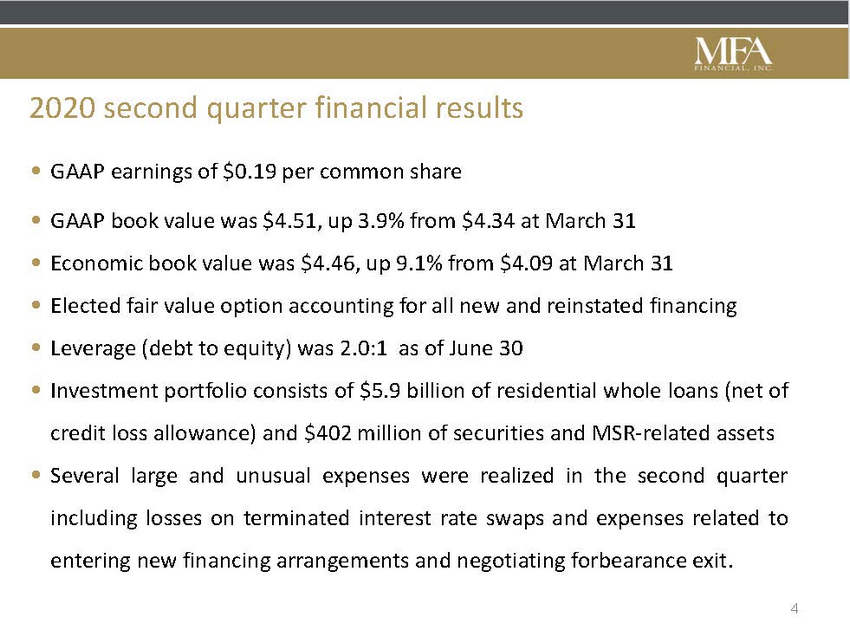 |
2020 second quarter financial results • • • • • • GAAP earnings of $0.19 per common share GAAP book value was $4.51, up 3.9% from $4.34 at March 31 Economic book value was $4.46, up 9.1% from $4.09 at March 31 Elected fair value option accounting for all new and reinstated financing Leverage (debt to equity) was 2.0:1 as of June 30 Investment portfolio consists of $5.9 billion of residential whole loans (net of credit loss allowance) and $402 million of securities and MSR-related assets Several large and unusual expenses were realized in the second quarter including losses on terminated interest rate swaps and expenses related to entering new financing arrangements and negotiating forbearance exit. • 4 |
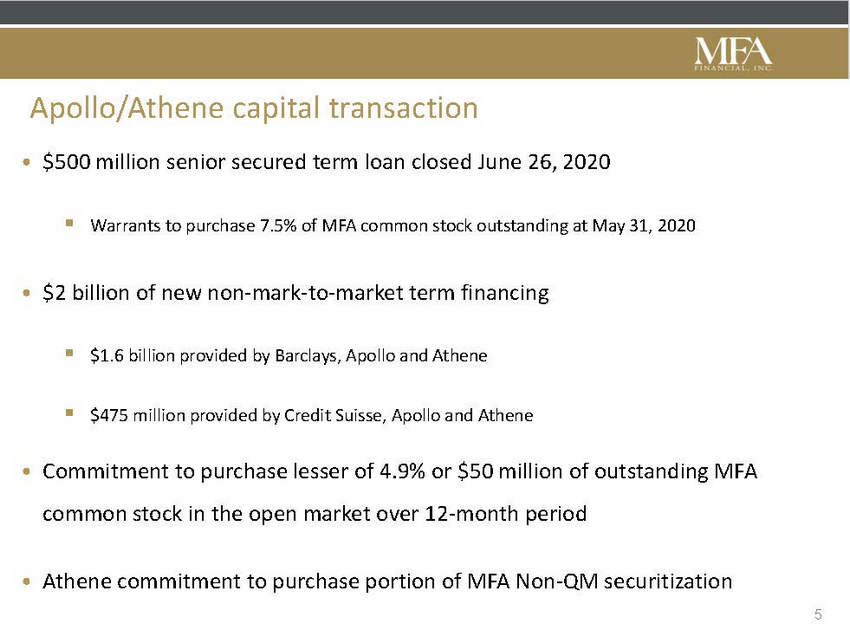 |
Apollo/Athene capital transaction $500 million senior secured term loan closed June 26, 2020 • ▪ Warrants to purchase 7.5% of MFA common stock outstanding at May 31, 2020 $2 billion of new non-mark-to-market term financing • ▪ $1.6 billion provided by Barclays, Apollo and Athene ▪ $475 million provided by Credit Suisse, Apollo and Athene • Commitment to purchase lesser of 4.9% or $50 million of outstanding MFA common stock in the open market over 12-month period • Athene commitment to purchase portion of MFA Non-QM securitization 5 |
 |
Restructured liabilities with more durable financing • $5.0 billion of total liabilities at June 30, 2020 ▪ $4.7 billion is asset-based (secured) financing o o $3.0 billion, or approximately 65%, is non-mark-to-market $0.8 billion is “under-levered” by approximately $55 million, creating a margin cushion ▪ $330 million is unsecured (and non-mark-to-market) o o $230 million 6.25% convertible bond $100 million 8.00% senior note • • Overall leverage (debt to equity) of 2.0:1 at June 30, 2020 Secured financing cost summary ▪ ▪ ▪ Apollo/Athene senior secured term loan: 11% (1 point OID) Outstanding securitizations (RPL and NPL MBS): 3.8% Other secured financing: 3.6% 6 |
 |
Exited forbearance on June 26 with substantial liquidity • MFA exited from forbearance arrangements on June 26, 2020 ▪ Initial forbearance agreement on April 10, extended on April 27 and again on June 1 ▪ All outstanding margin calls satisfied and lenders repaid in full • Forbearance provided meaningful strategic benefit ▪ Legacy Non-Agency portfolio liquidation through orderly sales in April ▪ Sales of MSR-related assets and CRTs in April, May and June ▪ Marketed and completed an orderly Non-QM whole loan sale in May ▪ Competitive and robust third party capital process 7 |
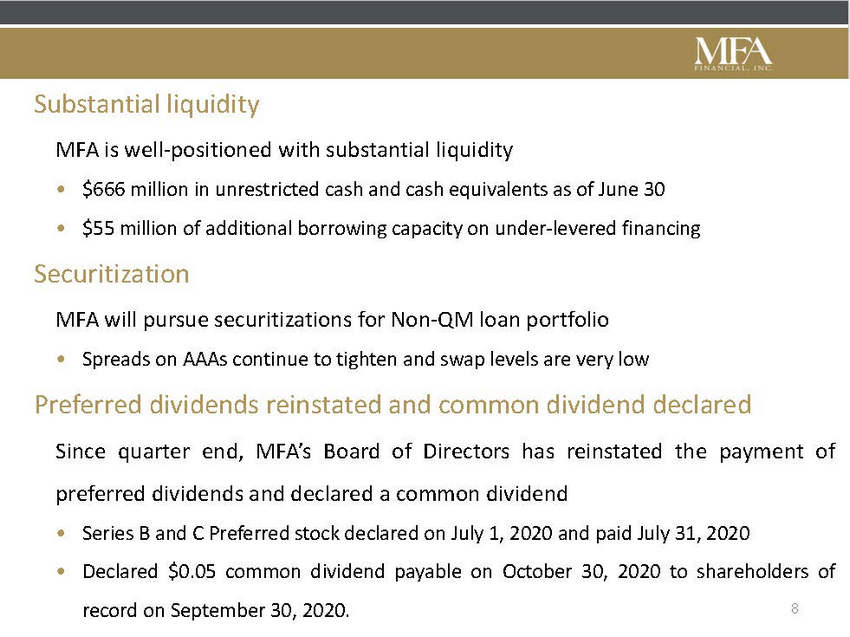 |
Substantial liquidity MFA is well-positioned with substantial liquidity • • $666 million in unrestricted cash and cash equivalents as of June 30 $55 million of additional borrowing capacity on under-levered financing Securitization MFA will pursue securitizations for Non-QM loan portfolio • Spreads on AAAs continue to tighten and swap levels are very low Preferred dividends reinstated and common dividend declared Since quarter end, MFA’s Board of Directors has reinstated the payment preferred dividends and declared a common dividend of • • Series B and C Preferred stock declared on July 1, 2020 and paid July 31, 2020 Declared $0.05 common dividend payable on October 30, 2020 to shareholders of record on September 30, 2020. 8 |
 |
Estimated REIT taxable income, undistributed income and implications for common dividends in 2020 • Prior year undistributed REIT taxable income was approximately $0.05 per share. To avoid paying corporate income tax, we are required to declare a dividend for this income prior to filing our REIT tax return in October 2020 and pay such dividend before the end of the year. • Estimated REIT taxable income for the six months ended June 30, 2020 is approximately $0.14 per share. In order to avoid a 4% excise tax, we are required to declare dividends (common and preferred) in 2020 for at least 85% of our estimated 2020 ordinary REIT taxable income. • Capital losses generated from sales of residential mortgage assets to date in 2020 are carried forward and offset against future capital gains, but capital losses do not offset ordinary REIT taxable income. 9 |
 |
Second quarter portfolio activity • Second quarter portfolio activity was focused on stabilizing the balance sheet, reducing leverage and generating liquidity ▪ Sold $3.2 billion of assets. Exited all Agency MBS positions and virtually all Legacy Non-Agency MBS positions in the quarter. Substantial reduction in MSR-related assets and CRT securities. ▪ Residential whole loans represent 94% of investment portfolio as of June 30th 2020. ▪ Patient deleveraging allowed us to preserve a substantial amount of book value. 10 |
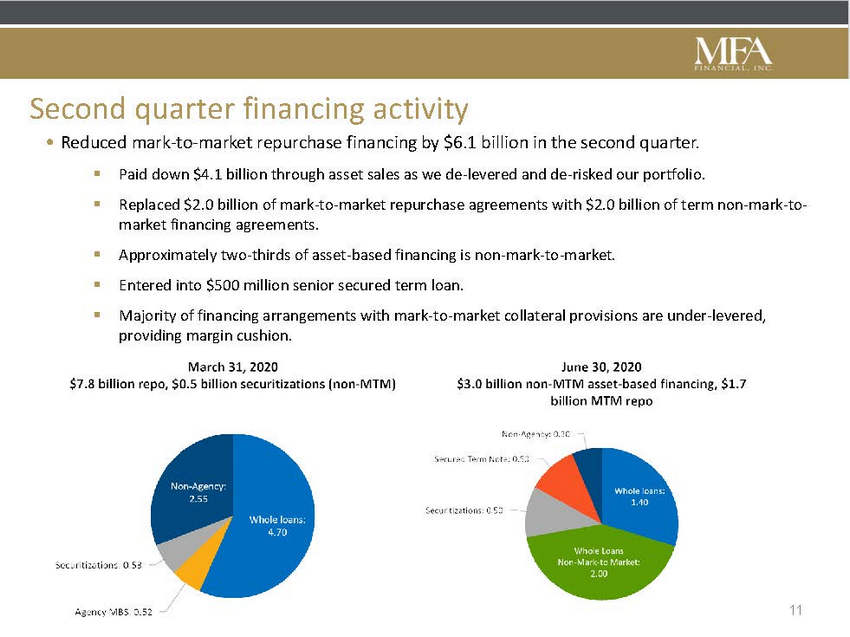 |
Second quarter financing activity • Reduced mark-to-market repurchase financing by $6.1 billion in the second quarter. ▪ ▪ Paid down $4.1 billion through asset sales as we de-levered and de-risked our portfolio. Replaced $2.0 billion of mark-to-market repurchase agreements with $2.0 billion of term non-mark-to-market financing agreements. Approximately two-thirds of asset-based financing is non-mark-to-market. Entered into $500 million senior secured term loan. Majority of financing arrangements with mark-to-market collateral provisions are under-levered, providing margin cushion. ▪ ▪ ▪ 11 |
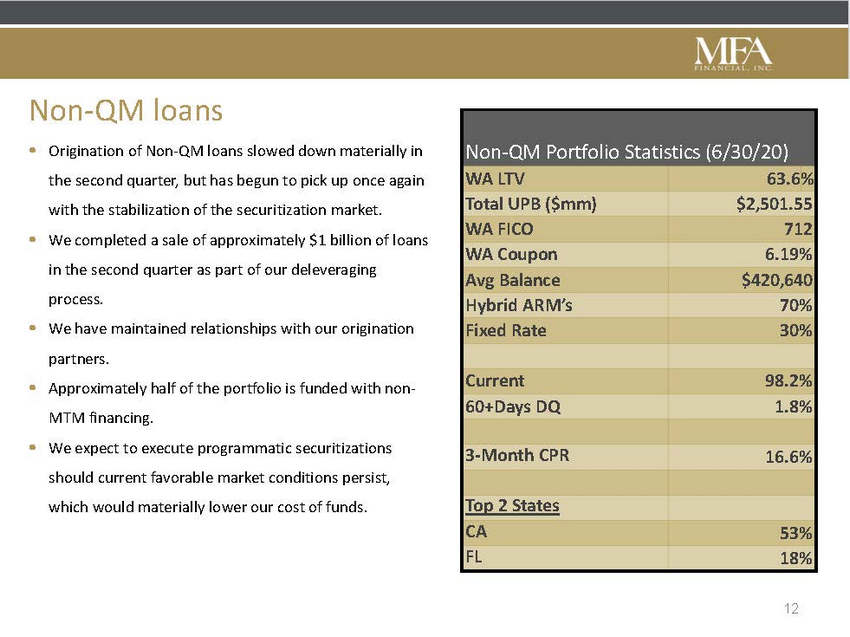 |
Non-QM loans • Origination of Non-QM loans slowed down materially in the second quarter, but has begun to pick up once again with the stabilization of the securitization market. We completed a sale of approximately $1 billion of loans in the second quarter as part of our deleveraging process. We have maintained relationships with our origination partners. Approximately half of the portfolio is funded with non-MTM financing. We expect to execute programmatic securitizations should current favorable market conditions persist, which would materially lower our cost of funds. • • • • 12 Non-QM Portfolio Statistics (6/30/20) WA LTV63.6% Total UPB ($mm)$2,501.55 WA FICO712 WA Coupon6.19% Avg Balance$420,640 Hybrid ARM’s70% Fixed Rate30% Current98.2% 60+Days DQ1.8% 3-Month CPR16.6% Top 2 States CA53% FL18% |
 |
Non-QM COVID-19 pandemic impact • A material percentage of our Non-QM loans have been impacted by the pandemic. Many of our borrowers are self employed and run small businesses. We executed forbearance / deferral plans for 32.3% of the Non-QM portfolio through June 30, 2020. The majority of loans exiting forbearance plans have continued to perform by making the next contractual payment. • • • 13 Dec-19Mar-20Apr -20May - 20June - 20 Loan Count7,4297,8717,7695,9475,844 Total UPB ($mm)3,517.33,500.93,464.12,501.42,460.1 % Current97.2%97.2%97.2%97.2%87.2% % 30 Days1.5%1.5%1.6%1.0%11% % 60+ Days1.2%1.3%1.1%1.8%1.8% LTV 66.5 65.7 65.863.6 63.5 % COVID Impact0.0%2.4%21.5%31.7%32.3% % Active Forbearance0.0%2.4%21.5%31.4%3.7% |
 |
RPL portfolio delinquency characteristics as of 6/30/2020. as of 6/30/2020 • 83% of our RPL portfolio is less than 60 days delinquent • On average, 22% of the 60+ days delinquent loans are making payments. Prepay speeds have maintained between 6% and 14%. 30% of the RPL portfolio has been granted forbearance plans related to the COVID-19 pandemic • • ▪ Although borrowers have received forbearance plans, many continue to make payments contractually current and are 14 |
 |
Performance of Non-Performing(1) loans purchased before 6/30/19 $161.3 $619.9 $301.3 $704.7 $497.3 $124.1 $2,408.6 millions) • Through diligent asset management we continue to improve outcomes for our NPL portfolio by returning loans to performing or paid-in-full status, and through other forms of resolution. • Measured by UPB at purchase, 34% (or approximately 3,700) of loans that were non-performing at purchase are either performing or have paid in full as of June 2020. • 46% of our NPL portfolio has liquidated or reverted to REO. In addition, we have accelerated our sales of REO in the 2nd quarter selling 90% more properties vs the 2nd quarter a year ago. • 75% of MFA modified loans are either performing today or have paid in full. 15 1Non-Performing at purchase defined as greater than or equal to 60 days delinquent 2Performing as of 6/30/2020 defined as less than 60 days delinquent or made a full P&I payment in June 2020 Acquisition Year 201420152016201720182019Total Loan Count7432,3541,0693,1241,8487219,859 UPB Purchased (in Status 6/30/2020 Performing(2)/PIF 34% 26% 25% 38% 44% 36% 34% Liquidation/REO 54% 58% 64% 39% 30% 26% 46% Non-Performing 12% 16% 11% 23% 26% 38% 20% Total100%100%100%100%100%100%100% |
 |
Business purpose loans – Rehabilitation (or Fix and Flip) loans • Fix and Flip portfolio declined $116 million to $863 million at the end of the second quarter. ▪ $135 million of principal payments oPaydowns slowed in April and May to about 65% of pre-COVID levels but recovered in June to about 95% of pre-COVID levels. $26 million in rehab draws No new investments in the quarter ▪ ▪ • Average yield of 5.73% for the second quarter. • Entire portfolio is financed with non-mark-to-market debt • Fix and Flip borrowers were negatively impacted by the COVID-19 pandemic ▪ Borrowers with less liquidity and in states hit hardest by COVID-19 were most negatively impacted. Delinquencies increased in April and May, but appear to have stabilized in June. Payment deferrals were granted to 1.5% of outstanding loans. ▪ ▪ * WARV-LTV: Weighted average after repair loan to value at origination **WA As-Is/Purch. LTV: Weighted average As-Is value or purchase value (when available) at origination 16 Portfolio Statistics (6/30/20) WA ARV-LTV* 63% WA As-Is/Purch. LTV** 70% WA FICO 720 WA Orig Term (months) 16mths WA Loan Age 12mths WA Passthrough Rate 7.26% UPB $863 million Undrawn commitments $94 million 2nd Quarter Yield 5.73% Prepayment rate (CPR) 45% Current and 30 Days DQ 79% 60+ Days DQ 21% |
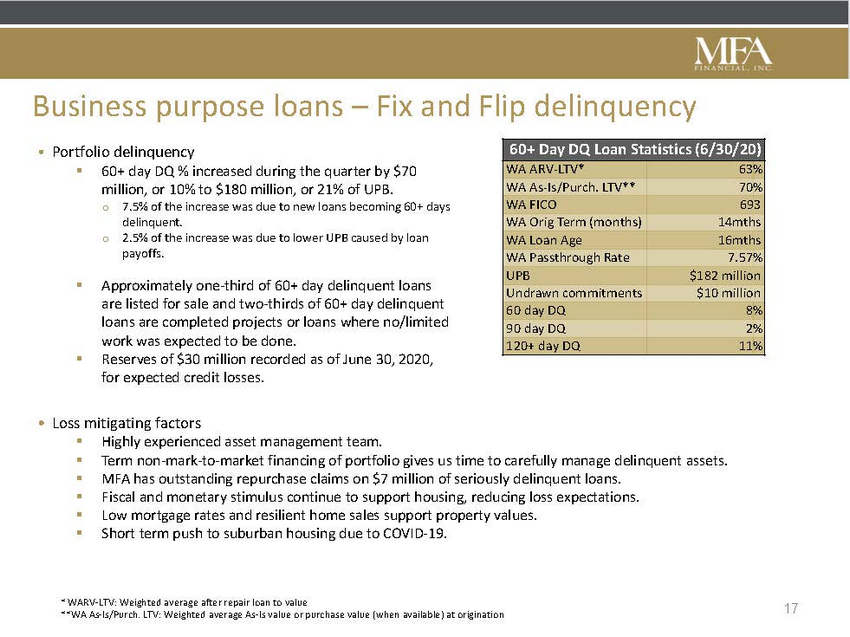 |
Business purpose loans – Fix and Flip delinquency • Portfolio delinquency ▪ 60+ day DQ % increased during the quarter by $70 million, or 10% to $180 million, or 21% of UPB. o7.5% of the increase was due to new loans becoming 60+ days delinquent. o2.5% of the increase was due to lower UPB caused by loan payoffs. ▪ Approximately one-third of 60+ day delinquent loans are listed for sale and two-thirds of 60+ day delinquent loans are completed projects or loans where no/limited work was expected to be done. Reserves of $30 million recorded as of June 30, 2020, for expected credit losses. ▪ • Loss mitigating factors ▪ ▪ ▪ ▪ ▪ ▪ Highly experienced asset management team. Term non-mark-to-market financing of portfolio gives us time to carefully manage delinquent assets. MFA has outstanding repurchase claims on $7 million of seriously delinquent loans. Fiscal and monetary stimulus continue to support housing, reducing loss expectations. Low mortgage rates and resilient home sales support property values. Short term push to suburban housing due to COVID-19. * WARV-LTV: Weighted average after repair loan to value **WA As-Is/Purch. LTV: Weighted average As-Is value or purchase value (when available) at origination 17 60+ Day DQ Loan Statistics (6/30/20) WA ARV-LTV* 63% WA As-Is/Purch. LTV** 70% WA FICO 693 WA Orig Term (months) 14mths WA Loan Age 16mths WA Passthrough Rate 7.57% UPB $182 million Undrawn commitments $10 million 60 day DQ 8% 90 day DQ 2% 120+ day DQ 11% |
 |
Business purpose loans – Single family rental loans • SFR portfolio declined $12 million to $490 million at the end of the second quarter. ▪ Prepayment rates remained low due to strong prepayment protection No new investments in the quarter ▪ • Average yield of 5.80% for the second quarter • Delinquency ▪ 60+ day delinquencies increased to 5.0% at the end of the 2nd quarter, up 3.7% from the end of the first quarter. 3% of SFR loans were granted a payment deferral in the quarter. We have seen 60+ day delinquencies trend down post quarter end. ▪ ▪ *WA DSCR: Weighted average debt service coverage ratio 18 SFR Portfolio Statistics (06/30/20) WA LTV 71% WA FICO 734 WA DSCR* 1.46x WA Coupon 6.64% WA Loan Age 13 5/1 Hybrid Loans 57% UPB $490 million Yield 5.80% Prepayment Rate (CPR) 9% DQ 60+ 5.0% |
 |
Summary • Second quarter results and book value reflect the continued recovery in residential mortgage asset prices following the COVID-19 driven disruption experienced in the first quarter. • Management’s focus was to take the actions necessary to stabilize our balance sheet, generate liquidity, preserve book value, refinance our borrowing arrangements and negotiate an exit from forbearance. • Closing the $500 million term loan was key to facilitating our exit from forbearance and refinancing virtually all of our asset-based borrowings, with approximately two-thirds now containing non-mark-to-market collateral provisions. Our ongoing relationship with Apollo and Athene also offers opportunities for our future investment and financing strategy. • Going forward for the short to medium term, we anticipate that normalization in our financing costs and other operating expenses, coupled with the pursuit of a loan securitization financing strategy, should drive earnings and return on equity. 19 |
 |
Additional Information |
 |
Q2 Results reflect portfolio restructuring and impact of forbearance agreements Key items impacting results: Net interest income significantly reduced due to asset sales and higher funding costs while under forbearance agreements. $ in mm $ in mm • • Net income impact of $90.6 million on sales of residential mortgage securities and residential whole loans. • Reversal of loan loss reserves of $85.4 million. • Unrealized gains on remaining CRT securities of $23.3 million and net gains on fair value loans (primarily cash) of $20.3 million. • $49.9 million loss related to swap hedges. (1) Includes MBS, CRT securities and MSR-related assets (2) Includes interest expense on financing associated with all residential whole loans. Interest income received on residential whole loans held at fair value is reported in Other Income in Net gains on residential whole loans measured at fair value. (3) Comprised of: • $40.0 million of non-recurring forbearance and portfolio restructuring expenses. 21 Realized (loss)/gains on MBS, CRT and RWL sold Reversal of previously unrealized losses/(gains) on sold securities held at fair value $49.5 $41.1 $(238.4) $(7.4) $(245.8) $90.6 Summary Income StatementQ2 2020 Q1 2020 Net Interest Income: Residential mortgage securities (1) $5.6 $31.1 Residential whole loans (RWL) (2) (2.2)33.8 Other interest earning assets and interest bearing liabilities(4.0)(3.2) Net Interest Income$(0.6) $61.7 Provision for credit losses on RWL and other financial instruments15.2(80.6) Valuation adjustment RWL designated as held-for-sale70.2(70.2) Provision for credit and valuation losses on RWL$85.4 $(150.8) Other Income, net: Net gains on RWL measured at fair value 20.3 (52.8) Net income impact of MBS, CRT and RWL sales (3) 90.6 (245.8) Unrealized gain/(loss) on remaining CRT securities held at fair value 23.3 (73.5) Impairment and other losses on securities available-for-sale and other assets (5.1) (419.7) Other miscellaneous net investment income (52.8) 1.0 Other (Loss)/Income, net:$76.3 $(790.8) Operating and Other Expenses (24.6) (24.6) Costs associated with restructuring/forbearance agreements (40.0) (4.5) Preferred dividend requirement (8.1) (5.2) Net (Loss)/Income Available to Common Shareholders$88.4 $(914.2) Earnings Per Common Share$0.19 $(2.02) |
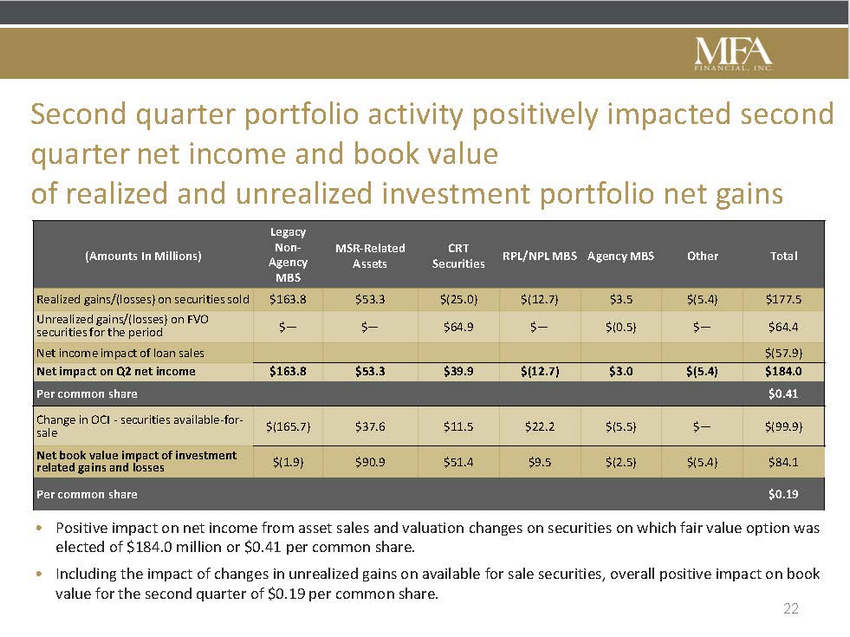 |
Second quarter portfolio activity positively impacted second quarter net income and book value of realized and unrealized investment portfolio net gains (Amounts In Millions) RPL/NPL MBS Agency MBS Other Total Agency Assets Securities •Positive impact on net income from asset sales and valuation changes on securities on which fair value option was elected of $184.0 million or $0.41 per common share. •Including the impact of changes in unrealized gains on available for sale securities, overall positive impact on book value for the second quarter of $0.19 per common share. 22 Legacy Non-MSR-RelatedCRT MBS Realized gains/(losses) on securities sold Unrealized gains/(losses) on FVO securities for the period Net income impact of loan sales Net impact on Q2 net income $163.8$53.3$(25.0)$(12.7)$3.5$(5.4)$177.5 $—$—$64.9$—$(0.5)$—$64.4 $(57.9) $163.8$53.3$39.9$(12.7)$3.0$(5.4)$184.0 Per common share$0.41 Change in OCI - securities available-for-sale Net book value impact of investment related gains and losses $(165.7)$37.6$11.5$22.2$(5.5)$—$(99.9) $(1.9)$90.9$51.4$9.5$(2.5)$(5.4)$84.1 Per common share$0.19 |
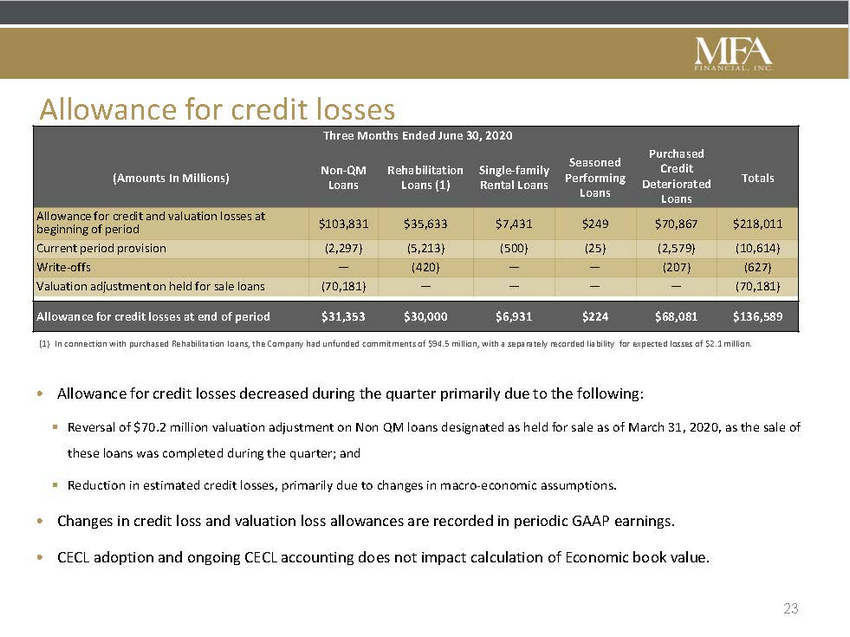 |
Allowance for credit losses Seasoned Deteriorated Loans Loans (1) Rental Loans Loans $103,831 $35,633 $7,431 $249 $70,867 $218,011 beginning of period (1) In connection with purchased Rehabilitation loans, the Company had unfunded commitments of $94.5 million, with a separately recorded liability for expected losses of $2.1 million. • Allowance for credit losses decreased during the quarter primarily due to the following: ▪ Reversal of $70.2 million valuation adjustment on Non QM loans designated as held for sale as of March 31, 2020, as the sale of these loans was completed during the quarter; and ▪ Reduction in estimated credit losses, primarily due to changes in macro-economic assumptions. • Changes in credit loss and valuation loss allowances are recorded in periodic GAAP earnings. • CECL adoption and ongoing CECL accounting does not impact calculation of Economic book value. 23 Three Months Ended June 30, 2020 Purchased (Amounts In Millions)Non-QMRehabilitationSingle-familyPerformingCreditTotals Loans Allowance for credit and valuation losses at Current period provision (2,297)(5,213)(500)(25)(2,579)(10,614) Write-offs—(420)——(207)(627) Valuation adjustment on held for sale loans(70,181) ————(70,181) Allowance for credit losses at end of period$31,353$30,000$6,931$224$68,081$136,589 |
 |
GAAP and Economic book value increased as residential mortgage assets partially recovered, following COVID-19 related market disruptions in Q1 (0.36) (0.36) results in a reduction of unrealized gains in OCI 0.16 0.16 mortgage securities and MSR term notes 24 GAAPEconomic Book value per common share as of 3/31/20$4.34$4.09 Net income available to common shareholders0.190.19 Impact of discount accretion and realization of gains on sale of Non-Agency MBS that Realization of net gains and other fair value changes attributable to other residential Losses on hedging swaps transferred from OCI to earnings0.140.14 Impact of warrants issued in connection with capital raise transaction0.040.04 Change in fair value of residential whole loans reported at carrying value under GAAP—0.20 Book value per common share as of 6/30/20$4.51$4.46 |
 |
Reconciliation of GAAP book value to Economic book value “Economic book value” is a non-GAAP financial measure of our financial position. To calculate our Economic book value, our portfolios of Residential whole loans at carrying value are adjusted to their fair value, rather than the carrying value that is required to be reported under the GAAP accounting model applied to these loans. This adjustment is also reflected in our end of period stockholders’ equity in the table below. Management considers that Economic book value provides investors with a useful supplemental measure to evaluate our financial position as it reflects the impact of fair value changes for all of our residential mortgage assets, irrespective of the accounting model applied for GAAP reporting purposes. Economic book value does not represent and should not be considered as a substitute for Stockholders’ Equity, as determined in accordance with GAAP, and our calculation of this measure may not be comparable to similarly titled measures reported by other companies. The following table provides a reconciliation of GAAP book value per common share to our non-GAAP Economic book value per common share as of the end of each quarter since Q1 2019. $2,020.7 $1,852.2 $3,366.4 $3,349.2 $3,334.6 $3,296.7 loans, at carrying value (Economic book value) 25 (In Millions, Except Per Share Amounts)6/30/203/31/2012/31/199/30/196/30/193/31/19 GAAP Total Stockholders’ Equity$2,521.1 $2,440.7 $3,384.0 $3,403.4 $3,403.4 $3,404.5 Preferred Stock, liquidation preference(475.0)(475.0)(200.0)(200.0)(200.0)(200.0) GAAP Stockholders’ Equity for book value per common share$2,046.1 $1,965.7 $3,184.0 $3,203.4 $3,203.4 $3,204.5 Adjustments: Fair value adjustment to Residential whole loans, at carrying value(25.3)(113.5)182.4145.8131.292.1 Stockholders’ Equity including fair value adjustment to Residential whole GAAP book value per common share$4.51 $4.34 $7.04 $7.09 $7.11 $7.11 Economic book value per common share$4.46 $4.09 $7.44 $7.41 $7.40 $7.32 Number of shares of common stock outstanding453.2453.1452.4451.7450.6450.5 |