
MPT 8-K
Medical Properties Trust Inc (MPT)
UNITED STATES
SECURITIES AND EXCHANGE COMMISSION
WASHINGTON, D.C. 20549
FORM
CURRENT REPORT
PURSUANT TO SECTION 13 OR 15(d)
OF THE SECURITIES EXCHANGE ACT OF 1934
Date of report (Date of earliest event reported):
(Exact Name of Registrant as Specified in Charter)
Commission File Number
| (State or other jurisdiction of incorporation or organization) |
(I.R.S. Employer Identification No.) |
| |
||
| (Address of principal executive offices) | (Zip Code) |
Registrant’s telephone number, including area code
Check the appropriate box below if the Form 8-K filing is intended to simultaneously satisfy the filing obligation of the Registrant under any of the following provisions:
| Written communications pursuant to Rule 425 under the Securities Act (17 CFR 230.425) |
| Soliciting material pursuant to Rule 14a-12 under the Exchange Act (17 CFR 240.14a-12) |
| Pre-commencement communications pursuant to Rule 14d-2(b) under the Exchange Act (17 CFR 240.14d-2(b)) |
| Pre-commencement communications pursuant to Rule 13e-4(c) under the Exchange Act (17 CFR 240.13e-4(c)) |
Securities registered pursuant to Section 12(b) of the Act:
| Title of each class |
Trading Symbol |
Name of each exchange on which registered | ||
Indicate by check mark whether the registrant is an emerging growth company as defined in Rule 405 of the Securities Act of 1933 (§230.405 of this chapter) or Rule 12b-2 of the Securities Exchange Act of 1934 (§240.12b-2 of this chapter).
Emerging growth company
If an emerging growth company, indicate by check mark if the registrant has elected not to use the extended transition period for complying with any new or revised financial accounting standards provided pursuant to Section 13(a) of the Exchange Act. ☐
| Item 2.02. | Results of Operations and Financial Condition. |
On February 4, 2021, Medical Properties Trust, Inc. issued a press release announcing its financial results for the three and twelve months ended December 31, 2020. A copy of the press release is attached as Exhibit 99.1 to this Current Report on Form 8-K and is incorporated herein by reference. The information in this Current Report on Form 8-K, including the information set forth in Exhibit 99.1 and Exhibit 99.2 attached hereto, shall not be deemed “filed” for purposes of Section 18 of the Securities Exchange Act of 1934, as amended, or otherwise subject to the liability of that section or Sections 11 and 12(a)(2) of the Securities Act of 1933, as amended. In addition, this information shall not be deemed incorporated by reference in any filing of Medical Properties Trust, Inc. with the Securities and Exchange Commission, except as expressly set forth by specific reference in any such filing.
| Item 9.01. | Financial Statements and Exhibits. |
(d) Exhibits.
| Exhibit Number |
Description | |
| 99.1 | Press release dated February 4, 2021 reporting financial results for the three and twelve months ended December 31, 2020 | |
| 99.2 | Medical Properties Trust, Inc. 4th Quarter 2020 Supplemental Information | |
| 104 | Cover Page Interactive Data File (embedded within the Inline XBRL document) | |
2
SIGNATURES
Pursuant to the requirements of the Securities Exchange Act of 1934, as amended, the registrant has duly caused this report to be signed on its behalf by the undersigned hereunder duly authorized.
| MEDICAL PROPERTIES TRUST, INC. | ||
| By: | /s/ R. Steven Hamner | |
| Name: | R. Steven Hamner | |
| Title: | Executive Vice President and Chief Financial Officer | |
Date: February 4, 2021
3
Exhibit 99.1

| Contact: Drew Babin, CFA | ||||
| Senior Managing Director – Corporate Communications | ||||
| Medical Properties Trust, Inc. | ||||
| (646) 884-9809 | ||||
| [email protected] |
MEDICAL PROPERTIES TRUST, INC. REPORTS FOURTH QUARTER AND FULL-YEAR RESULTS
Per Share Net Income of $0.20 and Normalized FFO of $0.41 in Fourth Quarter
Full-Year Growth in NFFO per Share of Approximately 21%
Nearly $3.6 Billion of Investments Closed in 2020 and $1.1 Billion Year-to-Date 2021
Birmingham, AL – February 4, 2021 – Medical Properties Trust, Inc. (the “Company” or “MPT”) (NYSE: MPW) today announced financial and operating results for the fourth quarter and full-year ended December 31, 2020 as well as certain events occurring subsequent to quarter end.
| • | Net income of $0.20 and Normalized Funds from Operations (“NFFO”) of $0.41 for the 2020 fourth quarter and net income of $0.81 and NFFO of $1.57 for the full-year 2020, all on a per diluted share basis; |
| • | Closed in the fourth quarter on one inpatient rehabilitation (“IRF”) development agreement and six general acute and IRF acquisitions in the U.S., the U.K., Switzerland, and Colombia totaling nearly $670 million; |
| • | Closed in mid-January on an £800 million real estate investment in behavioral health properties in the UK operated by Priory Group (“Priory”); |
| • | In the first quarter of 2021 completed the sale of Olympia Medical Center to the UCLA Health System for proceeds of $51 million, recovering a loan balance of $25 million and other past due amounts at an overall expected gain exceeding $10 million; |
| • | During and subsequent to the fourth quarter issued $1.3 billion in 3.5% senior unsecured notes due in 2031, redeemed $800 million of senior unsecured notes due in 2024 with a blended interest rate of 6%, raised $828 million in common equity, extended with improved pricing the existing $1.5 billion line of credit agreement, and arranged a $900 million interim credit facility. |
“I am pleased that in spite of the pandemic, MPT grew NFFO per share by 21% in 2020 and is approaching $5 billion in investments closed since the end of 2019 in a manner both accretive to earnings and beneficial to operator and property diversity in an already strongly diverse portfolio,” said Edward K. Aldag, Jr., MPT’s Chairman, President, and Chief Executive Officer. “While not a surprise to MPT, the challenges of 2020 proved that hospitals are essential to global healthcare delivery and that our growth pipeline can sustain momentum under challenging circumstances.”
1
Mr. Aldag continued, “2021 is obviously off to a strong start on the investment front, and growth-related conversations with our operators are picking up as they emerge from 2020 with strong operations and significant liquidity.”
Included in the financial tables accompanying this press release is information about the Company’s assets and liabilities, net income, and reconciliations of net income to NFFO, all on a basis comparable to 2019 results, and reconciliations of total assets to pro forma total gross assets and total revenues to total adjusted revenues.
PORTFOLIO UPDATE
During the fourth quarter and thus far in 2021, MPT and its operators continued to execute on several accretive acquisitions despite the COVID-19 pandemic.
Throughout the fourth quarter, the Company closed on various investments in IRFs across the U.S. In late-November, MPT agreed to a roughly $48 million development in Stockton, CA with Ernest Health (“Ernest”) and also acquired an Ernest facility in Elgin, SC in late December for roughly $17 million. In addition, the Company acquired in December properties in El Paso, TX and the Louisville, KY market operated by Curahealth for a combined $58 million. These transactions were closed at a weighted average GAAP cap rate approximating 10%.
In addition to these U.S. rehabilitation facilities, MPT closed on the previously announced $130 million Colombian investment and three other transactions: (i) the Company purchased the 999-year ground lease at The Royal Marsden Private Care, a flagship facility located in London’s Cavendish Square and MPT’s first lease with the National Health Service (“NHS”), for £50 million; (ii) separately, MPT acquired Circle Reading Hospital, to be joined to MPT’s master lease agreement with Circle, in December for £85 million; and (iii) MPT increased its equity ownership and related investment in Infracore, the landlord entity of Swiss hospital operator Swiss Medical Network, for a total investment of approximately 207 million Swiss Francs. Terms of these investment agreements provide for long-term absolute net lease arrangements and investment returns well in-line with recently disclosed yields in the U.K. and Switzerland.
As discussed in more detail in the Company’s January 6, 2021 press release, MPT invested £800 million on January 19, 2021 in a sale-leaseback agreement of U.K. behavioral hospitals operated by Priory at an 8.6% GAAP cap rate. In addition, the Company extended a short-term £250 million loan to the purchaser of the operator, expected to be repaid by the end of the third quarter, and acquired a 9.9% equity interest in Priory. In relation to the deal, MPT utilized approximately £500 million of interim short-term financing at terms similar to those in its revolving line of credit agreement.
The Company has pro forma total gross assets of approximately $20.4 billion, including $15.1 billion in general acute care hospitals, $2.2 billion in inpatient rehabilitation hospitals, $1.7 billion in behavioral health facilities, $0.3 billion in long-term acute care hospitals, and $0.3 billion in freestanding emergency room and urgent care properties. MPT’s portfolio, pro forma for the transactions described herein, includes 431 properties representing roughly 43,000 licensed beds across the United States and in Germany, the United Kingdom, Switzerland, Italy, Spain, Portugal, Australia, and Colombia. The properties are leased to or mortgaged by 50 hospital operating companies. MPT continues to work with existing and new operators in the U.S. and abroad on numerous opportunities.
2
OPERATING RESULTS AND OUTLOOK
Net income for the fourth quarter and year ended December 31, 2020 was $110 million (or $0.20 per diluted share) and $431 million ($0.81 per diluted share), respectively, compared to $130 million (or $0.26 per diluted share) and $375 million ($0.87 per diluted share) in the year earlier periods.
NFFO for the fourth quarter and year ended December 31, 2020 was $220 million ($0.41 per diluted share) and $831 million ($1.57 per diluted share), respectively, compared to $171 million ($0.35 per diluted share) and $557 million ($1.30 per diluted share) in the year earlier periods.
Based on 2020 and 2021 year-to-date transactions, including the Priory sale-leaseback transaction, along with an assumed capital structure resulting in a net debt to EBITDA ratio between 5.0 and 6.0 times, MPT expects an annual run-rate of $1.14 to $1.18 per diluted share for net income and $1.72 to $1.76 per diluted share for NFFO.
These estimates do not include the effects, if any, of unexpected real estate operating costs, changes in accounting pronouncements, litigation costs, debt refinancing costs, acquisition costs, currency exchange rate movements, interest rate hedging activities, write-offs of straight-line rent or other non-recurring or unplanned transactions. Moreover, these estimates do not provide for the impact on MPT or its tenants and borrowers from the global COVID-19 pandemic. These estimates may change if the Company acquires or sells assets in amounts that are different from estimates, market interest rates change, debt is refinanced, new shares are issued, additional debt is incurred, other operating expenses vary, income from equity investments vary from expectations, or existing leases or loans do not perform in accordance with their terms.
CONFERENCE CALL AND WEBCAST
The Company has scheduled a conference call and webcast for Thursday, February 4, 2021 at 11:00 a.m. Eastern Time to present the Company’s financial and operating results for the quarter ended December 31, 2020. The dial-in numbers for the conference call are 844-535-3969 (U.S. and Canada) and 409-937-8903 (International); both numbers require passcode 6688297. The conference call will also be available via webcast in the Investor Relations section of the Company’s website, www.medicalpropertiestrust.com.
A telephone and webcast replay of the call will be available beginning shortly after the call’s completion through February 18, 2021. Dial-in numbers for the replay are 855-859-2056 and 404-537-3406 for U.S./Canada and International callers, respectively. The replay passcode for all callers is 6688297.
The Company’s supplemental information package for the current period will also be available on the Company’s website in the Investor Relations section.
The Company uses, and intends to continue to use, the Investor Relations page of its website, which can be found at www.medicalpropertiestrust.com, as a means of disclosing material nonpublic information and of complying with its disclosure obligations under Regulation FD, including, without limitation, through the posting of investor presentations that may include material nonpublic information. Accordingly, investors should monitor the Investor Relations page, in addition to following our press releases, SEC filings, public conference calls, presentations and webcasts. The information contained on, or that may be accessed through, our website is not incorporated by reference into, and is not a part of, this document.
About Medical Properties Trust, Inc.
Medical Properties Trust, Inc. is a self-advised real estate investment trust formed in 2003 to acquire and develop net-leased hospital facilities. From its inception in Birmingham, Alabama, the Company has grown to
3
become one of the world’s largest owners of hospitals with 431 facilities and roughly 43,000 licensed beds in nine countries and across four continents on a pro forma basis. MPT’s financing model facilitates acquisitions and recapitalizations and allows operators of hospitals to unlock the value of their real estate assets to fund facility improvements, technology upgrades and other investments in operations. For more information, please visit the Company’s website at www.medicalpropertiestrust.com.
This press release includes forward-looking statements within the meaning of Section 27A of the Securities Act of 1933, as amended, and Section 21E of the Securities Exchange Act of 1934, as amended. Forward-looking statements can generally be identified by the use of forward-looking words such as “may”, “will”, “would”, “could”, “expect”, “intend”, “plan”, “estimate”, “target”, “anticipate”, “believe”, “objectives”, “outlook”, “guidance” or other similar words, and include statements regarding our strategies, objectives, future expansion and development activities, and expected financial performance. Forward-looking statements involve known and unknown risks and uncertainties that may cause our actual results or future events to differ materially from those expressed in or underlying such forward-looking statements, including, but not limited to: (i) the economic, political and social impact of, and uncertainty relating to, the COVID-19 pandemic, including governmental assistance to hospitals and healthcare providers, including certain of our tenants; (ii) the ability of our tenants, operators and borrowers to satisfy their obligations under their respective contractual arrangements with us, especially as a result of the adverse economic impact of the COVID-19 pandemic, and government regulation of hospitals and healthcare providers in connection with same (as further detailed in our Current Report on Form 8-K filed with the SEC on April 8, 2020); (iii) our expectations regarding annual run-rate net income and NFFO per share; (iv) our success in implementing our business strategy and our ability to identify, underwrite, finance, consummate and integrate acquisitions and investments; (v) the nature and extent of our current and future competition; (vi) macroeconomic conditions, such as a disruption of or lack of access to the capital markets or movements in currency exchange rates; (vii) our ability to obtain debt financing on attractive terms or at all, which may adversely impact our ability to pursue acquisition and development opportunities and pay down, refinance, restructure or extend our indebtedness as it becomes due; (viii) increases in our borrowing costs as a result of changes in interest rates and other factors, including the potential phasing out of LIBOR after 2021; (ix) international, national and local economic, real estate and other market conditions, which may negatively impact, among other things, the financial condition of our tenants, lenders and institutions that hold our cash balances, and may expose us to increased risks of default by these parties; (x) factors affecting the real estate industry generally or the healthcare real estate industry in particular; (xi) our ability to maintain our status as a REIT for federal and state income tax purposes; (xii) federal and state healthcare and other regulatory requirements, as well as those in the foreign jurisdictions where we own properties; (xiii) the value of our real estate assets, which may limit our ability to dispose of assets at attractive prices or obtain or maintain equity or debt financing secured by our properties or on an unsecured basis; (xiv) the ability of our tenants and operators to comply with applicable laws, rules and regulations in the operation of the our properties, to deliver high-quality services, to attract and retain qualified personnel and to attract patients; (xv) potential environmental contingencies and other liabilities; and (xvi) the closing of the Priory sale-leaseback transaction.
The risks described above are not exhaustive and additional factors could adversely affect our business and financial performance, including the risk factors discussed under the section captioned “Risk Factors” in our Annual Report on Form 10-K for the year ended December 31, 2019 and as updated in our quarterly reports on Form 10-Q. Forward-looking statements are inherently uncertain and actual performance or outcomes may vary materially from any forward-looking statements and the assumptions on which those statements are based. Readers are cautioned to not place undue reliance on forward-looking statements as predictions of future events. We disclaim any responsibility to update such forward-looking statements, which speak only as of the date on which they were made.
# # #
4
MEDICAL PROPERTIES TRUST, INC. AND SUBSIDIARIES
Consolidated Balance Sheets
| (Amounts in thousands, except for per share data) | December 31, 2020 | December 31, 2019 | ||||||
| (Unaudited) | (A) | |||||||
| Assets |
||||||||
| Real estate assets |
||||||||
| Land, buildings and improvements, intangible lease assets, and other |
$ | 12,078,927 | $ | 8,102,754 | ||||
| Investment in financing leases |
2,010,922 | 2,060,302 | ||||||
| Mortgage loans |
248,080 | 1,275,022 | ||||||
|
|
|
|
|
|||||
| Gross investment in real estate assets |
14,337,929 | 11,438,078 | ||||||
| Accumulated depreciation and amortization |
(833,529 | ) | (570,042 | ) | ||||
|
|
|
|
|
|||||
| Net investment in real estate assets |
13,504,400 | 10,868,036 | ||||||
| Cash and cash equivalents |
549,884 | 1,462,286 | ||||||
| Interest and rent receivables |
46,208 | 31,357 | ||||||
| Straight-line rent receivables |
490,462 | 334,231 | ||||||
| Equity investments |
1,123,623 | 926,990 | ||||||
| Other loans |
858,368 | 544,832 | ||||||
| Other assets |
256,069 | 299,599 | ||||||
|
|
|
|
|
|||||
| Total Assets |
$ | 16,829,014 | $ | 14,467,331 | ||||
|
|
|
|
|
|||||
| Liabilities and Equity |
||||||||
| Liabilities |
||||||||
| Debt, net |
$ | 8,865,458 | $ | 7,023,679 | ||||
| Accounts payable and accrued expenses |
438,750 | 291,489 | ||||||
| Deferred revenue |
36,177 | 16,098 | ||||||
| Obligations to tenants and other lease liabilities |
144,772 | 107,911 | ||||||
|
|
|
|
|
|||||
| Total Liabilities |
9,485,157 | 7,439,177 | ||||||
| Equity |
||||||||
| Preferred stock, $0.001 par value. Authorized 10,000 shares; no shares outstanding |
— | — | ||||||
| Common stock, $0.001 par value. Authorized 750,000 shares; issued and outstanding - 541,419 shares at December 31, 2020 and 517,522 shares at December 31, 2019 |
541 | 518 | ||||||
| Additional paid-in capital |
7,461,503 | 7,008,199 | ||||||
| Retained (deficit) earnings |
(71,411 | ) | 83,012 | |||||
| Accumulated other comprehensive loss |
(51,324 | ) | (62,905 | ) | ||||
| Treasury shares, at cost |
(777 | ) | (777 | ) | ||||
|
|
|
|
|
|||||
| Total Medical Properties Trust, Inc. Stockholders’ Equity |
7,338,532 | 7,028,047 | ||||||
| Non-controlling interests |
5,325 | 107 | ||||||
|
|
|
|
|
|||||
| Total Equity |
7,343,857 | 7,028,154 | ||||||
|
|
|
|
|
|||||
| Total Liabilities and Equity |
$ | 16,829,014 | $ | 14,467,331 | ||||
|
|
|
|
|
|||||
| (A) | Financials have been derived from the prior year audited financial statements. |
MEDICAL PROPERTIES TRUST, INC. AND SUBSIDIARIES
Consolidated Statements of Income
(Unaudited)
| (Amounts in thousands, except for per share data) | For the Three Months Ended | For the Twelve Months Ended | ||||||||||||||
| December 31, 2020 | December 31, 2019 | December 31, 2020 | December 31, 2019 | |||||||||||||
| Revenues |
||||||||||||||||
| Rent billed |
$ | 203,034 | $ | 130,310 | $ | 741,311 | $ | 474,151 | ||||||||
| Straight-line rent |
55,184 | 33,643 | 158,881 | 110,456 | ||||||||||||
| Income from financing leases |
49,081 | 52,364 | 206,550 | 119,617 | ||||||||||||
| Interest and other income |
26,507 | 40,121 | 142,496 | 149,973 | ||||||||||||
|
|
|
|
|
|
|
|
|
|||||||||
| Total revenues |
333,806 | 256,438 | 1,249,238 | 854,197 | ||||||||||||
| Expenses |
||||||||||||||||
| Interest |
85,190 | 70,434 | 328,728 | 237,830 | ||||||||||||
| Real estate depreciation and amortization |
72,196 | 44,152 | 264,245 | 152,313 | ||||||||||||
| Property-related |
5,712 | 8,598 | 24,890 | 23,992 | ||||||||||||
| General and administrative |
34,542 | 27,402 | 131,663 | 96,411 | ||||||||||||
|
|
|
|
|
|
|
|
|
|||||||||
| Total expenses |
197,640 | 150,586 | 749,526 | 510,546 | ||||||||||||
| Other income (expense) |
||||||||||||||||
| (Loss) gain on sale of real estate |
(130 | ) | 41,498 | (2,833 | ) | 41,560 | ||||||||||
| Real estate impairment charges |
— | (21,031 | ) | (19,006 | ) | (21,031 | ) | |||||||||
| Earnings from equity interests |
5,154 | 4,416 | 20,417 | 16,051 | ||||||||||||
| Debt refinancing and unutilized financing costs |
(27,569 | ) | (1,233 | ) | (28,180 | ) | (6,106 | ) | ||||||||
| Other (including mark-to-market adjustments on equity securities) |
2,717 | 1,152 | (6,782 | ) | (345 | ) | ||||||||||
|
|
|
|
|
|
|
|
|
|||||||||
| Total other income (expense) |
(19,828 | ) | 24,802 | (36,384 | ) | 30,129 | ||||||||||
|
|
|
|
|
|
|
|
|
|||||||||
| Income before income tax |
116,338 | 130,654 | 463,328 | 373,780 | ||||||||||||
| Income tax (expense) benefit |
(6,232 | ) | (731 | ) | (31,056 | ) | 2,621 | |||||||||
|
|
|
|
|
|
|
|
|
|||||||||
| Net income |
110,106 | 129,923 | 432,272 | 376,401 | ||||||||||||
| Net income attributable to non-controlling interests |
(222 | ) | (285 | ) | (822 | ) | (1,717 | ) | ||||||||
|
|
|
|
|
|
|
|
|
|||||||||
| Net income attributable to MPT common stockholders |
$ | 109,884 | $ | 129,638 | $ | 431,450 | $ | 374,684 | ||||||||
|
|
|
|
|
|
|
|
|
|||||||||
| Earnings per common share - basic and diluted: |
||||||||||||||||
| Net income attributable to MPT common stockholders |
$ | 0.20 | $ | 0.26 | $ | 0.81 | $ | 0.87 | ||||||||
|
|
|
|
|
|
|
|
|
|||||||||
| Weighted average shares outstanding - basic |
537,003 | 493,593 | 529,239 | 427,075 | ||||||||||||
| Weighted average shares outstanding - diluted |
538,351 | 494,893 | 530,461 | 428,299 | ||||||||||||
| Dividends declared per common share |
$ | 0.27 | $ | 0.26 | $ | 1.08 | $ | 1.02 | ||||||||
MEDICAL PROPERTIES TRUST, INC. AND SUBSIDIARIES
Reconciliation of Net Income to Funds From Operations
(Unaudited)
| (Amounts in thousands, except for per share data) | For the Three Months Ended | For the Twelve Months Ended | ||||||||||||||
| December 31, 2020 | December 31, 2019 | December 31, 2020 | December 31, 2019 | |||||||||||||
| FFO information: |
||||||||||||||||
| Net income attributable to MPT common stockholders |
$ | 109,884 | $ | 129,638 | $ | 431,450 | $ | 374,684 | ||||||||
| Participating securities’ share in earnings |
(719 | ) | (954 | ) | (2,105 | ) | (2,308 | ) | ||||||||
|
|
|
|
|
|
|
|
|
|||||||||
| Net income, less participating securities’ share in earnings |
$ | 109,165 | $ | 128,684 | $ | 429,345 | $ | 372,376 | ||||||||
| Depreciation and amortization |
83,327 | 53,497 | 306,493 | 183,921 | ||||||||||||
| Loss (gain) on sale of real estate |
130 | (41,498 | ) | 2,833 | (41,560 | ) | ||||||||||
| Real estate impairment charges |
— | 21,031 | 19,006 | 21,031 | ||||||||||||
|
|
|
|
|
|
|
|
|
|||||||||
| Funds from operations |
$ | 192,622 | $ | 161,714 | $ | 757,677 | $ | 535,768 | ||||||||
| Write-off of straight-line rent and other |
(683 | ) | 12,943 | 26,415 | 22,447 | |||||||||||
| Non-cash fair value adjustments |
612 | (4,636 | ) | 9,642 | (6,908 | ) | ||||||||||
| Tax rate change |
(366 | ) | — | 9,295 | — | |||||||||||
| Debt refinancing and unutilized financing costs |
27,569 | 1,233 | 28,180 | 6,106 | ||||||||||||
|
|
|
|
|
|
|
|
|
|||||||||
| Normalized funds from operations |
$ | 219,754 | $ | 171,254 | $ | 831,209 | $ | 557,413 | ||||||||
| Share-based compensation |
12,554 | 10,069 | 47,154 | 32,188 | ||||||||||||
| Debt costs amortization |
3,548 | 2,761 | 13,937 | 9,675 | ||||||||||||
| Rent deferral, net |
1,267 | — | (11,393 | ) | — | |||||||||||
| Straight-line rent revenue and other |
(71,659 | ) | (48,836 | ) | (238,687 | ) | (145,598 | ) | ||||||||
|
|
|
|
|
|
|
|
|
|||||||||
| Adjusted funds from operations |
$ | 165,464 | $ | 135,248 | $ | 642,220 | $ | 453,678 | ||||||||
|
|
|
|
|
|
|
|
|
|||||||||
| Per diluted share data: |
||||||||||||||||
| Net income, less participating securities’ share in earnings |
$ | 0.20 | $ | 0.26 | $ | 0.81 | $ | 0.87 | ||||||||
| Depreciation and amortization |
0.16 | 0.11 | 0.57 | 0.43 | ||||||||||||
| Loss (gain) on sale of real estate |
— | (0.08 | ) | 0.01 | (0.10 | ) | ||||||||||
| Real estate impairment charges |
— | 0.04 | 0.04 | 0.05 | ||||||||||||
|
|
|
|
|
|
|
|
|
|||||||||
| Funds from operations |
$ | 0.36 | $ | 0.33 | $ | 1.43 | $ | 1.25 | ||||||||
| Write-off of straight-line rent and other |
— | 0.03 | 0.05 | 0.05 | ||||||||||||
| Non-cash fair value adjustments |
— | (0.01 | ) | 0.02 | (0.01 | ) | ||||||||||
| Tax rate change |
— | — | 0.02 | — | ||||||||||||
| Debt refinancing and unutilized financing costs |
0.05 | — | 0.05 | 0.01 | ||||||||||||
|
|
|
|
|
|
|
|
|
|||||||||
| Normalized funds from operations |
$ | 0.41 | $ | 0.35 | $ | 1.57 | $ | 1.30 | ||||||||
| Share-based compensation |
0.02 | 0.02 | 0.09 | 0.08 | ||||||||||||
| Debt costs amortization |
0.01 | 0.01 | 0.02 | 0.02 | ||||||||||||
| Rent deferral, net |
— | — | (0.02 | ) | — | |||||||||||
| Straight-line rent revenue and other |
(0.13 | ) | (0.11 | ) | (0.45 | ) | (0.34 | ) | ||||||||
|
|
|
|
|
|
|
|
|
|||||||||
| Adjusted funds from operations |
$ | 0.31 | $ | 0.27 | $ | 1.21 | $ | 1.06 | ||||||||
|
|
|
|
|
|
|
|
|
|||||||||
Notes:
| (A) | Certain line items above (such as depreciation and amortization) include our share of such income/expense from unconsolidated joint ventures. These amounts are included with the activity of all of our equity interests in the “Earnings from equity interests” line on the consolidated statements of income. |
| (B) | Investors and analysts following the real estate industry utilize funds from operations, or FFO, as a supplemental performance measure. FFO, reflecting the assumption that real estate asset values rise or fall with market conditions, principally adjusts for the effects of GAAP depreciation and amortization of real estate assets, which assumes that the value of real estate diminishes predictably over time. We compute FFO in accordance with the definition provided by the National Association of Real Estate Investment Trusts, or NAREIT, which represents net income (loss) (computed in accordance with GAAP), excluding gains (losses) on sales of real estate and impairment charges on real estate assets, plus real estate depreciation and amortization and after adjustments for unconsolidated partnerships and joint ventures. |
In addition to presenting FFO in accordance with the NAREIT definition, we also disclose normalized FFO, which adjusts FFO for items that relate to unanticipated or non-core events or activities or accounting changes that, if not noted, would make comparison to prior period results and market expectations less meaningful to investors and analysts. We believe that the use of FFO, combined with the required GAAP presentations, improves the understanding of our operating results among investors and the use of normalized FFO makes comparisons of our operating results with prior periods and other companies more meaningful. While FFO and normalized FFO are relevant and widely used supplemental measures of operating and financial performance of REITs, they should not be viewed as a substitute measure of our operating performance since the measures do not reflect either depreciation and amortization costs or the level of capital expenditures and leasing costs necessary to maintain the operating performance of our properties, which can be significant economic costs that could materially impact our results of operations. FFO and normalized FFO should not be considered an alternative to net income (loss) (computed in accordance with GAAP) as indicators of our results of operations or to cash flow from operating activities (computed in accordance with GAAP) as an indicator of our liquidity.
We calculate adjusted funds from operations, or AFFO, by subtracting from or adding to normalized FFO (i) non-cash revenue, (ii) non-cash share-based compensation expense, and (iii) amortization of deferred financing costs. AFFO is an operating measurement that we use to analyze our results of operations based on the receipt, rather than the accrual, of our rental revenue and on certain other adjustments. We believe that this is an important measurement because our leases generally have significant contractual escalations of base rents and therefore result in recognition of rental income that is not collected until future periods, and costs that are deferred or are non-cash charges. Our calculation of AFFO may not be comparable to AFFO or similarly titled measures reported by other REITs. AFFO should not be considered as an alternative to net income (calculated pursuant to GAAP) as an indicator of our results of operations or to cash flow from operating activities (calculated pursuant to GAAP) as an indicator of our liquidity.
MEDICAL PROPERTIES TRUST, INC. AND SUBSIDIARIES
Annual Run-Rate Guidance Reconciliation
(Unaudited)
| Annual Run-Rate Guidance - Per Share(1) | ||||||||
| Low | High | |||||||
| Net income attributable to MPT common stockholders |
$ | 1.14 | $ | 1.18 | ||||
| Participating securities’ share in earnings |
— | — | ||||||
|
|
|
|
|
|||||
| Net income, less participating securities’ share in earnings |
$ | 1.14 | $ | 1.18 | ||||
| Depreciation and amortization |
0.58 | 0.58 | ||||||
|
|
|
|
|
|||||
| Funds from operations |
$ | 1.72 | $ | 1.76 | ||||
| Other adjustments |
— | — | ||||||
|
|
|
|
|
|||||
| Normalized funds from operations |
$ | 1.72 | $ | 1.76 | ||||
|
|
|
|
|
|||||
| (1) | The guidance is based on current expectations and actual results or future events may differ materially from those expressed in this table, which is a forward-looking statement within the meaning of the federal securities laws. Please refer to the forward-looking statement included in this press release and our filings with the Securities and Exchange Commission for a discussion of risk factors that affect our performance. |
Pro Forma Total Gross Assets
(Unaudited)
| (Amounts in thousands) | December 31, 2020 | December 31, 2019 | ||||||
| Total Assets |
$ | 16,829,014 | $ | 14,467,331 | ||||
| Add: |
||||||||
| Real estate commitments on new investments(1) |
1,901,087 | 1,988,550 | ||||||
| Unfunded amounts on development deals and commenced capital improvement projects(2) |
166,258 | 163,370 | ||||||
| Accumulated depreciation and amortization |
833,529 | 570,042 | ||||||
| Incremental gross assets of our joint ventures(3) |
1,287,077 | 563,911 | ||||||
| Proceeds from new debt and equity subsequent to period-end |
1,479,961 | 927,990 | ||||||
| Less: |
||||||||
| Cash used for funding the transactions above(4) |
(2,067,345 | ) | (2,151,920 | ) | ||||
|
|
|
|
|
|||||
| Pro Forma Total Gross Assets(5) |
$ | 20,429,581 | $ | 16,529,274 | ||||
|
|
|
|
|
|||||
| (1) | The 2020 column reflects investments made in 2021, including the acquisition of 40 facilities in the United Kingdom on January 19, 2021. The 2019 column reflects the acquisition of 30 facilities in the United Kingdom on January 8, 2020. |
| (2) | Includes $65.5 million and $41.7 million of unfunded amounts on ongoing development projects and $100.8 million and $121.7 million of unfunded amounts on capital improvement projects and development projects that have commenced rent, as of December 31, 2020 and December 31, 2019, respectively. |
| (3) | Adjustment to reflect our share of our joint ventures’ gross assets. |
| (4) | Includes cash available on-hand plus cash generated from activities subsequent to period-end including proceeds from new debt, equity or loan repayments. |
| (5) | Pro forma total gross assets is total assets before accumulated depreciation/amortization and assumes all real estate commitments on new investments and unfunded amounts on development deals and commenced capital improvement projects are fully funded using cash on hand (if available). We believe pro forma total gross assets is useful to investors as it provides a more current view of our portfolio and allows for a better understanding of our concentration levels as our commitments close and our other commitments are fully funded. |
Adjusted Revenues
(Unaudited)
| (Amounts in thousands) | For the Year Ended December 31, 2020 |
|||
| Total revenues |
$ | 1,249,238 | ||
| Revenue from real estate properties owned through joint venture arrangements |
105,758 | |||
|
|
|
|||
| Total adjusted revenues(1) |
$ | 1,354,996 | ||
|
|
|
|||
| (1) | Adjusted revenues are total revenues adjusted for our pro rata portion of similar revenues in our real estate joint venture arrangements. We believe adjusted revenue is useful to investors as it provides a more complete view of revenue across all of our investments and allows for better understanding of our revenue concentration. |
Exhibit 99.2
4 Q Supplemental 2020
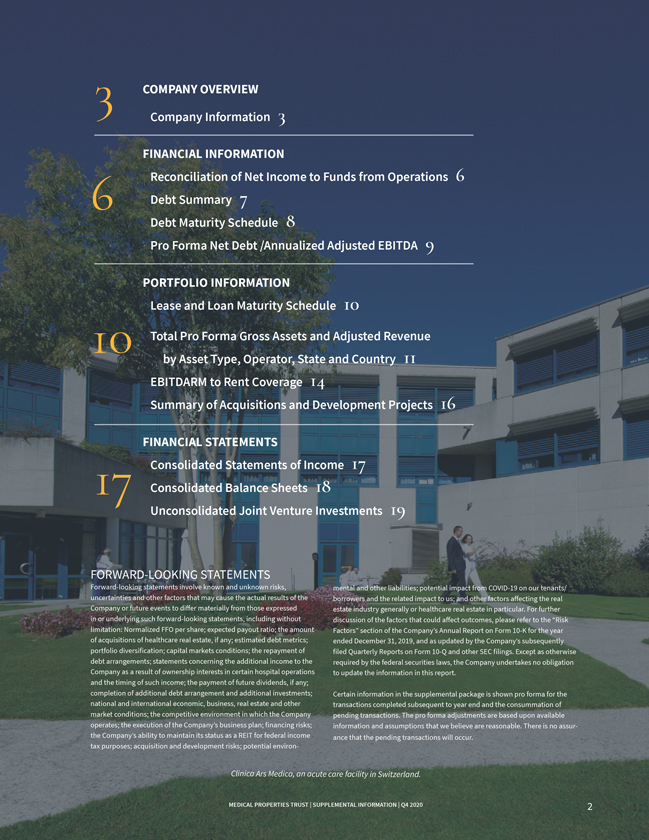
3 COMPANY OVERVIEW Company Information 3 FINANCIAL INFORMATION Reconciliation of Net Income to Funds from Operations 6 6 Debt Summary 7 Debt Maturity Schedule 8 Pro Forma Net Debt /Annualized Adjusted EBITDA 9 PORTFOLIO INFORMATION Lease and Loan Maturity Schedule 10 10 Total Pro Forma Gross Assets and Adjusted Revenue by Asset Type, Operator, State and Country 11 EBITDARM to Rent Coverage 14 Summary of Acquisitions and Development Projects 16 FINANCIAL STATEMENTS Consolidated Statements of Income 17 17 Consolidated Balance Sheets 18 Unconsolidated Joint Venture Investments 19 FORWARD-LOOKING STATEMENTS Forward-looking statements involve known and unknown risks, mental and other liabilities; potential impact from COVID-19 on our tenants/ uncertainties and other factors that may cause the actual results of the borrowers and the related impact to us; and other factors affecting the real Company or future events to differ materially from those expressed estate industry generally or healthcare real estate in particular. For further in or underlying such forward-looking statements, including without discussion of the factors that could affect outcomes, please refer to the “Risk limitation: Normalized FFO per share; expected payout ratio; the amount Factors” section of the Company’s Annual Report on Form 10-K for the year of acquisitions of healthcare real estate, if any; estimated debt metrics; ended December 31, 2019, and as updated by the Company’s subsequently portfolio diversification; capital markets conditions; the repayment of filed Quarterly Reports on Form 10-Q and other SEC filings. Except as otherwise debt arrangements; statements concerning the additional income to the required by the federal securities laws, the Company undertakes no obligation Company as a result of ownership interests in certain hospital operations to update the information in this report. and the timing of such income; the payment of future dividends, if any; completion of additional debt arrangement and additional investments; Certain information in the supplemental package is shown pro forma for the national and international economic, business, real estate and other transactions completed subsequent to year end and the consummation of market conditions; the competitive environment in which the Company pending transactions. The pro forma adjustments are based upon available operates; the execution of the Company’s business plan; financing risks; information and assumptions that we believe are reasonable. There is no assur-the Company’s ability to maintain its status as a REIT for federal income ance that the pending transactions will occur. tax purposes; acquisition and development risks; potential environ- Clinica Ars Medica, an acute care facility in Switzerland. MEDICAL PROPERTIES TRUST | SUPPLEMENTAL INFORMATION | Q4 2020 2
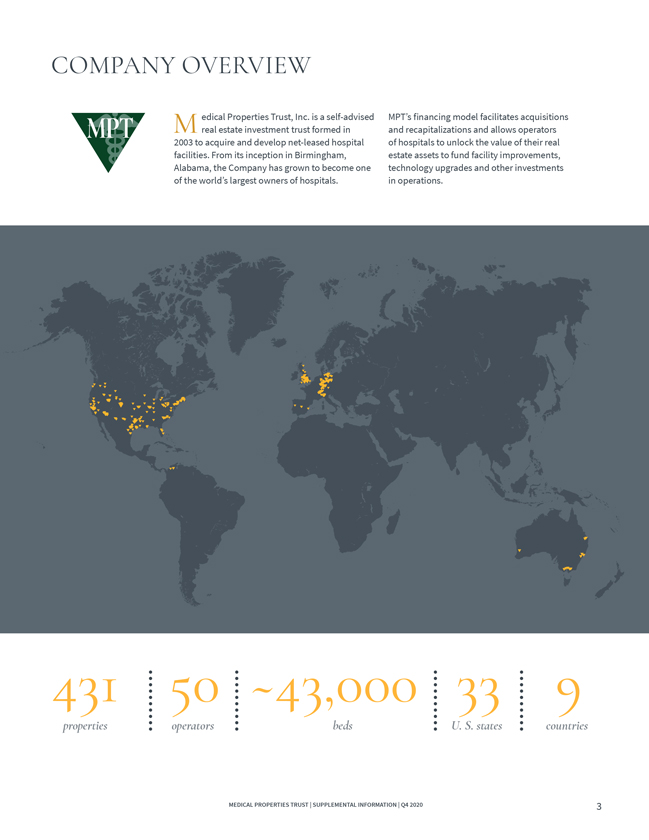
COMPANY OVERVIEW Medical Properties Trust, Inc. is a self-advised MPT’s financing model facilitates acquisitions real estate investment trust formed in and recapitalizations and allows operators 2003 to acquire and develop net-leased hospital of hospitals to unlock the value of their real facilities. From its inception in Birmingham, estate assets to fund facility improvements, Alabama, the Company has grown to become one technology upgrades and other investments of the world’s largest owners of hospitals. in operations. 431 50 ~43,000 33 9 properties operators beds U. S. states countries MEDICAL PROPERTIES TRUST | SUPPLEMENTAL INFORMATION | Q4 2020 3

COMPANY OVERVIEW MPT OFFICERS: From the Left: Charles R. Lambert, Rosa H. Hooper, R. Lucas Savage, Edward K. Aldag, Jr., R. Steven Hamner, Emmett E. McLean and J. Kevin Hanna. Officers Edward K. Aldag, Jr. Chairman, President and Chief Executive Officer R. Steven Hamner Executive Vice President and Chief Financial Officer Emmett E. McLean Executive Vice President, Chief Operating Officer and Secretary J. Kevin Hanna Vice President, Controller and Chief Accounting Officer Rosa H. Hooper Vice President, Managing Director of Asset Management and Underwriting R. Lucas Savage Vice President, Head of Global Acquisitions Charles R. Lambert Vice President, Treasurer and Managing Director of Capital Markets Board of Directors Corporate Headquarters Edward K. Aldag, Jr. G. Steven Dawson Medical Properties Trust, Inc. R. Steven Hamner 1000 Urban Center Drive, Suite 501 Caterina A. Mozingo Birmingham, AL 35242 Elizabeth N. Pitman (205) 969-3755 D. Paul Sparks, Jr. Michael G. Stewart (205) 969-3756 (fax) C. Reynolds Thompson, III www.medicalpropertiestrust.com MEDICAL PROPERTIES TRUST | SUPPLEMENTAL INFORMATION | Q4 2020 4

COMPANY OVERVIEW INVESTOR RELATIONS Drew Babin Tim Berryman Senior Managing Director of Corporate Communications Managing Director of Investor Relations (646) 884-9809 [email protected] (205) 397-8589 [email protected] Stock Exchange Senior Transfer Listing and Unsecured Agent Trading Symbol Debt Ratings American Stock Transfer New York Stock Exchange Moody’s – Ba1 and Trust Company (NYSE): MPW Standard & Poor’s – BBB- 6201 15th Avenue Brooklyn, NY 11219 Above: Saint Luke’s Community Hospital operated by Saint Luke’s Health System in Shawnee, Kansas. MEDICAL PROPERTIES TRUST | SUPPLEMENTAL INFORMATION | Q4 2020 5
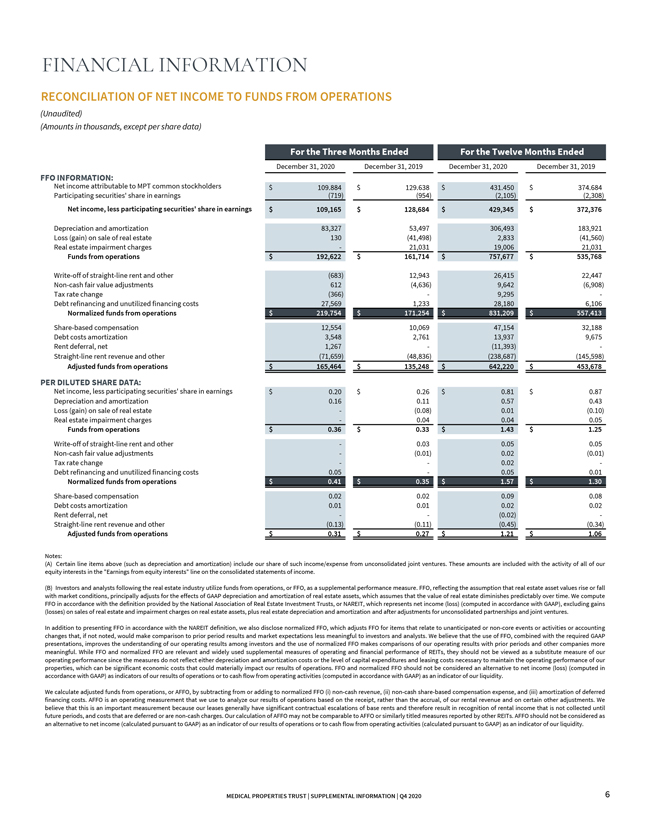
FINANCIAL INFORMATION RECONCILIATION OF NET INCOME TO FUNDS FROM OPERATIONS (Unaudited) (Amounts in thousands, except per share data) For the Three Months Ended For the Twelve Months Ended December 31, 2020 December 31, 2019 December 31, 2020 December 31, 2019 FFO INFORMATION: Net income attributable to MPT common stockholders $ 109,884 $ 129,638 $ 431,450 $ 374,684 Participating securities’ share in earnings (719) (954) (2,105) (2,308) Net income, less participating securities’ share in earnings $ 109,165 $ 128,684 $ 429,345 $ 372,376 Depreciation and amortization 83,327 53,497 306,493 183,921 Loss (gain) on sale of real estate 130 (41,498) 2,833 (41,560) Real estate impairment charges — 21,031 19,006 21,031 Funds from operations $ 192,622 $ 161,714 $ 757,677 $ 535,768 Write-off of straight-line rent and other (683) 12,943 26,415 22,447 Non-cash fair value adjustments 612 (4,636) 9,642 (6,908) Tax rate change (366) — 9,295 -Debt refinancing and unutilized financing costs 27,569 1,233 28,180 6,106 Normalized funds from operations $ 219,754 $ 171,254 $ 831,209 $ 557,413 Share-based compensation 12,554 10,069 47,154 32,188 Debt costs amortization 3,548 2,761 13,937 9,675 Rent deferral, net 1,267 — (11,393) -Straight-line rent revenue and other (71,659) (48,836) (238,687) (145,598) Adjusted funds from operations $ 165,464 $ 135,248 $ 642,220 $ 453,678 PER DILUTED SHARE DATA: Net income, less participating securities’ share in earnings $ 0.20 $ 0.26 $ 0.81 $ 0.87 Depreciation and amortization 0.16 0.11 0.57 0.43 Loss (gain) on sale of real estate — (0.08) 0.01 (0.10) Real estate impairment charges — 0.04 0.04 0.05 Funds from operations $ 0.36 $ 0.33 $ 1.43 $ 1.25 Write-off of straight-line rent and other — 0.03 0.05 0.05 Non-cash fair value adjustments — (0.01) 0.02 (0.01) Tax rate change — — 0.02 -Debt refinancing and unutilized financing costs 0.05 — 0.05 0.01
Normalized funds from operations $ 0.41 $ 0.35 $ 1.57 $ 1.30 Share-based compensation 0.02 0.02 0.09 0.08 Debt costs amortization 0.01 0.01 0.02 0.02 Rent deferral, net — — (0.02) -Straight-line rent revenue and other (0.13) (0.11) (0.45) (0.34) Adjusted funds from operations $ 0.31 $ 0.27 $ 1.21 $ 1.06 Notes: (A) Certain line items above (such as depreciation and amortization) include our share of such income/expense from unconsolidated joint ventures. These amounts are included with the activity of all of our equity interests in the “Earnings from equity interests” line on the consolidated statements of income. (B) Investors and analysts following the real estate industry utilize funds from operations, or FFO, as a supplemental performance measure. FFO, reflecting the assumption that real estate asset values rise or fall with market conditions, principally adjusts for the effects of GAAP depreciation and amortization of real estate assets, which assumes that the value of real estate diminishes predictably over time. We compute FFO in accordance with the definition provided by the National Association of Real Estate Investment Trusts, or NAREIT, which represents net income (loss) (computed in accordance with GAAP), excluding gains (losses) on sales of real estate and impairment charges on real estate assets, plus real estate depreciation and amortization and after adjustments for unconsolidated partnerships and joint ventures. In addition to presenting FFO in accordance with the NAREIT definition, we also disclose normalized FFO, which adjusts FFO for items that relate to unanticipated or non-core events or activities or accounting changes that, if not noted, would make comparison to prior period results and market expectations less meaningful to investors and analysts. We believe that the use of FFO, combined with the required GAAP presentations, improves the understanding of our operating results among investors and the use of normalized FFO makes comparisons of our operating results with prior periods and other companies more meaningful. While FFO and normalized FFO are relevant and widely used supplemental measures of operating and financial performance of REITs, they should not be viewed as a substitute measure of our operating performance since the measures do not reflect either depreciation and amortization costs or the level of capital expenditures and leasing costs necessary to maintain the operating performance of our properties, which can be significant economic costs that could materially impact our results of operations. FFO and normalized FFO should not be considered an alternative to net income (loss) (computed in accordance with GAAP) as indicators of our results of operations or to cash flow from operating activities (computed in accordance with GAAP) as an indicator of our liquidity. We calculate adjusted funds from operations, or AFFO, by subtracting from or adding to normalized FFO (i) non-cash revenue, (ii) non-cash share-based compensation expense, and (iii) amortization of deferred financing costs. AFFO is an operating measurement that we use to analyze our results of operations based on the receipt, rather than the accrual, of our rental revenue and on certain other adjustments. We believe that this is an important measurement because our leases generally have significant contractual escalations of base rents and therefore result in recognition of rental income that is not collected until future periods, and costs that are deferred or are non-cash charges. Our calculation of AFFO may not be comparable to AFFO or similarly titled measures reported by other REITs. AFFO should not be considered as an alternative to net income (calculated pursuant to GAAP) as an indicator of our results of operations or to cash flow from operating activities (calculated pursuant to GAAP) as an indicator of our liquidity. MEDICAL PROPERTIES TRUST | SUPPLEMENTAL INFORMATION | Q4 2020 6
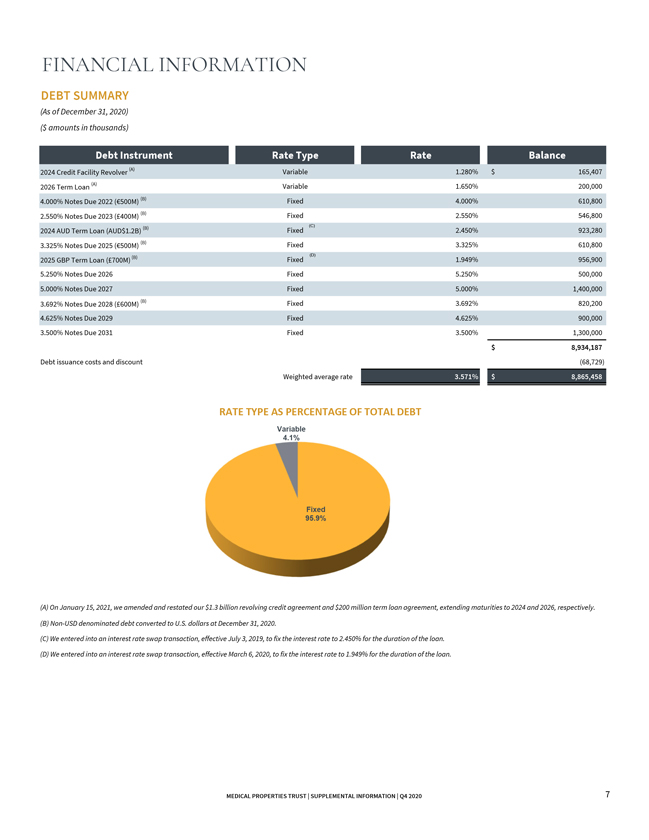
FINANCIAL INFORMATION DEBT SUMMARY (As of December 31, 2020) ($ amounts in thousands) Debt Instrument Rate Type Rate Balance 2024 Credit Facility Revolver (A) Variable 1.280% $ 165,407 2026 Term Loan (A) Variable 1.650% 200,000 4.000% Notes Due 2022 (€500M) (B) Fixed 4.000% 610,800 2.550% Notes Due 2023 (£400M) (B) Fixed 2.550% 546,800 (B) (C) 2024 AUD Term Loan (AUD$1.2B) Fixed 2.450% 923,280 3.325% Notes Due 2025 (€500M) (B) Fixed 3.325% 610,800 (B) Fixed (D) 1.949% 956,900 2025 GBP Term Loan (£700M) 5.250% Notes Due 2026 Fixed 5.250% 500,000 5.000% Notes Due 2027 Fixed 5.000% 1,400,000 3.692% Notes Due 2028 (£600M) (B) Fixed 3.692% 820,200 4.625% Notes Due 2029 Fixed 4.625% 900,000 3.500% Notes Due 2031 Fixed 3.500% 1,300,000 $ 8,934,187 Debt issuance costs and discount (68,729) Weighted average rate 3.571% $ 8,865,458 RATE TYPE AS PERCENTAGE OF TOTAL DEBT Variable 4.1% Fixed 95.9% (A) On January 15, 2021, we amended and restated our $1.3 billion revolving credit agreement and $200 million term loan agreement, extending maturities to 2024 and 2026, respectively. (B) Non-USD denominated debt converted to U.S. dollars at December 31, 2020. (C) We entered into an interest rate swap transaction, effective July 3, 2019, to fix the interest rate to 2.450% for the duration of the loan. (D) We entered into an interest rate swap transaction, effective March 6, 2020, to fix the interest rate to 1.949% for the duration of the loan. MEDICAL PROPERTIES TRUST | SUPPLEMENTAL INFORMATION | Q4 2020 7
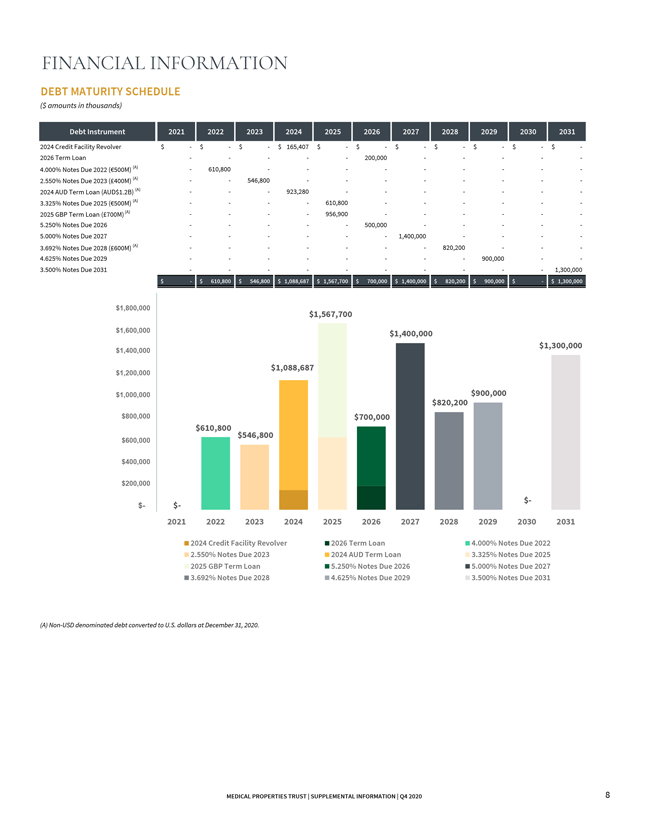
FINANCIAL INFORMATION DEBT MATURITY SCHEDULE ($ amounts in thousands) Debt Instrument 2021 2022 2023 2024 2025 2026 2027 2028 2029 2030 2031 2024 Credit Facility Revolver $ —$ —$ —$ 165,407 $ —$ —$ —$ —$ —$ —$ -2026 Term Loan — — — — — 200,000 — — — — -
4.000% Notes Due 2022 (€500M) (A) — 610,800 — — — — — — — — -
2.550% Notes Due 2023 (£400M) (A) — — 546,800 — — — — — — — -2024 AUD Term Loan (AUD$1.2B) (A) — — — 923,280 — — — — — — -
3.325% Notes Due 2025 (€500M) (A) — — — — 610,800 — — — — — -2025 GBP Term Loan (£700M) (A) — — — — 956,900 — — — — — -
5.250% Notes Due 2026 — — — — — 500,000 — — — — -
5.000% Notes Due 2027 — — — — — — 1,400,000 — — — -
3.692% Notes Due 2028 (£600M) (A) — — — — — — — 820,200 — — -
4.625% Notes Due 2029 — — — — — — — — 900,000 — -
3.500% Notes Due 2031 — — — — — — — — — — 1,300,000 $ —$ 610,800 $ 546,800 $ 1,088,687 $ 1,567,700 $ 700,000 $ 1,400,000 $ 820,200 $ 900,000 $ —$ 1,300,000 $1,800,000 $1,567,700 $1,600,000 $1,400,000 $1,300,000 $1,400,000 $1,088,687 $1,200,000 $1,000,000 $900,000 $820,200 $800,000 $700,000 $610,800 $546,800 $600,000 $400,000 $200,000 $- $- $- 2021 2022 2023 2024 2025 2026 2027 2028 2029 2030 2031 2024 Credit Facility Revolver 2026 Term Loan 4.000% Notes Due 2022 2.550% Notes Due 2023 2024 AUD Term Loan 3.325% Notes Due 2025 2025 GBP Term Loan 5.250% Notes Due 2026 5.000% Notes Due 2027 3.692% Notes Due 2028 4.625% Notes Due 2029 3.500% Notes Due 2031 (A) Non-USD denominated debt converted to U.S. dollars at December 31, 2020. MEDICAL PROPERTIES TRUST | SUPPLEMENTAL INFORMATION | Q4 2020 8
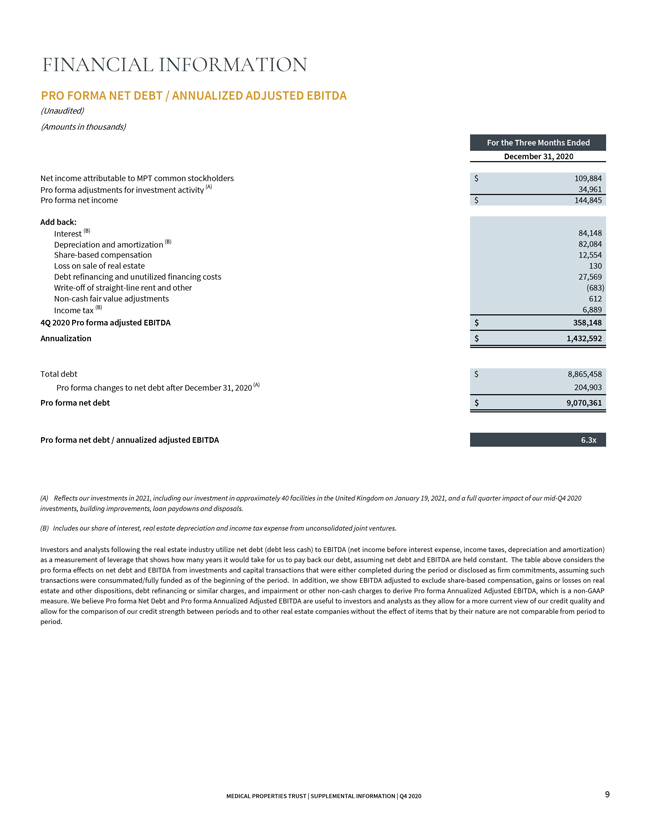
FINANCIAL INFORMATION PRO FORMA NET DEBT / ANNUALIZED ADJUSTED EBITDA
(Unaudited) (Amounts in thousands) For the Three Months Ended December 31, 2020 Net income attributable to MPT common stockholders $ 109,884 Pro forma adjustments for investment activity (A) 34,961 Pro forma net income $ 144,845 Add back: Interest (B) 84,148 Depreciation and amortization (B) 82,084 Share-based compensation 12,554 Loss on sale of real estate 130 Debt refinancing and unutilized financing costs 27,569 Write-off of straight-line rent and other (683) Non-cash fair value adjustments 612 Income tax (B) 6,889
4Q 2020 Pro forma adjusted EBITDA $ 358,148 Annualization $ 1,432,592 Total debt $ 8,865,458 Pro forma changes to net debt after December 31, 2020 (A) 204,903 Pro forma net debt $ 9,070,361 Pro forma net debt / annualized adjusted EBITDA 6.3x (A) Reflects our investments in 2021, including our investment in approximately 40 facilities in the United Kingdom on January 19, 2021, and a full quarter impact of our mid-Q4 2020 investments, building improvements, loan paydowns and disposals. (B) Includes our share of interest, real estate depreciation and income tax expense from unconsolidated joint ventures. Investors and analysts following the real estate industry utilize net debt (debt less cash) to EBITDA (net income before interest expense, income taxes, depreciation and amortization) as a measurement of leverage that shows how many years it would take for us to pay back our debt, assuming net debt and EBITDA are held constant. The table above considers the pro forma effects on net debt and EBITDA from investments and capital transactions that were either completed during the period or disclosed as firm commitments, assuming such transactions were consummated/fully funded as of the beginning of the period. In addition, we show EBITDA adjusted to exclude share-based compensation, gains or losses on real estate and other dispositions, debt refinancing or similar charges, and impairment or other non-cash charges to derive Pro forma Annualized Adjusted EBITDA, which is a non-GAAP measure. We believe Pro forma Net Debt and Pro forma Annualized Adjusted EBITDA are useful to investors and analysts as they allow for a more current view of our credit quality and allow for the comparison of our credit strength between periods and to other real estate companies without the effect of items that by their nature are not comparable from period to period. MEDICAL PROPERTIES TRUST | SUPPLEMENTAL INFORMATION | Q4 2020 9
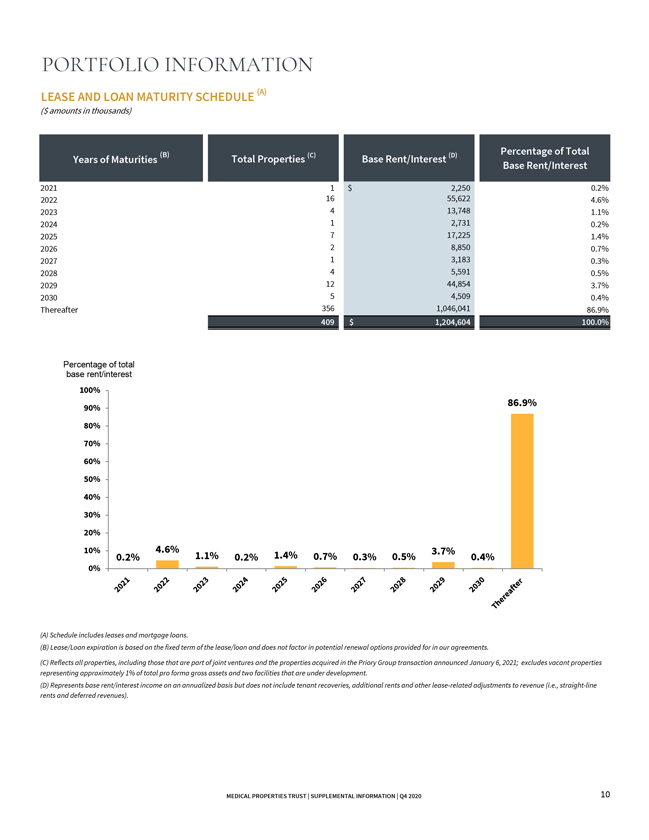
PORTFOLIO INFORMATION LEASE AND LOAN MATURITY SCHEDULE (A) ($ amounts in thousands) (B) (C) (D) Percentage of Total Years of Maturities Total Properties Base Rent/Interest Base Rent/Interest 2021 1 $ 2,250 0.2% 2022 16 55,622 4.6% 2023 4 13,748 1.1% 2024 1 2,731 0.2% 2025 7 17,225 1.4% 2026 2 8,850 0.7% 2027 1 3,183 0.3% 2028 4 5,591 0.5% 2029 12 44,854 3.7% 2030 5 4,509 0.4% Thereafter 356 1,046,041 86.9% 409 $ 1,204,604 100.0% Percentage of total base rent/interest 100% 86.9% 90% 80% 70% 60% 50% 40% 30% 20% 10% 4.6% 3.7% 0.2% 1.1% 0.2% 1.4% 0.7% 0.3% 0.5% 0.4% 0% (A) Schedule includes leases and mortgage loans. (B) Lease/Loan expiration is based on the fixed term of the lease/loan and does not factor in potential renewal options provided for in our agreements. (C) Reflects all properties, including those that are part of joint ventures and the properties acquired in the Priory Group transaction announced January 6, 2021; excludes vacant properties representing approximately 1% of total pro forma gross assets and two facilities that are under development. (D) Represents base rent/interest income on an annualized basis but does not include tenant recoveries, additional rents and other lease-related adjustments to revenue (i.e., straight-line rents and deferred revenues). MEDICAL PROPERTIES TRUST | SUPPLEMENTAL INFORMATION | Q4 2020 10
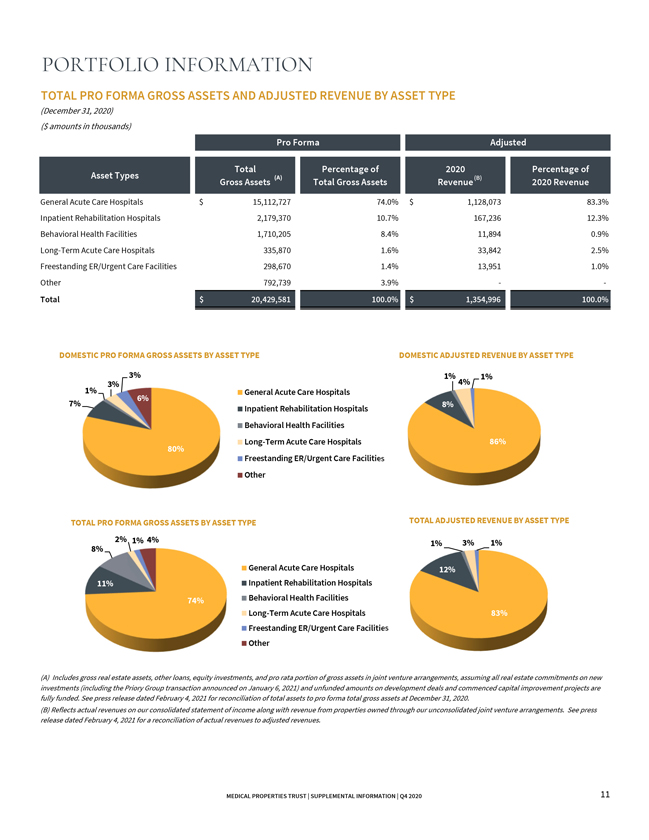
PORTFOLIO INFORMATION TOTAL PRO FORMA GROSS ASSETS AND ADJUSTED REVENUE BY ASSET TYPE (December 31, 2020) ($ amounts in thousands) Pro Forma Adjusted Total Percentage of 2020 Percentage of Asset Types (A) (B) Gross Assets Total Gross Assets Revenue 2020 Revenue General Acute Care Hospitals $ 15,112,727 74.0% $ 1,128,073 83.3% Inpatient Rehabilitation Hospitals 2,179,370 10.7% 167,236 12.3% Behavioral Health Facilities 1,710,205 8.4% 11,894 0.9% Long-Term Acute Care Hospitals 335,870 1.6% 33,842 2.5% Freestanding ER/Urgent Care Facilities 298,670 1.4% 13,951 1.0% Other 792,739 3.9% — - Total $ 20,429,581 100.0% $ 1,354,996 100.0% DOMESTIC PRO FORMA GROSS ASSETS BY ASSET TYPE DOMESTIC ADJUSTED REVENUE BY ASSET TYPE 3% 1% 1% 1% 3% 4% General Acute Care Hospitals 6% 7% 8% Inpatient Rehabilitation Hospitals Behavioral Health Facilities Long-Term Acute Care Hospitals 86% 80% Freestanding ER/Urgent Care Faciliti Other TOTAL PRO FORMA GROSS ASSETS BY ASSET TYPE TOTAL ADJUSTED REVENUE BY ASSET TYPE 2% 1% 4% 1% 3% 1% 8% General Acute Care Hospitals 12% 11% Inpatient Rehabilitation Hospitals 74% Behavioral Health Facilities Long-Term Acute Care Hospitals 83% Freestanding ER/Urgent Care Faciliti Other (A) Includes gross real estate assets, other loans, equity investments, and pro rata portion of gross assets in joint venture arrangements, assuming all real estate commitments on new investments (including the Priory Group transaction announced on January 6, 2021) and unfunded amounts on development deals and commenced capital improvement projects are fully funded. See press release dated February 4, 2021 for reconciliation of total assets to pro forma total gross assets at December 31, 2020. (B) Reflects actual revenues on our consolidated statement of income along with revenue from properties owned through our unconsolidated joint venture arrangements. See press release dated February 4, 2021 for a reconciliation of actual revenues to adjusted revenues. MEDICAL PROPERTIES TRUST | SUPPLEMENTAL INFORMATION | Q4 2020 11
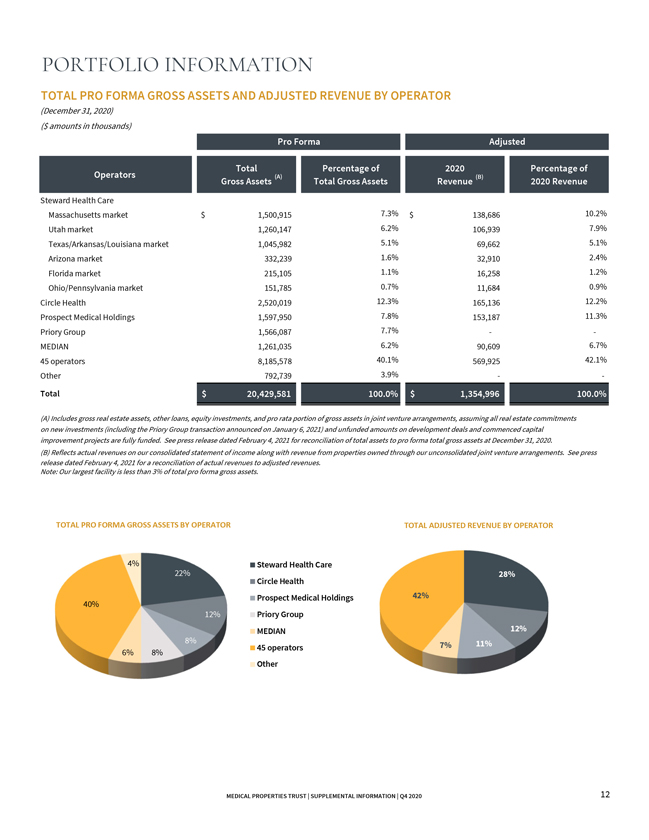
PORTFOLIO INFORMATION TOTAL PRO FORMA GROSS ASSETS AND ADJUSTED REVENUE BY OPERATOR (December 31, 2020) ($ amounts in thousands) Pro Forma Adjusted Total Percentage of 2020 Percentage of Operators (A) (B) Gross Assets Total Gross Assets Revenue 2020 Revenue Steward Health Care Massachusetts market $ 1,500,915 7.3% $ 138,686 10.2% Utah market 1,260,147 6.2% 106,939 7.9% Texas/Arkansas/Louisiana market 1,045,982 5.1% 69,662 5.1% Arizona market 332,239 1.6% 32,910 2.4% Florida market 215,105 1.1% 16,258 1.2% Ohio/Pennsylvania market 151,785 0.7% 11,684 0.9% Circle Health 2,520,019 12.3% 165,136 12.2% Prospect Medical Holdings 1,597,950 7.8% 153,187 11.3% Priory Group 1,566,087 7.7% — -MEDIAN 1,261,035 6.2% 90,609 6.7% 45 operators 8,185,578 40.1% 569,925 42.1% Other 792,739 3.9% — - Total $ 20,429,581 100.0% $ 1,354,996 100.0% (A) Includes gross real estate assets, other loans, equity investments, and pro rata portion of gross assets in joint venture arrangements, assuming all real estate commitments on new investments (including the Priory Group transaction announced on January 6, 2021) and unfunded amounts on development deals and commenced capital improvement projects are fully funded. See press release dated February 4, 2021 for reconciliation of total assets to pro forma total gross assets at December 31, 2020. (B) Reflects actual revenues on our consolidated statement of income along with revenue from properties owned through our unconsolidated joint venture arrangements. See press release dated February 4, 2021 for a reconciliation of actual revenues to adjusted revenues. Note: Our largest facility is less than 3% of total pro forma gross assets. TOTAL PRO FORMA GROSS ASSETS BY OPERATOR TOTAL ADJUSTED REVENUE BY OPERATOR 4% Steward Health Care 22% Circle Health 28% 40% Prospect Medical Holdings 42% 12% Priory Group MEDIAN 12% 8% 11% 45 operators 7% 6% 8% Other MEDICAL PROPERTIES TRUST | SUPPLEMENTAL INFORMATION | Q4 2020 12
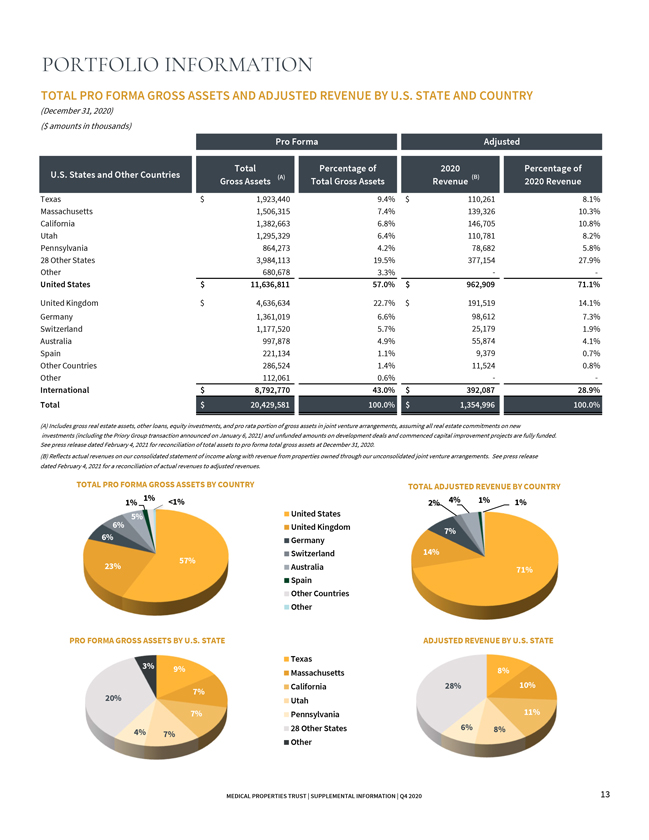
PORTFOLIO INFORMATION TOTAL PRO FORMA GROSS ASSETS AND ADJUSTED REVENUE BY U.S. STATE AND COUNTRY (December 31, 2020) ($ amounts in thousands) Pro Forma Adjusted Total Percentage of 2020 Percentage of U.S. States and Other Countries (A) (B) Gross Assets Total Gross Assets Revenue 2020 Revenue Texas $ 1,923,440 9.4% $ 110,261 8.1% Massachusetts 1,506,315 7.4% 139,326 10.3% California 1,382,663 6.8% 146,705 10.8% Utah 1,295,329 6.4% 110,781 8.2% Pennsylvania 864,273 4.2% 78,682 5.8%
28 Other States 3,984,113 19.5% 377,154 27.9% Other 680,678 3.3% — - United States $ 11,636,811 57.0% $ 962,909 71.1% United Kingdom $ 4,636,634 22.7% $ 191,519 14.1% Germany 1,361,019 6.6% 98,612 7.3% Switzerland 1,177,520 5.7% 25,179 1.9% Australia 997,878 4.9% 55,874 4.1% Spain 221,134 1.1% 9,379 0.7% Other Countries 286,524 1.4% 11,524 0.8% Other 112,061 0.6%— - International $ 8,792,770 43.0% $ 392,087 28.9% Total $ 20,429,581 100.0% $ 1,354,996 100.0% (A) Includes gross real estate assets, other loans, equity investments, and pro rata portion of gross assets in joint venture arrangements, assuming all real estate commitments on new investments (including the Priory Group transaction announced on January 6, 2021) and unfunded amounts on development deals and commenced capital improvement projects are fully funded. See press release dated February 4, 2021 for reconciliation of total assets to pro forma total gross assets at December 31, 2020. (B) Reflects actual revenues on our consolidated statement of income along with revenue from properties owned through our unconsolidated joint venture arrangements. See press release dated February 4, 2021 for a reconciliation of actual revenues to adjusted revenues. TOTAL PRO FORMA GROSS ASSETS BY COUNTRY TOTAL ADJUSTED REVENUE BY COUNTRY 1% <1% 4% 1% 1% 1% 2% 5% United States 6% United Kingdom 7% 6% Germany 57% Switzerland 14% 23% Australia 71% Spain Other Countries Other PRO FORMA GROSS ASSETS BY U.S. STATE ADJUSTED REVENUE BY U.S. STATE Texas 3% 9% Massachusetts 8% California 28% 10% 7% 20% Utah 7% Pennsylvania 11% 28 Other States 6% 8% 4% 7% Other MEDICAL PROPERTIES TRUST | SUPPLEMENTAL INFORMATION | Q4 2020 13
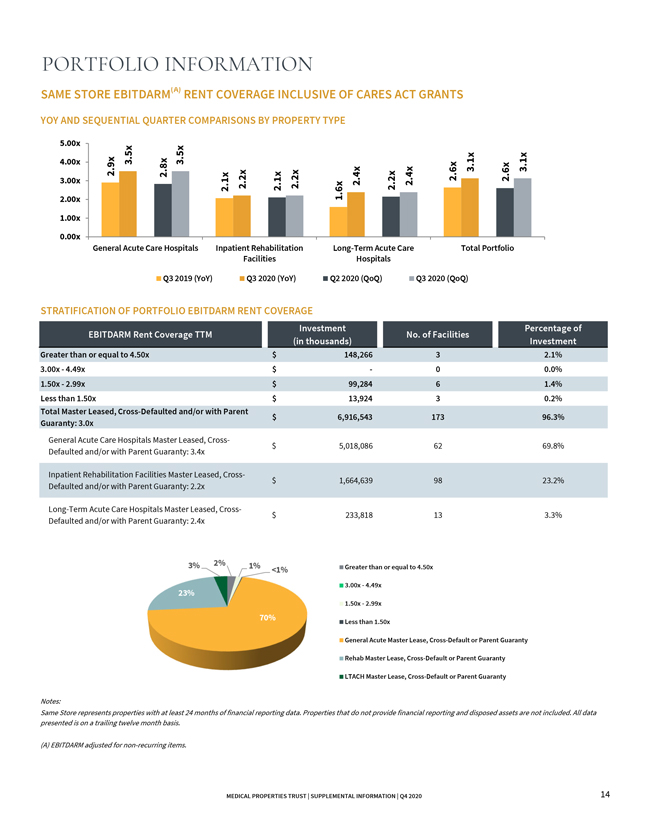
PORTFOLIO INFORMATION SAME STORE EBITDARM(A) RENT COVERAGE INCLUSIVE OF CARES ACT GRANTS YOY AND SEQUENTIAL QUARTER COMPARISONS BY PROPERTY TYPE 5.00x 4.00x 2.9x 3.5x 2.8x 3.5x 3.1x 3.1x 3.00x 2.2x 2.2x 2.4x 2.2x 2.4x 2.6x 2.6x 2.1x 2.1x 1.6x 2.00x 1.00x 0.00x General Acute Care Hospitals Inpatient Rehabilitation Long-Term Acute Care Total Portfolio Facilities Hospitals Q3 2019 (YoY) Q3 2020 (YoY) Q2 2020 (QoQ) Q3 2020 (QoQ) STRATIFICATION OF PORTFOLIO EBITDARM RENT COVERAGE Investment Percentage of EBITDARM Rent Coverage TTM No. of Facilities (in thousands) Investment Greater than or equal to 4.50x $ 148,266 3 2.1% 3.00x—4.49x $ —0 0.0% 1.50x—2.99x $ 99,284 6 1.4% Less than 1.50x $ 13,924 3 0.2% Total Master Leased, Cross-Defaulted and/or with Parent $ 6,916,543 173 96.3% Guaranty: 3.0x General Acute Care Hospitals Master Leased, Cross$ 5,018,086 62 69.8% Defaulted and/or with Parent Guaranty: 3.4x Inpatient Rehabilitation Facilities Master Leased, Cross$ 1,664,639 98 23.2% Defaulted and/or with Parent Guaranty: 2.2x Long-Term Acute Care Hospitals Master Leased, Cross$ 233,818 13 3.3% Defaulted and/or with Parent Guaranty: 2.4x 3% 2% 1% <1% Greater than or equal to 4.50x 23% 3.00x—4.49x 1.50x—2.99x 70% Less than 1.50x General Acute Master Lease, Cross-Default or Parent Guaranty Rehab Master Lease, Cross-Default or Parent Guaranty LTACH Master Lease, Cross-Default or Parent Guaranty Notes: Same Store represents properties with at least 24 months of financial reporting data. Properties that do not provide financial reporting and disposed assets are not included. All data presented is on a trailing twelve month basis. (A) EBITDARM adjusted for non-recurring items. MEDICAL PROPERTIES TRUST | SUPPLEMENTAL INFORMATION | Q4 2020 14
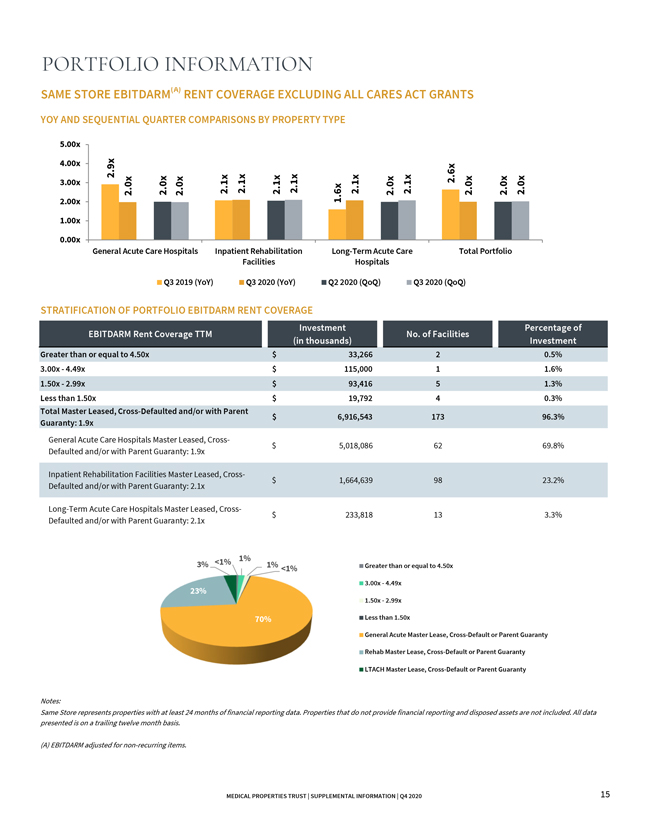
PORTFOLIO INFORMATION SAME STORE EBITDARM(A) RENT COVERAGE EXCLUDING ALL CARES ACT GRANTS YOY AND SEQUENTIAL QUARTER COMPARISONS BY PROPERTY TYPE 5.00x 4.00x 2.9x 3.00x 2.6x 2.0x 2.0x 2.0x 2.1x 2.1x 2.1x 2.1x 1.6x 2.1x 2.0x 2.1x 2.0x 2.0x 2.0x 2.00x 1.00x 0.00x General Acute Care Hospitals Inpatient Rehabilitation Long-Term Acute Care Total Portfolio Facilities Hospitals Q3 2019 (YoY) Q3 2020 (YoY) Q2 2020 (QoQ) Q3 2020 (QoQ) STRATIFICATION OF PORTFOLIO EBITDARM RENT COVERAGE Investment Percentage of EBITDARM Rent Coverage TTM No. of Facilities (in thousands) Investment Greater than or equal to 4.50x $ 33,266 2 0.5% 3.00x—4.49x $ 115,000 1 1.6% 1.50x—2.99x $ 93,416 5 1.3% Less than 1.50x $ 19,792 4 0.3% Total Master Leased, Cross-Defaulted and/or with Parent $ 6,916,543 173 96.3% Guaranty: 1.9x General Acute Care Hospitals Master Leased, Cross$ 5,018,086 62 69.8% Defaulted and/or with Parent Guaranty: 1.9x Inpatient Rehabilitation Facilities Master Leased, Cross$ 1,664,639 98 23.2% Defaulted and/or with Parent Guaranty: 2.1x Long-Term Acute Care Hospitals Master Leased, Cross$ 233,818 13 3.3% Defaulted and/or with Parent Guaranty: 2.1x <1% 1% 3% 1% <1% Greater than or equal to 4.50x 23% 3.00x—4.49x 1.50x—2.99x 70% Less than 1.50x General Acute Master Lease, Cross-Default or Parent Guaranty Rehab Master Lease, Cross-Default or Parent Guaranty LTACH Master Lease, Cross-Default or Parent Guaranty Notes: Same Store represents properties with at least 24 months of financial reporting data. Properties that do not provide financial reporting and disposed assets are not included. All data presented is on a trailing twelve month basis. (A) EBITDARM adjusted for non-recurring items. MEDICAL PROPERTIES TRUST | SUPPLEMENTAL INFORMATION | Q4 2020 15
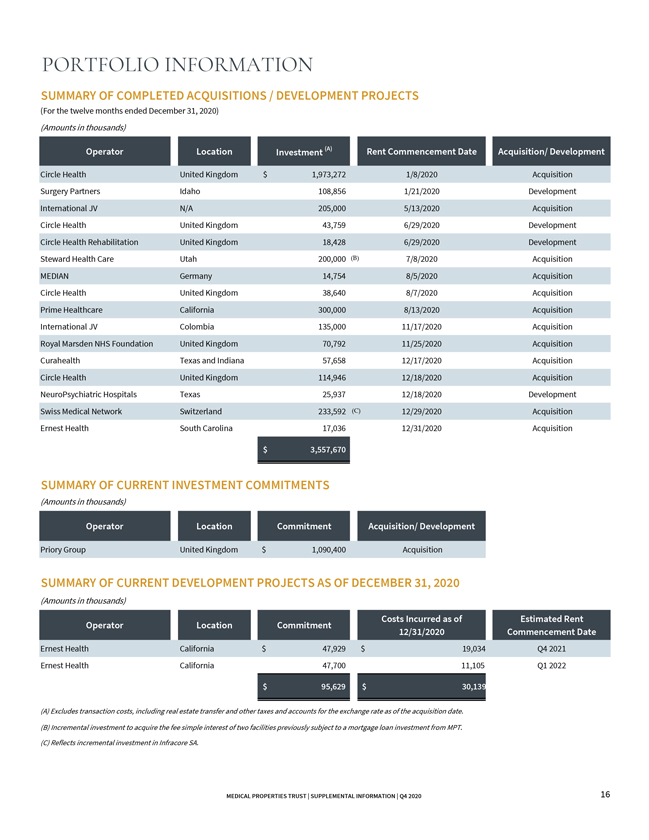
PORTFOLIO INFORMATION SUMMARY OF COMPLETED ACQUISITIONS / DEVELOPMENT PROJECTS (For the twelve months ended December 31, 2020) (Amounts in thousands) Operator Location Investment (A) Rent Commencement Date Acquisition/ Development Circle Health United Kingdom $ 1,973,272 1/8/2020 Acquisition Surgery Partners Idaho 108,856 1/21/2020 Development International JV N/A 205,000 5/13/2020 Acquisition Circle Health United Kingdom 43,759 6/29/2020 Development Circle Health Rehabilitation United Kingdom 18,428 6/29/2020 Development Steward Health Care Utah 200,000 (B) 7/8/2020 Acquisition MEDIAN Germany 14,754 8/5/2020 Acquisition Circle Health United Kingdom 38,640 8/7/2020 Acquisition Prime Healthcare California 300,000 8/13/2020 Acquisition International JV Colombia 135,000 11/17/2020 Acquisition Royal Marsden NHS Foundation United Kingdom 70,792 11/25/2020 Acquisition Curahealth Texas and Indiana 57,658 12/17/2020 Acquisition Circle Health United Kingdom 114,946 12/18/2020 Acquisition NeuroPsychiatric Hospitals Texas 25,937 12/18/2020 Development Swiss Medical Network Switzerland 233,592 (C) 12/29/2020 Acquisition Ernest Health South Carolina 17,036 12/31/2020 Acquisition $ 3,557,670 SUMMARY OF CURRENT INVESTMENT COMMITMENTS (Amounts in thousands) Operator Location Commitment Acquisition/ Development Priory Group United Kingdom $ 1,090,400 Acquisition SUMMARY OF CURRENT DEVELOPMENT PROJECTS AS OF DECEMBER 31, 2020 (Amounts in thousands) Costs Incurred as of Estimated Rent Operator Location Commitment 12/31/2020 Commencement Date Ernest Health California $ 47,929 $ 19,034 Q4 2021 Ernest Health California 47,700 11,105 Q1 2022 $ 95,629 $ 30,139 (A) Excludes transaction costs, including real estate transfer and other taxes and accounts for the exchange rate as of the acquisition date. (B) Incremental investment to acquire the fee simple interest of two facilities previously subject to a mortgage loan investment from MPT. (C) Reflects incremental investment in Infracore SA. MEDICAL PROPERTIES TRUST | SUPPLEMENTAL INFORMATION | Q4 2020 16
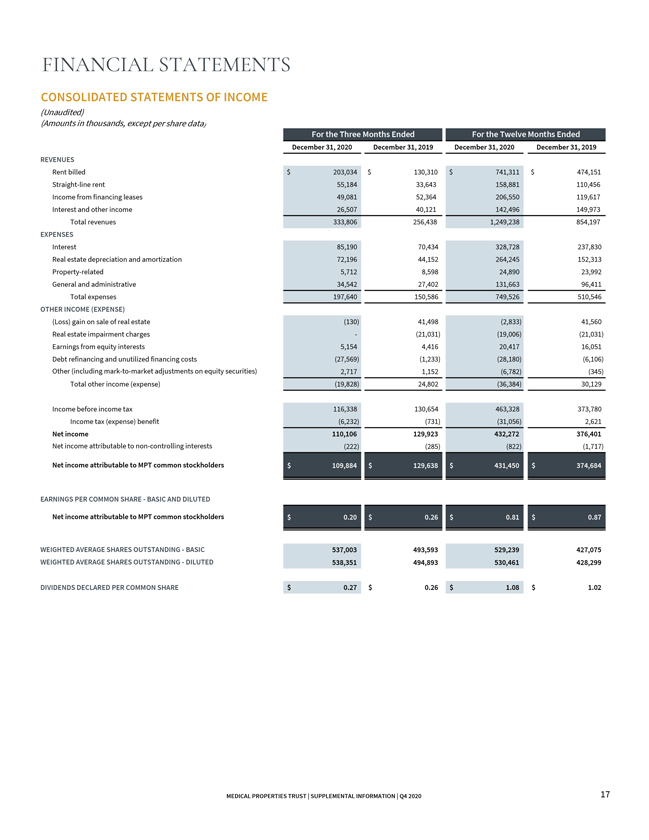
FINANCIAL STATEMENTS CONSOLIDATED STATEMENTS OF INCOME (Unaudited) (Amounts in thousands, except per share data) For the Three Months Ended For the Twelve Months Ended December 31, 2020 December 31, 2019 December 31, 2020 December 31, 2019 REVENUES Rent billed $ 203,034 $ 130,310 $ 741,311 $ 474,151 Straight-line rent 55,184 33,643 158,881 110,456 Income from financing leases 49,081 52,364 206,550 119,617 Interest and other income 26,507 40,121 142,496 149,973 Total revenues 333,806 256,438 1,249,238 854,197 EXPENSES Interest 85,190 70,434 328,728 237,830 Real estate depreciation and amortization 72,196 44,152 264,245 152,313 Property-related 5,712 8,598 24,890 23,992 General and administrative 34,542 27,402 131,663 96,411 Total expenses 197,640 150,586 749,526 510,546 OTHER INCOME (EXPENSE) (Loss) gain on sale of real estate (130) 41,498 (2,833) 41,560 Real estate impairment charges — (21,031) (19,006) (21,031) Earnings from equity interests 5,154 4,416 20,417 16,051 Debt refinancing and unutilized financing costs (27,569) (1,233) (28,180) (6,106) Other (including mark-to-market adjustments on equity securities) 2,717 1,152 (6,782) (345) Total other income (expense) (19,828) 24,802 (36,384) 30,129 Income before income tax 116,338 130,654 463,328 373,780 Income tax (expense) benefit (6,232) (731) (31,056) 2,621 Net income 110,106 129,923 432,272 376,401 Net income attributable to non-controlling interests (222) (285) (822) (1,717) Net income attributable to MPT common stockholders $ 109,884 $ 129,638 $ 431,450 $ 374,684 EARNINGS PER COMMON SHARE—BASIC AND DILUTED Net income attributable to MPT common stockholders $ 0.20 $ 0.26 $ 0.81 $ 0.87 WEIGHTED AVERAGE SHARES OUTSTANDING—BASIC 537,003 493,593 529,239 427,075 WEIGHTED AVERAGE SHARES OUTSTANDING—DILUTED 538,351 494,893 530,461 428,299 $ —$ - DIVIDENDS DECLARED PER COMMON SHARE $ 0.27 $ 0.26 $ 1.08 $ 1.02 MEDICAL PROPERTIES TRUST | SUPPLEMENTAL INFORMATION | Q4 2020 17
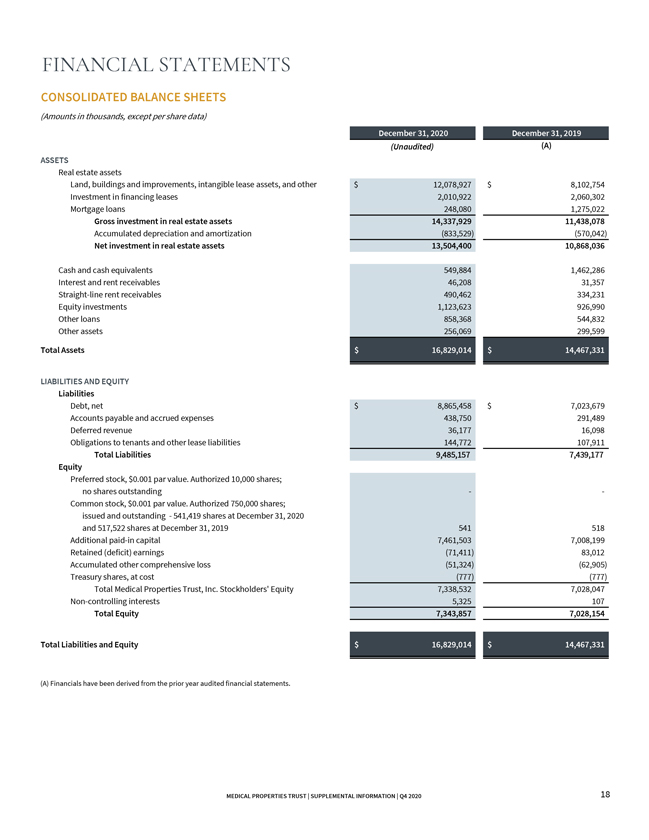
FINANCIAL STATEMENTS CONSOLIDATED BALANCE SHEETS (Amounts in thousands, except per share data) December 31, 2020 December 31, 2019 (Unaudited) (A) ASSETS Real estate assets Land, buildings and improvements, intangible lease assets, and other $ 12,078,927 $ 8,102,754 Investment in financing leases 2,010,922 2,060,302 Mortgage loans 248,080 1,275,022 Gross investment in real estate assets 14,337,929 11,438,078 Accumulated depreciation and amortization (833,529) (570,042) Net investment in real estate assets 13,504,400 10,868,036 Cash and cash equivalents 549,884 1,462,286 Interest and rent receivables 46,208 31,357 Straight-line rent receivables 490,462 334,231 Equity investments 1,123,623 926,990 Other loans 858,368 544,832 Other assets 256,069 299,599 Total Assets $ 16,829,014 $ 14,467,331 LIABILITIES AND EQUITY Liabilities Debt, net $ 8,865,458 $ 7,023,679 Accounts payable and accrued expenses 438,750 291,489 Deferred revenue 36,177 16,098 Obligations to tenants and other lease liabilities 144,772 107,911 Total Liabilities 9,485,157 7,439,177 Equity Preferred stock, $0.001 par value. Authorized 10,000 shares; no shares outstanding - -Common stock, $0.001 par value. Authorized 750,000 shares; issued and outstanding - 541,419 shares at December 31, 2020 and 517,522 shares at December 31, 2019 541 518 Additional paid-in capital 7,461,503 7,008,199 Retained (deficit) earnings (71,411) 83,012 Accumulated other comprehensive loss (51,324) (62,905) Treasury shares, at cost (777) (777) Total Medical Properties Trust, Inc. Stockholders’ Equity 7,338,532 7,028,047 Non-controlling interests 5,325 107 Total Equity 7,343,857 7,028,154 Total Liabilities and Equity $ 16,829,014 $ 14,467,331 (A) Financials have been derived from the prior year audited financial statements. MEDICAL PROPERTIES TRUST | SUPPLEMENTAL INFORMATION | Q4 2020 18
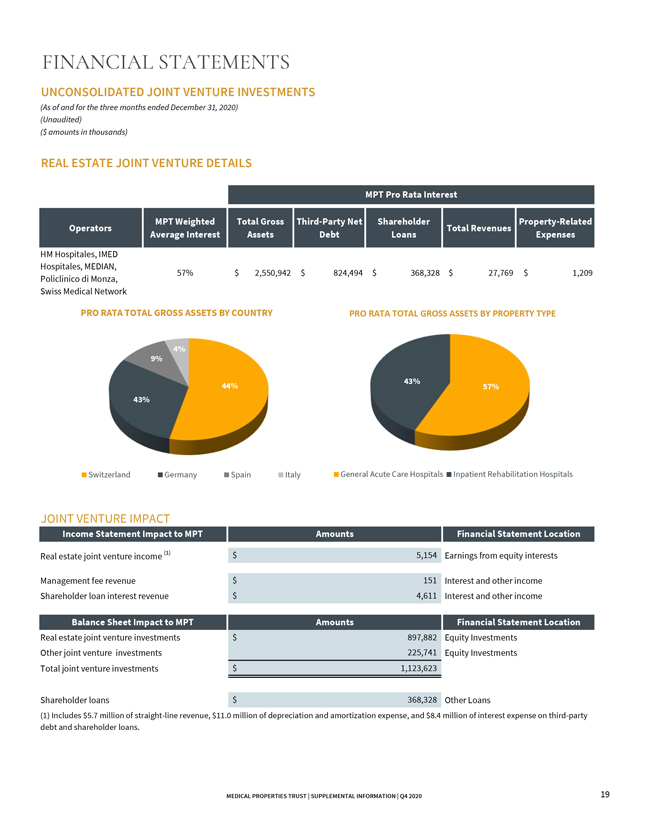
FINANCIAL STATEMENTS UNCONSOLIDATED JOINT VENTURE INVESTMENTS (As of and for the three months ended December 31, 2020) (Unaudited) ($ amounts in thousands) REAL ESTATE JOINT VENTURE DETAILS MPT Pro Rata Interest MPT Weighted Total Gross Third-Party Net Shareholder Property-Related Operators Total Revenues Average Interest Assets Debt Loans Expenses HM Hospitales, IMED Hospitales, MEDIAN, 57% $ 2,550,942 $ 824,494 $ 368,328 $ 27,769 $ 1,209 Policlinico di Monza, Swiss Medical Network PRO RATA TOTAL GROSS ASSETS BY COUNTRY PRO RATA TOTAL GROSS ASSETS BY PROPERTY TYPE 4% 9% 43% 44% 57% 43% Switzerland Germany Spain Italy General Acute Care Hospitals Inpatient Rehabilitation Hospitals JOINT VENTURE IMPACT Income Statement Impact to MPT Amounts Financial Statement Location Real estate joint venture income (1) $ 5,154 Earnings from equity interests Management fee revenue $ 151 Interest and other income Shareholder loan interest revenue $ 4,611 Interest and other income Balance Sheet Impact to MPT Amounts Financial Statement Location Real estate joint venture investments $ 897,882 Equity Investments Other joint venture investments 225,741 Equity Investments Total joint venture investments $ 1,123,623 Shareholder loans $ 368,328 Other Loans (1) Includes $5.7 million of straight-line revenue, $11.0 million of depreciation and amortization expense, and $8.4 million of interest expense on third-party debt and shareholder loans. MEDICAL PROPERTIES TRUST | SUPPLEMENTAL INFORMATION | Q4 2020 19
1000 Urban Center Drive, Suite 501 Birmingham, AL 35242 (205) 969-3755 NYSE: MPW www.medicalpropertiestrust.com Contact: Drew Babin, Senior Managing Director of Corporate Communications (646) 884-9809 or [email protected] or Tim Berryman, Managing Director of Investor Relations (205) 397-8589 or [email protected]